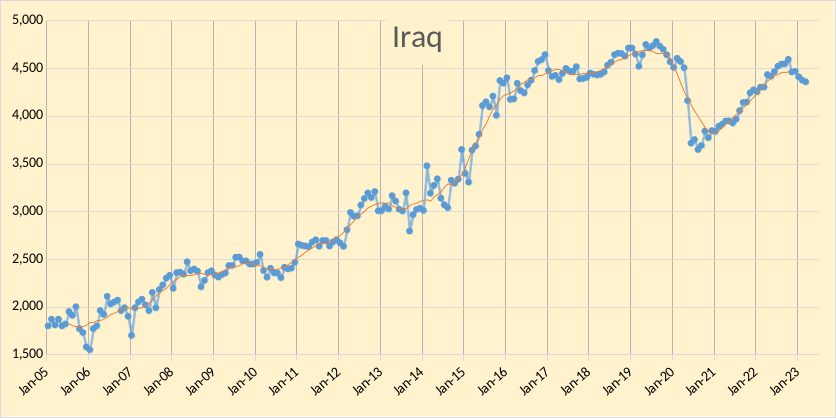
The OPEC Monthly Oil Market Report (MOMR) for April 2023 was published recently. The last month reported in most of the OPEC charts that follow is March 2023 and output reported for OPEC nations is crude oil output in thousands of barrels per day (kb/d). In many of the OPEC charts that follow the blue line with markers is monthly output and the thin red line is the centered twelve month average (CTMA) output.
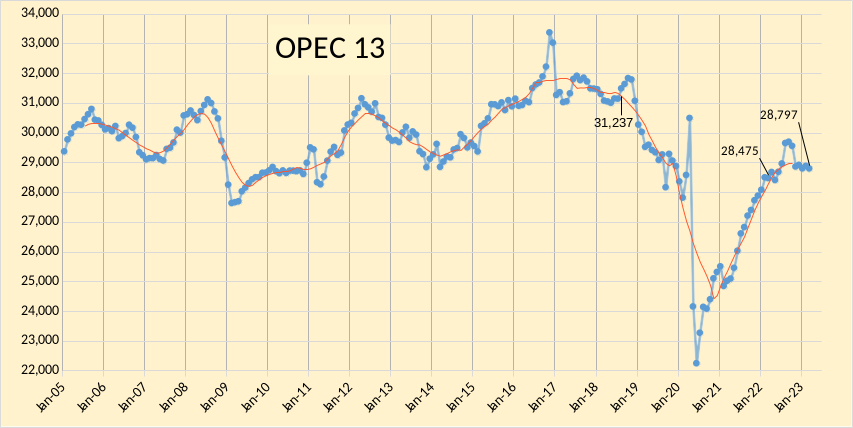
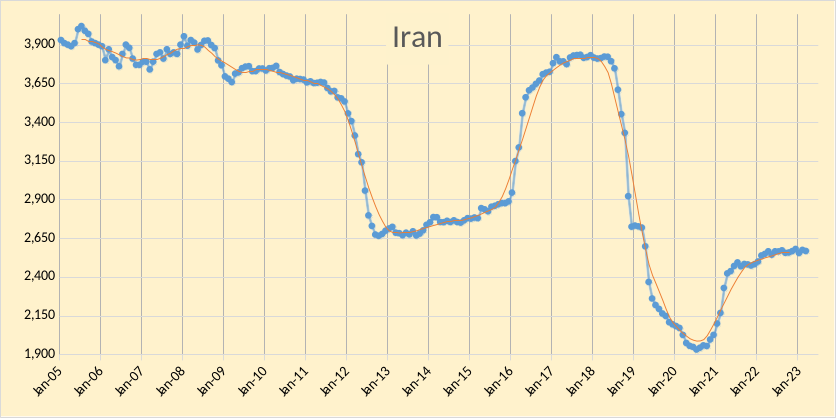
OPEC crude output was revised lower in January 2023 by 9 kb/d compared to last month’s report and February 2023 OPEC crude output was revised lower by 41 kb/d. When the World was at its centered twelve month average peak for C+C output in August 2018, OPEC crude output was 31237 kb/d (as shown in Figure 1), March 2023 OPEC crude output was 2440 kb/d below that level. Of this decrease about 1477 kb/d comes from decreased output in Iran (898 kb/d) and Venezuela (579 kb/d) since the World CTMA C+C peak in August 2018.

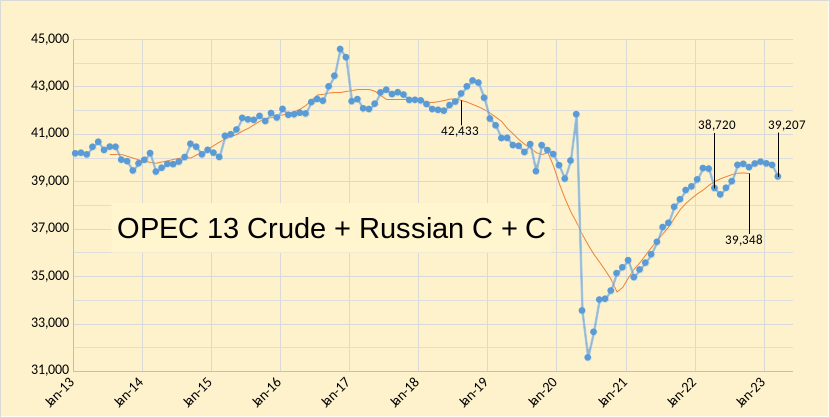
In the chart below we have Russian C + C and OPEC crude oil output. The centered 12 month average (CTMA) of output for OPEC13 crude and Russian C+C was 42443 kb/d in August 2018 when World C+C output was at its centered 12 month average peak. Output for Russian C+C and OPEC crude was 3266 kb/d below the August 2018 CTMA at 39207 kb/d in March 2023 and the recent CTMA was 39348 kb/d which is 3085 kb/d below the Aug 2018 level. In the past 12 months OPEC and Russian output has increased by 487 kb/d from 38720 kb/d in March 2022.
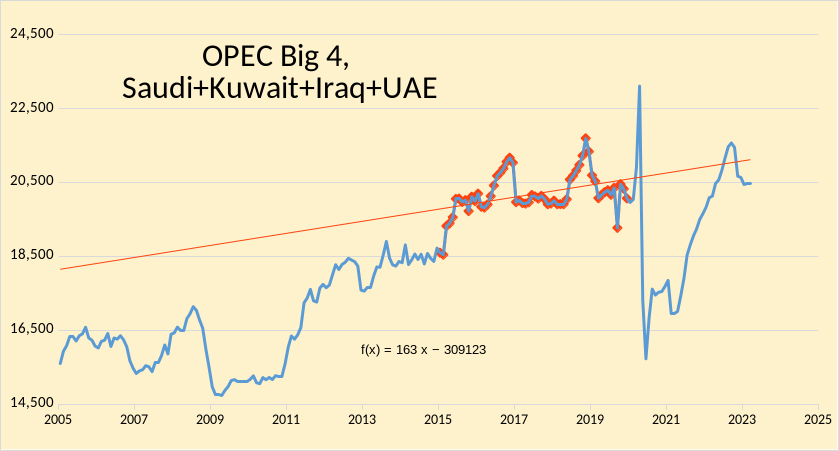
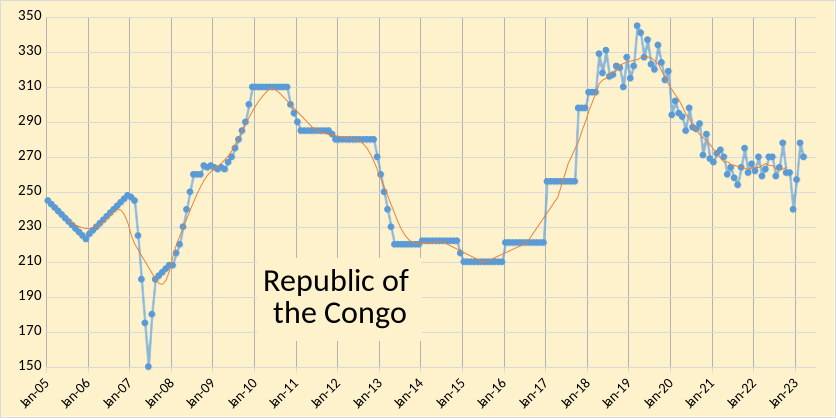
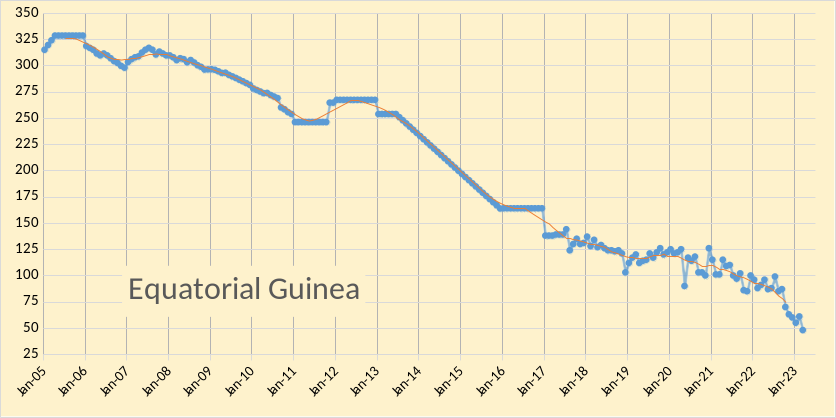
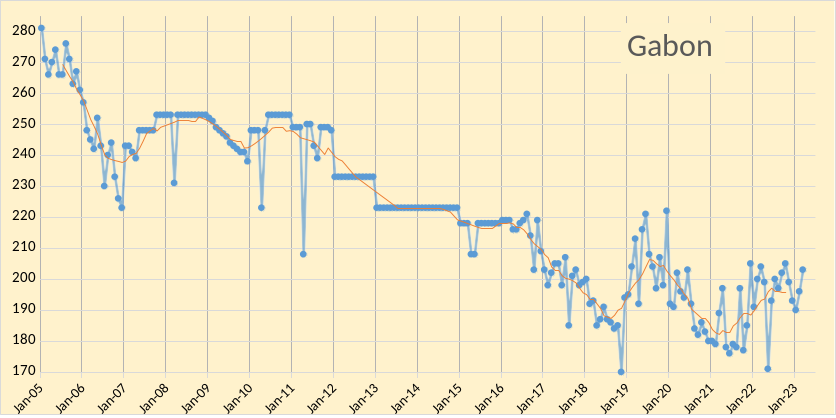
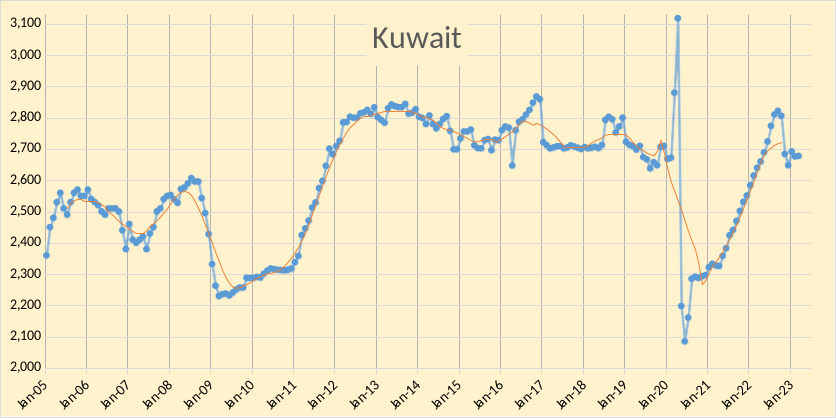
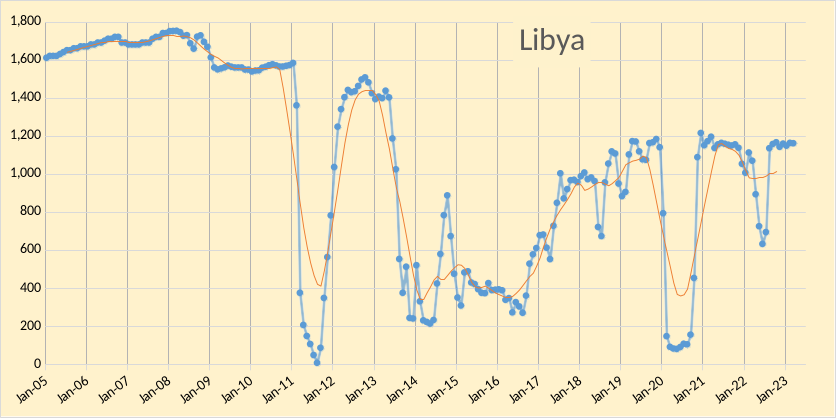
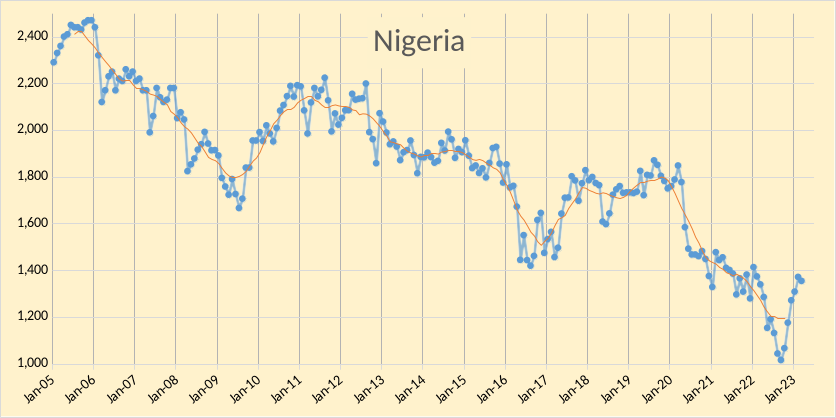
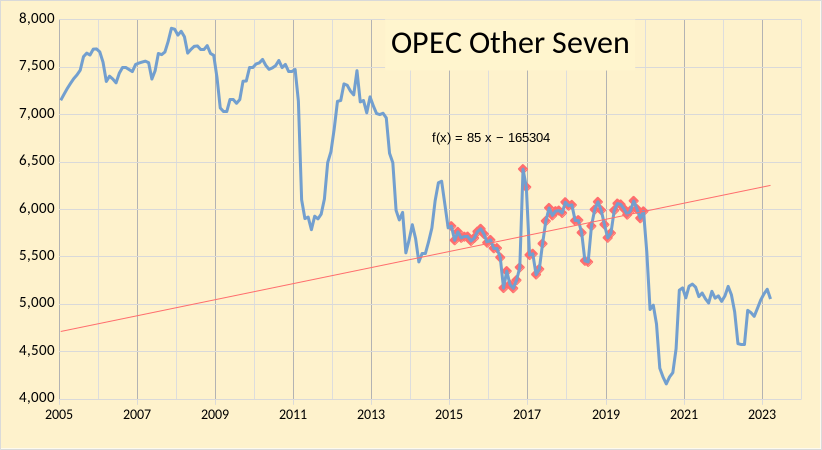
The big 4 OPEC producers (Saudi Arabia, Iraq, UAE, and Kuwait) saw average annual output increase at 163 kb/d on average from Jan 2015 to Dec 2019 based on an OLS trend through monthly data (shown in red markers on chart). In figure 5 below I show the trend for the rest of OPEC, excluding Venezuela and Iran (due to limited output caused by US sanctions for this period) which I call the OPEC Other Seven producers. Those nations saw an average annual increase of 85 kb/d over the same Jan 2015 to Dec 2019 period. Note however that these seven nations did not see their output rebound strongly after the pandemic and remain about 1000 kb/d below the December 2019 output level. About 800 kb/d of this decrease comes from Angola and Nigeria (about 400 kb/d each) and smaller decreases from Congo, Gabon, and Equatorial Guinea. I expect output from the OPEC Other Seven may see continued slow decline at perhaps an annual rate of 125 kb/d/year (OLS trend from Jan 2015 to March 2023).
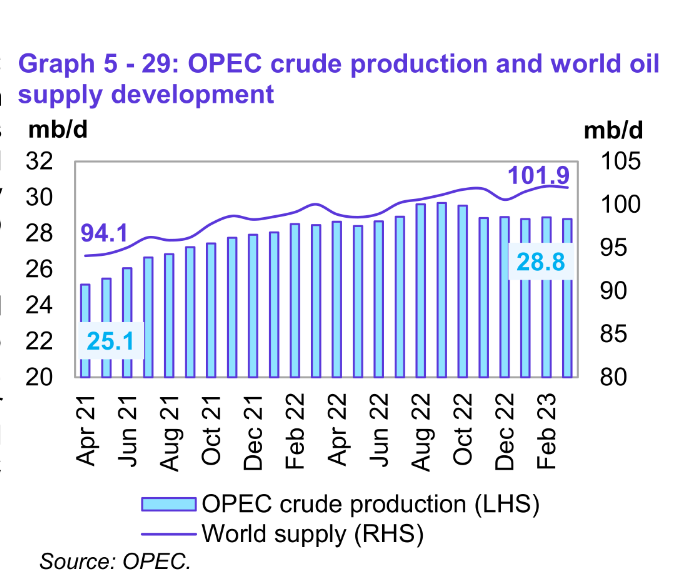
World All Liquids Supply increased to 101.9 Mb/d in March 2023, an increase of 7.8 Mb/d over the past 23 months. OPEC crude output increased by 3.7 Mb/d over the past 23 months to 28.8 Mb/d in March 2023.
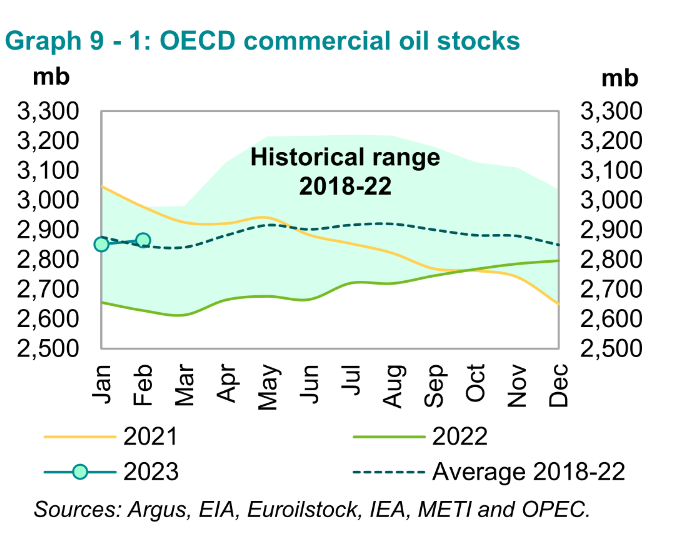
OECD Stocks have returned to about the 5 year average which may explain the current oil price of about 80 to 85 dollars per barrel. Unfortunately there is not very good data on World oil stocks, but the market appears to be relatively balanced in the past few months.
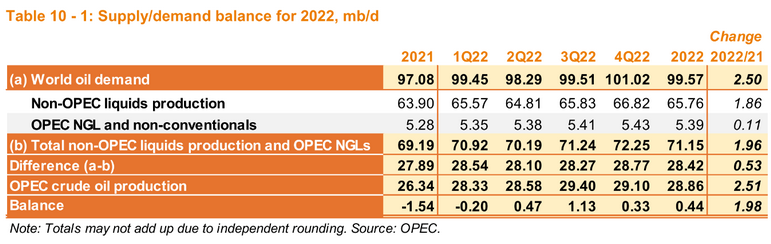
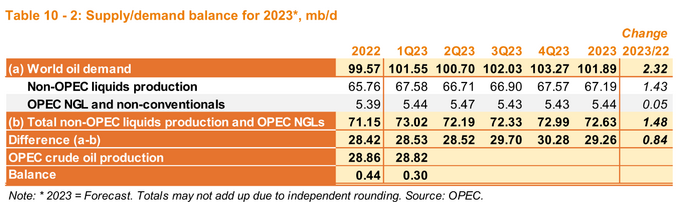
OPEC estimates of World Supply and Demand over the past few years suggests the World is oversupplied with Oil and other liquid energy supply (including NGL and biofuels) and this may explain recent cuts in OPEC+ output. The relatively subdued World oil prices also suggests the World may be adequately supplied with oil at present.
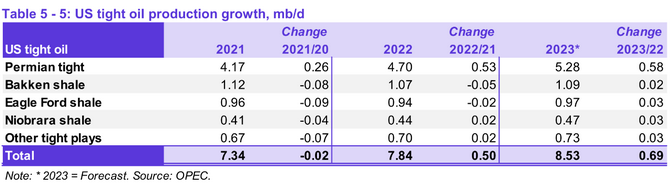
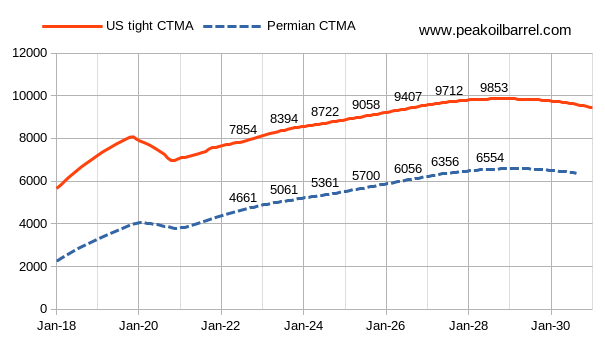
OPEC revised its estimate for US tight oil output in 2023 down by about 30 kb/d from last month’s MOMR. My estimate for US tight oil and Permian tight oil annual growth is 540 kb/d and 400 kb/d in 2023 and some believe my estimates are too optimistic, see figure 11 below with annual average output (kb/d) for 2022 to 2028 for my best guess scenario where it is assumed US exports of crude oil are allowed to continue through 2028. If we assume US C+C output minus tight oil output is relatively flat over the 2022 to 2028 period (with increases in the GOM offsetting declining Onshore conventional output), then the roughly 2000 kb/d increase in US tight oil output from 2022 to 2028 implies and average annual rate of increase in US output of only 333 kb/d over that 6 year period (and declining output after 2028).
185 responses to “OPEC Update, April 2023”
Dennis,
The trend lines in Figures 4&5 look cherry-picked like crazy. Just letting you know.
Stephen,
A period before the pandemic was chosen to show the trend prior to the pandemic, Jan 2015 was chosen as a starting point and Dec 2019 as an end point because there was a down turn in oil prices near the start of 2015 and the pandemic downturn was around early 2020, full years of data were chosen to reduce any data seasonality. Also the periods were based in part on World data, see chart below. Based on this chart what period looks “not cherry picked”, one can always be accused of cherry picking, but analyzing trends from 1870 to 2023 is not particularly enlightening in my view.
That data set is getting to be four years old. When trying to determine an inflection point such as peak oil, I don’t think using data that old can be justified. I know the recent data is very noisy from the pandemic but that’s all we’ve got imo.
Stephen Hren,
Not clear what you are suggesting, Ovi seemed to think for some data (OPEC Big 4) the June 2015 to March 2020 data makes sense for an OLS, that is shown below, since the pandemic there has been a very rapid recovery in World C plus C output with an average annual rate of increase of 3900 kb/d per year for an OLS on August 2020 to Dec 2022 data for World C plus C. Clearly that trend won’t continue, but my expectation is that we will see output increase at 400 to 500 kb/d per year for 3 to 4 years and then peak at that point followed by gradual decline. I expect the inflection point in 2027 to 2029, possibly due to lack of demand and the falling oil prices that result.
Stephen,
Maybe these are more to your liking.
Chart 4b
No not really. Data over ten years old is not relevant. I would probably start at 2015 and say we’ve been on a plateau for the last decade
I would start in 2016 and the trend line is flat.
But when you add in the rest of OPEC, the trend is clearly down. Just look at the chart below.
Hey, just draw the trendline for the OPEC 13, beginning at about January 2017, and see what that one looks like.
Ron,
Lots of different lines can be drawn, yes OPEC 13 is down from Jan 2017, the sanctions on Iran and Venezuela had a huge effect as did the pandemic. Hey we could start in 2020 as well. In chart below I use 10 years of data from Jan 2013 to Dec 2022 and throw out outliers from April 2020 to June 2021 for OPEC C plus C (EIA data). The decrease is due to sanctions imposed on Venezuela and Iran, plain and simple.
I can produce a far clearer graph, Dennis. Any graph should clarify rather than obscure.
It doesn’t matter what caused the decline. It happened and it ain’t coming back.
Click on the graph to enlarge.
Ron,
My chart has OPEC 13 data with outlier data removed (dates from May 2020 to June 2021) and an OLS trend line. You draw a random line by eye which tells us very little.
Interesting,
so in your view not including the outlier data from April 2020 to May 2021 is a mistake?
I disagree with that assessment. I doubt we remain on plateau, if that’s your thinking. Time will tell.
Stephen,
Here is OPEC minus Venezuela and Iran from April 2013 to March 2023 (10 years of data) with outliers removed using Tukey’s fences, basically April 2020 to June 2021 data removed based on this criterion. Fairly flat, but I believe this still underestimates the future trend as the entire period from Jan 2020 to the present should be thrown out in my view.
Dennis – This graph does a good job of showing the growth to ~2018/19, the turning point (pre-covid), and subsequent drop from 2019 to present. A cleaner representation would be to exclude outliers after 2016 that are 26500 or below 25500. See graph with scribbles below.
Kengeo,
I used a fairly standard definition of outlier with 1.5 times the interquartile range substracted from Q1 and added to Q3 to define the Tukey fences beyond which outliers are defined for the data set. There are good explanations for falling output after 2019 due to OPEC cuts after Dec 2018 and the Pandemic plus interest rate hikes by central banks as well as chaos caused by the War in Ukraine. My expectation is OPEC 13 output will be flat in the range of 29 to 30 Mb/d for the next 4 to 5 years and perhaps longer.
and chart 5b
The net increase for both trendlines would be about 128 kb/d per year for OPEC minus Iran and Venezuela crude oil from Jan 2005 to March 2023.
Dennis,
Thanks for the report. It seems OPECs projected oil demand will conflict with IEAs peak oil demand in 2024 (i’d speculate). Just a matter of choice as to which dumb “expert” to listen to i suppose.
Iron Mike,
Experts do not always reach the same conclusions about the future. I am simply reporting what OPEC is reporting, I think they are likely overestimating both future supply and demand, but I am not an expert.
Dennis – Nice analysis, but have to agree with SHREN, subtle cherry-picking has given way to egregious data exclusion…maybe adding in the longer term trends (as another POV) would offset / add perspective…?
Kengeo,
I can’t win, when I offer longer term trends, I also get complaints. I am showing the trend from Jan 2015 to December 2019. Here is a longer term trend from Jan 1993 to December 2022. No doubt you will say that is too long because you don’t like the result.
Interesting that the result is fairly close to the Jan 2015 to Dec 2019 result for OPEC minus Venezuela and Iran. For OPEC minus Iran minus Venezuela the Jan 1993 to Dec 2022 annual rate of increase is about 312 kb/d per year (using OLS on EIA data). If we use the Jan 1973 to Dec 2022 period the OLS trend is 235 kb/d/year for OPEC minus Iran and Venezuela and for World C plus C from Jan 1973 to Dec 2022 the OLS trend is 608 kb/d/year.
Kengeo,
Here is the long term World C plus C chart Jan 1993 to Dec 2022, notice the slope shows an average annual increase of 709 kb/d per year vs 479 kb/d per year for the shorter period from Jan 2015 to December 2019. In fact the period was chosen because it was a relatively flat portion of the output curve.
Does the IEA, OPEC or anybody really know what is happening with Russian Oil?
They are caught in a trap, and they can’t get out! Global economic leaders are probably embarrassed by trying to support a price cap on Russian oil that they knew or should have known, would never work. While the Biden administration threatens those who violate the price cap, the reality is that Russia is selling more oil with the price cap in place than they were before the invasion of Ukraine.
The Middle East, China and India are buying record amounts of Russian crude oil and in Europe and the US, they are knowingly buying laundered Russian oil that is feeding the Russian war machine. Reports show that China, Turkey, the UAE, Singapore, India, Saudi Arabia and other countries have feasted on Russian crude oil. Now some of those countries have refined that oil and they’re selling it back to the EU, Australia and other G7 nations in product form. So, while not buying Russian oil directly, they are buying derivatives of Russian oil every day.
Forbes says that countries are laundering Russian oil. They quote the Centre for Research on Energy and Clean Air (CREA ) says that China, India, the United Arab Emirates, Turkey, and Singapore as “laundromat countries” that increased imports of Russian oil after the Ukraine invasion. They also increased exports of refined products to the “price-cap countries” that sanctioned Russian oil, including the European Union, Australia, Japan, the United Kingdom, Canada, and the United States. In the year following Russia’s invasion of Ukraine, the five laundering countries increased seaborne imports of Russian crude oil by 140% over the previous year, according to CREA. They are absorbing 70% of Russia’s crude oil exports. The Russian oil finds its way into the price-cap countries as diesel, jet fuel and gasoil.
This is what happens when you have global leaders that have an agenda that seems to be divorced from reality. When you look at the war in Ukraine, there is no doubt that energy was a major undertone or the reasons and the execution of the war. Russian energy dominance as well as the European transition off fossil fuels left the entire continent vulnerable and now Europe is paying the price.
Today Reuters is reporting that, “India and China have snapped up most Russian oil so far in April at prices above the Western price cap of $60 per barrel, according to traders and Reuters calculations. That means the Kremlin is enjoying stronger revenues despite the West’s attempts to curb funds for Russia’s military operations in Ukraine. A G7 source told Reuters on Monday the Western price cap would remain unchanged for now, despite pressure from some European Union countries, such as Poland, to lower the cap to increase pressure on Moscow.” Yet Poland’s desire to lower the cap to increase pressure on Moscow won’t work if everyone on the globe basically continues to buy Russian oil. On the flip side of that, if everybody complied and refused to buy Russian oil above the price cap, then the world would be faced with shortages.
The oil market this morning doesn’t seem to be concerned about shortages even though we saw very bullish American Petroleum Institute Report (API). The API showed a trifecta of supply drawdowns and strong demand leading to crude falling by 2.675 million barrels. We also saw gasoline inventories fall by 1.0 million barrels and distill inventories by 1.9 million barrels.
We are also seeing signs that global oil demand has increased significantly with the Chinese reopening and more signs that OPEC is following through with production cuts. Chinese refinery runs hit a record high. Chinese refinery throughput surged to record highs in March 2023 as reported yesterday. Refinery throughput rates in China rose to a record high of 63.29 mn tonnes (or ~14.9 mbpd) in March 2023, reflecting recovery in domestic demand, as the nation reopened its borders earlier this year.
If the Russians had really cut production in March by 500 kb/d. you would think that the price oil would be more steady instead of being down $3/b from last week.
https://blog.pricegroup.com/2023/04/19/price-cap-trap-the-energy-report-04-19-2023/
Ovi,
I believe the thinking is that if Russia gets $60 for its oil rather than $80, that even if other nations are refining the oil, that those nations profit and not the Russians. Typically sanctions are not very effective, most international economists would likely agree. I think the alternative ( which might risk a nuclear conflict) most world leaders (except perhaps Putin) find unpalatable.
Dennis
I agree that it is the other nations that are profiting. Russia is happy with $60/b oil because their costs are lower and they need the cash. Also their currency has depreciated by 20% offsetting the $20/b loss.
Dennis – For OPEC 13, their combined production is 10% lower now than the 2017 timeframe (note average oil price from ’16-’17 was ~$45, which equates to ~$55-60 oil in today’s prices). My guess is that current EVs added would only drop oil demand by ~0.5 – 1.0 MBpD, globally. It may just be that OPEC combined peak oil was in 2017 and they’ve been losing ~2% annually ever since…Does the OPEC 13 have ~3-4 MBpD spare capacity? If they don’t then it seems there’s no way they can boost production back to 2017 levels, even with current high prices.
Kengeo,
It may be that OPEC 13 has peaked, though I would reserve judgement until the $125/bo prices in (2022 $) of the 2011 to 2014 period return in the future, OPEC might expand capacity if we see an extended high oil price period in the future.
Much of the decrease (about 82%) is explained by sanctions on Iran and Venezuela, as well as the failed state status of Venezuela. OPEC may not be able to return to the 2017 peak as Venezuela will not return to their 2017 level of output of about 2000 kb/d, Iran might be able to reach the 2017 level (3800 kb/d) if sanctions were eased. Other OPEC producers such as Nigeria and Angola have also seen significant declines in output while others such as Saudi Arabia, UAE and Iraq have seen increases in output. Much of the decreased output has been in response to either oversupply (in 2018) or lack of demand (2020 to 2021). I think looking at OPEC minus Venezuela and Iran gives a clearer picture.
Note that the trendline in the chart below uses OLS on the data points with the x from Jan 2015 to Dec 2019. The annual rate of increase over that period is 248 kb/d per year. Also a trendline on data from Jan 2005 to Dec 2019 has a slope of about 245 kb/d per year, very similar to the shorter period.
If we use all data Jan 2005 to March 2023 the trend is an annual rate of increase of 128 kb/d per year. I think using the pandemic data from April 2020 to May 2021 likely is skewing the result and that future growth is likely to be higher than 128 kb/d per year, the trend on the Jan 2005 to Dec 2019 data (245 kb/d per year) seems a better estimate to me.
Dennis
When I first saw figure 4, I thought that the wrong range had been picked for an OLS. Much to my surprise when I got down to the comments, I found similar thoughts.
Attached is a chart that shows an OLS line from June 2015 to March 2020, a more realistic range IMO. I think you left out March 2020. As can be seen the slope is close to zero, 4.9 kb/d/mth. Note that the OLS nicely intersects February 2023.
What this OLS is saying to me is: Sustainable production capacity is close to 21,000 kb/d and that is where it still is. Note that every time production has recently hit 21,000 kb/d and 21,500 kb/d, it falls back to a base of 20,000 kb/d.
I have looked at chart 5 and only have OPEC data back to June 18 for the remaining 7. I am not clear which countries are included prior June 18 since that is when Congo was a added.
Ovi, when a country leaves OPEC, all its historical data is dropped as well. And when a country becomes a new OPEC member, its historical data is added to the OPEC database. That’s the only it makes any sense. Otherwise, the historical OPEC data is meaningless.
Ron
I agree with what you say. The problem is where does one get the OPEC Congo data back to 2010. Please point me to where I can get data for the Congo back to 2010.
You use the EIA’s world data and subtract what you guess the percent condensate was.
Dennis
Have you done what Ron has suggested for Congo, Equatorial Guinea and Gabon?
Ovi,
I included a chart with all OPEC 13 data with outliers removed using Tukey fences. I used 10 years of initial data and some was removed as they were outliers as defined using Tukey fences. The slope was -170 kb/d/year.
See https://en.wikipedia.org/wiki/Outlier
Here is an OPEC 13 chart from Jan 2017 to Dec 2022 (EIA data), this tells us that there were severe sanctions imposed by the US on Iran and Venezuela in 2017, that OPEC cut back production in 2019 due to oversupply of oil on World markets and that there was a pandemic in 2020 and 2021 and all of these things affected OPEC output. The OLS trend is derived from the data shown on the chart, I think this trend tells us very little about future OPEC output.
I have the data for all of the OPEC nations back to 2005.
Ovi,
For Congo and other OPEC crude data see comment linked below
https://peakoilbarrel.com/opec-update-april-2023/#comment-756125
Ovi,
I try to use full years of data and would note that in the last OPEC post you had shown a chart with CTMA that has a plateau from mid 2015 to 2019, I used Jan 2015 to Dec 2019 data because a CTMA plateau starting in July 2015 would include data starting in Jan 2015. My interpretation of your chart is that the big 4 have been adjusting their output based on their evaluation of demand for their oil. We will have a better idea if this is correct if there is a higher oil price environment, only then will we know if they can produce at higher output levels.
Chart below looks at April 2016 to March 2020 (to use full 12 months of data for 4 years) for OPEC big 4 and OPEC other 7 (this excludes Venezuela and Iran). Big4 has annual decline of 12 kb/d and Other 7 an annual increase of 74 kb/d, the net for OPEC 11 (exludes Iran and Venezuela) is an annual increase of 62 kb/d per year over that 4 year period (April 2016 to March 2020).
The OLS trend lines use the data from the markers only (April 2016 to March 2020).
Dennis
Based on these to charts we agree that OPEC production from the big four has been pretty flat from 2016 to March 2020.
Forgot to mention that I like the new look of your OPEC charts with the moving average not as dominant, but still there to be seen.
Thanks Ovi,
hope you saw the link to STEO where you can get data for OPEC crude back to Jan 1997.
I agree Big 4 output was reatively flat over 2016 to March 2020, also would agree OPEC is not likely to return to the peak level of 2016, but I think flat output for a few years is possible, with increases in big 4 (if oil prices are over $80/b) offsetting declines in the rest of OPEC. If oil prices are low we could see OPEC output fall.
Ovi,
You can get the data back to 1997 from STEO see
https://www.eia.gov/outlooks/steo/data/browser/#/?v=7&f=M&s=0&start=199701&end=202412&map=&linechart=~COPR_CF&maptype=0&ctype=linechart
Ovi,
Chart below has OPEC minus Iran and Venezuela (I believe future output from these two nations will be relatively flat),the OLS is from June 2015 to March 2020 (orange x symbols) as you suggest is best. Annual rate of increase is 111 kb/d per year.
Oil exports from Russia’s western ports hit 4-yr high in April
MOSCOW, April 19 (Reuters) – Oil loadings from Russia’s western ports in April will rise to the highest since 2019, above 2.4 million barrels per day (bpd), despite Moscow’s pledge to cut output, trading and shipping sources said.
Russian crude exports and transit from the ports of Primorsk, Ust-Luga and Novorossiisk in April will rise above 10 million tonnes, up from 9.7 million tonnes in March, which is a day longer.
Corrected for the extra day, April and March exports from these ports are 2.43 Mb/d and 2.29 Mb/d respectively.
Note that it states that exports will be above 10 M tonnes in April.
https://www.reuters.com/business/energy/oil-exports-russias-western-ports-hit-4-yr-high-april-sources-reuters-2023-04-19/
It’s becoming clearer to me that peak oil supply and peak oil demand are happening simultaneously, as ridiculous as this sounds. That’s why we have a medium bound price range. OPEC has announced over 2M bpd of production cuts this year, and literally nothing happened. In 1979 this same amount of oil was taken off the market and the world went apeshit. Peak ICE car sales were in 2017. Peak oil production was in 2018. These two facts are not coincidental.
The heaviest oil users are the ones flocking to EVs. I work in construction and real estate. Folks who drive 30-60K miles/yr. Everyone who can is switching to electric. At a 1% EV saturation rate, oil consumption will fall probably 3-5%. When it reaches 10% saturation later this decade maybe 2027-28, it will be around a 25% reduction.
Watch the Shanghai auto show. The Seagull. New EV range of 200 miles for $11K. I don’t know if they’ll ever sell these in the US for whatever reason, but they’ll be buying them everywhere else and we’ll be stuck with Teslas lol. When I first watched Tony Seba back in 2016 I thought he was insanely optimistic . But he hasn’t been proven wrong yet.
https://www.reuters.com/business/autos-transportation/shanghai-auto-show-crowds-flock-byds-seagull-2023-04-19/
There’s a reason Warren Buffett invested heavily in BYD. He’s smart as shit.
Why would a 10% saturation of light transport by EVs lead to a 25% reduction in oil demand?
NIKO
EV cost advantage is in the operating costs, including fuel and maintenance. So the more heavily the vehicle is intended to be used, the more attractive EVs are to buyers.
Most cars spend 90% or more of their time standing still. But taxis, buses, delivery vans etc are used much more, so operating costs are a bigger part of the total cost of ownership. This means the market for EVs is likely to skew towards more heavily used vehicles.
1) So you think oil price is range bound because of reduced demand that will happen sometime in the future? 2) we’ve already hit and exceeded our “warren buffet is a genius and has anything relevant to add to any situation” quota for the month.
“The heaviest oil users are the ones flocking to EVs.”
And that goes a long way toward explaining why China is so far out ahead on electric vehicle production.
They are the biggest oil importers and therefore have great incentive…and some foresight.
Niko- As Stephen indicated…the drivers who put on the greatest mileage (and have the greatest fuel consumption)
are more likely to see a big financial advantage by switching to EV. This goes for fleets as well. These high mileage users have a much greater impact on fuel demand than does a lower mile/yr driver.
Even if the heaviest users switch to EV, those numbers don’t add up.
The total transportation sector (without looking at only light transport) consumes around 60% of oil. In order for 10% saturation of EVs to lead to 25% reduction in demand, that 10% would need to be consuming 41% of transport fuel. That is including fuel used for planes, trains, and ships, and we are only talking about replacing light transport.
Niko,
For the US in 2021 about 8 Mb/d of gasoline was used on average by light duty vehicles in the US. The average input of crude to refineries was 15 Mb/d in 2021 and about 1.4 Mb/d of gasoline and diesel was exported (net exports), so crude actually consumed in the US (not exported as products) was roughly 13.5 Mb/d. So approximately 8/13.5 or 60% of crude oil was consumed by the light duty vehicle fleet. I believe the demand being considered by Stephen Hren is the gasoline demand in the US. And he is likely correct that the high demand users are those most likely to switch to EVs because their savings will be highest. Most of the miles travelled are in newer vehicles (the miles travelled per year tend to be higher) and the number of new vehicles that are EVs tends to be higher and this proportion will grow over time as the percentage of new car sales that are EVs increases. The Model Y was the best selling vehicle in 2023Q1 in the US that was not a pickup truck and the best selling vehicle in Europe of any type.
Dennis, I am realizing that some of the confusion stems from the EIA’s definition of “petroleum”. Their data shows 19.8 mb/d of total petroleum consumption, but that stems partially from biofuels and from liquids that I suppose you would not consider to be petroleum. See https://www.eia.gov/energyexplained/oil-and-petroleum-products/use-of-oil.php. If we go by the EIA’s definitions, then 63% of the total transportation sector (with transportation in total being 67% of total oil consumption) goes to gasoline for transport.
Another way of looking at it: “In 2021, total gasoline consumption (based on energy content) accounted for about 58% of transportation sector total energy consumption and 16% of U.S. total energy consumption, and (based on volume) 45% of total petroleum consumption.” From https://www.eia.gov/energyexplained/gasoline/use-of-gasoline.php
If we used these numbers, then the top 10% of consumers of gasoline would need to consume over half of all gasoline in order for a 10% market saturation of EVs to replace 25% of oil consumption.
Regardless, if 60% of total petroleum is used by the light vehicle fleet, the calculation I performed above (in my other comment) does not actually change, I just need to remove the caveat about planes, ships, etc.
I still do not think it reasonable to believe that the top 10% of consumers is consuming 41% of light vehicle fuel. I am not sure where to look to verify this assumption, however.
This is also all predicated on the idea that the largest consumers will in fact be the first to switch to EVs. There is no reason to believe that this will be 100% the case.
I am not arguing that total number of EV sales will not increase. Simply that a 10% market saturation of EVs will not lead to a 25% reduction in oil demand. Not even close, in my humble opinion.
If we assumed that 10% of drivers consume 20% of gasoline, and use your numbers Dennis, and assume that the first 10% of EV owners will be in the highest consuming group, then a 10% market saturation by EVs would lead to a 12% reduction in oil demand. This seems much more reasonable, though we are still making a big assumption about the usage patterns of the first 10% of EV owners.
Niko,
I focus on crude oil see
https://www.eia.gov/dnav/pet/pet_sum_crdsnd_k_a.htm
Crude input to refineries was about 14.4 Mb/d in 2021. Note that EIA does include natural gas liquids as a petroleum product, but most of this is not used as a transportation fuel, but for heat and chemical industry input. Crude oil is the important ingredient for gasoline, diesel, and jet fuel which power most transportation.
Also keep in mind that Stephen Hren may be thinking in terms of Uber, Lyft, and taxis providing a larger share of miles travelled and might even be thinking of the problem of self driving cars being solved in the future. Though I am guessing about that.
In any case we are guessing as there is no data I have seen on numbers of miles travelled in EVs vs ICEVs, there is data suggesting newer cars are driven more miles and also the population of older vehicles decreases after 6 or 7 years as cars get scrapped over time.
US data from 2009 suggests vehicles 3 years old or newer made up about 20% of the fleet, but travelled 24% of total miles, not really that big a difference.
In short you might be right that the effect (if it exists) may have been overstated.
Cumulative plugin vehicle sales in the US are roughly 3 million. Let’s say each of these vehicles travels 14k per year and replaces vehicles that had average fuel consumption of 25 mpg. That’s about 13.3 barrels of gasoline per vehicle per year times 3 million so 13.3 million barrels divided by 365 days per year giving only a 36 kb/d reduction in gasoline demand, so not a big effect yet.
I realized some of the gasoline consists of ethanol so crude content of gasoline is 90% of 8Mbpd or roughly 7200 kbpd in the US.
About 3 years ago I said that vehicles with plugs would be over 90% of global light vehicle sales sales by 2030,
which probably sounded delusional at the time, and may still sound so to many currently.
But I still think we are on track to get to that level.
In 2022 10.2 million of the 79.6 million sales were plug models [12%].
I don’t know if total sales will be up or down by then…I’d guess down even though the global population will be up about up 500 million people by then.
Yeah – but there’s like a 1% chance that the reason oil price is “range bound” is because of demand from EV and plug in sales. it’s a very poor understanding of economics that would lead you to that conclusion.
There were about 28.1 million cumulative sales of BEVs and plugin hybrids combined as of the end of 2022. If was assume each of those cars was driven an average of 13000 miles per year and replaced a vehicle that had average fuel economy of 25 MPG (miles per US gallon) then demand for petrol and distillate fuel would be reduce by 953 kb/d. In 2019 (the peak) World consumed about 52347 kb/d of petrol and diesel/gasoil, 953 kb/d is about 1.8% of 2019 demand. As the number of plugin vehicles on the road increases demand for petrol and gasoil will slow and eventually decrease.
The IEA is predicting that nearly one new car in five will be an EV in 2023.
https://www.iea.org/reports/global-ev-outlook-2023/executive-summary
I used to hear that in order to get into the upper reaches of the Chinese leadership, you just about HAD to have a solid technical education. Haven’t heard this for quite some time.
But assuming it’s true, then this explains WHY China is leading the world in terms of wind, sun, and electric vehicles.
Lawyers such as our typical leaders in the USA believe engineers will save them, long term, so they can do as they please, short term.
Engineers know better……. that if they are to survive long term, it will be because they do the right things NOW.
” that peak oil supply and peak oil demand are happening simultaneously”
So far this scenario is playing out…thus the range-bound pricing [$50-120]
We are likely at both rough peak plateau and rough peak demand.
Why would I call such a wide range of price ‘range-bound’?
Because as any observer has seen, it is a fickle market- geopolitics, speculators, bad data,
invisible resource, shifting alliances, pandemics, central banks (and their opposite- floating chaos), etc.
For the record, I do expect a big price surge this decade, as supply falls short of demand by up to 5 mpbpd.
Still the long range charts of supply and demand will look pretty similar when viewed from the future.
After all, you can’t consume more than you produce.
Hickory,
I am becoming less certain about a big oil price surge, we might see $100/bo for an annual average oil price in 2022$ in the future, but I doubt it goes higher than that, demand seems to be growing more slowly than I imagined a few years ago and oil supply seems to be keeping up with demand.
Understood, and yes I see that as a feasible scenario.
But I do rank the risk of unforeseen disruptions to oil production and international trade as
higher than you, I suspect.
Hickory,
Perhaps. I would agree future disruptions are likely, but probably not severe, I would put odds at one in 10 for an annual average oil price above 100 per barrel in next 5 years and same probability for annual average oil price less than 60/b,both in 2022 $.
Stephen – You are spot on, if someone drives an old honda 40,000 miles per year for 5 years, here’s generalized economics:
– Used car price: $20k
– Gasoline cost: >$20k
– Maintenance cost ($.10 per mile): >$20k
– Total >$60k.
An EV, Tesla in example below but could be a cheaper option like Bolt (Chevy)…
– Used Model 3 (or new add ~$10k): $30k
– Tires ($.03 per mile): $6k
– Charging ($.03 – $.1 per mile): $6k to $20k
– Total >$42k to 56k.
Who wouldn’t want to save between $100 and $300 per month?
I think it will be interesting to see the disparity between ICE and EVs grow, essentially an ICE needs to be half the price of an EV to be breakeven…that excludes the performance benefits that EVs have over ICE…
Kengeo , a used Tesla ?? Hope you have a reliable battery tester , because if you go kaput you are going to get a marine like haircut . 🙂
P.S : How many have their own battery tester ? Makes me go –hmmm .
Battery warranty is 8 years/100,000 miles, so only an issue if you get high mileage/older Model 3…
HV battery failure is rare, but it’s a reasonable concern. Battery replacement outside warranty is ~$15k, batteries may last 250k-500k miles, so $.03-.05 per mile, not bad…
Hole in head,
You can see what the car can charge to on the dashboard, no need to test, there will be lots of used evs on the market before long. A used Chevy Bolt is about 16k after rebate, the new Bolt is about 20k after rebate so probably makes sense to go for newer vehicle. Used Tesla Model 3 for as low as 30k after rebate in US.
There’s already a trend among people who rent out in the boonies and commute to town jobs looking for rental houses closer to town. A few years back you could buy a reasonably reliable old car that got good mileage for as little as a couple of thousand bucks.
Such cars are unobtainium these days.
Local guys in my neighborhood are spending a couple of thousand bucks, or more, repairing cars and pickups that would have been scrapped four or five years ago, expecting to drive them at least another couple of years.
2 weeks and 2 days and we are back to where we started. Uh Oh! Looks like it’s time for another OPEC Cut! 😂🤣😂
COLUMN: The world is expanding oil refining capacity at a speed unseen in nearly two generations.
RBC Capital Markets, an investment bank, reckons the 2023-24 boost is the largest two-year increase in net refining capacity in 45 years
https://twitter.com/JavierBlas/status/1648942898526707714?cxt=HHwWhICzmY21nOItAAAA
and
https://oilprice.com/Alternative-Energy/Wind-Power/Wind-Power-Has-A-Profitability-Problem.html
more refining less green energy,,,it’s a twister
TTT , ” Show me the money ” Cuba Gooding or Tom Cruise in “The color of money ” . Show me the blended oil to run these refineries . 🙂
HiH, let’s pretend we both know nothing. Would you build a lemonade stand if you thought you could not get any lemons. It’s the same with all midstream, the prevailing “wisdom” on the forum is that those will lots of money don’t know what they are doing. TO the contrary they may not be always right but they have certainly done the due diligence before they spend billions of dollars. It’s not like wind and solar where you get a tax credit then go loose money for decades ON PURPOSE.
TEXASTEATWO
Leaving aside the psychology of rich people, and other personal remarks, the fossil fuel business has been one of the most profitable in the world for the last century or so, but that is changing.
A good example is the coal fired power plant industry. What looked like a winner 15 years ago is rapidly becoming a financial black hole. Huge sums have been invested in plants that are running at very low capacity.
The world is changing very quickly. People underestimate that. I expect a lot a stranded assets in the next decade.
In the 10 years ending in December 2019, energy was the worst performing sector of the stock market (https://oilprice.com/Energy/Energy-General/Energy-The-Worst-Performing-Sector-Last-Decade.html). I do not expect the sector to do any better in the 10 years ending in December 2029. I do expect other sectors to do worse though. I am retiring this year and plan to go into what I believe will be a huge growth sector: agroecology.
Hi Dennis or Ron,
Move this to the other thread if you think it should be there…….. but I think it is equally relevant here, considering the discussion is mostly about future oil supply and price right now.
Wind and solar farms ARE NOT losing money, but I do understand the meaning of “losing money on purpose”.
The ones with long term sales contracts are locked in with at least a modest profit guaranteed…….. even if that’s because of tax credits at this time.
And once such contracts are finished up………… five ten fifteen years down the road……… they’ll be PAID FOR.
And there’s every reason to believe that they will be able to sell every kilowatt hour they can produce at a decent profit. Quite possibly a very nice profit.
( By then we will have the smart grid, smart appliances, and various ways to store electrical energy for later use, at affordable costs…. such as running electrically heated water thru a truck load of gravel under a new built house to keep it warm in the winter…… and chilled water to keep it cool in the summer, using wind and solar juice when it’s CHEAP off peak. We will have electric cars by the millions as well…. and most of them will be capable of two way operation, grid to car, car to grid or house.)
It’s hard to believe anybody who follows this forum thinks natural gas will always be cheap and plentiful, or that we’ll be going back to coal or nuclear power.
I would like to hear any estimates made by the number crunchers here about how much HIGHER the price of natural gas would be, nationally and world wide, without the ten percent or so of our electricity being generated by wind and sun.
It’s my firm belief that on a COLLECTIVE basis, the money we have spent on wind and solar subsidies has saved us several times as much as we spent on these subsidies………. by way of LOWER MARKET PRICES for natural gas and coal.
And within another two to three years, there will be enough electric cars and trucks on the road to start cutting significantly into the amount of oil used for gasoline and diesel fuel. The ones that run all day every day will be the first to go electric once they’re more plentiful and cheaper.
Demand for oil is obviously inelastic…… meaning a cut in supply, everything else held equal, results in the price rising so that the producers GET MORE MONEY FOR LESS OIL. The flip side is that when we buy less oil, we save not only on the quantity……… we save EVEN MORE due to getting it cheaper.
Of course everything is NEVER held equal, there are always economic ups and downs, political problems such as wars, pandemics such as Covid, etc.
I’m no expert by any means, in terms of the energy industry.
But I’ve spent the last ten years or so putting in one hell of a lot of time studying the BIG PICTURE.
And anybody with two or more working brain cells who has put in the time making a study of the BIG PICTURE absolutely MUST come to the conclusion that we either go electric or that we go back to living the way my great grand parents lived……
Meaning in turn that most of us will die hard because we’re NOT going back to a time when most of us live on the land producing food for the others. Without diesel fuel, without manufactured fertilizers, without tractors, trucks and combines…….. most of us starve….. or die fighting and rioting.
Depletion of oil and gas GUARANTEE a crash and burn overshoot landing unless we go electric.
Mac, I agree with almost everything you say. Where I disagree is you seem to think it is totally possible to go totally electric. That is just a pipe dream.
Question: Where did you get this paragraph? It looks exactly like something I might have posted… as pure sarcasm.
( By then we will have the smart grid, smart appliances, and various ways to store electrical energy for later use, at affordable costs…. such as running electrically heated water thru a truck load of gravel under a new built house to keep it warm in the winter…… and chilled water to keep it cool in the summer, using wind and solar juice when it’s CHEAP off peak. We will have electric cars by the millions as well…. and most of them will be capable of two way operation, grid to car, car to grid or house.)
Great article by Roger Blanchard over on Resilience.org. Lots of good charts. Long article so I will only post the conclusion here.
The Status of Global Oil Production: 2023 Update
Conclusion
It appears to me that the wolf is nearing the door when it comes to oil supply problems but it’s a topic that is almost never mentioned anymore by the mainstream media in the U.S. The media was excited about the U.S. oil supply during the boom years from 2008 through 2019 but not anymore. Thus, we are heading blindly into the future oblivious to what is coming.
When it comes to global warming, there has been a fair amount of coverage from the mainstream media in the U.S. during the last year but I see it as often Pollyannaish. A common theme is that future conditions might be a little bit unfavorable but we will adapt and with our transition to renewable energy sources, we’re actually moving into a utopian future. I think we’ll end up a long way from utopia.
Roger Blanchard is a very smart man. I agree with him 100%. We will end up a long way from utopia.
Ron, this deadpan line kills me:
Short-term desires that involve the use of oil and oil distillates are far more important to Americans than the long-term consequences of environmental issues such as global warming.
Good find Ron . Confirms what a few have been bleating here for quite some time .
oh look Texasteatwo is right once again…must be dumb luck🖖
https://oilprice.com/Latest-Energy-News/World-News/Chinas-Coal-Use-Set-To-Rise-With-Growing-EV-Demand.html
“the “only real option in the short term” for China to boost its electricity grid stability is to increase coal-fired power production, ANZ Group analysts Daniel Hynes and Soni Kumari said in a report on Thursday, as carried by Bloomberg.”
wow the truth coming at us in a full frontal fashion
“That wind and solar, with some green hydrogen and battery storage, could replace fossil fuels entirely is one of the most pervasive and, at the same time, most blatantly untrue myths in the energy transition canon. The laws of physics debunk it every single day.”
https://oilprice.com/Energy/Oil-Prices/Why-We-Still-Need-Oil-Gas-For-Decades-To-Come.html
Texastea,
An opinion piece by Irina Slav is not the best source of reliable info imho. World consumption of wind and solar grew at an annual rate of 16.7% from 2011 to 2021 based on data from BP Statistical Review of World Energy. World consumption of fossil fuel grew at about 0.75% per year over the same 11 year period. From 2018 to 2021 fossil fuel consumption in the World grew by 0.0234% per year while over that same 3 year period wind and solar consumption grew by 15.7% per year (also based on data from BP Stats. Just some facts to consider. Also consider that if wind and solar continue to grow at the 2011-2021 rate of 16.7% per year that all fossil fuel consumption is replaced by 2040 or so.
Texas…I agree that fossil fuels will be needed/desired indefinitely for the petrochemical derivatives, and for fuel.
Nonetheless solar and wind energy can and will replace somewhere north of 70% of the energy provided by 2050.
It’s pure hubris to imagine that man’s puny machines could outshine the sun.
Seriously, go outdoors on a summer day before dawn. Then wait till news. Notice how the temperature of the great outdoors increases? How many gas plants would you need to heat the entire air column to the horizon in just a few hours?
People believe what they choose to believe regardless of the facts. Ignorance is strength. Thinking that 15% growth in renewables who represent 10% of 20% of the energy transition issue is not how you project future growth they are blind guides. The past is not the future. Wind and solar will never exceed 20% of our energy mix. They can’t.
“People desire to believe what they desire to be true.”
Frances Bacon
You are correct JT, When it comes to core beliefs, facts don’t matter. I am writing a very short book about that very fact. Going very slow but steady.
“You are correct JT, When it comes to core beliefs, facts don’t matter.”
And that explains why he makes the statement-
“Wind and solar will never exceed 20% of our energy mix. They can’t.”
Hickory, perhaps… But there are no hard facts about the future, only opinions.
“IT’S TOUGH TO MAKE PREDICTIONS, ESPECIALLY ABOUT THE FUTURE”
– Yogi Berra
(sorry about the Caps)
Of course there are no future facts.
JT- says “People believe what they choose to believe regardless of the facts.”,
and then he immediately follows it that with his own beliefs…as if they are facts.
I’m just pointing out that your beliefs don’t equate to facts, any more than the next guys do, even Tucker Carlsons… believe or not.
That’s correct Hickory they can’t. Spend some quality time in USGS and calculate the resource vs reserve ratios of the various elements needed to produce the amount of wind and solar to replace the global electrical grid which represents only 20% of our energy mix and you’ll discover it can’t be done. And if it could it would take 50 years and have to be replaced by then. The only way it can be done is with free abundant energy which is the issue isn’t it.
JT,
In 2021, electricity production used about 42% of primary energy consumption in the World based on BP Statistical review of World energy. You may be forgetting that about 60.4% of the primary energy used to produce electricity is simply waste heat. So if you wish to convert TWh of electricity to Exajoules, (divide TWh by 278) you then need to divide by 0.406 to account for the waste heat to convert to exajoules of primary energy, the result is 252.2 EJ of primary energy was used Worldwide to produce the electricity consumed. Total primary energy consumed was 595.15 EJ in 2021, 252.2/595.15=42%.
See https://www.bp.com/en/global/corporate/energy-economics/statistical-review-of-world-energy.html
You also forget that as we move away from fossil fuel and eliminate much of the waste heat of the combustion process the need for primary energy diminishes, by as much as 250% (100 units of energy replaced by 40 units of energy). Scarce materials such as copper can be recycled and can be replaced by aluminum in some cases and in other cases by fiberoptic cable (in communication applications).
FED’s funds rate is at 5% while 4 week T-bills are at 3.28%. 4 week T-bills are the best of the best collateral.
Collateral is in short supply. Which is why we have a 170 points of inversion here. When the leverage oil longs have to sell because they don’t have and can’t get the collateral to hold their positions. Oil prices takes the elevator down not the escalators or stairs.
I expect yields on those 4 T-bills to go to zero or below as this progresses. That is regardless of what the FED does or doesn’t do.
Counterparty risk and trust! Got collateral? If you don’t you do anything or pay any price to get it. Which is exactly what we are seeing with the T-bills.
2008 was a massive global dollar shortage. I happen to believe what we are entering now will be bigger than 2008. Hope I’m wrong. I’m looking but can’t find any data that suggests I am wrong.
Well one issue I have is that the dollar itself has not performed as well as the long dated bond market. the dollar is losing its negative correlation with the S&P 500 (from -0.6 on 120D to -0.24 on 15D) and I don’t think the S&P will do well in a “bigger than 2008” scenario.
There is the simpler issue that we have entered a profit recession, economic data has very much rolled over and is slowing, contracting, and/or going negative across wide array of indicators. Also biggest cluster of bubbles in human history is popping. I know you like to CONSTANTLY beat the dollar shortage drum, but I think you lose the thread of how normal people think about these things and possibly even how markets digest information.
EXAMPLES: personal consumption YoY has been slumped for over a year; Industrial Production YoY has water up to it’s forehead; Retail sales: no; Total employees (NFP): toast; Income: wrong; Imports: what imports; Exports: barely; Mortgage purchases: shadow realm. I mean it’s not ALL bad, but it’s mostly a sea of red as far as actual economic data that feeds into the GDP.
keep in mind I agree with you, but let’s also understand why gold is doing so well and most importantly for this PEAK OIL thread – OIL WILL NOT DO WELL
Gold gets sold as it did in 2008 as this progress. One of the very few things that doesn’t really have any counterpart risk.
Gold isn’t hedging inflation it’s hedging deflation. (Lower interest rates and shitty economy). But it will absolutely get sold to meet margin as the banks aren’t lending. Unless you have the best collateral you’re not getting a loan. The fallout from SVB and Credit Suisse hasn’t even hit yet.
I think we are entering a period of time where falling treasury bond yields means lower stock prices, lower gold prices, lower bitcoin prices, and lower oil prices.
Lower bond yields for a long time have meant higher prices. Markets changed when macro underlying fundamentals change.
Deflationary monetary conditions which are anything that impedes credit are just starting to spillover into real economy.
Again the curves have been warning us for over a year that this was coming.
https://mishtalk.com/economics/the-strangest-us-treasury-yield-curve-in-history-whats-goin-on
The strangest yield curve in history
I’m going to disagree with the notion that the inversion of the 1’s and 3’’s is due to debt ceiling.
4 week T-bills are the best most liquid collateral you can get. We aren’t seeing a huge sell off in 8 weeks and 3 month bills. Not a rotation out of them into the 4 week bills to avoid debt ceiling.
Money market funds aren’t selling bills in mass.
Huge bid in 4 week bills is a run on collateral. When the price of collateral goes through the roof. It becomes very expensive to roll leveraged positions over. These 4 week bills are used in all kinds of REPO borrowing and derivative and swap contracts.
SVB and Credit Suisse were just the first to go. Think 2008 Bear Stearns. What comes next?
What is going to be 2023’s or 2024’s Lehman?
Where did the price of oil go after Lehman?
Heck FED’s RRP rate which should be the floor of interest rates is 4.80% while 4 week T-bills are at 3.35%. The bid for collateral is massive. Which means collateral shortage. Which means a lot of borrowers won’t be able to rollover their debts that are coming due.
Banks are tightening lending and hoarding collateral. Which is why money supply is falling.
In this climate I say good luck to all those who believe inflation is here to stay.
Projections for Nat Gas production US
Coffeedude has been saying something along these lines for years now.
Hickory,
Yes, although that chart may simply be referencing the associated gas produced along with oil (chart label, anyway).
This would exclude ~13 Trillion cubic feet annually produced from the Appalachian Basin and virtually all Haynesville output, amongst other sources.
There is a short, interesting article from the Natural Gas Intelligence folks describing Mexico’s nascent LNG program.
Eye opening comment claims that if all the proposed projects come to fruition (improbable, but not impossible), Mexico could vault into the fourth largest LNG exporter position almost overnight.
With Waha prices at ~$1/mmbtu, and JKLM spot (Asian LNG price) at about $14/mmbtu, there is a heck of a lot of money to be made by being involved in these operations.
Yes…the graph is ‘associated gas’.
[Associated-dissolved natural gas, also referred to as associated gas, is natural gas produced by oil wells]
Overall- ‘In 2022 gas production amounted to 38.9 trillion cubic feet, while the nation used 32.3 trillion cubic feet.’
Hickory,
If you – or anyone, actually – wishes to get a sense of ‘where the puck is going’, rather than making somewhat linear extrapolations of the status quo, a 10 minute read of Liberty Oilfield Services Conference Call transcript from the other day offers some compelling info on what to expect in the future hydrocarbon world.
Liberty just acquired a Permian CNG company (Siren) by which Liberty will obtain its needed fuel for its burgeoning electric frac fleet.
As Liberty is making the rapid transition away from diesel to natgas/electric frac’ing, the economic benefits will spur competitors to likewise adapt or wither away.
(The natgas-fueled, reciprocal engine system Liberty will use for baseload power, will exemplify microgrid potential/economics/flexibility right in the heart of a 5 million barrel oil per day region).
Although some (cough, Dennis, cough) might think CEOs such as Chris Wright are not the ‘sharpest tools in the shed’, the continued transition to natgas is overwhelmingly likely as forward thinkers embrace this route.
While most on this site understandably focus on oil, the ‘puck’ is heading inexorably towards natgas.
Thanks..always interested to hear about what innovations are being worked on.
Coffeeguyzz,
The move to using natural gas for frack fleets makes sense. Generally some of these CEOs are pretty smart, in some cases there are some that make outrageous claims, Harold Hamm comes to mind, others like Sheffield seem sharp to me.
As more NG gets exported it may become expensive.
Rig and Frac Report
Hz rigs were up 3 to 543.
Permian up 4 to 343
Texas up 1 to 312
Fracs were up 7 to 290
Fracs
Does anyone have a chart of fracked linear feet per month? Tight oil production levels don’t seem to track frac spreads, so I wonder if the disconnect is feet/frac?
Rigs by Basin
The first column is the first week in March. Last column is April 21.
Cana Woodford down 7 to 24 over the 8 weeks
Eagle Ford down 10 to 58, What is happening there, anyone?
Permian up 12 to 343
Ovi,
I believe that the natgas percentage for the Cana Woodford wells is fairly high, as is the Eagle Ford’s – depending upon location. The low natgas price might be behind the pullback in these regions.
FWIW, the Barnett was assessed by the USGS to have 53 Trillion cubic feet technically recoverable back in 2015, yet only one rig is working there. Other basins are, apparently, more economically attractive to currently develop.
That 53 Tcf is over double the size of Turkey’s Black Sea field which is just now coming online.
Lottsa natty.
Coffeeguyzz
Thanks for the info. In Canada we have a company, Arc Resources, that focuses on natural gas and the analysts keep recommending it. The reason for their recommendation is that it is Liquids Rich. These liquids, ethane, propane, butane and some pentane command high prices. I have read that Cana Woodford is a liquids rich gas play.
A company, Baytex, recently bought Ranger oil in the Eagle Ford. Would Ranger stop drilling while it is waiting for the takeover to be completed, possibly in late Q2?
Ovi,
Re Ranger/Baytex … while I am unfamiliar with the specifics, the selling company is not apt to act in a detrimental fashion to the new, combined entity.
The negotiations may be hard nosed, but there is an understanding that operations need to function so as to ensure a smooth transition.
That may span from a complete cessation of new drilling to actually tapping ‘new frontiers’ to prove up expected resources.
I have seen it go all over the spectrum in the Appalachian Basin this past decade.
Regarding liquid rich natgas …
There is a large number of new PDH plants (Propane Dehydrogenation) coming online in China now and in the past few years. Europe should have 2 coming online shortly, and India is planning on its first PDH plant next year.
These projects consume an enormous amount of propane.
There is an entire ‘sub industry’ surrounding the new fleet of large ships to transport this product (along with ethane for the new build global ethane steam crackers).
Historically, naptha would provide most of the feedstock with which to make a wide array of plastics.
The huge supply of propane/ethane/butane from ‘shale’ formations has upended legacy processes
(US now exports ~2 1/2 million bpd of NGLs … and increasing).
Next time that you are in a supermarket, Ovi, glance up and down the aisle. Virtually. Every. Single. Product …from dairy to detergents, from meat to mustard to miscellaneous … ALL of it uses ‘plastic’ in some form. Even the glass/cardboard-paper/can products invariably have a ‘plastic’ seal in the lids, lining, or internal bag.
Demand for NGLs should remain strong far off into the future.
Coffeeguyzz
Thanks for the info.
Is PDH something new or has it been around since pre 2000. Is its expansion related to increased demand for propylene?
Ovi,
As I am not especially knowledgeable about the downstream plants, I cannot say much about the PDH history.
Prior to the ‘shale revolution’, oil sourced naptha provided much of the feedstock which refineries then converted into propylene and, mainly, polypropylene.
With inexpensive, abundant propane (and ethane) sourced from large volumes of ‘shale’ wet gas, these new PDH plants – as well as dedicated ethane steam crackers which produce ethylene, and thence polyethylene – are now being constructed.
One new one is coming online right now in Alberta.
Coffeeguyzz,
There is a big difference between technically recoverable resources and economically recoverable resources as Mr Shellman correctly points out on occasion. At $2/MCF the ERR for the Barnett is simply the cumulative production to date. Remaining ERR is roughly zero, at today’s NG price, but if prices increase some might become economic.
53 TCF sounds like a lot, it is less than 2 years of US consumption.
Dennis,
Of course.
I find it somewhat perplexing – and amusing – that you continually get into discussions over the years regarding the USGS assessments.
Unlike the EIA, the USGS studiously avoids the economic aspects in hydrocarbon recovery, although the F5/F50/F95 classifications should provide some ‘clues’ to any informed observer.
The TECHNICALLY Recoverable Resources are exactly what the name depicts … known, in-the-ground hydrocarbons that are TECHNICALLY able to be recovered using contemporaneous technology.
That’s it.
If natty sells for one buck or ten per mmbtu, the follow on extraction will (or not) proceed. Same for earl.
Simple as, and you recognize this as you have tried to explain this umpteen times over the years.
(PS, the Mancos B is USGS-assessed at ~66 Tcf … and no one but we wonks have hardly ever heard of it. Tons of other gas-bearing rock in the US and – indeed – throughout the world).
(PPS, when I just re-checked that 66 Tcf Mancos number, found out that ANOTHER nearby formation [Mancos-Menefee Composite, to the south of the Mancos B] has a TRR assessment of 27 Tcf. We gots natgas coming out our ears).
Coffeeguyzz,
First 150 TCF is less than 5 years of US consumption, it is not that much, and typically only 2/3 of TRR is extracted so that makes ERR more like 3 years consumption.
Not really a lot of gas, especially as there are plans to export more and more of it.
Coffeeguyzz,
Total shale gas resource is about 1600 TCF, not a lot of conventional gas left so we will ignore that. Let’s say peak is roughly at 50% of ERR and ERR is 70% of mean TRR (1120 TCF for ERR and 50% at 560 TCF), Up to the end of 2021 there has been about 232 TCF of shale gas produced and shale gas reserves were about 400 TCF. Adding reserves to undiscovered ERR would give us 1500 TCF and 50% would be 750 TCF, deduct cumulative output at end of 2021 and we have 520 TCF to reach peak. If shale gas continues to grow at 8.5% per year (annual rate of increase from 2013 to 2022) and then slows to 3% annual growth after July 2031, then 750 TCF cumulative production is reached by July 2033 which could be the peak in US shale gas output (output would be 175 BCF/d at this point, recent level is about 81 BCF/d), if US consumption does not increase this suggests exports of 145 BCF/d in July 2033. The question is does exporting this much of out natural resources make sense from a security perspective.
I think not. If we choose a more sensible path of conserving out natural resources, we may have plenty of natural gas for many decades. If we cap exports at the 2022 level, we might have enough natural gas to last for 520/38=14 years (2036), before reaching half of resource produced and we might be able to maintain a plateau for 28 years perhaps (to 2050), with a sensible export policy, this assumes no increase in US output of marketed natural gas production and a steady output of 38 TCF per year. The more gas exported, the sooner we risk running out, same is true for tight oil.
Yes…but boom and bust seems to be the American way.
Nat gas included.
Dennis,
Serious question … no insult intended …
Do you get out of the house much?
I mean, you are obviously a math whiz and I would love to have you by my side doing surreptitious card counting at a casino, but … but … numbers just ain’t real life.
I could shoot down your just-presented scenarios in a gazillion ways (my number), but – as it would largely be speculative based – why bother?
Above, Ovi asked about the increased need for propylene. I have been doing copious amounts (non number-precise) of speed reading on the growing applications of various forms of ‘plastic’ use (more commonly called polymers) in the fields of automotive manufacturing, construction (including bridges), a vast array of consumer products, on and on. A global army of Fuzzy Heads is diligently working away in labs coming up with new iterations of Fiber Reinforced Plastics which will benefit humanity in myriad ways currently unforseen.
Your pronounced proclivity to assemble numbers, analyze them, and project forward is astonishing in its skill level.
Should you examine your projections from, oh, say 10 years ago and compare them to today’s reality, the reasons behind their inaccuracies might be instructive. (Hint, the world moves in non linear fashion. Would you numbers guys say that is multi variable?)
Anyway, your efforts and contributions to this site have been very admirable, IMHO, and I appreciate your, Ovi’s, and Mr. Patterson’s long running efforts.
Lottsa natty far off into the future.
Gar. Own. Teed.
Coffeeguyzz,
Whether there is enough natural gas depends on rate of use, the
2000 TCF of natural gas is not a lot. At the World level natural gas will also deplete, likely by 2040 we will be at peak.
Past estimates were too low for oil due to an underestimate of URR by 200 Gb, estimate from 2012.
The next Peak Oil site must be named “The Oil ConunDrum”.
“The next Peak Oil site must be named “The Oil ConunDrum”.”
Already taken. That was the working title for the book Mathematical Geoenergy until it was published
https://books.google.com/books?id=oY2ZPn5EOTQC
https://theoilconundrum.blogspot.com/
I’m going to reply to this right out of the Republicans playbook.
It’s not an oil conundrum, it’s a human conundrum.
It was a play on words. Unless you are describing a puzzle on how some human was a drum, a precise walking metronome.
It’s not the gun that kills people, it’s the people using the gun
oil isn’t the problem, humans using oil is the problem
The Oil Drum => The Oil conunDrum
it’s just a play on words
How about “Oil Con-none-drum”?
rgds
WP
I like this one: Instead of Carnot Cycle, which points to the ultimate ineffficiency of internal combustion engines, there’s => CarNOT! eCycle!
Natural gas scenario for World, 100% probability this will be incorrect. Note I follow J Laherrere in using gross natural gas output minus reinjected gas rather than dry gas output, dry gas is about 90.4% of gross minus reinjected. Cumulative output through 2021 is about 5400 TCF, peak occurs in scenario at about 8560 TCF cumulative output in 2039, at about 45% of expected URR (19000 TCF). Scenario reaches 50% of URR in 2045.
This chart of global NG production very roughly shows what I expect for total global combustion going forward.
There are many implications of this, including for global population, global economic output (and its ugly twin- environmental destruction), and for global heating….greenhouse heating of the earth is just starting the big ramp up.
note- heating on the scale that we are undertaking doesn’t just cause relative warmth…the big problem is that it causes amplified instability as the natural mechanisms of energy flow equilibrium/distribution shifts to a higher gear. There are big practical implications to this. For example- We need to abandon the floodplains and tidal zones. Any important infrastructure needs to be relocated inland and uphill. Flooded buildings need to not be rebuilt… its a lost cause and waste of everyones money.
Hickory,
One thing I did not account for after the peak is the possibility that a ramp up of wind and solar power may reduce demand for natural gas and cause the price to fall. In most of the World wind and solar will be cheaper forms of power than fossil fuel, and as the price of natural gas falls due to lack of demand extraction rates will decrease, in fact demand for natural gas might fall significantly after 2040 and most will be used as a material input to various chemical processes rather than as a fuel. A more optimistic scenario below where much of the potential resource is never extracted because there are cheaper sources of energy.
Thanks for this adaptation scenario.
With either of these scenarios, there will be plentiful nat gas for the next 30-40 years.
Chart below is the Liquefied natural gas trade volume worldwide from 1970 to 2021
Hickory,
I agree, supply is likely to be plentiful, especially if wind and solar continue to grow rapidly, the problem may be low prices for natural gas in the future and lack of supply at the low price, this is not likely to be a problem before 2035 or perhaps 2040 in my view.
I should sharply qualify my prior statement-
“With either of these scenarios, there will be plentiful nat gas for the next 30-40 years.”
Plentiful, and affordable, for a lucky segment of the global population,
and in short supply and expensive for a big portion of the rest of the world…perhaps a majority.
Like many other commodities, foods, and manufactured goods the big charts of global supply hide the big story where some people and places have a lot, and others have very little.
And that is the big story that drives human history.
Transport via LNG serves as a partial equalizer to supply and price between regions and countries, with partial being the big word.
Peak Oil Has Finally Arrived. No, Really
This is an old story published by the WP in September 2022. I don’t recall anyone posting it here. If I have forgotten, let me know, I do forget things these days.
I’ve rarely felt more trepidation about writing a column than this one. But here goes: After more than a century of almost continual growth, the world’s appetite for oil is peaking, and will soon enter terminal decline.
BP Plc in 2020 predicted that consumption of liquid hydrocarbons would at best plateau for 15 years around the 97.9 million barrels a day mark it hit in 2019, before revising its forecast to a peak between the middle of this decade and 2030.
Then consider just how close to peak oil we already are. Every forecaster has a different estimate for this number, but the median of 12 who see a future date is for a maximum level of about 103.2 million barrels of liquid fuels a day — something most see occurring some time between the mid-2020s and the mid-2030s. In contrast to a history where consumption grew by more than a million daily barrels per year, that’s a modest enough rise that debates about the precise timing of the peak are almost academic. Still, the median target is only a sliver above levels of about 101.6 million daily barrels which both the International Energy Agency and US Energy Information Administration expect to see by the end of this year.
The state of gasoline is a foretaste of what is to come. Demand for the fuel, which uses more than a quarter of the world’s crude, has already peaked. Part of that is about electric cars — BloombergNEF estimates that they’re already subtracting about 1.7 million daily barrels from global consumption. Still, much of it is just that plain old internal combustion engines are sipping less gas. New US cars now travel nearly twice as far per gallon as they did at the start of the Obama administration, with light trucks and SUVs increasing efficiency by a more modest 59%.
https://www.washingtonpost.com/business/energy/peak-oil-has-finally-arrivedno-really/2022/09/28/f67f2f0a-3f68-11ed-8c6e-9386bd7cd826_story.html
Thanks Ovi. I don’t know how I missed this one. I am going to read it again, sleep on it, and have more to say tomorrow.
Ovi, obviously hardly anyone has a clue. They have no clue as to peak oil but they simply believe, as displayed in Seppo and Steve’s posts below, they point out the absurdity of those who believe renewables will simply step in and it will be business as usual for decades to come. The point is, peak oil is upon us right now.
It doesn’t matter whether Dennis or I am correct, the difference is only a sliver of production. We are arguing over peanuts. I think that total liquids may go a bit higher than they did in 2018 but C+C will not. We are that close. The point is, even if Dennis is correct and peak oil happens later this decade, it doesn’t matter, peak oil is right now! Any increase we have from where we are right now will be so small it will make little difference.
The article states that the crude oil portion of total production is only about 80 million barrels per day. That is the part that matters. Peak production right now. And the world is totally ignorant of that fact.
And if that isn’t bad enough, there is a 90% chance that a worldwide recession is upon us.
Ron,
Seppo and Steve were both making fun of the idea that fossil fuels could replaced by alternatives.
Peak oil may be right now, but HHH may be right that inflation is coming down (I believe he is right about that, but think falling interest rates may solve many of the problems he sees). So the coming recession may be relatively mild and not the full blown finacial crisis that many here predict. I agree we don’t know what will happen and that we are either past peak or very close to peak currently (I think a rough undulating plateau of 80 to 85 Mb/d is likely from 2017 to 2030), so far it has not lead to any apparent energy shortages as reflected by current natural gas and oil prices. That could change.
Seppo and Steve were both making fun of the idea that fossil fuels could replaced by alternatives.
Dennis, I obviously knew that. My post was poorly worded. I have made corrections to it that better reflect my opinion.
We both agree that peak oil is upon us, our differences are only minor as to the date and amount. But where our difference is a wide chasm, is the consequences of peak oil and the coming crises brought about by overpopulation. You are at heart a cornucopian, a pollyanna. I know you believe there will be tough times ahead, but ultimately you are confident that everything will be just fine. Obviously I do not share that opinion.
Ron,
No I am not confident everything will be fine, I believe it is possible that things will be ok if good policy measures are taken. Population will peak and decline reducing pressure on the environment, East Asian total fertility ratios are quite low and as this occurs in the rest of the World population can fall rapidly. Better education for girls and young women and more equal rights for women could help to accelerate the transition to lower World population.
Projection for Japanese population from UN.
Dennis,
Weren’t you the one regurgitating Powells transitory statement last year ? You can only get away with that level of incompetence in the public sector. People who make wrong predictions should refrain from making more predictions for at least 6 months.
And Ron is right, you are a pollyanna just admit it, there is nothing wrong with that. It counteracts the doomers so it isn’t an echo chamber which is healthy.
Iron Mike,
Yes I got inflation wrong, like the Fed, I think inflation won’t be a problem at least in the US for much longer, I expect the Fed will be reversing course and lowering interest rates by 2024 at the lastest, possibly as soon as September 2023. HHH may be correct that deflation is the important risk over the near to medium term (next 5 years).
As to being a Pollyanna, to a doomer as realist looks like a Pollyanna and to a Pollyanna a realist looks like a doomer. I am not a Pollyanna.
Dennis,
Come on, how many doomers do you think see themselves as doomers ? And how many pollyannas see themselves as pollyannas ? And admit it ?
I’d argue most if not all see themselves as “realists”. It takes self-awareness to see ones own bias and courage to call it out.
But eitherway the flow of this world usually ends up proving all predictions wrong. As you are aware.
Iron Mike,
Obviously true. Nearly everyone thinks they are a realist and all predictions about the future are wrong. Consider the fact that most claim my scenarios of the future are wildly optimistic and we have my very old shock model from 2012 where I tried to utilize Paul Pukite’s excellent framework. The only update to this chart is current EIA C plus C data through 2022, the models are unchanged from 2012.
My original post had a best guess of the Medium scenarios with either a URR of 2560 or 2795 Gb for World C plus C. I considered the “high model” with the URR of 2795 Gb as being unrealistic. See
http://oilpeakclimate.blogspot.com/2012/07/an-early-scenario-for-world-crude-oil.html
An excerpt:
The high scenario attempts to ramp extraction rates to 1973 levels over a 30 year time frame, this seems quite unrealistic when considering that Saudi Arabia and other middle east OPEC members were aggressively ramping up production from 1960 to 1973 at the some of largest oil fields discovered to date.
I doubt that such world wide extraction rates will be seen in the future, but included it to illustrate that even if it were accomplished the peak would only move by a few years (to 2021 from 2019 in the medium scenario). Even the medium scenario is somewhat unrealistic as it ramps to 1990 extraction rates over just a 5 year period, the reality is likely to fall between the plateau and medium scenarios.
My second attempt reduced the URR to 2560 Gb and I left the high 2795 model off my charts because I though it was too unrealistic (too optimistic). That post is linked below
http://oilpeakclimate.blogspot.com/2012/07/further-modeling-for-world-crude-plus.html
The chart below is based on the spreadsheet linked at the bottom of the second post with EIA data updated.
Notice that my best guess (between 2560 low and 2795 medium) was in fact too pessimistic an assessment of future World output of C plus C.
Dennis,
That was some interesting models. I am assuming you underestimated US production more than anything right ?
How close was the model in predicting future Saudi Arabian (OPEC) extraction rates ? Did they beat your expectation and also have higher extraction rates than expected ?
It’s still a good model, your last chart, most of the data points lie between 2560Gb medium and 2795Gb high. Likely probability that remaining data points would lie between those two curves. With the 2795Gb medium being a possible polynomial regression sweetspot. Dennis how did you go about estimating future extraction rates ? What method did you use ?
Iron Mike,
The model only looks at World output, it is not a bottom up model, it is top down. So there was not estimate of future extraction rates in the US or Saudi Arabia only for the World as a whole. If I had estimated US output at the time I would not have expected US output to increase by 7 Mb/d from 2012 to 2019, so you are likely correct that was a big miss by me, tight oil was not really on my radar until later.
The extraction rates were simply guesses about what might happen in the future based on what was seen up to 2011, newer models using the framework have divided output of C plus C into 3 buckets, conventional oil (the largest piece), extra heavy oil (most of this from Canadian oil sands with some from Venezuela’s Orininoco belt), and tight oil (mostly from the US in my model). The current iteration of the World Shock model has about 2800 Gb for the World conventional C plus C URR with about 100 Gb for extra heavy oil and about 70 Gb for tight oil. The extra heavy oil estimate leans heavily on the Canadian government’s estimate of future oil sands output and assumes Venezuela’a output continues at about 100 Kb/d (as estimated by OPEC) for the next 10 years or so.
The tight oil model is based on individual well profiles in the Permian, Bakken, Eagle Ford, Niobrara, and other US tight oil plays (here it is more guessing as the data is not good for the “other” tight oil category.) I estimate wells costs EUR per well and future completion rates as well as future oil and natural gas prices to see that wells completed will be profitable. Note of course that I have no special knowledge about the future so the scenarios for tight oil, extra heavy oil, and future extraction rates for conventional oil all have 0% probability of being correct (infinite possible scenarios and only one correct scenario of the future). That 2012 scenario was nothing more than a lucky guess.
Ron
I agree that we are in the peak oil plateau now. I do not know how all of us missed that WP article. It is surprising for the WP to publish such an article and I would have expected other papers to pick up on tha story. It just confirms that nobody in the current press is listening. They only hear Green.
What startled me most in the article was this statement: “Demand for the fuel, which uses more than a quarter of the world’s crude, has already peaked. Part of that is about electric cars — BloombergNEF estimates that they’re already subtracting about 1.7 million daily barrels from global consumption.”
Is that reduction being offset by increases in the other transportation sectors. More importantly it raises the question of how close are we to peak demand and will the C plus C portion be lower than C plus C supply. The second half of this year will see how much stress the demand side puts on the supply side.
Attached is a chart of US gasoline product suppled. US consumption is currently 860 kb/d lower than August 2019. It will be interesting to see if June 2023 will exceed June 2022. China EV sales are rising and are essentially being powered by new Coal fired stations. Not sure how much gasoline consumption is reduced by those Chinese EV’s.
As for a recession. I dont think it will happen if oil stays below $100/b. I expect a slowing economy but not a recession.
Ovi,
Using EIA data for annual consumption of gasoline and transport fuel (gasoline, distillate, jet, and residual fuel) the peak was 2019 for both gasoline and transport fuel. When we look at the percentage increase per year, for gasoline it was 1.5% and for transport fuel 1.2% per year from 1995 to 2019.
https://www.eia.gov/international/data/world/petroleum-and-other-liquids/annual-refined-petroleum-products-consumption?pd=5&p=0000000001m&u=0&f=A&v=mapbubble&a=-&i=none&vo=value&&t=C&g=none&l=249–249&s=94694400000&e=1640995200000
Dennis
In the chart I posted, gasoline supplied started to plateau in 2017. That plateauing, I believe, was due to having having over 100 M new vehicles in the US meeting stricter fuel consumption standards. This is another case where all of that history is not relevant. I think a more realistic scenario going forward will be 0% increase ±0.5%, post 2024.
We will get a clue come June 2023 on how much growth we can expect in gasoline consumption.
Ovi,
The chart is for the World, US fuel economy rules are a small piece of the World picture, these types of rulesxhave been implemented at different times in different nations.
In short I disagree. Trying to look at World picture where we only have annual data.
Hi Ovi,
For the US your guess sounds good, I do not expect much growth.
Sorry, I did not label my chart clearly, I was trying to show the output for the entire World, the link would have perhaps made that clear, but I should have been more explicit.
At the World level I was just showing the data that I have, from 1980 to 2021, the trend considered only 1995 to 2019, but perhaps a shorter time frame is better.
The chart below looks at the natural log of World gasoline use for two periods, from 2005 to 2012 and then from 2015 to 2019 to match the flat period in US gasoline consumption (2013 and 2014 were dropped because they did not follow the slope of the 2005-2012 period) . The trend for the earlier period is a slope of 1.08% per year (2005-2012) and for the more recent period (2015 to 2019) the slope was and increase of 1.32% per year, rather than the apparent plateau in US gasoline consumption over the 2016 to 2019 period. I initially used 2015 to 2019 because I though 4 data points was too short, but the slope of 1016 to 2019 is almost the same as 2005-2012 (an increase of 1.16% per year vs 1.08%/year for earlier period).
I expect US consumption may not increase, but my expectation is that World consumption of gasoline may continue to increase for a few more years, eventually that will slow as the World fleet becomes more efficient and might use less liquid fossil fuel.
In Europe, almost half of passenger cars are diesels. In France or Poland, it uses more diesel to drive passenger cars than gasoline. There are also 2,500,000 autogas vehicles on the road in Poland. Distances between cities are much smaller than in the United States or Australia. That is why electric cars can effectively reduce oil consumption (and not only petrol in Europe). https://www.eea.europa.eu/data-and-maps/daviz/dieselisation-of-diesel-cars-in-4#tab-chart_1
Regards,
Piotr
Piotr,
Yes much more diesel use in Europe so both gasoline and distillate use will decrease as EVs become more widely used. From 1995 to 2015 the percentage of gasoline dropped from 38% to 23% of the gasoline plus distillate total in Europe. Chart below has Europe’s gasoline plus distillate consumption from 1995 to 2021.
Data from
https://www.eia.gov/international/data/world/petroleum-and-other-liquids/annual-refined-petroleum-products-consumption?pd=5&p=00000000014&u=0&f=A&v=mapbubble&a=-&i=none&vo=value&&t=R&g=none&l=73–73&s=94694400000&e=1640995200000
No problem, green will save us.
SEPPO,
What Goldman failed to include in the “Renewables” Green Energy Data, is that in 2022, 55% of the Renewable Energy generation came from Biomass (38%) and Hydro-power (17%).
My forecast is that within 3-5 years, Governments and Leaders will have to forgo pushing Green Energy as massive global protests due to skyrocketing energy prices and surging food-goods inflation will force the world back to burning more Dirty Fossil Fuels & Wood Energy, whether we like it or not.
steve
STEVE, I hope that you caught my sarcastic remark.
SEPPO,
Yeah… I caught it. 🙂
However, I just wanted to make it clear that the supposed Renewables, more than half was from burning trees and hydropower.
steve
Steve,
In the US wind and solar primary energy output has increased by 13.5% per year on average from 2010 to 2022, if it continues to grow at that rate it will provide 53% of US primary energy output by 2040, if primary energy output is unchanged from the 2022 level (it is possible that energy use might decrease as we move away from fossil fuel use where about 60% of primary energy is simply waste heat.) Also wind in solar would provide 69% of the fossil fuel energy output of 2022, if the rate of growth continues at 13.5%. By 2043 all fossil fuel primary energy use could be replaced, if wind and solar continue the 2010-2022 rate of growth.
Unhinged. Delusional. Stupid. Dangerous.
wtf?
As Nate Hagens said, “Renewable energy can power a great society, just not this one.”
It seems as though the oil industry has understood both peak oil and climate change perfectly well for a very long time, and done absolutely fuckall to prepare the public or apparently even itself. Not long ago the public was told shale would last for decades, a more dangerous lie than anything greens have ever told.
I was willing to put a 5 kw solar array on my roof and add solar hot water as an experiment to try to understand and be part of the solar cycles (eg:, winter/spring /summer/fall/day-to-day, etc). What I learned that it is possible to heat and cool a home and power an EV.
**However**, there is not enough solar in winter to live an American Lifestyle. I’ll have to wait until there are 45% efficient Perovskite solar cells and then double the number. Even then, there will be some very cloudy and very cool January’s. What that means that instead of having an average of 4.4 kw net times a factor of 5 (due to location) = 22 kwh/day on a yearly average. I will be up in the 132kwh/day range. Instead of generating around a low of 300 kwh in January, my low might be in the 1800 kwh range where my highest usage was 2200 kwh. Some more “winterize before you solarize” will be needed. I think it is doable.
Also, I will need a “Powerwall” to store electricity in the winter months. What I am seeing is that Tesla has batteries with energy densities of around 250 wh/kg. I’m reading of labs creating batteries with energy densities in the 360, 685, and possibly in the 1250 wh/kg ranges. This gives me hope that maybe we will be able to store 5 times the energy in a 10 kwh Powerwall size panel in the next 5 to say 15 years. Still, I don’t expect it to be a panacea. What I do expect is that the local utilities will manage and maintain mass storage in Uber-Powerwall power vaults. Will those vaults be lithium based?, sodium based? aluminum based? Don’t know. But I’m warming up my popcorn maker. Should be interesting to watch all this play out.
I think it is doable. I think we will see government financial support ala the tax incentives for EVs. We might even trade the cost of a new aircraft carrier for a national roll out of support. If it doesn’t work out and the tech is “late to market”, keeping the pipes from freezing and riding a bike to market are a reality that could happen. But we will see.
G7 Nations Argue About Peak Oil And Gas But Haven’t Even Solved Peak Coal
Despite the data supporting natural gas, the cries for gas to be phased out continue. One of the most surprising things about this though, other than the fact it doesn’t make sense, is that the phase-out of coal, which is significantly worse, has yet to even be decided on. Governments continuously debate peak oil and gas, when they haven’t even stopped growing coal demand. Countries can’t even commit to a date to stop using coal but are already waving their hands on what to do about gas. It reminds me of when I’m behind on a chore around the house, so I try to tell my wife about what my plans are for an even more audacious chore simply as a distraction. They borrowed my playbook.
These discussions are ironically, or sadly, happening on a day when Germany is shutting down its last three nuclear plants, with the baseload power gap to largely be met by everyone’s favorite’s coal and natural gas. The world still has yet to reach peak coal, with new plants being announced even now. Everyone needs to get serious promptly about reducing coal dependencies and the noise around natural gas, which is a very viable substitute for baseload coal power, is not helping countries move away. To understand how quickly substantial action on coal growth is required it is worth noting that UK coal use peaked in 1979 and the country still uses some to this day.
From BP Statistical Review of World Energy.
https://www.bp.com/en/global/corporate/energy-economics/statistical-review-of-world-energy.html
Coal consumption peak was 2014 at 162.58 EJ, in 2021 consumption was 160.1 EJ.
Yes, the coal must be phased out. But also for a reason rarely stated. There are some radioactive elements in coal in very low concentrations. But because coal is burnt in great quantities to produce electricity, significant amount of radioactive elements are also emitted and deposited around coal fired power plants. With the result that areas near coal fired power plants in Germany are more radioactive than areas around nuclear power plants. I found a figure of 109 GBq emitted per year from a 2000 MW modern coal-fired power plant with filters to retain most of the heavy elements. I don’t know if that figure is correct. But anyway, the so-called environmentalists German anti-nuclears are not helped when they argue that coal is bad but better than nuclear energy.
I’m posting this to the other thread in case Dennis or Ron want to delete it here. The crux of the matter, when it comes to whether renewable energy can shoulder the load, at least in some countries, is whether such countries make the right decisions…. which are POLITICAL decisions.
If we Yankees choose to get on with it, making the necessary decisions, we can do it.
So can at least a few other countries.
Leviathan, the nation state, can forbid the production of twenty mpg cars and mandate the production of hundred plus mpg equivalent cars and small trucks.
Leviathan can shut down the air travel industry.
Leviathan can spend some of the hundreds of billions currently spent on military hardware on HVDC power lines and wind and solar farms.
Leviathan can put otherwise out of work construction guys to work refurbing our built infrastructure to be far more energy efficient.
Our Leviathan is Uncle Sam of course.
We did it starting a couple of days after Pearl Harbor.
Maybe we’ll get a Pearl Harbor equivalent event.
That may be our only real hope.
A falling birth rate means a bright spot in the black clouds.
Japan already has a big surplus of empty houses. Look it up. Japan doesn’t NEED growth now. Japan simply needs stability.
https://oilprice.com/Energy/Oil-Prices/Four-Scenarios-That-Could-Send-Oil-Prices-To-200.html
False Assumption?
“It is the scenario where consistent underinvestment [in oil industry] shrinks supply so much, that prices have nowhere to go but up.”
Sure- increasing capital investment in oil E & P could temporarily help with keeping supplies up, but that would only accelerate the eventually rate of decline as we use up what is recoverable more quickly.
The standard assumption that throwing more money at the production efforts would guarantee more production has worked well during the past hundred years, but we are far into the phase of severely diminished returns.
Return on Investment in the oil industry is going to get harder and harder for new projects as time goes by. Higher and higher prices will help with that problem to some degree.
But keep in mind that those higher and higher prices will make electric transport more and more of a relative bargain. Just wait until the next generation CATL battery hits the market.
We’ve got two transport systems going in opposite directions on the trend chart.
Great commentary on natural gas and coal, Mr. Patterson. You have a great way of putting things in perspective.
To get a perspective on NG, examine helium.
After WWI, helium was, according to my late father, highly regulated by the government. America was virtually the only source of helium and so the Hindenburg used hydrogen. As everyone knows, hydrogen is quite flammable, while helium is not. Despite this, they–cough, cough–had a smoking lounge on-board the Hindenburg.
Okay, fast forward to the late nineties. The old Cliffside Helium Storage Plant near Amarillo was depleted. There was enough helium to get along. No one anticipated such a huge demand waiting in the wings.
So all at once we have a major shortage of helium. The only great source is in the reverse comma streak of wells in the northern part of the Texas Panhandle, a bit in western Oklahoma, up into Kansas, taking in the old Hugoton field, which is now mostly shut down. Helium in natural gas is only about 0.2%, usually. In that reverse comma, it can be as high as 2-3%. There is a place in America–Pinta Dome–where you hit 10% helium and 90% nitrogen, a quirk from the mantle no doubt, but those wells were very isolated and covered a lake of water. Kerr-McGee abandoned their efforts long ago (they drilled the first one in 1950).
Now everything of the modern world uses helium: MRI machines, computers, iPhones, robots, EV’s, magnets, and of course party balloons. The resurgence of rockets (Mr. Musk) brought about a big demand. But there’s not enough helium–except in gas wells that are very isolated and marginal. We can’t do without helium; no one has found a good alternative. Imagine going in with a life-threatening situation and being told that the MRI scanner was inoperational due to a lack of helium. Qatar is about the only other source, and it’s not our friend.
Well, that’s what the end of oil will look like. And, unless we’re careful, the end of natural gas too. Oil is certainly a more complex thing for nature to manufacture, but NG takes some pretty special conditions too.
There will be a brief period of time–who knows how long–when we are up to our eyeballs in natural gas. That will be secondary to the vast numbers of Permian shale oil wells dropping their pressure below the bubble point, at which time gas will come out of the rock. The rising GOR will briefly turn oil wells into gas wells, and it will happen Just like that. The market will be aghast at all the gas, and more LNG terminals will be built.
But no pipelines will be built, unless politics change, except in Texas. So the giant Appalachian Basin-Coffeeguyz can tell us differently perhaps–will go on selling NG at a miserly discount (<$1). Enough that dry gas will be stranded. I predict that at some point there will be a scurry to trench a pipeline for it, but first things first.
I also hope whatever wakeup call occurs takes care of the wondrous Uinta Basin in southeastern Utah, the home of waxy crude oil devoid of nitrogen, sulfur, toxic metals and with an API gravity of 38–the perfect blending oil. It is a big basin. Like the Colorado Niobrara up in Weld County, it could be obtained with a minimal environmental footprint (the whitetail deer count has actually gone up a great deal with the barely-visible standpipes and gathering stations).
In Colorado, of which I can speak with some experience, they may have inadvertently showed us the future in oil and gas exploitation. I don't like their selling land for homes on land where oil leases had already been let, but their environmental footprint is superb.
Gerry,
It is not clear that many wells will be drilled in the Permian if it becomes a gas play rather than an oil play as the wells will not be profitable to drill if we are awash with natural gas and prices are low. There are some Texans that believe exporting our energy resources is a bad plan and that we should conserve the resources for our nation (or maybe just for Texas). That’s up to the fine citizens of Texas.
Some data on Helium from USGS at link below, much of it is exported.
https://pubs.usgs.gov/periodicals/mcs2021/mcs2021-helium.pdf
Dennis, I was referring to the hundreds of thousands of wells that have already been drilled. Those are in the process of gassing out as we speak. The overall GOR for the Permian has risen, but not nearly to the level it is likely to hit at some point in the foreseeable future. And it’s a hamster wheel, because after this recession that we’re likely to experience, the price of oil is likely to go up, which will mean more drilling at a faster pace, thereby throwing more oil wells into the equation–as they will one day gas out too. This is the dilemma of any oil field that contains a lot of gas. Boyles law is that the pressure is inversely related to the volume in an enclosed space, which had kept me bewitched for five decades. Boyles law is a real piece of work.
As to helium, that was a good chart you appended. You will have noticed that the stores are depleting, and the fields from which most helium’s been extracted are depleting as well. The Hugoton is a wonderful old place with a marvelous infrastructure and tens of thousands of wells dating from the thirties on until a few years ago. It makes a lot of CO2, as well as helium. The Mississippi Lime wells in northwestern Oklahoma, up towards the Cherokee Outlet, sometimes put out surprising percentages of helium. I think we’ll have enough, but perhaps not. The point is, all other countries that produce helium really dislike the U.S. For decades, helium was the only country that produced helium, and the price was always low. I don’t think anyone envisioned 36 thousand MRI machines in the world.
Gerry,
Yes I understand Boyles Law, my point is that the economics will intervene with the physics, if it is no longer profitable to produce the gas because the oil output is too low the well will be abandoned. In addition as the field pressure depletes the oil output may be too low to even bother to drill new Permian wells, by 2030 or perhaps 2035 this will likely be the case and wells may no longer be drilled in the Permian basin. By that time we may see declining demand for oil and tight oil wells may no longer be profitable to drill.
On the helium, as it becomes scarce price will increase and perhaps the US will stop exporting helium to conserve the resource, in addition it may no longer be wasted on party balloons as it becomes more expensive.
For those that think exporting the natural gas as LNG is a smart move, they better be careful not to assume the large amounts that some tout as TRR will be economic to produce. Those who build LNG export facilities should be careful about the resource they assume will be available to export, so they won’t be stuck with a stranded asset. World demand for natural gas may decline faster than the decline in World supply of natural gas so LNG investments need to pay out quickly to be viable.
https://market-ticker.org/akcs-www?post=248633
The “Inflation Reduction Act” requires all power plants implement Carbon Capture and Storage.
Karl believes this will lead to massive economic damage.
D Coyne: “Yes I understand Boyles Law”
Since you understand it, would you kindly explain it to me?
I do not for the life of me understand how it works.
The thing says that the pressure is inversely proportional to volume. When the pressure in a reservoir falls below the bubble point, oil comes out of rock. And the gas is extracted. As the volume in the reservoir drops, Boyles Law would have the pressure rising.
Thank you in advance.
Gerry Maddoux,
The V is the volume of the container and P is the pressure. As incompressible fluid (oil) is removed from the rock the volume of the container increases (think of a gasoline container with a cap and the volume for the gasoline vapor as the gasoline container goes from full to nearly empty, if that helps to visualize) . As the volume of the container increases the pressure decrease by the same proportion, if no gas is removed (some associated natural gas is in fact removed). The general case is the ideal gas law PV=nRT (n is the number of moles of gas, T is absolute temperature) see
https://en.wikipedia.org/wiki/Ideal_gas_law.
For Boyle’s law it is assumed that the amount of gas (n in ideal gas law) and Temperature are constant, so we ignore the methane that is removed with the oil as an approximation). So under that approximation the increased volume in the rock spaces due to removal of oil from the rock causes the pressure to fall.
PV = nRT, the ideal gas law makes a lot of sense if you remember that gas is
made up of molecules bouncing around and that pressure is simply the force
of all those molecules bouncing against the wall of the volume divided by
the surface area. The right hand side of the equation is n = the number of
molecules (in moles), R a constant that fixes units, and T = temperature.
Temperature is a measure of the kinetic energy of the molecules, so the
higher the temperature the faster the molecules are going and the harder
they hit the surface of the volume increasing the pressure. If the right hand side of the equation is constant, that is the number of gas molecules and the temperature is
constant, then increasing the volume increases the average distance between
molecules thus decreasing their density which reduces the number molecules
hitting the wall of the volume per unit area, thus decreasing the pressure.
Thanks, Schinzy.
Good way to put it.
You did a nice job explaining it, as have others.
For some reason, I have a hard time with it.
I have no trouble understanding the other gas laws, just this one.
Thanks.
Gerry, he did a good job with that, yes. Dennis is also correct regarding the economics of someday, soon, drilling $12MM HZ wells for 200K BO EUR’s, 3 BCF of natgas and some NGL’s. It does not work below $6.
To YOUR point, I made a chart this morning for my front page to illustrate how boundary defined, gas solution shale oil reservoirs in the Permian deplete…just for you ! You are correct, associated gas from tight oil wells also has limited long term potential. If “smart” people want to build out $400 billion more gas takeaway and LNG facilities for the Permian, rest assured it will not be with their own money.
In 1975 the US implemented the Energy Policy and Conservation Act that ceased US hydrocarbon exports. There was a really good reason for that at the time, most of which had to do with maintaining a competitive edge over the rest of the industrialized world, long term energy security and a prosperous future for our country. What’s different now than 48 years ago… other than we have far less hydrocarbon resources to draw on and it costs ten times more to extract? That the bulk of those new US hydrocarbon resources decline 70-90% in three years?
Its worse. Yet oil exports now exceed 50% of total US tight oil production, we’re burning the snot out natural gas (Bakken and Permian) and the plan is 50 BCF of LNG exports in a decade…all on the myth of shale abundance.
What if the myth is wrong, or worse it was all a lie? Will China, Russia, Iran, the KSA and all of OPEC export us the oil and natural gas we will still need?
Gerry , good to see you return . Your info on Helium is mind blowing and so is on LNG . Learning all the time . On a lighter note Benny Hill on ” learning all the time ” . 4 min of laughter ,
https://www.youtube.com/watch?v=cokngZwEwrw
Gerry,
I think the key is to think of the Volume as a container size, so imagine a 2.5 gallon gas can with a tablespoon of gasoline in it that is sealed, most of the gasoline will evaporate and exist as a vapor in the can at some pressure P1, if we put a tablespoon of gasoline in a 5 gallon can at the same temperature (say 80 F) the pressure in the gas can would be P2 with P2<P1 by roughly 0.5. The gas will fill a given volume, but if we use the same amount of gas in moles or number of molecules in two different volumes the ratio of the pressures in the two containers will be the same as the ratio of the volumes such that P1times V1 is equal to P2 times V2 or P2/P1=V1/V2.
The EIA’s Monthly Energy Review is just out. It has US C+C production down 180,000 barrels per day in February and down another 56,000 barrels per day in March.
Those numbers are subject to revision. The official numbers will be out Friday in the EIA’s Petroleum Supply Monthly. But that data will only be through February.
Hi Mike. I studied your graph in detail. That’s a very good way of looking at oil-gas dynamics in a closed system.
I think I get it. The gas has for millions of years been drastically compressed in a closed system, within the rock. Upon fracking, oil came out of the rock, along with a variable amount of gas. With production, some gas came out of solution, but early on most remained in the rock. When more liquids were removed, because of a gradient, more gas came out of solution and became free gas. When the bubble point was reached, gas came out of the rock, more and more as extraction occurred. Boyles Law always worked because the gas was no longer densely compressed, so while the volume of gas inside the wellbore increased, the density of gas decreased, and the pressure fell in that localized reservoir.
With enough time, and close well spacing, and since the above occurred in the enclosed bores of thousands of wells, the “average” bubble point of the entire reservoir would emerge. Permian production profiles suggest that this happened in 2020. Which means that the Permian is already in parabolic decline–it has just been hidden by a frantic bringing on of new wells all the time. In other words, we’re soon to see the same parabolic decline curve that individual wells write–on a massive scale.
Yes, I finally get it, I believe. That’s a very clever chart of bubble point and liquids-gas interaction across the basin. I must say that I never thought of this as expansion of gases as the pressure fell. That’s probably very naive of me, but I’m in this for the preservation of my remaining brain cells so I’ve no problem admitting it. Thanks again. That’s a hell of a chart!
Crude Oil And The U.S. SPR
At around $78 per barrel on April 21, the energy commodity is sitting at the same price as on October 18, significantly above the administration’s $67-$72 per barrel buying target. With the peak driving season getting underway and other factors supporting crude oil’s price, there may not be another chance to buy crude oil at lower prices over the coming months.
VERY INFORMATIVE
The trade gaps in both WTI and Brent futures from the OPEC cuts just closed a little bit ago.
https://oilprice.com/Energy/Energy-General/European-Union-Pushes-Into-North-African-Solar-Markets.html
We’re going to be competing with China from here on out for oil and other natural resources in the world market.
OFM, easier to ship (via HVDC?) solar output from Morocco to EU than from Morocco to China…
But easier from Morocco to China than Morocco to USA…
Bullish Natgas Price Fundamentals For DUMMIES…
No comment necessary.
steve
New posts are up.
https://peakoilbarrel.com/steo-april-2023/
and
https://peakoilbarrel.com/open-thread-non-petroleum-april-26-2023/
New posts (a previous link is broken)
https://peakoilbarrel.com/short-term-energy-outlook-april-2023/
and
https://peakoilbarrel.com/open-thread-non-petroleum-april-26-2023/