A Guest post by Ovi
All of the Crude plus Condensate (C + C) production data for the US state charts comes from the EIAʼs March Petroleum Supply monthly PSM which provides updated information up to January 2023.
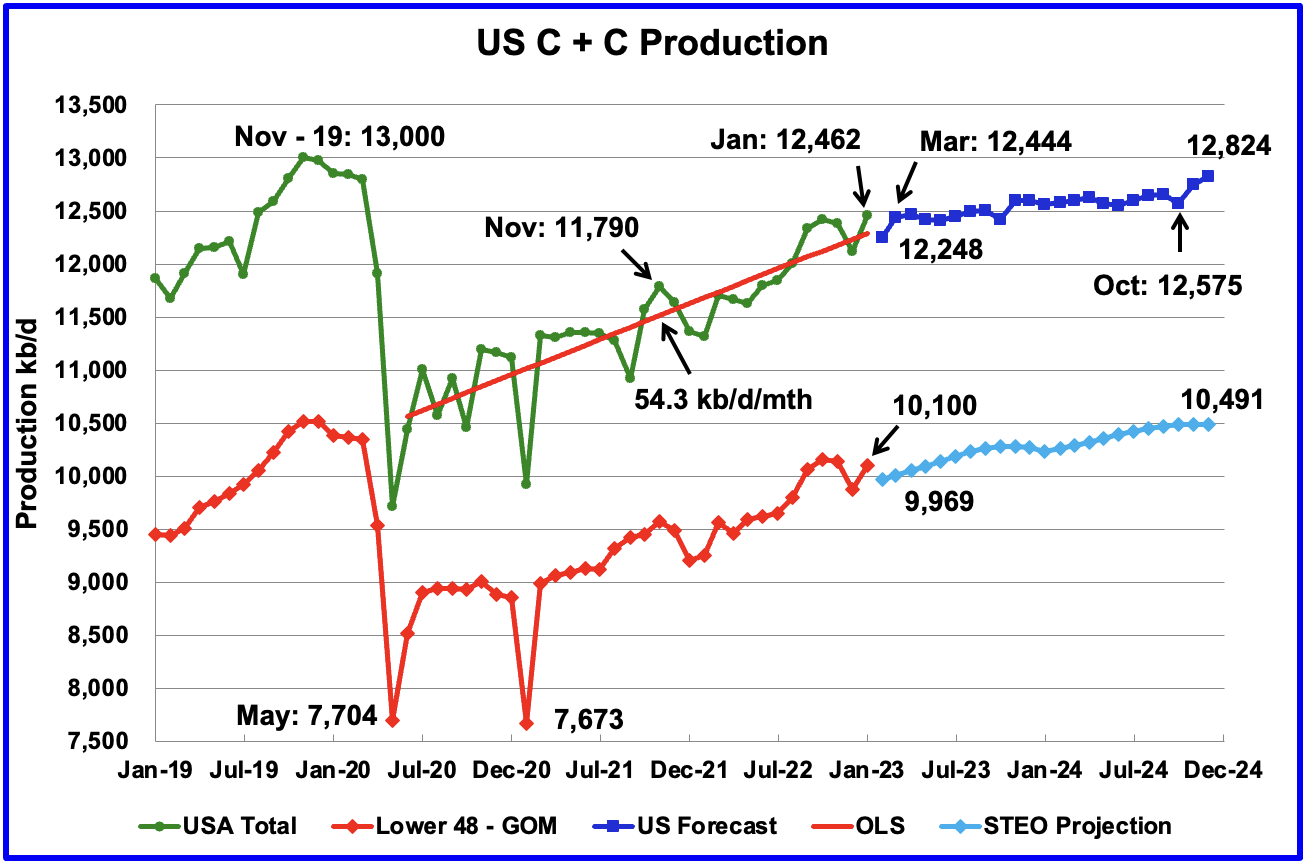
U.S. oil production increased by 437 kb/d to 12,462 kb/d, a post pandemic high. For January, the GOM contributed 125 kb/d to this high. The states with the largest increase were North Dakota with 97 kb/d followed by Texas with 76 kb/d.
The dark blue graph, taken from the March 2023 STEO, is the forecast for U.S. oil production from February 2023 to December 2024. Output for December 2024 is expected to be 12,824 kb/d which is 166 kb/d lower than the November 2019 peak of 13,000 kb/d. From March 2023 to October 2024, production is forecast to increase by 131 kb/d. February’s production is expected to drop by 214 kb/d to 12,248 kb/d.
The red OLS line from June 2020 to January 2023 indicates a monthly production increase of 54.3 kb/d/mth over that period. Clearly the growth rate going forward for 2023 and 2024, shown in the dark blue graph, will be lower than the 54.3 kb/d/mth seen in the previous July 2020 to January 2023 period.
While overall US oil production decreased by 347 kb/d, the Onshore L48 had a smaller but similar sized increase of 221 kb/d to 10,100 kb/d in January. The light blue graph is the STEO projection for output to December 2024 for the Onshore L48. From February 2023, to December 2024, output is expected to increase by 522 kb/d. Note that the last six months of 2023 are showing a hint of plateauing.
Oil Production Ranked by State
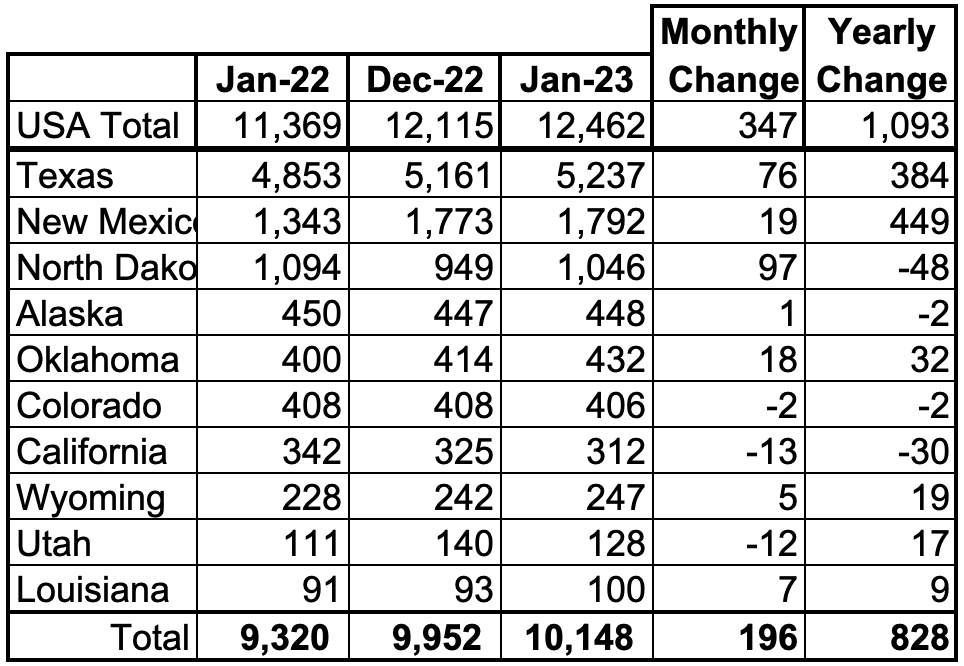
Listed above are the 10 states with the largest US oil production. These 10 accounted for 81.4% of all U.S. oil production out of a total production of 12,462 kb/d in January 2023.
On a YoY basis, US production increased by 1,093 kb/d with the majority, 833 kb/d having come from Texas and New Mexico.
State Oil Production Charts
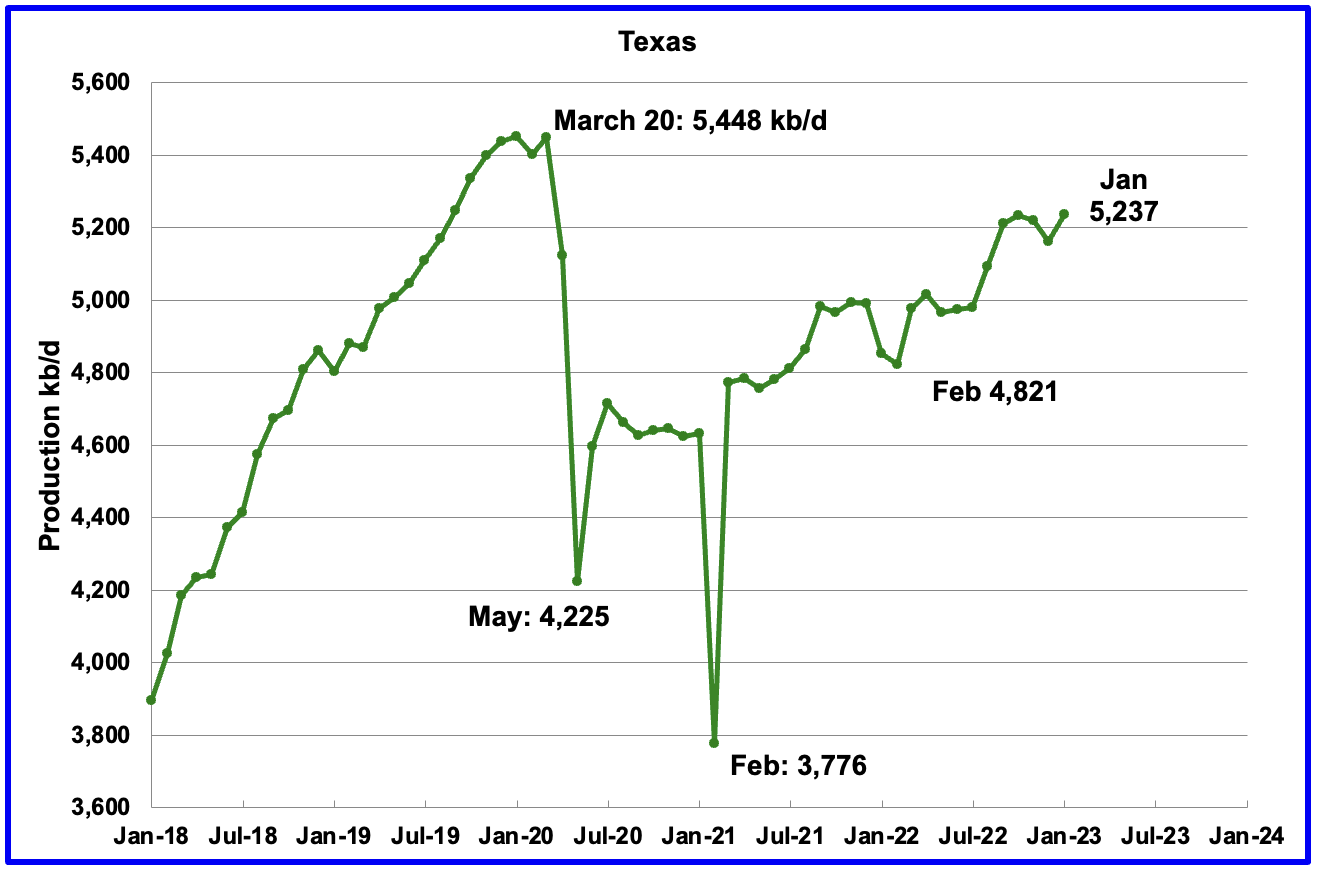
Texas production increased by 76 kb/d in January to 5,237 kb/d, a post pandemic high.
In January 2022 there were 235 Hz oil rigs operating in Texas. By January 2023, 325 Hz oil rigs were operational, an increase of 90 rigs. On a YoY basis, production increased by 384 kb/d.
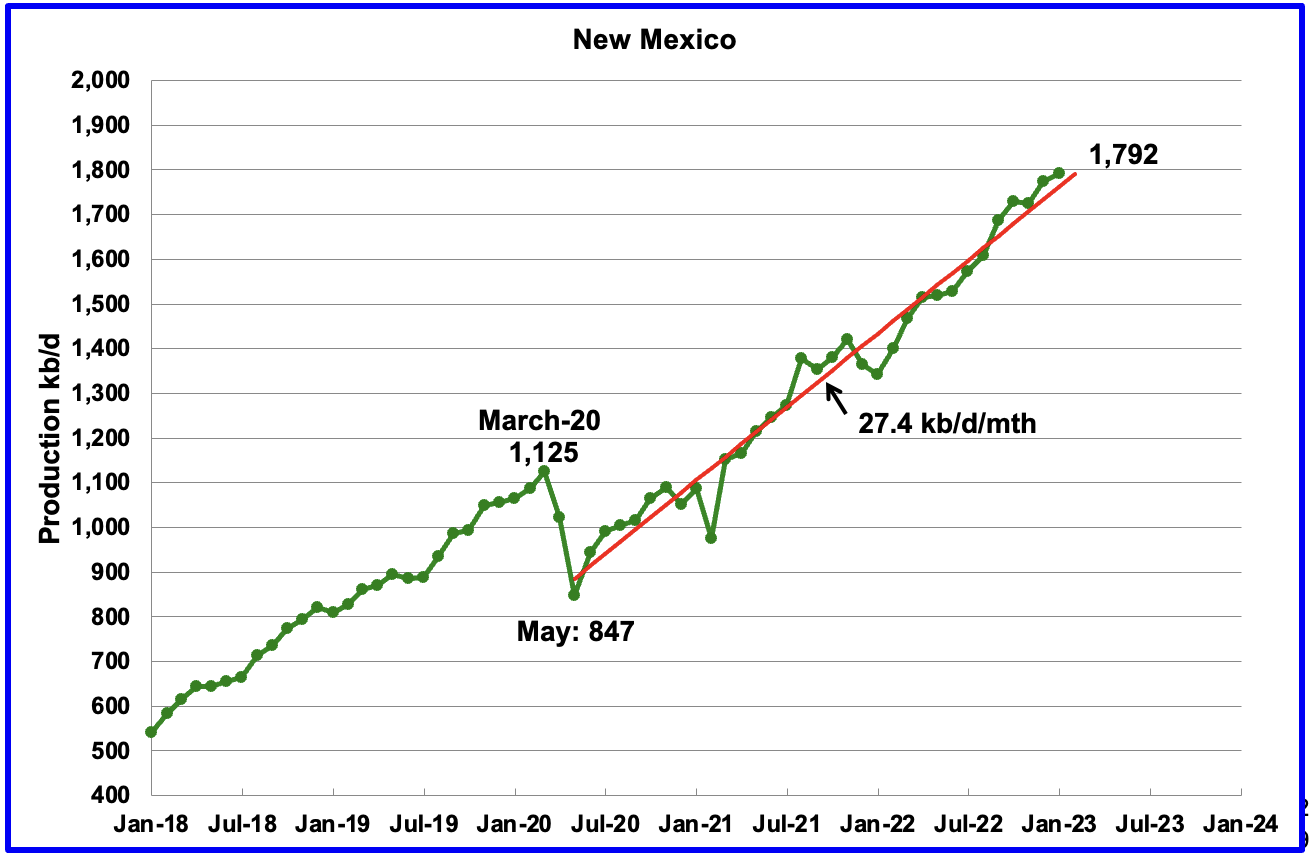
New Mexico’s production continues to make new highs. January’s production added 19 kb/d to 1,792 kb/d, another record high.
The red OLS line from May 2020 to January 2022 indicates a production growth rate of 27.4 kb/d/mth and shows no sign of rolling over. Since August, the rig count has been steady in the high 90s, 97 ±4.
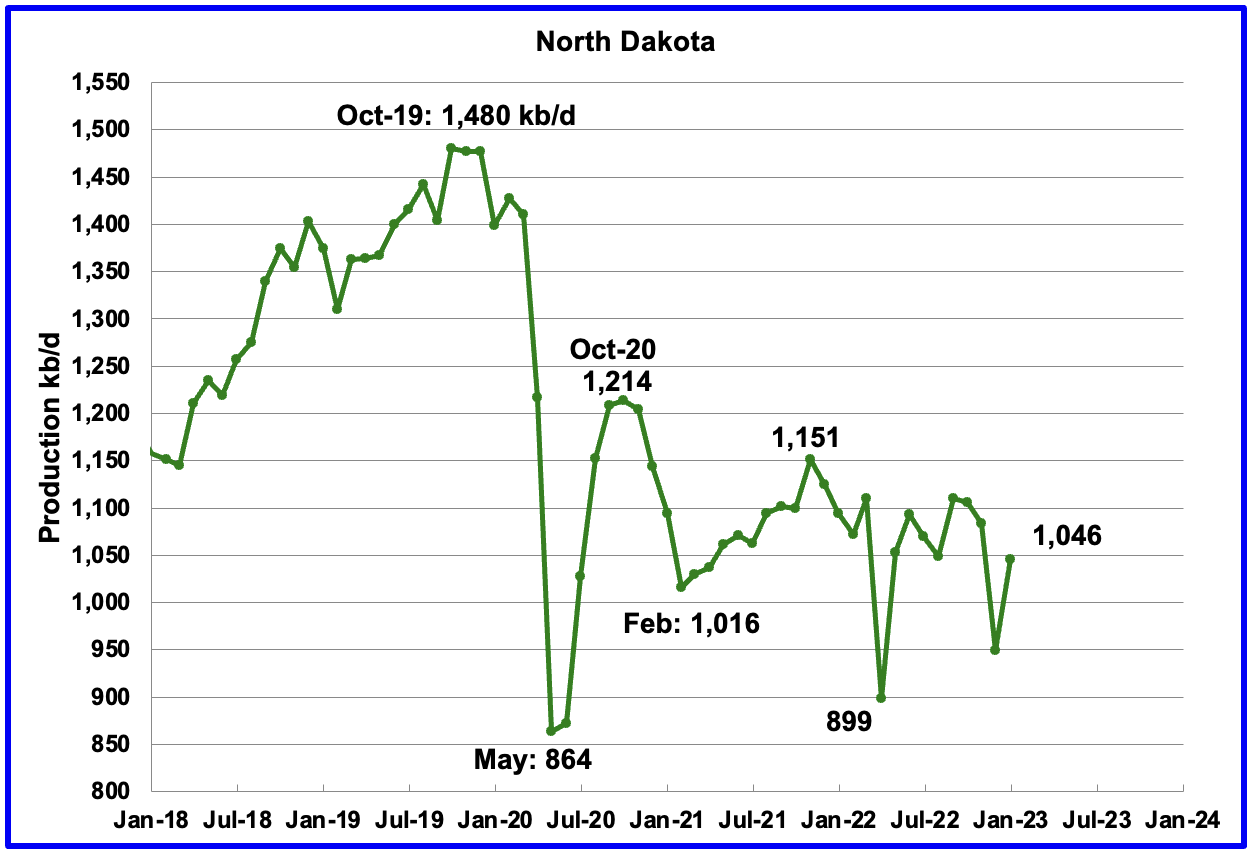
North Dakota’s January oil production has partially recovered from December’s extreme cold weather impacted production. Output increased to 1,046 kb/d, an increase of 97 kb/d over December.
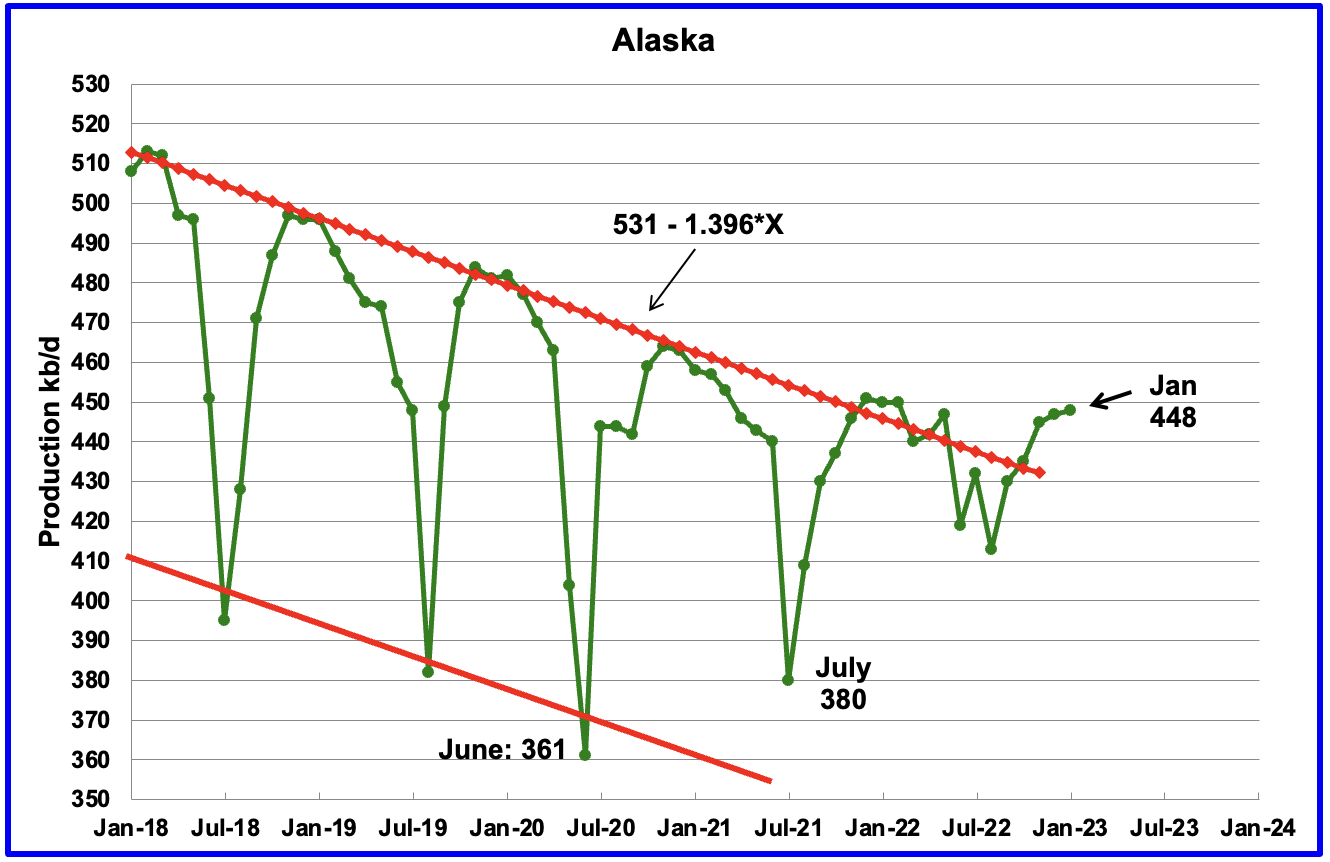
Alaskaʼs January output increased by 1 kb/d to 448 kb/d and was 2 kb/d lower than January 2022. This is an early indication that Alaska’s oil production may be breaking out from the red declining downtrend line.
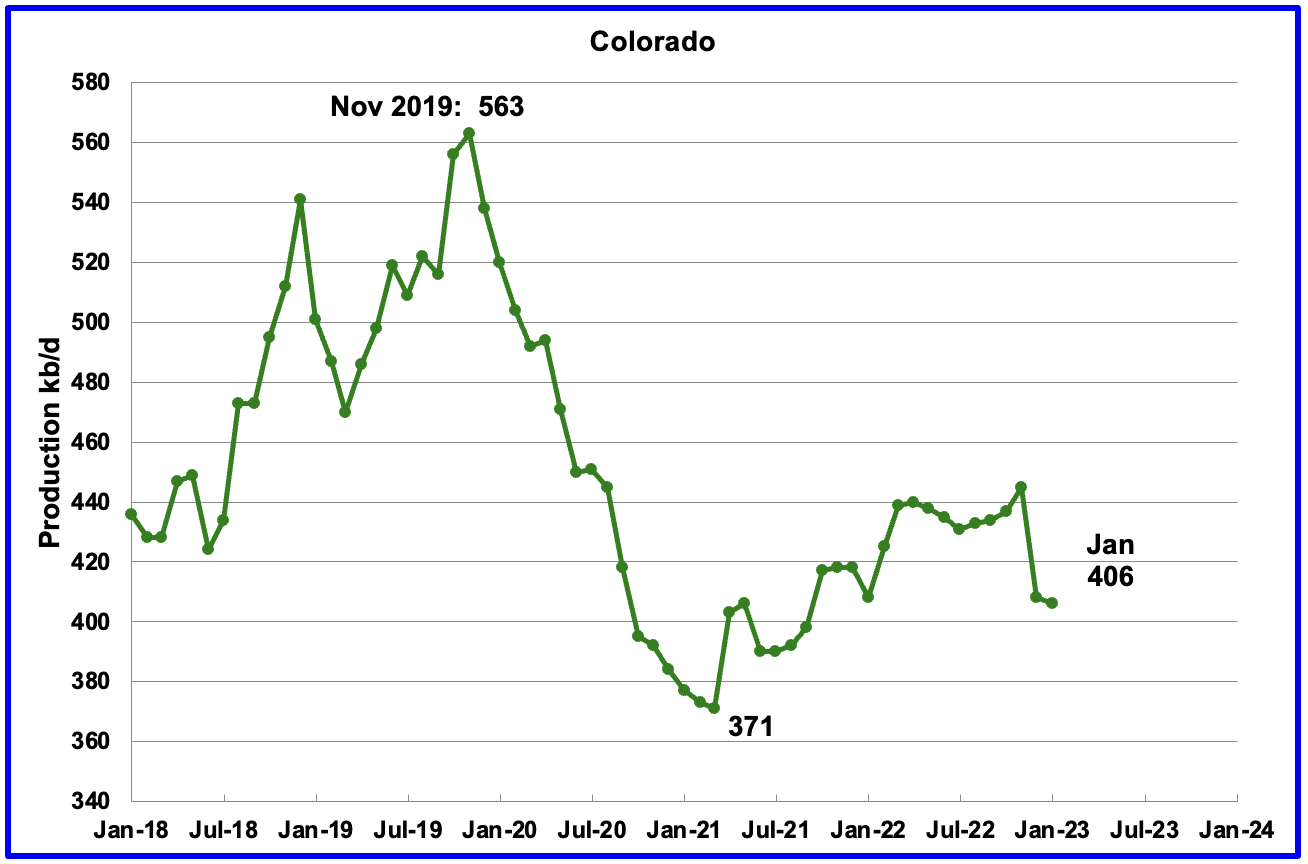
Coloradoʼs January production decreased by 2 kb/d to 406 kb/d.
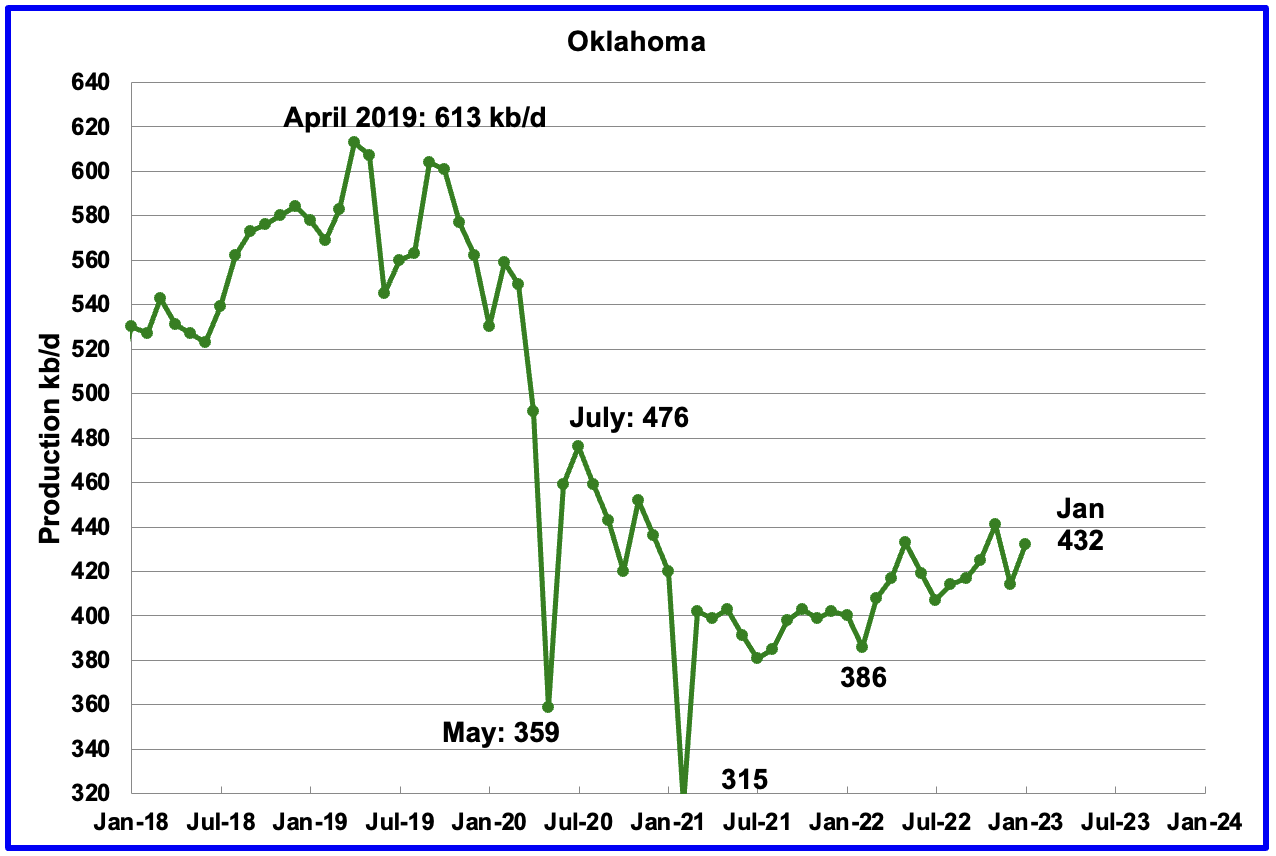
Oklahoma’s output in January increased by 18 kb/d to 432 kb/d. Production remains 44 kb/d below the post pandemic July 2020 high of 476 kb/d.
From January 2022 to April 2022, close to 50 rigs were operating in Oklahoma. By January 2023 the rig count had increased to 60.
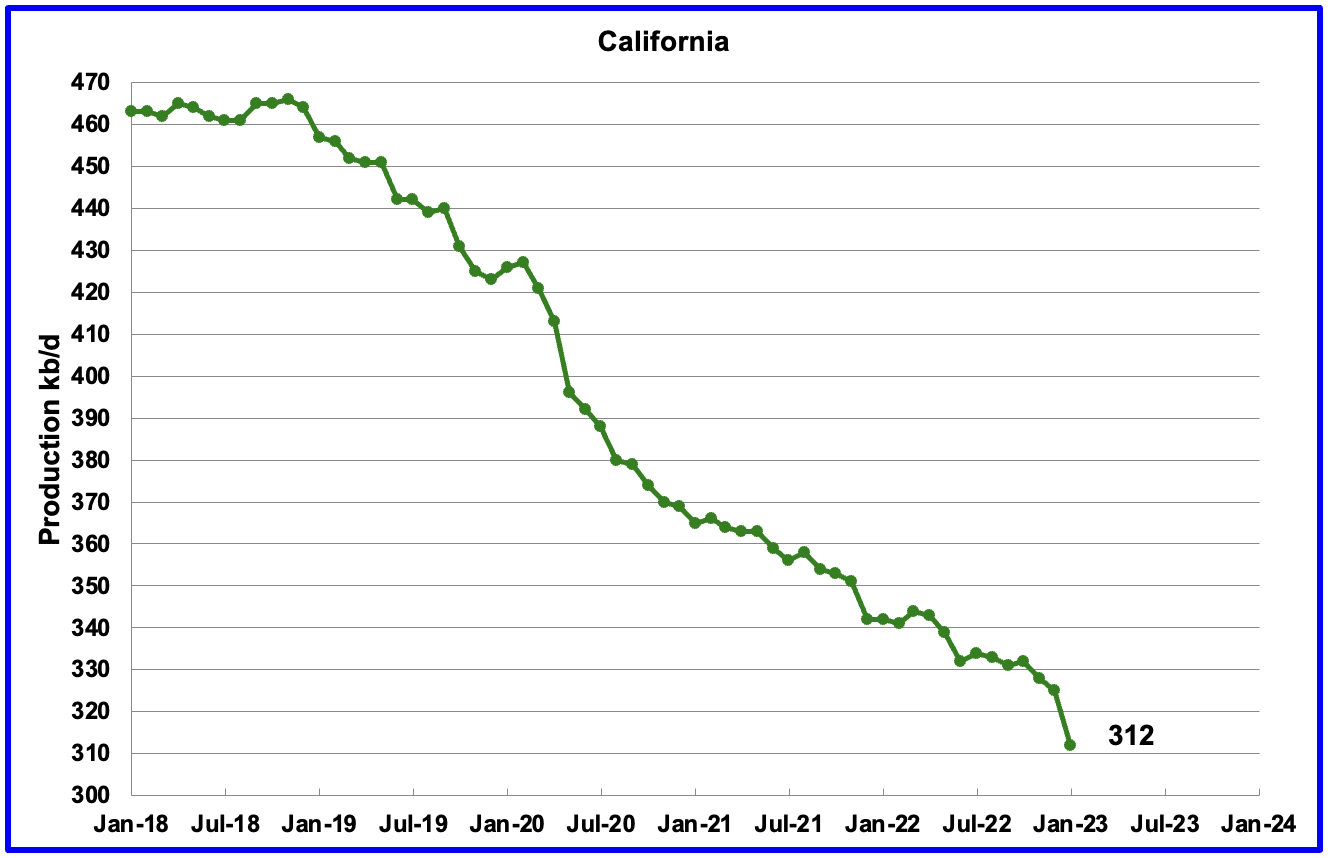
Californiaʼs overall slow output decline trend continues. However there was a larger than normal drop of 13 kb/d in January to 312 kb/d.
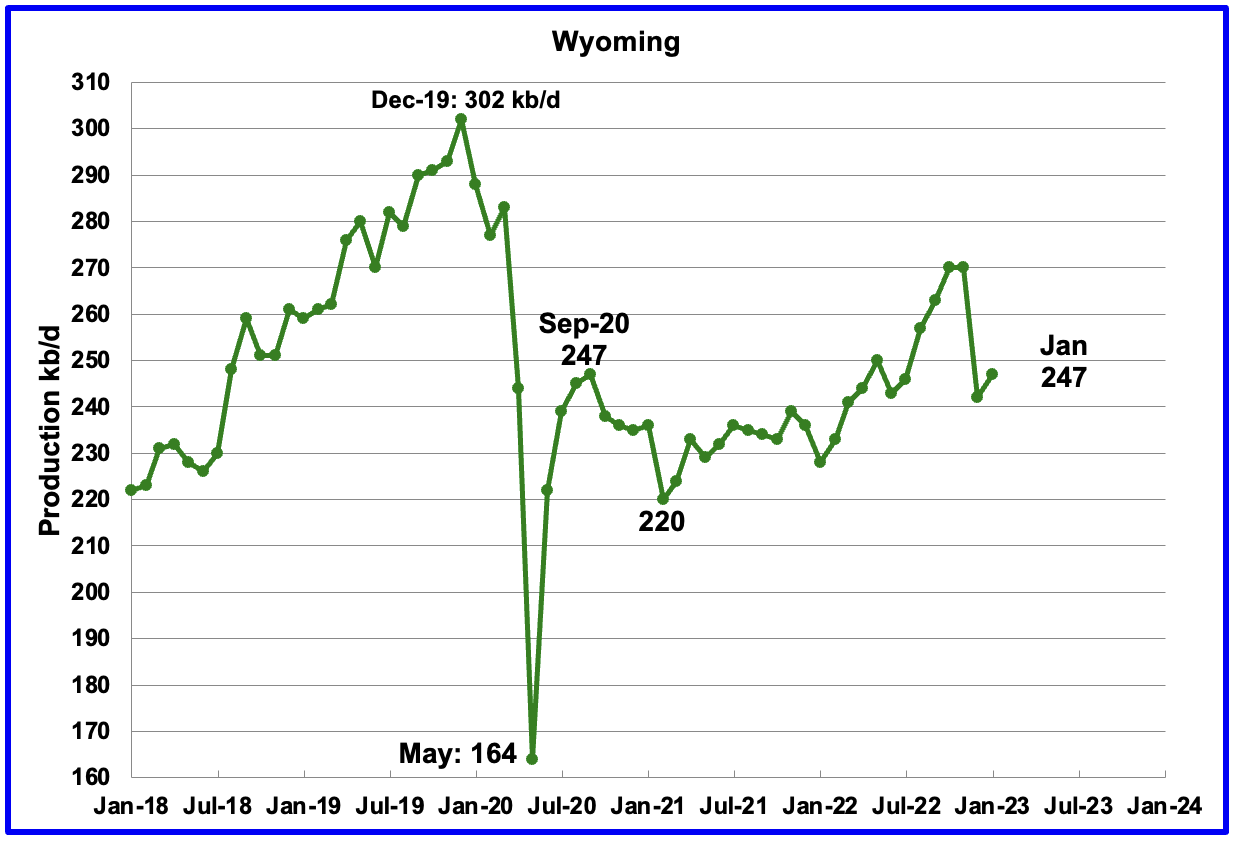
Wyoming’s oil production has been on a slow unsteady uptrend from the low of 220 kb/d in February 2021 due to increased drilling. October and November 2022 output reached a post pandemic high of 270 kb/d. Weather affected December production but January’s production recovered by 5 kb/d to 247 kb/d.
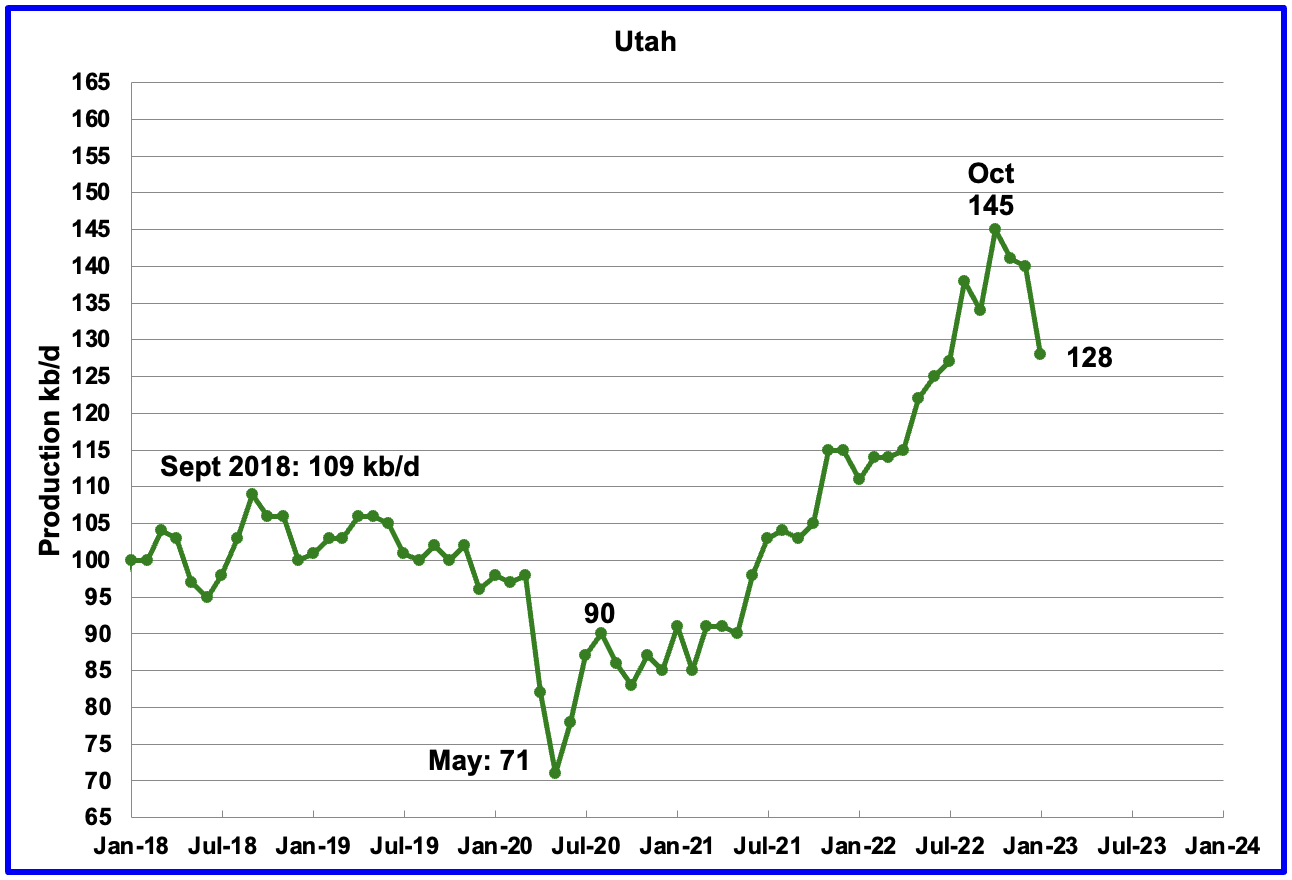
Utah’s oil production had been increasing steadily since early 2021 and reached a new high of 145 kb/d in October 2022. However since then, production has declined by 17 kb/d to 128 kb/d in January.
Utah had 7 Hz rigs operating in January 2023, up from 5 in January 2022.
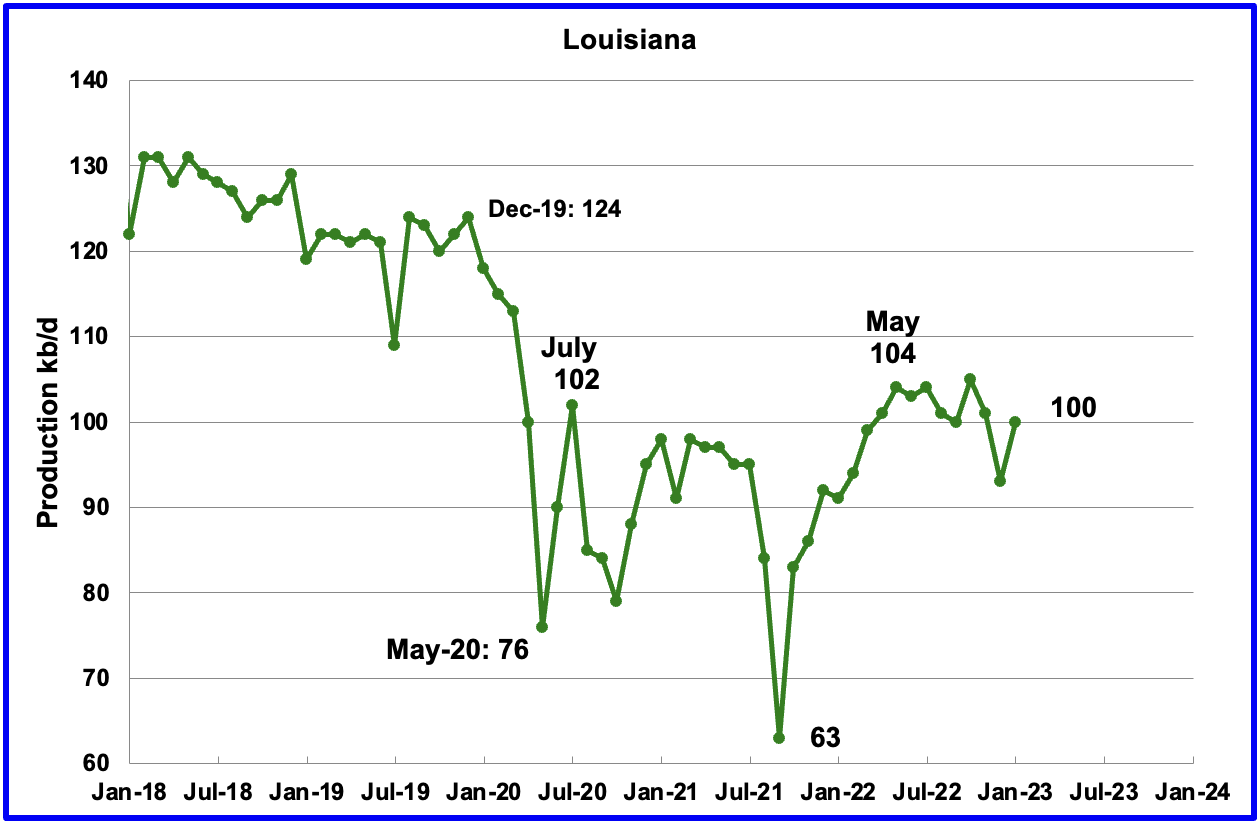
Louisiana’s output rose from the low of 63 kb/d in September 2021 to 104 kb/d in May 2022. Since then output has plateaued. January’s production was 100 kb/d, 4 kb/d lower than May 2022.
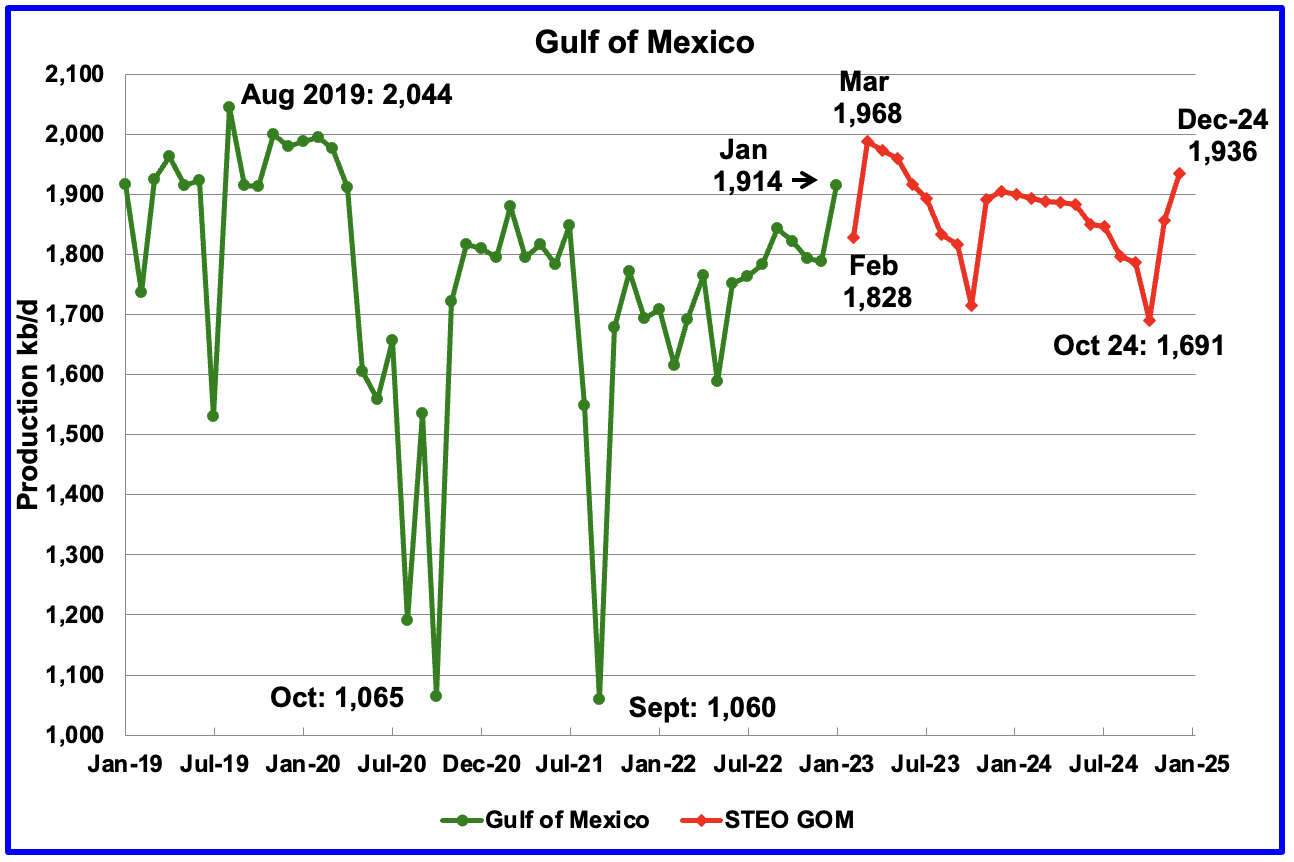
GOM production increased by 125 kb/d in January to 1,914 kb/d. If the GOM was a state, its production would normally rank second behind Texas.
The February 2023 STEO projection for the GOM output has been added to this chart and projects that output in February 2023 will drop to 1,828 kb/d. This is an unexpected surprise since Shell announced that the Vito platform had begun production on February 15, 2023. This production drop implies that the startup may have encountered problems and the Vito platform had to be shutdown.
Note that March production, estimated at 1,968 kb/d, could mean that the EIA expects that Vito’s estimated peak production of 100,000 barrels of oil equivalent per day, will be fully online during March.
It is not known if the GOM decline after March 2023 is related to extensive maintenance.
A Different Perspective on US Oil Production
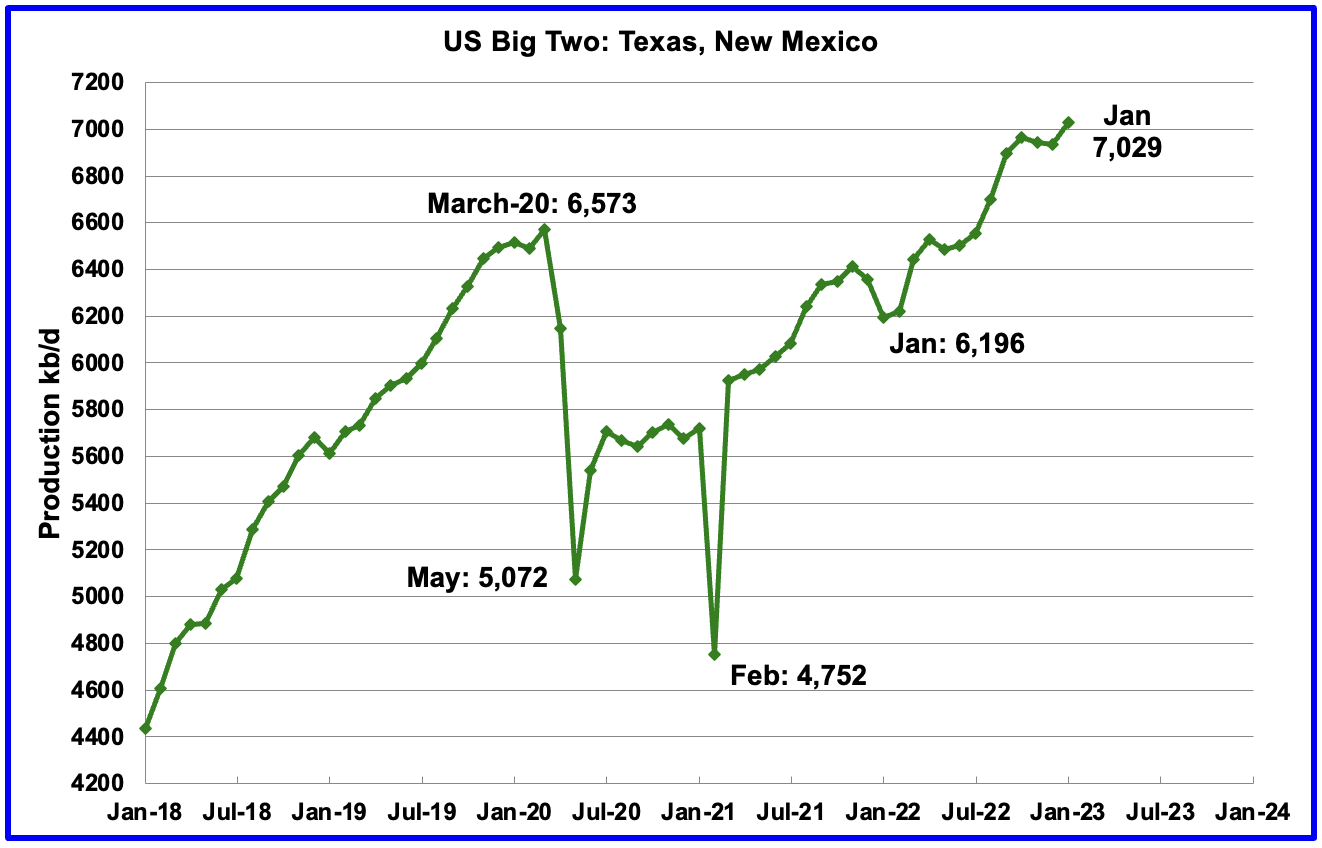
The Big Two states, combined oil output for Texas and New Mexico.
January’s production in the Big Two states increased by a combined 95 kb/d to 7,029 kb/d with Texas contributing 76 kb/d while New Mexico added 19 kb/d.
If the data in the DPR section below is accurate, 25 kb/d of the Texas increase came from the Eagle Ford basin. That would imply that the increase from the Permian was 70 kb/d in January. The DPR data shows that the January Permian output was 65 kb/d, which is fairly close. This may also imply that the slightly older DPR data has been updated and is more accurate than the latest data.
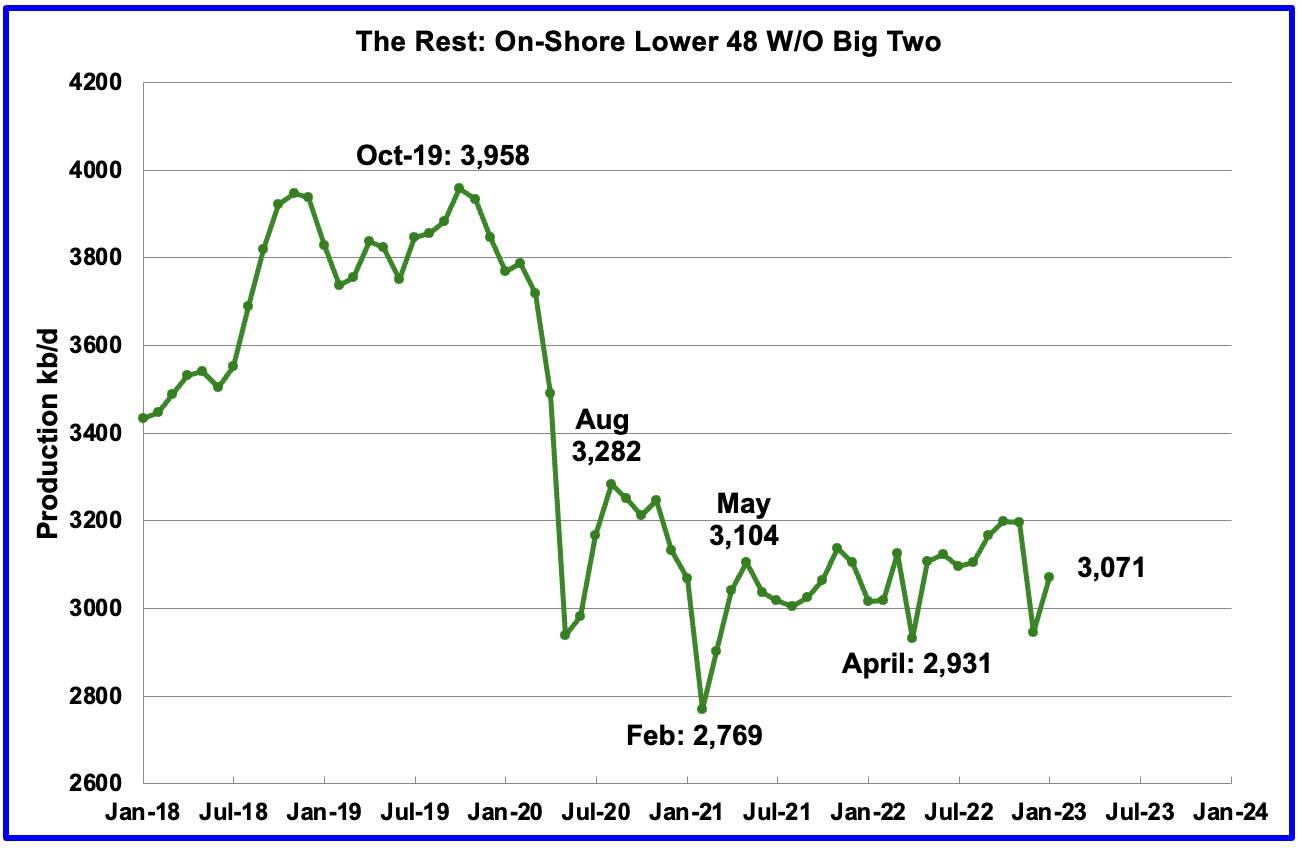
Oil production by The Rest
In January production in The Rest rose by 126 kb/d to 3,071 kb/d. From May 2021, oil production in The Rest has primarily stayed in the range of 3,000 kb/d to 3,200 kb/d and has not given any clear indication of being in decline or rising.
The main takeaway from The Rest chart is that current production is 881 kb/d below the high of October 2019. The question we need answered is “Is this a permanent loss that will never be recovered?” All indications continue to be that this is a permanent loss.
Rigs and Fracs
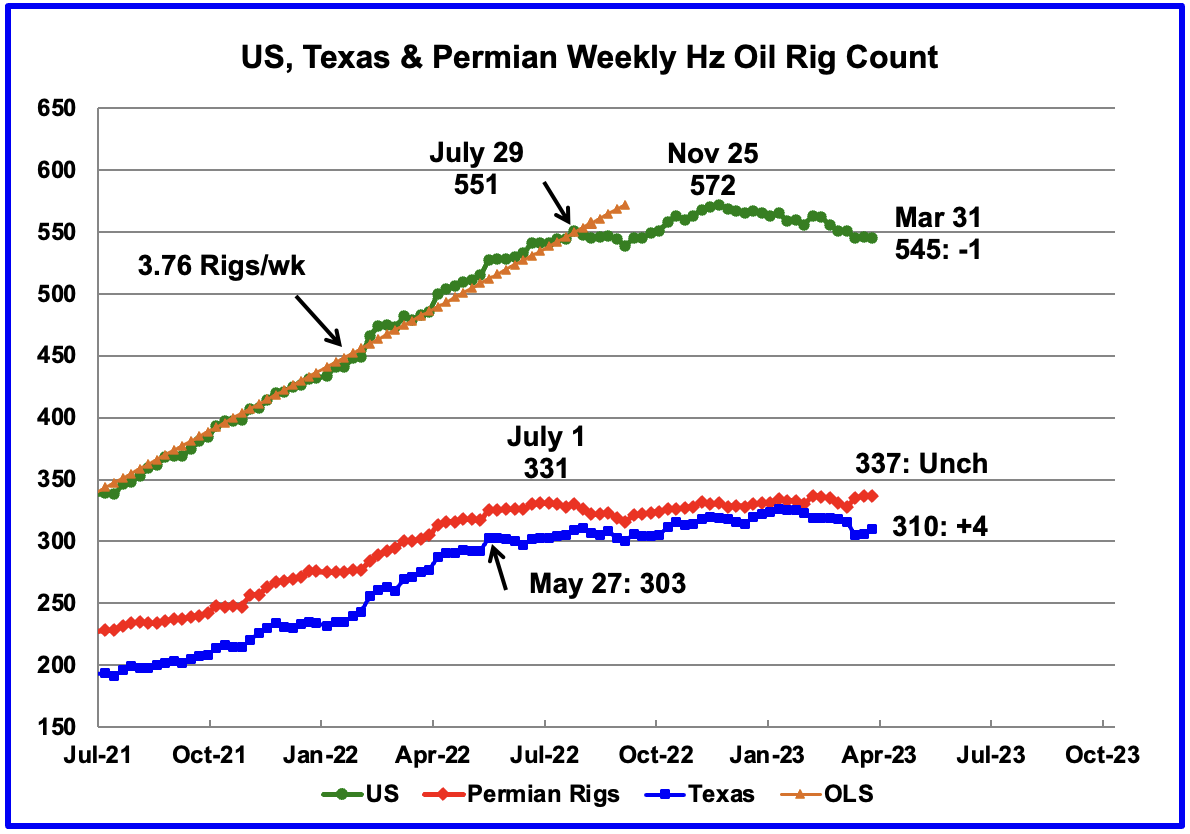
Since the beginning of April 2021 through to the week ending July 29, 2022, the US added horizontal oil rigs at a rate of close to 3.76 rigs/wk, orange OLS line, and peaked at 551 rigs in the week ending July 29. However since then the number of operational rigs has wondered primarily sideways.
A high of 572 rigs was reached in the week ending November 25, 2022. In the week ending March 31, 2023 the number of rigs decreased by 1 to 545 and are down 26 from the recent high of 572.
In the week ending March 31, Permian rigs were unchanged at 337 and Texas rigs increased by 4 to 310. Note that the trend for rigs in the Permian is showing a slow increase from September 2022 and is currently 6 above the high of 331 on July 1, 2022.
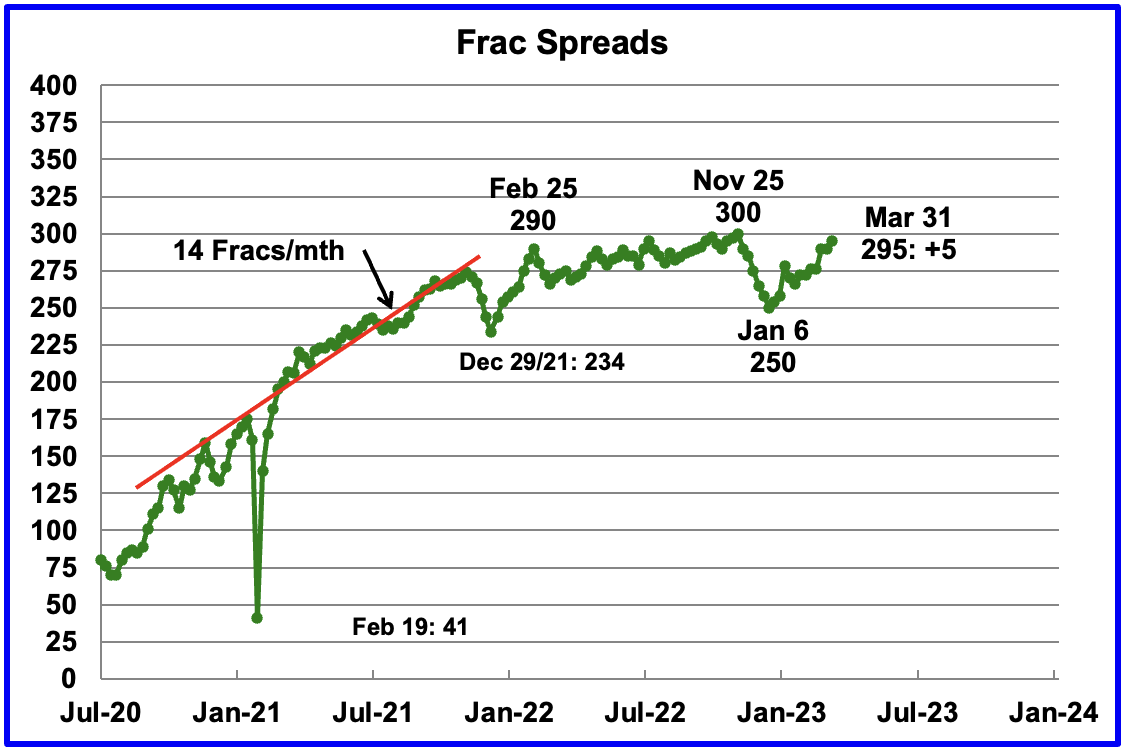
For frac spreads, the general trend since the week of January 6, 2023 can best be described as recovering from the slow down associated with the 2022 Thanksgiving and Christmas holidays. This trend is a repeat of what happened last year. However there is one difference. Last year the recovery took place over 9 weeks while this year it has taken 13 weeks so far. How far above 300 will the Frac count get in 2023?
For the week ending March 31, the Frac count increased by 5 to 295.
Note that these 295 frac spreads include both gas and oil spreads.
Frac Spread Count
The Frac Spread Count, provided by energy consultancy Primary Vision, measures how many crews across the U.S. are drilling wells in preparation for hydraulic fracturing of shale, and serves as a simultaneous indicator of the number of wells being drilled, as well as a leading indicator of crude oil production.

Frac spread count for the week February 11 to February 17.

Frac spread count for the week February 25 to March 3.
I have been working with the Frac Spread count database recently to try to understand how to use it. Some progress has been made and some initial results are provided in the above two tables. Not sure how useful they are since I think most of the oil experts out there already know what these two tables are showing.
Here is some of the typical information provided in their database, OperatorName, WellName, the vertical distance from a point in the well (usually the current or final depth) to a point at the surface, the total volume of water used as a carrier fluid for the hydraulic fracturing job, etc. Unfortunately I cannot find any information that identifies an oil spread vs a gas spread. Any information to sort that out would be helpful.
The first table above shows results for the week February 11 to February 17. The total Frac count is 282, 10 higher than reported officially by Primary Vision. This could be due to double counting or more updated information. Texas and New Mexico had 161 frac spreads crews operating during that period. The 161 spreads accounted for 59% of all Frac crews. Eddy and Lea counties are the hot spots in New Mexico while Midland and Ward are the most active counties in Texas.
The second table shows the results for the week February 25 to March 3. The total count is 184 and is 92 spreads below the officially reported 276. I assume this is due to late reporting in the database and will update next week to see if the count increases. One of the issues is that the database does not show Frac spreads in progress. It only reports Fracs that have been started and completed.
As in the previous table, Eddy and Lea counties are the hot spots in New Mexico while Midland, Ward and Barnes (new) are the most active counties in Texas.
I would be interested in hearing whether there are any other Gems in the two pivot tables.
This morning it was reported that Ovintiv bought EnCap’s Permian basin oil assets in a $4.3 billion deal. Interestingly the article states “The assets being bought are located in the Midland portion of the Permian Basin in Texas”. At least they are buying in the right county.
Drilling Productivity Report
The Drilling Productivity Report (DPR) uses recent data on the total number of drilling rigs in operation along with estimates of drilling productivity and estimated changes in production from existing oil wells to provide estimated changes in oil production for the principal tight oil regions. The March DPR forecasts production to April 2023 and the following charts are updated to April 2023. The DUC charts are updated to February.
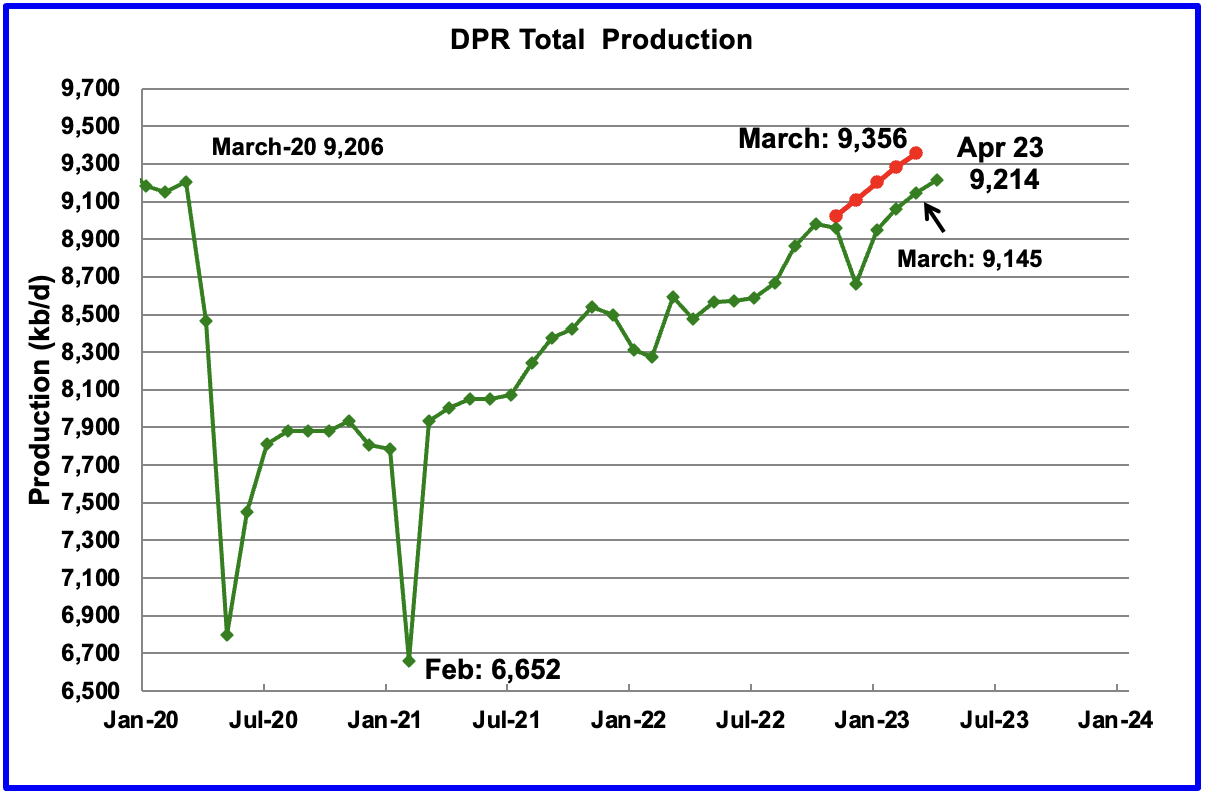
Above is the total oil production projected to April 2023 for the 7 DPR basins that the EIA tracks. Note that DPR production includes both LTO oil and oil from conventional wells.
The March DPR report made significant Downward revisions to the the February report, which had already made downward revisions to the January report. For instance, March output was revised down by 211 kb/d from 9,356 kb/d to 9,145 kb/d. The DPR is projecting that oil output for April 2023 will increase by 69 kb/d to 9,214 kb/d, a post pandemic high. April’s output is projected to barely exceed the March 2020 output of 9,206 kb/d by 8 kb/d. The pre-pandemic high was 9,292 kb/d in December 2019.
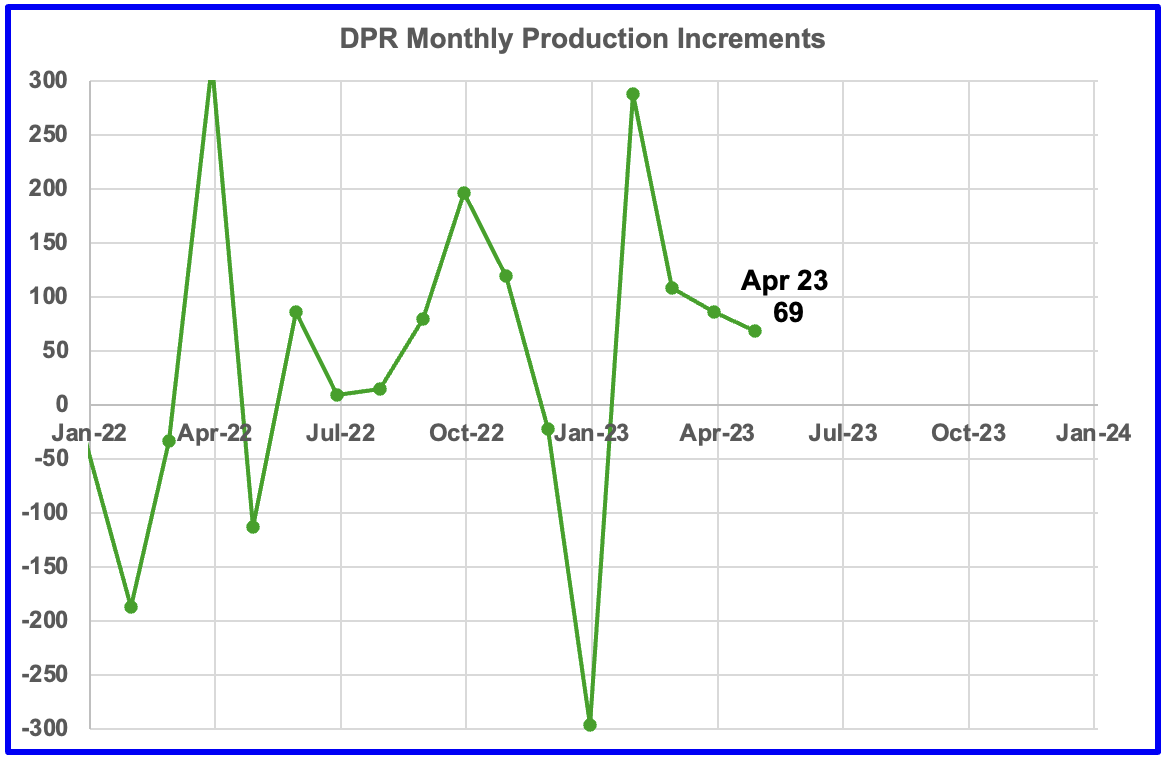
This chart shows the monthly DPR production increments. What is notable is the reduced month to month volatility since January 2022. The January spike is due to the weather related December oil production drop.
The other thing to notice is the declining monthly increases in the production rate. March’s production increase was 86 kb/d while April’s increase dropped by 17 to 69 kb/d.
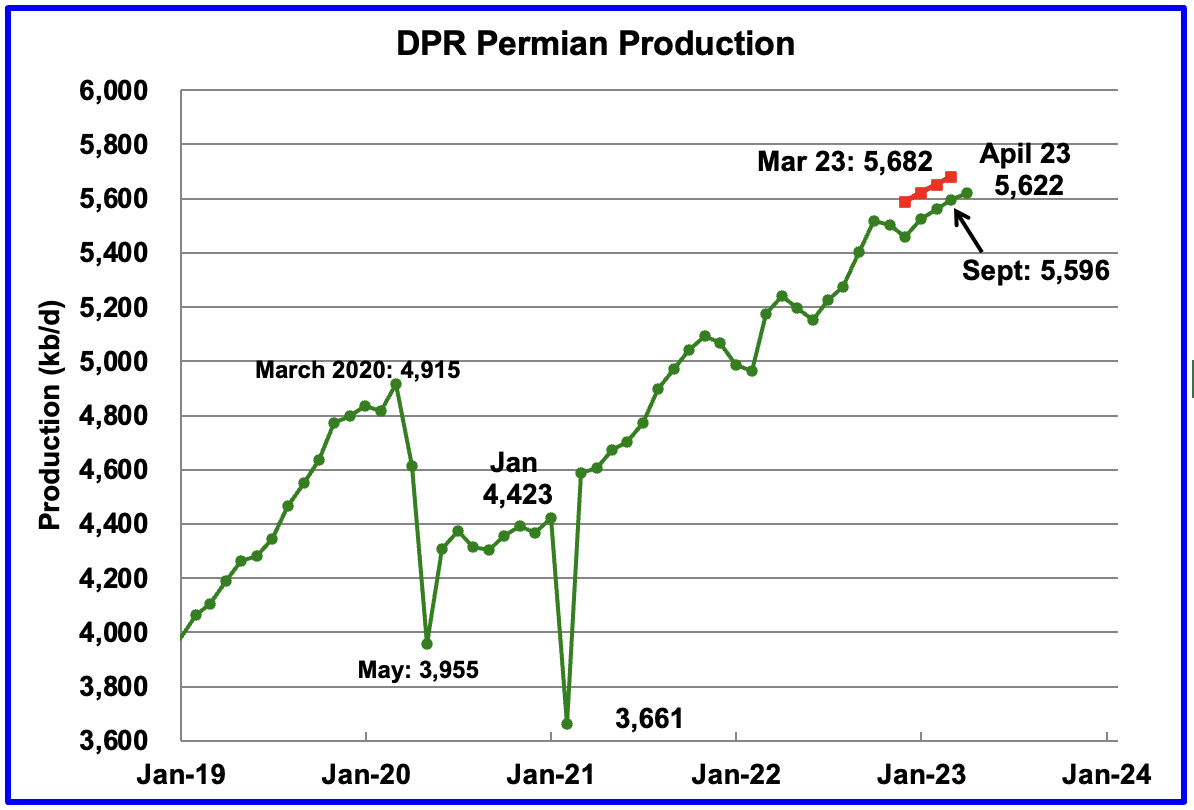
Permian output continues to rise in April. However the rise is really a drop after incorporating a large downward production revision to the previous post. The April report report has downwardly revised March output from 5,682 kb/d to 5,596 kb/d, a drop of 86 kb/d. Note that April’s production is lower than the March estimate (red markers) from the previous post.
If the Permian were part of OPEC, at 5,596 kb/d it would be the second largest producer after Saudi Arabia. April’s output is 707 higher than the pre-pandemic high 4,915 kb/d.
During February, 435 wells were drilled and 433 were completed in the Permian. (Note that February is the latest month for DUC information). The completed wells added 370 kb/d/well to February’s output for an average of 855 b/d/well. The overall decline was 335 kb/d which resulted in a net increase for Permian output of 35 kb/d. Of the 433 completed wells, 391 were required to offset the decline.
Note, this is the second month in which no DUCs were used in the Permian, actually two were added.
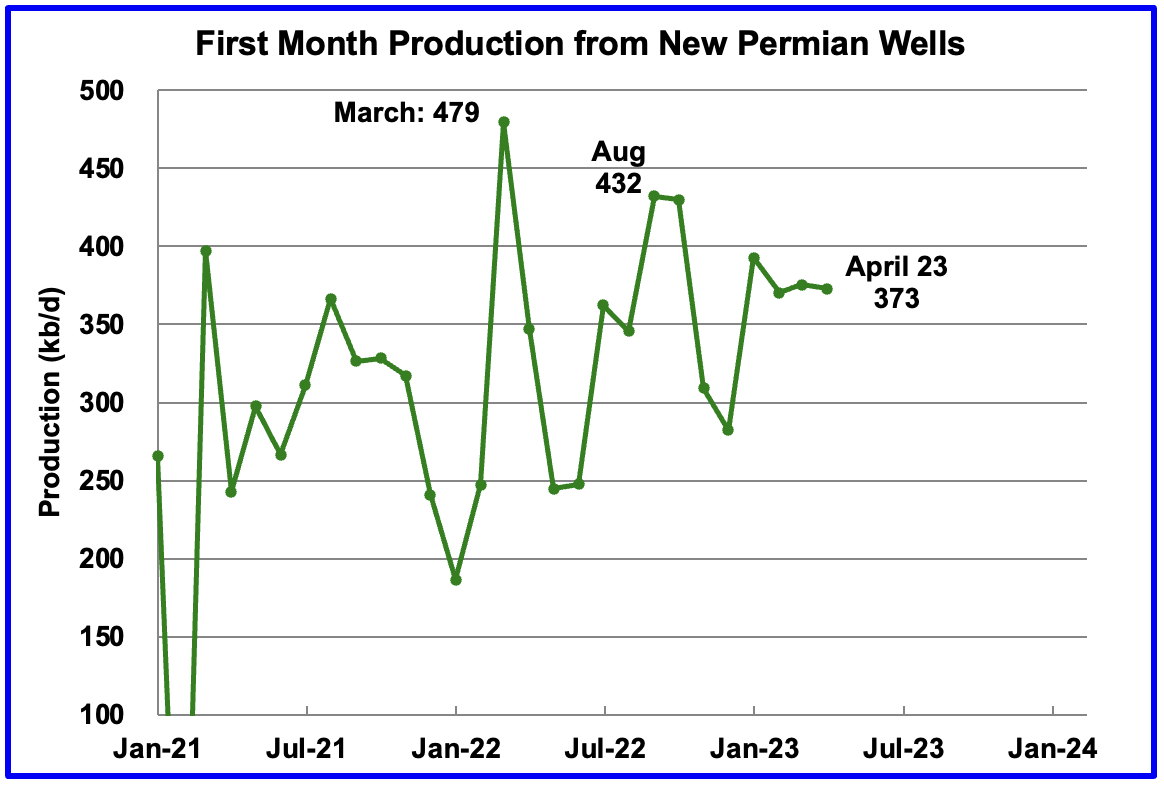
This chart shows the average first month total production from Permian wells tracked on a monthly basis. Assuming the latest information is correct, total monthly production from the newest Permian wells in April continues to be at the 370 kb/d level. Part of the flat production shown is related to an essentially unchanging number of wells being completed, currently hovering slightly over 430 for the last 4 months.
This production level could drop over the coming months if oil prices stay close to $70/b, according to this source.
“The US shale patch may lose as much as 20% of its activity over the next year if energy prices hold at current levels, according to one of the biggest private equity players in the industry.
Crude would need to rise by about 15% to $80 a barrel, and gas would have to climb by more than a third to $3 per million British thermal units for drilling and frack work to maintain its current pace, Quantum Energy Partners Chief Executive Officer Wil VanLoh said in an interview Tuesday. Oil and natural gas prices have slid since mid-2022 on fears of a global economic slowdown.”
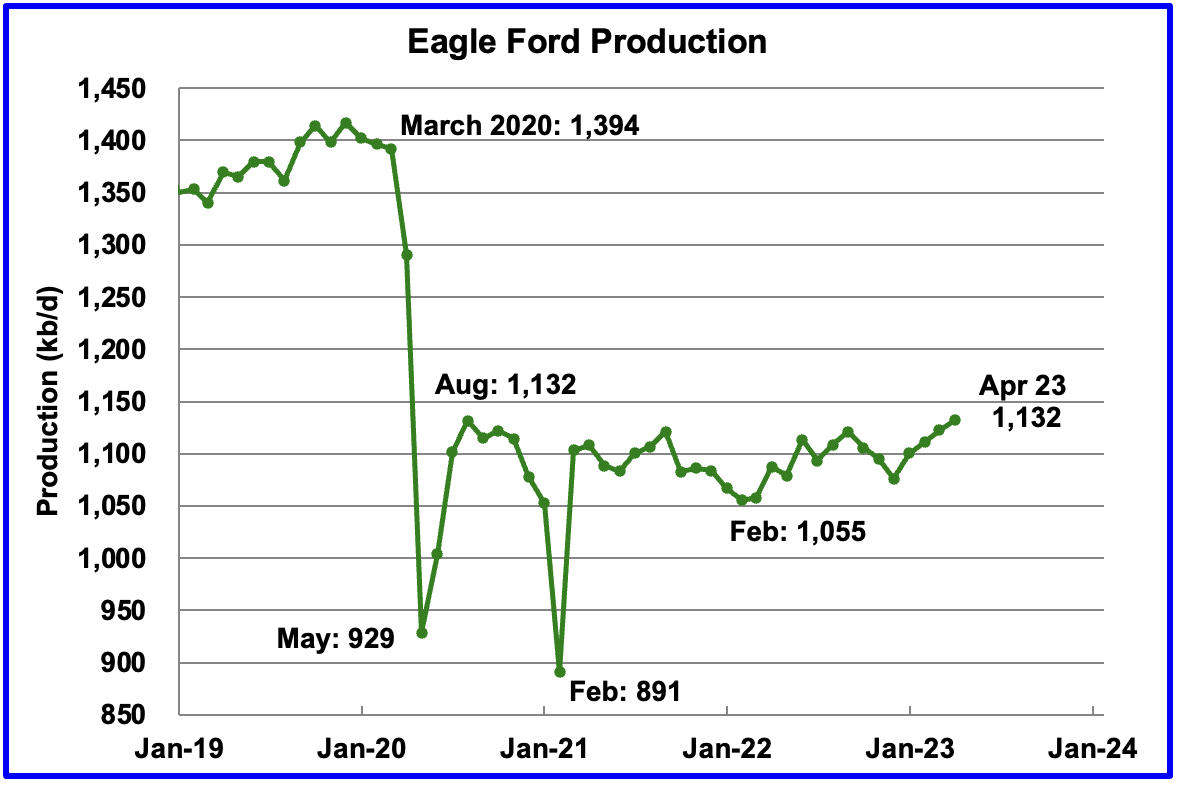
Output in the Eagle Ford basin has been in a generally flat trend since March 2021. However since the December 2022 weather induced drop, production has been increasing. April output is expected to increase by 9 kb/d to 1,132 kb/d and is back to the same output as in August 2020.
At the beginning of the year 2023, 68 rigs were operating in the Eagle Ford basin and continued at 68 in March.
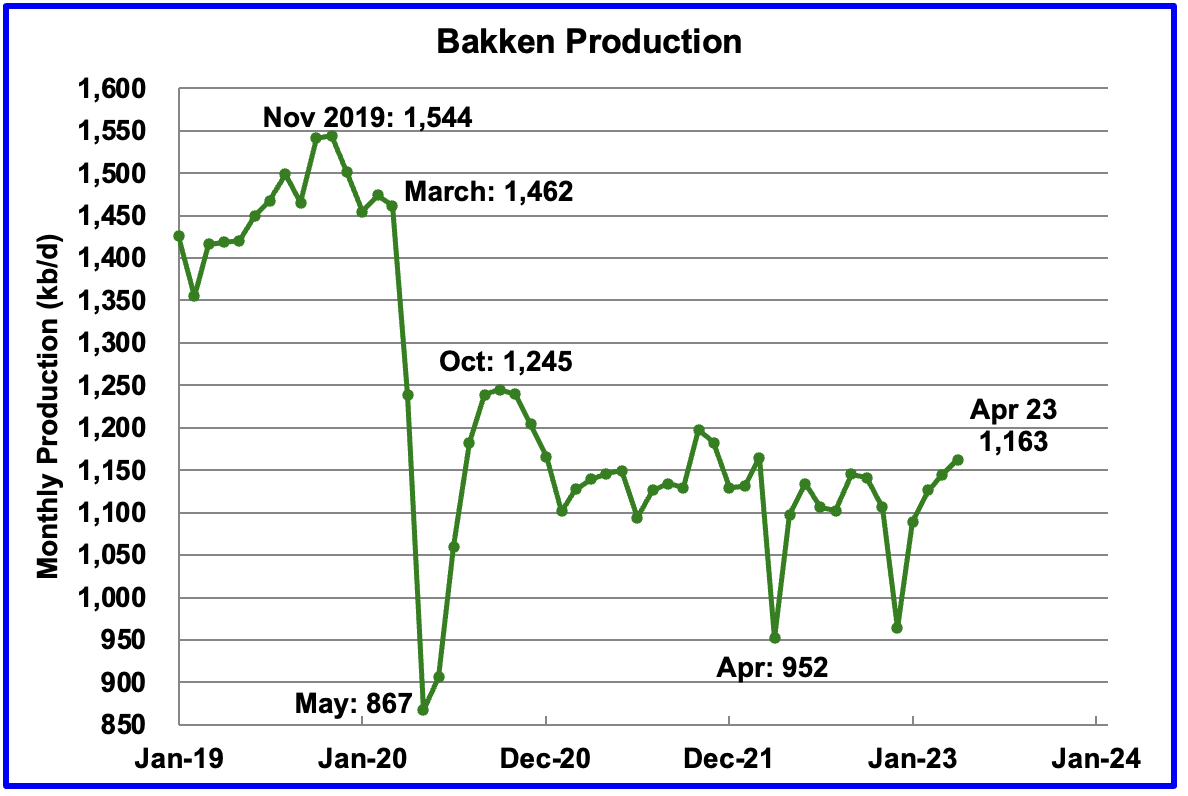
The DPR forecasts Bakken output in April will be 1,163 kb/d an increase of 18 kb/d over March. Production from January onward looks optimistic/wrong and increasing linearly.
The North Dakota Department of Mineral resources is reporting January Bakken production as 1,023 kb/d while the DPR is reporting 1,089 kb/d. See next chart
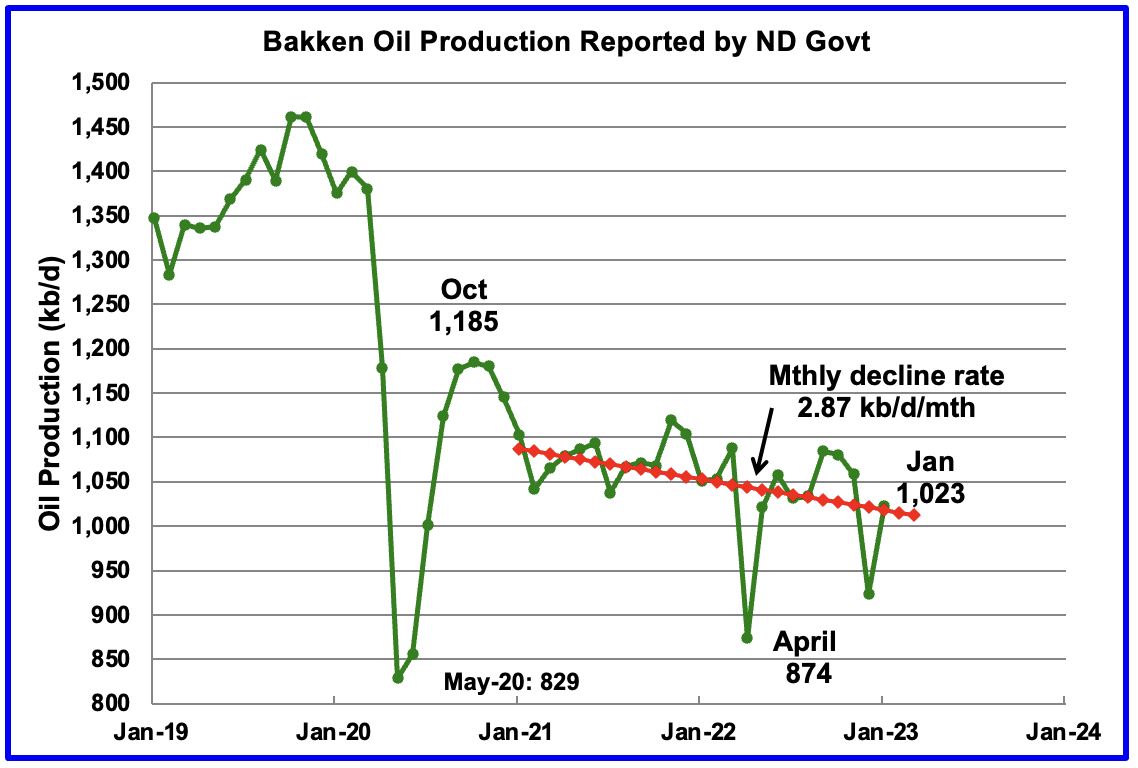
North Dakota Bakken production rebounded by 99 kb/d to 1,023 kb/d in January.
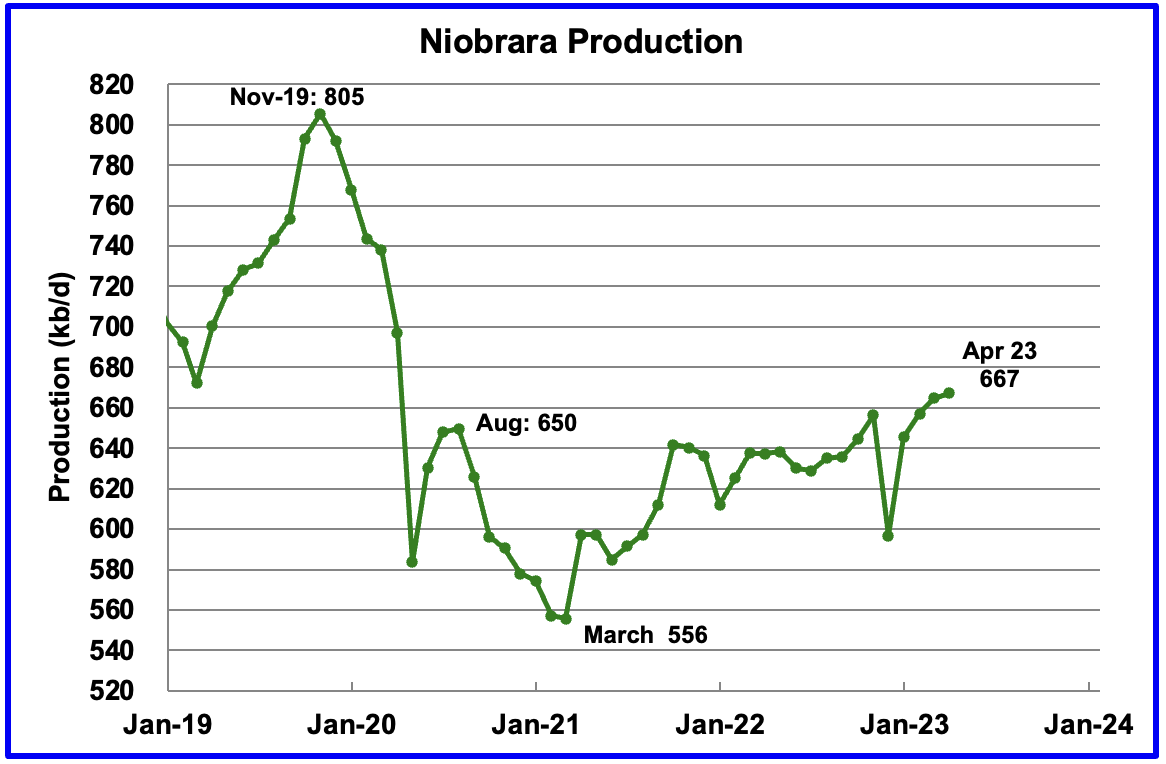
Output in the Niobrara continues to increase slowly. April output increased by 2 kb/d and set a post pandemic high of 667 kb/d. It should be noted that the LTO report in the next section indicates no LTO growth in output over the last three months in the Niobrara basin.
Production increased due to the addition of more rigs into the basin. The Niobrara had a peak of 19 rigs operating in November 2022. In March 2023, the count had decreased to 15.
DUCs and Drilled Wells
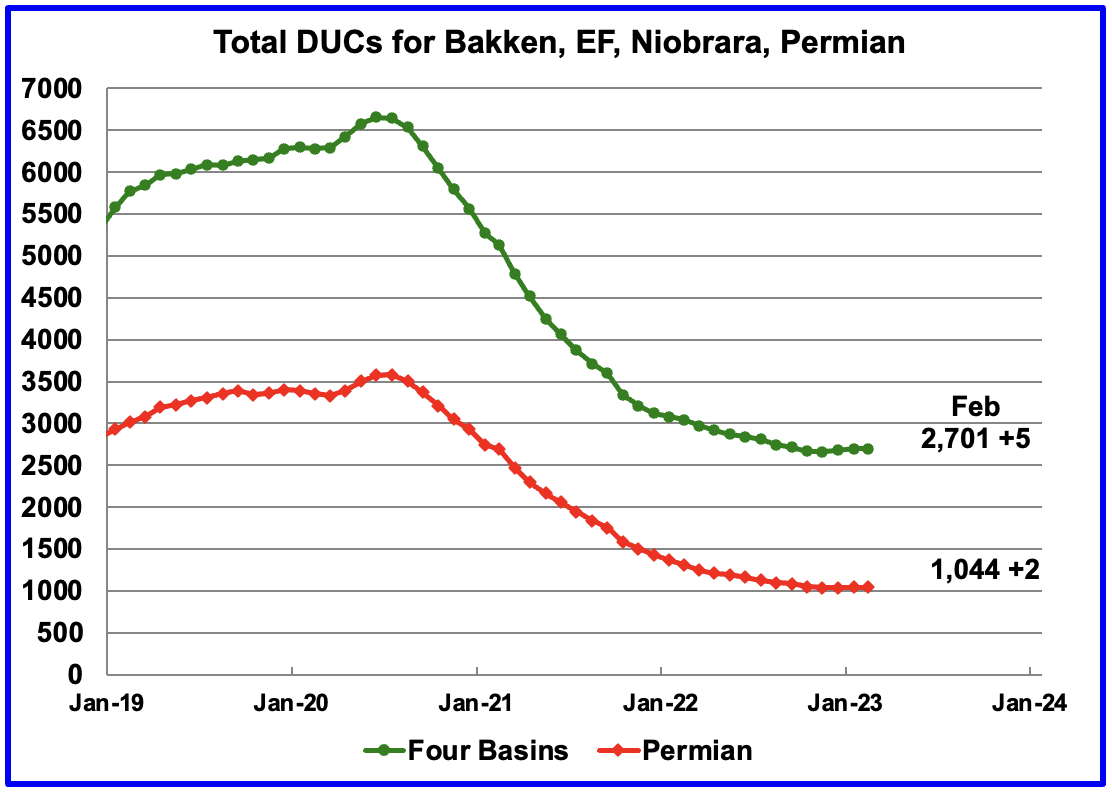
The number of DUCs available for completion in the Permian and the four major DPR oil basins has fallen every month since July 2020 but that trend has now reversed. In December 2022 the trend for total DUCs changed from decreasing to increasing. February added 5 DUCs. The biggest increase came from the Niobrara where DUCs increased by 10 while Eagle Ford DUCs dropped by 8.
In the Permian, the falling trend in DUCs has also changed. December was the first month since mid 2020 when the number of DUCs increased. February Permian DUCs increased by 2 to 1,044 because 435 wells were drilled and 433 were completed. Since the low of 1,037 DUCs in November 2022, the Permian DUC count has increased by 7 to 1,044.
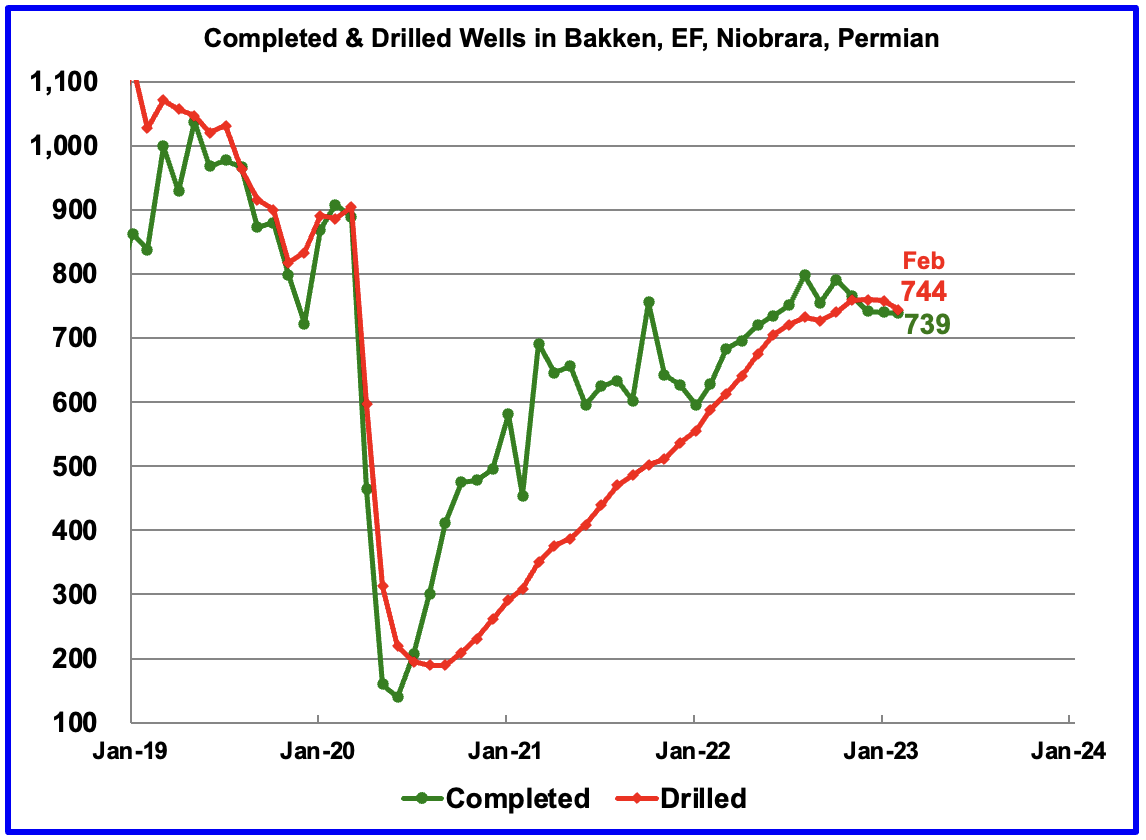
In these 4 basins, 744 wells were drilled while 739 were completed for a net increase of 5 DUCs in February.
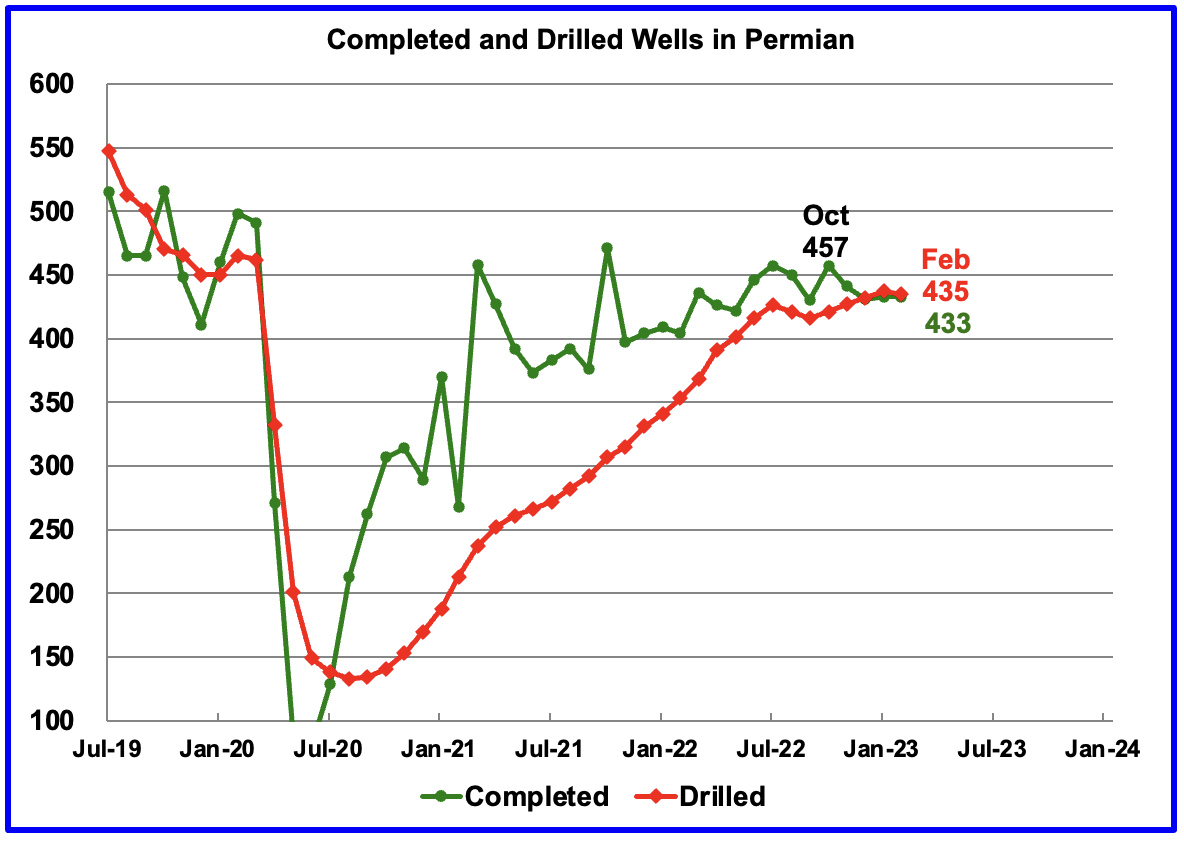
In the Permian, the monthly completion rate has been showing signs of slowing since the October high of 457. This is consistent with the frac spread chart shown above where there has been little growth in frac spreads since February 2022. The number of wells drilled in the Permian has been showing a slightly increasing trend since October but is now showing signs of plateauing at the 435 level.
In February 433 wells were completed, unchanged from January and 22 fewer than in October. During February, 435 new wells were drilled, a decrease 2 From January. The gap between drilled and completed wells in the Permian has now essentially vanished. This raises a question. Since the producers would be completing the best wells, does this imply that most of the remaining 1,044 Permian DUCs are Dead DUCs?
It also raises another question. Were those extra 2 wells that were drilled, DUDs that became dead DUCs?
February Light Tight Oil Update
The EIA’s LTO database provides information on LTO production from seven tight oil basins and a few smaller ones. The March 2023 report updates tight oil production to February 2023.
This is the seventh LTO report published since it was updated due operational issues. The current update has made significant Upward revisions to production reported in the previous February LTO report.
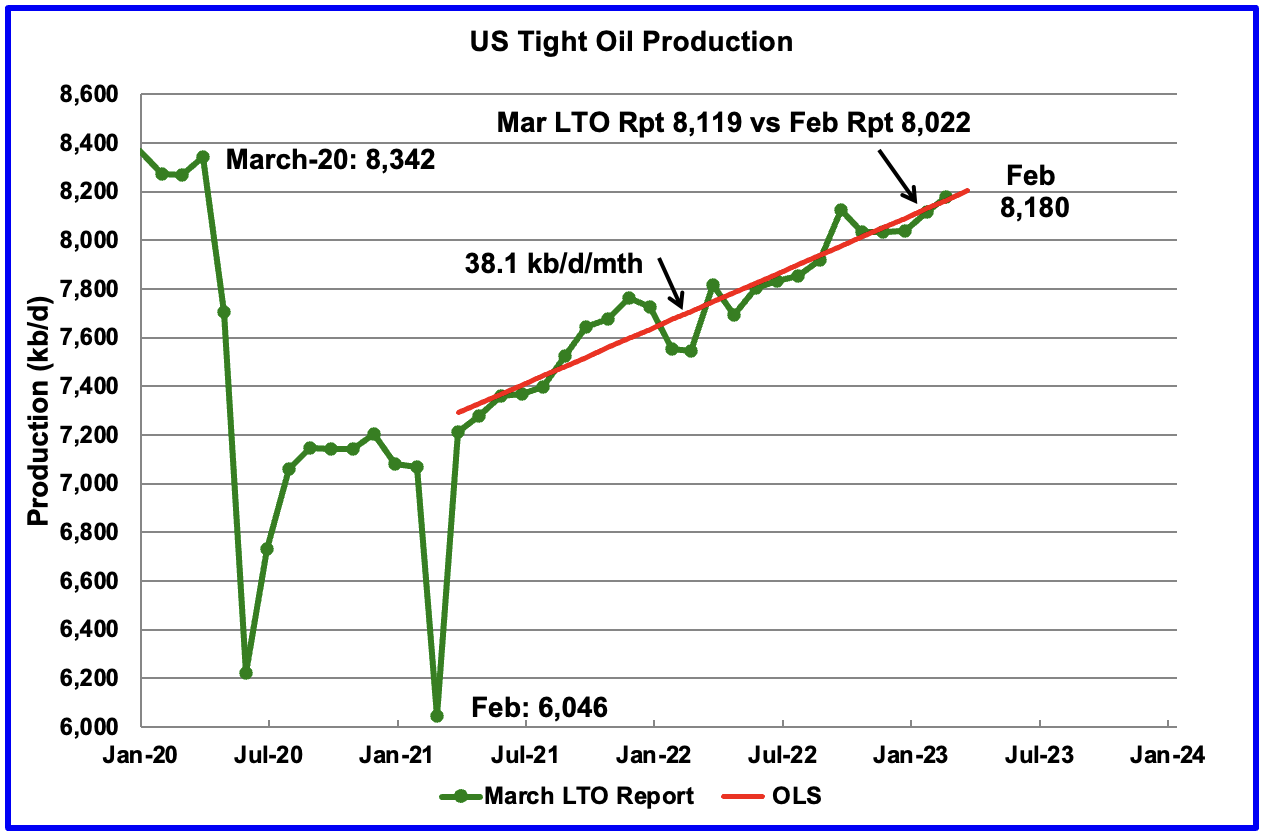
According to the March LTO report, February’s LTO output increased by 61 kb/d to 8,180 kb/d. However the January 2023 output in the March LTO report was revised up to 8,119 kb/d from 8,022 kb/d reported in the February report, an upward revision of 97 kb/d.
The red OLS line from March 2022 to January 2023 indicates a monthly production increase of 38.1 kb/d/mth.
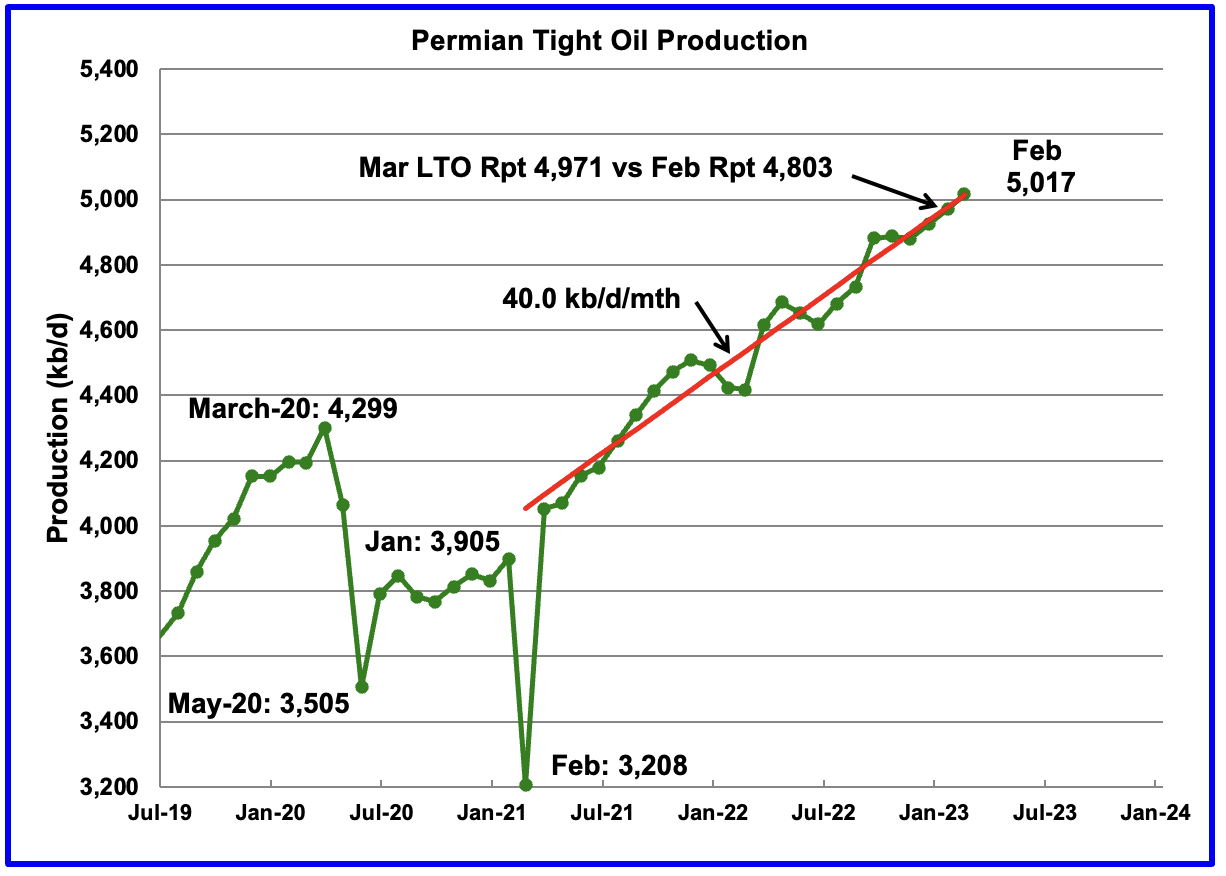
February’s Permian output increased by 46 kb/d to 5,017 kb/d and is 718 kb/d higher than the high of 4,299 kb/d recorded in March 2020. The January 2023 output of 4,803 kb/d in the February LTO report was revised up to 4,971 kb/d in the March LTO report, an upward revision of 168 kb/d. Most of the revision noted above for the LTO Total output is due to the Permian revision.
The red OLS line from March 2022 to February 2023 indicates a monthly production increase of 40.0 kb/d/mth.
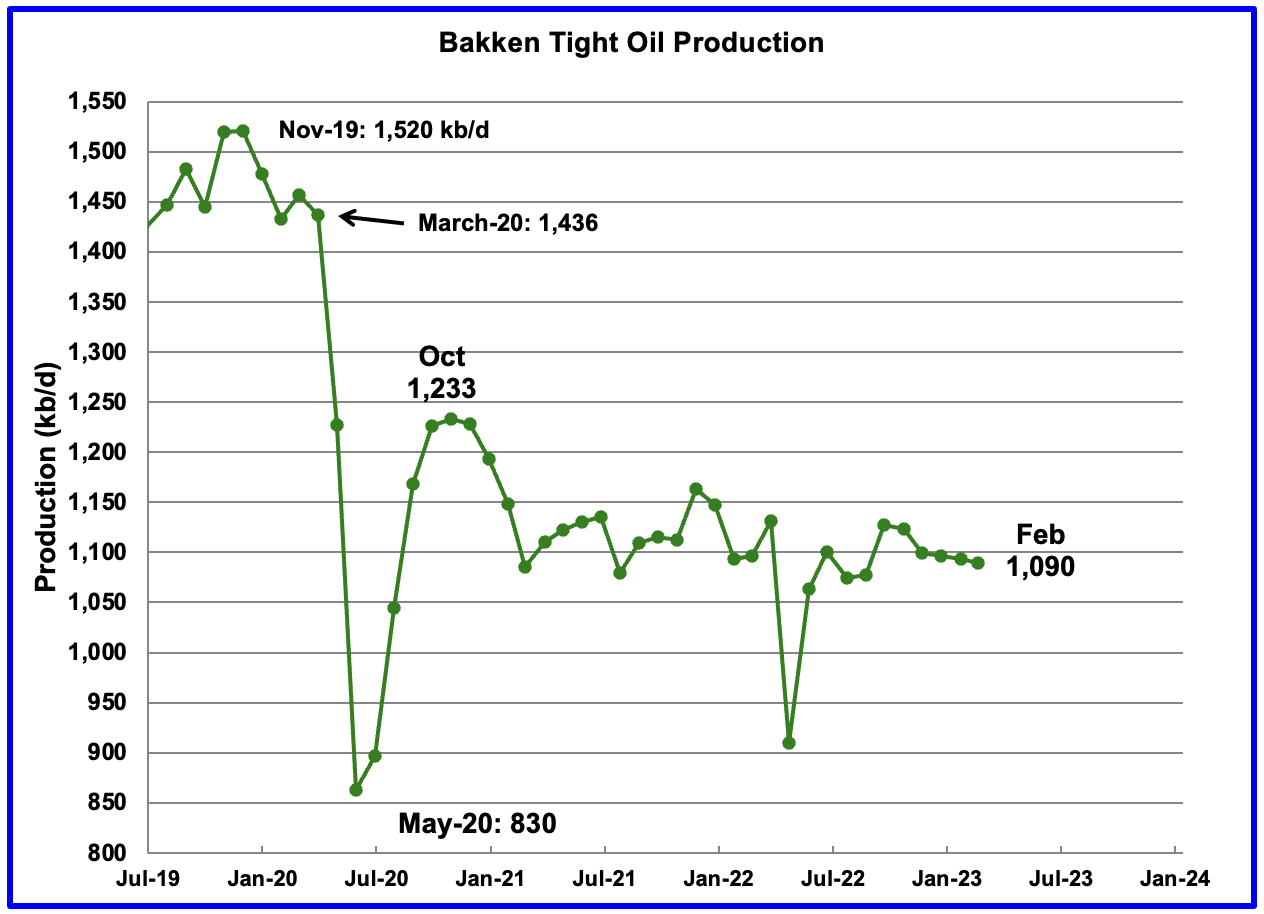
The Bakken’s February LTO output decreased by 3 kb/d to 1,090 kb/d. Consistent with the Permian basin’s output, last month’s January output was revised up by 40 kb/d.
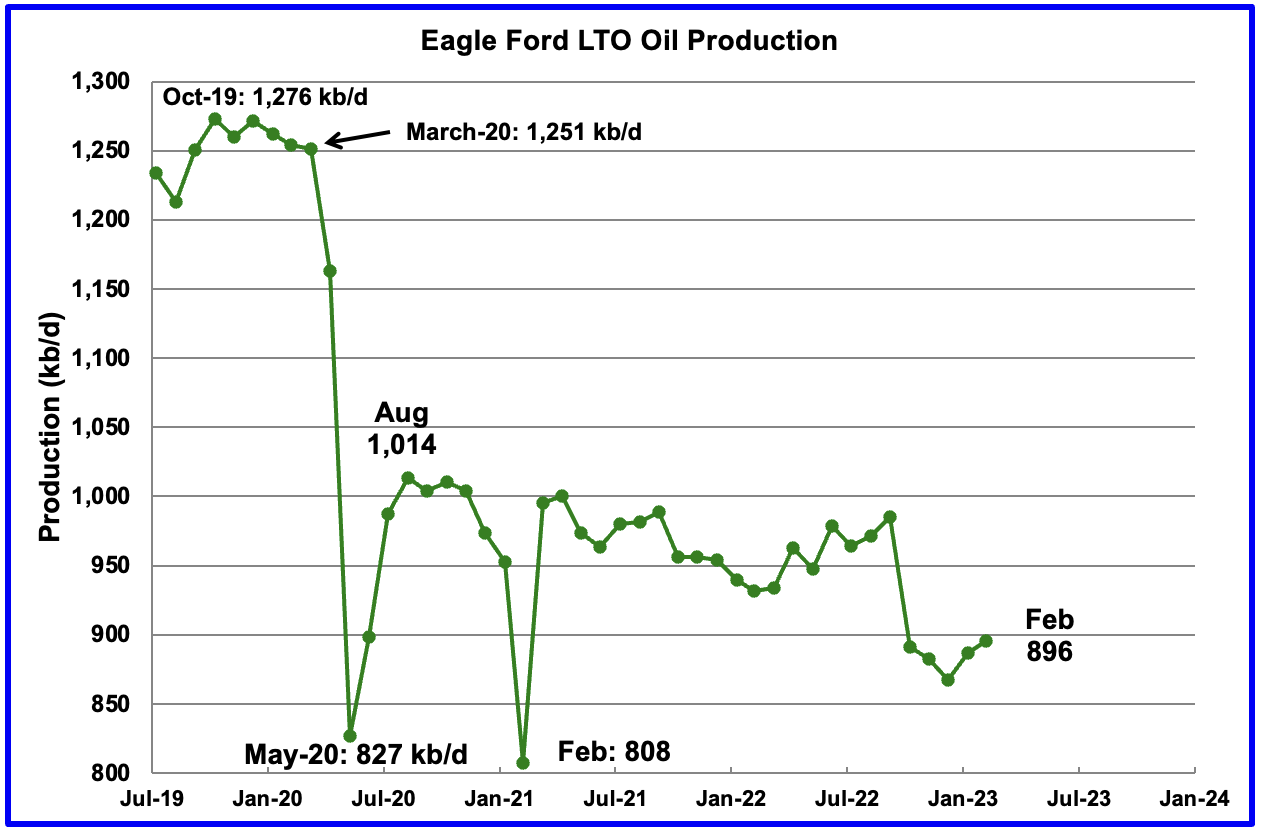
Production in the Eagle Ford basin increased by 9 kb/d in February to 896 kb/d and is now 118 kb/d lower than the post pandemic August 2020 high of 1,014 kb/d.
In February 2022, 45 rigs were operational in the Eagle Ford basin. By February 2023, the rig count had risen to 68.
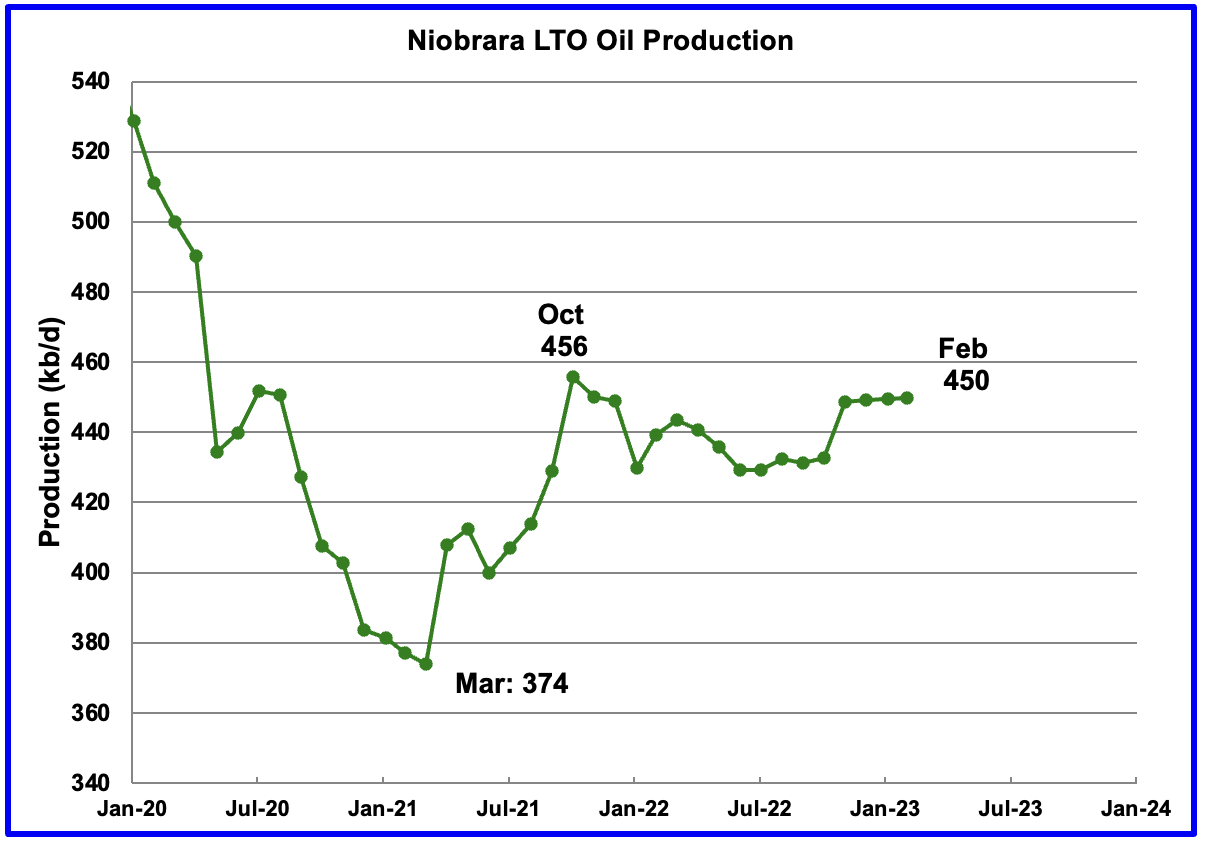
Production in the Niobrara since November has shown little growth. Output has been essentially flat at 450 kb/d.
Onshore L48 Conventional Production
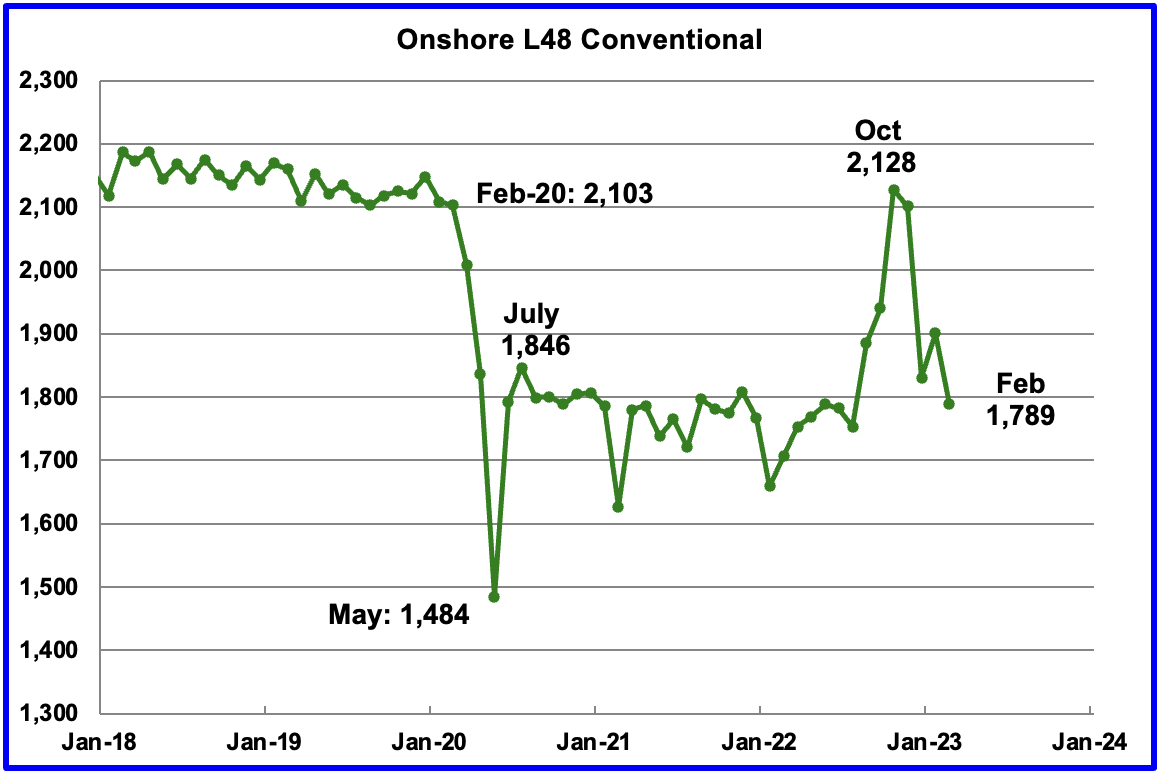
Conventional oil output in the Onshore L48 dropped by 112 kb/d in February to 1,789 kb/d and is more in line with estimates prior to July 2022. This estimate is based on a combination of the expected February LTO output and the expected February Onshore L48 output reported by the STEO.
The big production drop from October is due to ongoing major revisions to the monthly LTO report. Note that the conventional oil estimate comes from subtracting two large numbers and is quite volatile month to month due to revisions.
WTI
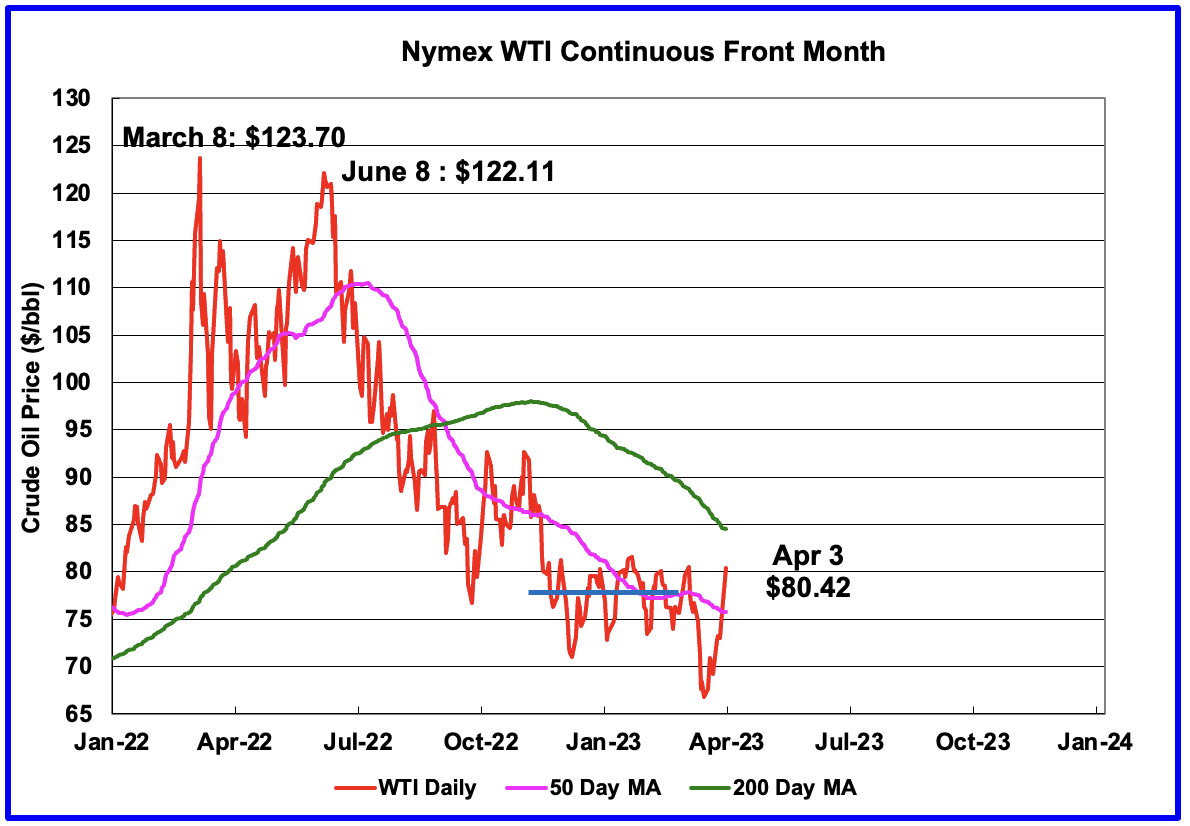
In the last post the following statement was made, “WTI appears to be making a strong bottom since the low of $71.02/b on December 9, 2022”. Then the Banking Crisis hit and a new low was established within a few days. On May 17th WTI settled at $66.74/b.
Following the banking crisis and oil price drop, OPEC +, over the April 1, 2023 weekend, shocked markets by announcing further production cuts of about 1.16 Mb/d. On Monday April 3, WTI settled at $80.42/b after adding a one day rise of $4.75/b. Is it a coincidence that the close to 1 Mb/d cut was set to offset the supposed 1 Mb/d buyback for the SPR which the administration had promised but then Energy Secretary Jennifer Granholm announced it would take years to happen.
The big question appears to be why did they do it now? If demand is strong, they wouldn’t need to cut. On the other hand, some think the financial side of the oil trade caused the price to drop due to fear of recession which led to traders creating a large short position. The production cut forced the shorts to cover.
It should be noted that OPEC’s current production of 28.9 Mb/d is 0.15 Mb/d above world demand for Q1 and 0.3 Mb/d above world demand for Q2. These are two typical week quarters. In Q4-23, OPEC is projecting demand of 30.1 Mb/d, 1.2 Mb/d above current reported February production. Maybe these estimates will be revised next month.
265 responses to “US January Oil Production at Post Pandemic High”
OPEC’s cut is likely going to backfire on them. You have an economy that wasn’t doing well before the cuts. An economy teetering on recession.
The cuts and added price might be enough to tip the economy right on into recession. I’d fade the hell out of this momentum driven rally. CTA’s exiting their shorts by buying doesn’t mean economy is doing well. It’s doesn’t mean any of the banking issues are fixed. It’s doesn’t mean China is fixed and coming to the rescue.
All this rally is, is some hedge funds being short squeezed.
For Goldman being all bullish on oil their CTA’s have about $30 billion in shorts. That they will be unwinding.
So what happens when you take out the shorts and everybody is long? Then some shock hits the economy or banking?
Oil goes to $25 when the longs are forced to exit their positions.
HHH
John Kemp
“The spreads imply traders were not anticipating a significant oversupply or a large increase in inventories prior to the OPEC⁺ cut. Following the cut, however, traders expect the market to become very tight later in 2023:”
https://mobile.twitter.com/JKempEnergy
That is the current view, for you to be right things are going to have to get much worse. While that is certainly not impossible right now that scenario is not being priced in. You’ve been on the oil price collapse wagon for some time, care to put a date on that $25 oil call so we can judge your accuracy?
Texasteatwo,
The only date HHH has been willing to give was March 2023, he has become a little gunshy about a specific date. Now it is “the future”, I expect that guess will be correct. My WAG would be 2040 for $25/bo WTI in 2022 US dollars (monthly average price), but it depends on many factors and I would put a 10 year window around that (2035 to 2045).
The front two contracts in WTI are still a few pennies in contango. How is that possible?
Why am I the only one that had to put a date on it? $25 is just a number. Maybe the real number is $35 or $45 or $55 or perhaps $15.
What’s your number? And date?
HHH,
I would guess $85/bo or higher for nominal Brent crude (monthly average price) by September 2023, about $80 for WTI, for Sept 2023.
Interesting, just a number, so you have revised your forecast, there will be a positive price for WTI in the future (25, 35, …, 500), I think you may have nailed it.
No I think the macro backdrop is bad enough to put oil at $25 dollars. Stop asking me when. Macro can take months to play out.
Absolutely everything is lined up to have another 2008 like recession. Bad economy plus bad monetary conditions. If it was just one or the other I wouldn’t be so bearish. But it’s both.
HHH,
I won’t ask again, the future is a long time, I agree at some point oil might get to $25/bo.
The when is where we might disagree, probably a 10 to 20 year difference.
I realize you said months and not years so maybe you’re with Hole in Head who expects $25/bo by 2025, I think this is nominal WTI and interpret this as a monthly average WTI price by December 2025, we could even give it to him in $2022 US$ (I think he made that prediction in 2022.) I would put the odds at less than 1 in 100 this guess will be correct.
I rarely get future oil prices right though.
Dennis – your prediction is a call based on huge economic shifts happening over a decade. HHH’s call was a much more short term call based on deteriorating economic conditions having very little to do with supply and demand. as HHH has been saying Macro conditions can take a long time to play out. In addition, we are talking about the largest bubble in human history. forever is a long time, even by your over-drawn standards.
Oil is down 32% from its June 22 high. It’s down 18.5% over the past year. If I recall, the “price” conversations with HHH took place last August, when oil was around $90, so a mere 11% drop from that. I’m old enough to remember a month ago when the banking system had a huge seismic jolt that sent oil from $80 to $65 – a drop of 19%. I could go on, but clearly few here will be convinced until well after this process has COMPLETELY played out. Economic data be damned! 🙂
Twocats.
The call HHH has made was for $25/bo. I don’t think this is very likely in the short term, now he is saying 25 is just a number, it could be some other number. I agree, the likely number is about $80/b, a recession might take us down to $60, continued growth perhaps $100. My point is that $25/bo is very very unlikely before 2035.
What is your expectation of what time period is needed for this to completely play out? From your comment it seems a decade is too long, is it 2 years, 5 years? I don’t need an exact date, give me a year or a couple of years window. It is not 2033, how about 2025 or 2027, a hint, thanks as I am not a reader of minds.
Dennis, commercial real estate is in deep shit. Most of the loans are on the balance sheets of the mid size banks that are already in trouble because of collateral issues.
There is a reason why Blackstone had $4.5 billion in withdrawal requests but only let $660 million be withdrawn.
Mostly likely scenario is $25 oil as this plays out. And let me make it clear. This isn’t what I want to happen. Based on all the info it’s just what is most likely.
HHH,
There are always potential problems, I just don’t think the macroeconomics will play out as you believe they will, we will know more in the future.
HHH,
What makes you think that when a recession comes, OPEC won’t cut production further and further. Oil is not just demand driven, there is also a supply side in economics. OPEC is not as dumb as you think, they are obviously putting a floor on oil prices as they don’t want a repeat of what happened during the pandemic.
If they don’t cut production during a recession or a depression, then we’ll see < $25 oil. And i agree with you. But i just don't see them letting that happen. OPEC+ is at war with the west.
HHH, I don’t know who will be right, I just follow the data. But I think there are several differences in the energy markets now as compared to previous economic cycles. Usually late in the cycle inventories begin to build, SPR’s have been filled, and production is high. That is just not the case at the current time. The Saudis just said you are NOT going to be getting any of our oil for less that $70 and many analyst think they mean north of $90 Brent. Now it is certainly a question as to their veracity but as I noted before they are in the drivers seat and we (and our allies) have few policy responses left. TO paraphrase Jeff Curry with goldman , OPEC has never had so much pricing power over the markets as they do now. I am betting we have seen the lows for the year outside of a major economic event. .
https://www.cnbc.com/video/2023/04/03/opecs-pricing-power-is-higher-than-it-has-ever-been-says-goldman-sachs-jeff-currie.html
to add a bit more commentary the metals are on fire this morning and the $ has broke below the support for a very clear head and shoulders topping pattern. While I like the action as it reinforces my world view I will wait a couple of week before saying I told ya so🖖
CHART OF THE DAY: OPEC is cutting oil production to defend much higher prices than ever before. The chart below, from
@GoldmanSachs
, shows the (nominal) price of Brent crude the Friday before any output cut announcement (collective or voluntary) #OOTT
https://mobile.twitter.com/JavierBlas/status/1643267338894974976?cxt=HHwWgICx3Ya8h84tAAAA
Texasteatwo,
Looking at real oil price data we haven’t seen the real price of oil (monthly average) fall below $25/b since Dec 1998 (except for the pandemic crash in April 2020), I think the odds of seeing a nominal monthly average oil price of $25/bo for WTI in the next 10 years are vanishingly small, Great Depression 2 might do it or WW3. I am hopeful we do not see either of these events in the next 10 years and preferably never.
I fully expect them to cut production again this year and probably 1-2 times next year. But in a deleveraging event. Which is my base case scenario. Going by what all the yield curves are telling us. It’s not going to matter. It didn’t matter in 2008.
they cut 2.2 million barrels in early 2009 and oil did start to go up right on those screws. but that was AFTER oil price had fallen, and the fed was also slashing interest rates and firing up the QE printing presses.
https://money.cnn.com/2008/12/17/markets/oil/#:~:text=OPEC cuts 2.2 million barrels,17, 2008
the landscape is much different now with inflation still so high and the fed still raising rates. i do agree that cutting production too much would be akin to warfare.
According to this link, sales of combustion engine passenger vehicles has probably peaked.
https://www.visualcapitalist.com/combustion-vehicle-sales-peak/
More interestingly, the sales numbers are currently at about 69m vehicles. The question is whether the number of combustion engine vehicles on the road has peaked.
I don’t know the exact numbers, but there are roughly a billion vehicles on the road, and their life is roughly 14 years. So roughly 70 million are taken off the road each year. That is about the same as the number of new combustion vehicles.
This suggests that the number of combustion engine passenger vehicles on the road has peaked. So it looks like oil demand from them has probably peaked as well.
Of course, EVs are taken off the road each year as well, and make up part of that 70 m. But only small numbers of EVs are taken off the road, because they currently make up a tiny minority of the vehicles on the road.
These numbers may seem odd in rural America. A third of the new car market is China, and the Chinese are paddling as fast as they can to switch to EVs. This will cut their oil imports and increase their car exports. Since China is probably the world’s biggest oil importer, the Saudis will have noticed.
HHH
Where did you get the info that GS has $30 billion in shorts that they will be unwinding.
As of this morning the Trend line for oil was $82.70. I think TTT also mentioned $82 as a number he was seeing as a “break out” type number. As of 6:15pm the price stands at $80.88. I typically like to see “confirmation” of 2-3 days, but certainly if oil closed ABOVE $82, I would imagine anyone shorting anything oil / energy related would hasten their unwind.
I still whole-heartedly agree with HHH about pretty much everything related to current economic conditions, but if I’ve learned one thing from 15+ years of watching markets – do not fight the signal no matter how much an asset class “should” do something. I imagine TTT will be celebrating with something stronger than tea if that happens and I will admit I was wrong and that he called it should oil recapture bullish trend. Let’s do this! 🙂
When oil prices really start heading down it won’t be because hedge funds and some CTA’s are shorting it. It will be because the longs are selling.
And why will the longs sell? Because they will be forced to. In illiquid markets. Again these markets are bought up with leverage.
When the credit gets turned off it’s lights out. OPEC can cut all it wants and prices will still fall.
Credit comes from commercial banks not the FED or other central banks btw.
I wouldn’t make money short selling unless there are these bear rallies where everyone thinks the “bottom is in” or whatever bullshit they are selling on CNBC, Fox Business, Bloomberg or whatever. there’s been no relief rally in Russell 2000, or financials, or REITS. 7 companies are responsible for 90% YTD gains in markets. so I could really care less what dennis thinks. I’m posting because this shit is so obvious it’s a weird perverse pleasure in frolicking in this knowledge while most people here are like “But OPEC cut!!” please please please buy energy so I can sell it to you!
More commentary on Opec cut, I don’t wish to beat a dead horse, but since it parallels my “rant” in part that shows the comments were not entirely political but rather sober analysis.
“Or maybe the market is a lot stronger, and China was merely masking its economic recovery precisely to inflict the most damage not only on shorts, but the Biden white house. In a time when the multi-polar world order is breaking down and virtually every nascent superpower (or just plain old “power”) is taking on the senile 80-year-old in the White House, this is certainly a credible scenario.”
https://www.zerohedge.com/commodities/opec-succeeds-nuking-crude-oil-shorts-puts-100-brent-horizon
The myth of the “dead DUC”.
The drilling and completion of tight oil wells should be thought of as a production line with drilled but uncompleted wells as what could be termed work in progress on a production line. It takes time to complete a well after the drilling phase is finished so tight oil producers want an inventory of drilled wells to be ready for the completion process when completion crews become available. Typically this is in the range of 4 to 5 months of inventory for the current completion rate, so the roughly 1000 DUCs in inventory for Permian producers represents between 2 and 3 months of the current completion rate (2.4 months). In short, there are either no “dead DUCs”, or likely very few. Note that people were claiming there were 3500 dead DUCs in the Permian basin back in June 2020, obviously that was wrong by about 2500 DUCs. If there are “dead DUCs”, the count might be 0 to 100 rather than 1000. Note that if producers want 4 months of DUC inventory, recent completion rates of around 430 wells per month implies a build in the DUC inventory is necessary to 1720 DUCs in the Permian basin an increase of 676 in the DUC count. I am not going to claim that the “dead DUC” count is negative 676.
Real oil men that have actually worked on these types of wells can correct me as I might be wrong.
Dennis, I must disagree. Dry holes, or just “not enough oil to be profitable” has happened thousands of times in the history of the oil industry. Do you really believe that shale wells are an exception?
‘DUCs’ Are Goosing Oil Companies’ Booming Profits. What Happens When They Run Out? Bold mine.
In late October, U.S. oil and gas producers posted some of their best quarterly results in years.
ExxonMobilXOM +5.9%, for example, posted a third-quarter profit of $6.8 billion, and Chevron earned $6.1 billion — a stunning turnaround from losses of $680 million and $207 million, respectively, a year ago.
They didn’t accomplish the blow-out earnings by drilling more. In fact, they spent less on new drilling in the third quarter. Exxon’s capital spending fell to $3.9 billion from $4.1 billion.
SNIP
U.S. producers are completing DUCs at record rates, outpacing new wells by almost 250 a month, according to an analysis by Raymond James & Associates. In July 2020, companies had about 9,000 DUCs on their books. Today, that number is about 3,300. The 6,000-well drawdown in 16 months is the largest in history.
But not all DUCs are created equal. Many of the wells drilled before 2019 are now classified as “dead DUCs” because their contributions are irregular. DUCs that are still viewed as viable candidates was just 2,370 in September, which was the smallest inventory since early 2013.
That’s 930 Dead Ducs. Hey, if most of them were drilled before 2019 and are still Ducs, there has to be a reason. But let’s look at pure reason. There is no reason that some drilled wells were deemed not profitable to complete. Why would that not be the case? In the history of the oil industry, there have been thousands of dry holes drilled. There is absolutely no reason that this should not be the case for shale wells.
Ron,
Lets look at the Permian basin specifically and keep in mind that we do not know the drilling date of the wells that have been completed. Lets say for simplicity that producers follow a first in first out type of mentality when drilling and completing wells, so the first wells drilled are the next in line to be completed, in the past 3 months there were 1304 wells drilled in the Permian basin. I would suggest that most of the 1044 DUCs in the Permian were drilled in the past 3 months. There may be a few wells that have been drilled that will be low performing wells, but most of those have been completed and either have been producing at low rates or they have been shut in because they are no longer profitable to produce.
One can casually look at other plays besides the Permian and consider the ratio of DUCs to completion rate and find that the DUC inventory in all plays minus Permian basin is about 6.93 months at the Feb 2023 completion rate, for the Permian basin the ratio is 2.41 months. There are not 1044 “dead DUCs” in the Permian basin, that is nonsense in my view. There might be 5 or 10, difficult to know, probably the number is close to zero.
Ron also keep in mind the people who wrote that article were not oil men they were journalists. Perhaps there might be a few dead DUCs in other shale plays, but the very low ratio of DUCs to completed wells in the Permian basin suggests there are fewer dead DUCs there.
Of all 38199 horizontal wells drilled in the Permian basin as of Aug 2022 (from Jan 2007) only 632 of the wells had been plugged (1.65%), a few of these may have been “dry holes”, but most of the 632 likely produced oil for some period and perhaps were poor performers and were not worth continuing to produce when there was a pump failure or other downhole repair needed and were plugged after 5 or 10 years.
Also during the early period of the Permian tight oil play there were a much higher percentage of wells that were poor producers. By about the end of 2014 the play had been better defined and a far lower percentage of wells drilled were poor performers.
See
https://novilabs.com/blog/permian-update-through-august-2022/
Lets say for simplicity that producers follow a first in first out type of mentality when drilling and completing wells, so the first wells drilled are the next in line to be completed,…
There is no reason to make such an assumption. In fact there is every reason to believe that would not be the case. It just makes sense that drillers would complete the most promising wells first and leave the least promising wells for last.
At any rate, I am not an oil man. Therefore I must take the word of what the industry is telling me. Like in the following article.
EIA: Number Of DUCs Falls To Lowest On Record Bold mine.
With more than 4,000 DUCs still active, it may seem like there is little cause for concern, even with losing nearly 50% of the DUC inventory since the beginning of last year. But that DUC count has long been debated. Not due to the accuracy of the figure itself, but because wells that remain in the uncompleted phase for more than two years are considered dead DUCs.
Most analysts agree that 95% of all wells drilled are completed during the first two years. That means any wells still left uncompleted after that time are extremely unlikely to be completed—ever.
Back in June of last year, Rystad Energy estimated that the total number of live DUCs was just 2,380—that was when the EIA had estimated the overall DUC count was more than 6,100. Since then, the total DUC count, per the EIA, has dropped by 1,827, or 30%. Assuming that the majority of those that were completed were live, that leaves U.S. shale with precious little to frack.
The method with which the EIA calculates DUC wells has been called into question well before the dwindling fracklog.
Ron,
You can believe what you wish. I think the dead DUC meme is nonsense. If we take the numbers from the Oil Price article (again, I think Geiger is a journalist not an oil person) it suggests that in Feb 2023 there would be a total of 1115 DUCs that are “live” in all US shale plays. with a Feb 2023 completion rate of 971 so an inventory of 1.15 months for DUCs for all US shale plays. If you believe that, I have a bridge to sell you in Brooklyn…
Also it occurred to me that if the Permian DUC count is accurate at 1044 (and a 2.4 month inventory based on Feb 2023 completion rate) and we deduct this from the 1115 DUC estimate based on the Oil Price article you linked for all shale plays in Feb 2023 we are left with 71 DUCs for all plays minus the Permian basin in Feb 2023 for a completion rate in those other plays of 538 wells in Feb 2023. That implies an inventory of 71 DUCs for 538 completed wells or 0.13 months.
A simpler explanation is the 2 year rule for Dead DUCs is simply wrong and the Rystad estimate from June 2021 is wrong.
I would suggest that anything that you read in OilPrice.com you do so with great care. Few of the posters have any real world experience and much of their work is copy and paste from elsewhere. Whether that is journalism is open to debate. There are a number of posters who do there own work, David Messler for one, but the majority are just would be hacks with sod all idea. The usual suspects are widely quoted. EIA, IEA, Rystad, WoodMac etc are mentioned as if they were the gospel. Like some others on this blog I am extremely cautious about about these entities because first they are out to sell their wares, the IEA is now effectively behinds a paywall, and the likes of S&P, Argus, WoodMac and Rystad are out to sell reports for $ zillions, and secondly they dare not rock the boat with bad news – it is all dumbed down. The worst people to believe are the management consultants – truly clueless and stuffed full of MBA’ s who simply read all the consultant reports and make ever more wild asummptions. ( Show us your watch and we can tell you the time. )
Stephen Bowers,
Do you have an opinion on the “dead DUC” claims made by Rystad and others? I think it is not well founded based on comments Mr. Shellman has made, but I might be remembering incorrectly.
Dennis, I do not think there is one sinlge explanation here. Some holes will have been drilled and that on logging may indicate a poor prospect. The shale reservoir is not homogenous and will vary. The logging will identify the best locations of a cluster frac. Adjacent wells may be indicative of productivity. The oil business is based upon cash flows, always has done, and always will do. Looking at some of the published data on ROI is rather eye-wateringly lousy ( in my business we would not accept this). I suspect the DUC’s are therefore graded working on the best first principle, as is always the case. The lower grade wells will be graded as to the likely return on investment $, and may never be completed. What the cut off point is will be much down to the well owner and what assetts he will have at his disposal and what money is available to pay for the completion. Completion costs will vary in terms of number of cluster fracs, amount of sand, flow back water disposal, expected oil and gas production and the cost of marketing the oil and gas. There are so many variables that you just cannot generalise. Remember cube drilling? That was supposed to save costs and boost productivity – where is it now? Rystad will not be completely wrong and will not be completely right either. This is why I hate consultants.
Stephen Bowers,
Thanks for the reply, I agree with most of what you said. No doubt the operators estimate what a drilled well will produce when completed and I understand that there is wide variability within any tight oil play as far as individual well productivity. My guess is that since 2016 or so the prospective acreage (or rock volume as there are many horizons in most plays) has been fairly well defined and would expect that very few wells have been drilled since 2016 that will not be worth completing at $80/bo and $3.50/MCF at the wellhead. Also consider that the options are a 3.5 million loss on a drilled well that is never completed vs breaking even by spending another 4.5 million to complete the well and at least get your 8 million back, once you have the sunk cost on the drilled well the choice is between zero profit and negative 3.5 million ($8 million D&C assumed for the example). I think this may be why Mr Shellman once commented that the dead DUC meme seems kind of silly.
You mention frac clusters helping to decide on completion, but the fracs happen during the completion process, so we wouldn’t have much information on fracs, unless you are talking about adjacent wells. As Mike often says it is dark down there and much is not known, if the wells are properly spaced (at least 600 feet from the nearest lateral) fracs from adjacent wells might not tell us much, though productivity of nearby wells would certainly influence the decision on whether to complete the well.
Though one might ask, if the nearby wells were dogs, why drill another well nearby?
Stephen…I agree with your comment about OilPrice postings.
Same applies to many other sources of info quoted here on energy and political matters.
Zero Hedge for example.
One of the most important skills that people can have these days, and that most perform miserably at, is the ability to identify factual information and the ability to separate fact from opinion, from speculation, and from politically or financially motivated biased analysis.
You can’t trust anyone to do this mental sorting for you- not the editor, not the producer, not the preacher, the newscaster, the lawyer, the CEO, the AI program or your friends.
Can you find reality? Can you spot when you are simply being manipulated to someone elses agenda.
I thank Dennis for working hard to keep this site focused toward the search for reality in the energy sphere.
Hickory,
Thanks. I have biases as well, difficult for humans to be objective as we all have a point of view which influences how we understand what we read. That is why a variety of viewpoints is useful from my perspective.
Ron,
Chart below from
https://novilabs.com/blog/permian-update-through-august-2022/
Nice chart Dennis. But I do not understand the connection to ducs, especially dead ducs. The article is all about completed wells. Ducs are not mentioned anywhere in the article. I found the below chart, from Pioneer Wells, interesting.
Ron,
We assume a DUC is a dead DUC because if completed it won’t produce enough to be profitable, the chart shows the percentage of completed wells with different levels of production. Note also that nobody knows what a DUC will produce until it is completed. Mike Shellman has mentioned in the past that no sane oilman would drill a well and not complete it eventually (and sooner would be better).
Note also that nobody knows what a DUC will produce until it is completed
No Dennis, that is simply not the case. Damn Dennis, you know better than that. We have been over and over this for a decade now. You know they take samples before they frack. And you tell me they simply ignore them even if they tell the driller he will get very little if he completes the well?
When the well is drilled, before it is fracked, the driller has samples from the well. He can tell from the samples of the the rock just how much oil he can expect to get from the well if fracked.
Mike Shellman has mentioned in the past that no sane oilman would drill a well and not complete it eventually (and sooner would be better).
Well, I don’t remember ever reading that. But then I don’t read all the posts anymore. I would love to hear Mike S explain his reasoning here. I simply cannot believe any man would complete a well if his samples showed he would get hardly any oil if completed.
Ron,
I think there is more to tight oil wells than you understand. Many of these wells have 10 thousand foot laterals, 2 miles. There are no dry holes, they always hit some oil in the rock. How well the oil will flow depends on the fracture network, both already existing and future fractures that happen during the completion process, these can not be predicted accurately in advance, this is not the simple poke a hole in a pool exercise you are familar with, it is 100 to 10,000 times more complicated than that. So what you think you know about this is very far from reality.
No samples show there will be no oil, there are no dry holes, especially today when the sweet spots are well defined, in the early days when the sweet spots were being delineated there might have been some. Nobody spends 3 to 4 million drilling a dry hole, there are more and less productive wells and that is only determined once the well is fracked.
Dennis, let’s call a truce here. Ducs are just not that important. US production, if it has not already peaked, will peak soon. The US, as I have said befoe, is now just a bit player in this peak oil story. Sure, it was very important in the last decade because of the shale boom. But that is over now and US production will likely plateau for about a decade now. Either that or decline.
World peak is my primary interest.
Ron,
Tight oil will play a small role in determining the World peak, I am just correcting the record on the “dead DUC” meme, there probably are few dead DUCs, its an arbitrary category created by journalists looking for clicks on the pieces they write, there is nothing special about 2 years, especially when a pandemic intervenes. In the Permian the drilling inventory is at historically low levels (2.4 months) and the number of dead DUCs is likely zero to 5. In other basins there might be a few, I tend to focus on the Permian because that’s where most of the growth is happening.
Dennis, we must agree to disagree on this point. Throughout all shale basins, there are several hundred DUCs that will never be completed unless the price of oil goes above $150 or so. But neither of us can prove our case, so we will just have to leave it there.
Thanks for the interesting exchange.
Yes Ron I agree we do not know the number, but we have very different estimates on how large the number of dead DUCs is. There are no doubt a few, but keep in mind that it takes typically 3 to 6 months from drilling to first flow for a tight oil well. In some setups with multiple wells on a pad the process waits on a set of 4 to 6 wells to be fracked so that they come online at nearly the same time which can extend the lag time.
A large inventory of DUCs is needed to keep the process moving forward. In the Permian basin in particular there are about 1000 DUCs with a Feb 2023 completion rate of 430, about 2.4 months of inventory. It is doubtful that many of these Permian DUCs are “dead DUCS”, and certainly not 100 of them. Note that a typical well inventory from Jan 2016 to Sept 2018 was about 4 to 6 months more than the most recent monthly completion rate, today’s level is less than half that inventory. Perhaps there are 100 dead DUCs in the rest of the shale plays, impossible to determine. My expectation is that at $100/bo the number is in the single digits for all shale plays.
Hi Ron,
I was wrong, I had misinterpreted what Mr. Shellman had said in the past. He let me know that dead DUCs are not a myth and that there may well be a 1000 or more dead DUCs out there.
I am surprised the number would be that high. There are about 3400 total DUCs in the 5 major tight oil plays (EIA estimate) so if 1000 of these are dead, then the DUC inventory is quite thin, a level of about 3 months for the 5 major tight oil basins.
Dennis, thanks for the info. I am not at all surprised.
Another way to look at DUCs is to consider the ratio of DUCs to current completion rate which I call DUC inventory in months of current completion rate. The chart below looks at the historic inventory levels from Jan 2016 to Feb 2023, currently we are near historic lows for that period (low was 4.47 months in Oct 2022.) Currently we are at 4.92 months as operators have chosen to increase the drilling rate perhaps because the DUC inventory was getting too low. The Permian basin is at 2.41 months of DUC inventory a very low level, if the count is accurate.
WAHT THE HECK DENNIS AND RON, I will give you my two cents.
Early in the resource plays the big operators often using minor players as front operators would drill a vertical well, case it and complete it in several zones that had potential horizontal applications. I know this because I watched it happen in real time in Okla. They would make a “crappy well” but they would produce it and evaluate over time. that is how they mapped out the play if there were not sufficient previously drilled wells. IN the mean time they were building their lease positions again often using other names so to not draw attention.
To be clear in the early days, could some of the operators drill a well and case it knowing that it might not produce, sure that could happen, although I have never seen that myself in any of my work. What is more likely is that a company has a contracted drilling rig and wants to keep it, either they have a favorable cost agreement OR perhaps they are afraid they can not get another rig on a time frame they want. Other factors may be their cap ex budgets. Lets say you have X money to spend and that will drill and complete 10 wells or 25 DUCS. Let’s also say you guided the street to a certain production level and you can use your DUC inventory to increase or keep steady your production to meet your guidance. There is a lot going on in this area. It is not black and white. I know for a fact that these companies manage their businesses using DUCS. I would put the idea that these companies drilled a well and cased it and thought it might NOT produce on the lowest possible rung of the reason why there are DUCs in the business.
To those who might disagree, a sports analogy might be appropriate. Let’s say you got a guy who played two years high school football and he believes that gives him the knowledge to call into a sports talk show and tell the world a head coach in the NFL doesn’t know what he is doing. It happens all the time, the question for you guys is who do you believe.
Just my 2 cents.
Texasteatwo,
The DUCs referenced by the EIA are horizontal wells only rather than vertical wells. Let’s try a straightforward question, do you believe there are hundreds or thousands of horizontal DUCs that are so-called “dead DUCs” that will never be completed? I believe Mike Shellman has said in the past that not many businessmen would spend 3 to 4 million to drill a well and then leave it to rot. I believe Mr Shellman is likely correct.
Dennis,
“The DUCs referenced by the EIA are horizontal wells only rather than vertical wells.” yes I realize that Dennis, the point I was making is the the industry was evaluating the extent of the plays using vertical wells. That is when they would run a full whole core, evaluate the thickness the brittleness, the oil or gas content etc. They did not do that with the way more expensive horizontal wells.
“Let’s try a straightforward question, do you believe there are hundreds or thousands of horizontal DUCs that are so-called “dead DUCs” that will never be completed?
to your question not I do not. but i have not evaluated every play out there but I do not believed anyone would drill and case any well without the intent to complete it. hope that helps.
I almost left out another very important reason for a DUC’s. Sometimes industry will drill a well but does not have the immediate ability to transport the the products, ie pipelines. Or they have pipelines but do not like there terms of use and may build their own pipeline. Like a say it’s a bit more complicated, but I cannot imagine a reason where after drilling you would case the well if you were not going to complete it. If it did not come out like you hoped, you would just Plug it.
not many businessmen would spend 3 to 4 million to drill a well and then leave it to rot.
This reminds me of what Alan Greenspan said about the crash of 2007. He couldn’t believe that banks would expose themselves to so much risk.
“Those of us who have looked to the self-interest of lending institutions to protect shareholders’ equity, myself included, are in a state of shocked disbelief,” [Greenspan] told the House Committee on Oversight and Government Reform.
https://www.nytimes.com/2008/10/24/business/economy/24panel.html
The assumption that all businessmen always know what they are doing is doubtful at best. Maybe it’s just me, but I can’t remember a single project in my career where nobody made a mistake. In my experience, mistakes are so common in business that managers spend most of their time fixing stuff.
Considering the frenzied drilling and the incomplete information about geology and the market, abandoned wells don’t seem all that unlikely.
Alimibiquated,
Perhaps there will be a couple of DUCs that do not get completed, 100s or 1000s is quite unlikely. Typically these operators have maintained a 3 to 6 month inventory of DUCs, during the pandemic the inventory ballooned temporarily as completion rates plummeted, but now inventory levels are inline with historic levels and in Texas and New Mexico the levels are well below historic levels at about 3 months or less. Probably not very many dead DUCs in those two states especially if oil and natural gas prices rise as I expect they will to $80/bo and $3/MCF at wellhead.
Dennis
Something has changed regarding the use of DUCs. Looking at the DUC charts in the post, in January 2020 there were 3400 DUCs in the Permian and the completion rate was 500/mth, or roughly 7 months of backlog. Looking at the latest February data, there are 1,044 DUCs and the completion rate is 433/mth for a cycle time of 2.4 months.
One possible explanation is OPM. There may have been a lot of that back in January 2020 and it was used to drill extra wells giving false hope to investors. In today’s environment where cost control and returning cash to investors is the new norm, the supply of OPM is tighter and requires a more disciplined use of cash resources.
The only oily basin where DUCs are increasing is the Niobrara. Something is unique there.
As noted in the post, the gap between drilled and completed wells in the Permian has now essentially vanished. We need some info from some Drillers or Framers on the typical time between completions and drilling.
Ovi,
Yes things have changed at lot especially in the Permian see chart below, in 2016 to mid 2018 the inventory of DUCs hovered around 5 months completion rate. Lately it has been about 2.4 months, that is a big change.
Permian DUC inventory with pandemic values off scale (high of 45 months).
Ovi,
I found the following from Jan 2023 on lag times between drilling and completion
https://www.spglobal.com/commodityinsights/en/ci/research-analysis/drilled-but-uncompleted-wells.html
Befor the pandemic the average time beween drilling and completion was about 6 months, but during the pandemic the average lag rose to about 10 months, recently the lag time has fallen to about 8 months (data from Jan 2022 through August 2022.) see first figure in blog post linked above.
There is also this older article from the EIA (June 2021.)
https://www.eia.gov/todayinenergy/detail.php?id=48537
Dennis
As noted above something has really changed in the Permian. With 2.4 months of DUCs, the cycle time must be down to less than 2.4 months, assuming a few of those DUCs are dead.
Ovi,
It may be that they are doing just in time well manufacturing to save on costs, I would note that the Eagle Ford also has a low inventory of about 3.6 months. Maybe there are a lot of frack crews available in Texas and New Mexico and the companies in those two states don’t feel the need to maintain a large inventory of DUCs. Note that this is not the case for the Haynesville (in Texas and Louisiana) where the DUC inventory is about 10 months, and also in the Niobrara (about 6 months inventory) and the Bakken (7 months of inventory). My guess is that there are fewer dead DUCs in the Permian and Eagle Ford, but it would be interesting to hear from people who know more than me.
https://www.worldoil.com/news/2023/4/3/u-s-shale-unlikely-to-fill-gap-left-by-surprise-opec-production-cuts/
“There’s not a coordinated response that comes out of here,” said Brendan McCracken, Chief Executive Officer of Permian basin producer Ovintiv Inc. “We’re now into several years of players like us running these businesses for returns and free cash flow, and that’s not going to change in the short term or the long term.”
The golden age for small producers with legacy production may have arrived. Shallow and Mike should be happy, it will come with higher societal cost such inflation, but I think that is where we are at.
Texasteatwo,
Supply from non-OPEC producers that are not a part of OPEC plus may increase if oil prices remain at $80/bo for WTI for an extended period, especially if natural gas prices follow the futures curve and get back to $3.50/MCF we might see higher completion rates in US tight oil plays. Lately completion rates in Haynesville, Marcellus, and Utica plays have plateaued so we may see shale gas output increase more slowly at current low natural gas prices ($2/MCF).
Ovi,
Thanks, great work.
The frac spread data is very interesting, do you have a link to where you found it, or are you a subscriber to Primary Vision?
Note that on the Bakken January estimate for the DPR this is total output from the Bakken region in both North Dakota and Montana, nearly all output in those two states comes from the Bakken region (Williston Basin), and total C+C output in January 2023 from those two states (ND and MT) was 1110 kb/d fairly close to the DPR estimate of 1089 kb/d for the Bakken region (about 2% too low, which is not bad for a model). Looking at historical DPR estimates vs PSM data it looks like about 22 to 23 kb/d on average comes from outside the Williston basin in North Dakota and Montana so the DPR may be quite close to the PSM estimate for Jan 2023 for the Bakken (1110-22=1088 vs 1089 in DPR).
Dennis
Thanks
As I mentioned in the post, I wasn’t sure how useful the results would be since most of the participating oil experts already know what is happening in the main counties that are shown in the two tables. So no, I am not paying for info that may not be useful to me.
I meant to link Primary Vision to their database in the post. I forgot and have updated the post so that Primary Vision is now linked. Scroll to the bottom of the page and download the SQL or CSV version. I used the CSV version. After looking at many of the files I finally got to one that I thought would be useful, registryupload_3.csv.
Thanks Ovi.
I will check it out.
Ovi,
This seems useful for determining completions in various plays, but after October 2022 the data seems incomplete at least compared to the DUC spreadsheet estimates for completion rates. I focused on the Permian basin for completion rates.
Dennis
I agree that the DUC sheet is more up to date and more useful. The most useful info out of this table is that it shows that 50% of the Fracs occur in the Permian. I was hoping there would be info showing primarily Oil fracs vs NG fracs
The data in the attached tables covers the period Feb 25 to March 3, same as in the post. I don’t understand your October 22 comment. The database is incomplete because it only shows completion Start and End dates. I downloaded another data folder yesterday and the number of frac spreads increased. Not sure on the extent of the time lag.
It is unfortunate that the database does not include the basin. However by doing an internet search, a column for Basin was added to the file for a few of the bigger basins. Attached are two tables showing the break down by the bigger basins.
Table 1: Basin vs County
Ovi,
I looked at the data by month for Permian basin completions (this can be done by sorting on state and county) and we know the counties for the Permian basin from novilabs Permian posts. For the Permian basin the numbers match for Sept 2022 and Oct 2022, but for Nov and Dec 2022, and Jan and Feb 2023 the completions for the Permian are less than the DUC spreadsheet. To me, monthly data is more natural than weekly data and I wanted to compare completions with DUC spreadsheet. I think the EIA might be using a model for the most recent few months of data, but there may be proprietary databases that have this information.
Sept 2022-431 completions in Permian vs DUC 430
Oct 2022-468 completions Permian vs DUC 457
Nov 2022-388 completions Permian vs DUC 441
Dec 2022-368 completions Permian vs DUC 431
Jan 2023-362 completions Permian vs DUC 433
Feb 2023-207 completions Permian vs DUC 433
This is what I mean by incomplete data after October 2022, also possible the DUC spreadsheet is wrong for data after Sept 2022.
I will check back in a month to see how the data has changed.
Dennis
I have sent you an email.
Table 2: State vs Basin
Ovi,
I think you might mean Montana for Bakken (rather than Colorado), for Pennsylvania, Ohio, and W Virginia (Marcellus and Utica) they would be natural gas and the unknown in Texas plus Louisiana would be Natural gas (Haynesville shale). Wyoming and Colorado would be the Niobrara (oil) and Oklahoma (Anadarko) might be a mix of oil and natural gas frac crews. No Permian basin in Oklahoma, New Mexico and Texas only. See DPR spreadsheet that lists states and counties for various shale plays.
Garfield County in Colorado is in the Niobrara play, Major County in Oklahoma is in the Anadarko play, Yoakum County in Texas is part of the Permian Basin, Webb County in Texas is part of Eagle Ford, Divide and Dunn Counties in North Dakota are part of Bakken. The Colorado and Wyoming Counties would all be in the Niobrara, Counties in Pennsylvannia, W, Virginia, and Ohio would be part of Appalachia shale gas plays, Oklahoma would be Anadarko, other Texas and Louisiana counties would be Haynesville shale gas play. Everything else would be other plays (Powder river, Fayetteville, etc).
Dennis
Thanks
I will look at focussing on the oil plays. However that is getting tricky because many of the oil plays are getting gassier.
There is a Garfield County in Montana also. When I saw Garfield I added Permian. I failed to notice the Colorado next to it.
Ovi,
Yes that is a problem, in many cases there is both oil and gas produced, but some plays such as Marcellus, Utica, and Haynesville are almost exclusively natural gas (with some NGL and condensate). Other plays such as Eagle ford, Permian, Niobrara, and Anadarko are indeed quite gassy and becoming more gassy as time goes on (as the region suffers from pressure depletion).
The truth behind the curtain on the DUC calculation on a basin basis .
https://www.oilystuffblog.com/forumstuff/forum-stuff/quack?origin=notification
On refilling the SPR, I think there are limitations for withdrawing and filling, when the administration promised to refill, they may have believed that Congress would be ok with not selling another 26 million barrels from the SPR, but they were incorrect. They might not be able to refill until the withdrawals are complete at the end of June 2023. It was a dumb policy to drain the SPR in the first place in my opinion and also dumb policy to drain another 26 million as Congress has mandated.
Perhaps the rest will be held for a true emergency as was originally intended.
I agree it was a stupid policy to use the reserve when there was no emergency condition.
Another huge American error has been to drill the hell out the Bakken and Permian over the past decade.
That action should have been spread over 3 decades, but we generally have no plan or coordinated action
when it comes to developing the nations natural resources.
So often this country runs around like a chicken with it head cut off.
Hickory,
Yes there is a strong belief in the US of the magic of the market and general distrust of government intervention in markets, though the release of oil from the SPR was exactly that a government intervention.
It is not clear that government planning of oil production would yield better results than private enterprise. Though perhaps better enforcement of spacing rules and restriction of natural gas flaring might have led to less waste. Also not having changed the rules on crude oil exports in 2015 might have led to a more gradual development of tight oil resources, this may have been another government blunder (but one that was fully supported by many in the oil and natural gas industry.)
I would like to point out that Elinor Ostrom won the 2009 economic prize in honor of Alfred Nobel for empirically showing that solutions other than those usually promoted by economists (that is to say private ownership and government regulation) frequently solved the so called “tragedy of the commons” problem in a superior fashion than the commonly promoted solutions. The better solutions were not unique but followed two general rules in order to attain success:
1. Those exploiting the resource made the rules.
2. Those exploiting the resource were in charge of enforcing the rules.
Schinzy,
I think market solutions are imperfect and need government oversight to take account of externalities, but I am not familiar with that work as I have been out of the economics game for a long time, sometimes better social policy is difficult to institute under existing institutions which are often slow to change (particularly in the US, perhaps in Europe such policy might be more easily instituted). Unfortunately the US constitution was written in a way that makes significant change nearly impossible, we have a system that is conservative by design, it is why we are stuck with 19th century policy in the US.
Hickory and Dennis,
Hindsight is 2020. A year ago, the West was applying sanctions, oil was sky rocking and no one knew what was going to happen to Russian production. After April of 2020, one could make a case it would be heathier for the oil industry to have an extra 100 million barrels of spare storage. America could in force a 55mph speed limit and save a million barrels a day. But we don’t. America is going to produce records amounts of oil for the next 10 years. What kind of emergency are you looking for that the SPR is going to make a real difference. It’s not. We have 10 years to change our ways and the Biden administration is trying to point the ship in that direction.
Huntingtonbeach,
I respectfully disagree, selling the oil from the SPR was a dumb move, I believed it at the time and believe it now. Much of the oil produced by the US (the 8 Mb/d from tight oil) cannot be utilized by US refineries, we have the capacity t handle about 5 Mb/d, that is it, any excess is simply exported. Most of the US refinery capacity was designed to handle heavy grades of crude oil (most of World output is heavy oil or extra heavy oil). US C plus C is likely to peak in 2028 and then decline rapidly as tight oil plays run out of profitable drilling locations, so we have more like 5 years not 10 years. Perhaps a drained SPR will not be a problem, but it is nice insurance to have and dumb to have drained it when not necessary.
“If you give a man a fish, you feed him for a day. If you teach a man to fish, you feed him for a lifetime.”
“but it is nice insurance” Not really, it’s like buying a $1000 life insurance policy for your young children’s college education on yourself. Do you think if it was a $600 policy it would make a difference?
“likely to peak in 2028 and then decline rapidly as tight oil plays run out of profitable drilling locations, so we have more like 5 years not 10 years.” Now your sounding more like most of the doomers here. The world is not going to come to an end the day after peak. It will most likely take 5 years for everyone to agree the tight play has peaked.
“(the 8 Mb/d from tight oil) cannot be utilized by US refineries, we have the capacity t handle about 5 Mb/d, that is it, any excess is simply exported. Most of the US refinery capacity was designed to handle heavy grades of crude oil (most of World output is heavy oil or extra heavy oil).” This statement just doesn’t even seem relevant. Instead of saying “simply exported” you could have said simply exchanged. Not sure your point.
California has one of the largest reserves for heavy oil in the world, second only to Venezuela.
https://www.researchgate.net/figure/General-map-of-California-showing-the-location-of-the-oil-and-gas-fields-and-of-the-major_fig1_273693761
If commenting to SPR releases helped unite the West against Russian tyranny. It was well used.
Huntingtonbeach,
The release from the SPR was not needed, only a small portion of the 200 milion barrels sold (about 30 million barrels) was part of a coordinated release with other nations, that’s fine, the other 170 million barrels was stupid.
You claim we produce plenty of oil, but much of it cannot be used in our refineries. In a situation where we need the SPR for whatever reason, selling crude oil exports only helps us if we can find imports to replace those barrels, you assume they can be found, in a situation where the SPR is needed, that may be a bad assumption.
Here is what the decline in the tight oil plays may look like.
After 3 years output would be down by 1000 kb/d and down by 2000 kb/d after about 5 years, the decline will likely be evident after 1 year, 2 at most.
I agree the peak won’t be the end of the World, but claims that we have plenty of oil for several decades are wrong in my opinion.
California proved crude oil reserves are 1.7 Gb, US input to refineries is about 5.8 Gb each year, so California proved reserves would take us about 3.5 months. Of course CA output is much lower at about 122 million barrels per year, about 2% of the typical yearly crude input to refineries (122/5800). The SPR is at 371 million barrels and we import about 6 million barrels of crude per day, so we have enough oil in the SPR to last for 62 days.
“California proved crude oil reserves are 1.7 Gb, US input to refineries is about 5.8 Gb each year, so California proved reserves would take us about 3.5 months.”
You make my point for me, the SPR is a false sense of security. Also, you make the same mistake Ron does. There is a lot of oil out there that are not proven reserves. California has more oil than Texas. 20 years ago tight oil wasn’t a reserve either.
I also see 10 years of production as high as today in your graph.
The real answer is getting off the addiction.
Huntingtonbeach,
Only the oil that is profitable to produce counts, there is a difference between resources and reserves. You are correct that there might be 10 years of tight oil at today’s level or higher, but we still can only refine about 5 Mb/d of the tight oil and that probably won’t change, as Mike Shellman has pointed out it would be better to conserve our resources and not export them. The SPR is nice to have for the 62 days we might need it, saving tight oil resources for use in the US might also be sensible.
I agree using less oil is the best approach, but it will take some time to achieve, probably more than 10 years.
HB –
CA Proven Reserves were 5.0 GB in 1990, 3.0 GB in 2010, 1.5 GB in 2020…the peak was 1985
What’s your point….? CA oil production will continue it’s decline, not sure what the heavy oil is going to do for anyone…CA oil production nears zero around 2030 (+/- a couple years).
Anyone who actually thinks the SPR get’s refilled….geez not sure what planet they are living on, we likely tapped into because we had no other options to meet national demand. As we’ve discussed refineries need a certain balance to the quality of crude product input…we are starting/continuing to scrape the bottom of the barrel…
Dennis,
“nice to have for the 62 days we might need it”
Well we all know what 62 days of a college education gets you, flipping burgers. Monday night this week Tucker Carlson went on a rant about how the SPR is arguably the most valuable asset the United States has. At the time, mine first thought was that’s why TTT bought up the subject last week. Then the next morning you bring the subject back up. I wasn’t going to let it go without posting. Then later in the day TTT admits below he watches Tucker. No surprise for myself from someone who links to Zero Hedge.
“Only the oil that is profitable to produce counts”
Regarding proven reserves, what is profitable changes by the day. Unproven resources are the feed stock for proven reserves. Know one knows exactly what’s out there, but for sure there is a lot. Making your above comment is kind of a type of tunnel vision.
Not exporting or the masses driving 55mph just isn’t realistic today. The truth is oil is just to cheap today to take conservation serious. I’m actually pleasantly surprised how much of the world is moving toward decarbonization. I tried to bring to your attention last week that maybe we have reached peak demand, but your canned response seemed like you were blowing me off. I think we’re closer to it than you think. Thanks for the Tesla link on the non oil side.
Huntingtonbeach,
I do not think the World has reached peak demand for oil, perhaps we are close in the US, it seems like demand for the main liquid transportation fuels in the US (gasoline, distillate fuel, Jet/kerosene fuel, and residual fuel) is in decline. Oil prices are determined more at the World level and I think demand for these fuels at the World level will continue to grow for another 5 to 10 years. Just my take, I am often wrong. You’re welcome for the Tesla Master Plan, part 3 link, I though it was interesting.
I agree the 60 mph speed limit idea won’t work and it is not likely we will stop exporting crude oil, though I have changed my position and believe that it would be good policy on security grounds, probably part of the reason the crude export ban was put in place in 1975 and should have never been lifted. I can see exporting oil to Canada and importing heavy oil from them, and perhaps to Mexico and Venezuela where barrels can be exchanged (for each barrel exported to a nation a barrel is imported from that nation).
I’m pretty conservative on use of saved resources, and debt accumulation.
When it comes to the SPR, I’d only use it for emergencies,
hoping that it never needed to be tapped.
If we had no domestic tight oil and the Arab countries set up another embargo against us…
that would have been a good reason, as an example.
And if we see episodes of higher petrol product prices that aren’t catastrophic related,
then the government should restrain from intervening in the market. It is good for the country to adapt to much higher fuel prices. That is the real world and it serves as incentive to conserve fuel, insulate buildings, and install more efficient mechanisms such as heat pumps and higher mileage or electric vehicles, for example.
But I don’t own it.
EIA on SPR drawdowns legislated by Congress
https://www.eia.gov/todayinenergy/detail.php?id=50476
Regarding GOM production. The EIA’s lower than expected prediction for February-2023 is pretty consistent with their revised update from last month. Ovi – you showed that in your comments from last month. So, I don’t think that the EIA has any insights regarding the Vito startup.
Regarding the EIA prediction that GOM production will steadily drop between March-2023 and October-2023. I can see that without there being more than normal facility downtown. The absolute drop is not that much. If you take out October as a hurricane-impacted month, the drop is only from around 2 mmbopd to 1.8 mmbopd.
I guess you could argue a 10% drop is pretty severe – from 2 to 1.8 in 6 months or so. I would flatten that decline a bit,, maybe going from 1.95 to 1.85,,
Thanks Bob,
So the EIA’s STEO is perhaps a bit on the pessimistic side in your view for its GOM forecast, if I am understanding you correctly, in other words 5% rather than 10% decline.
And 5% may even be too steep over such a short time window. Maybe Vito’s ramp-up will tend to offset other declines, and production stays pretty flat.
Bob Meltz,
That had crossed my mind, but you are the expert (along with Mr.Kaplan) on offshore oil, I figured you had already taken Vito into account.
Ovi,
Thanks for the post and the presentation of data.
I think OPEC cut in anticiptation of weaker demand. They are being proactive now rather than reactive. Just my opinion.
Agree. Its about optimizing their stream of income, as best they can estimate.
Iron Mike
I tend to agree that they see weaker demand in Q2-23. However they see a rebound in Q3 and Q4. Will have to wait to see if their view changes in the next OPEC update.
I see the OPEC move as providing support for $80/b oil and sending a message to the shorts. As they say, killing two birds with one stone.
TexasTeaTwo
The problem with democracies is that they have scruples that lead to unintended consequences.
I agree that the Khashoggi scruples have been costly. I don’t know why B’s advisors didn’t look ahead and advise him to say nothing. Note the WH reaction to the OPEC increase was to downplay the move and didn’t add gasoline to the fire.
The OPEC decision is obviously Saudi-driven and is a direct smack in the face to Mr. Biden and Senator Blumenthal, who wrote a bicameral action to stop selling sensitive arms to the Saudis in October 2022 after the OPEC reduction in oil production. This came after Mr. Biden’s campaign words that he would make “Saudi Arabia a pariah state.” Even when he visited MbS in Jeddah a few months ago to ask him to increase production, he made it clear that he really wished to talk with the king, MbS’s father, who is at this time reportedly in the deep morass of Alzheimer’s in his mid-eighties. That had to really sting.
Okay, so MbS is upset. Really upset. Enough that he is willing to poke a sharp stick in the eye of the president of the United States. Everyone always points to the meeting of FDR with the old Saudi warrior King Abdul ibn Saud onboard the USS Quincy in Feb, 1945, in the Bitter Lakes regions of the Suez Canal, where they formed a bond that has stood the test of time. I think that deal has been busted. And that’s really important.
Why? Well, the price of oil has little to do with it. The tacit (handshake) agreement onboard the Quincy was that the U.S. would be the preferred buyer of Saudi oil and in return the U.S. would protect the House of Saud–which at the time was a primitive place indeed. Through the years that arrangement worked. The House of Saud actually used the Bush residences as a comfy place to bunk. It was a cozy arrangement and the U.S. protected the Saudis and we really were the preferred customer. The U.S. possessed unquestioned hegemony and the Petrodollar was king.
Well now, it would appear that MbS looks upon Asia as its main buyer (they’ll take the Yuan instead of the Petrodollar). But the arrogance of MbS may well get him and his “family” in trouble.
With this latest move in the face of inflation and a depleted SPR, the Biden administration would appear to be out of bullets. The singular “bullet” is to again bring Senator Blumenthal’s bicameral bill before an irritated Congress, cut off the selling of sophisticated weapons to the defense installations in the KSA. This would be devastating, because the infrastructure is about 60% American–and other missile systems won’t work. The KSA would be vulnerable.
This latest move, on top of the sanction on Russia and a resurgent Iran, has made oil the weapon of the world once again, and a lot hinges on just how angry the Biden administration really is, and just how strongly Congress wants to support Ukraine and defeat Putin in a proxy war. Russia has an inferior missile defense system, and the parts won’t work on the elaborate defense infrastructure the U.S has set up in the KSA. The UK has supplied a lot of defense to the KSA, and so has Canada–but as allies–and they’re out if the U.S. is out. For the first time since Feb, 1945, the House of Saud could be put in a tribal defensive posture. They may have built the biggest Gulf Coast refinery, and bought the Georges Cinq, and Citibank, and half of London and Paris, but if they antagonize the Biden bunch enough, they will pay one hell of a price.
This could be the biggest power play since the embargo of the seventies. No one can predict the price of oil in these circumstances. Because it totally depends on what happens to rebuke this power play. In other words, the price of oil depends not on shale, but on potential sanctions imposed on the new Saudi arrangement with Xi and Putin. MbS’s actions imply not just anger, but total disdain: For shale. For Biden. For selling SPR oil to China. I’m a Republican, but I’m pulling for Mr. Biden to respond in some fashion. Because if he doesn’t, there goes the Petrodollar and in comes the new hegemony currency: the Yuan (probably backed by Gold).
wonderful commentary Gerry, I put you right up there with Coffee as to the poster here that I can learn a thing or two from. No wasted ink high value👍 you might like;
Robert F. Kennedy Jr
@RobertKennedyJr
The collapse of U.S. influence over Saudi Arabia and the Kingdom’s new alliances with China and Iran are painful emblems of the abject failure of the Neocon strategy of maintaining U.S. global hegemony with aggressive projections of military power. China has displaced the American Empire by deftly projecting, instead, economic power. Over the past decade, our country has spent trillions bombing roads, ports, bridges, and airports. China spent the equivalent building the same across the developing world. The Ukraine war is the final collapse of the Neocon’s short-lived “American Century.” The Neocon projects in Iraq and Ukraine have cost $8.1 trillion, hollowed out our middle class, made a laughingstock of U.S. military power and moral authority, pushed China and Russia into an invincible alliance, destroyed the dollar as the global currency, cost millions of lives and done nothing to advance democracy or win friendships or influence.
Gerry to your point regarding materials to support “green energy”.
Ryan Maue
@RyanMaue
·
55m
“VP Harris and Janet Yellen have each made high profile trips to Africa, including Zambia, under guise of fighting climate change on the continent.
The real reason is cobalt 📈 not drip irrigated organic peppers 🫑🌶
U.S. urgently needs rare earths.”
few have the capacity or courage to acknowledge your points, valid as they are. There are clearly people here that have the intellectual capacity to argue that using slave labor, using child labor is worth it if it mean affecting climate change, they just don’t have the stones.
That is why I don’t think it has anything to do with climate change, it ‘s more political and like all politics there are winners and losers. In the case, rich white elite europeans and Americans and Chinese win and poor people of color lose. Does not seem like anything changes when it come to Democrats, it almost like its 1863 in Mississippi.
TexasTeaTwo
I think it is best to put Robert F. Kennedy Jr on IGNORE.
“I think it is best to put Robert F. Kennedy Jr on IGNORE.” ovi do you think the press will?
Robert F. Kennedy Jr. files paperwork to run for president as a Democrat
https://www.cnn.com/2023/04/05/politics/robert-kennedy-president-democratic-nomination/index.html
Gerry
I think this would be the dumbest thing the US could do, “The singular “bullet” is to again bring Senator Blumenthal’s bicameral bill before an irritated Congress, cut off the selling of sophisticated weapons to the defense installations in the KSA.”
You know what they say, keep your friends close, keep your enemies closer. Now that China has brokered a deal between SA and Iran, cutting off SA would just push them into Russia’s and China’s sphere of influence.
The big killer would be if Saudi started to accept more Yuan for their oil. Part of the USS Quincy Feb, 1945 deal was that oil would trade in US dollars. As you imply keeping the petrodollar is critical.
US reaction is smart. Downplay the move and don’t add gasoline to the fire.
https://energy.economictimes.indiatimes.com/news/oil-and-gas/us-shrugs-off-saudi-led-oil-production-cut/99229748
Ovi, “You know what they say, keep your friends close, keep your enemies closer.”it may be a bit late for that.
https://www.washingtonpost.com/opinions/2023/04/04/saudi-arabia-opec-oil-production-cut/
This is just my ramblings but what I see, is a world watching the USA leap from one crises to another. Jump from one foreign policy blunder to another, little cohesion between US parties on large foreign policy issues. Over time that has a price and now we are seeing it. Forgive me OVI, sometimes we miss the forest because of the trees, one of our longest and best historical allies has now turned to our competitors, partly for pragmatic reasons, as long as our government policy is to get rid of oil as a fuel, why in the hell would they pay attention to what we say. It is now russia china and OPEC standing against the US and european green energy interest. Care to wager who will win the battle of ideas 🤔
How much of Saudi’s sovereign wealth fund is denominated in dollars? It would make sense for the Saudi’s to make sure those dollars retain their value.
HHH here is another view, what if they charge more for their oil in dollars and then convert those dollars into real assets. Tucker Carlson’s opening monologue tonight addressed the consequences of Washington policy to take other government owned assets in including dollars reserves when they feel aggrieved. How many times can we do that before NO one wants to hold dollars anymore?
Let’s entertain the idea of a big move away from the dollar. Is that positive or negative for the dollar?
It’s the exact opposite of what everyone thinks. Say If supply of dollars drops say 25% is that positive or negative for the dollar? If the supply of Chinese yuan or RMB increases by 25% is that positive or negative for the dollar. If they both happen at same time is that positive or negative for the dollar?
Russia might not hold treasuries anymore but Eurodollars are still flowing freely in an out of Russia. Understand the US dollar isn’t the world’s reserve currency. The Eurodollar is. Yes they are both dollars but they are absolutely separate.
Take it a step further. Is a move away from the dollar in trade a positive or negative for oil? Not what everyone is going to think. Any move to use the yuan or RMB as currency of settlements will crush the value of their currency. Demand = printing currency out thin air. Well backed collateral but still. Is Brazil going to buy Chinese debt with their excess yuan? China’s capital markets just aren’t anywhere near deep enough. And no gold doesn’t work. Try going to the Chinese central bank an exchange yuan for gold. You’ll be told no.
Eurodollar was never meant to be a store of value. It’s a medium of exchange.
The people pumping this dollar crashing narrative don’t even understand how the Eurodollar system actually works. They have no idea what they are talking about.
https://www.bloomberg.com/news/articles/2023-04-09/macron-says-europe-must-develop-its-own-autonomy-separate-from-us?leadSource=uverify%20wall
Klieber , maybe Xi mixed something in Macron’s tea that he is singing a different tune . 🙂
Between 1999-2020, 96% of world trade was invoiced in USD, and in 2021, 88% of world trade was PAID in USD. Daily forex transactions was 6.6 trillion dollars in 2019, of which 88% was in USD. Daily purchases of oil are about 8 billion USD. When oil is traded in other currencies, those currencies need to be exchanged for dollars in order to settle the invoices. This keeps the dollar strong. Is this not the fundamental meaning of a reserve currency?
I welcome any and all correction to these numbers and reasoning!
Russia seems to have a pretty good missile defense system
https://tass.com/defense/1362271?utm_source=google.com&utm_medium=organic&utm_campaign=google.com&utm_referrer=google.com
I think it is time for the us to let go of the reigns of power and start power sharing. The US is behaving like a parent competing with their children. It’s a disaster, the US seems completely resistant to listening to any non Western voices.
Yeah, that’s not how failing empires work, bud. You’re supposed to go out kicking and screaming into irrelevance/thermonuclear war.
I expect the forthcoming Fallout TV show adaptation to become a documentary at this rate.
30 thoughts between 7.45 am and 11.45 am . That was fast . OPEC sure rattled the cage . It is getting interesting .
Ovi’s post on the Ovintov buy out on the last thread .
https://peakoilbarrel.com/eia-short-term-energy-outlook-and-annual-energy-outlook-2023/#comment-755229
Mr Shellman’s view . Separating the wheat from the chaff .
https://www.oilystuffblog.com/forumstuff/forum-stuff/please-dear-god-let-ovintiv-s-check-clear?origin=notification
It gets interesting . Azerbeychan media report .
https://www.azerbaycan24.com/en/more-countries-may-join-oil-production-cut-official/
Pioneer Permian Well Productivity For DUMMIES… It Ain’t Get’n Better… LOL
While the TUG of WAR will continue here at the PeakOilBarrel between the Contrarians and the Bullish Forever Shale Proponents, things are not looking good for the Shale Industry.
You will notice that Pioneer’s well productivity, even with larger laterals and gobs more fracking sand, is falling FLAT ON ITS FACE as cumulative first 6 month production is heading in the WRONG DIRECTION…. lower.
This is no surprise as we continue with FRACKING ON STEROIDS with 3-mile laterals. Furthermore, we are now seeing 3-mile laterals in the Bakken as Hess has completed several in just the first month of 2023.
I say… go ENERGY TOOTH FAIRY.
steve
https://doi.org/10.3390/en13082052
Physical Scaling of Oil Production Rates and Ultimate Recovery from All Horizontal Wells in the Bakken Shale
Paul,
They have also done a paper using the same methodology for the Permian which Mike Shellman pointed out about a year ago.
This may have been posted before, but I missed it if it was. A good read imo.
https://blog.gorozen.com/blog/why-wont-energy-companies-drill
Excerpt:
When you think about the challenges now being faced by the industry in these terms, you can easily see why oil company executives would keep the pace of development subdued. On the one hand, you could increase activity, risk attracting the ire of policymakers, have your stock price go down, and deplete your irreplaceable asset. On the other hand, you could return capital to shareholders, stay under the radar of policymakers, have the market reward your capital discipline, and keep your Tier 1 assets for a later time when the market will better value them.
Dennis, the article makes serval very valid points, and contrary to Steves ” analysis ” below the industry can/ will keep “oil” production “flat” for a considerable time. It makes absolute NO sense to flood the market with oil, drop prices while at the same time the input cost continues to rise. It really is that simple.
The doomerism regarding the “end” of shale is bullshit. My go to description is we are in the 4th inning of this game regarding oil and the 2nd inning regarding nat gas.
Texasteatwo,
I think when people claim the end of shale, they mean the end of increases in output, so consistent with an assumption of flat output. The article points out that tier one locations are limited and we might have trouble maintaining output with less productive wells in tier 2 and lower locations. Also oil prices will need to remain high enough to maintain profitability, perhaps over $100/bo, this might speed the transition to other types of energy and reduce demand for oil.
We may also see natural gas prices rise as LNG makes natural gas more of a global market, that could lead to more rapid deployment of wind and solar as they will become cost competitive over a greater area as natural gas prices rise, eventually this may lead to less demand for natural gas as demand for natural gas power plants wanes and as people switch space and water heating to air and ground source heat pumps.
I agree this will all take some time perhaps 20 years.
Dennis brings up a valid point in regards to Shale Companies holding onto Tier 1 locations because they just don’t have a lot of them remaining. While some companies, like Chevron, haven’t BLOWN through their Permian Undeveloped Reserves, the largest producer, Pioneer, is the exact opposite.
Pioneer only has 50,133 net acres of Undeveloped Acreage vs 805,744 Developed Acreage.
Also, if you look at the Pioneer’s Permian Leasehold acreage, it has already developed most, which shows up as the DARKER COLOR in the area.
steve
Remember, developed acreage is generally a two-dimensional statement. It does not reference or represent other zones that are undeveloped under the same surface footprint.
In Pioneer’s acreage fairway there are currently ~six independent zones that respond well to a frac and produce Tier 1 results. They don’t overlap consistently and have differing fairways of Tier 1, but they are there and are expanding. In many areas, they are starting over in a new zone as if no wells have ever been drilled on that acreage.
I am under wells on a medium sized Howard County tract, for example. The operator was about 50% developed in the Wolfcamp A last year as their only target. Now, with three good Lower Spraberry wells on and around the acreage, they are starting over developing the Lower Spraberry as if a well had never been drilled on the tract. A completely new zone, which would make your map above nearly blank. Other zones in the Wolfcamp are also looking good, but need more time and science.
So, that map does not represent the true three-dimensional potential development story. Pioneer has many more locations left that are missing from your post.
That’s just it, there’s no way to know what the actual resource base is down there until it’s all drilled through. Could go another twenty years or twenty months til it drops off
Gunga,
To your point about many hydrocarbon horizons beneath the same surface acreage …
Pioneer is now targeting the Barnett and Woodford on their leases. (4 wells so far, I beleive).
As per their latest conference call, Sheffield said other companies have also started drilling the Barnett with – seemingly – some success.
Javier Blas
@JavierBlas
·
2h
OIL MARKET: Three consecutive weeks of >10 million barrels crude + refined products stock draws in the US
See good commentary here from Ryan Maui.
https://mobile.twitter.com/RyanMaue/status/1643670129845182464?cxt=HHwWgIC9lcnRvs8tAAAA
teaser:”President Biden and most other Dem politicians plus UN Secretary General are getting heavy backlash from world’s leading climate scientists for “misleading and unhelpful” rhetoric and misinformation on climate change.
Dangerious “doomerism” causes mental anxiety and suicidal or homicidal thoughts in vulnerable children and adults leading to a range of outcomes including ecoterrorism. ”
I bring this up in the context of what the Opec did. After The president claimed he will end oil use, make a pariah state out of Saudi to placate his green base who have now been brainwashed into believing the world is going to end in 2,3,4,5, years what ever the number is today, we now get a taste of the repercussion of that. This is not a political rant, all leaders have a responsibility to tell the truth. The truth is we in the US are going be using oil for decades. We may keep our demand levels from growing faster over the next few years but the demand will grow. This also applies to most large industrial economies including China and India. Just a fact. That is just the best will be able to do. This slowing DEMAND GROWTH will done with higher prices rather than energy substitution in my opinion. Again why is Warren Buffett taking large position in oil companies if he saw this any other way, ditto for Cupperman.
Javier Blas
@JavierBlas
·
57m
Either the White House thinks we are heading into recession, and oil prices will plunge in 2H 2023. Or they are way too blasé about the impact of the OPEC output cut. Or maybe they feel powerless and simply puttting a brave face | #OOTT
A tight oil scenario consistent with the elimination of oil exports to conserve oil for future American use. US oil exports phased out over Jan 2023 to Dec 2024 in the scenario.
Slightly modified scenario with no tight oil completions from Sept 2023 to June 2024, assumes US crude oil exports are banned tomorrow and it takes time to ramp down completions. Note that the ramp down to zero tight oil completions happens pretty quickly in this scenario falling to zero by September 2023 (6 months from now). Politically in the US this scenario seems unlikely, just a thought experiment for what things might look like in an alternative reality.
These charts certainly make it seem like an appealing idea
Stephen Hren,
You are joking right? The tight oil industry would be very upset and would tell everyone this will make gasoline more expensive, if phased in over a few years, it would not affect gasoline prices much and tight oil producers would probably see better ROI. I don’t think the oil industry will be convinced.
this seems well reasoned to me
https://www.zerohedge.com/energy/calling-all-consumers-its-time-recall-our-failing-energy-policies
HHH, since you took time to address my question I wanted to respond. I will be very honest with you. The questions are very much out of my knowledge base. I will add I would wager that there are probably a couple of dozen people who might be able to answer them, and none of them is me. But I don’t think that invalidates the point I was making.
Outside of the gold and silver markets I don’t see large player deliberately selling large amounts assets into an illiquid market. Most will be more prudent, wont telegraph their intent, will sell or divest their holding over time. I think a case can be made a lot of governments have watched what the US has done to N.Korea, Iran, Venezuela, Iraq, and Russia, (may not be a complete list) and say to themselves who will be next. I think a lot of the world governments want an alternative and that s is why we wee the CHINA, Russia, Iran India and OPEC members exploring options. How this plays out in the oil markets to be determined. But domestic inflation as those dollars come back home to roost is a high possibility.
https://www.zerohedge.com/geopolitical/why-regime-needs-dollar-be-global-reserve-currency
The whole dollars coming back home to roost is exactly what I’m talking about. Majority of people don’t understand the monetary system.
I know all the answers to the questions I asked.
The majority of dollars that exist outside the US were created outside US. They are ledger money loaned into existence. They don’t come home to roost they disappear into the thin air they were created from when the banks that loaned them out are defaulted on due to lack of dollars to repay loans.
Deflationary not inflationary money.
Any move away from the dollar is deflationary for oil prices.
Because less dollars means less ability to repay debt. China has over $1 trillion in USD denominated debt. How much debt denominated in RMB does the US have?
Exactly Zero.
HHH,
The dollars disappear as well when the loan is paid back. A bank loans 1 million and creates 1 million, the borrower pays back one million in principle to the bank to retire the note and the one million is destroyed, no default necessary. In the case of a one million default, now the bank writes off 1 million in assets (the one million note never gets paid), but the effect on the money supply is the same.
That is true Dennis, But what is your point? My point is that there is already a dollar shortage. Which is the real reason why countries are trying to find other ways to do business.
Not using dollars will just compound the problem of dollar scarcity. Deleveraging by default.
Curves are screaming deflationary money.
Take a look at dollar reserves globally. $2 trillion disappeared from central bank balance sheets.
Dennis , you must differentiate between the Eurodollar system used in international settlement and USD used in the domestic economy . The FED and the Treasury have no control over the Eurodollar . It is this that will be the inflection point , in my opinion . HHH can elaborate , all I know I have learnt from him . He is my Guru on this .
HHH,
I appreciate your time to humor me. You say below, “Take a look at dollar reserves globally. $2 trillion disappeared from central bank balance sheets.” Is that defaulted money that disappeared? or did they turn those dollar into other assets?
In a deflationary environment I would assume people would want to hold dollars. Like wise in an inflationary environment people would want to hold debt or real assets. Since I have a barbell approach to these matters I hope to be covered either way. But when i hear doomsday I can recall Art Cashin saying to paraphrase, you can’t bet on the end of the world, it only happens once and it wont matter if you are right at that point.
I mentioned before how the latest inflation fighting green energy bill is almost certain to put a bid in all matter of construction materials and energy, keeping inflation elevated at best. Not saying you will be wrong but I am keeping my options open at this point.
don’t over complicate it. earnings recession is dead ahead. dollars, gold, and duration. those are the asset classes that will benefit from the moves HHH is talking about. not end of the world, but certainly the end of a lot of careers for money managers. T minus 3.
bonds and gold have already broken out and you basically have to pray for a pull back for a good entry point.
trust me, I would rather it be a bull market. i have tons of money in Long Only accounts. the only satisfaction I get from this is how much i enjoy watching the world burn.
the relevant portion to this blog thread: energy, cyclicals are going to do terribly.
Twocats
I like all a variety of views, especially the well argued ones.
“the relevant portion to this blog thread: energy, cyclicals are going to do terribly.”
I am going to say I don’t think it is that simple, and so you know where I am coming from, I still hold about a 1/4 of my portfolio in upstream US domestic companies, although that has been trimmed back in early march to rebalance into US mid streams. Getting about an average 8% yield in what I consider to be a growth industry.
The teaser: “Conclusion
Recessions reduce oil demand, but no recession has reduced it as much as the COVID one, and I think it is unlikely the current recession coming our way would do so either. If we take the dotcom recession and GFC as benchmarks, we could expect the U.S. economy to lose perhaps up to 1 mmbbl/d of demand. Arguably, a large part of that loss may have already materialized in the physical markets if we track the latest 2022 consumption data against 2018-2019.”
The date of the article is July 2022, before the announced OPEC cuts in October, before Russia announced cuts, and before the latest OPEC announced cuts. If my math is correct, and there may be a bit of double counting OPEC + has announced cuts of production greater than 3 times the normal loss of demand here in the US during a recession. While I am going to grant you the historical relationship you mention, it is no longer a valid apples to apples comparison.
SO getting passed the headline and looking at just the data:
https://seekingalpha.com/article/4521645-recession-wont-push-oil-below-100-at-least-not-for-long
Texas tea two,
I tend to agree with you, but these guys think we are about to see Great Depression 2, I think they are wrong, but hey I am wrong at least half the time (some would say much more than half the time).
The low bid on 8 week T-bills for four weeks straight has been 0.00%. We are in a global run on collateral and people will pay whatever they have to, to secure collateral.
Heck even the IMF said something to the effect that this was the worst growth prospects globally we’ve seen in 30 years.
OPEC cuts just confirm what the the curves are saying.
HHH,
Really?
From
https://www.imf.org/en/Publications/WEO/weo-database/2022/October
Real World GDP annual growth in 2023 is expected to be 2.15% (at market exchange rates), not the lowest in the past 20 years by any stretch (2020 was -3.4%, 2009 was -2%, and 2008 was 1.6%, you are just making stuff up.
https://www.usnews.com/news/business/articles/2023-04-06/imf-head-expects-less-than-3-global-economic-growth-in-2023
Lowest outlook in 30 years Dennis and they like the FED don’t have a clue what goes on in Eurodollar market.
Their forecast for growth is through rose colored glass. Growth isn’t going to be anywhere near the pathetic growth they are calling for.
HHH,
The forecast for real GDP for the next 5 years is an average annual growth rate of 2.67% at market exchange rates, from 2005 to 2022 the average annual growth rate in real GDP was 2.53%, not a whole lot different. And if you think the IMF, World Bank, BIS and central banks don’t understand the Eurodollar market, I would respectfully disagree.
Twocats,
What the yield curves are worried about isn’t, wasn’t the 3 US banks and Credit Suisse. If that was the case the curves would have worked themselves out.
There is about 215 points of inversion in the Eurodollar curve right now in the near term contracts. Way worse than 2008.
Whatever is coming is almost here. And we know it’s illiquidity, collateral at the heart of it.
Agree, long duration, physical gold and physical cash. Everything else is picking up dimes in front of a steamroller.
Interest rates are going to zero regardless of the current talk coming out of FED.
Oil is going down regardless of OPEC cuts.
Yield curves are just what people think is going to happen.
Yield curves don’t predict the future.
We all have this assumption that Bankers and Investors know what they are doing.
I’ll bet 90% of them don’t know anymore than the people posting on this site. Some of them are literal ‘Donuts’.
It is a copy cat league in the business world. rarely are there original innovative ideas
SVB thought buying long dated bonds with their customers deposits was a good idea.
Oooops!!!
Central banker are absolutely clowns and don’t have the powers or tools they claim to have. Sbv by law is required to back bank deposits with assets. (Treasury bonds )
Yield curves are what the majority of people (institutions) think will happen. Yield curves are hedges. The majority of people (institutions) are betting because they have proprietary data that the average joe can only dream of having. They are betting interest rates go to zero rather fast. It’s literally trillions of $ being bet on lower rates.
Which means higher oil prices aren’t here to stay.
I’m at the point where in tired of talking. If you don’t believe what I’m saying just hide somewhere and watch.
” If you don’t believe what I’m saying just hide somewhere and watch.”
If you are as accurate as you say you are, then you must be willing to place a huge bet on it.
I wish you luck.
https://mishtalk.com/economics/fed-interest-rate-hike-in-may-is-again-odds-on-following-jobs-report
At the moment, interest rates in the USA are going up. No denying that.
The missing bank reserves would show up on the other side of their balance sheets if central banks bought anything. That’s not the case.
It didn’t show up in any asset class. What likely happened was central banks bailed out those within their borders that needed dollars. Both China and Switzerland dollars reserves were drawn down by about 850 billion a piece. So book entries on Eurodollar bank balance sheets were likely cancelled out with these dollar reserves.
Money disappeared into thin air. But with fewer and increasing fewer dollars available debts will be defaulted on in mass. Which is also money disappearing into thin air.
Eurodollar system in contraction. The Eurodollar system is about 5 times the size of the domestic US dollar system. A small relatively small contraction in Eurodollar can absolutely dwarf any so called liquidity being provided by the FED.
HHH,
Some of the slack may be taken up by other currencies, see
https://www.bis.org/statistics/gli2301.htm
Tim Watkins explains the Eurodollar and the lack of collateral in an easy to understand words .
https://consciousnessofsheep.co.uk/2023/04/08/in-brief-a-tough-spring-ahead-the-end-point-of-the-euro-dosh-gravy-train/
If this does not indicate a recession then what does ?
BLOOMBERG ENERGY: Continued Bullish Natgas Price Action For Dummies…
No comment necessary…
steve
Steve , +1 .
HOLE,
LOL +100
Natgas Price Gets the Typical Bounce at $2.00
Typically, commodities, stocks and assets see bounces at ROUND NUMBERS, like $2.00. However, will it hold in the days ahead?
I doubt it…
steve
China Likely Putting in STINK BIDS for LNG…
Reuters just came out with an article, shown below, suggesting that China is putting in “Opportunistic Bids” on LNG as they remain quiet on the sidelines.
Not only are we seeing Europe with Natgas Inventories at a decade high, we see the same with the USA, Japan, and Korea. So, it looks like China will continue to put in STINK BIDS because it knows the price is likely going ever LOWER.
This makes sense because Russia has diverted a significant portion of its natgas from Europe to China via its Siberian Gas Pipeline. According to Oilprice.com, earlier in the year:
“Russia has increased the export capacity of its pipeline to China to over 60 million cubic meters daily, China Media Group has reported, with total flows this year seen at over 22 billion cubic meters.
That would compare with 15 billion cubic meters delivered via the Power of Siberia last year, and a total of 30 billion since the launch of the pipeline three years ago.”
I believe we see SUB $2 Natgas in the weeks ahead, and I wouldn’t be surprised to see a SPIKE down close to the $1.00 level.
steve
in a sane world this would not be news but sanity flew the coop few years back.
https://oilprice.com/Latest-Energy-News/World-News/G7-Plans-To-Back-New-Natural-Gas-Investments.html
natgas bull here for the time frame greater than the next 4 weeks
TEHAS,
I get it. I am not arguing the point that Natgas goes Full Ballistic in the years ahead.
However, I was warning subscribers and folks on social media months ago, we were heading to low Natgas prices. But, I kept getting “JUST WAIT UNTIL FREEPORT COMES BACK ONLINE.”
LOL… that was an extra 1 bcf/d of consumption. SO WHAT?
Regardless… we likely see lower Natgas prices, maybe even $1 in the weeks and months ahead. I don’t have a CRYSTAL BALL, but I don’t think the lows will be in the next 4 weeks.
This is exactly the ENERGY CLIFF dynamics I have spoken about in interviews. We get HIGH PRICES & SHORTAGES followed by LOW PRICES & SURPLUSES.
The Energy Cliff just makes the volatility worse.
steve
Steve,
One would expect some volatility with changes in the supply situation in Europe as well as an unusually warm winter, if we have an unusually warm summer natural gas prices might increase, if not drilling of shale gas wells will decrease until supply falls enough to bring prices up.
Dennis,
If you agree with your reply given above, then maybe you should delete the one below, suggesting even weaker prices into 2024. 🙂
steve
Steve,
Just checking to see if it was already occurring, it isn’t, but if your prediction of $1/MCF is correct (at WAHA it is already at about 50 cents per MCF), the rigs will be stacked. You see the big ramp from Jan to April 2022, the ramp down will look like that at $1/MCF for HH gas.
Haynesville rigs have so far not moved much which is surprising.
On the last thread about Haynesville rig count .
https://peakoilbarrel.com/eia-short-term-energy-outlook-and-annual-energy-outlook-2023/#comment-755172
Article on Natural Gas
https://www.naturalgasintel.com/slumping-u-s-natural-gas-prices-lead-energy-analysts-to-lower-forecasts-into-2024/
Excerpt:
“It will be interesting,” Portillo wrote in a note, “to see if upstream operators in both oil and gas basins are going to be willing to continue to pay service costs that are more akin to $80 oil and $5 gas, but as things stand, the combination of skyrocketing service cost inflation since 2020 and a plunge in natural gas prices has decimated well level returns in basins like the Haynesville.”
He explained that the last time gas prices were at the levels they are today (in 2020 during the pandemic), TPH estimated the cost to drill and complete wells “for select operators was 30-40% cheaper.”
Current wells in the Haynesville now are averaging $1,500-2,000/foot or more, with 10,000-foot laterals costing $15,000-20,000/per foot or more.
“From a returns perspective, wells in the basin are sensitive to the move in the near-term gas strip, given lack of liquids production, with 25-30% of the life of well estimated ultimate recovery produced in year one and 40-45% by the end of year two.
“All told,” Portillo said, “with 2023 strip now approaching our fundamental targets of $2.75/MMBtu, prompt at $2.20 and further downside risk to the 2024 curve, we continue to expect a material drop in Haynesville drilling activity over the coming months, as cash flows and returns do not justify development with commodity prices at these levels.”
I believe LTO Survivor has been telling us this for months.
Rare shipments of Forties crude head to East Coast refiners
HOUSTON, April 6 (Reuters) – U.S. and Canadian refiners have turned to North Sea “Forties” crude oil for the first time in seven years in the latest sign of changing global oil flows from Russia’s invasion of Ukraine.
Nearly 2.6 million barrels of the crude are set to arrive at U.S. East Coast ports since February, according to Customs data on Refinitiv Eikon. Some of the oil is likely headed to Canada via pipeline.
The light, low-sulfur Forties crudes are blended with others to replace Russian crudes that have been barred from the U.S. and Canada. Prior to the ban, about 50% of all crude from Russian ports that landed in the U.S. went to East Coast refineries, the customs data showed.
The flow of Forties to the U.S. comes as high-sulfur east coast Canadian crudes increasingly head to Europe to backfill barred Russian supplies, said Matt Smith, Americas oil analyst at data provider Kpler.
Shipping costs must be increasing.
https://www.reuters.com/business/energy/rare-shipments-forties-crude-head-east-coast-refiners-2023-04-06/
Did a bit of work on the us nat gas situation, current storage per the eia nat gas report today 1830 vs 1532 5 year average.
https://ir.eia.gov/ngs/ngs.html
The Freeport plant shut down on June 8th and returned to full operation at the end of march per public reports. That ~ 534 Bcfg that was available for domestic use or storage during one of the warmers winters in recent history. Had that plant NOT shut down, I think one could assume storage level even during a warm winter would have been BELOW the 5 year average and would have been very close too last years storage levels of 1387. (1830-534=1296.) These numbers DO NOT point to a huge glut in US NAT GAS. Just some context to the panic porn above. That is not to say this price does not smart bigly to domestic producers. It is to say I bet it’s temporary and a very small decrease in drilling and completion activity or a hot summer or both will straighten out the markets in short order.
https://www.spglobal.com/commodityinsights/en/market-insights/latest-news/natural-gas/022223-freeport-lng-outage-showed-growing-connection-of-us-supply-global-gas-market?_its=JTdCJTIydmlkJTIyJTNBJTIyMjJjNmE4ZGYtNWU3YS00NTk0LWI5MGMtMGY4MzI3YWQ4N2U3JTIyJTJDJTIyc3RhdGUlMjIlM0ElMjJybHR+MTY4MDgyODkxMH5sYW5kfjJfMTAwMjJfc2VvXzhlN2ZkZTViMzgzNDg3OWYzODliYTAwYjdhOWU2MDAwJTIyJTdE
Opec+ production lower on fall in Russian output
London, 6 April (Argus) — Opec+ crude production dipped in March on the back of a decline in Russian output, although the drop fell short of the full 500,000 b/d cut pledged by Moscow.
Russian crude production was down only 100,000 b/d on the month in March to 9.7mn b/d, Argus estimates, despite Moscow’s high-profile pledge to reduce output by 500,000 b/d. Russia’s deputy prime minister Alexander Novak first announced the 500,000 b/d cut on 10 February, but acknowledged on 24 March that the full reduction had yet to be reached. Preliminary indications suggest overall crude exports from Russia were stable last month. A rise in Urals loadings more than offset a drop in shipments through the Druzhba pipeline and reduced ESPO Blend liftings from Kozmino.
Lower Russian output led to a fall in production from the non-Opec contingent of the Opec+ coalition to 13.51mn b/d in March, down by 110,000 b/d compared with February. Production by the 10 Opec countries with quotas was 20,000 b/d higher at 24.49mn b/d as maintenance in Angola and lower production from some other west African members was offset by an increase in Saudi output and an ongoing recovery in Nigerian supply. Opec+ producers with quotas pumped 2.1mn b/d below their combined target last month, with Russia producing around 780,000 b/d under quota and west African member countries making up a large chunk of the remaining shortfall.
If you ignore all the quota obfuscation, which can only apply to Saudi and UAE as they are the only countries recognised as having even a hint of spare capacity, don’t the productions profiles for all these countries just look like various stages of post peak operation settling in after a shake up from the Covid shut-ins (e.g. plateau – Oman, late life – E.G., early decline – Kuwait, rapid phase – Angola, external constraint – Iran, small producer stair-step down – Gabon).
Exxon Launches New Unit At Beaumont Refinery
Exxon this week started a new crude oil distillation unit at its Beaumont refinery, boosting its daily capacity to almost 620,000 bpd.
This makes the Beaumont facility the second-largest refinery in the United States after Aramco’s Motiva, Reuters reported.
The new unit itself will have a capacity of 250,000 barrels of crude daily and will process light crude from the Permian.
Meanwhile, outside the U.S., some 2 million bpd in new refining capacity is due to come on stream this year.
What will be the impact on crude demand with 2Mb/d coming on line. Would companies have invested in this level of refinery capacity if peak demand was around the corner? Italics my comment.
https://oilprice.com/Latest-Energy-News/World-News/Exxon-Launches-New-Unit-At-Beaumont-Refinery.html
Can some explain how the LTO oil will be used? Will it be blended with a heavier crude first before being refined?
Ovi, mixing heavy oil with light oil, before refining, doesn’t really do anything. In the refinery, the light stuff will still come out as light products like gasoline, and the heavy stuff will still come out as heavy products like diesel.
“Would companies have invested in this level of refinery capacity if peak demand was around the corner? ”
I would frame this slightly differently Ovi.
“Would Exxon have made this investment if rapid Permian basin oil output decline expectation was around the corner?”
And the answer is no. They clearly expect a fat tail.
“They clearly expect a fat tail.”
an honest assessment, I could go on but there is no need too.
Hickory
A much better question.
Ovi refining is not expertise but on the surface the new oil distillation unit may be designed to handle the LTO where the existing capacity is not, but that is just a guess. TO your other question, demand is not about to peak based by our own government estimates and any number of private analysis. It is pretty clear that top executives in oil and banking and even green tech(musk) now openly say new investments is needed, not that was much of a secret in my world. How the Dems walk back their climate crazies from the cliff will be interesting to watch. Energy fiction has now met energy reality.
Here is a take I found interesting on the oil market in general.
https://www.zerohedge.com/geopolitical/luongo-davos-runs-opec-buzzsaw
Texas tea,
Consumption of transportation fuel in the US (refinery output minus net exports of transportation fuel which I define as gasoline, distillate fuel, jet/kerosene fuel, and residual fuel.)
What is the data source for that transport fuel decline Dennis?
Despite the substantial increase in mileage efficiency for the countries ICE fleet, I find this chart surprising.
Also, liquids are a global market and most countries aren’t so well endowed with domestic oil as the US. Global oil product consumption has not peaked and will continue to go yet higher as long as supplies come to market at an affordable price for quite a long time yet.
Hickory,
I use EIA data for finished product output of gasoline, distillate, jet fuel, and residual fuel and decuct net exports of each of these fuels, that is US consumption. I use annual data from 1973 to 2022.
Hickory,
I agree World demand will increase over the next 7 to 10 years.
Dennis forgive me I am not following your point. are you saying oil demand is not going up, or are you making a random point? Refinery output is more than just transportation fuel here in the US and it also can be exported. see below Demand is predicted to go up by both private and government sources. see below.
https://www.eia.gov/energyexplained/oil-and-petroleum-products/refining-crude-oil-inputs-and-outputs.php
https://www.reuters.com/business/energy/morgan-stanley-ups-2023-oil-demand-growth-estimate-by-36-flags-russia-risk-2023-02-22/
https://www.eia.gov/outlooks/steo/report/us_oil.php
https://www.spglobal.com/commodityinsights/en/market-insights/latest-news/oil/031523-world-oil-demand-to-hit-fresh-highs-in-2023-as-china-rebounds-iea
With respect to your note to Ron, please share based on what methodology do you believe there are 1000’s of cased wells that will never be completed, Dead Ducks. I am dying to know the circumstances that would lead to that “fact” if true.
Dennis there may be someone calling for less demand of oil over the near medium term but I could not find one.
Long-term outlook to 2035
Over the long term, we expect to see average oil prices in the USD65-75/bbl range, with supply growth primarily from OPEC, US shale, and a few offshore basins that break even below USD75/bbl. However, we also anticipate that demand growth will hit its peak in the early 2030s due to slow chemicals growth and peak transport demand driving down oil consumption. Still, to meet demand, E&P companies will need to add >40 MMb/d of new crude production, mostly from offshore and shale unsanctioned projects. Roughly 4-5% of this new production will need to come from yet-to-find resources.
https://www.mckinsey.com/industries/oil-and-gas/how-we-help-clients/energy-insights/global-oil-supply-demand-outlook-to-2035—removed
Texastea,
I am simply charting historical data from the EIA. Future data is not known.
Texas tea two,
At the World level demand is likely to increase through 2030 at least, I am simply showing that in the US demand for transportation fuel peaked in 2005, in 2022 demand for transportation fuel in the US was below the level of 1991 and 1973-1982.
Texastea,
When you said the US government did not predict peak demand, I thought you meant for the US, I think you meant peak World demand for oil, most analyses are not predicting that for several years, but a few expect it fairly soon with policy measures implemented to combat climate change.
For example the IEA’s Announced Pledges scenario has peak liquid fuels demand in 2024.
https://www.iea.org/reports/world-energy-outlook-2022/outlook-for-liquid-fuels
Texasteatwo,
This is the opinion of Mike Shellman who has been in the oil business for 50 years or more.
Texastea,
The opinion on dead DUCs comes from Mr Shellman, I am confident he knows far more about this than me. I had misunderstood a comment he made about 6 months ago (from memory). That misunderstanding by me was the basis of the myth of the dead DUC comment. Mike corrected my mistake.
Thank you Mr. Shellman.
Texas tea two,
There are many reasons for dead DUCs. Mr Shellman outlines a few of them in the post linked below. He is also skeptical that Exxon would operate the Pioneer resources better than Pioneer, he thinks results would likely be worse with XOM running the show.
https://www.oilystuffblog.com/forumstuff/forum-stuff/quack
Dennis, I have no idea if he is right or not. Opinions are just that, they are not facts. I don’t read his blog because i have not confidence in his opinions on oil and gas matters. Between me and my life partner we have we have over 80 years of combined experience, she is a landman that handles the legal side of the oil and gas business and my self a geologist. She has worked the eagle ford, Oklahoma and the Permian as an executive in pub co’s, neither of us can come up with any logical reason for there to be 100’s let alone 1000’s of “Dead” Ducs. If Mike told me the sun was up I would look out the window and check rather that take his word for it, again I am data driven VS opinion driven. Thanks for the reply.
Texas tea,
It is interesting to have different points of view, I tend to agree with your point of view on dead DUCs, but I know much less than Mr. Shellman, in most cases his opinion is probably right. Note that one can track the date these DUCs were drilled, I don’t have the subscription data needed to check that out. I believe Mike has looked into this in the past and found there were many older DUCs that would likely never be completed. Other analysts from Rystad and elsewhere (Tom Loughery at flowoilwell.com) have reached similar conclusions.
Link to article citing the work of Rystad.
https://www.aogr.com/web-exclusives/exclusive-story/duc-inventories-decline-to-levels-on-par-with-2013
World Consumption of transportation fuel (gasoline, distillate, jet fuel/kerosene, residual fuel) from BP Stats
OECD Consumption of transportation fuel from BP Stats.
Interesting charts, thank you. They are going to be interesting to follow.
Ratio of OECD to World transport fuel consumption
Has the rush for the exit started in the Permian??
https://auto.economictimes.indiatimes.com/news/oil-and-lubes/buyout-firm-encap-eyes-nearly-usd-3-bn-of-permian-asset-sales/99312617
Russian capacity problems?
https://www.bnnbloomberg.ca/video/russian-oil-production-cuts-a-start-of-a-capacity-problem-cornerstone-analytics~2663196
An interesting tweet on SPR and sour crude inventory .
https://twitter.com/TaviCosta/status/1644037596396539904
Oh my
“n a deal that would be transformational for the US energy sector, and spark another shale revolution, the WSJ reports that US supermajor, the largest US energy E&P and formerly the world’s largest company by market cap, Exxon – the company that according to the Big Guy made more money than God in 2021, has held preliminary talks with shale giant Pioneer Natural Resources about a possible acquisition of the U.S. fracking giant, as the oil major hunts for a blockbuster deal in the shale patch.
Citing “people familiar” the WSJ notes that while discussions between the two companies about a potential deal have been informal, and there is no formal process between Exxon and Pioneer yet, now that Exxon is flush with cash thanks to record profits in 2022 it has been exploring options that could reshape a swath of the U.S. oil and gas industry while pushing Exxon deeper into West Texas shale.”
https://www.zerohedge.com/markets/seismic-deal-exxon-planning-acquisition-shale-giant-pioneer
this should make some anti industry folks heads explode
source their own refinery maybe? or maybe their engineers don’t know what they are doing, perhaps they should give shellman a call and get up to speed.
this makes coffee look like Nostradamus🖖
TTT,
Beat me to it by a minute.
Coffee, its friday we still be working here😉
Exxon’s long term debt is 4 times what it was 10-12 years ago. They need to be able to show reserves in the ground when it comes time to rollover debt. Perhaps they feel the need to just buy reserves through acquisition.
Maybe they need more reserves so they can borrow more money to do stock buybacks.
Texastea,
Probably won’t change the fundamentals. Drilling locations are limited and XOM cannot change physics.
Kinda huge story breaking just now from the Wall Street Journal.
Reports are that Exxon is looking to buy out Pioneer.
Big ripple effects if this comes to pass.
Below is an open Bloomberg link.
Is XOM looking for a way to maintain steady production as their current Tier 1 acreage is getting smaller?
https://www.bnnbloomberg.ca/exxon-pioneer-held-preliminary-talks-over-possible-deal-wsj-1.1905575
Ovi,
Lemme see, lemme see …
Would one of the largest, most respected companies in the world shell out ~$50 billion (Pioneer’s market cap) due to a potential dwindling scope of ongoing operations?
Naw, this deal – should it come to pass – will provide Exxon with decades of some of the lowest cost feedstock for its own, nearby refinery.
The pressures for consolidation upon the smaller operators will become intense as the economies of scale brought about by an Exxon/Pioneer acquisition will enable very low cost of production, relatively speaking.
Sheffield has been saying growth will be slow, probably will still be true with XOM running the show.
Coffeeguyzz,
Recently the Exxon refinery was updated to handle 250 kbpd of light crude. Most of Exxon’s refineries are not designed to refine tight oil. Most of Pioneer’s output is exported.
Coffeeguyzz
As long as crude stays over $80/b, Exxon’s economics won’t affect the little guy. As long as he can make a profit, he is happy.
Coffee.
When Exxon progress the deal to the point that they do due diligence it will be quietly swept under the carpet.
Mr Shellman’s view point on the XOM and PXD stuff .
“If you are confused, that’s not good. Because I am baffled.
Saying Exxon will do better than Pioneer is like turning your pizza parlor over to Congress for them to run more efficiently and make you more money.
I drilled some of those vertical Spraberry wells long ago and we frac’ed long intervals in the entire correlative interval. Those wells were drilled on 80’s and subsequently to 40’s. They communicate with each other, big time. ”
Visit his website for more info .
Coffee , respected companies . LOL . How did the AOL , Times Warner , CNN merger go ? How did the Chrysler , Fiat merger go ? Want me to continue ? BASF and Monsanto ? THC and Federal Moghul ( bankruptcy due to asbestos liability ) I will pull up a list of merger fiasco’s faster than you can read .
Respected companies ? ” Brutus is an honorable man , and so are they all honorable men ” — Julius Caesar .
Saudi TV Show Offers Glimpse Into 2020 Oil War With Russia
In March 2020, the cartel’s leader was at an impasse with Moscow: Riyadh wanted to cut output in response to the Covid-19 pandemic, but the Kremlin wanted to wait, Energy Minister Prince Abdulaziz bin Salman said as part of a documentary series aired by Saudi-owned MBC Group.
When the minister told the crown prince that the cartel hadn’t reached an agreement on quotas, the kingdom’s de facto ruler said Saudi Arabia should hit its “maximum production capacity.”
“I actually panicked,” the minister said during the episode titled OPEC Leadership. “I won’t lie about how I was during that moment.”
The minister returned to a room of Aramco executives and told them, “Let’s do it then, I have instructions to do it,” he said in the episode. Mohammed Al Qahtani, Aramco’s head of downstream operations, stood up, and “I even saw a tear in his eye,” the minister said.
“It was a tear of pride and joy,” Prince Abdulaziz said. “He stood up and said, ‘This is the greatest day of my life.’ Then we all got up and — to be honest — we all applauded.”
Ultimately, Saudi Arabia’s brinkmanship worked. When OPEC+ met in mid-April that year, its members agreed to to cut 9.7 million barrels a day — just below the initial proposal of 10 million..
So if we go to 2020 April’s numbers from Aramco, we’ll see the maximum Saudi production level at that time?
January had the widest margin between EIA and BOEM monthly estimates for GoM production that I have seen (150kbpd). Atlantis and Shenzi haven’t reported; BOEM assumes they are shut in, EIA assumes they added 30kbpd from December. If EIA is right then last month had effective availability for wells and platforms in the high 90s. This will not be sustainable so expect a large drop in February, even with a substantial contribution from Vito.
George
The GOM graph in the post shows a large drop for February and then a big rebound for March to the highest post pandemic daily production.
Amazing the AI and machine learning of GPT-4
What is the book Mathematical Geoenergy about?
Based on “mathematical geoenergy”, what is the oil shock model?
What is the mathematical expression for the Oil Shock Model in terms of a convolution?
Glad we figured this out before the machines take over.
“Glad we figured this out before the machines take over.”
The leap from impressively regurgitating and structuring text to having emotions and desires and a motivation to take over is a huge leap.
I am unaware of any algorithm that cares about what its results are.
Not neural networks, not machine learning, not anything.
ChatGPT ( and the future versions) will definitely have a role, but you can always pull the electricity cable out of the wall to get them to stop.
This is a very simplistic take on the alignment problem. The “just turn it off, bro” thing doesn’t work when it’s the Internet now, does it?
It’s like saying absolutely do not try and engineer smarter algos to produce a better bottom line for your company. Sure, whatever you say.
AGI is coming, or at least systems smart enough to massively disrupt things. GPT-4 is already something that no one expected this side of 2050, so LLM based transformers have massively tipped the balance in just five years or so.
But also: https://youtu.be/3TYT1QfdfsM
You don’t need some self-aware system either. Skynet can come about because it simply needs to achieve the goal given it, and has enough reasoning to manage it and to hell with the consequences (see the paperclip example often cited by Bostrom or Yudkowsky etc.).
Maybe.
Have you ever programmed Neural Networks or Machine Learning?
If not, I can see why you are skeptical of my opinion.
These fancy sounding things just make predictions based on training data.
Do you think linear regression is going to take over the world? How about logistic regression?
How about a decision tree? or an ensemble random forest? k-means clustering? ANNs? CNNs?
Not any time soon IMO…
There is a reason neural networks are primarily used on TEXT and IMAGES. That is what they are good at.
They aren’t as good at plotting to take over the world.
Now that is some scary shit…
Paul
“The Oil Shock Model is based on the concept of dispersive discovery and oil production. Dispersive discovery refers to the process of finding oil reservoirs over time, which follows a statistical pattern.”
What does the “dispersive discovery” model look like going forward from 2022. Is it random discovery around declining linear discovery?
Ovi, It has what’s called a fat-tail which is essentially a power-law (not exponential) decline
Should add it’s just a matter of time before you can ask GPT what the dispersive discovery will predict
Paul
Why should we expect a fat tail when discoveries have been getting smaller and there isn’t much left to discover?
I wonder if Putin and Igor Sechin (CEO of Rosneft) have looked at this chart together.
MeThinks
Fat-tails are a result of the possibility of a rare super-giant occurring. It may never be found but that’s what the distribution of reservoir sizes shows.
A thinner tail occurs when we factor in accelerating search techniques, so if we have been speeding up the process of discovery and not finding more we are traversing the fat-tail faster. So time is a variable factor in that sense, and we will see something like the logistic. I asked ChatGPT
Is it possible to estimate the dispersive discovery trajectory of oil in barrels per year for the world?
I forget some of this stuff. The book has a detailed derivation on how the logistic comes about from compensating discovery and acceleration 😉
Ovi,
The chart below shows the discovery model used for my shock model (based on Paul’s work), note that the discoveries in my model include reserve growth. So an initial discovery of 1 billion barrels, might be revised in the future to 2 billion barrels as more knowledge about the discovery is gained. The reserve growth is backdated to the initial date of the discovery, so if the oil was discovered in 2020 and by 2025 the total initial oil in place is revised to some higher value such as 2 billion barrels the entire amount (2 billion barrels) is considered to have been discovered in 2020. The chart you showed does not include reserve growth.
For my model cumulative discovery of conventional oil (including reserve growth) is about 2604 Gb as of the end of 2020. Note that cumulative production of conventional at the end of 2020 was about 1371 Gb and proved reserves of conventional oil were about 1309 Gb for a total of 2680 Gb, fairly close to my model for conventional discovery.
Dennis
OK. I do see it is bit skewed and the 2025 production looks reasonable. What is the area under the curve, 3000 GB?
Ovi,
The area under the curve is 2800 Gb, which is my guess for conventional oil URR, about 166 Gb of unconventional oil in my most recent shock model for a total C plus C URR (conventional plus unconventional C plus C) of about 2966 Gb. The unconventional oil consists of 70 Gb of tight oil and 97 Gb of extra heavy oil ( Canadian oil sands and Orinoco belt oil combined). In theory there should be 180 Gb or more of extra heavy oil, but my expectation is that much of the 420 Gb of claimed proved reserves in Canadian and Venezualan extra heavy oil at the end of 2020 will remain in the ground (roughly 340 Gb of this extra heavy proved reserve will never be produced.) Note that the 2025 number is discoveries plus reserve growth rather than output (it is about 6 Gb in 2025 for discoveries, including future reserve growth).
Dennis
My mistake. I meant to say discovery since 2025 discoveries are in the range shown in the discovery chart I posted above.
The disturbing aspect of the power-law of declining number of reservoirs as the size gets bigger is that the cumulative sum is infinite. That is, there is room for a super-giant that has about the size of all known reserves found so far. That’s just the nature of the statistics of such things, same with earthquakes, etc. Yet, I think the finite nature of the earth and the fact that there are few places left to search precludes that last super-giant from occurring.
Paul,
In my dispersive discovery model the URR is constrained to 2800 Gb. About 2600 Gb had been discovered by 2021, so no discovery larger than 200 Gb would be possible after 2021, if the model is accurate.
Looks like the model shows that roughly 90% of potential global URR is already logged as known reserves,
if I’m understanding what you present correctly.
Hickory,
The discovery chart is resources rather than reserves, but cumulative production plus proved conventional reserves at the end of 2020 are nearly the same. Many question the proved reserves numbers reported by BP, it is believed the OPEC reserves are overstated, Laherrere has estimated in the past they ae roughly 300 Gb too high.
Note that Laherrere does not believe there is significant reserve growth.
Hickory,
Correct, if the proved conventional reserves reported by BP Statistical Review of World Energy are accurate and my discovery model is also correct, then about 95% of conventional oil already has been produced or exists as proved reserves. In fact the rest could occur due to reserve growth with no future discovery.
The last sentence in the front-page WSJ article about Exxon possibly acquiring Pioneer: “Pioneer executives said the company sits on about 30 years of premium inventory.” This runs counter to what Scott Sheffield has been warning about.
There are a couple of possibilities: 1) Exxon projects that oil is going to $150 and staying there, 2) The LTO addition to their Beaumont refinery will improve economics so much that it will take care of any over-calculation of reserves.
As I understand it, the new unit will handle 250,000 bopd of the Permian LTO. The Beaumont facility will now handle what, maybe 650,000-700,000 bopd, total. The Pioneer acreage is, on balance, better than the Anadarko acreage that Occidental acquired for $38B (IMO). It would be a slick operation: Exxon oil going to the Exxon Refinery.
Exxon decided to pull out of Sakhalin-I. And also Brazil. The consideration of this purchase probably, more than anything, reflects the somber scarcity of ready-to-go oil prospects in a shrinking world. Economies of scale will, per usual, prevail in lower-than-usual margins.
The Exxon BOD changed complexion several months ago. Of the three “activist” shareholders elected to the board, one was Greg Goff, who was formerly CEO of Andeaver (Tesoro) Refinery. Everyone said, there goes Exxon. Yeah, right, straight up. The new board actually has had a good influence: Exxon is stopping all flaring of NG in the Permian, going all-electric, and also planning on a net-zero carbon emission there by the end of this decade. No matter how shaky this may look to me–a total outsider–I rather suspect that Exxon’s BOD will vote to gulp this down.
Consolidation is coming to the Permian Basin. It may be the only way to survive.
Walmart will likely be a bigger player than Exxon in energy markets ten years hence:
https://cleantechnica.com/2023/04/08/walmart-to-build-dedicated-fast-charging-network/
Sales of cars with plugs are up 49% yoy and have crossed the 10% level that often indicates the beginning of the steep ascent up the S curve of disruption:
https://cleantechnica.com/2023/04/07/world-bev-sales-now-10-of-world-auto-sales/
And I agree with Gerry and others that consolidation in the Permian is more likely a sign of weakness than strength.
I read an article about this.
Apparently rumblings about a Chevron OXY merger also. Warren Buffett owns a decent chunk of both.
Gerry,
Always a good read. I have been absorbing the Information regarding the Opec cuts, the new china, Russia, Saudi relationship, Exxon/Pioneer news (which neither has down played as of this writing) and now the very real
(increasing odds) of China going into Taiwan. My conclusions follow.
The world we knew no longer exist. I wont go into the why’s and wherefores. When I made my relative big bets on oil and carbon based energy 3 years ago, I wanted US domestic producers. I had no idea Russia would go into Ukraine. But now, between Iran, Iraq, Venezuela, and now Russia you have huge areas that it is not safe for Us companies to invest/explore. Add in the areas that the greens prohibit. You say the consideration of this purchase probably, more than anything, reflects the somber scarcity of ready-to-go oil prospects in a shrinking world. oh yea, I could not agree more, even if it maybe for different reasons.
I will not belabor the point of the slim margins of US resource plays, but I want to make it clear it is NOT just the US resource plays, It is world wide. It is going to take >$ 90 for some period of time to make any new investment any where. That number will go up not down, the era of cheap oil is now gone in my opinion, that of course does not preclude crashes, it is to say NO NEW oil of any significant quantity is coming to market without higher prices.
But Coffee made a good point, you will see consolidation, because of the slim margins. You will also see producers going around the traders and taking some part of their production directly to the end users. I think that is Exxon’s play, if you own the oil and you own the transportation of that oil and you own the refining of that oil all you really care about is owning the oil in the first place. That is the same with the gas producers. A numbers of upstream producers are getting into the mid stream business, and making deals directly with the end users. It is now a low margin business and producers and owners of the assets are tired of the traders kicking them in the backside, It is becoming a different business model. If you got the supplies, you have the capacity to make long term deals, so you do it.
a bit of a different take on the deal:
https://oilprice.com/Energy/Crude-Oil/Is-This-The-Next-Permian-Mega-Deal.html
NOW we wait to see what happens with china and taiwan, if it happens it will be before the next US presidential election in my view, what do you want to be holding if that happens, It aint APPL and it aint TSLA.
The World Is Devouring It’s Oil Reserves At A Replacement Rate Of 1:5
The world is now consuming 5 barrels of oil for each 1 barrel it discovers. Thus, it doesn’t take a brain surgeon to figure out, this doesn’t end well.
Furthermore, the new oil discoveries are mostly offshore that are more expensive and suffer higher decline rates than onland oil discoveries 50 years ago.
So, the GLOBAL OIL INDUSTRY RED QUEEN SYNDROME continues as the world is likely losing 10+ mbd of oil each & every year due to the natural decline rate that has to be replaced.
steve
Tesla had no alternative but to cut prices in China , Peak cars is still 2017-18 . Just like peak oil (C+C ) .
https://brucewilds.blogspot.com/2023/04/chinas-auto-price-war-is-now-out-of.html
Just how much oil is Russia really producing? Ovi posted this hree days ago: Bold mine.
Russian crude production was down only 100,000 b/d on the month in March to 9.7mn b/d, Argus estimates, despite Moscow’s high-profile pledge to reduce output by 500,000 b/d.
But two days ago this was posted by Bloomberg:
Russia Says It Cut Oil Output by 700,000 Barrels a Day in March
Russia’s Energy Ministry said the nation reduced its oil output by about 700,000 barrels a day last month, according to a person familiar with the figures.
Yet that figure is inconsistent with data on the nation’s March seaborne exports and supplies to domestic refineries — adding to the uncertainty over how much oil Russia actually pumps.
The Kremlin pledged to curb crude-only output by 500,000 barrels a day between March and December in retaliation for Western trade restrictions and a price cap imposed by the Group of Seven industrialized nations. The reduction was 40% higher, according to the Energy Ministry data.
Eight members of the Organization of Petroleum Exporting Countries, including de facto leader Saudi Arabia, agreed to join the voluntary cuts from May, bringing the total reductions to more than 1.6 million barrels per day in an effort to stabilize the global market.
The surprise decision drove an oil rally and set the stage for crude prices returning to $100 per barrel.
Russia will cut its crude-only output using February’s production as the baseline, according to Deputy Prime Minister Alexander Novak. Bloomberg calculations based on industry data put that month’s production at 10.1 million barrels a day.
The Energy Ministry data say producers pumped a daily average of 1.285 million tons of crude, the person said, asking not to be identified because the figures aren’t public.
That’s equivalent to just over 9.4 million barrels, meaning crude-only cuts totaled nearly 700,000 barrels a day last month.
The nation’s total March production of crude oil and condensate averaged 1.413 million tons, the person said. That’s equivalent to 10.36 million barrels per day, compared with 11.1 million barrels in February, according to Bloomberg calculations.
The resulting total cuts averaged 740,000 barrels a day, the data indicate.
Russia classified its oil statistics last year due to their “sensitive” nature, making it difficult to assess the implementation of supply cuts beyond the assurances of energy officials.
As a result, Russia watchers have started following the nation’s seaborne oil exports and domestic oil-processing rates as gauges for crude production estimates. However, both indicators showed no visible declines last month.
Ron
Difficult to sort out all of those numbers.
According to the March MOMR, “Russia’s liquids production in January decreased m-o-m by 36 tb/d to average 11.2 mb/d. This includes 9.8 mb/d of crude oil and 1.4 mb/d of NGLs and condensate. A preliminary estimate of Russia’s crude production in February 2023 shows stable m-o-m output at an average 9.8 mb/d, while NGLs and condensate were relatively stable.”
Since the crude portion is the same for both January and February, it is not unreasonable to assume that overall February is the same as March. That would confirm the 11.1 Mb/d in February in the Bloomberg article. So March would break down to 9.8 Mb/d of crude, 0.9 Mb/d of condensate and 0.4 Mb/d of NGLs. I am taking the 0.4 Mb/d from the EIA since the EIA always removed 0.4 Mb/d from the Russia energy Ministry C plus C numbers.
So the crude number is consistent with Argus, a difference of 0.1 Mb/d. Since the OPEC crude number is preliminary, March production, using Argus, would break down as follows; 9.7 Mb/d crude, 1.0 Mb/d condensate and 0.4 Mb/d NGLs. So that puts March C plus C at 10.7 Mb/d vs the 10.4 Mb/d (rounded) stated in the article. Depending on the data source, Russian monthly condensate always bounced between 0.9 Mb/d and 1.0 Mb/d.
The Energy Ministry March crude production of 9.4 Mb/d is 0.3 Mb/d lower than the Argus 9.7 Mb/d. It seems there is an unknown 0.3 Mb/d difference floating through these numbers.
Here is an Interesting piece on Cost Progress in the Cdn Oil Sands
Oil Sands Producers Breakeven Prices Below US Conventional Rivals, BMO Capital Markets Says
11:32 AM EDT, 04/04/2023 (MT Newswires) — BMO Capital Markets on Tuesday noted that Canada’s major oil sands producers, once noted for high costs, now have a lower breakeven on oil prices than the large-capitalization US oil and gas producers.
“We believe that on average, oil sands producers should be able to cover their 2023 capital budgets at WTI US$37/bbl and base dividends at WTI US$46/bbl,” the investment bank noted. “This is well below the average U.S. large cap producer, which we estimate require WTI prices of US$48/bbl and US$53.50/bbl, respectively, in order to fund 2023 capital programs and dividends. The main driver behind the stronger breakevens stems from the low decline, longer life nature of oil sands assets, which results in much lower sustaining capital requirements. Within the oil sands group, Canadian Natural (NYSE: CNQ) has the best sustaining breakeven primarily due to its top -tier mining projects and diverse asset base.”
Full Disclosure: I own a bit of CNQ. I also think it is one of the top tier oil companies in the world. Their main focus is lowering their production cost. No side distractions.
Ovi,
A problem for Canadian oil sands producers is the difference in price recieved for their product. WCS is about $59/b vs $80/b for WTI, if you look at annual reports and compare the average selling price for oil for CNQ vs Pioneer Resources, the price may be significantly different. Currently the spread appears to be around $20/b.
For 2022Q3, CNQ had a realized price for its themal in situ Oil sands of $76.32 per barrel in Canadian dollars (about $57 in US dollars). Pioneer got about $94/bo in US dollars for its oil in 2022Q3. That is a difference of $37/bo.
Dennis
I am not sure which US companies were compared under the description “large-capitalization US oil and gas producers.”
WCS discount was orders of $30 during the SPR release. Today it is closer to $15/b. Todays live price attached.
Two of the major oil companies in Canada, CNQ and Suncor, have upgraders to upgrade the bitumen to Syncrude Sweet Select which sells for close to $80/b in FOB Alberta. Not sure what the Cushing price would be due to shipping costs. Probably reduced in the order of $5/b to $10/b at FOB Cushing.
This is what CNQ’s Q4-22 report states: “The Company’s high value SCO captured a strong price premium to WTI of US$4.43/bbl in 2022, driving strong annual realized SCO pricing of $117.69/bbl, which on an annual basis represented approximately 46% of total liquids volumes and generated significant free cash flow for the Company.
What is critical to a companies profits is the netback per barrel. Attached is a chart which shows the difference in net backs for different grades that CNQ produces. Thermal is the worst and oil sands upgraded is the best.
I do not know what Pioneer’s netback was for their product. Maybe a clue is given in their relative stock performance.
Netback Comparison
Ovi,
One way to compare is to look at net income divided by revenue (net margin) for the two companies for CNQ it was 11B/42B or 26%, for Pioneer it was 7.8/24 or 32%. Stock price is less important.
I am not invested directly in energy stocks, I buy the market (S&P 500) so indirectly own some US energy stocks.
Stock price comparisons change depending upon end points chosen, on most comparisons CNQ looks better, except 1 year and one decade, for 2, 3, and 5 years CNQ was better as a stock, future is more difficult to say what happens to stock price.
Dennis
The ratio that analysts focus on in Canada when looking at an oil stock is Free Cash Flow and P/FCF. It is a reflection of the cash left over after all expenses and dividends are paid. It determines how many shares a company can buy back, buy back debt and pay out dividends and special dividends. Many oil companies last year, including CNQ, paid out special dividends in addition to the basic dividend.
I took the following table/data from finviz.com. I do not know what all of these ratios are. On a P/FCF, CNQ looks good. Not sure about a few of the other ratios.
Ovi,
One thing to keep in mind with CNQ’s netbacks is that 2/3 of the boe output is not mining and upgrading and it has a low netback of under $40/boe Canadian (which is about $30/boe US. For Upgrading and mining the netback is high at $69/b ($52/b US), but for the company as a whole the netback is about $44/boe in US$ for 2022 Annual report. For Pioneer in 2022 the netback was $56.60/boe, so considerably better than CNQ.
Stock price comparison. Red CNQ, Blue PXD. Green CVX
Otten recently introduced House Bill (HB) 170 to “expand safety zones around oil and gas wells and related natural gas infrastructure.” What a joke! In plain language, the bill increases setback distances from 500 feet of a shale well to 2,500 feet–effectively killing any new shale well drilling anywhere in the state.
https://marcellusdrilling.com/2023/04/pa-house-bill-170-kills-new-marcellus-drilling-using-setbacks/
A good conversation on the Eurodollar from July 2022, Jeff Snider interview
https://www.macrovoices.com/guest-content/list-guest-transcripts/4692-2022-07-07-transcript-of-the-podcast-interview-between-erik-townsend-and-jeff-snider/file
we’ve covered this ground before but it is worth reinforcing
“These multiples probably do not reflect the true value of the 2.2 bn of 2P-Proved and Probable, reserves upon which PXD sits, and XOM covets. What an offer by XOM for PXD would show beyond a doubt, is that crude reserves are currently undervalued in relation to the role they will play in providing energy in the coming decades.”
https://oilprice.com/Energy/Crude-Oil/Oil-Demand-Set-To-Remain-Strong-For-Years-To-Come.html
Texasteatwo,
See
https://investors.pxd.com/news-releases/news-release-details/pioneer-natural-resources-reports-fourth-quarter-and-full-year-1
Only 41% of PXD proved reserves as of Dec 31, 2022 were crude (972 MMbo of 2377 MMboe) 738 MMb NGL, and 3997 BCF NG. In 2022 the netback was about $56.60/boe, so a simple calculation suggests 2377 million times 56.60 for a value of $134 billion. Interesting that the company is only valued at around 50 billion. Of course we could take oil at $80/bo, NGL at $27/b and NG at $2/MCF and production costs of $11/boe and we would get about $77 billion for a valuation, note that the proved reserves may be overstated as often these companies have inflated type curves that do not reflect reality. Also much of these “proves reserves” will be not be in premium tier one areas and thus will have higher production costs than the $11/boe figure I took from 2022Q4.
Bottom line, the 50 billion valuation might not be as good a deal as XOM thinks. Time will tell. Sheffield may be laughing all the way to the bank.
Texasteatwo,
Messler relies on EIA projections which are not very good. A more realistic projection comes from the IEA especially the Announced Pledges Scenario (APS) which has World demand for oil peaking in 2024. The EIA scenario has not been updated since 2021, next update in the fall of 2023. Chart from
https://www.iea.org/reports/world-energy-outlook-2022/outlook-for-liquid-fuels
Dennis, do you know if these projections are indicating
Demand as being the amount of achievable global production (and thus consumption), or
Demand as being what the global market can afford to or desires to purchase (regardless of production potential)?
I find that this distinction is generally not specified, but the implications of the assumption choice on projection outcome are huge.
Hickory,
These projections are based on different demand scenarios which are dependent on policy.
So the STEPS scenario is based on current stated policies, the APS is based on Announced pledges made by nations to reduce climate emissions and the NZE is the net zero emissions scenario which attempts to keep warming to less than 1.5 C.
My only comments Dennis are that Exxon has a fair bit of expertise and experience in this play, they will do an independent evaluation, I don’t spend any of my life second guessing other professional unless I have a personal stake in the matter. So it will be what it will be but I can assure you they know more than you, me, Mike and the EIA all put together X infinity.
Oil’s 15 day correlation with USD is -0.89. 30 day is actually positive 0.16. 120 day is 0.68. But definitely nothing has changed in the global economy in the past several months. All good. Thumbs up.
Here’s a look at past 12 months of US production, what stands out is minimal growth over 12 months, oil prices still moderately high. Since the new year, essentially zero growth. If the annual trend continues then 12.5 MBpD might happen by sometime next year. If the recent 2023 trend continues then essentially no growth between now and end of 2024…
Dennis thinks high prices will come to the rescue…but economy doesn’t seem prepared for that outcome…
OPEC seems ready to encourage those high prices, should be an interesting driving season…
Kengeo,
The weekly data is best ignored.
Better to look at STEO, growth will be slow the next 2 years for US if STEO is correct, about 200 kb/d per year. The rate of growth slows down by over a factor of 3 from the previous 23 months where that annual growth rate was about 653 kb/d per year. Over the past 12 months that we have reliable monthly data (Feb 2022 to Jan 2023) the annual growth trend in US C plus C output was 1134 kb/d. If we use April 2022 to March 2023 (and use the STEO estimates for March and April), the annual growth rate for US C plus C is 1090 kb/d. In each case I use OLS to estimate the trend.
“Texas wind capacity factors averaged 32% in December 2022. But that doesn’t mean that wind provided steady power at 32% of installed capacity; as shown on the left, Texas wind generation varied from a low of 5% of capacity to a peak of 70% during the month. Why this matters: LCOE is so blissfully unaware of reality that it is calculated the exact same way whether Texas wind capacity factors are 32% for every hour of December, or if they average 32% but vary from 5%-70%. This is preposterous since in the latter scenario, backup thermal power/storage needs are much higher than in the former. LCOE is the cocktail napkin of energy math.
What actually happened? On Dec 23, temperatures dropped to 130-280F vs average levels of 450F, causing electricity demand to spike to its highest level ever while renewable output collapsed. Rising electricity demand was met by natural gas output doubling. Even if Texas wind and solar capacity were 5x (!!) larger, the need for gas fired power that day would only have been 20% lower. In other words, a massive gap that only backup power could fill, none of which is accounted for in LCOE. What about energy storage? Low wind conditions lasted for 3 days, in which case many billions of dollars of 4-6 hour storage would have been needed instead.
https://assets.jpmprivatebank.com/content/dam/jpm-wm-aem/campaign/energy-paper-13/growing-pains-renewable-transition-in-adolescence.pdf
A new thread on Non-OPEC and World Oil production has been posted.
https://peakoilbarrel.com/non-opecs-december-oil-production-drops/
A new open thread Non-Petroleum has been posted.
https://peakoilbarrel.com/open-thread-non-petroleum-april-11-2023/