By Ovi
This month’s report is a shorter version of previous posts because the EIA’s International Energy Statistics update for June is not available. Information from other sources such as OPEC, the STEO and country specific sites such as Brazil, Norway and China is used to provide a short term outlook for future output and direction for a few of these countries and the world.
Where STEO data was used, the ratio of C + C to All Liquids was calculated. The average for the last four months was used to project June, July and August production for a few countries.
World oil production and projection charts are presented at the end of this post.
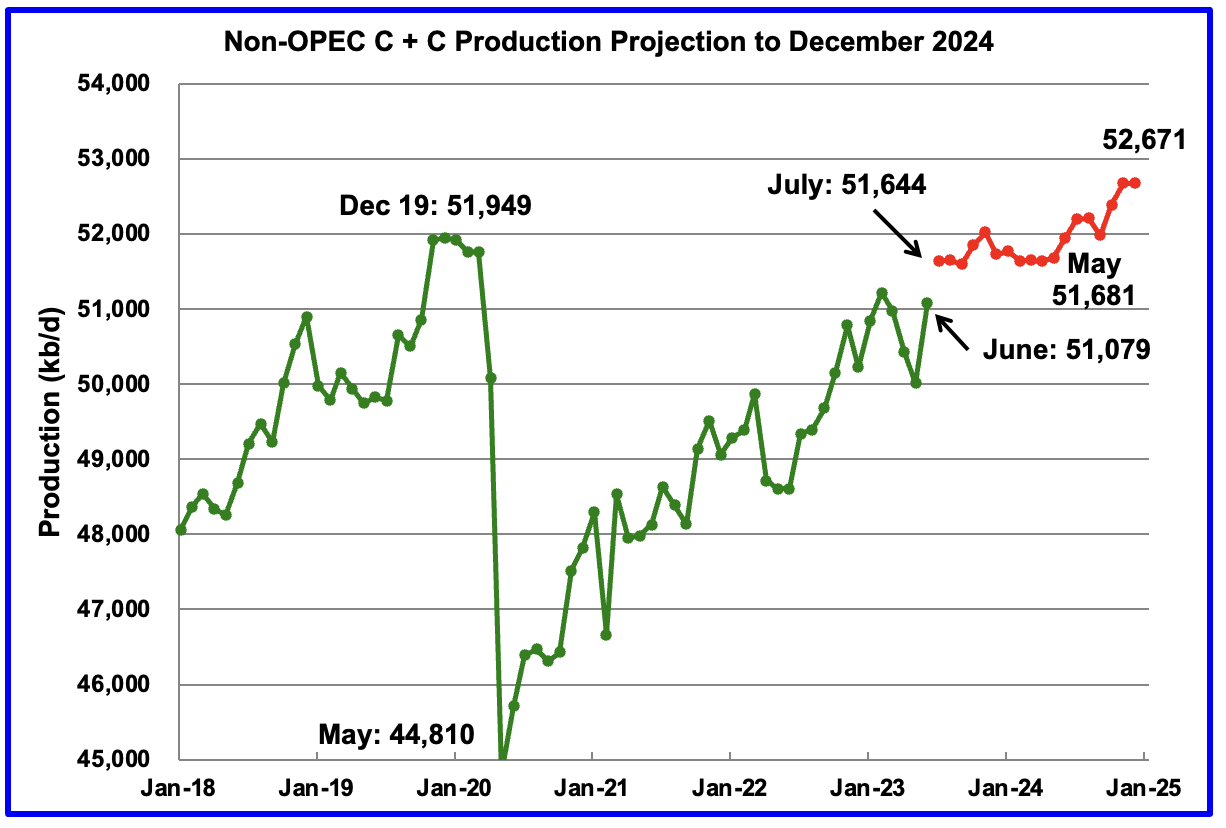
The October STEO is projecting June Non-OPEC oil production to increase by 1,069 kb/d to 51,079 kb/d. Close to 500 kb/d of that increase is associated with the upward revision of Russian output from last month. In the previous EIA May report, Russian condensate was not included in Russian production.
Using production data from the October 2023 STEO and the previous May’s EIA International Energy Statistics, a projection for Non-OPEC oil output was made for the period July 2023 to December 2024. (Red graph). Output is expected to reach 52,671 kb/d in December 2024, which is 722 kb/d higher than the December 2019 peak of 51,949 kb/d.
From July 2023 to December 2024, oil production in Non-OPEC countries is expected to increase by 1,027. Note that production is expected to be relatively flat till May 2024.
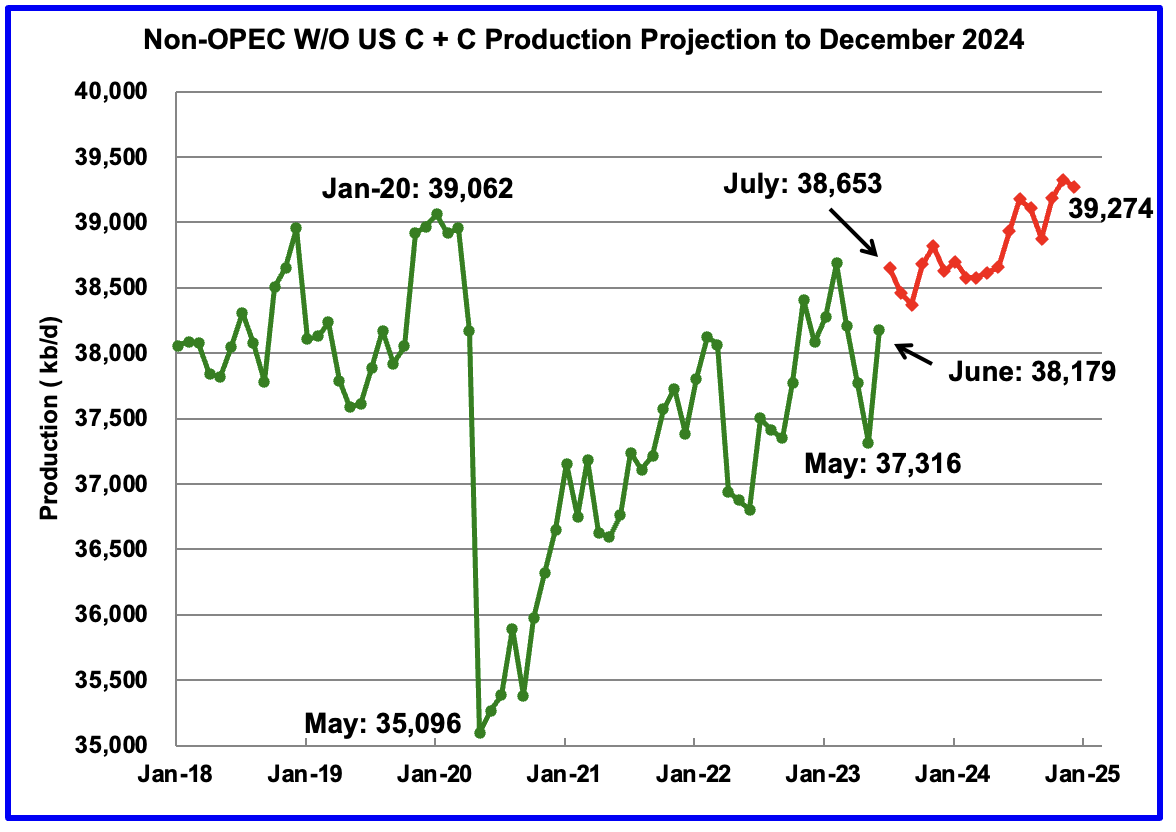
June Non-OPEC W/O US production, using the same method described above, is projected to increase by 863 kb/d to 38,179 kb/d. Again, close to 500 kb/d of this increase is associated with the upward revision to Russia’s June output. July 2023 production is projected to increase by 474 kb/d, the majority of which occurs in the later half of 2024.
From July 2023 to December 2024, production in Non-OPEC countries W/O the US is expected to increase by 621 kb/d.
Note that December 2024 output exceeds the pre-covid high of 39,062 kb/d in January 2020 by 212 kb/d.
Non-OPEC Oil Production Charts
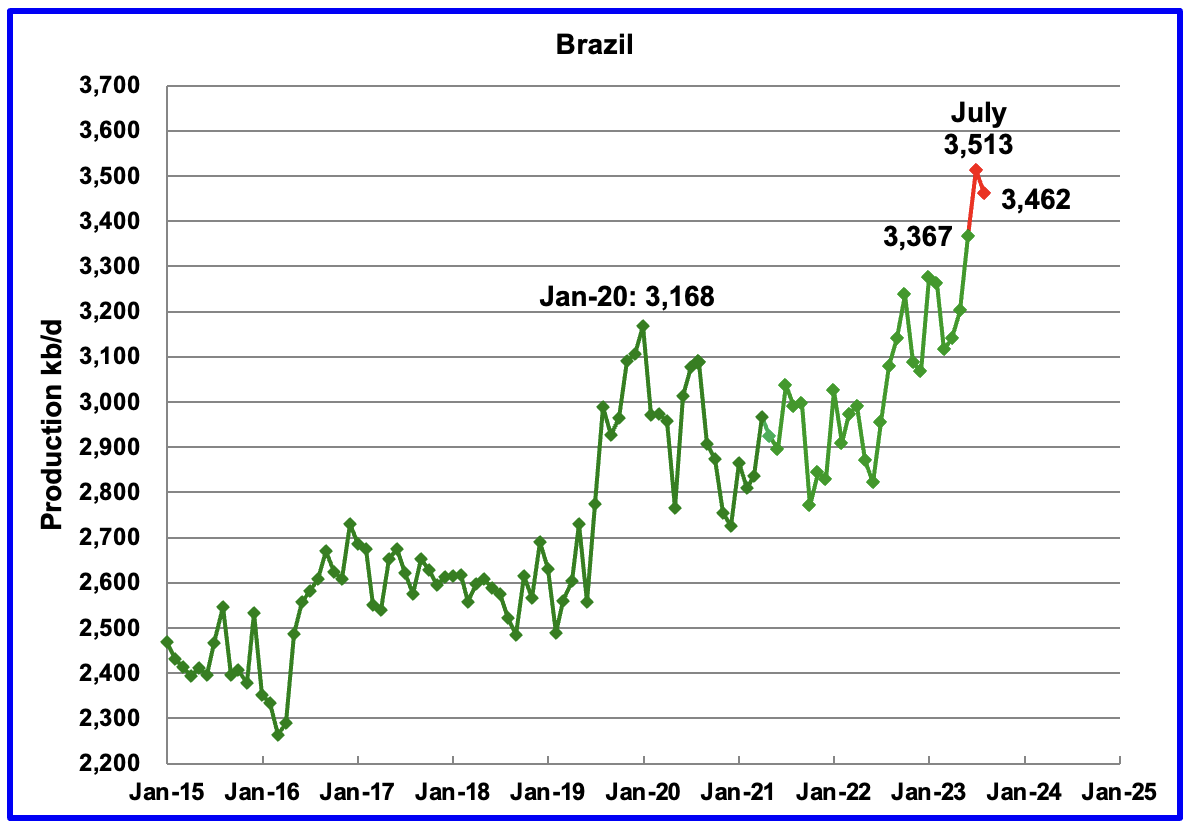
Brazil’s National Petroleum Association (BNPA) reported that output in June and July increased to a new record high. July increased by 146 kb/d to 3,513 kb/d mainly due to new project start-ups in the Pre-Salt layer, red markers. August production dropped by 51 kb/d to 3,462 kb/d.
According to the October MOMR: the August drop is “mainly due to maintenance in the pre-salt fields.”
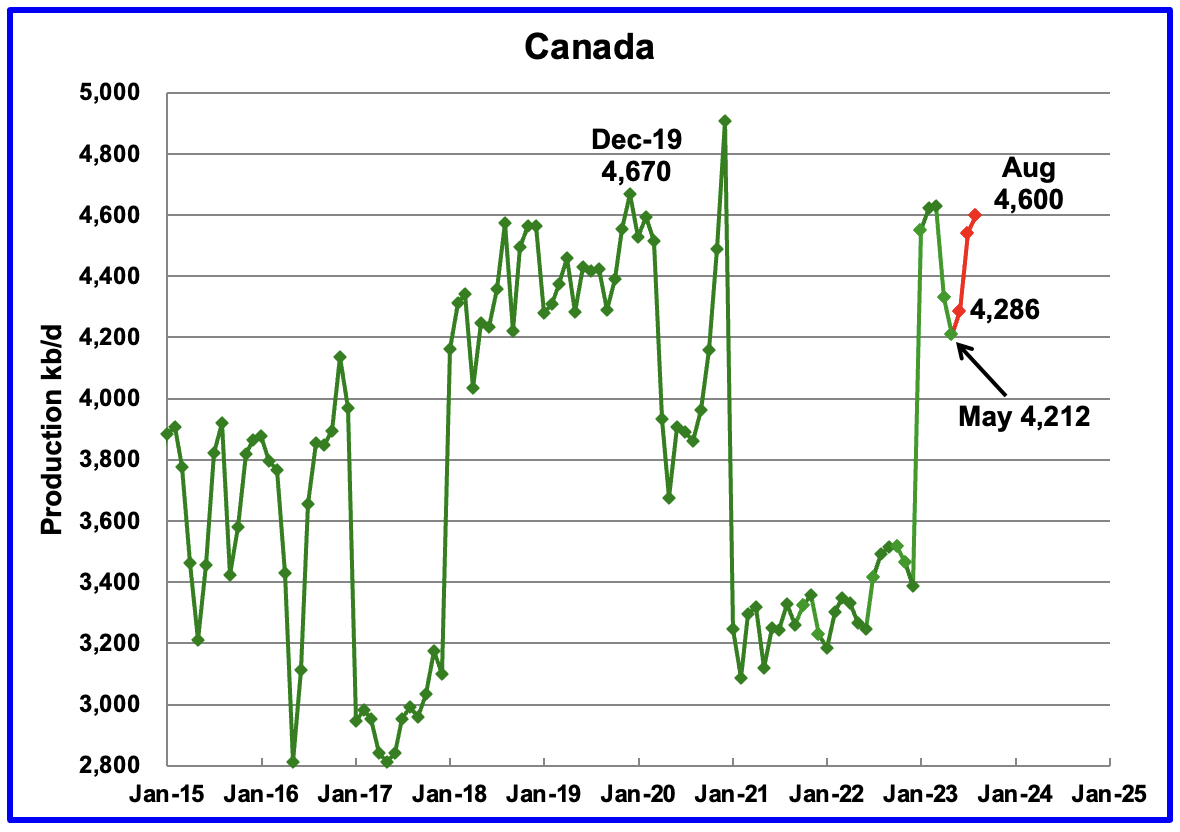
The STEO is forecasting that Canadian production rebounded in June by 74 kb/d to 4,286 kb/d. Production continued to increase in July and August. The April and May drops to 4,212 kb/d were due to significant maintenance at the oil sands mines and upgraders.
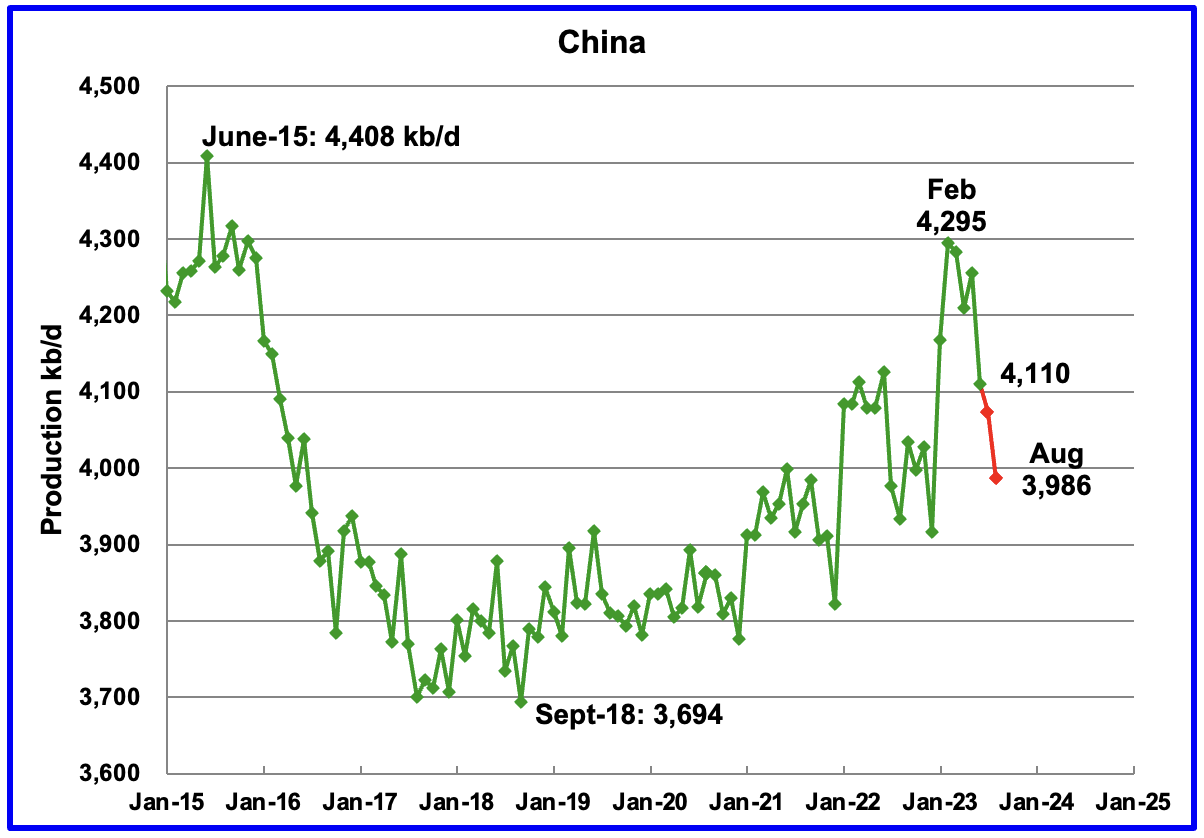
The China National Bureau of Statistics reported that production in August dropped by 124 kb/d from June to 3,986 kb/d.
While China’s production growth has risen steady since 2018, it may be approaching its post pandemic high.
Every January for the last four years, China’s production has taken a massive jump. In January 2022, production climbed by 307 kb/d to 4,185 kb/d. In 2023, production jumped in both January and February by 322 kb/d to a new high of 4,295 kb/d. Production then drops after these big increases. Are the production jumps associated with new wells being brought online and why in winter?
According to the October MOMR: “For 2024, Chinese liquids production is expected to remain steady y-o-y and is forecast to average 4.6 m/d.”
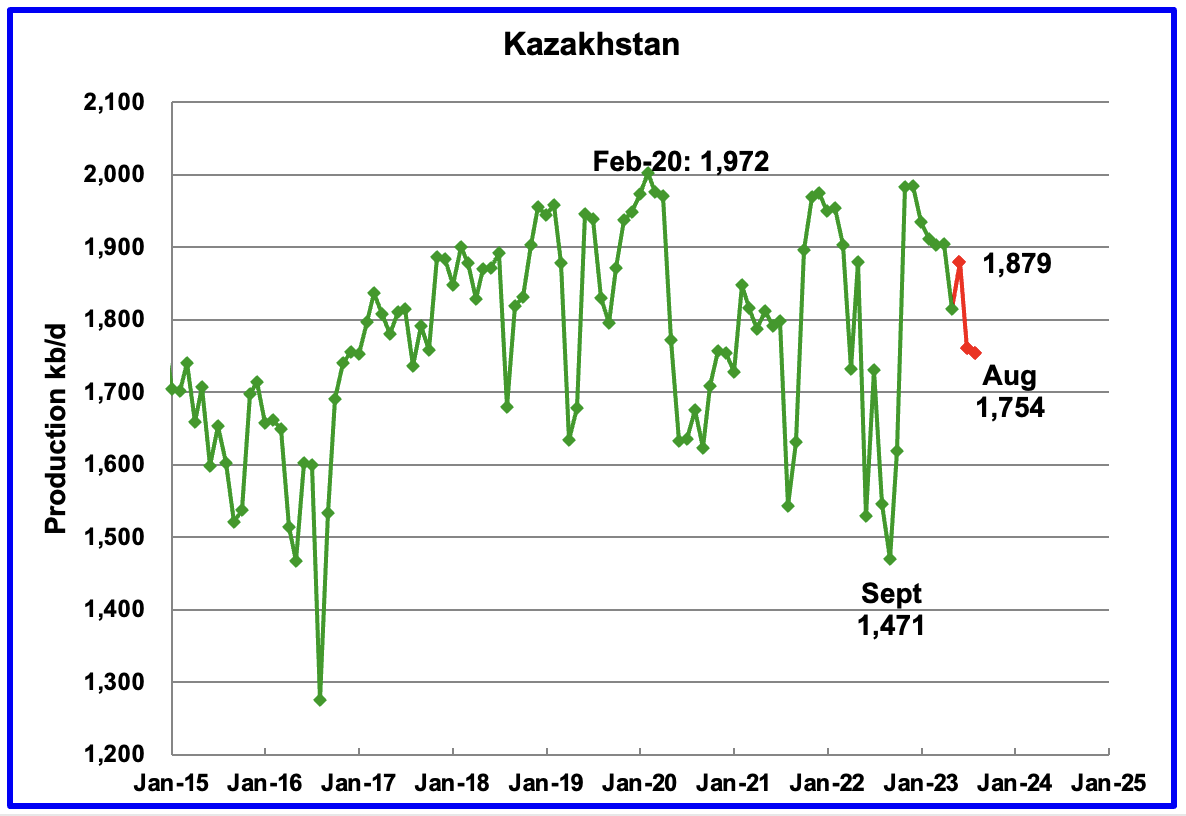
According to the STEO, Kazakhstan’s output increased by 65 kb/d in June to 1,879 kb/d. The STEO is forecasting that production decreased in July and August to 1,754 kb/d.
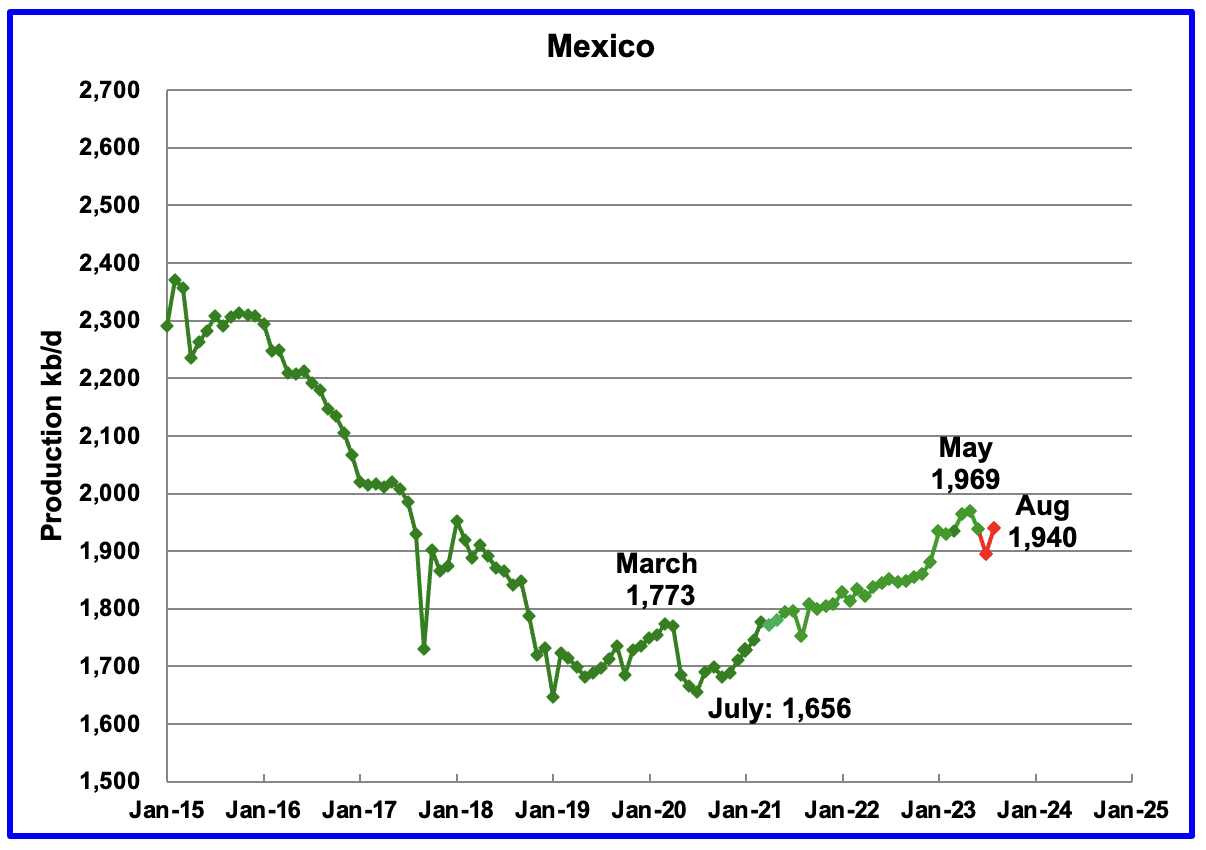
Mexico’s production in June was 1,938 kb/d a decrease of 31 kb/d from May. Output dropped to 1,895 kb/d in July and rebounded to 1,940 kb/d in August according to Pemex.
Mexico has recently revised its definition of condensate. This has resulted in the EIA adding an extra 60 kb/d, on average, to the Pemex report. The red markers include the additional 60 kb/d.
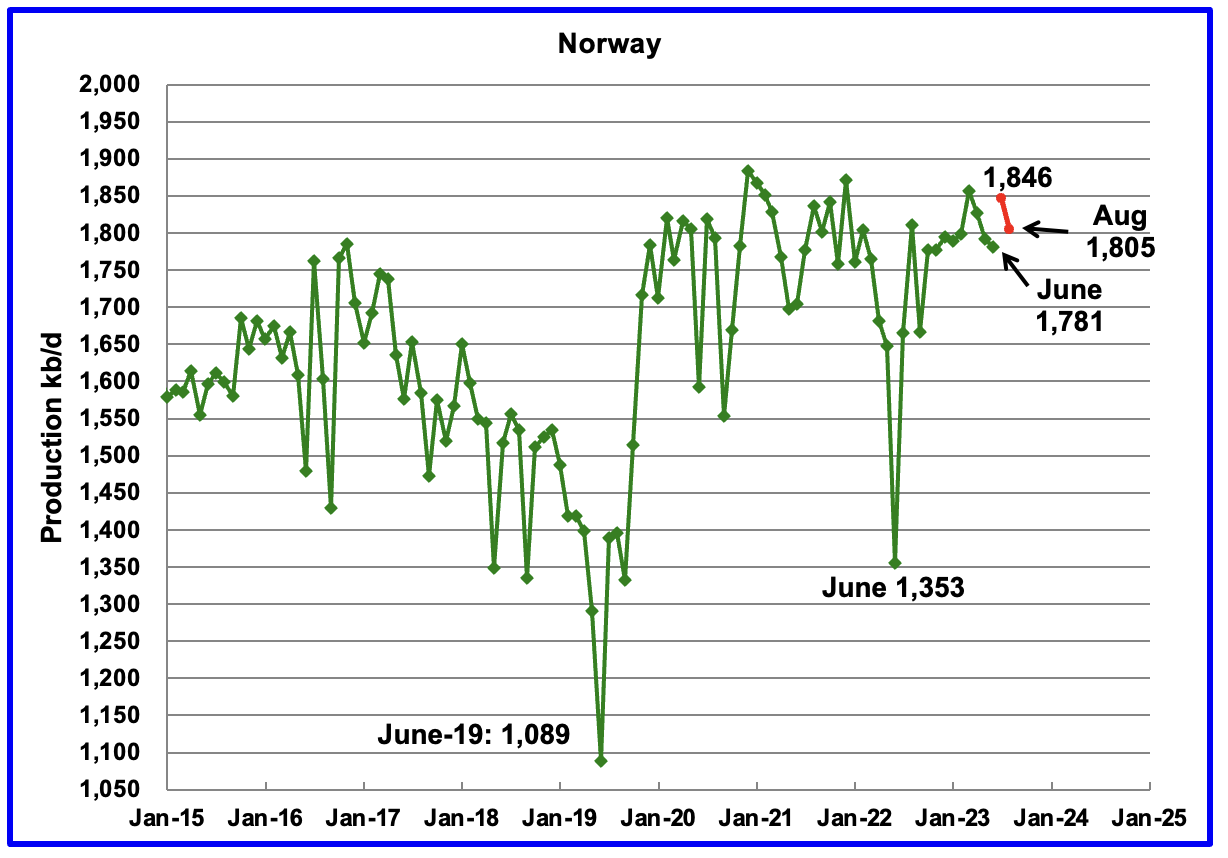
The Norway’s Petroleum Directorate (NPD) reported that June’s production dropped to 1,781 kb/d. Production rebounded in July to 1,846 kb/d and then dropped to 1,805 kb/d in August. (Red markers).
According to the NPD: “Oil production in August was 1.0 percent higher than the NPD’s forecast and 0.2 percent lower than the forecast so far this year.”
Recent production highs to 1,850 kb/d appears to be close to Norway’s post Covid production peak.
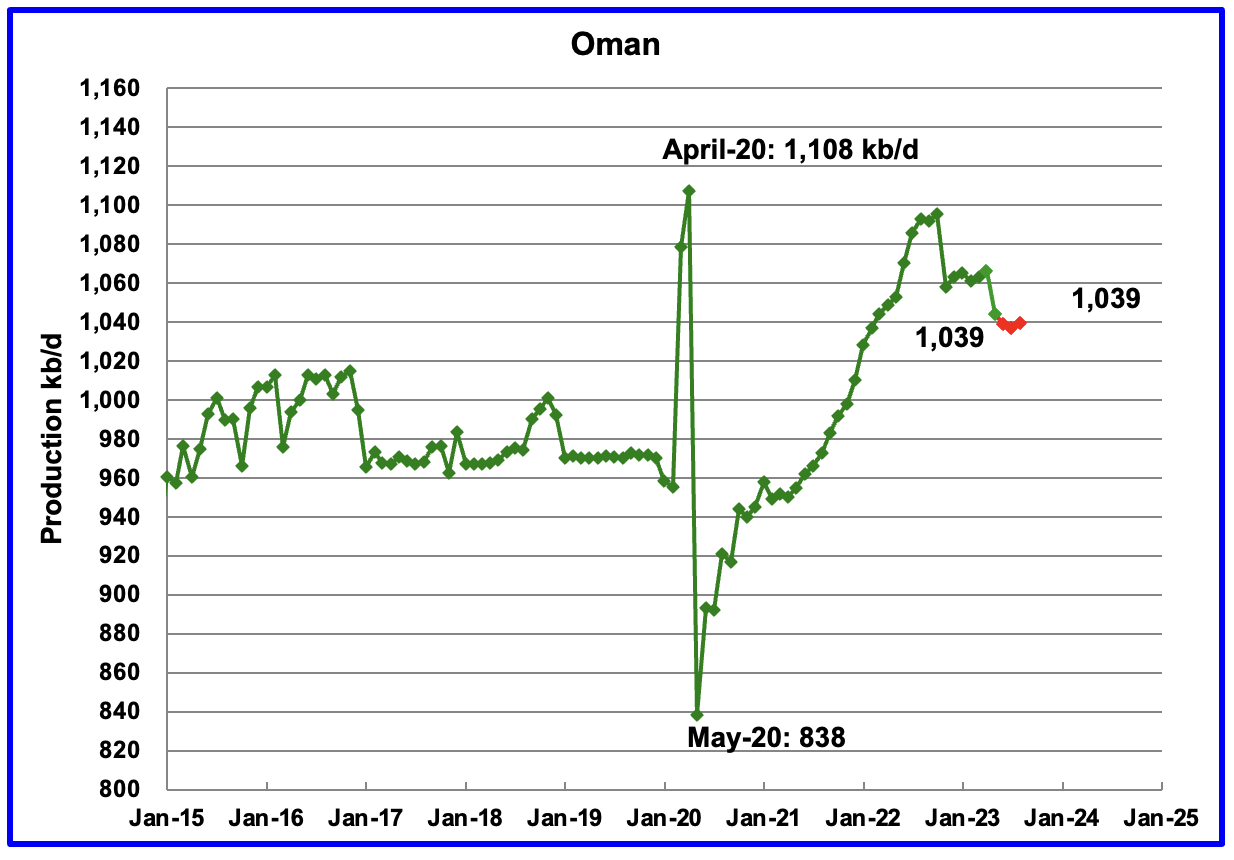
Oman’s production rose very consistently since the low of May 2020. However production began to drop in October 2022. According to the October STEO, Oman’s June output dropped by 5 kb/d to 1,039. The STEO projects that production will recover in August after July’s drop to 1,037 kb/d.
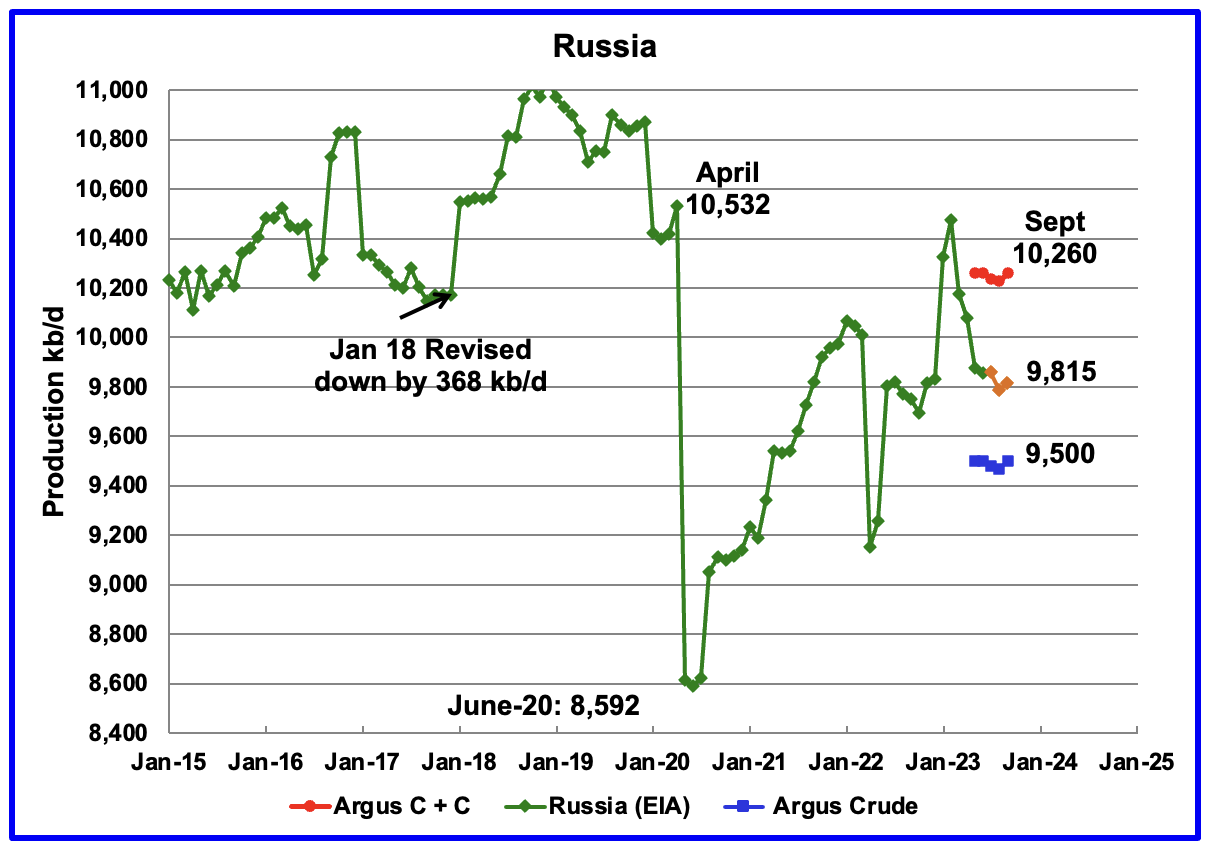
The EIA’s STEO report was used to project Russian output in September by reducing the all liquids output by 0.938 to estimate the C + C production. The 0.938 is a pre-war average of Russia Ministry production to the STEO all liquids production from October 2020 to September 2021. September production was 9,815 kb/d an increase of 28 kb/d over August, orange markers.
Using data from Argus Media, Russian production was estimated from April to September. For September, Argus reported that Russian crude production was 9,500 kb/d, an increase of 30 kb/d, blue markers. Adding 8% to Argus’ September crude provides a projected C + C production of 10,260 kb/d, red markers.
Comparing the Argus crude data with the latest STEO projection indicates that the STEO estimate for Russian C + C is midway between the Argus estimates for Crude and C + C.
Both the October OPEC MOMR and the IEA OMR agree that Russian crude production in September was close to 9,500 kb/d.
World Oil Production Projection
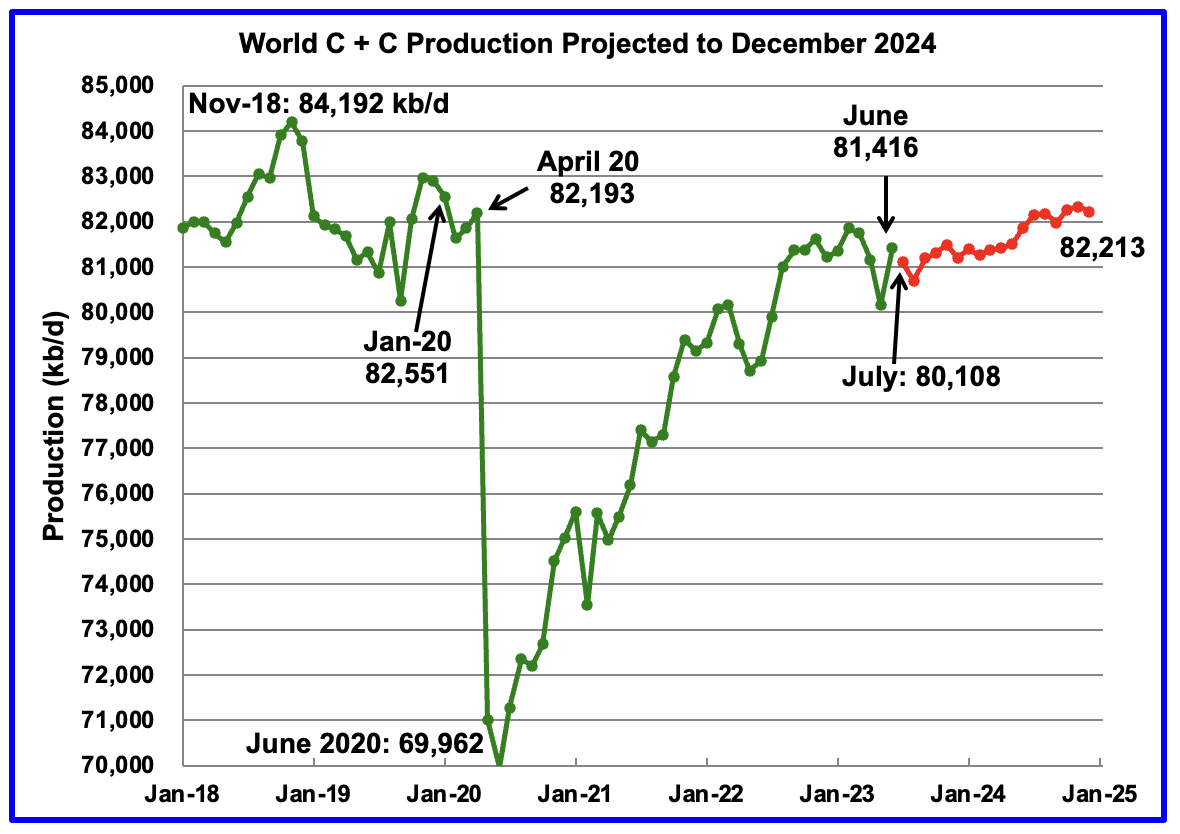
World oil production in June, according to the STEO, increased by 1,263 kb/d to 81,416 kb/d.(Green graph). As noted previously, close to 500 kb/d of the increase is due to an upward revision to Russian production.
This chart also projects World C + C production out to December 2024. It uses the October 2023 STEO report along with the May International Energy Statistics to make the projection. (Red markers).
The red graph forecasts that World crude production in December 2024 will be 82,213 kb/d and is 1,979 kb/d lower than the November 2018 peak. Note that it is not known how much of the increase is due to OPEC + reducing their voluntary production cuts.
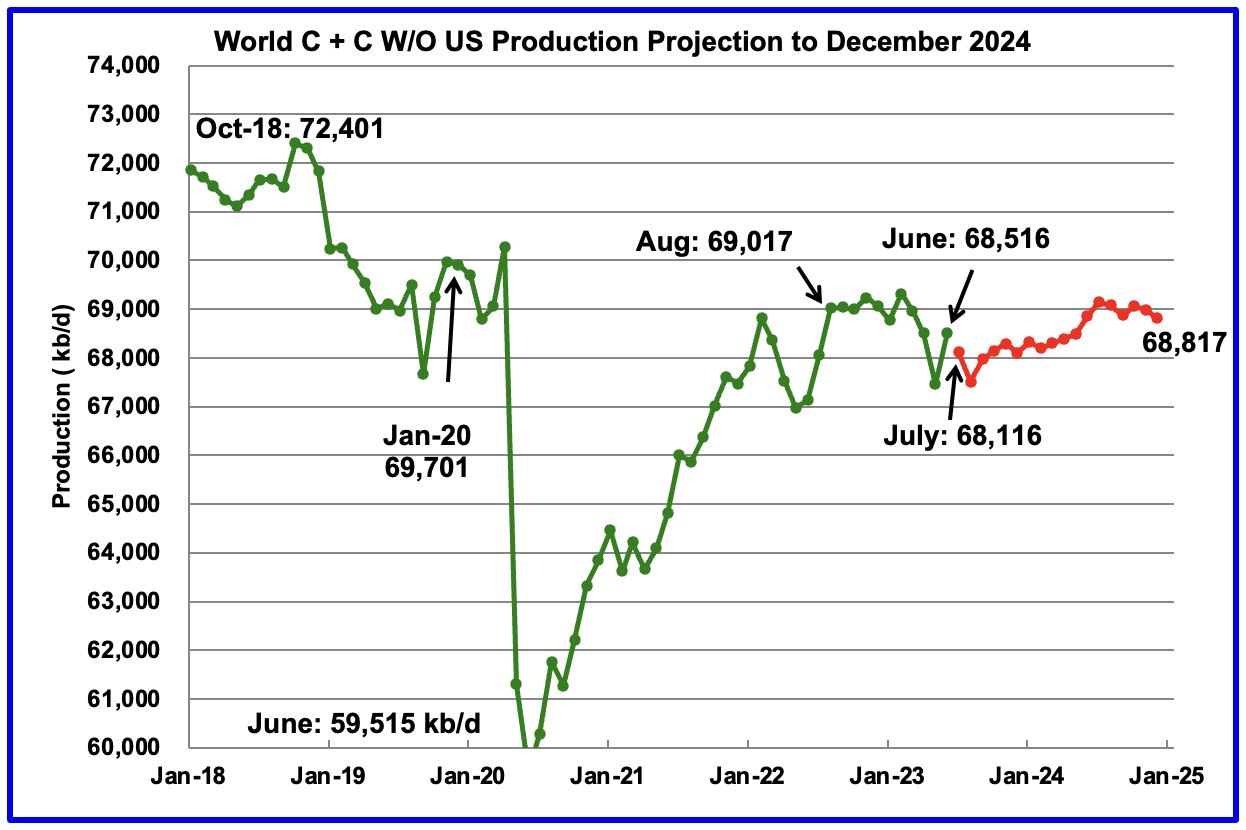
World without the US oil output in June increased by 1,057 kb/d to 68,516 kb/d. July’s output is expected to drop by 400 kb/d to 68,116 kb/d. December 2024 output of 68,817 kb/d is 3,584 kb/d lower than October 2018 output of 72,401 kb/d.
Note that World oil production W/O the U.S. from August 2022 to December 2024 is forecast to decrease by 200 kb/d.
162 responses to “June Non-OPEC and World Oil Production”
The below link is to a Joe Blogs YouTube video.
RUSSIAN Economy Collapses as Russia Declares Dramatic Fall in Oil & Gas Revenues & Higher Deficit
The below chart is a screen grab. The data is in billion Russian Rubles. Each line is a yearly accumulating value from January 2021 to August 2023, Note that the total yearly oil and gas revenue in Augusr 2021 was 15,698,000,000 rubles. In August 2923 it was 4,836,000,000 rubles.
The MinFin link is here:
https://minfin.gov.ru/en/document
We can’t be sure whether the numbers are correct or what the objectives are
Alexander Novak: Russia will exceed the plan for oil and gas revenues in 2023
October 14/ 07:12″Moscow. Russia’s oil and gas revenues have increased this year, they even exceed the plan. This was announced by Deputy Prime Minister of the Russian Federation Alexander Novak.
“Oil and gas revenues have grown this year? They have grown. And they are even exceeded based on the results of the year, which the Ministry of Finance recently told us about,” he said.
The Ministry of Finance of the Russian Federation reported, reminds TASS, that the federal budget of the Russian Federation for January – September 2023 received 5.575 trillion rubles in oil and gas revenues, which is 34.5% lower than a year earlier.
This dynamics is associated with a high comparison base for last year, a decrease in price quotes for Urals oil at the beginning of the year, lower prices and a reduction in natural gas export volumes, the Ministry of Finance explained. At the same time, the monthly dynamics of oil and gas revenues remains at a level significantly higher than their base size of 8 trillion rubles per year.”
—–
Ron, I have little interest in this topic, but this message does not mention the fact that the ruble to dollar exchange rate in August of this year jumped from 73 rubles per dollar to 98 now.
Ron, I have little interest in this topic, but this message does not mention the fact that the ruble to dollar exchange rate in August of this year jumped from 73 rubles per dollar to 98 now.
Wow, I never even thought about that! They are getting far less rubles for their oil and gas and even those rubles are worth far less than they were a year ago. They are getting hit with a double whammy, Fewer rubles for their product and those rubles are inflated. In September 2021 their accumulated oil and gas revenew was almost 18 trillion rubles. It was down to 8.5 trillion in Sep. 2022 and down to 5.575 trillion greatly inflated rubles in Sep. 2023.
Thanks Opritov, you are correct. The Russian economy is in a lot more trouble than Joe Blogs indicated in that video. Revenew is dropping while that revenew is worth even less due to inflation.
When the exchange rate goes over 100.00 one Russian rubble is worth less than a penny. Where back when the exchange rate was 60.00 one rubble was worth 40 cents.
It’s a huge deal.
Check your math
That might explain why think oil will go to 25$ 😉
Math is right exchange rate at 100.00 one Russian rubble equals exactly a penny. At 50.00 one Russian rubble equals 50 cents. At 25.00 one Russian ruble equals 75 cents.
Oil might go to $150 before going to $25. It would actually seal the deal on my $25 oil call. Global depression will be the results.
Inflation isn’t the boogeyman in the room we need to be worried about. High oil prices are deflationary. Particularly when we know there is no money backing these higher prices.
This ain’t the damn 1970’s nor is it pre-2008 before Eurodollar market had a heart attack and resulted in a lot less dollars available to chase prices.
We’re in a dollar shortage globally. Treasuries are being sold to get dollars that are needed to do global trade because banks aren’t interested in lending. Think inverted yields for over a year.
When the yield curve start to un-invert is usually when the recession starts.
If 1 $ is 50 rubbles, then one rubble is 2 US cents. The rubble did not go down 40x.
HHH, Toby is right. at 60 rubles to the dollar, one rubel is worth 1.67 cents. At 50 rubles to the dollar one rubel is worth 2 cents.
This explains a lot about HHH’s understanding of economics 😂😂😂
@HHH
I thought you explained treasuries are needed for Eurodollar system as security for lending and supplying $s. So they should be in high demand and high price? You told of a shortage of collateral as reason for the $ shortage – now we have a glut of collateral.
This month the Rouble already traded various days under 100 to the USD. That was before the central bank introduced the last round of capital controls. Without a significant change to the budgetary predicament, I expect the Rouble to be back at those levels sometime next month.
On Mastodon some Russian folks have been hinting at cigarettes being used again as informal currency. There was even new legislation passed last Spring penalising the possession of large quantities of cigarettes.
Also, for an introduction on how to interpret exchange rates:
https://www.investopedia.com/terms/e/exchangerate.asp
“On Mastodon, some Russians hinted that cigarettes would again be used as an informal currency. Last spring, a new law was even passed penalizing possession of large quantities of cigarettes.”
—-
Where do you get this information from? I have never heard of the use of cigarettes as a means of payment. And the law was not about a ban on storage, but on a ban on transportation, so that contraband would not be brought from abroad without paying excise taxes and taxes, in the Russian Federation there are high taxes on nicotine-containing products, unlike some neighboring states. By the way, life and consumption of services and products have not changed much over the past two years. Although official annual inflation does not exceed 6%, I still think it is somewhat higher, but not critical. But the price of food has not changed for almost a year within 6%, and if you count in dollars, it has dropped significantly. Automotive fuel is traded within 50-60 rubles per liter. Rent payments (heating, electricity, gas supply, garbage collection, etc.) are planned to rise by 4- 6% per year.
For example, I pay for my apartment (I live alone) about 6,000 rubles a month, unlimited Internet and mobile communications cost 680 rubles. Healthcare is free and of good quality, in the last 15 years I have been in the hospital three times for 14 days, although I have to buy medicine with my own money. Although I wouldn’t go to a free dentist. What has really become more expensive are cars. Western cars have disappeared from sale, and Chinese ones have risen in price by 200-300%. Tourist trips have also risen in price (the most popular destinations are Egypt) by 50-80%.
I haven’t noticed anyone dissatisfied with the government’s actions, of course there are such people in Moscow, but I haven’t even heard of any actions.
I reported this video some weeks ago as the figures presented in that graph and a few other tables are false. Either Joe can’t read Russian or does not understand what cumulative statistics mean.
In any case, Russia keeps running a sizeable budget deficit, with visible impact on the Rouble, sovereign debt (something new in Russia) and dwindling foreign currency reserves. This summer they started selling gold from the sovereign wealth fund, always a symptom of stress. If the government does not correct this trajectory in short order, Russia will eventually experience a currency crisis like that of the 1990s.
Luis, yearly cumulative revenue statistics means cumulative revenue, from the sale of oil and gas that year to any given date after January 1. August cumulative oil and gas revenue means the total cumulative revenue earned, from the sale of oil and gas, between January 1 and August 31. Joe knows that but apparently, you have a different explanation. I would love to hear it. Please give us your explanation of cumulative statistics.
But thanks, you did give us one explanation that Joe could not figure out. That is where all that extra, non-oil and gas revenue, came from. It came from gold sold from their sovereign wealth fund. Mystery solved. Thanks.
Good read on Exxon Pioneer and the permian basin. Believe it or not.
‘As big as Saudi Arabia’: the Permian oilman who sold Pioneer to Exxon
https://www.ft.com/content/ac41fd5b-dcd8-4a12-8c81-f10df7cc4c8a?ftcamp=traffic/partner/feed_headline/us_yahoo/auddev
bigger theme is how dedicated and optimistic people get things done despite the naysayers. But also point out how during the growth period both in terms of production and technology there were “smart” people on both sides of the debate. Perhaps I was a bit hard on the some here, while they were wrong “bigly” it was not that the points they made were entirely without merit. But alas at the end of the day those who were correct made a ton of money.
While being correct on the pages of POB seem like a scarlet letter, it look like I was right on nat gas prices as opposed to Steve who I hope at the good taste to inform his readers he really does not know sh!t about nat gas. Nat gas is now knocking on the door of $3.50 as I predicted. Also looks like my inflation outlook was correct now with two months of higher inflation, the trough this last summer may be the low for long while as inflation expectations as well as the government policies building it in. Shortages will continue. As I also predicted geopolitical risk would increase due to the skeleton we have as a president. So all in the all its events are playing out much like I had expected. The non existent green energy transition now takes a backward to real world events and the domestic energy sector will be called on to come to the rescue once again. The road goes on forever and the party never end….
Texasteatwo,
Article you linked is behind a paywall.
Regarding energy transition see data at
https://www.energyinst.org/statistical-review
In 2018 World primary energy consumption was 581 EJ and in 2022 it was 604 EJ, and increase of 23 EJ over that 4 year period. World fossil fuel consumption was 488 EJ in 2018 and 494 EJ in 2022, and increase of 6 EJ over the 4 years from Jan 2019 to Dec 2022. So 6/23=26% of the increase in primary energy consumption was from fossil fuel and 74% of the increase was from non-fossil fuel. Of the 17 EJ of non-fossil fuel increased consumption, 14.6 EJ came from wind and solar or 63.5% of the increase in World energy consumption over the period from Jan 1, 209 to Dec 31, 2022.
The transition will take time, but as fossil fuel resources deplete and become more expensive and as wind and solar energy prices continue to fall the speed of the transition to non-fossil fuel is likely to accelerate.
I am not in this for the money, just to inform people about peak oil and other problems facing humanity and to offer a forum for polite discussion.
Dennis
How many wind turbines there are is irrelevant. All that matters is how much fossil fuels are burnt. Total liquids consumption is at it’s highest rate ever, coal consumption has torn through previous highs and gas consumption is set to continue to increase.
Move the graph dates up to 1960 and you will realise just how extreme coal, oil and gas consumption levels are now.
https://ourworldindata.org/co2-emissions
We have been warned about tipping points and it has been reached in the permafrost regions of the Arctic. It is now melting and nothing can stop it, releasing billions of tonnes of CO2 and methane.
https://www.thearcticinstitute.org/permafrost-thaw-warming-world-arctic-institute-permafrost-series-fall-winter-2020/
I do find that people who cannot cope with this reality usually respond with some flippant and ridiculously hopefully solution.
Charles,
The growth rate in fossil fuel use has been quite slow from 2018 to 2022, with a growth rate of only about 0.3% per year. Fossil fuel use will peak and then decline, the faster alternative sources of energy are put in place, the faster will be the decline in fossil fuel use.
Yes fossil fuel use is much higher than in 1965, about 495 EJ in 2022 vs about 145 EJ in 1965.
Not much we can do about the fuel that has been burned, we need to burn less in the future.
Here is the gift version of the article:
https://on.ft.com/48Ph6s2
rgds
WP
Thanks Weekendpeak.
A nice piece. I hadn’t realized that Sheffield was one of the leading voices pushing for the export ban in 2015 (as stated in the article, I have not fact checked this).
For TEHAUS,
You stated this eloquently in your comment:
“While being correct on the pages of POB seem like a scarlet letter, it look like I was right on nat gas prices as opposed to Steve who I hope at the good taste to inform his readers he really does not know sh!t about nat gas. Nat gas is now knocking on the door of $3.50 as I predicted.”
Everyone has an opinion, but the data suggests otherwise.
Europe Natgas Inventories are now 97.2% full and can continue to add more natgas to storage for the next 4 plus weeks. Last year at this point, Europe’s natgas inventories were 90% full.
I have stated to my subscribers, without any massive Geopolitical events, the Supply & Demand fundamentals for Natgas continue to be BEARISH on the short-term while the opposite is true for Oil. However, we are now seeing massive geopolitical events take place. So, that does change the dynamics.
Regardless… it’s no coincidence today that as oil jumps by 4.3%, natgas is down 3.5%.
When the natgas price punctured through the Resistance Level of $3, traders came in and pushed the price much higher. If these Geopolitical events do not escalate, I believe natgas will become weaker in the months ahead.
But, of course, in 2024 and onwards, we will likely see new highs for natgas.
steve
Steve,
So you still think $1/MCF in the short term?
D COYNE,
Not likely, but not out of the question. Too many Geopolitical events taking place for $1 natgas.
However, I do think if the Geopolitical events do not escalate too high, we will see the low $2’s for natgas likely in the next 1-3 months.
But if the Middle East situation escalates considerably, then likely higher natgas prices.
steve
Steve
Maybe European storage capacity is not a good statistic to use to predict NG prices any more. Germany is rapidly building LNG importing facilities to regasify the LNG. Once storage is filled the LNG can then be used for industrial/chemical use and heating.
Germany plans to build 70.7mn t/yr of peak LNG import capacity by 2030, German economic ministry BMWK documents and planning applications by German energy firm RWE show.
Germany is set to be the fourth-largest LNG import capacity in the world by the end of this decade, behind South Korea, China and Japan.
To rapidly add LNG import capacity, Germany is turning to floating storage and regasification units (FSRUs) to add import capacity in the near term, some of which will be replaced by onshore terminals that are set to come on line in the second half of this decade.
https://www.argusmedia.com/en/news/2422417-german-lng-import-capacity-to-hit-707mn-tyr-by-2030#:~
Spanish LNG sendout climbs as German demand rises
Spanish LNG sendout rose yesterday to its highest since 24 August and could remain strong today, spurred by robust import demand from Germany.
https://www.argusmedia.com/en/news/2493836-spanish-lng-sendout-climbs-as-german-demand-rises
Yeah, our green government is fully ideology driven.
Importing all the LNG – because tapping the own gas deposits is unecological. Fracking in Texas is wide away, but in north Germany it’s ick and ugh. Transporting the gas around the glove is ok as long as you don’t see a derrick here.
Being complete on CO2 saving and having the TV and Radio 24/7 on full propaganda mode – and shutting down the last 6 running nuclear plants the last 2 years instead of shutting down the 6 worst brown coal burners.
They can’t even build a new railroad anymore because of ecological groups protesting.
I can’t take this government serious anymore.
I suspect that most people on this forum failed to realize that texasteatwo is actually Scott Sheffield with bad grammar: the leading expert on all things having to do with shale oil and gas, geology, international supply and demand, geopolitics, and the general state of the derivatives market. I shall miss him sorely, as I’m sure Netanyahu will call him soon to act as an adviser to the Israeli invasion of Gaza. He is clearly a legend in his own mind, which probably means that he drives a faded Saab ragtop in need of a valve job, drinks watered-down house beer, and puts ketchup on his flank steak at Roylita’s Bar and Grill in Hobbs. What an honor to be able to tap into this font of knowledge without paying a subscription fee! It is akin to touching his garment.
ROTFL
Someone alert the burn ward, this is a third degree job.
https://www.sharecafe.com.au/2023/10/13/exxons-shale-deal-ignites-oil-merger-wave-including-australian-interests-in-the-beetaloo-basin/
Exxon Mobile’s deal to acquire Pioneer includes interest in Australia’s Beetaloo Basin.
Let the fracing of Australia begin!!
The Beetaloo is a giant EARTH FART from my unqualified opinion.
Would love to hear from oil pros and talented posters if there is any OIL potential there?
“And the Beetaloo is pretty well regarded by those in the business as the next big thing,” Mr. Riddle stated.
Andre,
The Beetaloo has been popping up off and on for a few years now as a potentially large source of hydrocarbons.
With all the chest thumping frequently displayed by promoters, one would be prudent to approach these matters with a healthy dose of caution.
That said, the three operations currently (last time I checked) underway in the Beetaloo show very strong indications of excellent hydrocarbon recovery … mostly natgas with a smaller footprint of oil.
The targeted zones are relatively shallow (~7,000 feet) and experienced American technicians are assisting in the design/development of these wells.
Just as the Vaca Muerta has recently obtained a Super Spec rig, the Aussies could leapfrog much of the ‘learning curve’ of American and Canadian operators and ramp up production in a relatively short time.
A pipeline for the natty would need to be built from this remote region to supply the gas-starved south eastern Oz.
Weird as it may sound, Australia is quickly running out of natgas and could well import LNG from the US in future years. Preposterous sounding?
Of course.
But the economics, contracts, as well as the location of Australian LNG might prove more daunting for local supplies than west coast (from Mexico) Permian LNG shipped to Australian FSRUs … several of which are in development.
Quick follow-up on the Beetaloo …
Some short speed reading reveals some exceptionally bullish info on this emerging story.
A Super Spec has arrived in Oz and just drilled a 10,000 footer (TVD) in about 3 weeks’ time.
Preliminary analysis shows ~300 of relatively porous hydrocarbon bearing rock.
Most intriguing is that this confirms formation continuity with another well 100 miles away. This suggests one million square acres of Marcellus-tier potential.
Story unfolding over the next several months, it would seem.
Thanks for the link, Andre.
“He’s made a big play in the Beetaloo,” stated former Empire chairman Paul Espie.
“What his endgame is – you can come to your own conclusion.”
Thanks for your analysis coffee!!!
Another perspective from a completely unqualified person
Why is Exxon Mobile betting on Natural Gas???
What do they know about oil exploration?
Andre,
While I certainly cannot speak for Exxon, there are several reasons why many of us observers are extremely bullish on natgas … economics being the number one factor.
As one barrel of oil contains the equivalent in heat energy of 5,800 cubic feet of natgas, a strict oil-to-gas financial/energy conversion would price oil today at under $15/barrel.
On the production end, the Appalachian Basin is producing almost 6 times the Bakken in heat energy content (~35 Bcfd natgas versus 1.2 million bbld oil) with almost the same number of rigs (~40 versus ~35).
The big hurdles of handling natgas primarily involve both infrastructure and hardware.
Once pipelines are built, the treated product can flow to markets at relatively low cost.
As natgas has become abundant throughout the US (New England being a notable exception), there has been a growing trend to utilize this comparatively cheap energy source for many end uses, electricity generation being a biggie.
Whereas transportation has been oil’s historically dominant role, new hardware is poised for natgas to have significant impact in this arena.
(One can, today, fill up an empty 32 Gallon of Gasoline Equivalent [GGE] vehicle for under 32 bucks in Oklahoma City. Much of Ohio sells retail CNG [Compressed Natural Gas]for under 2 bucks per).
Other factors such as cleaner combustion come into play, as well as near limitless supply.
Informative energy project site from the NT-
https://territorygas.nt.gov.au/home
includes info on the gas field, infrastructure corridor to Darwin, and the big SunCable project (Darwin to Singapore).
Looks like Darwin as a LNG hub will be huge.
https://territorygas.nt.gov.au/gas-strategy/our-gas-led-growth-story/expand-darwins-world-scale-lng-hub
Rig and Frac Report for October 13
Rigs Up. Fracs Up
– US Rigs up 4 to 449
– Permian rigs up 1 to 293. Texas added 4 while NM dropped 3.
– Eagle Ford up 2 to 47
– NG down 3 to 104 (not shown)
Fracs Up 3 to 260
Fracs by County and Basin
Attached is a Frac Spread table for the week September 2 to September 8 as extracted from the October 13 Frac Focus CSV file.
For the week ending September 8, the official Frac focus site reported 252 frac spreads. This updated, 5 weeks delayed, analysis found 266. The table only shows counties with more than four operating frac spreads.
The largest number of frac spreads continues to be found in New Mexico’s Lea county and Colorado’s Weld county. A new Texas county, Gonzales appears in the top 6. Notably absent is Martin county with only 3 fracs.
The table also shows the number of days to took to Frac each of the 23 wells in Lea county and the 15 in Eddy county.
Maybe one of our experts can explain the variation in time to frac these wells. Clearly length is a factor. There is a factor of two between the shortest and longest frac in Lea county. Length is a possibility for Lea. However the top to bottom ratio is closer to 6 in Eddy county and the top 4 in Eddy take double the number of days of the top 4 in Lea.
Ovi,
The increasing adoption of simul frac’ing may be the main reason behind the wide differences between time on location for completion operations.
Using new hardware, 2 wells can be stimulated while an adjacent 2 are being perforated.
Amongst other consequences, this optimal four-wells-at-a÷time approach favors deep pocketed companies as a significant amount of capital is expended before any revenue is generated.
Just one more reason behind the ongoing consolidation in the upstream sector.
Coffeeguyzz
Thanks for the update on simul fracing. I assume these frac spreads must utilize a lot more equipment than found on a single frac spread.
Ovi,
Using the longitude latitude info at frac focus, you might be able to see if the frac spreads are in the same place working on multiple different wells from the same pad, so in effect what you would see in the case of a frac spread working on a pad with 4 wells being completed at once is 4 wells listed with very similar locations, not clear how easy it would be to pull that nformation from the Frac focus spreadsheet or database ( I don’t know which you are using ).
Dennis
Interesting thought. Attached is a table showing four of those Lea fracs. The latitude is identical for these four wells and the end dates are one day apart between the top two and bottom two. It looks like a good candidate for a simul frac.
One can calculate the longitudinal separation using the difference in longitude. At 32º latitude, the Earth’s circumference is close to 34,000 km. Checking the distance between the first two gives:
34,000*0.00007/360 = 0.0066 or 6.6 metres. Same for the next two. So this could be a simul frac. These were 21 day fracs with slightly different vertical depths.
This raises another question if it’s a simul frac. Is this 1 frac or 4. Does this explain why the frac numbers I get are slightly on the high side relative to the official report?
I use the CSV file.
Ovi,
I imagine each of these rows in the spreadsheet represents an individual well. As to how we properly count the frac spreads operating, I would think there is on frac spread working on a set of 4 wells and we would count this as a single frac spread, but industry insiders would know more than me, obviously.
Dennis
Here is the issue as I see it. When one Frac Spred meant one well was being completed, completed wellls and spreads were the same.
Now when one Frac Spread can complete 4 wells, we need to decide what is more significant, completions or Frac Spreads. In term of future production, completions are more important.
Ovi,
I agree completions are more important, if you count up monthly completions using the frac focus spreadsheet, you will find the the spreadsheet is not complete beyond about April 2023, if you compare novilabs data for Permian with the data from the fracfocus spreadsheet. We just do not have very good data on completions after April 2023 at present. The best data is the output data from the EIA’s PSM in my view, everything else for the most recent 6 to 12 months is not very good.
It has been a long time (probably 5 years or more) since there was a one to one correspondence between frack spreads and completions. One way to see this would be to look at total frack spreads reported by primary vision and the completions reported in the DUC spreadsheet over time. From Feb 2020 to October 2022 about 3.7 wells were completed per frack spread operating in the US on average.
Data for completions per frack spread for US tight oil and shale gas. The average from Feb 2020 to April 2023 (data in chart below) is about 3.7 completions per frack spread for US tight oil and shale gas.
Ovi,
I no longer follow these matters as closely as I once did.
My (limited) understanding is that while the number of units in the spreads is still roughly the same, the capacity (aka horsepower) has increased dramatically.
Curiously – to me, anyway – that the latest iteration of preferred cluster perforations is a single entry point per stage located at the 12 o’clock position.
I think the ‘bigger story’ regarding shale in the coming years will be increased hydrocarbon recovery.
These guys will simply not sit back and leave ~85/~90 per cent of the oil in the ground.
Way, WAY too much time, effort, money and infrastructure has been expended over the years to leave all that oil just sitting there.
Above–
Not all shale is created equal, not just in oil density but permeability. Some of the shale of the oiliest reservoirs is in the nanodarcy permeability range and hard to crack into a good network of fissures. Some of the less oil dense shale is in the darcy range and cracks like a hen egg. A good example of this is the multi-laminated shale in the midst of previously “condemned” acreage in Dunn County North Dakota, where a number of monster wells have been developed and also where the fabled halo effect is most likely to occur. Enhanced cluster perforation, custom designed for the permeability of the rock, could be an exciting next chapter in the shale story. Equally intriguing is the maintenance of micro reservoir pressure using a washout solvent such as ethane gas or even CO2 for miscibility of the longer hydrocarbon molecules that clog up distal pores. A largely unsung story is the plateau, if not growth, of Bakken production using the same paltry squadron of rigs and fracking units. That is no accident.
Mr. Maddoux,
Yeah, the Bakken is chugging along at 1.2 million barrels of earl per day with only ~35 rigs working. (Still looking for that Red Queen. Anybody see her lately?)
Up in the northern region of the Ohio Utica – Columbiana county, specifically – Encino has a 4 well pad with production averaging over 500 bbld for first half of 2023. This is up from virtually nothing for this county in all of 2022.
Reports are circulating of a renewal/expansion of leasing activity in this area.
Coupled with EOG’s surprising, very large (re)entry into the App Basin, something sure seems to be afoot in the Buckeye state.
Almost a decade ago, an outfit (Enervest?) drilled a handful of horizontals targeting the Clinton sandstone. Depth was about 3,000 feet with short (~4,000 foot laterals.
Early output was somewhat respectable, but nothing further came of it, as far as I know.
These upstream guys are exceptionally innovative, resilient, and – as stated by the then-retiring CEO from Halliburton – people you definitely do not want to bet against.
Ignorance on display here. The Red Queen process is simply replacement of depleting wells with new wells. It’s nothing more than that — sure there are efficiency improvements over time and as the lateral length increases, but you would have to believe in tooth fairies to deny this iron-law property of finite & nonrenewable resources.
https://rbnenergy.com/sites/default/files/field/image/Fig1_Bakken%20Crude%20Oil%20Production%20and%20Rig%20Count%2C%202010-20.PNG
Coffeeguyzz,
Much of the oil will be left behind as it it not economical to produce it, they are not likely to do better than 10% recovery and on average it will probably be around 6% or so.
Dennis,
LOL.
While I greatly respect your long running efforts with this blog, the Ancient Greek tension between Mythos versus Logos frequently comes to mind whenever you make these sweeping projections
Just keep on keepin’ an eye on these crazee geopolitical events unfolding in real time and watch how truly crucial is the necessity of affordable, reliable energy.
Hydrocarbons will continue to provide that assurance far off into the future.
Gar. Own. Teed.
Your wishes don’t make it so. In Stoicism, one is encouraged to accept the world as it is, rather than how one wishes it to be. BTW, Stoicism was founded in Athens by Zeno of Citium in the early 3rd century BCE.
Coffeeguyzz,
Bakken URR is likely to be about 10 Gb, OOIP estimated at about 400 plus or minus 100 Gb. Recovery rate about 10/400=2.5% with a range of 2% to 3.3%. To get to a 6% rate of recovery would require a URR of 18 Gb if we assume the OOIP is only 300 Gb. That is not very likely.
The OOIP estimate for the Permian tight oil resource is about 1800 Gb, URR (TORA from BEG of Texas) is likely to be under 50 Gb, which would be a recovery factor of about 3% (if 50 Gb is achieved).
https://www.beg.utexas.edu/tora/challenges
ND Director Cut came out THU and showed good growth. Above 1.2 MM BOPD now. Helms said earlier this epuld happen at year end. The growing ability to do 3 mile laterals is making tier 2 acreage competitive with 2 or even 1 remaining mile parcels in the core. Helms even noted some land speculation returning to Divide County.
My account here may be compromised.
Dennis et al, take note that ‘RE’ is OFM. Something odd going on there.
Gasoline prices have decoupled from oil prices at least since about September 13th. Economic reality starts to catch up.
Oil storage is low and gasoline prices are still falling.
Remember if you believe the FED’s rate cuts or hikes matter. Effects take 18 or so months to show up. So even if they do cut to zero again it simply doesn’t matter for 18 months. If at all.
Global collateral, mainly government bonds have lost something like $70 trillion in value due to rising interest rates. So when it comes to borrowing. It’s just not possible to create the same amount of dollars or other currencies that we use to be able to create.
Money supply is in contraction. So the higher oil prices go. The more damage that’s occurring in economy. We heading straight into a crisis not a recession.
The Fed is reversing in collateral at par, even if bonds are trading at prices lower than that. So banks that have direct repo lines with the Fed are good (well, effectively subsidized of course) so it is banks/institutions that don’t have access to those repo facilities that are facing real issues with respect to their HTM portfolios. If they have to liquidate there is a hight probability that there will be more SVBs coming out of the woodworks.
rgds
WP
https://www.youtube.com/watch?v=mbqQeooSVu4
Not highly relevant but of considerable interest as a historical item. This is about the last known commercially working rod line powered oil field pump. The owner is keeping it working for old times sake mostly, the same way farmers kept a horse or mule for a generation or two after going with tractors.
Anybody with hands on experience with old machinery will love it.
A family in our field still has many wells that they operate with rod lines and a power. They are trying to sell them, last I knew. Wells drilled 1905-10.
You are referring to shackle lines?
Yes. I’ve heard them called both here.
Shallow (and perhaps Mike) may find this Oklahoma stripper man’s channel of interest.
How to fix the 7Kv transformer driving your pump jacks…
https://www.youtube.com/watch?v=3RgwOYGdGCk
(back into lurk mode)
Oops, when I say Oklahoma, I meant Texas. I find his channel fascinating.
Here he describes how a 70 year old stripper can still kick after a long rest:
https://www.youtube.com/watch?v=L7HQVa6e84s
I’ve watched some of his videos. I think he has wells in both Texas and Oklahoma.
As I recall, he has at least one well running with shackle rods, also called rod lines in my area.
Hi Shallow, yes, he has a well running with rod lines for fun.
There was a youtube stripper operator from Oklahoma (also had a well running on a rod line), he had similar content, but pulled everything because of insurance worries.
Attached is a chart that compares the EIA’s estimate for ND oil production vs the sum of oil production from counties as published by the ND Department of Mineral Resources.
For the latest months, It is possible that some counties are slow reporting.
Ovi,
See
https://www.dmr.nd.gov/oilgas/stats/historicaloilprodstats.pdf
North Dakota C plus C in kb/d from NDIC from Jan to Aug 2023
1062.88
1159.036
1124.897
1135.823
1134.995
1166.636
1180.692
1219.345
Comparing the July NDIC estimate (1181 kbd) with EIA’s estimate, we find the EIA estimate is lower (1174 kb/d).
You may be using the DPR estimate which includes output from both North Dakota and Montana (Bakken is in both states). Montana and North Dakota C plus C output is about 1232 kb/d in July 2023 according to the PSM (July is the most recent month reported).
Dennis
As stated above, the chart compares the EIA’s estimate for ND oil production vs the sum of oil production from the ND counties. The issue being addressed is the lag between the counties reporting and the EIA estimate which is close to the DMR estimate. So the DMR must have some correction factor to compensate for the lag in production data being provided by the counties since the DMR is saying August production 1,219 kb/d, ignoring the decimal points. The last data point for August is an estimate for ND that the EIA will post, based on the published August DMR report.
The DMR is reporting August production as being 1,219 kb/d vs the sum of counties which is 1,119 kb/d. So ND has a correction factor and then the EIA adds their correction factor or maybe they use the county data and have their own correction factor. Not clear how these numbers are created. Makes one wonder where those decimals come from. Certainly gives false sense of accuracy.
Not sure what the problem was before July 2021. After that the dsicrepency is of the order 10 kb/d but diverges after January 2023, which as noted may be due to a lag in reporting data.
DMR updates their past production data close to 15 months back, each month.
Ovi,
I don’t bother to look at the county data, I just look at the total reported by the State. Where are you finding an EIA estimate for August for North Dakota?
The EIA estimates North Dakota output by surveying the largest producers in the state that produce about 90 to 94% of total output, then they make an estimate of the balance from the smaller producers. From Jan 2021 to December 2022 the initial 914 estimate was on average about 98.5% of the reported state output, so the initial EIA estimates are conservative on average and are later revised higher to match the state data.
See compstat speadsheet at link below.
https://www.eia.gov/petroleum/production/
and also
https://www.eia.gov/petroleum/production/pdf/eia914methodology.pdf
The document linked above explains the EIA’s methodology for the PSM estimates.
Note that the North Dakota county data does not include “confidential wells”, the NDIC makes an estimate of the output from the confidential wells (for August about 100 kb/d and in July about 70 kb/d) but does not reveal which counties that production is coming from as that information is confidential.
From title of county oil production pdf
ND Historical Barrels of Oil Produced by County
(Confidential Wells are Not Included)
I did a quick check at Novilabs and as of May 2023, the top 13 oil producing companies in the North Dakota Bakken produced about 90% of Bakken/Three Forks tight oil output, so probably only the 13 or perhaps 14 largest oil producers in North Dakota are required to fill out the EIA’s 914 survey which the EIA uses as the basis for their estimate for North Dakota’s output for the most recent 7 to 19 months.
The EIA currently uses state data through November 2022 for North Dakota and the estimates from December 2022 to July 2023 are based on the 914 survey and the historical relationship between the 914 survey and state data from Jan 2015 to November 2022. The EIA updates its final estimates in August of each year to match with state estimates up to 7 months prior in the case of North Dakota, for Texas they go back 13 months because the data lag is longer there compared to North Dakota.
Dennis
I though my response above was pretty clear: “The last data point for August is an estimate for ND that the EIA will post, based on the published August DMR report. I checked the last few months and the EIA values were slightly lower than NDIC, but not different enough to be noticeable on the chart.
As for the confidential data, production from the two sources from July 2021 to January 2023 is pretty close. Can’t say if that is due to confidential wells or just continued late reporting.
Not sure where this information came from: “The EIA currently uses state data through November 2022 for North Dakota”
Attached is a chart comparing ND production data and EIA production numbers from January 2019 onward. There is a slight discrepancy between the two starting in January 2019. Clearly the EIA is not updating their production to coincide with ND.
Ovi,
Not sure why there is that discrepency in 2019, for most of the period the data is a near exact match.
The state data does change over time, below is an older data set from Feb 2021 compared with current data fro Jan 2019 to June 2020
1347, 1404
1283, 1337
1340, 1394
1336, 1393
1337, 1395
1368, 1425
1390, 1446
1424, 1481
1389, 1444
1462, 1519
1461, 1519
1420, 1477
1375, 1432
1399, 1455
1380, 1435
1178, 1226
829, 862
855, 895
Data for ND from NDIC.
Dennis
I am comparing NDIC with EIA since your response implied that EIA updated their past info to conform with ND.
Ovi,
You would need to look at compstat spreadsheet to see what I am talking about, what the EIA has for state data is different from what is currently reported by NDIC, my previous comment was to show that the state data does not remain static, it changes over time. The EIA updates their data each year in August (Petroleum Supply Annual) notice in compstat spreadsheet the change from EIA 914 to EIA final estimate and the match with what EIA thinks the state data is, they may only update this State data once per year for data more than 18 months old.
https://www.eia.gov/petroleum/production/xls/comp-stat-oil.xlsx
Ovi,
Below is data from EIA’s compstat spreadsheet on 914 report page of EIA for North Dakota.
There might have been an udate to ND state data since the EIA grabbed this data, estimates can always change.
Note also that the EIA estimates are lower than NDIC estimates for every month you report above, that is the EIA estimates are conservative.
Dennis
We agree on the EIA data. Below is the data published by the DMR in their monthly PDF update. This is a screen shot for 2019 daily oil in kb/d, rounded. Not clear where your ND data comes from.
ND Dennis
Jan 1404 1320
Feb 1337 1377
Mar 1394 1374
April 1393 1376
ND data source
https://www.dmr.nd.gov/oilgas/stats/historicaloilprodstats.pdf
Dennis
The EIA numbers in the above blue table are out by one month. The January 2019 number is actually February.
https://www.eia.gov/dnav/pet/hist/LeafHandler.ashx?n=PET&s=MCRFPND2&f=M
Hi Ovi,
There is a link in my comment, I will repeat it.
https://www.eia.gov/petroleum/production/xls/comp-stat-oil.xlsx
In that spreadsheet, go to North Dakota tab (ND). and the State Data Column and EIA Final cloumn have been reproduced in the blue image. Yes it is different from what is currently reported by the NDIC, but notice the change from old data I downloaded in Jan 2021 from NDIC with current data. The difference is fairly large about 4% lower for the earlier estimate (downloaded in early 2021) for Jan 2019 compared to the current NDIC estimate for Jan 2019. The estimates change over time.
Comment linked below
https://peakoilbarrel.com/june-non-opec-and-world-oil-production/#comment-764888
Ovi,
Yes, I messed up the data and was off by a row, correct data below.
Sorry. Screengrab below is from compstat spreadsheet for North Dakota.
Dennis
Why is the column “Current Reported State Data” different than the ND pdf file which is updated and backdated every month.
I think “Current reported state data is what the EIA is reporting as its final production number not ND.
Also note the Enverus production is very close to the ND PDF numbers.
Ovi,
The Enverus numbers are usually different from the State data. The difference in the numbers is the lag in time from when the compstat data was pulled and today. The 914 report was published at the end of September, the data should have been data from Sept 2023. The Enverus data was downloaded on Sept 1, 2023, the State level data might be from before Sept 1, 2023. It is not clear when the EIA pulls the State data.
It is also possible that the EIA adds up the county data as you did, which would leave out the confidential well output.
Also the EIA has a specific policy for revising oil and natural gas data, see link below
https://www.eia.gov/petroleum/production/pdf/eia914revisionpolicy.pdf
Dennis
The question that needs answering is why is the EIA data different than what ND reports.
Ovi,
The question was answered. The estimates reported by North Dakota may have changed from Sept 14 to October 12 (when the most recent North Dakota data was released). When the next compstat spreadsheet is released on October 31, we can compare with the North Dakota data (from October) at that time. We don’t have the ND data from Sept 30, 2023 (or I don’t in any case).
Also when Nov 14 comes around and the next round of NDIC data is released we can compare with the October data to see how it has changed.
North Dakota is notoriously inept re’ oil & gas data collation. Either way, it’s truly remarkable that with only 35 rigs running, the production is flat to (maybe) up a bit. Consider that in July 2023 there were 18,179 wells pumping in the Bakken, ranging in age over the last ten years. Just 35 measly rigs are leveling out the decline for this whole “mature” basin. That’s an absolutely astounding demonstration of methodical planning and execution: spacing, reservoir pressure, fracture design. Some of these new wells were drilled in areas that were designated “condemned” just five years ago (Tier 4). Some are in Divide County, where the shale benches aren’t all that thick (Tier 3-4). I’m something of a cheerleader, but I’ll tell you, some of the finest operators are in the Bakken, just plodding along.
How do the decline rates compare in the Bakken v other US shale basins for “older wells”?
Are re fracks adding significant production in the Bakken?
Hi Shallow:
I imagine all those old wells have about the same decline curves. My main point was that it doesn’t take much ongoing activity to keep level at this point in time, in the Bakken. That will end at some point. In every shale basin there is an occasional monster well, due to the oil density of the rock and the permeability. For a long while everyone thought the depth of the benches determined productivity, but the fractures expand out only so far.
Refracks? Not now, but in my estimation that’s the future. Most of those old wells that are chugging along were perforated along the same bias. I don’t see a reason why the ones with high millidarcy permeability couldn’t be perforated and cluster fractured on an opposing bias. Coffeyguyz alluded that refinements are likely coming in all shale basins–and I think he’s right. To be frank, there must be some reason why Exxon, a company that makes record profits would pay about twice what everyone thought Pioneer was worth. It is often pointed out how often Exxon stumbles, but they’ve prospered where a lot of companies haven’t.
I haven’t done a 180 on shale; I still prefer conventional myself, but I do think there’s going to be a renaissance of sorts, due to innovations in fracturing and the mobilization of washout solvents.
Gerry
Divide county seems to be a bit player in the Bakken. Not being critical, just stating a fact. Production in January went to 19.5 kb/d from 15 kb/d in December. Is that when that new well came on line.
Dunn is attached for comparison.
Divide County has indeed been a bit player. It may continue that way as its oil dense benches are very thin. My bet has always been that with precision geo-steering it will become productive. It used to be thought that the fracture spiderweb in shale went way out, but it usually doesn’t–especially in the nanodarcy and low millidarcy permeability range. Divide hasn’t even been traditionally considered to be in the oil play until recently. I own quite a bit of it and I’m still unsure that it’s going to pay.
But people act like the Permian is all great stuff. It’s not, just expensive. Some of it is goat pasture too, as Mike Shellman says. This shale profitability comes down to three or four things: oil density, permeability, water cut, gas cut. Unfortunately, some of the most oil dense shale doesn’t fracture extensively and some of the most prodigious shale oil comes with beaucoup gas and water.
In other words, this is risky business, shale, but it’s damn near all we have left in America–it’s risky going for conventional oil too. We have some good shale that hasn’t been proselytized, like the beautiful Uinta past the Douglas Arch going from Colorado to Utah. It has a perfect gravity of 38, is free of sulfur and toxins, and it a perfect blending crude. The Permian has attracted the talent because of infrastructure, an almost sure thing of at least breaking even, lax venting and flaring, and you’re going to “strike oil” when you drill. Having drilled a very expensive dry hole this year, that’s a very important metric.
Dunn County
Gerry Maddoux,
Perhaps I am missing your sarcasm. In my opinion North Dakota’s NDIC does an excellent job with its oil data, its job is a lot easier than Texas as there are perhaps 15000 oil wells rather than the 250 thousand wells or more that the RRC tracks.
Natgas Falls 5%… A Shocker
Gosh, that came out from LEFT FIELD 🙂
steve
https://www.oilystuff.com/forumstuff/forum-stuff/i-told-ya
I told ya! Mike Shellman @ oilystuffblog
scary stuff!
Andre,
Mike is reporting on the DPR which was picked up by Reuters. I agree with Mike that report is crap, I think we may see a plateau in tight oil output at around 9 Mb/d, but it will require fewer completions or the same number of completions with lower productivity per well.
Dennis
I disagree. The DPR flagged the dropping Tight oil and Permian peak three months ago. Not quite sure what Mike’s beef is. It will take another two to three months to firmly confirm what the LTO and Permian trend is.
Ovi, that is precisely what I suggested in MY post, on MY blog, that using Permian tight oil production as an example, US production was going down and it would take 1Q24 for people to realize it.
I made that statement based on falling rig counts in the Permian Basin. If you would actually read my post you would see I prefaced that prediction by suggesting longer laterals/front loading for cash flow=much steeper decline rates at >18 months, initial liquids productivity declining by as much as 10% per year, gas and NGL’s being a bigger part of the production stream, failing economics, fewer T1/2 locations, an understanding of pressure depletion and what GOR actually means, and accelerating, annualized legacy decline rates. Its a boots on the ground, actual checkbook kinda thing.
All these stupid EIA predictions get picked up by the press and create the illusion of abundance for the US public. Which is dung heap. We are in an inventory bind facing war on several fronts. So maybe its just an American thing to be worried about that, not a Canadian thing, in any case I have my audience and my personal reasons for posting what I do…none of which has anything whatsoever to do with the EIA, DPR, LTO, SPCAA, PETA and particularly not POB.
Dennis Coyne…I have NOT been “predicting ‘steep’ declines in tight oil for years and will eventually get it right;” that is stupid and insulting. I AM predicting a decline in 2023 Permian production and therefore not near the growth that was actually predicted for the year. Why?
I am worried about my country’s fucking future !!!!!!
Your statistical ‘trendology’ has worked fairly well in the past and your models have miraculously been reasonable… by shit house luck. By OPEC cuts and higher prices, which you did not predict, by higher initial productivity from longer laterals, which you did not predict, by the completion of DUC’s which you still do not understand and by abundant, never ending capital which you had NO idea would continue to flow into an otherwise unprofitable business model. You predicted years ago that all Permian debt would be fully paid back by 2024…you are only going to miss it by /-$90 billion.
I’d cool it on the insults, if I were you.
Unbelievable that you gents would try to school Shellman on the actual oil and gas business. His whole thesis addressed the godawful issues that this country (the USA) is facing. The SPR is half empty and the caverns are salting in. The Cushing Hub is just above sludge level. The majority of our domestic oil has an API gravity lighter than real oil and has to be mixed with a substantial aliquot of heavy crude before the Gulf Coast Refineries can use it and yet we blocked the Keystone XL and are dickering with Venezuela for their high-sulfur junk while the Middle East and the Baltic Region are simultaneously blowing up. We can’t manufacture our own JP8 fuel without importing middle distillates (C9-C16 hydrocarbon chains), and we don’t have much 9-16 stored up. He has tried to explain in the simplest of terms what a rising GOR means (to no avail), and the massive water cut in the Delaware (ditto), not to mention the fact that Exxon grossly overpaid for Pioneer because there was absolutely nothing else to buy, coupled with neither the incentive or time to go exploring. In other words, shale is the Okay Corral for domestic oil and gas production. In the midst of a potential emerging catastrophe you’re really going to dissect the veracity of production/projection numbers made up by some agency that couldn’t find its ass with a flashlight and a three-way mirror? This is rich!
Love it when the top talent posters chime in ( I am definitely not one of them ).
https://www.reuters.com/article/us-oil-sechin-idUSKCN0VJ0RB
And don’t think the USA’s enemies aren’t watching!
Gerry and Mike,
Care to guess how much the output from either US tight oil or Permian output will be in 2023Q1?
Mike,
Here is the price prediction I used in my tight oil scenario. I doubt it will be correct, in fact I am 100% certain that it will be wrong. On debt, the initial assumption was that all free cash flow would be used to pay down debt, instead producers have chosen to return money to shareholders with either share buybacks (which increases stock price) or paying higher dividends. I also incorrectly assumed natural gas and NGL prices that were too high NGL at 33% of crude price and NG at $3/MCF.
At lower NG price of $2.50/MCF, 25% of net revenue returned to shareholders and NGL at 25% of crude price and prices for Brent crude in inflation adjusted 2022 US$ per barrel the debt is not paid back until 2032, current debt for Permian basin for model is about $121 billion (about 31 B higher than the 90 billion you mention). The scenario for debt above assumes the completion rate falls to 375 wells per month. In August the completion rate was about 450 per month in the Permian.
Andre,
That article from 2016 claimed US tight oil would peak in 2020. Back in 2013 I was predicting a peak in 2018 for US tight oil with a URR of about 20 Gb.
In 2017 I posted this
https://peakoilbarrel.com/the-future-of-us-light-tight-oil-lto/#more-15160
where my best guess had a URR of about 47 Gb with a peak around 2023 to 2026 at about 5600 to 5700 kb/d.
My current expectation is a URR of about 73 Gb with a peak of about 9500 kb/d in 2028, current output is roughly 8500 Kb/d for US tight oil and output has benn increasing at annual rate of about 600 kb/d for the past 2 years and I expect future increases to be about 250 kb/d per year from 2023 to 2027. Alternatively, tight oil reaches about 9100 kb/d in 2025 and remains on a plateau until 2029 and then begins to gradually decline, URR = 73 Gb (cumulative output through 2022 is about 24 Gb of tight oil, 50% of URR reached in 2026).
Mike,
Sorry you deleted your post.
Don’t understand the point of deleting posts.For me, using blog posts as the equivalent of a lab notebook means that you don’t throw things out, as a blog documents what works, and just as importantly what doesn’t. Fascinating to go back and use it to track your path. https://i0.wp.com/imageshack.com/a/img922/5524/85QyEv.jpg
I suppose Mike is using his blog to vent, in which case the process of writing down your thoughts is important so you don’t lay awake at night juggling it all in your head.
Hi Dennis,
Thanks for continuing to host the site. I am a huge fan of Mike S work ( I consider him a national hero), but agree he took your disagreement with him too personally. I don’t think you were insulting him.
Igor Sechin the CEO of Rosneft and Putin’s right hand man opinion is pretty important. He also knows very well what is going on in Russia.
Like everyone else they get forecasts wrong.
He definitely does not think USA shale is sustainable.
Look at how they are behaving in the Ukraine…A RESOURCE WAR with 2 oil importers (China and NATO) encroaching their borders….
thanks!!
@Andre
It’s more the other way round – Russia is grabbing at least the eastern of Ukraine, where a lot of raw materials are – including energy.
And NATO in Europe was a toothless tiger before this war – no country wanted to invest in weapons. Now they are ramping up production everywhere. This shot exploded into the face of Russia, even when they still manage to conquer Ukraine.
The real dangerous border they have is China. They are rolling them up, Siberia is more and more drifting to the side of China.
When I re-publish something from my personal blog on another venue I open myself to criticism and the potential for defense, which I willingly accept from people with credibility (experience). Otherwise, if you come to my place and suggest I have been calling for a “significant decline in shale oil for years and someday I will get it right” (not true), or that “those clowns at Exxon obviously know less than Mike,” that’s an uncalled for insult. My history with Dennis Coyne is long and contentious; if you could get the truth from him he would admit those were designed to be insults, as was the petty remark about Texas.
I put up and take down posts and comments in a section of my blog all the time; I took the one down yesterday because that is often the only way you can stop stupid comments. The same thing happens here at AOB. If people want to look at the same models and charts about the future everyday they can come here, as they can come here and become utterly confused by EIA shit and the need to guess about the future two months in advance. I try to create clarity, in real time, to give people insight into what will likely happen eventually. I don’t need to be lectured about proper “blog protocol.” Good grief.
My agenda is very clear: I wish to counter the blatant lies about tight oil abundance, profitability and short/long term sustainability whenever I can. That comes from my heart, from an entire lifetime of succeeding and failing from a checkbook and understanding oil decline and depletion. I am only concerned about the world we live in and the future of my country. That country at the moment is in a very precarious state with regards to its hydrocarbon future; failed governmental/ regulatory policies and the gross mismanagement of the shale resource(s) by corporate greed is, and will cause our nation great harm.
Passive aggressive insults from Denis are still just as insulting.
I don’t think the level of insults can ever amount to much when one considers the topic is on a finite & non-renewable supply. It’s essentially arguing over how to arrange deck chairs on the Titanic — uncertainty involved only because the data is not complete.
Mike,
Yes I have often been wrong and this will continue. Below are several different scenarios for Permian output with 375 wells per month, 400 wells per month and 450 wells per month, the 450 well per month scenario is my best guess, average output for first quarter of 2024 about 5500 kb/d for Permian basin. Output was about 5400 kb/d July 2023.
For the higher completion rate scenario, debt is not paid in full until 2033, if high dividends had not been paid out (10% of net revenue rather than 25%) debt would be paid off by 2030. If we assume higher natural gas prices (due to LNG exports rising and depletion of natural gas) of say $3.50/MCF, then debt is paid back by mid 2028 (assuming only 10% of net revenue is paid out to shareholders as dividends).
Impossible to predict accurately what the future will bring, so of course any such scenario of the future is certain to be wrong, probability of predicting the future correctly is zero. There are an infinite number of possible scenarios, if we pick one, odds of correctness is one divided by infinity which equals zero.
I agree we don’t know what November output will be, what do you think output will be for the Permian basin in 2024Q1? My 450 well scenario has average 2027 output at about 6100 kb/d for Permian tight oil output.
URR of 450 well scenario is 44 Gb, total wells completed is 106 thousand wells from Jan 2010 to Jan 2037 (450 wells completed until Dec 2030 for scenario with ramp down to 410 wells by Feb 2033 and to 250 wells per month by Feb 2035 and to zero wells by Feb 2037.)
Mike,
Where did I insult you? Does disagreeing respectfully constitute an insult in Texas? Strange that.
Mike,
Sorry I forgot about the clowns at Exxon comment, you may well know much more than they do. You certainly know a lot, far more than me and perhaps more than anyone else in the oil business. I apologize in advance, if that is perceived as an insult, it is not my intention.
Mike,
Are you referring to the comment about Texas taking longer to compile data on 300 thousand wells than it takes North Dakota to compile data on 15 thousand wells (20 times fewer wells so the task is roughly 20 times easier)? Not clear why you would consider that a petty comment, it was intended a defense of the RRC and the difficult job it is to track hundreds of thousands of oil and gas wells in a timely fashion.
Mike
Note that I asked “What’s Mike’s Beef?”. I appreciate the work people the EIA do and I also appreciate that is not easy to collect all of the data and make predictions from it. So what caught my eye was the statement: “I for the life of me will NEVER understand why anybody follows the Energy Inaccuracy Agency and uses its data; it’s worthless.” The DPR has been signalling a plateau of the past 3 to 4 month and I didn’t see why you were calling it worthless info.
As for reading your blog, I do read it and I appreciate your insights and now head to state files to get their production data. Recently I have added a special Permian section to the US post because of a report by Goehring & Rozencwajg and your Permian predictions. I was a bit reluctant to start that section because I didn’t know if the GOR of a county was meaningful. However a few posts back you made the following comment:
“GOR statewide is totally meaningless and most of the time, meaningless for an entire county, and certainly for a basin like the Midland or Delaware. EXCEPT in the unconventional HZ play where entire counties are packed full of wells on close spacing.”
Based on that statement I decided that I would start posting data on GOR for Permian counties and watch if there was much blowback. If you check the Permian section of the US post, each month I reference your comment.
Mike appreciate that I am a guy sitting up here in Canada who is interested in the peak oil discussion and decided to post some nice charts to keep this site interesting. It’s a slow learning process and I appreciate all the comments.
Below is the August NM output of Lea plus Eddy county. What is interesting is that the latest August update, as of today, March and April production only increased by a few kb/d. The EIA April production is over 100 kb/d higher than that. It will be interesting to see if the EIA output is revised down.
Also attached is the GOR for Lea county.
Ovi,
For all of New Mexico the difference between the EIA estimate and the State estimate in April and May is only 20 kb/d in April and 10 kb/d in May (1% and 0.5% respectively), for most of 2022 and 2023 the EIA estimates will need to be revised higher.
Dennis
I get a bigger gap for April. Today’s big NM update for August just raised April Lea plus Eddy production by 1 kb/d. The April gap I am seeing is 56 kb/d, 1804 kb/d vs 1860 kb/d.
Ovi,
I am comparing apples to apples, EIA=all counties in New Mexico, NM State data=all counties in New Mexico.
See the link I posted from “New Mexico Oil Conservation Division Natural Gas and Oil Production [Wednesday, October 18, 2023]”
Just click on excel link in upper left corner of page to download the spreadsheet.
Screenshot of total oil in barrels per month for Jan 2022 to Sept 2023 for all counties in New Mexico.
https://wwwapps.emnrd.nm.gov/ocd/ocdpermitting/Reporting/Production/ExpandedProductionInjectionSummaryReport.aspx
1840 kb/d for April 2023 (divide by 30 days) and 1796 kb/d for May 2023 (divide monthly total by 31 days).
Dennis
It is not necessary to always compare apples to apples. What is necessary is to be clear on what is being compared and the intent of the comparison. The intent here is to show that the Lea and Eddy counties production in March and April did not change much with the latest August NM data. Secondly that both the EIA and L plus E are also dropping. The gap is not the issue. It is the trend that that is being discussed here. Slope is what we are addressing not one number.
In the chart posted below, one can see how close the EIA and L + E production are. More importantly the slope and trend are the same.
The issue is whether the NM Permian has peaked or is on a plateau. I think we agree it will take another 3 or 4 months to get a clearer picture of what is happening.
Ovi,
I think it makes more sense to compare like things when looking at estimates from different agencies. Why not look at all NM counties as that is what the EIA data is looking at. That makes more sense to me. Some of the gap you are seeing is the difference between fruits.
Here is GOR for all of New mexico using the 914 survey data
https://www.eia.gov/petroleum/production/
Dennis
The Permian investigation started out by looking at the two biggest producing counties, Lea and Eddy. At some point I did a check and found out that those two counties account for 98% of NM production. Since the focus of this issue is aimed at trying to sort out whether the Permian is peaking/plateauing and whether the NM portion is closer to peaking/plateauing, a 2% difference in production will have an insignificant impact on the slope.
As I keep emphasizing, this issue is not the same as a scientific experiment.
When it comes to the use of GOR, I go with Mike Shellman’s advice: “GOR statewide is totally meaningless and most of the time, meaningless for an entire county, and certainly for a basin like the Midland or Delaware. EXCEPT in the unconventional HZ play where entire counties are packed full of wells on close spacing.”
Attached is a table comparing NM production vs Lea plus Eddy for 2022.
The comment at link below, especially the chart, should be ignored, it is incorrect, I copied an incorrect column from one spreadsheet to another mistakenly.
https://peakoilbarrel.com/june-non-opec-and-world-oil-production/#comment-764992
The chart below is correct for 914 survey data from New Mexico, note that if Lea and Eddy counties produce 98% of the oil in New Mexico, then this likely reflects output from those two counties.
GOR is really only useful at the well level, so countywide data does not tell us much, and statewide data perhaps even less.
Dennis
Please read Mike’s GOR comment more closely: “EXCEPT in the unconventional HZ play where entire counties are packed full of wells on close spacing.” I think the four top counties, Lea, Eddy, Martin and Midland fall into the category of “counties packed full of closely spaced wells.
Some of our contributors have said there is a general pressure drop in the Permian which indicates there is pressure crosstalk within the counties’ wells.
Not quite sure what the point of the long term GOR chart is. Yes the GOR is going to fall once you start pumping oil out of a new well/area. We are discussing the transition into the bubble phase. The only part of the chart that is significant is the last year and the GOR is starting to increase.
Note the Lea GOR chart below that was posted in reply to Mike. Oil production has been flat since January and the GOR has broken out of the normal range.
The chart below is a new way to present data that may provide a better clew as to when a county transitions into the bubble phase and possibly peaks/plateaus. At this point the 2 main producing counties in NM and Texas are exhibiting the same behaviour.
It will take another 3 or four months of data to see whether this type of charting has merit.
Ovi,
There is not likely pressure depletion across entire counties, I don’t think the GOR tells us much at the county level except that as completion rate increases, GOR tends to fall and as the completion rate falls GOR goes up, this has more to do with the average age of operating wells in the county. In general older wells will have higher GOR than newer wells, your charts can be interpreted in this way. A county does not reach bubble point, this is something that occurs at the well or perhaps lease level, it is not likely to occur everywhere all at once.
Yes there can be interwell communication for two wells that are within about 1000 feet of each other.
I think comments by petroleum engineers on this point would be of interest, it is not clear to me that Mr Shellman is correct that county level GOR is useful.
Also note that the Gas data seems to become complete in Texas quicker than the oil data, perhaps because most of it feeds into NGL plants and there are fewer points where data needs to be gathered (because the number of NGL plants may be relatively limited.
Dennis
This is where the drilling is in concentrated in Lea and Eddy counties. The picture below is a composite from these two sites.
The time has come to let the numbers, trends and charts talk for themselves.
https://www.shalexp.com/new-mexico/lea-county
https://www.shalexp.com/new-mexico/eddy-county
Ovi,
You cite a comparison between EIA and New Mexico data as being significant, the state data is likely incomplete and leading to the gap you are seeing. I agree in a few months (probably more like 5 months in the future) the gap you currently see between April and May 2023 for the EIA and New Mexico data will be gone. It only amounts to 1% or less in any case.
Ovi,
Notice that 2% is about 40 kb/d, at the April and May 2023 output level. That explains much of the gap you see between EIA and Lea/Eddy output.
GOR Ratio for Lea County
The GOR for May and June barely changed with the August update. I assume that July and August will stay above 3.05 and that Lea county is transitioning into the bubble phase since GOR is increasing and output is starting to drop.
G’dammit. This is nuts. No, I am not a petroleum engineer; I NEVER implied I was one. If that lessens my credibility, after 50 years of drilling over 300 wells with my own money, so be it. I am simply trying to help others understand very complicated matters in a complex industry.
Ovi’s quote of mine is accurate and verbatim. I have NEVER said GOR should be used basin wide, or county wide, except in the exact circumstances he references… in counties that are saturated with gas depletion, HZ SRV’s, like Eddy, Lea, Martin and Midland Counties. I NEVER said entire counties reach bubble point at once nor have I EVER implied entire counties, or sub basins suffer from pressure depletion all at once.
Tell the truth!
Ovi: in the next few days I will try and put something up on Forum Stuff, titled Ovi, that clearly shows it IS reasonable to suggest entire counties ARE gassing out in the Permian and that is precisely why initial liquids productivity is falling, in some core areas as much as 25% YOY. Lea and Eddy counties are two good examples. In the absence of spatial skills, a big county that is stuffed with HZ wells in the bottom 1/3rd of the county, represents an entire county in the context we seek.
I’ll try and show you a textbook example of how EOG bubbled completely out of Lea County and is now left for Ohio. Lea and Eddy County are vital to understanding what’s going on; it’s no coincidence rigs left both counties last week. The Permian tight oil sector needs go where they can produced at least 50% oil in its production stream. Not in New Mexico; no mas, no sir.
All of Midland County has reached bubble point, IMO, and PXD’s declining initial well productivity is proof. It’s a goner. I don’t pretest to be smarter than Exxon but they overpaid for that shit, big time. Watch.
If people don’t like what I have to say, block me, ignore me, quit quoting me, or re-posting my observations. Above and beyond all else, quit putting words in my mouth.
Mike
I will look forward to it.
Using data from Novi Labs
https://novilabs.com/blog/permian-update-through-april-2023/
I find the following GOR for the Average well completed in 2021 for Lea and Eddy counties combined (1285 wells).
It seems possible that rigs have left Lea and Eddy because there are fewer Tier 1 and Tier 2 locations for drilling new wells.
Looking at older Lea and Eddy wells completed in 2010, the GOR at month 132 is about 7.4 (183 wells completed in 2010). Oil at 9 bo/d and gas at 67 MCF/d at 132 months from first flow.
Took a quick look at EOG wells in Lea county completed in 2021, the GOR at month 16 was about 3.7, vs 4.2 for all companies operating in Lea and Eddy counties based on data from Novi Labs published in June 2023 (last report available to me.)
Lea County GOR 2018 and 2021 wells, note that Delaware basin average lateral length increased from about 7000 feet in 2018 to about 9000 feet in 2021. This may have affected GOR as the longer lateral length probably reduces oil per foot of lateral more than any reduction in gas per foot of lateral.
Data from
https://novilabs.com/blog/permian-update-through-april-2023/
and
https://www.eia.gov/todayinenergy/detail.php?id=50016#
EOG was worse in 2021 for Lea County than the average for all operators at 16 months from first flow at 3.7 MCF/bo vs 3.3 MCF/bo for the countywide average in Lea county.
Ovi,
Notice that the peak for DPR region output keeps moving forward, it went from June to July, now August, next month maybe September, perhaps we will see a plateau at some point. The EIA does a terrible job with tight oil of late, it is unfortunate. The official estimate used to be pretty good, now the DPR may be better, at least through August for all DPR regions.
DPR region output (all regions included) this includes some conventional oil produced in those regions. Data is from March 2021 to August 2023.
Dennis
I did notice that.
I wonder with all of the issues the EIA is having, including the international update, if too much experience has retired from there and it be a while before they get back up to speed.
Ovi,
Unclear what is going on, they had a great person doing the tight oil report but she left the EIA and since then the official tight oil estimate has not been very good.
It also occurs to me that with the clown show in the US House of Representatives maybe nobody want to work for the US Government, it is pretty embarrassing to be honest.
Mr Shellman,
I apologize for ascribing a specific prediction to you that you never made.
Looking back at this post originally from July of 2021
https://www.oilystuff.com/single-post/running-out-of-room-remix
Comments such as the one below give the impression that you expected decline in US tight oil in the near future.
How long can the Permian Basin “develop only sweet spots, likes it been doing the past seven years?”
The answer is, not very much longer.
Perhaps I got the wrong impression as you never made any specific prediction, but I sure get the impression that you expect decline to start fairly soon when I finish reading the piece, which was excellent imho. Maybe output will be lower in 2024Q1 than the 8159 kb/d which the EIA estimates for tight oil output in August 2023, time will tell.
https://www.jodidata.org/oil/database/customisable-charts.aspx#dchart1684
Saudi crude exports decreased by 428 kb/d to 5.58 mb/d, a 28-month low.
WHOOPS… Natgas Drops Below $3…
What a FRICKEN SHOCKER… Who Saw this coming??
steve
Data for New Mexico from
https://wwwapps.emnrd.nm.gov/ocd/ocdpermitting/Reporting/Production/ExpandedProductionInjectionSummaryReport.aspx
and EIA data from
https://www.eia.gov/petroleum/production/xls/comp-stat-oil.xlsx
Note that in much of 2022 the EIA estimate (in red) was lower than the New Mexico state estimate (in blue).
From Jan 2015 to Dec 2021 the EIA 914 estimate was pretty good.
The ratio of the sum of the data from EIA 914 and NM State government over that 7 year period is EIA914/ NM State=0.999997. The correlation coefficient is 0.9995 over the Jan 2015 to Dec 2021 period between NM state data and EIA 914 estimate.
EIA will briefly delay data releases from November 8-10
The U.S. Energy Information Administration (EIA) will delay its scheduled data releases for November 8–10, 2023, to complete a planned systems upgrade. EIA will resume its regular publishing schedule on November 13.
The delay will affect all scheduled data releases, including the Weekly Petroleum Status Report (WPSR) on November 8 and the Weekly Natural Gas Storage Report (WNGSR) on November 9. EIA will continue to collect data for those reports and will publish two weeks of official statistics for the WPSR on November 15 and the WNGSR on November 16.
All EIA survey respondents will continue to submit data to EIA during the systems upgrade.
https://seekingalpha.com/article/4642150-there-is-way-too-much-misinformation-on-us-oil-production
some here should find this info interesting and useful.
Those damn oil tourists…
“Beware of oil tourists talking about how U.S. oil production increased 1.2 million b/d from the end of last year to today. They don’t know what they are talking about.”
Rig and Frac Report for October 20
Rigs Flat. Fracs Up
– US Rigs were unchanged at 449
– Permian rigs were up 1 again this week to 294. As occurred last week, Texas added 4 while NM dropped 3 to 89. The last time there were 89 rigs in the Permian was April 22, 2022. Rigs are down 15 from the 104 high. Is this the beginning of a trend in the NM Permian?
– Eagle Ford was down 1 to to 46
– NG was up 3 to 107 (not shown)
Fracs were up 6 to 266. Is 275 going to be the new Frac spread target.
Any post on oil production evolution of opec?
OPEC post will be Monday.
Thanks.
Mike:
I sure hope XOM isn’t missing a coming oil glut in buying PXD the same way it missed a coming natural gas glut when it bought XTO 2009-10.
I don’t know what Permian shale is worth, but as you know, a high oil price can make a bad deal good, and vice versa.
Shallow sand,
Are you thinking OPEC will flood the market with oil? My guess is that with major players like XOM, Chevron, and Conoco Philips controlling much of Permian output that capital discipline may continue in the Permian with either slow growth in output (about 250 kb/d per year up to 2025-2027) or perhaps a plateau in output at around 6000 kb/d from 2025 to 2030. If my guess is correct, there is not likely to be a glut like we saw in 2015 to 2016 or during the pandemic. As always I am often wrong so your guess or that of Mr. Shellman is likely to be much better than mine.
XOM may expect higher oil and natural gas prices in the future, it sure looks like a good guess to me until at leat 2030, perhaps even 2035.
Dennis.
I have no idea at all where oil prices are headed in the future.
My current guess for 2024 is a range of $35-150, with both being a possibility, meaning both prices could be registered in the same year.
The primary reason the XTO deal was bad for XOM was that natural gas prices were low, especially post 2014.
Shallow sand,
Thanks. I imagine with all the LNG capacity scheduled to be built and already operating that soon US natural gas prices will rise along with oil prices as the oil market is becoming quite tight and OPEC seems willing to keep it that way.
https://www.reuters.com/markets/deals/chevron-buy-hess-corp-53-bln-stock-2023-10-23/
I don’t post much here in the oil side but I’m reading it.
For what it’s worth, I see these recent giant mergers in a way that’s from a different perspective, compared to the guys in the industry. I think they’re looking at things from a short term perspective, looking out maybe four or five years, talking about gluts and prices, good deals and bad.
I’m standing far away, looking more at the forest than the trees.
Maybe the way these industry giants see it is that while they may look bad in the short to medium term, they’ll be looking GREAT in the longer term, a decade or more down the road. They’ve got money enough to make that bet, no problem at all.
OFM
This is the situation as I see it. Right now SA is in charge of the market and they are happy with the current price $80 to $85 for WTI and $4 higher for Brent. Going forward there is a bit more supply coming and possibly a bit more demand. As long as that keeps supply and demand in rough balance, WTI will stay in the $80 range. At that price, some oil companies will be printing money.
Not sure how Hess is doing relative to Chevron. I know the big Cdn companies, SU, CNQ and IMO are all printing money at $80.
I also think that XOM and CVX have a much better idea of how much easy oil is left than we do.
Agree with your note, but there is a very large difference between these two 60 billion dollar purchases. In Pioneer, Exxon acquired arguably the finest remaining shale in the Permian basin, but it will be mostly run through by 2030. On the other hand, in Hess, Chevron acquired a lesser amount of good shale, but a part owner of the large Guyana field, a major GOM deep water operator, a major player in Suriname, and elsewhere around the globe—much of which should be producing in 2050.
I respectfully disagree with the quick burnout on the Pioneer acreage by 2030. My crystal ball says it should also still be producing in 2050 like Guyana. Exxon isn’t that dumb and thinks long-term. They know much more than we do about long-term application of technology and innovation to increase recovery on some of the finest rock on the planet. It will be expensive and not an easy task, but the Pioneer addition adds the combined scale needed to make it work. Think 30-year Permian hydrocarbon factory.
I just guess they expect high oil prices for longer.
Then they can do a lot of fancy stuff with the shale, refracking and other stuff.
At 70 or lower it was wasted money.
Gungagalonga,
Much depends on the future price of oil, my expectation is a decline in oil prices around 2030-2035 caused by waning oil demand as land transportation moves to battery power worldwide. If that hypothesis is correct, tight oil will no longer be profitable to develop beyond 2035, the same may be true for deepwater offshore projects, but tight oil is likely higher cost and thus will become unprofitable at a higher price point than the Guyana and Suriname offshore developments.
Fair enough and I agree to an extent.
But…. Remember that Exxon has one of the largest and best risk management and hedging departments in the industry.
Sometimes the speculative price in the future doesn’t matter as much.
Chevron’s Hess deal shows Big Oil still banking on fossil fuels despite energy transition
Chevron (CVX) is doubling down on fossil fuel demand for years to come as it plans to acquire crude and natural gas explorer Hess (HES) in an all-stock deal valued at $53 billion, or $171 per share.
That’s the story. Oil demand higher for longer
https://finance.yahoo.com/news/chevrons-hess-deal-shows-big-oil-still-banking-on-fossil-fuels-despite-energy-transition-161521096.html
Selfishly, I certainly hope you’re right: higher for longer works with me.
Scott Sheffield himself though said they really had to pace themselves or they would run out of primo drilling spots within 2-3 years.
Maybe Exxon has some magic juice.
And while I am especially fond of John Hess up in the Bakken, there is only so much you can do.
Gerry Maddoux,
I thought I saw in recent (past year) presentations that they had 10 years of prime locations at current completion rates. Perhaps I am remembering incorrectly. Looked quickly at August Q2 earnings slides and they claim decades long inventory of high return wells (slide 7 at link below).
https://investors.pxd.com/files/doc_financials/2023/q2/Q2-2023-Earnings_8-2-2023-Webcast.pdf
New posts are up
https://peakoilbarrel.com/opec-upate-october-2023-and-eia-international-energy-outlook-2023/
and
https://peakoilbarrel.com/open-thread-non-petroleum-october-23-2023/