A post by Ovi
Below are a number of Crude plus Condensate (C + C) production charts, usually shortened to “oil”, for Non-OPEC countries. Normally the charts are created from data provided by the EIA’s International Energy Statistics in the first week of the month. Unfortunately the EIA was not able to update the production information for March until today. Consequently the charts below are produced from a mixture of country specific sites such as Brazil, Norway and China and the July STEO and the International report. The International report was used to update the March production data.
Where STEO data was used, the ratio of C + C to All Liquids was calculated. The average from the last six months was used to project the March production numbers and extended to May in a few cases.
World oil production charts are found at the end of this post.
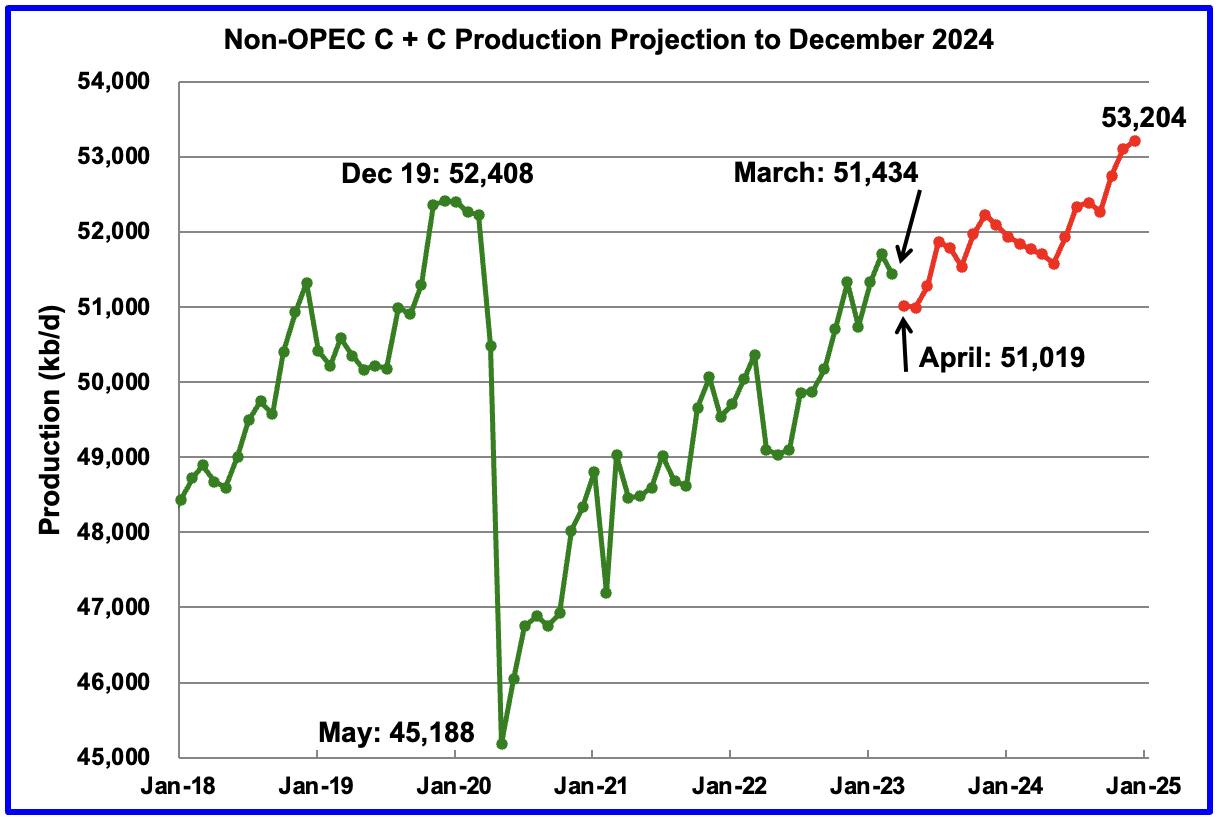
March Non-OPEC oil production dropped by 268 kb/d to 51,434 kb/d. The largest decreases came from the Russia, 300 kb/d and Brazil 146 kb/d.
Using data from the July 2023 STEO, a projection for Non-OPEC oil output was made for the period April 2023 to December 2024. (Red graph). Output is expected to reach 53,204 kb/d in December 2024, which is 796 kb/d higher than the December 2019 peak of 52,408 kb/d.
From April 2023 to December 2024, oil production in Non-OPEC countries is expected to increase by 2,185 kb/d, possibly an unrealistic forecast. According to the STEO, the major contributors to the increase are expected to be US, close to 500 kb/d and Canada close to 800 kb/d, both on the high side. Russia is expected to provide the largest drop.
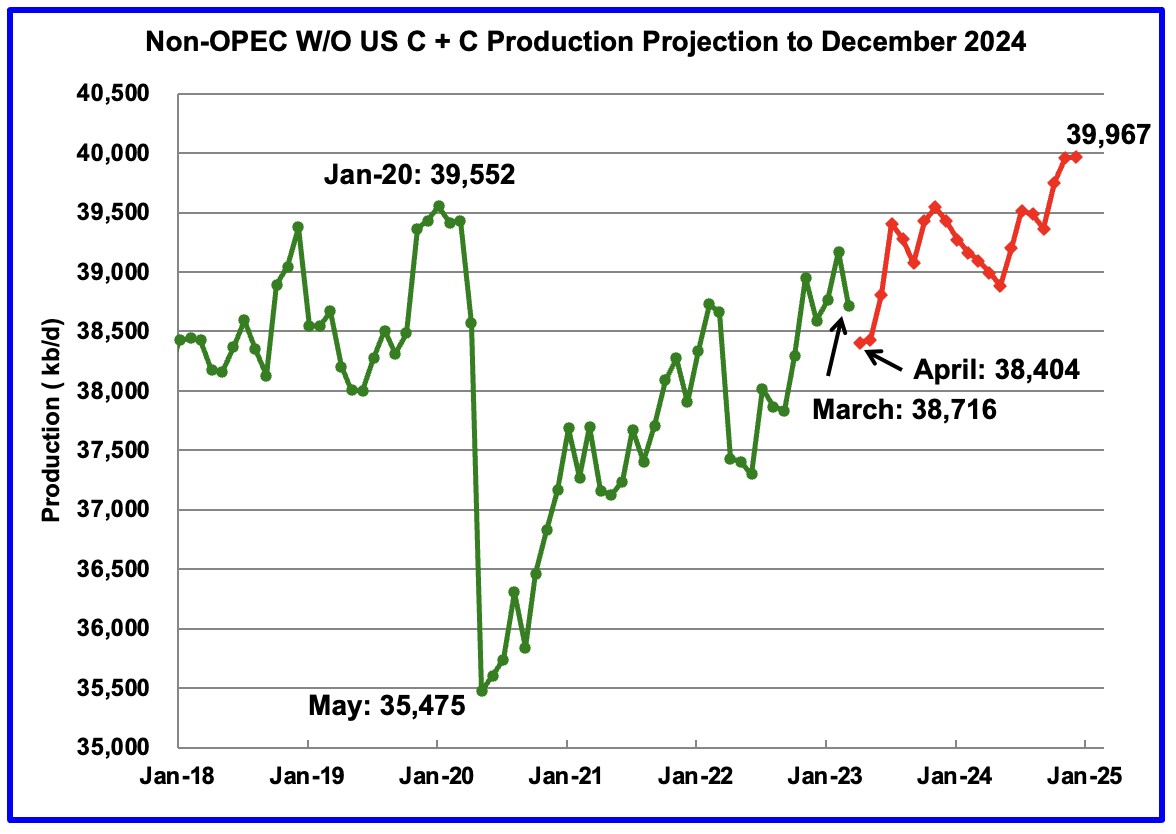
March production dropped by 454 kb/d to 38,716 kb/d.
From April 2023 to December 2024, production in Non-OPEC countries W/O the US is expected to increase by 1,563 kb/d.
Note that December 2024 output exceeds the pre-covid high of 39,552 kb/d in January 2020 by 416 kb/d.
Non-OPEC Oil Production Ranked by Country
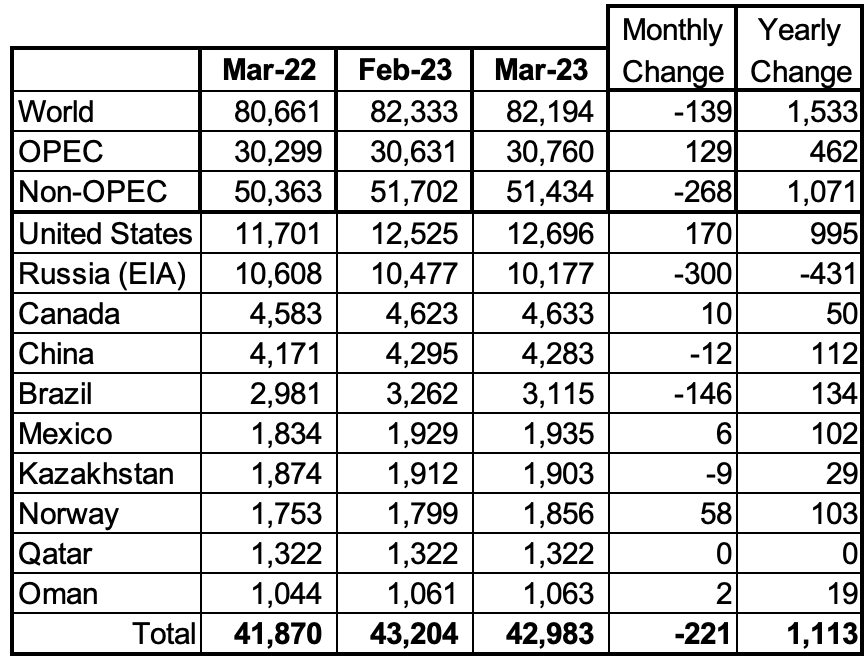
Listed above are the World’s 10 largest Non-OPEC producers. The criteria for inclusion in the table is that all of the countries produce more than 1,000 kb/d.
The March production drop for these ten Non-OPEC countries was 221 kb/d while as a whole the Non-OPEC countries saw a production decrease of 268 kb/d. In March Russia and Brazil had the largest production drops, a combined 446 kb/d.
In March 2023, these 10 countries produced 83.9% of Non-OPEC oil production.
OPEC C + C production increased by 129 kb/d in March while it increased YoY by 462 kb/d. World MoM production decreased by 139 kb/d while YoY output increased by 1,533 kb/d.
Non-OPEC Oil Production Charts
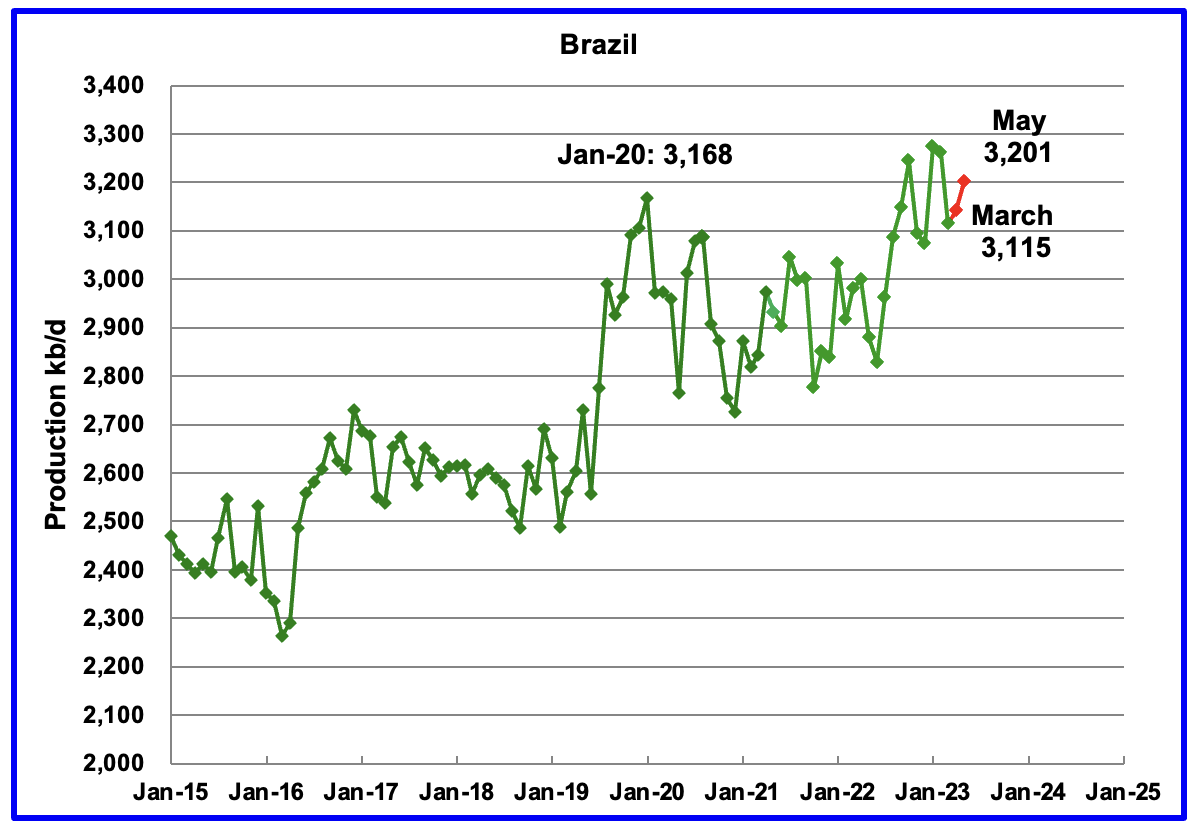
Brazil’s National Petroleum Association (BNPA) reported that March’s output decreased by 147 kb/d to 3,115 kb/d. April and May rebounded with May production reaching 3,201 kb/d, red markers.
Much of Brazil’s upcoming 2023 production growth of close to 100 kb/d will come from the highly productive pre-salt fields. From March 2022 to March 2023, production from the pre-salt fields increased by 134 kb/d.
According to the OPEC MOMR: “Crude oil output is set to increase through production ramp-ups in the Buzios (Franco), Mero (Libra NW), Tupi (Lula), Peregrino, Sepia, Marlim and Itapu (Florim) fields. However, offshore maintenance is expected to cause some interruptions in major fields. Petrobras has also started production at the fifth FPSO in the giant Buzios field in the deepwater pre-salt Santos Basin offshore Brazil, according to Offshore Magazine; the Almirante Barroso platform has capacity to produce up to 150 tb/d of oil and 6 million cm/d of gas and inject 220 tb/d of water.”
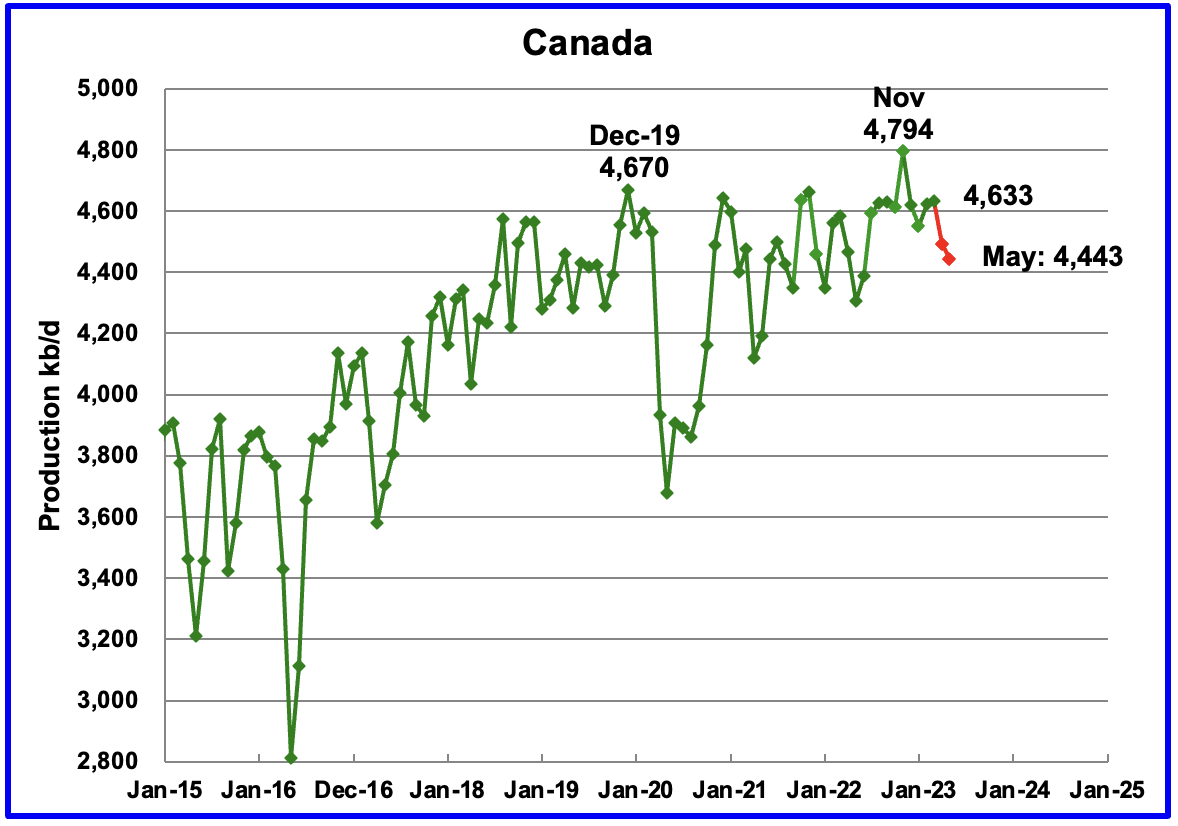
According to the STEO, Canada’s production rose by 10 kb/d in March to 4,633 kb/d. Production dropped in April and May to 4,443 kb/d.
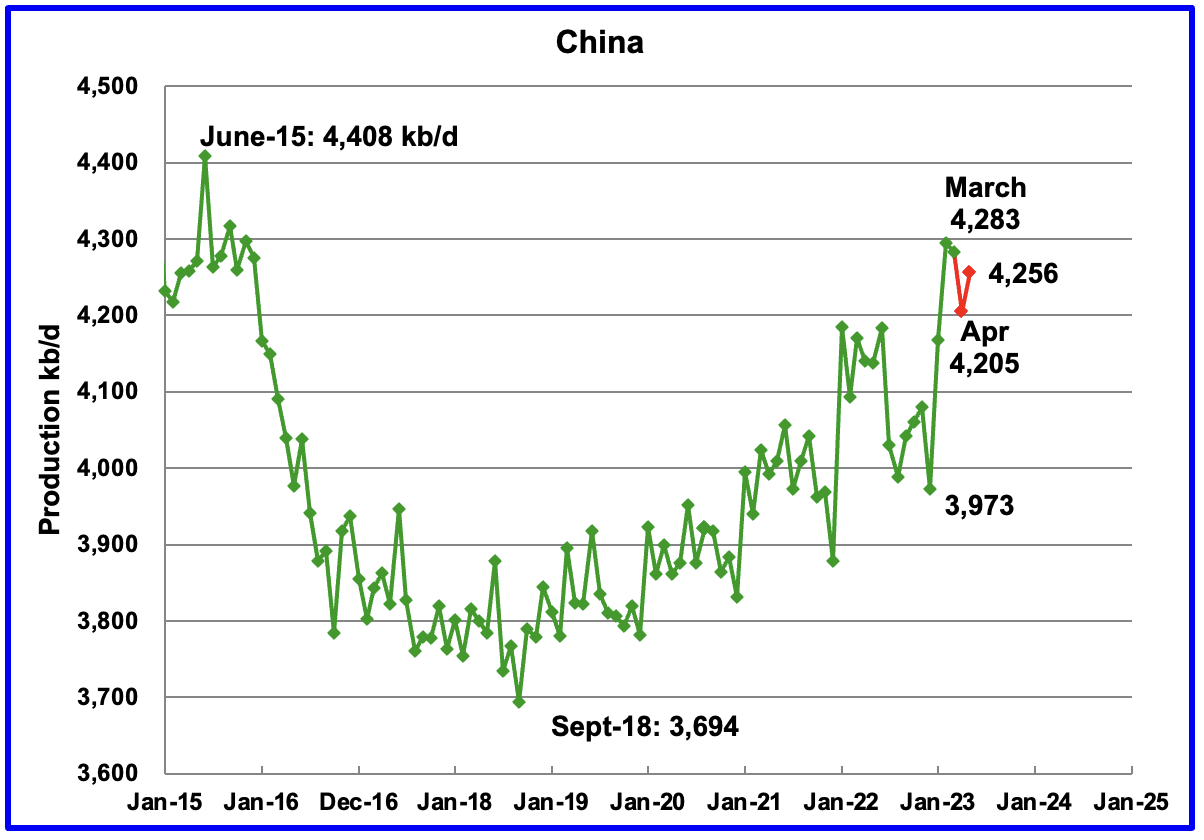
The China National Bureau of Statistics reported that production during April and May was 4,205 kb/d and 4,256 kb/d respectively. March production dropped by 12 kb/d to 4,283 kb/d.
Since September 2018, China’s production has increased by close to 600 kb/d. Bloomberg notes that the “Most Overlooked Oil Production Boom Is in China”
“Spending billions of dollars via its state-owned energy giants China National Petroleum Corp. (CNPC), China Petroleum & Chemical Corp. (Sinopec) and Cnooc Ltd., Beijing has been able to reverse the decline in domestic oil production that started in 2015, lifting output this year to a near all-time high.In doing so, the country is somewhat damping the need to buy crude overseas, complicating the efforts of Saudi Arabia and its OPEC+ allies to control the market.
On top of extra Chinese output, OPEC+ is already battling higher-thanexpected oil production from several of its own members that are under Western sanctions: Russia, Iran and Venezuela.
From the low point in 2018 to the peak in 2023, China has added more than 600,000 barrels a day of extra production – more crude than some OPEC+ nations generate daily. Pumping about 4.3 million barrels a day now, China is again the world’s fifth-largest oil producer, only behind the US, Saudi Arabia, Russia and Canada, and ahead of Iraq.
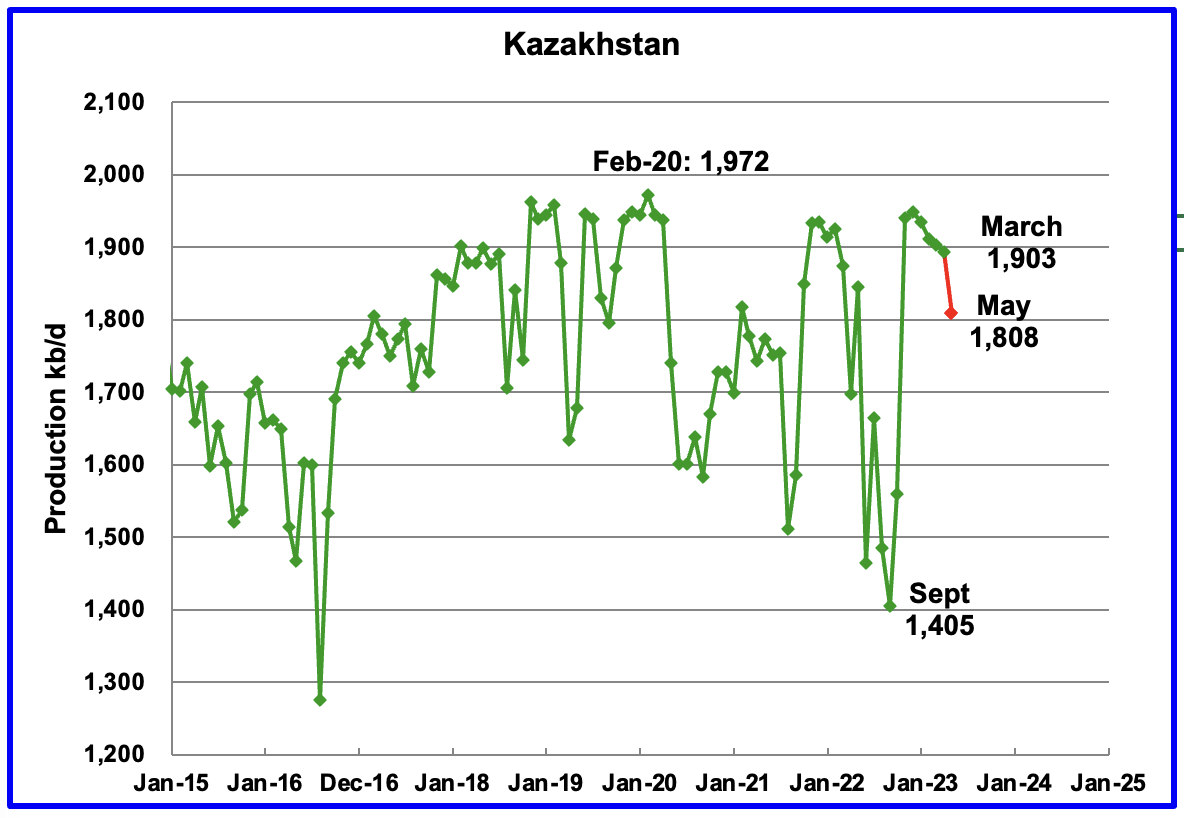
Kazakhstan’s output decreased by 9 kb/d in March to 1,903 kb/d. Production decreased in April before dropping in May to 1,808 kb/d.
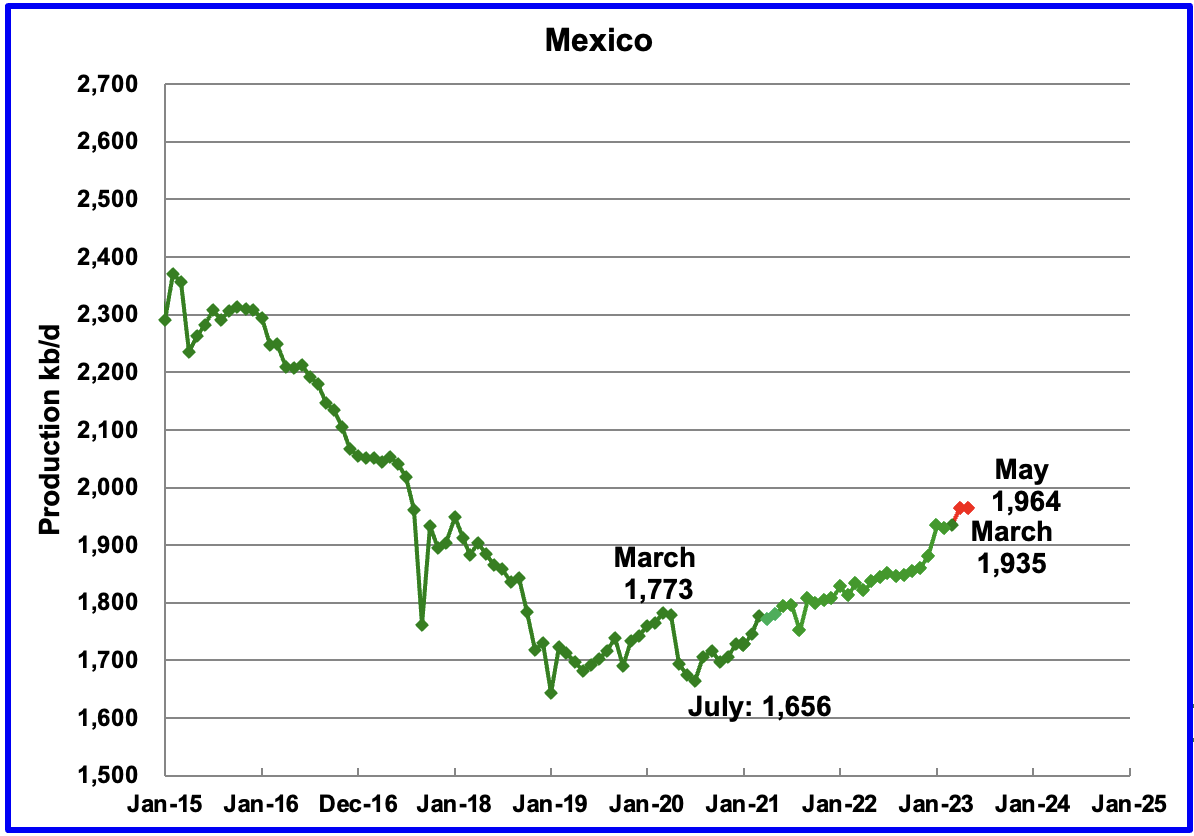
Mexico’s production for March was 1,935 kb/d an increase of 6 kb/d over February. Output rose to 1,964 kb/d in May, according to Pemex.
Mexico has recently revised its definition of condensate. This has resulted in the EIA adding an extra 60 kb/d, on average to the Pemex report. The red markers include the additional 60 kb/d.
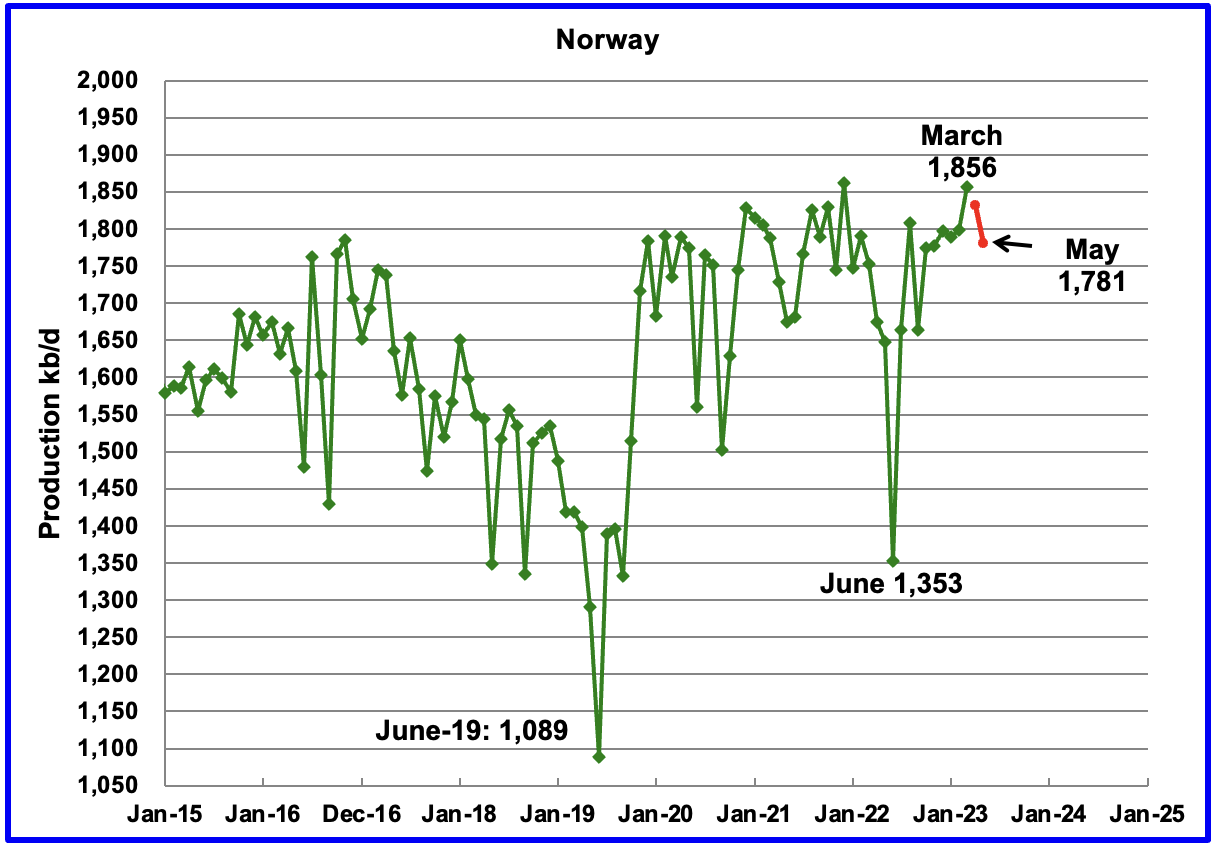
The EIA reported Norway’s March production to be 1,856 kb/d. The Norway Petroleum Directorate (NPD) reported that May’s production dropped to 1,781 kb/d. (Red markers).
According to the NPD : “Oil production in May was 1.3 percent lower than the NPD’s forecast and 0.8 percent lower than the forecast so far this year.”
According to this source, “The North Sea’s biggest oil field Johan Sverdrup now has the capacity to produce as much as 755,000 b/d of crude.”
“Norway’s state-controlled Equinor, which operates the Norwegian field, said it performed a successful test confirming the increased capacity this week, marking a 35,000 b/d rise from the field’s previous capacity. Equinor said it aims to maintain crude production “towards this level going forward”.
Johan Sverdrup came on stream in October 2019. A second phase started in mid-December last year, raising capacity to 720,000 b/d from 535,000 b/d.
Data from the Norwegian Petroleum Directorate (NPD) show production hit a monthly record of 714,000 b/d in March. Figures for April are not available yet, but Vortexa tracking data suggest exports of the grade exceeded 700,000 b/d last month. Loading schedules show exports will fall to 687,000 b/d in May and 697,000 b/d in June.
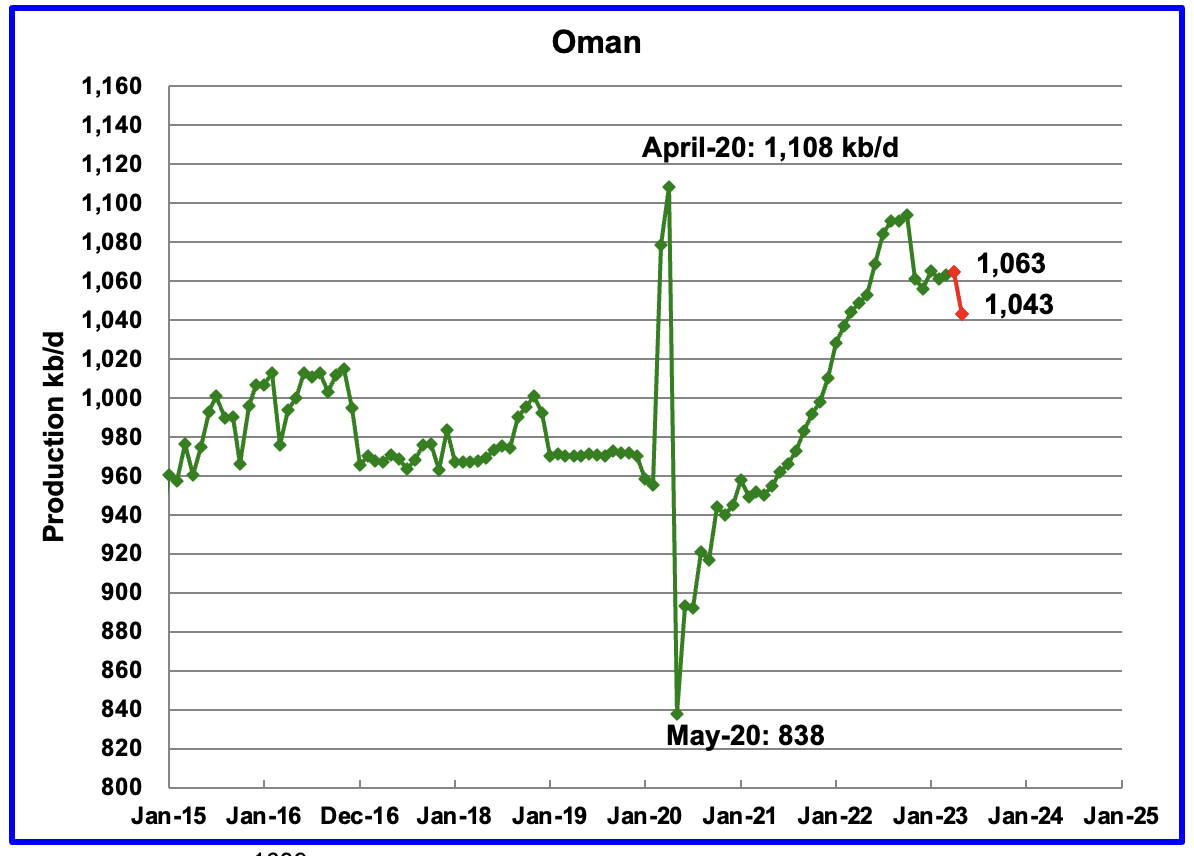
Oman’s production has risen very consistently since the low of May 2020. Oman’s March output was essentially flat but dropped to 1,043 kb/d in May.
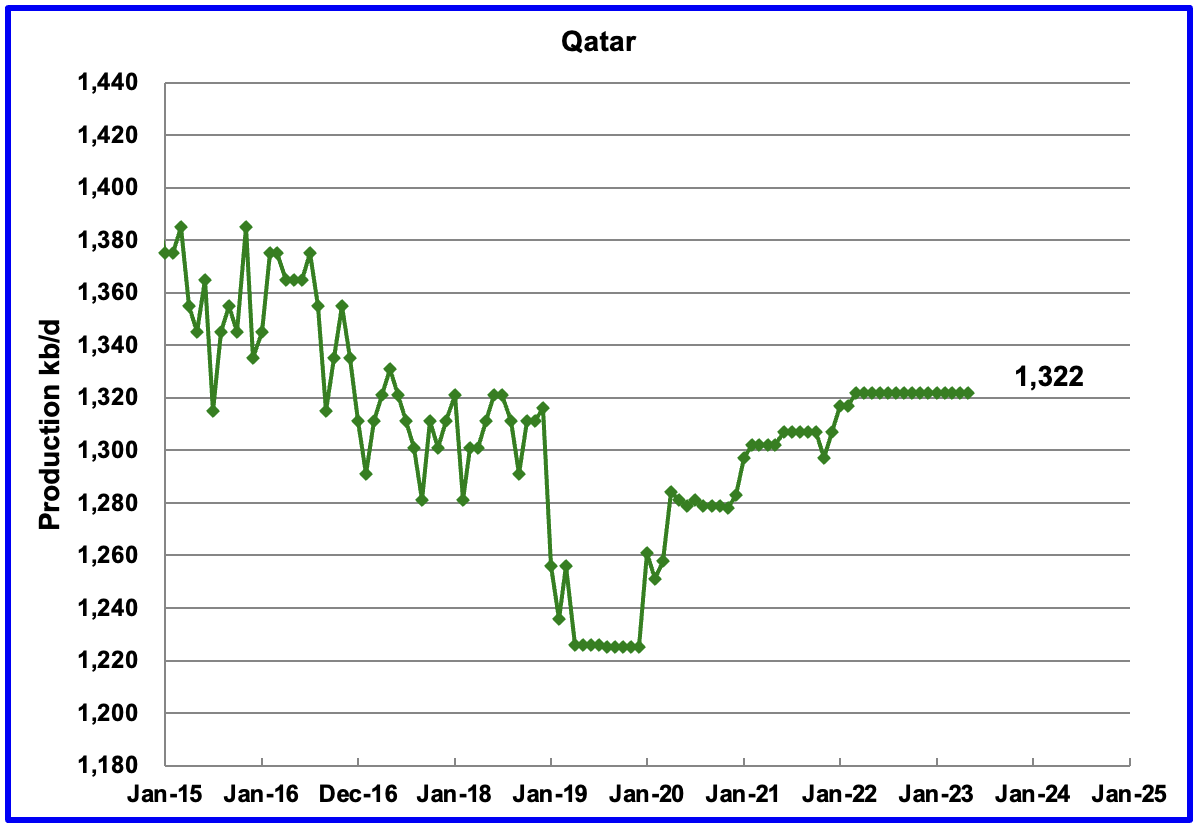
Qatar’s March to May’s output was unchanged at 1,322 kb/d, possibly due to lack of updated information .
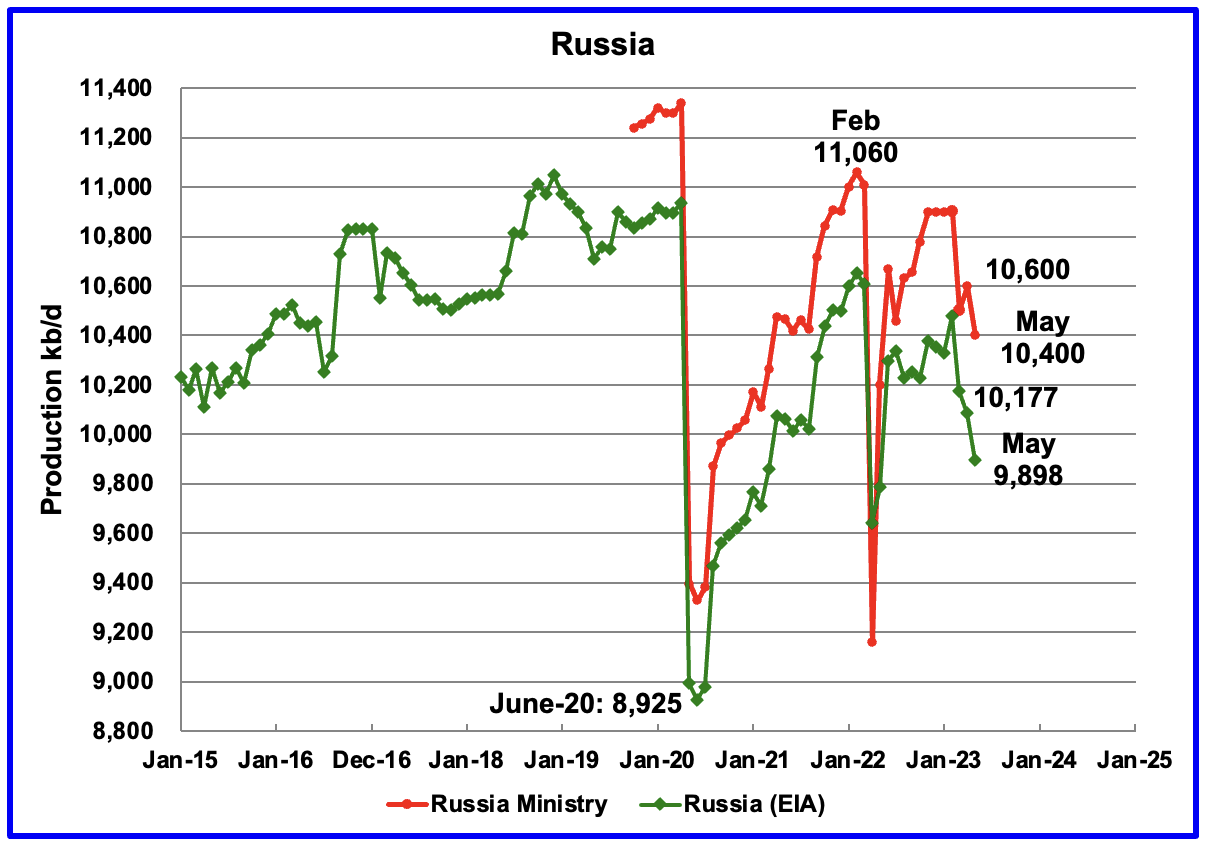
The July STEO forecasts that Russian output decreased by 300 kb/d in March to 10,177 kb/d. It further expects Russian output to drop to 9,898 kb/d by May 2023. (Green Markers). The EIA reported that Russian production dropped by 300 kb/d to 10,177 kb/d. The STEO production numbers are very close to those reported in the EIA’s international report
Using data from Argus Media, production for the Russia Ministry data was estimated. For March, Argus reported that Russian production of crude was 9,600 kb/d. If the typical Russian monthly condensate output of 900 kb/d is added to the crude production, Russian C + C in March would be close to 10,500 kb/d, a drop of 400 kb/d from February. April production was assessed at 9,700 kb/d of crude or 10,600 kb/d of C + C.
For May, the Argus Media report shows that Russian production decreased to 10,400 kb/d, after allowing for 900 kb/d of condensate.
Typically the difference between the Russia Ministry data and the EIA was 400 kb/d. Comparing the May production figures, the difference is close to 500 kb/d.
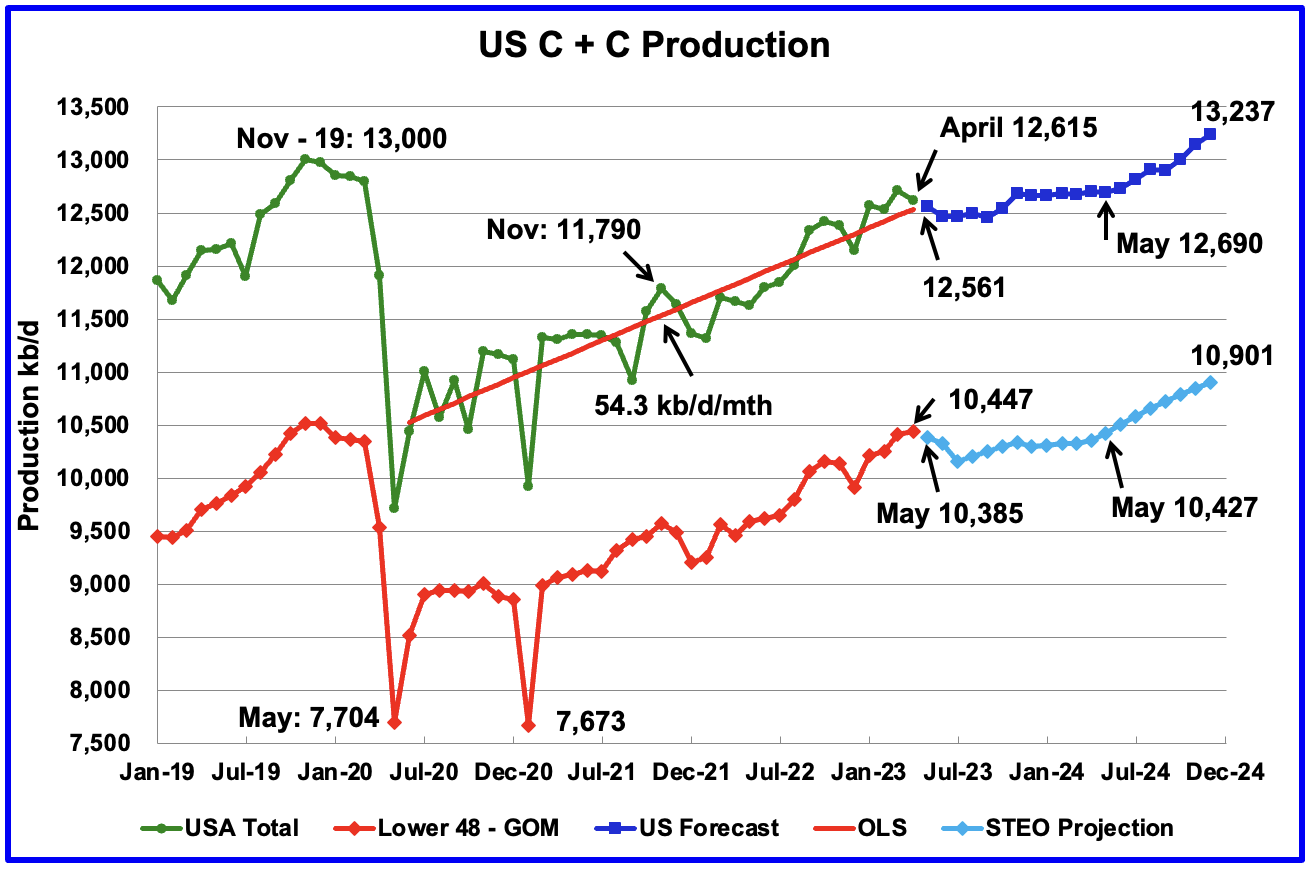
U.S. April oil production decreased by 53 kb/d to 12,615 kb/d. Some of the 53 kb/d drop, is due to the upward revision of February production to 12,717 kb/d. Output in December 2024 is expected to reach 13,237 kb/d.
Output from April 2023 to May 2024 is projected to increase by 75 kb/d. After May 2024, production is expected to increase by 547 kb/d. The majority of the 547 kb/d increase will come from the onshore L48, 474 kb/d.
In the onshore lower 48, production from April 2023 to May 2024 will drop 20 kb/d before beginning to rise to 10,901 kb/d in December 2024.
World Oil Production Projection
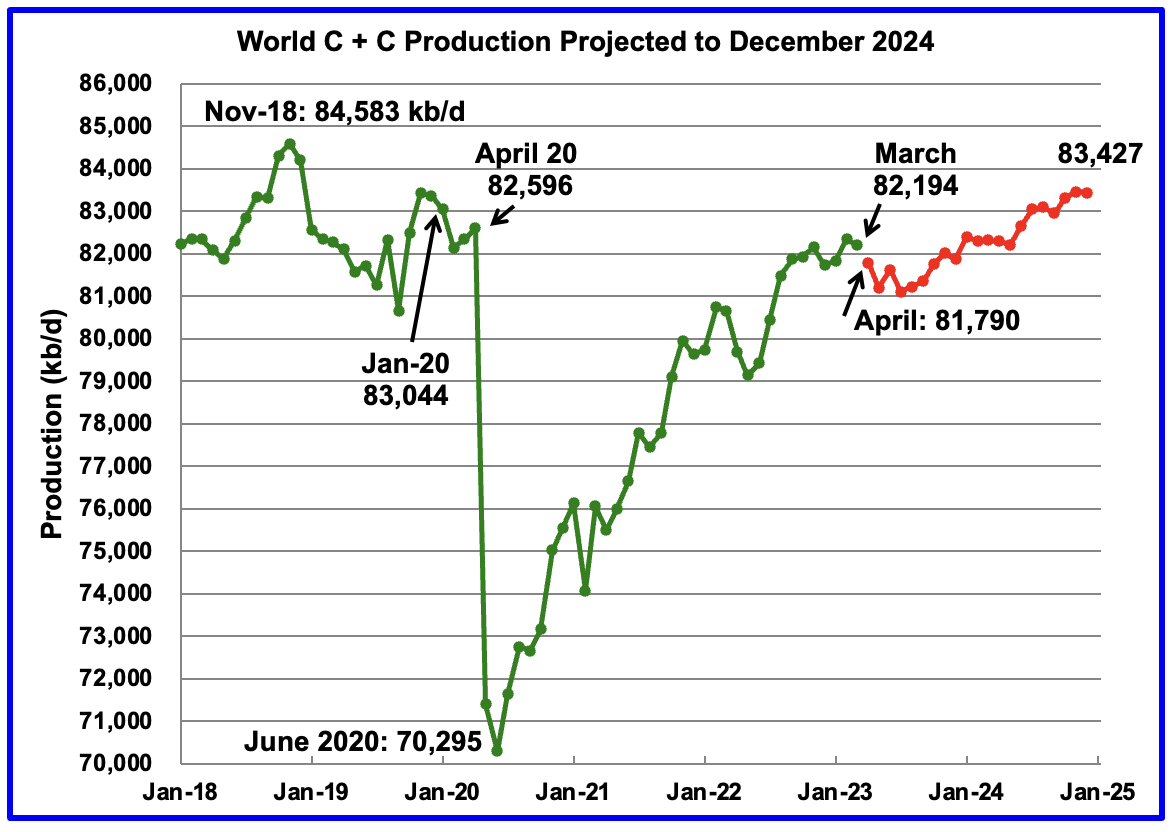
World oil production in March decreased by 139 kb/d to 82,194 kb/d.(Green graph).
This chart also projects World C + C production out to December 2024. It uses the July 2023 STEO report along with the International Energy Statistics to make the projection. (Red markers).
The red graph forecasts that World crude production in December 2024 will be 83,427 kb/d and is 1,156 kb/d lower than the November 2018 peak. Note that from March to July, production of 81,105 kb/d, production drops by 884 kb/d.
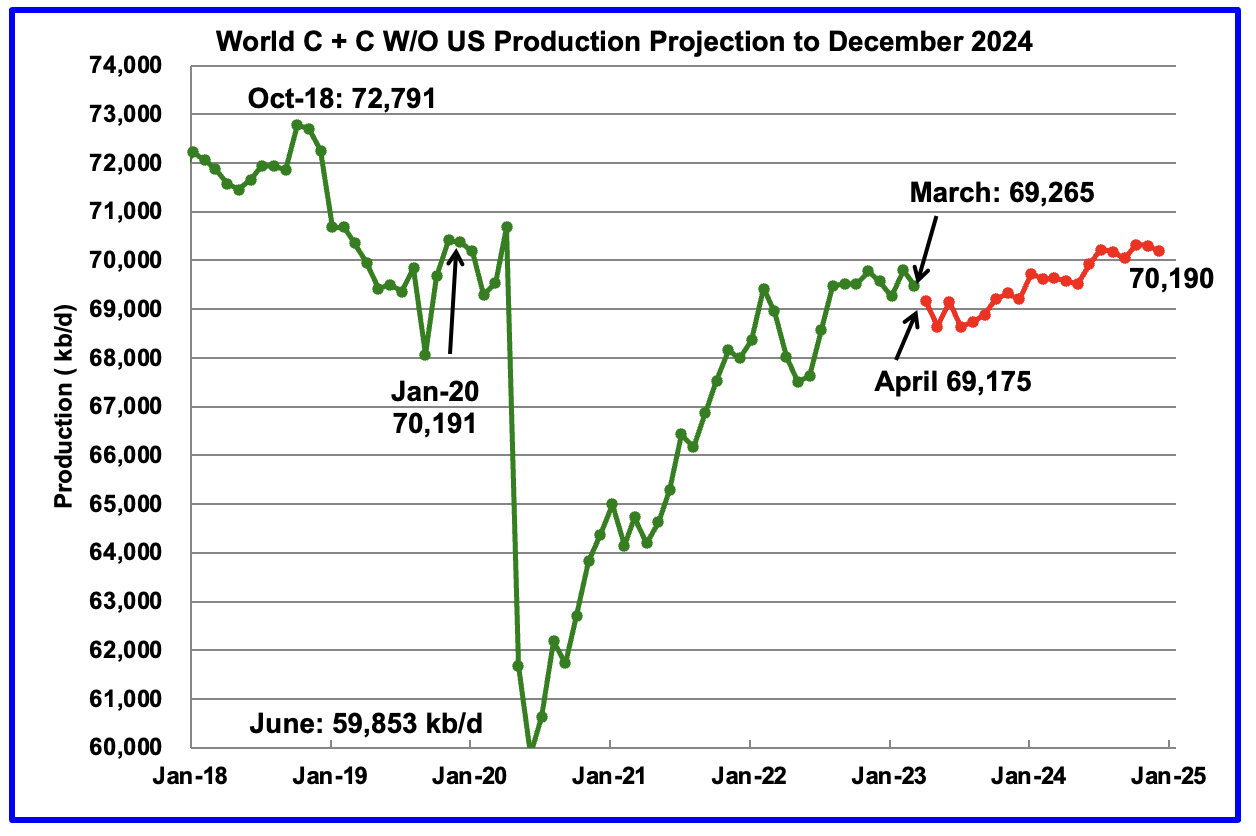
World without the US oil output in March decreased by 565 kb/d to 69,265 kb/d. Aprils’s output is expected to decrease by close to another 90 kb/d. December 2024 output of 70,190 kb/d is 2,601 kb/d lower than October 2018 output of 72,791 kb/d.
World oil production W/O the U.S. from April 2022 to December 2024 is forecast to increase by a total of 1,015 kb/d.
301 responses to “March 2023 Non-OPEC Oil Production Drops”
The OPEC Annual Statistical Bulletin was issued on 12th July.
https://www.opec.org/opec_web/en/publications/202.htm
There is virtually no change to any reserve numbers between 2021 and 2022 except that UAE added two billion barrels. Data that isn’t available elsewhere shows number of completed wells. Iran is especially interesting as Baker-Hughes does not report rig numbers there. The completions have been declining steadily since 2014, with a noticeable dip in 2020/21, which now looks to have been recovered. I don’t understand how Venezuela can hold production when there are no new wells being completed, I thought heavy oil wells generally had a shorter life and needed replacement or at least recompletion every few years, but it looks like I was mistaken. Given Iraqi ambitions from a few years ago to raise production to 6.5 mmbpd the completion activity is pretty useless (i.e. it’s fallen by over half and isn’t showing much sign of increasing). If you stick a straight line trend for total w/o Venezuela from 2014 then it would hit zero, i.e. signifying the end of any new developments, in the late 30s.
The only place where some OPEC numbers can be checked is in the sub-saharan countries. The larger E&Ps that operate there report production of all liquids of just under half of the amount reported by EIA for the countries. Note that some reported E&P production is from non-OPEC countries, like ExxonMobil in Chad, and some production from smaller E&Ps like Kosmos is not included, but the numbers are small and since 2011 the ratio of countries to companies has remained quite constant. The reserve numbers are quite different with the companies now reporting just over 3 billion compared to the countries at 45 billion (with the factor rising from about 5 to 15). R/P for the combined companies has fallen from 9 years to 6, for the countries it has risen from 31 to 39.
At the rate BP, Shell, Chevron and ExxonMobil are dwindling away I should think all are to some degree looking at how they can sell off their remaining assets sometime in the next few years. Eni and TotalEnergies have been holding production and have ongoing developments in progress so are likely to remain for some time.
And
Thanks for the great charts and info Mr. Kaplan.
Agree. Nice charts!
Thank you Ovi, excellent post.
Annual US Output and US L48 excluding GOM, 2018-2024, the 2023 and 2024 annual output is a forecast by the EIA’s STEO. Note that 2019 peak annual output is expected to be exceeded in 2023 and 2024 will exceed 2023, if the forecast is correct (it never is exactly right.)
I’m betting against a new peak. Not in this economy.
From the July STEO:
U.S. economy. Our forecast assumes U.S. GDP growth of 1.5% in 2023 and 1.3% in 2024, which is revised up from last month’s forecast of 1.3% in 2023 and 1.0% in 2024. The upward revision is partially driven by an updated estimate of real GDP growth in the first quarter of 2023 (1Q23) resulting from more consumer spending and aggregate investment than assumed in last month’s STEO. We use the S&P Global macroeconomic model, and we input our energy price forecasts to get the forecasts for the U.S. economy used in STEO.
GDP ? What is GDP ? Sorry friends behind paywall , So it is a copy paste .
WHAT IS GDP ?
Whenever their stuffed animals fall apart, my kids get their great-grandmother’s to stitch them up. It’s an emergency and they rush to the hospital for broken toys, which is luckily next door. This activity adds nothing to GDP but it makes the children happy and probably adds years to the old lady’s life. I think about it and I wonder. We’re really measuring the wrong things. We’re not measuring what matters at all.
As the original Robert F. Kennedy said about GDP, “it measures everything, in short, except that which makes life worthwhile.” A forest adds nothing to GDP while cutting it down is valuable. Care work, repair work, share work, these are all worth nothing. Raising children, caring for elders, caring for yourself? “Do that on your own time.” That’s the message from the ruling oligarchs, and ‘serious’ economists. Seriously? What is GDP even measuring?
These people only look at the speedometer, never glancing at the fuel (E), and never thinking that the two might be connected. And we must just keep accelerating forever, they have no concept of a destination at all. Of course this ends in ruin. How could it not? We measure only prices and destroy that which is priceless. That’s what GDP is a measure of.
Waste
What GDP really measures it the rate at which we take things out of the Earth and put them in the bin. We’re literally standing in front of a steaming trash can crowing about how big it’s getting. In geological time, that’s all GDP is. Garbage Dug from Planet. In the long run every single human product is thrown away. Every service leaves only waste heat behind. What economics calls a measure of growth is, geologically speaking, just a measure of pollution. Every year we make things that don’t decompose for hundreds of years, using resources that took millions of years to form. What kind of math equation is this? How do you think it ends?
Pollution, of course, is not a biological concept. The oxygen ‘pollution’ of photosynthesizers became the manna of aerobic lifeforms. The ‘pollution’ of your own butt can grow the plants you eat. Nature is a cycle, and one creature’s shit is another’s breakfast. Economics, however, is a closed system which does not acknowledge (or measure) the existence of nature at all. Both the amount of resources nature has and the amount of waste it can take are assumed to be infinite. The only limiting factor is, within macroeconomics, nothing. It’s all just disembodied numbers that can keep growing forever.
In conventional economics, it is just assumed that you can keep drawing resources forever and dumping them forever and thus grow forever. Does this make sense in physics? No, but economics both not integrated with any of the other sciences (because its assumptions aren’t even provable) and simply doesn’t give a shit. ‘Don’t you like iPhones?’ is the general answer to questions about growth, and as long as iPhones can be produced, this is satisfying. As Upton Sinclair said, “It is difficult to get a man to understand something, when his salary depends upon his not understanding it.” Such is with the global economy, where our salaries literally depend on not understanding that the whole thing is a planetary Ponzi scheme.
The planetary Ponzi proceeds by taking resources from millions of years ago and dumping the costs on creatures not yet born. This is done not so much out of malice as sheer ignorance. Economics has no concept of the environmental space it operates in, nor the geological time. Because this trick has worked for 400 years is convincing enough to anyone that looks at quarterly reports, but to anyone that can do math the situation is completely fucked. As the physicist Tom Murphy says, “Having witnessed a half-dozen rabbits come out of the hat in the example of lighting technology, we are conditioned to believe more are forthcoming. It will be true until it isn’t any more. One way to put it is that 6 rabbits does not imply an infinite number.” We are now at least six doubling cycles into the garbage measurement we call growth, and now the whole thing is going in the bin. Garbage in, garbage out, as the computer scientists say.
Waste Heat
GDP is also not just a measure of useful things, it’s increasingly a measure of useless profit. Effectively waste heat. As the second law of thermodynamics says: “Not all heat energy can be converted into work in a cyclic process.” In the same way, not all value goes to the worker, increasingly most of it goes to the capitalist. Nobody sells anything at ‘cost’, and the goal is actually to maximize the waste (profit). Given that everything requires energy to produce, this actually accelerates the heat death of the livable planet.
The problem of a population exhausting resources is wildly exacerbated by a few capitalists trying their damnedest to maximize the waste. The incentives of capitalism are wildly aligned with the living planet. They make GDP go up and crow about their own ‘innovativeness’ which is just innovation in bullshit. The resources come from the past and the costs are dumped in the future. All they ultimately produce is a bunch of hot air called profit, and still die in their god-measured years.
Wasted Energy
GDP is denominated as money, but what is money? Since the gold standard tarnished it’s assumed that money is created out of thin air (by fiat) but it’s not called the petrodollar for nothing. USD is a promise that you can get oil, generally at gunpoint. As Vaclav Smil says in the first line of Energy And Civilization: “Energy is the only universal currency: one of its many forms must be transformed to get anything done.” As he continues, “Only the inputs of fossil energies — directly as fuels and electricity, and indirectly in agricultural chemicals and machinery — could sustain both an expanding population and a higher per capita supply of food.” I would add is per capitalist greed, ie the waste heat above.
Whatever civilizational ‘progress’ that GDP measures, it’s all paid for by ancient sugar daddies. There is a huge (and magnificently dense) energy subsidy built into every single good and service we buy. The source of this growth is not mere human ingenuity, we have dug up millions of years worth of more intelligent lifeforms and used their ingenious harnessing of solar power as stored energy. What did we do with this solar inheritance? Blew it all in a few centuries.
The almighty dollar is really backed by finite fossil fuels, which really backs us into a corner. Cut off this subsidy and civilization as we know it crashes. Keep it plugged in and this civilization burns. So our proximate choices are crash and burn, or both, as we seem to be choosing. To switch to renewables A) doesn’t allow this civilization and B) at best buys you a few centuries of snorting some other resources before the chessboard problem spills us out the petri dish once again.
The fact is that GDP is effectively a proxy for fossil fueled growth, and if we keep growing, we’re fucked either way. If we replace fossil fuels to keep growing, then we’re just fucked in a million other ways. Climate collapse is just a symptom of seeing the world this way. An electric bulldozer still bulldozes the planet, however green the paint.
What Now?
What does this have to do with a Paati stitching the leg on a stuffed animal for a child? Nothing. I have no solution. The thread she used is probably made out of petroleum, what do I know about solutions? I’m just a particle in the stream. What does one do about this problem? I dunno. We’re in much bigger doo-doo than ‘one’ can undo.
One ‘lesson’ is that we already live most of our lives outside of capitalism and that we could contract the role of markets instead of putting our hospitals and schools and town square in them, but that’s just one point among trillions of dollars saying the opposite. That’s the best I can come up with, and it’s still a political solution to a philosophical problem. It’s still wildly inadequate, like bringing a knife to a gun fight.
The deep philosophical problem is the very idea of endless growth, but changing that is a whole-ass shift in consciousness, which is way above my pay grade. All I can do is my dharma, which seems to be complaining to a few people that already know.
As long as people measure GDP and don’t measure the living planet, we’ll get more of the former and less of the latter. As the old business school adage goes, ‘you get what you measure’. The corollary of that is that ‘you lose what you don’t measure,’ ie everything that which makes life worth living. In fact, as long as we require measurement and science to understand our place in the world, we’ll keep getting lost in abstractions and miss the point, which is spiritual. But who am I to tell you that? I’m here in front of a screen, pointedly not looking out the window or playing with my children.
From where I sit GDP has nothing to do with me. It’s something stupid and meaningless and frankly evil compared to my own life, let alone the living planet. My kids don’t understand it and the dogs don’t understand it and I think they’re on to something. We somehow believe that GDP is important cause we see it on TV, but it’s not. It’s just a made up number to glorify waste, and waste heat, and wasted energy.
GDP is bullshit, but to someone under the bull, this is a purely academic observation. You can’t get the bullshit back in the butt, nor can you immediately the bull off’a you, especially with so many hopes riding on it. The best you can hope for is to try again over the next few lifetimes, with the ruins of GDP as fertilizer.
GDP is income, it is an imperfect measure no doubt.
GDP is a measure of at what rate we are destroying the natural world. Like someone once said, “If you really want to help the GDP, ram your car into a school bus, or go on a shooting spree”.
Brilliant post. Summation: humans and yeast are effectively the same.
Required
I tend to agree with you. In the US chart above, production is essentially flat from April 2023 to May 2024. All of a sudden production takes off in June and adds 547 kb/d over the next seven months. What happens next June. The EIA is still forecasting $80/b WTI in late 2024, not that different than $76/b today.
Is there a change of heart amongst the drillers. Is Drill Baby Drill going to reappear all of a sudden? 😟 😟 😟
I would certainly like to hear what some of the real drillers think about the possibility of production starting to take of next June.
Ovi,
Chart below has STEO oil price forecast in Real Dollars (July 2023 $). The forecast may not be accurate, but they expect real WTI oil prices (July 2023 $) to rose from $71.86 in May 2023 to $75.24 in Dec 2023, after that the price gradually rises to $77.29 by Dec 2024. The EIA model may think that a real WTI price is a thresh hold where the completion rate starts to increase in tight oil basins and that may explain the transition from flat output in 2023 to rising output in 2024. From June 2021 to Feb 2023 most months has real WTI oil price over $75/bo, and all months from March 2023 to Nov 2023 (except April) are expected to be below $75/bo. This might explain the nature of the STEO forecast for US output. Note the delay until June, might be based on an assumption that producers will wait to see prices stabilize above $75/bo for 6 months before the increase in completions starts (also it takes 3 to 4 months to ramp up drilling and completion activities).
You are not the only one, the peak is here according to this report:
https://info.gorozen.com/2023-q1-hubberts-peak-is-here
Svaya,
Note that they mistakenly estimate cumulative output from Permian basin at 14 Gb, it is about 10.7 Gb as of April 2023. If their 34 Gb estimate for Permian URR is correct, this suggests 50% cumulative output would be reached in July 2026, if we assume flat output from April 2023 to July 2027, my expectation is that their 34 Gb estimate is too low by at least 6 Gb and if I am correct and output also remains flat as assumed before, then 50% of cumulative output is reached in Jan 2028.
My best guess scenario has URR at about 40.5 Gb and reaches cumulative output at 50% of URR in October 2027.
This bits got me going:
“The most crucial development in global oil markets is depletion in the Permian basin. We
first warned about this in 2018, predicting the Permian would peak in 2025. In retrospect,
our analysis was too conservative. We now believe the basin could peak within the next
twelve months. The implications will be as profound as when United States oil production
peaked in 1970, starting a chain of events ultimately sending prices up five-fold over ten
years. If we are correct, this could not come at a worse time for oil markets: inventories are
tight, production in the rest of the world is declining, and investors are incredibly compla-
cent.”
If true this could be worse than Covid and that could have a similar demand destruction steep colapse like the one in 2020.
Also I cannot argue with this:
¨The question, of course, is how things develop from here. The Biden administration announced their intention to rebuild the strategic petroleum reserve, although we are skeptical they will be able to do so. Despite having built by 80 m b from their lows, commercial invento-ries remain near long-term seasonal averages. It is unclear how the US will be able to rebuild its SPR without driving prices dramatically higher. In fact, despite pledging to replenish the SPR at a price between $67 and $72, government inventories have resumed liquidating by 270,000 b/d since April 1st, 2023. The administration has many motivations for releasing oil from the SPR. Last spring, a genuine desire was to insulate commercial inventories from Russia-related disruptions. Many analysts believe the administration sought to depress gasoline prices in the fall before the midterm elections. Most recently, the administration likely used SPR sales to forestall the impending debt-ceiling breach.¨
… ¨the US strategic petroleum reserve currently stands at 371 mm barrels – the lowest level
since 1983 and half the peak reached in 2009. Since its introduction in 1975, the SPR has
been a successful buffer in dissuading “bad actors” from using oil supply disruption as a
weapon. With strategic reserves at such a low level, we are concerned groups may try to use
the “oil sword” again. As recently as 2019, Houthi rebels attacked an oil refinery complex¨
Svaya,
A post by the same group more focused on Permian Basin.
https://blog.gorozen.com/blog/the-permian-basin
Excerpt:
Our models tell us the Permian will ultimately recover 34 bn barrels of oil, of which 14 bn or 41% have already been produced. At current production levels, the Permian will have produced half its recoverable reserves sometime in late 2024; at this point, it will most likely stop growing, just like the other two basins.
This where they are mistaken, only 10.7 Gb of Permian tight oil has been produced, about 3.3 Gb less then they claim.
Data in spreadsheet at
https://www.eia.gov/energyexplained/oil-and-petroleum-products/data/US-tight-oil-production.xlsx
Add together Spraberry, Wolfcamp, and Bonespring columns in spreadsheet and then sum the total and multiply by 365.25/12 to get millions of barrels of Permian tight oil output. The result is 10738.54 million barrels or 10.7 Gb.
Other than this mistake their analysis is excellent, though I think their URR estimate is likely low by at least 6 Gb for the Permian Basin.
Dennis –
Wondering if you have an updated version of your 2015 shock model (excluding US tight oil)? How well does the 2015 model match current data?
Thanks,
Svaya,
Correct. If I understand Dennis’ models correctly, Dennis’ models of a plateau in shale are based on the assumption that sweetspot style rates would continue for some time. As G&R point out, total rig count in the shale fields declined over the years not because of any technology breakthroughs or efficiency gains, but because the drillers got better at locating sweet spots.
Moving out of the sweet spots means increasing the drilling per acre and less productivity per acre. Double whammy. Its unlikely with shale’s low to nonexistant profitability (during the sweet spot years), increasing capex and declining quality inventories that future production will be sustained at current rates and neither does it look like steep declines could be mitigated.
I think shales steep declines are on the horizon.
Kengeo,
That model was based on C plus C less extra heavy oil URR of 2200 Gb and 500 Gb of extra heavy oil and was independent of my tight oil models. So the model was far too conservative and did not anticipate how important tight oil output would be. In 2022 the model forecast was for 69.5 Mb/d, too low by about 11 Mb/d compared to actual World output. C plus C less XH World output in 2022 was 64 Mb/d for Model vs 76.7 Mb/d for atual World C plus C less extra heavy output or about 12.7 Mb/d too low.
When I say my past models were very conservative, this is a good example.
Anon,
I have thought since 2012 that steep tight oil decline was just around the corner, for the past 13 years I have had to pudh the date that average well productivity would decrease in the North Dakota Bakken/Three Forks to next year. It did happen in the Eagle Ford back in 2017, though productivity bounced back up in 2020 and 2021 after falling in 2018 and 2019. For Bakken productivity see
https://novilabs.com/blog/north-dakota-update-through-may-2023/
The average well productivity increased from 2012 to 2019 and has held steady from 2019 to 2022, still waiting for the decrease some 10 years later. I am assuming average well productivity in the Permian basin holds steady at the 2020 level (it actually increased in 2021, but my model does not reflect this increase). I will wait for actual evidence of average well productivity decline to below the average 2020 level before incorporating it into my model, many of my past scenarios were too low because I predicted falling average well productivity when in fact it did the reverse. Eventually it will fall, when it occurs I do not know.
My understanding is that costs have been starting to decrease in the oil patch, if oil prices rise we may see increased profits and completion rates. My best guess model has completion rates falling from about 500 per month recently to about 475 wells completed per month. It might be somewhere in the 450 to 500 range, 475 is just a guess.
Dennis,
You prefer to look at URR as a very important metric (it is). Goehring & Rozencwajg’s research shows there’s a magic moment when shale oil fields begin their stagnation and decline, that is, when 60% of sweet spot acreage (Tier 1) has been drilled. URR might not be as decisive of an aid in forecasting peak as G&R’s AI modeling might have suggested.
Watch from 32:00-40:00:
https://www.youtube.com/watch?v=iHzWGnbI9nw&t=1927s
Just my two cents, if you go first for the sweet spot wouldn’t the decline be steeper. My basic logic tells me that the offset that should come from sweet spots will come istead from sour spots thus not helping the decline rate which is pretty high for tight oil.
Anon,
My tight oil models are not as focused on URR as my shock models. I use actual well productivity based on Novilabs data and the prospective area for tight oil development identified by the USGS. Note that when I do this analysis for the Bakken my results are similar to what G & R have for URR estimates (I have 9.5 Gb for North Dakota Bakken/Three Forks vs a 9 Gb estimate by G & R). Note that the USGS has a mean TRR estimate for the ND Bakken of about 11 Gb so the G & R URR estimate is about 82% of the mean TRR estimate. For the F95 ND Bakken TRR estimate the USGS has about 9 Gb, similar to the G & R URR estimate. For the Permian basin the TRR mean estimate is about 75 Gb with the F95 estimate at 44 Gb. For the Bakken model, the wells I have being completed are about 8 million of 15 million prospective acres and for the Permian it is about 23 of 50 million prospective acres. The URR is a function of average well productivity times number of wells completed for my tight oil models. Output is also a function of average well productivity and completion rates. Future completion rates are not known, nor is future average well productivity. I do not have access to tier on and tier 2 prospective area data, so the G & R estimates may be more accurate. They do make a very basic error on cumulative production in the Permian basin, which makes me question their analytical thoroughness, unclear what other errors they may have made.
Dennis,
Re Goehring and Rozencwajg’s ” … very basic error/analytic thoroughness” …
One year ago, G&R published a 35 page report that – among other things – called for a near quadrupling of HH from then $8 and a convergence of US and global natgas pricing.
Hmmm …
Their ‘neural modeling analysis’ (gotta love that marketing) called for only ~4,500 more Marcellus well locations (this, when ~12,500 wells had been drilled).
Since publication, over 550 wells in Pennsylvania alone have been spud. Adding in WV’s should bring the total to 700+ wells. Extrapolation should indicate that new Marcellus production will end by 2030.
If anyone believes that, they are nuts.
This is another display of Art Berman tier work that an unsuspecting public is prone to accept unless some due diligence is exerted on the part of serious students in these matters.
>Their ‘neural modeling analysis’
I’l take math and common sense(from experts on the field) every day over the neural network and I am a computer geek.
But if there is no math (a formula that reverses a curve of data) I’ll take the neural modeling analysis over marketing blah blah.
Ruh-roh is better than blah, blah!
OPEC Crude oil annual output 2018-2024 with STEO forecast for 2023 and 2024.
https://oilprice.com/Energy/Crude-Oil/Iraq-Takes-First-Step-Towards-Becoming-The-Worlds-Biggest-Oil-Producer.html
I think it is actually possible to build out and exploit more of the northern oilfields in Iraq. Especially heavy oil in the kurdish region. Corruption and lack of desire from larger oil companies to invest there has delayed expansion in the landlocked territory. There are some landlocked opportunities across the border in Iran also; chinese contractors have been working there.
Let us see what will win , the oil or the water .
https://www.iraqinews.com/iraq/iraqs-marshes-suffering-its-worst-heatwave-in-40-years/
OPEC crude plus US C C, EIA data 2018-2022 and STEO forecast for 2023 and 2024, annual average output.
In 2024 output is expected to be about 1050 kb/d less than 2018.
Using forecast above and the STEO total liquids forecast for Non-OPEC less US and assuming the 2022 ratio of crude plus condensate to total liquids continues in 2023 and 2024, along with the 2022 ratio of OPEC crude to OPEC C plus C also continuing into 2023 and 2024, I get the forecast below for 2023 and 2024 annual average World C plus C output. 2024 output is about 401 kb/d less than average 2018 output, in 2023 and 2024 World average annual C plus C output increases by about 900 kb/d each year. Of this 900 kb/d annual increase in World C plus C output about 490 kb/d comes from the US,
I agree with Ovi’s assessment that this seems optimistic. Note however that first quarter 2023 World output was at about 82,113 kb/d. So achieving 82,580 kb/d in 2024 only entails a 467 kb/d increase from the 2023Q1World C plus C output level.
My best guess model has 2024 World C plus C annual average output at 82410 kb/d (a 297 kb/d increase from 2023Q1 output).
Did you see the MOMR?
Non-OPEC is down 0.3 mb/d
OPEC is down 0.55 mb/d
That’s over a 3 month period…
Kengeo,
Under World Oil Supply I find:
Non-OPEC liquids production (including OPEC NGLs) is estimated to have increased m-o-m in June 2023 by 0.5 mb/d to an average of 73.0 mb/d. This was higher y-o-y by 2.7 mb/d. Preliminary estimated production drops in June were mainly driven by Russia and were more than offset by rises in OECD Americas and Other Eurasia.
From 2023Q1 to 2023Q2 there was a small decrease as expected due to reduced Russian output. Also the World was oversupplied in 2023Q1 by 0.35 Mb/d so the market adjusted to a lack of demand.
From: Table 11 – 1: World oil demand and supply balance, mb/d (Monthly Oil Market Report, July 2023)
OPEC Non-OPEC change:
1Q23 vs 2Q23: -0.86 mb/d
2Q23 vs 3Q23: -1.18 mb/d (assuming OPEC down 0.1mb/d monthly)
Total Non-OPEC production
1Q23 – 65.23
21Q23 – 64.92 (-.31)
3Q23 – 64.04 (-.88)
OPEC crude oil production (secondary sources)
1Q23 -28.82
2Q23 -28.27 (-.55)
3Q23 -~28 (-.3)
ovi and dennis great stuff!
picking up our discussion from last April, my thesis’s were 1)nat gas is the future to a eventual transition to nuclear, 2)we are entering into golden age for legacy domestic oil producers and 3)that inflation will remain sticky. 1970’s style redo.
With the recent announcement of Buffett taking a majority interest in the Maryland LNG plant and today exxon /Denbury news as well as a number of my mlps (PAA for example) making major moves to multi year highs, points to my conclusions being “dead balls accurate.”
add in the collapse of the ESG narrative and public companies shunning new green projects for lack of profits leaves only broke governments to fund the boondoggles, that half-life is now very short.
While WTI oil continues to trade below $80, cost are coming down rather precipitously. I still think $80-$90 will be the “New” range unless we get some more black swan (war) news. I still think odds favor china going into Taiwan before the next US presidential election.
https://www.rigzone.com/news/this_is_the_goldilocks_price_for_oil-13-jul-2023-173324-article/
On inflation, the $ has now broke well below the established head and shoulders pattern. Target around 94-95. We may have seen the low print on CPI and PPI but I expect it to stay in this range UNTIL…
The big wildcard now looks to be the BRICS currency announcement schedule for august with sometype of gold back trading currency, I have seen where 43 other countries have ask to participate. This should be a huge weight on the dollar. I think we are seeing two trading blocks being set up. I expect that to be inflationary as well as a much weaker dollar. There is nothing the fed can do about that.
Hard to say the exact reasons for this, but some combination of corrupt US government, using the dollar as a weapon and the idiocy of mandated green energy utopia being imposed of non interested countries representing 1/2 the worlds GDP and 3/4 of the worlds population.
With the era of the pandemic over and the world is getting back to normal, I agree at the right price the US will achieve a new record high oil production, be the largest LNG exporter and the near term future will be a golden age for domestic energy producers.
ON a side note even in my little central Texas town I see a Tesla every and then, and of course in Austin in the high end neighbor hoods they are as common as labradors. I got that one wrong. But diesel is $3.09 so I am OK with that.
I saw the Biden administration will refill the SPR but not until his next term😂
https://www.zerohedge.com/energy/us-strategic-petroleum-reserve-will-not-be-replenished-anytime-soon
Texas tea,
Little indication of nuclear taking off, either in the US or worldwide, nuclear consumption was down 4.8% in 2022 for the World and 1.4% in the US. Natural gas consumption for the World was down 3.1% in 2022, but is up at an annual rate of 1.7% per year over the past 10 years. Consumption of non-hydro renewable power was up by 13% in 2022 and had an average annual growth rate of 12.6% from 2012 to 2022. In fact if we look at the increase in consumption of primary energy by the World in 2022 it was 6.63 EJ, of this total 5.49 EJ was from renewables (including hydropower) for an 82.8% share of the increase in energy consumed in 2022. Data from the Statistical Review of World Energy.
https://www.energyinst.org/statistical-review
Dennis, keeping the faith😎
https://oilprice.com/Latest-Energy-News/World-News/Future-Of-Oil-Demand-Is-Brighter-Than-Youve-Been-Told.html
Not sure about the rest of it, but I agree with your oil price assessment, TTT:
Only change is suspect $80-$100 ($80 would keep production growth -if even possible- minimal. $90 would make many producers “happy”, and $100+ could spur new/more development…
But of course consumers would like prices <$80, which in my opinion isn't going to happen.
Texastea,
We will see how it goes, reduction in share of fossil fuel use has proceeded slowly falling from 93% to 82% from 1965 to 2022, for the past 10 years the share has fallen a bit faster from 86% to 82%, but we need to go from 82% to zero in the next 28 years, nearly 3% per year on average. Of course some percentage of fossil fuel is not used for energy, but as in input for other materials such as plastic chemicals and fertilizer. To address climate change we need to ramp up non-fossil fuel energy as rapidly as possible while reducing the use of energy as rapidly as is feasible. I hope we will see demand for fossil fuel fall rapidly after 2030, so far we are not doing nearly enough.
Dennis —
Little indication of nuclear taking off
Not only that, but the fleet is getting older quickly, though you don’t see this in the production numbers.
Pretty soon the big burst of investment of the 70s will reach end of life. Capacity additions came to a virtual standstill in the 80s, and a 40 year gap in investment will be hard to compensate for. Most nuclear reactors are over 30 years old.
So even if a lot of new nuclear plants are built between now and 2050, capacity is likely to be lower than it is now.
TTT,
That is an excellent, wide ranging comment regarding several energy, political, and economic topics.
Some perspective/context, perhaps, focusing on current hydrocarbon realities …
If anyone reading this posting has not yet SERIOUSLY read (and re-read) the above link from OFM (hope things are going well for you, Mac. Tnx for the link.), one would be advised to appreciate the production/capacity numbers from Iraq presented therein.
In just the last 4 months, approximately $40 billion has been committed to 3 new/expanded LNG projects (Port Arthur Phase 1, Plaquemines Phase 2, and yesterday’s mammoth Rio Grand LNG Phase 1).
The 40 Mtpa (Million tonnes per annum) from just these 3 projects will match the much ballyhooed Qatar LNG expansion. The anticipated brownfield expansions from Port Arthur and Rio Grande will add an additional 3 Billion cfd demand to the near 6 Billion cfd already required for these 3 FID-approved projects.
As Cummins continues to incrementally introduce the X15L natgas engine – for Class 8 trucks – to rave reviews (CNG prices were about half of diesel’s in the US in 2022), the widespread rollout in a few months is stirring great anticipation.
You oil-centered folks who focus on potential oil scarcity might be advised to ‘broaden your horizons’, if only as (unpalatable?) thought experiments regarding alternative scenarios to an oil-deprived world.
While TTT’s comment about a looming gold backed currency is more probable – and lifestyle shattering – than many might think, the chances of oil scarcity is near the bottom of likely future situations which we – globally – will encounter.
coffee I always appreciate your comments, opinions and world view. I will say it, first of all because you probably wont and secondly of all because your ideas have stood the test of time. It was you and me a decade ago calling out the BS, sticking to our guns and time has proven us right. I said many times… all that green energy will do is pick up SOME of the over all INCREASE in energy demand. A decade later and many trillions of $$$ later, that simple obvious truth in now mainstream. I have NO idea if the current estimate for necessary expenditures to get to this carbon neutral world takes into account the inflationary pressures or the replacement cost of the failures of the current green energy infrastructure because it does not matter. Neither europe nor the US can afford it. no one else cares.
If the BRICS are successful and roll out a competitive trading currency to the dollar that is widely adopted, I think the best scenario example would be the collapse of the soviet Union for the EU and the US. In that world green energy and reparations will be used in past tense only. The world wont end but life as we now enjoy it will.
Now I don’t know the future but there is a wiff of panic, the old energy companies CEOs’ from Norway to France to Texas and now even the big wall-street banks have come to our view. its drill baby drill for the foreseeable future.
Pandemic stimulus or transfer payments from of government are largely gone. Individual tax receipts are something like 20% lower in 2023 than they were in 2022. Income on average is down 20% year over year. Nothing inflationary at all about that fact.
Combined that with millions getting hit with having to repay student loans. Recession is near. Hard landing is near. Much lower oil prices are near.
HHH- market is already under pressure, while possible, what do you see as the trigger for the event? $150 oil seems twice as likely as $50…there’s unlimited demand at $50 and moderate demand at $100, aren’t the suppliers in the driver seat?
Look, main stream narrative that all is good is BS. All is not good: look no further than China if you want to confirm that. Look no further than yield curves be it USA, Germany, Canada or UK or whatever. They are fuckin telling things aren’t good or inflationary.
How anybody could think inflation will somehow prevail in current economic environment is ludicrous. Not based in reality. Based in bullshit.
We have deflationary money in Eurodollar market. We also have no lender of last resort in Eurodollar market to re-collateralize the market when necessary.
If you want a black swan that really isn’t a black swan that brings everything down look no further than commercial real estate.
“If you want a black swan that really isn’t a black swan that brings everything down look no further than commercial real estate.”
Where I live and work, workers are refusing to go back to the office. Even the management can’t request you to come back with a straight face as they don’t want to either.
If you force your empleyees to come back, your competitor will hire up your good ones.
I forgot where I read it, but a financial commentator said it is better for
the business to default on their commercial loan and walk away then sit on an empty builiding.
It’s a $14 trillion market. 80% of these loans are on the balance sheets of the small and medium sized regional banks. Same banks that are underwater on treasury bonds that caused a few bank failures earlier this year.
As the underlying collateral for these loans gets repriced. These banks will be unable to borrow their way out. As the large banks aren’t going to accept the collateral these banks have. And they also won’t be doing the one thing that the economy needs them to do. Which is make new loans.
Credit crunch is already here. You can see it in demand. You can see it in the global trade data. Imports and exports falling like a rock everywhere.
The FED and rest of the central banks will be cutting rates back to zero soon enough. But that won’t be inflationary. They will be cutting in response to money in real economy vanishing like a fart in a hurricane.
What’s interesting is all the data supports HHH arguments on the economy, all the way up to the point of oil to $50. Oil has recaptured trend is actually bullish. “Should” it be that way given these economic conditions? No. But you’ve got a powerful price control mechanism in OPEC, tons of oil shorts to unwind, and a little thing called Peak Oil, that even if we aren’t “AT” peak oil, we are close enough that there isn’t SUFFICIENT slack outside OPEC to calm The Machine. The machine has its Sauron eye on oil, and its more than likely going up from here. TTT take a victory lap.
Not sure we are looking at same charts but there is nothing bullish about the WTI or Brent chart. Trend is clearly down. But then again when looking at charts people tend to see what they want.
Based on the macro oil is heading lower. Much lower.
Dollar is having itself a pullback. Before going higher. Nothing gets to where it’s going in a straight line.
How do I know that? When the economy is doing well the dollar weakens. Loans are made. Business is done. When the economy is bad the dollar strengthens.
Both oil prices and the value of the dollar depend on what state the global economy is in. Sure OPEC can get oil prices to rise for a bit by cutting production. But time and time again the temporary bump in prices just doesn’t last.
Show me why the economy is going to take off and start booming and I’ll get onboard with higher oil prices.
Right now all I see are reasons why the economy is headed straight off a cliff. What is going to trigger the growth in demand? China? Europe? USA? Japan? Please tell me because I’ve been looking and can’t find any reason to believe growth is going to boom anytime soon.
And btw, slowing inflation isn’t really what you want when the amount of debt exploded higher much higher over the course of about three years. We are told getting inflation back to 2% is a good thing. I don’t see it as a good thing. I see it as a major problem.
China’s year over year inflation came in at 0%. That is a huge problem and not just for China. Means they can’t pass on higher costs to consumers nor increase employee pay without directly effecting the bottom line. Profits are going to be tanking.
All economics prognostication is based on game theory. OTOH the finiteness & non-reewability of crude oil can’t be gamed.
“Not sure we are looking at same charts but there is nothing bullish about the WTI or Brent chart. Trend is clearly down”
I use trend as meaning on a 3 month basis because that’s a significant time frame for the machine that does most of the trading. a trade being 3 weeks (in order to front run the Month-over-month. Oil hasn’t made a new low in 4 months. In addition, Oil Volatility (OVX) is very low, just touched 30. The last time it was in that range was August 2020. Oil went from $40 to about $110 from there. Now, some of that was Ukraine war shock, but last I checked the war is still happening. And like I said, CFTC net speculative longs are still extremely low so people are positioned heavily short.
We are already seeing some significant reflation that’s already started in quite a few commodities (Palm Oil – up 22% in 1.5 months, Cotton -no new low in 9 months, Lumber – up 42% over 6 months). Which will only keep the Fed higher for longer-er. That’s what the signals I’m seeing are saying, and the signal can trump Macro. We are still seeing the downturn in things like industrial inputs, but even cobalt is now up 13% in the last month. That is not screaming deflation but reflation, for now. It is maybe even probable that oil will turn back down but I certainly wouldn’t be pressing oil or energy stock shorts right now. We are 4.5 months past the “oil is going super low” deadline of March, given about a year ago. Even giving some slack, at some point you might have to change your position on the matter.
There is a lot of talk about GDP on this site. But a better measure of how well off an economy is doing is GDI. The I stands for income. And here in the US that is in contraction. Not growing at a slow rate. Contacting.
All 18 or 19 times GDI has contracted in last 100 years we’ve had a recession. You need to let this recession play out before getting bullish on oil again.
The month after we hit our all time low in unemployment rate think it was 2.5% way back in 1954 or maybe it was 52 we went straight into recession. So unemployment figures actually don’t give good insight into if a recession is on the way or not.
The narrative of soft landing will soon give away to reality.
HHH,
Good point. Link below to real domestic gross income for US.
https://fred.stlouisfed.org/series/A261RX1Q020SBEA
HHH –
We can all agree that at the end of June WTI hit a low of ~$68 and has settled to ~$76, a 12% increase in 3 weeks. Over 6 months WTI has bounced between ~$66 and $83, current price is neutral in this range. Past 2 years WTI has generally traded between $60-$70, except for 2nd half 2021 and most of 2022 where it traded between $80 and $120, peaking 12 months ago at $121.
As far as GDI is concerned, please see following:
I think your expectation for $50 oil is based on 15+ year old pricing…look at correlation between WTI and GDI, looks very bullish for oil as far as I can tell…
Dr Tim Morgan discusses peak oil , renewables , EcoE ( EROEI) , G & R report .
https://surplusenergyeconomics.wordpress.com/2023/06/17/258-written-in-the-skies/
HiH, thanks for posting this. Here is the link again.
‘PEAK OIL’ AND THE UNFOLDING INFLEXION
Finally, someone that knows what the hell they are talking about. 🤣
From the comments the author, Tim Morgan, says:
“I remember back in about 2003 being asked by one of my bosses whether peak oil would really happen (“yes”), and when (“about 2018”). We’re never going to “use up” all the oil in the ground, but a lot of what remains isn’t cost-effective.”
I am unclear, but is he saying that in 2003 he picked 2018 as the date for peak oil? At any rate, he goes on:
With 2019 as the baseline, I’m projecting oil supply lower by 18% in 2030, and 33% by 2040. This is a compound annual decline rate of about 2%, which sounds gradual, but mounts up over time. I may be revising these numbers later this month when we get definitive data for 2022.
That works out to 3% decline thru 2030, then 2% decline to 2040…
That would bring total recovery to ~1950 Gb at 2040…doesn’t seem unreasonable, but I suspect slightly higher decline rates, 3-5% (5-7% per others).
Lots of different opinions on decline rates, I’d guess we’ll have a good idea within 12 months though…
Hole in head,
I recognize very well there are physical limits, I have degrees in both physics and economics rather than history and political philosophy which is Tim Morgan’s background. At point of use the EROEI of wind and solar are actually better than oil and natural gas and calculations that assume the best approach is to build just enough capacity to meet demand and then build enough backup storage capacity with batteries and pumped hydro are incorrect. The cheapest economic cost system builds about 3 times average load in wind and solar capacity, widely distributed and highly interconnected with HV transmission, such a system reuires very small anounts of backup power in the order of 1 to 2% of average load. Excess power can during high wind or solar periods can be used to produce synthetic fuels (this is free power that would otherwise be wasted). These fuels can be used to produce steel, cement and to power any other high heat processes that cannot be more cheaply done with electric arc furnaces. There are no technical limits here, it is simply a matter of building stuff using technology that has already been developed. Any claims that physicists and engineers who have worked on these problems don’t understand simple physics is something a historian or political philosopher might proclaim, but it is false.
Also claims that energy is the source of all value is very appealing to a Marxist who would argue, no labor is the source of all value. There is no single source of value, or more correctly and single good could be chosen as a yardstick and using an input output matrix for all goods in society we could value all other goods in units of oil, apples, water, or chia pets, any item will do. Claims that energy is special are no different than a Ricardian or Marxian claim that labor is special and all goods should be valued in labor.
No single good has any special importance, not energy, not labor, not bananas.
Dennis wrote: No single good has any special importance, not energy, not labor, not bananas.
This is my third time to edit my reply. I give up. Words cannot express how much I disagree with that statement. So I will say nothing except the words I have placed in bold below.
Energy drives the world. Without it we are back to the stone age.
Ron,
Energy is important, so is clean water, fertile soil, air quality. To suggest that only energy matters is incorrect in my view.
Goddammit, Dennis, no one ever said “Only energy.” Intelligence is also important. We have had since life first evolved on earth, clean water, fertile soil, and air quality. We have only had fossil energy for just a little over two hundred years. In that time, the population over the world has exploded over eightfold. Now you tell me, was that due to clean water, or fertile soil, or air quality? Was that due to something that has existed since hominids evolved, or was it due to the sudden appearance of fossil fuels?
What made the difference Dennis? I await your reply. Was the sudden appearance of fossil fuels a factor in the sudden appearance of the industrial revolution and consequently the dramatic population explosion? Or did the sudden explosion of the fossil fuel revolution have nothing to do with it?
I await your reply. This is going to be interesting. 🤣
And it took hundreds of millions of years for the sun to energize all the plants and animals that turned into oil…oil is the ultimate renewable energy, it just takes a real long time to charge the battery!
Proverbs 27:22 Even if you pound a fool with a pestle Like crushed grain in a mortar, His foolishness will not leave him.
Ron,
A whole host of ingredients combined to make that expansion possible, improved healthcare leading to lower rates of mortality, innovations in agriculture allowing more people better access to food. Technical innovation in general. The widespread use of fossil fuel was an an ingredient, but claims of energy being the “master resource” are overblown and asserting that energy is the source of value which is implicit in a Surplus Energy Economic Model is just silly. Any good can be claimed to be the source of value and if the claim can be made for any good ( an input output matrix can be created for any good showing this is the case) then the source of value is entirely arbitrary, it gives us no new information.
The point is a fairly simple one, a complex phenomenon cannot be boiled down to a certain thing as being all important in my view. This is sometimes termed as essentialism, this approach leads to a set of blinders that limits understanding in my view rather than enhancing it.
Dennis wrote, bold mine: The point is a fairly simple one, a complex phenomenon cannot be boiled down to a certain thing as being all important in my view.
That was supposed to support this statement: No single good has any special importance, not energy, not labor, not bananas.
He went from any special importance to all important. He just moved the goalpost a tad in my opinion. Nevertheless, I would even disagree with that last statement. Just because many things added to the population explosion it still does not mean that one thing and one thing only enabled the industrial revolution that, in turn, enabled the massive population explosion. That one thing was fossil energy, coal and oil.
That point has been made over and over again by many historians. None better than David Price in his great essay: Energy and Human Evolution That essay was once a page on this blog until I took it down a couple of years ago.
Ron,
I disagree with the master resource designation that fossil fuel has been anointed with by many. Important, yes, master resource I don’t think so. There is no master resource in my opinion. There are many important resources, energy is one of them, my point is that among the many important ingredients to society, I would not elevate energy to some special status, knowledge might be important as well and the ecological fitness of the planet.
knowledge might be important as well and the ecological fitness of the planet.
Knowledge??? The ecological fitness of the planet??? How about consciousness? Oh, I forgot, you said, “no single good.” Consciousness is obviously not a “good” where knowledge and the ecological fitness of the planet are both “goods”… I guess.
I give up, Dennis. You win. I cannot possibly argue with such logic. Over to you on this subject. 🤠
Ron,
Hmm, knowledge (in particular scientific understanding) is not important? I think their are a number of attorneys that focus on intellectual property who might disagree. We can disagree, I just think essentialism is a dead end.
Dennis, knowledge is very important. I just thought we were discussing the importance of goods, as in goods and services. And you mentioned energy, labor, and bananas. Labor is not “goods” but it is definitely a “service”. Now you pitch in knowledge and the ecological fitness of the planet.
I was not aware that those two were considered either goods or services.
No Dennis, I cannot argue with such logic. I give up.
Ron,
You may not have heard of the labor theory of value, but it was the basis of value used by Classical and Marxian Economics. Any good or service could be chosen as the measure of value, one could choose an hour of labor, a barrel of oil, or a ham sandwich, the choice is entirely arbitrary.
Modern economics has no objective theory of value.
See
https://en.wikipedia.org/wiki/Léon_Walras
Using input output models, it can be shown that any good or service could arbitrarily be chosen as a measure of value. For this reason we could arbitrarily choose energy as our measure of value in an economic model, but the fact that it is an arbitrary choice suggests the foundation of such a model is built on sand.
You bring up the conditions necessary for rapid population growth and what might have changed from earlier times, ecological fitness of the planet has no doubt decreased due to fossil fuel, but the relative fitness at the beginning of the industrial revolution was likely necessary, the increased scientific knowledge over time is quite important in my view, as is the increased energy availability during the fossil fuel age.
Dennis, I don’t have a problem with labor. My whole argument was about energy and nothing else. Without energy, planes don’t fly, cars and trucks don’t run, farm machinery doesn’t run, factories don’t run, food is not produced, and the world just dies.
Without energy, none of us eat. Without energy, we all die. Well, most of us, anyway. There may be enough bugs, roots, and other such food to keep perhaps one percent of us alive.
But you say energy has no special importance. I would not dare argue with someone who actually believes that. Hell no, I wouldn’t dare. 🤭 You win this argument because I am out of it.
Ron,
How would we do without water, air, or soil? Not well I imagine. The point was really about value theory. Nowhere did I say energy was of no importance. How about steel, cement, aluminum, or even sand? It is all interconnected, there is no master resource in my view.
Dennis, you said: No single good has any special importance, not energy…
Sooo… energy is not especially important. And to back that statement up you say that air, water, and soil are also important. Well, okay Dennis, you win. Bye now.
Dennis,
How would we do without water, air, or soil? Not well I imagine. The point was really about value theory. Nowhere did I say energy was of no importance. How about steel, cement, aluminum, or even sand? It is all interconnected, there is no master resource in my view.
This is true, but everything you mentioned requires energy for its formation. I think the key to Rons argument is all things being pretty much equal fossil fuels where the key to our increase in life standards, medicine, the explosion of our population and our ability to exploit and make the resources you mentioned.
I personally think fossil fuels are extremely special and a master resource. Without them humans would be either living in caves or a primitive agrarian society. For example without an industrial society, our taste buds would have never experienced a big mac or complex artificial sugars found in sodas and lollies, beethovens music would never be heard or Kants philosophy ever read, or quantum mechanics proving Einstein wrong. None of these things i think would be possible without fossil fuels.
Iron Mike,
I do not agree, that fossil fuels were the key, just a piece of the puzzle, scientific advances were also important. In fact an argument could be made that fossil fuel has done more harm than good, had these resources been unavailable perhaps other forms of energy that were less environmentally damaging might have been developed more quickly and human population might not have grown as rapidly as we have seen for the past 200 years. Impossible to know as we cannot rewrite history.
Maybe rather than being a key for development of civilization, fossil fuel might be viewed as the key to destroying the planet.
Not sure I agree that water air and fertile soil require fossil fuel, steel, cement, and aluminum perhaps, though steel was around long before oil and natural gas and before coal was used to a large degree as a fuel. It was not produced in the same quantities as today, mostly used for swords and knives before the industrial revolution.
I guess I just can imagine that things would have been very different without fossil fuel having become so dominant in society.
There has been both good and bad with the rapid economic growth that has come with the exploitation of fossil fuel. Does the good outweigh the bad? I would answer no. Is it possible that knowledge could have progressed without the use of fossil fuel, certainly there was quite a bit of knowledge that had been developed prior to 1870 when oil and natural gas started to be widely used.
It is of course impossible to know how things might have developed without the use of fossil fuel as history cannot be rewritten. In my mind energy and matter are both important, neither is very useful without the other.
Dennis,
The exponential growth in scientific advancement wouldn’t have been possible if humans used the time necessary to think instead of constantly occupied with hunting or plowing the fields all day. Time is necessary to think, to exploit and make resources and to come up with new things.
Time implies something/somebody else doing the hard parts of life for you so you can explore other avenues of living. It started with slavery. If industrial civilisation was a car, the engine is fossil fuels. Engine is the main component of a car. The other parts of a car are necessary, but the engine is where the magic happens. We can agree to disagree here.
Yes i agree one can argue that its detrimental. But i ask those people to put their money where their mouth is and completely cut out fossil fuels out of their life. Who will step up ?
We live in a complex world, usually something which is useful can also kill us. Like say a knife. Essentially everything has a price and given biological evolution there was only one path humans would ultimately take and that was to exploit fossil fuels. We like all other species are programmed to exploit and reproduce. That is our path of least resistance. It also happens to be our achilles heel, which will be perilous as biological evolution is slow, and we will likely breed and exploit ourselves into extinction. Well those who depend on industrial civilisation anyways.
I sometimes think the earth evolved humans to get out of the icehouse state it had fell into the last 40 million years or so. Humans have the potential to reawaken greenhouse earth, which has been the lions share of earths history if i am not mistaken.
This is fairly easy to prove. With unlimited or cheap energy, humans can supply themselves with water, and food. Does unlimited food imply more energy – no, not really. Except that well fed slaves can work for a little longer. Does unlimited or cheap water beget more food and energy? Not really, unless it’s behind a high elevation dam. Energy will buy you other goods. Other goods will not provide energy.
On a practical basis-
There are a few sources of energy production that are not directly due to combustion,
such as potatoes and other plant products that store energy from current years growth, animal and human labor,
nuclear, photovoltaic, wind and hydroelectric power.
But humans emerged from the animal world as a result of combustion and we should assume that As Goes Combustion So Goes Humanity.
By and large.
It remains a proof of concept that humanity can get by without combustion of the stored Sun energy storage products of coal, natural gases and oil,
at least in significant numbers.
We can and will get by for a long time on a mixed system of energy that includes a long fat tail of combustion along with all the others we can come up with (yes even corn ethanol which is a pitiful net energy producer).
I suspect that humans will burn just about everything that they can get their hands on.
I am also of the camp that believes that the numbers of humans will roughly match the trajectory of net energy available, with about a 10-20 year lag. There are other reasons human population could decline of course, but if not it will then come down to energy.
Got2surf,
That reminds me of the “assume a can opener ” joke. So to prove that energy is the master resource, we just need to assume we have an unlimited supply of energy.
Maybe sand is the master resource because there is so much silica on the planet, we can just build solar panels using the silica and we have all the energy we need.
I don’t think either argument is very convincing.
Information drives the world. Energy is ultimately only used to collect information. And current tech is extremely inefficient.
I recommend the book “The Touchstone of Life” for an interesting discussion of this.
Dennis –
Take a look at this estimate for decline rates:
“A projected range for average decline rate on post-peak production is 5-7%, equivalent to around 3-4.5mb/d of lost production every year.” Simon Michaux, 2019 Paper, Geological Survey of Finland
Current OPEC decline rate is ~8%, for a 5% decline, we could expect OPEC monthly decline of at least 0.1 mb/d…if Non-OPEC decline continues at similar levels then we can expect monthly decline of between 0.2 – 0.3 md/d.
Annually, that’s somewhere between 2.4 – 3.6 mb/d. That puts 2024 production between ~78-79 mb/d.
This works out to 3-5% annual decline…
From the comments section of Dr Morgan’s blog .
” It’s important to keep in mind the difference between depletion and decline with regard to oil fields. Any oil removed from a field adds to depletion and the annual depletion rate is the amount of oil removed per year divided by the remaining recoverable oil in the field.
The decline rate, if any, is just the rate at which oil removal declines from year to year. Extra infill drilling and enhanced oil recovery techniques can keep a field from having any decline at all, although a gradual decline usually starts at less than 50% field depletion.
My view is that governments and energy companies will do everything in their power to increase oil production or at least not let it decline, even as depletion continues apace. Like rust, depletion never sleeps. But this means that eventual production decline rates are likely to be much greater than expected, especially since 25% of world production comes from 25 fields and half of world production comes from a only a few hundred fields (out of 50,000-70,000 fields, depending on how they are separated for counting). When the giant and the super-giant fields near the end of their production plateaus (negative or very small decline rates), oil production will fall off a cliff. ”
This paper explains it all: https://royalsocietypublishing.org/doi/10.1098/rsta.2012.0448
Hole in head,
You should read the paper.
From Section 4d of the paper
Aleklett et al. [43] estimate that the typical regional depletion rates of RRRs are of the order of 2–5%
Let’s take the average which would be 3.5%, this happens to be the decline rate for my World model from 2043 to 2100.
Here is a link to the abstract of the paper referenced (43).
https://www.sciencedirect.com/science/article/abs/pii/S0301421509008519?via=ihub
Interestingly they projected C plus C output of 55 Mb/d in 2030, the paper is from 2010, even the IEA was projecting 75 Mb/d in 2030 which the authors though was much too optimistic. This was before tight oil was recognized as being important. Without any tight oil output, my model would have output at about 74 Mb/d in 2030.
Dennis , ” Hole in head,
You should read the paper. ”
If I do everything , then what will you do ? Just pulling your leg . 🙂
Kengeo,
Not all areas have decreasing production, the 5 to 7% decline rate is for those fields in decline. On OPEC decline, also that refers to those field with declining output and also assumes no further development in that field (the natural decline rate is the rate a field declines with no further development. From 2018 to 2022 OPEC output declined at about 2.9% per year (using OLS trend through annual output data) and this was mostly due to OPEC cuts due to a lack of demand for oil. The more important number is World output because OPEC tries to balance the World market and keep oil prices relatively stable, World average decline from 2018 to 2022 has been about 1.1% (if we drop 2020 and 2021 due to low demnd from pandemic the decline is about 0.7% per year). The low oil prices over this period (with the brief spike in 2022 due to War in Ukraine) show definitively this decline is due to lack of demand for oil rather than oil depletion.
Getting the facts is important . 1P or XP . Reserves or resources . Mike S on the subject .
https://www.oilystuffblog.com/forumstuff/forum-stuff/fish-in-a-lake?origin=notification
Hole in head,
A nice summary by Mike. I think Laherrere does a good job on this, his guess is around 3500 Gb for URR for world C plus C, mine is about 2600 to 2700 Gb, perhaps the reserve growth and discoveries will stop after 2022 (unlike what has happened for the past 152 years). Are reserve and resource estimates uncertain? The answer is so obvious I have never thought to even ask it.
Dennis,
Your model from start to finish of oil production, i don’t think it can be 2600-2700Gb URR. Can you show me how you are getting that result for URR including the chart please. Are you using AUC to calculate URR ?
Iron Mike,
Not sure what AUC is.
Spreadsheet with data at link below, model is 2600 Gb, 2700 Gb is a “high model with higher extraction rates” (not included here). Below is my current best guess model. The URR just adds up yearly production from 1870 to 2294.
https://peakoilbarrel.com/wp-content/uploads/2023/07/world-model.xls
Iron MIke,
Yes I use area under the curve (AUC) to find URR. Note that the model is not a Hubbert curve and the peak does not occur at 50% of URR. I have made some subtle changes in decline rates for the model after 2043, now the model declines at around 2.5% per year on average from 2030 to 2043 and from 2044 to 2100 the average rate of decline is about 3.5%. After 2100 the annual decline rate is assumed to be about 10.5% per year.
The model can easily be modified to a 3.1% annual decline rate from 2044 to 2294 by changing the rate that the extraction rate is assumed to decrease after 2044. This change increases URR to 2665 Gb from the earlier 2600 Gb estimate (all of the change is from 2100 to 2294 where the model is highly speculative in any case), cumulative output to 2100 is about 2580 Gb in either case.
Dennis,
Thanks for that. i will check your URR. For some reason it seems low to me. But i am probably mistaken.
Iron Mike,
In response to your questions about decline rates I have changed the scenario somewhat after 2040. Earlier I had more gradual decline up to about 2070 and then the decline rate steepened. This seemed artificial so I modified the scenario after 2040 so tht the decline rate was around 3.5% where earlier it had been about 2.7 or 2.8% (I can’t remember exactly). So perhaps you were assuming 2.7 % decline after 2040.Under that assumption (2.7% average annual decline rate from 2041 to 2294) the URR would be 2879 Gb. So my changing the decline rate in response to our conversation may have changed things. The decline rate from 2041 and later is around 3.6%, with cumulative production around 2570 Gb in 2100.
Dennis,
I checked and you are right i get a URR for your model of ~2600Gb.
With regards to the decline rate, i personally think 3.5% after 2040 is probably more realistic than your previous ~2.7%.
I think the world might be going through a transition phase economically speaking. We might be oscillating around the peak for a while yet before hitting terminal decline. I would change my view if the global economy was humming with world real GDP growth rate > ~ 3.5%. But anything below this will limit oil production, which can successfully hide geological peak oil.
Iron Mike – I thought the same but it’s because growth was pretty slow from 1985 to 2000 at ~1.6%, visually we want to see the growth rate = decline rate.
I think the decline rate is going to sneak up on us, and be quite significant.
US will likely lead the way with 5-10% decline rates.
Take Mexico as an example. After it’s peak in 2004 at 3.8 mb/d, production decline rate has been 4.5% thru 2019, where production stood at 1.9 mb/d. Plateau was essentially non-existent, maybe 2003-2005, but that’s likely a stretch. Reserves had peaked exactly 20 years earlier. Europe on the other hand peaked in 1999 at 7.06 mb/d, in 2019 production stood at 3.6 mb/d, a decline rate of 3.5%.
For a broad group of Africa, Asia, and CIS the peak was 2010 at 32.1 mb/d and only 1% decline rate. Middle East peaked in 2016 at 31.7 mb/d, this is the key data to observe, looking at 2022 (30.7 mb/d) their loss is only ~0.2 mb/d annually (0.6% annual decline). I suspect Middle East decline rate is actually closer to 2%, we will see…
Kengeo,
From 1910 to 1972 output increased at about 7% per year. From 1982 to 2016 output increased at about 1.2% per year. From 2016 to 2030 I expect relatively flat output, I doubt the decline will mirror the increase. Thanks for your comments, they help me to improve.
On decline being the same as growth, I think as output increased it was limited by how much demand there was Worldwide. On the way down we may eventually see steep decline if alternatives are found for most uses of oil, Laherrere typically has declines at about 3.5% not the 7% rate that was seen from 1910 to 1972, From 1910 to 2016 the rate of increase averaged about 5.25%.
Iron Mike,
I agree the 2.7% decline rate seemed low to me as well which is why I changed the model, perhaps at your suggestion (or I may have been convinced by a comment you made, the change was definitely a result of you making me think, which is appreciated)
Good job Dennis. Nobody has a more accurate projection, IMO.
(And all of the guys even get their cliff)
Hickory,
Thanks. The cliff starts in 2100 and this is later than the pessimists would prefer, a more realistic model might have URR at about 2665 with about 3.2% average decline from 2043 to 2294, probably not cliffy enough for many.
This older paper linked by Hole in head is very good (from 2014)
https://royalsocietypublishing.org/doi/10.1098/rsta.2012.0448
An excerpt from section 3e of the paper:
The extreme situation would be if all fields reached their maximum depletion rates simultaneously, in which case the regional value would also be at a maximum, although not the same numerical value. However, this is not likely to happen in reality as fields are usually at different stages of development at any given point in time. Larger regions, for example the world, will never develop uniformly and some subparts will be developed in the beginning, whereas others will remain undeveloped for a long time. Such patterns will give more temporally dispersed fields, yielding lower regional depletion rates.
I have said this myself on occasion, it is not my original idea. The dispersion in depletion rates will be highest for the World (the largest region) and we will see the lowest depletion rates for the World. Elsewhere the rate was estimated in the range of 2% to 5%, of course pessimists will say 5% must be the right estimate and optimists will choose 2%, the realist chooses the mean at 3.5%, in my view.
Again an excerpt from section 4d of the paper linked above:
Aleklett et al. [43] estimate that the typical regional depletion rates of RRRs are of the order of 2–5%, …
Note also for the World this might be closer to the low end (because it is the largest region) so a 3% estimate might be more realistic than 3.5%.
You are envisioning oil extraction until 2120? This will have ended well before due to the fact that the extraction will require more energy than the energy provided by the oil. By now, the energy needed to extract oil represents roughly one quarter of the energy provided by the extracted oil. By 2050, it will represent the same quantity.
In 2120 you will extract oil mainly for it’s chemical components – then energy matters as much as with iron ore.
Jean-Francois,
Not everything that is extracted is extracted only for its energy content and the net energy it provides, oil has many useful qualities its energy per unit volume is quite high and energy per unit mass is pretty good as well (though not as good as methane on a mass basis). If the cost to extract oil is lower than what people are willing to pay for the oil, then it is likely to be extracted. EROEI is not really a part of that decision making process, perhaps this will change by 2120, it is not clear what social changes will occur in the next 97 years.
Dennis. We have not to wait 2120. In Algeria, the authorities have decided to settle solar panels in the middle of nowhere in Sahara to feed in energy the extraction of natural gas instead of burning natural gas for this. The choice of energy to extract oil and natural gas begins being meaningfull.
bayrok
on June 19, 2023 at 7:30 pm said:
As an analogy, fracking rock for oil is the equivalent of mopping up spilled milk from the kitchen top, and then squeezing the drops into your breakfast cereal. Rinse, and repeat. 🙂
To the note immediately above, I don’t know who “bayrok” is, but his comment is silly. I seriously doubt that bayrok has any skin in the game, or has ever seen a shale well fracked.
No matter how one feels about fracking, it saved America’s economy. During the 2008 crash, it was the only industry that grew. Without the ten million barrels a day production, we’d be totally at the mercy of oil and gas producers who–as the late T. Boone Pickens famously said–“don’t much like us.”
I have mercilessly criticized the shale oil people for venting and flaring natural gas, which is wasteful and environmentally harmful, and totally unnecessary. I absolutely hate seeing methane gas plumes on the spectroscope, knowing that trillions of tons of fugitive gas have historically been hidden from sight and treated like ozone. That’s my personal peeve with fracking. But the concept of fracking? Brilliant!
The lesson that should be derived from fracking is that, as far as domestic production by America, this is the last hurrah. There’s still a lot of shale oil that will be produced, and proportionately a great deal more shale gas–but then that’s pretty much it. The angry bashers of shale oil and gas need to step back and ponder where America would be today if not for the fracking.
Vulnerable. Like Europe. Probably where bayrok lives.
Gerry,
Thanks. Some of your comments in the past seemed to indicate you had concerns beyond methane flaring and venting such as PFAS chemicals in fracking fluids, water disposal, etc.
I agree with those concerns, though perhaps I misunderstood.
I also agree with Mike that exporting out oil and natural gas outside of North America is a bad idea, though the realist position is that this is likely to continue imho.
If you don’t export oil and gas, where will you put it?
We had a good storage of oil in the Strategic Petroleum Reserve, and the president emptied it. So we could refill that–it’d take all of a month–but then what? Besides, we’d be better off getting heavy sour to refill the SPR.
At this point, we have a robust shale oil and gas business. Stop exports and it’s going to build up and clog the system pretty damn fast. I’m afraid that Jeannie is out of the bottle.
What if you extract less?
rgds
WP
Gunga, or whatever your name is, I would say to you and about 1.5% of the American population fortunate enough to have minerals under unconventional oil and gas, and having made close to $680 billion dollars of free money in the past 25 years… get a job. Pour concrete, wait tables, clean hotel rooms; I know, learn to be an insurance salesman. Not very many people are as fortunate as you are. Lots of Americans don’t have royalty and struggle to make ends meet, working.
If one is a first or second generation successor to mineral interest hanging on to grandads commitment to the land, you’ve had a good run. Feel privileged. If one is a great grandkid, or overriding royalty interest owner who wiggled their way into all this free money by putting deals together in Martin County, get a job. America should keep American oil and gas IN American and if that means royalty owners make half of they’re making now, tough shit, get a job.
I know you’d like for me to keep my mouth shut and what, stop ranting about oil exports all together? I’m a threat. People are starting to listen. The deal in America is to shut people up if you don’t like what they say.
But let’s get one thing straight, my opposition to oil exports has nothing to do with climate change, liberal idealism, renewables or ending the US tight oil and gas phenomena thru nationalism. That’s really stupid. It’s about slowing down, preserving bottom hole pressure, increasing RR, not wasting gas, conserving groundwater. It’s about saving American oil. If you’ve got a problem with THAT, swim the river to Mexico; they’ll send your checks down there too.
MY message…America first.
Yours, I take it, is DRAIN America first. The only argument you and millions of people like you can make is what YOU think is best for America NOW will always be best for America. You are dead wrong and you should NOT be given the ultimate control of our hydrocarbon future. No way.
Mike,
I agree with many of your points related to responsible production practices to reduce waste as much as possible, so no issue there. The prudent operator standard still is paramount…. but sometimes forgotten, I agree. I could also see wisdom at not exporting…. but not at the cost of cutting American production… too many unintended consequences would occur…
My point on continuing to produce (responsibly) vs. not producing to “save for the future” was that many people and institutions would have suffered. These are typically not rich people living off massive inherited minerals… these are the same folks you suggest should “get a job”…. waiters, housekeepers, salesman, I’ll even add yardmen… yes, my yardman and his brother get about $300 each per month from royalty off their grandfather’s old small South Texas farm and it makes a big impact to their monthly budget. They also work hard at their day job and earn it. This is the typical sized mineral owner in the US. Yes, there are trust fund baby types in the mix too that give the mineral world a bad rap, but those are the far minority. Most mineral and royalty revenue goes to individuals that also work and contribute to society. This is truly America First in my opinion. We are unique to have private mineral ownership and it represents freedom at its finest. Your generalizations of the American mineral owner are way off in my opinion.
Also realize that many current mineral owners didn’t inherit interests, some just buy and trade on the private market…. After 10 years in Geology and the energy finance side….I started with nothing and built my own small royalty company from scratch taking a loan out against my crappy 1995 Suburban to make my first tiny buy at auction. 23 years later, most of it also working another day job, I am still at it and love it. It isn’t huge and took a lot of time and work to assemble, but it keeps the roof over my head for my family. I have never inherited anything.
Mike,
America first? America is each man for himself.
Gerry,
I believe the aim i to conserve the resources for the future by reducing tight oil output to the level that US and Canadian refineries can handle (I don’t think we export much oil to Mexico, perhaps their refineries were built to handle heavy grades of oil). I don’t think this is likely to happen, but certainly enforcing rules to eliminate flaring in Texas might reduce tight oil output to some degree. We could also stop approvals for new LNG export terminals so that natural gas exports don’t increase any further.
I doubt any of these things will happen, but I agree with Mr. Shellman that this would be a better policy. It was a mistake to reverse the crude oil export ban that had been in place for 40 years from 1975 to 2015, in my opinion.
I’m not espousing the wisdom of Mr. Obama’s lifting the exportation ban in 2015, Dennis, merely saying that ship has sailed. With one flourish of his pen, the president could have prevented the exportation of American oil and gas and most people expected him to do so, but he didn’t, and there is no way to back up history.
A reminder. On one side, pushing for lifting the ban were the people who ran companies with names like EOG and Pioneer. On the other side was just about everybody else. There was a big party in the shale basins that night, and it hasn’t stopped.
Exportation bans could be reenacted by Congress again, of course, but with a whole bunch of unintended consequences, the most prominent of which would be the almost immediate rise of the price of WTI to above $100/barrel. I don’t believe our incumbent president is quite ready for that.
America has always been terrible at energy policy. In 1981, when Reagan took office, there were controls in place because oil was at nosebleed $35 and the price of a gallon of Ethyl gasoline was $1.25-$1.50, depending on whether you were buying it in Texas or California. Reagan immediately decontrolled oil, and by 1986 the price of oil had fallen to just above ten bucks. There was a problem: ten bucks was very close to the cost of lifting for quite a few oil producers–we weren’t exactly Saudi Arabia.
I don’t know, if you were in charge of reversing course, how would you do it as the energy czar? Run a lottery? If you’re Pioneer and draw a high number you have to quit drilling out your leases, go broke? Mandate all the Occidentals, Chevrons, Exxons, Pioneers to cut back drilling by 20%–we’re saving the oil for our children?
Like I said, that ship has sailed. And whether he wants to own it or not, with Mr. Obama at the helm. For whatever reason, a brilliant Democrat president served as the greatest catalyst possible for the shale oil industry, with its methane venting and flaring and all the GHG that has been purposely spewed into the troposphere. I don’t mean this to be partisan, and I didn’t write my above notes to be provocative, but this is the history and you can’t make this stuff up!
That ship has NOT sailed, Gerry; energy policies in our country can be changed by electing politicians with forethought, courage, and the ability to think past next week…indeed for the future of our children.
Since when did Oxy, Pioneer, and Chevron become more important that our nation’s long energy energy future? Fuck THEM. That wanker at Exxon made $36MM last year in compensation. He’ll NEVER deliver on his promises from Eddy County, ever. He could care less.
Reduce exports. It’s easy. It does not require something as nefarious as a “lottery.” Put these tight oil assholes back on reasonable spacing between wells and distances between lease, unit lines. In the old days the TRRC set field rules for spacing based on GOR. In Texas, conservation of pressure, maximization of recovery rates, prevention of waste is the law. Those laws are broken now, by THREE (3) Texas Railroad Commissioners that have personally chosen the course for America’s oil future, two of which we know benefit from their decisions personally.
90% of the very last of our country’s oil resources will be stuck, immobile, never recovered from our country’s oil basin resource beds because money comes before reservoir management. 10% recovery rates of OIP…whoever is good with that is insane !
Don’t like that? Lets stop flaring and venting associated gas. Tomorrow. That’ll slow ’em down. Prevention of waste is in the Texas Natural Resource Code and part of our State’s Constitution.
Don’t like that? Where is the groundwater going to keep coming from to frac over 5,000 wells a year in arid West Texas and New Mexico? Stop that, tomorrow. Mandate 70% of produced water be recycled and re-used for frac source water, not the 20% the tight oil sector has been able to muster after 8 years. Do it ! It’s easy. The tight oil industry isn’t going to voluntarily do shit, for the nation, until it hurts their revenue.
5.0 MM BOPD. That is what American refineries can absorb in the way of tight oil. We can increase that to 6.5MM BOPD easily with some forethought and re-tooling of GC refineries. Spend the money on refinery upgrades, instead of oil export facilities.
Keep the rest in the ground, for our kids, yeah. For our nations LONG TERM energy security. We can go back and drill infill infill wells as WE need the oil…not the Netherlands, or South Korea.
America Needs America’s Oil. The future is not NOW, it’s in the future.
Mike, here we go again…. that’s noble that you want to keep USA shale in the ground for a future generation. But as discussed before… this is not practical and would never have been an option, so why debate,
The USA is blessed with millions of private mineral rights owners who benefit by oil and gas royalty payments. These folks need cash flow now in their hands. Foundations need cash flow in their hands… hospitals…colleges… charities… What would you say to them? Cut your budget to save oil in the ground?
It would never have happened in our free country and would likely have had net negative effects.
Drill now … full throttle.
Yep, when driving off a cliff it’s important to keep the accelerator pushed to the floor…some here think we will come crashing down …others think it will be an ET moment…maybe the truth is somewhere in between?
Rearranging the chairs on the Titanic is not the answer. The ship is going down. Let me say this so all you good oil men can understand. You need to keep your dick in your pants. Or, realize God gave you birth control and abortion shortly after the drill bit for a reason. Sooner or later your going to realize this is a demand issue and it’s last call with only the ugly girls waiting for a ride home. Your not doing the children of the future any favors with your current conversation. Your all just getting into bed with the lights off.
Gerry Maddoux,
As I imagine you are aware, changing the export ban required approval of both Houses of Congress before Obama signed the Bill. The Republicans were in control of both the Senate and House of Representatives in 2015, don’t blame this policy on Obama. I suppose he could have vetoed the bill, but it might have had the votes for an override. It passed 65-33 in Senate and 316-113 in House, also the bill was part of a Budget agreement that would have shut down the government if it had been vetoed in December 2015.
https://www.reuters.com/article/us-usa-fiscal-oil-idUSKBN0U121U20151219
As Mike implies who is elected has consequences. Interesting that in the Senate as many Senators opposed the bill as supported it, but it was part of a $1.8 trillion spending package that extended tax breaks for wind and solar along with ending crude export ban.
In my view the crude oil ban should be reinstated, tight oil producer will need to reduce output to accomodate the ban on crude oil exports.
Changing the export ban required approval of both Houses of Congress before Obama signed the Bill. The Republicans were in control of both the Senate and House of Representatives in 2015, don’t blame this policy on Obama.
Dennis, thanks for pointing this out. I agree 100%. It was a total bipartisan effort. However, if Obama had vetoed the bill, all those Republicans who sponsored and supported the bill would have raked him over the coals.
Mr Shellman,
Great comment. I agree 100% that what you outlined in your camment would be far better energy policy than current policy, unfortunately most people do not understand this as well as you do. You have my email address, I no longer have yours, contact me if you have a chance.
Ron,
Thanks. On rereading my comment I meant to say as many Republican Senators opposed the bill as supported it with more Democrats in support than opposed, this is likely because the Democrats don’t like to shut down the Government, that’s a Republican tactic (at least since 1995).
Also judging by the vote totals on the original bill there likely would have been enough votes to override any veto. In addition it was one of those situations where the Republicans were playing hardball and threatening to shut down the government, a veto would have led to a government shutdown and would not have been a good look for a President, plus an override might have been possible in any case.
Democrats for an extension of Wind and Solar tax credits in exchange for allowing the crude oil exports which was supported by some Democrats and most Republicans. Actual opinion is a little hard to gauge because it was not a stand alone bill it was part of a huge 1.8 trillion budget reconciliation bill.
Gungalonga,
It was US policy in this “free” country for 40 years, there are limits on freedom in order to protect our security. Less tight oil produced might have led to higher oil prices and higher royalty and tax payments. The RRC has regulated oil output in Texas since 1919.
Nationalism
Da Do Ron Ron, Da Do Ron Ron
Loyalty and devotion to a nation
Da Do Ron Ron, Da Do Ron Ron
The belief that your own country is better than all others
Da Do Ron Ron, Da Do Ron Ron
Responsible for pushing countries to expand their influence in Europe
Da Do Ron Ron, Da Do Ron Ron
Leads to conflict with others
Da Do Ron Ron, Da Do Ron Ron
HB, this post is over the top. Please do not post such nonsensual bullshit again. Sarcastic cynicism is not an appropriate subject for this blog.
Well Ron I’m sorry for you that my sense of humor went right over your head. “Da Do Ron Ron” had nothing to do with you and I wasn’t thinking about you either. Did you Google it ? I don’t think so. There’s nothing negative about it.
“The title “Da Doo Ron Ron” was initially just nonsense syllables used as dummy line to separate each stanza and chorus until proper lyrics could be written, but Spector liked it so much that he kept it. Phil Spector did not want lyrics that were too cerebral and would interfere with a simple boy-meets-girl story line.
On June 8, 1963, it reached number three on the Billboard Hot 100,[5] and on June 22, 1963″
https://en.wikipedia.org/wiki/Da_Doo_Ron_Ron#:~:text=The title “Da Doo Ron,-meets-girl story line.
Listen to the song. It can’t help but to improve any ones spirits –
https://www.youtube.com/watch?v=v-qqi7-Q19k
Da Do Ron Ron was simply the choirs for the short and simple message I was sending about the road to nationalism in is tread. The United States has been burning other countries oil resources for what ? The last 70 years. And now when Western Europe is facing tyranny on it’s boarders and Russian petro dollars are financing the worst war on European soil since 1945. There are those here who feel we should save our last drops of oil so their kids and others today can drive oversized trucks down the highway at 80mph. When it comes to conservation the future is now.
During World War II America rationed gasoline. If anyone was serious about the future of their children and America. They would be all in on conservation and sustainability. Saving a few barrels of shale for later is meaningless if you don’t address demand.
Dennis down stream- “Only about 3.5 Mb/d would be removed from the World market (that is roughly the average annual rate that the US exports crude oil), OPEC would increase output to fill some of the gap and prices might rise to $90 to $100/bo”
First of all, I would like to know what Dennis is smoking in his cigar and he knows I usually mostly agree with him but not this time. Pulling 3.5 mbd off the world market and expecting $90 to $100 is, I won’t say it and let you decide. Do you remember 2008? The world was running a lot less than 3.5 mbd short then. What’s the difference between now and 2008 ? That’s right, shale and 15 years of depletion.
Do I need to finish the rest of the choirs ?
Thus far the US tight oil phenomena produced a little south of 11G BO. By the end of the decade the US will likely have exported close to 12G BO, about two full years of total US consumption. Two years buys a lot of time. When we learn to use LTO better we buy more time.
Berman is quoted as saying that tight oil exports to foreign countries, mostly because of its quality and lightness, saves the US consumer about 8 cent a gallon at the pump… so pay now, or pay later. $3.50 now or upwards of $5 or more later, depends on what OPEC wants to charge us.
The SPR is at a 45 year low and other inventories are also low; we’re headed for $80 anyway. Demand IS going down. Reducing exports increases REAL energy security in our country, not the fake kind the API infers by sending oil to say, the Netherlands.
Reduce exports and D&C costs go down, the tight oil sector becomes healthier and more sustainable, can stand on its own financial feet without debt, and will provide better returns for investors. Royalty owners make MORE money in the long run.
Increase spacing between wells and recovery rates of oil in place likely go up, adding long term reserves to America. 10% RR is a crime.
Reducing exports WILL stop the waste of natural gas, and groundwater. The drilling and completion labor force moves to production, or further downstream; injecting gas to maintain pressure further increases recovery rates of OIP. Ultimately no jobs are lost. At the rate the US is draining itself, for exports, D&C folks are going to lose their jobs anyway.
What folks that don’t know anything about oil and gas production don’t realize is reducing exports has GOT to be occur anyway. The Permian Basin is going to literally explode with produced water, and way sooner than folks think. There is no more places to stuff the stuff.
Always ask the US oil export advocate how they benefit from exports on a personal level. You won’t be surprised.
Safe now or sorry later.
Mike,
Thanks, great comment, again I agree 100%.
Total global liquids production is now breaking any previous high.
https://www.opec.org/opec_web/static_files_project/media/downloads/publications/MOMR%20May%202019.pdf
https://www.opec.org/opec_web/static_files_project/media/downloads/publications/OPEC_MOMR_January-2023.pdf
OPEC has been cutting production because the demand has not yet fully recovered due to COVID.
However China and India are seeing good recovery and next year global oil production will hit new highs.
2019 2020 and 2021 will be seen to be just another dip like so many in the past.
https://ourfiniteworld.com/2010/12/16/world-oil-production/
HI, Just a guess. When Trump/Biden created to much money most things doubled in price. So a 80 dollar barrel oil is really 40 in old money. As a result people spent more..oil… consumed… not that there is more… The SPR is down and not being refilled… OPEC is probably at 2P spent oil consumption… last 10% is tough to get but could be done. Rest are all following suit. That is typically a peak before a fall, in that no more peaks are coming.
For that to happen there would have to be significant growth from current levels for the following countries areas (>3 mb/d combined):
-US (2019 was 13 mb/d; now is ~12.5)
-Russia (2019 was ~11 mb/d; <10 now)
-Africa (2019 was 6 mb/d; now is ~5)
Does anyone here believe that all 3 of these large areas will see combined growth of more than 10% by next year? I would bet that Africa will actually fall, US will be same or even slightly lower, and Russia will be same or slightly lower, so not sure what your assessment is based on….
Kengeo
There were people like you on The Oil Drum saying the same thing 15 years ago.
You need to read up about every oil producing country to have a reasonable idea of what will happen.
https://www.spglobal.com/commodityinsights/en/ci/research-analysis/2023-annual-canadian-oil-sands-production-outlook-the-canadian.html
https://www.offshore-energy.biz/turning-brazil-into-worlds-fourth-largest-oil-producer-with-new-hydrocarbon-exploration-programme/
https://www.ecooilandgas.com/namibia-sees-11-billion-barrels-in-offshore-oil-reserves/
https://www.iea.org/reports/iraqs-energy-sector-a-roadmap-to-a-brighter-future
https://www.barrons.com/articles/saudi-arabia-aramco-stocks-oil-capital-spending-7f73052c
AT the moment OPEC spare capacity stands at 3 million barrels per day.
https://www.energyintel.com/00000183-ce06-d7b9-a5a7-cf5f197a0000
What is your assessment based on? Wishful thinking doesn’t do the job!
Kengeo
It is based on reading expert analysis by people who drill for oil for a living.
I know a few do you?
Although a somewhat trivial matter, perhaps, Vietnam just received its first LNG shipment this week … a harbinger of an absolutely staggering build out of LNG import infrastructure to feed its humongous build out of CCGT plant needs.
(At ~16,000 Megawatt capacity, these new, world class power plants will appromoxinate the current, total electricity usage of New England.)
Countries such as Brazil, Vietnam, several smaller west African nations, island states around the world, as well as India and China continue to track a course for ever-increasing use of natgas – frequently in the form of LNG – to supply their populations’ growing needs.
As I noted in my above comment, expanding one’s perspective beyond sources such as Ars Technica, Resilience, DeSmog Blog, et al, may provide a far different – certainly broader – worldview than one may otherwise embrace.
I think it is to Mr. Patterson’s and Dennis’ credit that this site still offers a (mostly) open forum by which non ‘party’ views may be aired, and I thank you both for that.
Coffeeguyzz
Sounds like I am wasting my time putting these posts up. 😁😁😁
Ovi,
Credit should go to you for writing wonderful posts, just an oversight by Coffeeguyzz, this site would not be very good without your posts (which are much better than mine).
Thank you.
Dennis
Thanks. Funny. I think your posts are better than mine. I really appreciate you 5 to 10 year projections. That is quite a feat. Unfortunately there are a few that don’t appreciate the value of your models. While you say many times they will be wrong, and maybe they might be. What is unsaid is the level of the wrongness. If they are out by 10%, I would rate them as bang on.
Ovi,
I did not mean to slight your excellent contributions in any way.
I mentioned Mr. Patterson and Dennis in the context that it is ‘their’ site with the ability to ban/delete comments and posters as has happened occasionally over the years.
Info such as that which you put forth, along with others (Island Boy used to regularly post on US power generation), helps the cyber community to become better informed, despite varying views on different topics.
I guess POB has been up and running for about a decade now, which is quite an accomplishment in itself.
Pkease keep up your good work.
Coffeeguyzz
Got it. I also appreciate your contributions and comments.
Thanks Ovi,
I am not confident they will be within 10% for the future real numbers, certainly after 2030 the models are not going to be close, within 50% if I make a lucky guess. You are too humble, your posts are definitely better.
Yes, for those who can afford it: US & Middle East (>80% producers)
Vietnam is not on that list…and you will also find a great many countries not on that list:
Asia
Africa
Europe
Mexico
Syria
Most Central/South America
But hopefully US can shift to NGLs and use less oil, that’s an only option….
Rig and Frac report for week ending July 14.
US Hz oil rigs were down 2 to 487.
Big loser was Texas and NM gained.
Texas was down 7 and NM rigs increased by 3 to 100. Overall Permian rigs were down 4 with Texas Permian down 7 and NM up 3
NG Hz rigs were down 3 to 119.
It looks like the trend has reverted to what started in November with about one or two rigs lost per week, which is probably reflecting a depleting quantity of undeveloped well sites. The extra 40 lost in May was a response to the March price drop.
George
If the May price drop caused the Rig count to drop, will increasing WTI price result in more rigs? While depleting quantity of land is an issue, I still think that management decisions on how to deploy its cash is having an impact on rigs and fracs and my sense is that a new equilibrium will establish itself around 500 rigs and 275 fracs per week, even if WTI increases beyond $80/b
Without real data it’s all a bit of a guess but I’d say most of the decline, and all of the May dip, has come from smaller private companies. These would have been less profligate with other peoples money or have been driven by a growth at all costs philosophy based on company officer bonuses, so wouldn’t have had much to change as lending tightened. Larger public E&Ps tend to set drilling campaigns annually and quarterly and then stick to them. The small private E&Ps aree unlikely to have large spare acreage and likely would have divested some rather than buying any in the Covid months, so I think it’s a good bet that they would run short of attractive drill sites first. It takes a lot longer to add rigs, which tends to happen as a ramp, compared to dropping them, which can be fairly precipitous (compare hiring new staff with sacking them). Companies will need to see a significantly higher price (at least $80, maybe more, especially if the capital cost index inflation is sustained) and I think they’d want to see a high price to be maintained for some time and for rumours of a possible recession to be fully banished before they start looking for available rigs and placing contracts.
Fracs were up 3 to 263.
Fracs seem to be stabilizing in the range of 250 to 275. I have to wonder if the Texas heat has something to do with the reduced level of drilling and fracing activity.
The heat has nothing to do with anything, Ovi. We’re from Texas.
Why must it be so hard to believe that stuff is slowing down in the Permian because D&C costs are still high, economics suck (all 2Q Q’s I’ve seen have <$1.20 realized natgas prices), these guys are scared of running out of primo locations and wells are not as productive as they were?
Why else at $75 oil? Five rigs in the Permian when to the barn last week. Since when has THAT price become not high enough for tight oil? It was growing like a house a fire at $50. Whatzup?
Respectfully, why do people always look for reasons other than reality?
What is going to occur to change this picture next year, in 2024? Higher oil prices, or higher natgas prices? D&C costs down 40% to where they were 2020? Cheaper, more abundant labor? Higher well productivity from better frac's? Tier 3 and 4 wells on the flanks going to be as good as 1 & 2 in the sweet spots? Water costs (approaching 90% WOR in the Delaware) going lower? More places to inject the stuff? More groundwater to frac with? Is Wall Street going to have a big 'ol fat, I forgive you moment and want to reconcile the marriage?
Man, what's happening is just the start. There is nothing to analyse here…it's just another (big) oil field starting to poop out.
Mike
I just raised the question. 115 F is hot and must make for difficult working conditions.
My last post on US oil production had a special section on key counties in the Permian that showed that many of them were close to peaking or heading into a plateau. That post more closely reflects what I believe is happening in the Permian.
I remember Rockman (who used to post on the Oil Drum….I wish he would post here)
Saying to look at the Austin Chalk to see where US Shale is heading.
Austin Chalk Tight Oil Output
Good point Dennis!
US L48 excluding GOM, EIA data, past 24 months the annual rate of increase about 674 kb/d.
Dennis (or anyone else interested) –
Can you confirm the following info for Global Oil Supply/Reserves (looking at Rystad and production data from 2023 Statistical Review):
Under 1P, peak or middle-point (P/MP) year would have been 2004 (URR of ~2,000 Gb).
Under 2P, P/MP of 2007 (URR of ~2,200 Gb).
Observable peak was in 2019 (95 mb/d), implying a URR of ~2,800 Gb.
2PC M/MP for 2020 at ~2,850 Gb.
2022 production was 93.8 mb/d (below previous peak).
A future 2PCX M/MP would occur 2025 at a URR of ~3,150 Gb.
D. Coyne Shock model has production peaking near 2028 with a URR ~2,850 Gb (same as 2PC but peak delayed ~8 years / or 8 year plateau).
A max URR for all crude types of 3,500 Gb would occur roughly around 2032.
I’m trying to figure out how production wouldn’t keep falling and I can’t seem to do so…
Kengeo,
My shock model has two parts, a conventional oil model and an unconventional oil model. The conventional model has a URR of 2500 Gb with peak in 2016 at 1273 cumulative output (51% of URR). The unconventional model has a URR of 168 Gb and the unconventional oil peak is in 2029 at cumualtive output of 82 Gb (49% of URR). Overall crude plus condensate output peaks in 2028 when the two models are combined, but the timing of the two models is very different. At peak in 2028 cumulative output is 1655 Gb, which is 62% of URR, this simply because the conventional and unconventional peaks do not coincide. The reason that output is not decreasing is that unconventional output is rising faster than the decline in conventional output. This I expect to continue until 2028.
My Model gets to 1575 Gb cumulative output in 2026, but a lower output model as you propose would reach this level later. My model reaches 1750 Gb cumulative C plus C output in 2032, but my expectation is the the URR won’t be 3500 Gb.
My model URR is 2670 Gb, 50% of that is 1335 Gb which occurred back in 2018.
Conventional and unconventional oil models, both scales in millions of barrels per day
$ 1 trillion extra paid by Europe for gas due to sanctions and war . Cutting the nose to spite the face .
https://www.energyflux.news/p/europes-pyrrhic-gas-victory
That’s the price of the war that Putin is carrying out against us. His war again Ukraine is also a war against Europe as he is seeing Europe as a threat for his influence on the neighbours of Russia. He’s at war against the rule of law, the social protection, the democracy, the education, the health system and the ecology that benefit to the economies, which make Europe attractive to the neighbours of Russia and which are an example that could threaten his own regime. That was the sense of his war against Georgia and now against Ukraine.
JFF , wakeup . The dog ate my homework . 🙂
https://karlof1.substack.com/p/the-eu-is-broke-ukraine-ate-its-budget
Libya’s second largest field goes off line . 500000 bpd stopped .
https://www.bloomberg.com/news/articles/2023-07-14/libya-s-second-largest-oil-field-is-fully-halted-by-protesters#xj4y7vzkg
Art Berman .
Tengizchevroil (TCO) produces about a third of Kazakhstan,s oil. It operates two fields, Tengiz and Korolevskoye, which are deep and quite complex, and is 50 % owned by Chevron and 25% by ExxonMobil. Chevron reports TCO reserves separately. It looks like peak production was in 2019. Oil production and reserves are now in decline. Cumulative revisions and adjustments have been flat for about eight years, implying that there are no probable reserves left, and there have been no recent discoveries of significance. Undeveloped reserves account for most of the drop in total numbers and it looks like these will run out in about four years (i.e. the last in-fill well).
All this points to the fields being in the later life cycle stages and decline might be expected to accelerate now, although gas injection is being used to maintain production (meaning when it does come final decline might be fast).
Most of the other Kazak oil comes from Kashagan operated by western E&Ps through ExxonMobil Kazakhstan Ventures, but it is not so easy to get separate data for that because ExxonMobil reports all Asia and Australia combined together. With most production coming from only two developments that have not been very reliable the numbers are quite noisy month to month and it is better to look at annual averages, which show that Kazakhstan probably peaked at the same time as TCO and will now be in decline. This may be reported as part of OPEC+ cuts but I don’t think any voluntary choking is happening, the operating companies just calculate the expected decline to the next OPEC meeting and that is declared as a cut. Oman, Gabon etc. are probably doing the same.
Kashgan = cash gone . 😉
And total:
George
The STEO sees production dropping to 1,699 kb/d in August and then recovering at year end 23. In 2024 production stays close to the 1,850 kb/d level. I guess that the August drop must be maintenance related.
I’ve only really looked at STEO wrt the GoM but on that evidence it appears to be completely worthless.
I read through all the above. This is really back to the future. Hubbert’s peak. And just like before, when Mr. Hubbert placed his extrapolations first on the blackboard of a boardroom, then on a projector slide, there were many naysayers and even a hierarchy that tried to silence him. After Mr. Hubbert died, the late Matt Simmons tried to get the message out. He was actually much more successful–mainly because he was a charismatic man who was not beholden to superiors. What is happening now is eerily familiar, except the curves and graphs are better, and the oil and gas industry now has an awful reputation, much of it from the self-inflicted wound of carelessness and arrogance. Prolonged flaring/venting of methane gas. Trucking tainted water to pump into a hole in the ground far from where it was tainted. Even fracking with chemicals that never degrade, in a limestone karst, mind you, close to the Ogalalla reservoir.
Back when Mr. Hubbert made his prognostications, there were close to 2,000 drilling rigs working in the U.S. Today there are a quarter of that number. Back then it was hit or miss. Today when a drill bit bites into the caliche in the shale field, you have close to absolute certainty of “striking oil.” With multiple benches and thick shale, this thing went crazy. And it’s not going to stop until it is impossible to make it pencil out to BE. No lesser personage than Warren Buffett has bought into it; he may well wind up with Berkshire Hathaway owning Occidental outright. An amazing number of people invest in his shadow. The whole show is propped up by oil and gas exportation; without it, there would be no frenzy. Without exports, there would be–by necessity, mind you–a more studied spacing profile, better water management, a reason to abide by the vent/flare rules of 24 hours/10 days. Exportation is the Big Money play.
IOW, exports are now built into the system. All sorts of overpaid geniuses are reassuring a mostly pissed-off administration that we have oil aplenty for future generations. I was listening to an hourlong podcast yesterday in which a well-respected money manager assured us all that Crane County Texas was still chock full of oil and the Permian Royalty Trust was the place to put your money. Hell, Mr. Biden doesn’t know! What he does know–what every Democrat knows–is that Mr. Obama made a mistake in 2015. He thought he was getting a quid pro quo, that the deal would put a damper on the flaring. Instead, he inadvertently put a match to the fuse. The permian was ready to explode and it did. Exports did this, not you.
The Permian shale boom will obviously end with an abundance of NG. In a just world, all this NG would replace world coal–a tradeoff that would cut emissions a great deal. That transition is being tacitly fought–oddly enough–by the world community, which mostly despises American oil and gas (think UK, Germany, not to mention China). I don’t think any American candidate for president has a thorough-enough understanding of oil and gas to “do the right thing.” And American presidents have a long tradition of doing something with oil and gas that produces unintended consequences: I give you Reagan in 1981, Geo W in 2001, Obama in 2015.
This will have to end on its own. In a massive belch of gas. And then a trickle. And the alarm bell will go off.
I’d love to see the crude oil ban go back on.
But you’re the economist. What would be your best guess on the price of oil if 8 million barrels per day were removed from the world market? $150? $200?
What do you reckon that would do to the world economic situation?
And then there’s this: You could either tell 2/3rds of the shale operators to cease and desist, or command everyone to go at 1/3rd speed. There is a third possibility: store 8 million barrels a day somewhere in a salt mine.
Gerry,
Only about 3.5 Mb/d would be removed from the World market (that is roughly the average annual rate that the US exports crude oil), OPEC would increase output to fill some of the gap and prices might rise to $90 to $100/bo which would encourage development of resources elsewhere. The World could handle oil prices up to $135/bo, perhaps more as the World economy is larger today than in 2014 when we last saw such high prices consistently. Today the World uses less oil per unit of GDP so and the World might respond to high oil prices with faster uptake of EVs. Difficult to predict how it would play out, but the World would manage in my view.
As Mike suggested refineries might choose to retool to refine more tight oil as tight oil might be cheaper than imports. The market would determine what tight oil producers would do, many would slow their completion rates to reduce output. I did a scenario showing how this might look if an export ban had been put in place in April 2023. The scenario assumes that by 2040 prices start to fall as the World transitions to electric transport and completion rates in the tight oil plays fall as a result.
Your model is interesting, Dennis, but I doubt that it reflects the reality of how the world would react.
And if you count all petroleum products, the export is closer to 10 million barrels. What happens to that?
And it’s pretty hard to ban oil without banning NG. The Permian Basin pipelines are full and they’re building hundreds of miles more. It’s hard to get the oil out without moving the gas. So that bankrupts the LNG companies.
I mean, come on, ya’ll!
A ban might happen after Warren Buffett is gone, but he keeps buying chunks of Occidental, and I doubt he’d do that if he thought Occidental was going to have to “slow their completion rates to reduce output.” If Occidental slows completion rates, they go as insolvent as the Silicon Valley Bank and out the window goes about $40B of Warren’s money.
Look, this isn’t going to happen, I don’t care how many models and scenarios you come up with. No president in his right mind is going to take the chance on being the person who gave the country $200 oil.
I enjoy reading Mike Shellman’s comments, and yours too, but I tell you that from God’s mouth to Joe Biden’s ears, there is enough oil in the Permian Basin to last the world for a hundred years. Hell, I heard it just yesterday. Crane County. Permian Royalty Trust.
Gerry,
I agree that the scenario I presented is highly unlikely, it is what could happen if crude exports are banned. Note that the proposal to to ban only crude oil exports from North America (or I think that is Mr. Shellman’s proposal, he can correct me) so it would only take about 3.5 Mb/d off of the World crude oil market. From 1975 to 2015 there was not a ban on petroleum product exports on on crude oil exports. As far as the natural gas exports, those could come from the Marcellus and Utica basins. It would not be a bad idea to slow those exports down as well or at least stop them from increasing any further.
Update on SLB’s Russia Operations
Published: 07/14/2023
SLB today announced that it is halting shipments of products and technology into Russia from all SLB facilities worldwide in response to the continued expansion of international sanctions. This follows SLB’s previous ban on shipments from the United States, United Kingdom, the European Union and Canada into Russia.
How long before this begins to affect Russian production?
https://www.slb.com/resource-library/updates/2023/update-on-slbs-russia-operations
Russian March C+C production was down 300K barrels per day below February. I don’t know how they have fared in the intervening months, but there was some decline due to maintenance. However, I think the drop in exports they are talking about below was due to a drop in production. Russia’s old brownfields have been declining for years, but massive infill drilling has made up for some of that decline. New Arctic fields have made up for the rest. But now I think the irreversible decline has finally set in.
Russian Oil Flows Show First Signs of Drop Months After Cuts Vow
July 11, 2023 Flows of Russian crude are starting to show signs of falling, more than four months after the country was due to slash production.
Crude shipments through Russia’s western ports in the four weeks to July 9 dropped substantially below their average February level for the first time, after volumes surged during the intervening months, according to vessel tracking data monitored by Bloomberg and corroborated by other data sources.
Nationwide seaborne crude flows fell to 2.86 million barrels a day in the week to July 9. That was a little more than 1 million barrels a day lower than the previous week, with 80% of the drop coming from ports in western Russia. Moscow has said previously that lower flows resulting from its output cut would be targeted at ports on the Baltic and Black Sea. There was no obvious sign of maintenance at Russian ports like that which led to the big drop seen two weeks ago.
60% of Russian production comes from its West Siberian brownfields. That is where Russia’s western ports get their oil.
Ron
An hour after I posted the story I realized I hadn’t put in the link. I went back and added it.
Regardless, thanks.
Ovi, here is the link to your SLB story. SLB was formerly known as Schlumberger. They are the world’s largest oilfield service company.
SLB halts all shipments of products and technology into Russia
Oilfield services company SLB announced on July 14 that it will immediately stop all shipments of its products and technology from its facilities worldwide.
The company said the ban is a response to growing international sanctions against Russia. Previously, SLB only restricted shipments of its products from the U.S., U.K., Canada, and the EU into Russia.
SLB, previously known as Schlumberger, is the world’s largest offshore drilling company. It continued to operate in Russia after the full-scale invasion of Ukraine in 2022, even as other oil giants left the country.
SLB faced criticism for continuing to work in the Russian oil sector even as Russian oil profits funded Putin’s war in Ukraine. The $28 billion company was labeled an “international sponsor of war.”
I wouldn’t worry too much about SLB . There are several players in the black market who will be willing to offer their services . Expensive maybe . Tankers upon tankers of physical oil are moving around the world . A small hiccup .
HiH, you don’t understand what it was that SLB provided. They provided technology and parts that only another service provider could provide. Only Baker Hughes, Halliburton, or SLB could provide those things. Where will they now get drill bits? Perhaps they will now find another provider, but it won’t be easy. Yes, they will find other sources, but they will sorely miss SLB.
Ron , I know what is SLB ‘s business and the services they provide . Tell me what you want and I will get it for you . I use to ship auto and tractor parts from India to Pakistan when all trade between the two countries was banned in 80’s and 90’s via Dubai . There is a black market and a price to pay . You will get the product you want . Heck , Iran got it’s entire nuclear program thru the black market and you are talking about drilling bits . We have millions of barrels being sold with false paperwork and ghost tankers 24/7/365 . Drill bits etc are kids game . Been there done that . SLB is doing ” virtue signaling ” and nothing more .
HiH, are you telling us that sanctions have no effect whatsoever? Do you say they are just “virtue signaling” and nothing more? Does the fact that all US oilfield service companies have now pulled out of Russia mean nothing? Is that it?
Ron . ” but they will sorely miss SLB. ” I am saying they won’t . As I mentioned in my post ” A small hiccup ” . No more , no less .
HiH, that’s all well and good, but you failed to answer my question. But let me rephrase it. If SLB pulling out is only a small hiccup, then was the other two oil service companies, Baker Hughes and Halliburton, pulling out also a small hiccup? Russia paid these guys billions of dollars a year, and they meant almost nothing to them? Is that the case? Three small hiccups were paid many billions of dollars per year each were worth almost nothing? Do you really believe Russians were that dumb?
My point is, and it is my only point, SLB was worth one hell of a lot more to the Russian oil business than you think they were.
Ron,
I think you are correct, the effect will be larger than Hole in Head imagines. His point, I believe is that Russia will find a way to hire the experts needed to replace the services provided by these large oilfield service companies, so the effect may be smaller than you think. Personally I don’t know the oil business well enough to guess.
Dennis, we will know when we get the results of Russian production for early 2024. I predict Russian production will not rise when the price rises enough for Saudi to start producing flat out again.
In other words, I think the third and fourth quarter 2023 Russian decline is due primarily due to sanctions. Well, that plus natural decline.
Dennis/Ron/HIH
There are two sides to the SLB cut. How many Non-Western companies have the expertise of SLB. Companies like SLB know how to characterize a field using their specialized blasting and recording equipment. Difficult to replace. They also supply drilling equipment parts and repair. Parts can be rerouted.
Knowing where to drill may be the more critical issue.
I have a couple of 8 1/2″ PDC drill bits at home. Reconditioned. Had only drilled a couple of hundred metres of soft stuff. From when I used to drill oil wells.
Even bigger Russian cuts may be coming.
Exclusive: Russia sets plans for oil export cuts in August, sources say
MOSCOW, July 14 (Reuters) – Russian oil exports from western ports are set to fall by some 100,000-200,000 barrels per day next month from July levels, a sign Moscow is making good on its pledge for fresh supply cuts in tandem with OPEC leader Saudi Arabia, two sources said on Friday, citing export plans.
OPEC and major producers, including Russia, together known as OPEC+, have been cutting supply since November to support prices. Moscow this month pledged to cut exports by 500,000 bpd in August, while Saudi Arabia extended its 1 million bpd output cuts.
As Russia did not reveal the baseline for its cut, analysts and traders had said it would be difficult to monitor. But according to trading sources and Refinitiv Eikon data, the August cuts will deepen export reductions between May and July that already total 500,000 barrels per day.
July oil loadings from western ports, such as Primorsk and Ust-Luga in the Baltic Sea and Novorossiisk in the Black Sea, are set to fall to 1.9 million bpd this month compared to 2.3 million bpd in June and 2.4 million bpd in May.
If exports fell by 500,000 barrels per day for May, June, and July, then they had to be cutting production as well. Where would they store that much oil if they produced it but did not export it?
Did anyone predict peak oil in 2018? Yes, Charles Maxwell did using the simplest of predictive methods.
“The peak of production usually comes sometime between 30 and 50 years after the peak of finding oil.”
“Now the question remains in front of us, has the world peaked in its level of discovery and if so, how long will it take the world, if it has peaked, to reach the peak of oil output? I believe that the peak of discovery fell in the five-year interval between 1965 and 1970. So if you took it at, say, 1968, and then you added 50 years, you would get to 2018.”
https://www.forbes.com/2010/09/13/suncor-energy-oil-intelligent-investing-cenovus.html?sh=6ef4b3341414
And he predicted it in 2010, eight years before it happened.
Thanks for the link, Stephen. I enjoyed it. I have a son named Stephen, spelled the same way. My maternal grandmother’s maiden name was Stephens.
Thanks again.
The US Military ( Former Defense Secretary Jim Mattis ) in the JOE 2010 report
https://apps.dtic.mil/sti/pdfs/ADA518100.pdf
predicted Peak Oil as early as 2015 but likely in 2018.
They more or less nailed it.
Now look at how militaries across the world are behaving.
“A severe energy crunch is inevitable without a massive expansion of production and refining capacity”
Andre , there is a German army report of 2010 warning about consequences of peak oil . The TPTB ( whosoever ) know and are aware of Peak oil . The problem is as you have outlined on the non petroleum thread about Karl . He went to the senators and they said they would loose their jobs . Regretfully they will loose their jobs and their lives and so will many others .
https://theshiftproject.org/wp-content/uploads/2018/02/der_speigel_article_0.pdf
The US Military I believe missed the shale boom. Which is why we haven’t experienced the severe energy crunch yet.
I also speculate that Russia underestimated the US Shale boom as well, which is why they went into Crimea in 2014 and then waited to 2022 for round 2 as they thought US shale hit its peak.
Is there another person on the internet that has made this claim?
Standing ovation!!
There has been some discussion by Kangeo and Dennis on decline rates. There certainly is a difference of opinion on what the world decline rates are. However one must be clear on what decline rate this is being addressed. Below is a chart of the world’s NET decline rate. The decline rate that has occurred with ongoing drilling to maintain production.
The first chart shows the decline rate of the world without the current 12 largest producers. The decline rate is 665 kb/d/yr. The OLS line used data from January 2010 to January 2020. February 2020 to December 2021 data was dropped. January 2022 to March 2023 was included.
Looking at the post covid period, production has been flat at close to 19,000 kb/d since January 2021. There is no sign that decline in these countries has resumed.
Attached is a chart that shows the production rate of the top 12 countries over the same period. The OLS shows production increasing at the rate of 1,654 kb/d/yr. Production has been flat since October 2022.
We will need to see the effects the OPEC + and Russia cuts before any conclusions can be drawn.
Thanks Ovi,
The most important rate is the World rate as output from one nation influences output from other nations. So far, the trend from 2008 to 2019 is up at about 928 kb/d on average. The rate that World output will decline can only be guessed, demand for oil will likely influence the rate of decline, that also it unknown. Your World minus big 12 suggests a decline rate of 665/23000=2.9%. That might be as good an estimate as any.
Note that some such as Hook et al, 2014 have theorized that larger regions (such as the World) would tend to have smaller decline rates than smaller regions. As the 23 Mb/d of the World minus big 12 represents only about 29% of World output in 2016, the decline rate for the World may be less than 2.9%, though only from a geological perspective, demand might fall faster than that.
Dennis
The 2.9% applies to the World countries W/O Big 12. The big 12 are listed below. Most of the remaining countries are not reinvesting in drilling. So the 2.9% could also apply to the fields in the Big 12 that are not being drilled to maintain production.
The first country after Norway in terms of production was Nigeria, plagued with rebels. Most of the remaining countries are on plateau or declining, except for Guyana. Guyana is interesting since its output is being determined by XOM and I think they are in a big dispute with the govt.
An interesting country is Denmark. It has a yearly decline rate of 8.3% (0.916735). I guess they don’t inject water or CO2. The chart is attached. Not sure what happened to production in mid 2019 that it started to fall.
Big 12: US, Saudi Arabia, Russia, Canada, Iraq, China, UAE, Iran, Brazil, Kuwait, Kazakhstan and Norway
Ovi , just jogging my memory so can be “past expiry date ” . Jeffery Brown ( West Texas ) use to give Denmark as an example in support of his ELM model . They just seized being consequential a long time back . Next on the list Gabon ( courtesy Mr Seppo) .
HIH
I am not sure what happened to JB and his ELM model. It was another piece of the puzzle. Unfortunate.
World C plus C less Big 10
Big 10 are:
Russia
Saudi Arabia
United States
China
Canada
Iraq
Iran
United Arab Emirates
Kuwait
Brazil
Decline rate from Jan 1010 to Jan 2020 is about 2.4% per year on average.
Dennis
It is the blue markers that we will have watch. They currently are off trend.
Ovi,
My expectation is that is due to covid and recovery from covid, we might return to trend, but I agree the Feb 2020 to March 2023 data do not follow the previous trend. Trends can change. Sometimes OPEC members affect the trend as they are sometimes subject to quotas.
Dennis
I should have been more specific. I was looking at the post 2021 data. it has been flat. Implies there is some growth somewhere amongst those smaller producers.
Ovi,
I think it is just a return to trend, there are a few nations with increasing output outside of Big 10 such as Norway, Guyana, and Argentina. I decided to test this by also subtracting the 21 nations that had higher output in 2019 (annual average output) than in 2015. I was surprised to find that the annual rate of decrease increased to 5.3% from Jan 2016 to Jan 2020 and then was relatively flat from June 2020 to March 2023, not clear what the explanation is.
From December 2020 to March 2023, those 78 countries (World Less Big 12), had some winners and some losers. During this period their total production has been almost flat, increased by a mere 7,000 bp/d. The 16 biggest gainers and the 16 biggest losers are listed below.
Their change in production, up or down, is listed in thousand barrels per day.
Ron,
Thanks. Not clear why things changed so much after 2020, there is a clear change from previous trend, I do not have a good explanation.
World C plus C has been rising pretty quickly since Feb 2020, more than 4 times faster than the Jan 2016 to Jan 2020 period.
Feb 2020, more than 4 times faster than the Jan 2016 to Jan 2020 period.
Yes, of course, it has Dennis. But as it has been pointed out many times before, that is all recovery from the covid demand cuts.
If you will notice, the blue crosses in your chart are starting to roll over. And that is only through March. Stick around until the end of the year, and you will see a definite downward trend. It has already started with OPEC.
Ron,
I do not expect the rate of increase over the 2020 to 2023 period to continue, but it is unlikely to roll over, just fall to a lower rate (perhaps a 500 kb/d annual increase which will gradually slow to zero by about 2028). OPEC has cut production due to lack of demand as I am sure you are aware. At some point demand will rise to a level that results in OPEC reversing course and increasing output, probably by mid-2024.
Just curious, Dennis, but what do you think OPEC’s level of sustainable production is right now? I know it would just be a guess, but I would still like to know what that guess is. Of course I would be willing to give my guess if I expect you to do so. My guess would be 29,000,000 barrels per day crude only.
By sustainable I mean through 2025.
Ron – OPEC can be expected to have an annual decrease of ~1 mb/d for next 5-10 years, they currently have less than 200 Gb 2P Reserves. They currently produce 10-11 Gb annually. Assuming their oil lasts until ~2070, they will have a 4-5% annual decline rate. At a 2.5% decline rate they run out in 2050. A 1% decline rate OPEC runs out in 2040, and so on.
One of the biggest reasons for the large decline rates is due to conservation of existing reserves.
Peak for OPEC was 2016 at 31.7 mb/d (Middle East). 2017 was 0.5 mb/d lower, 2018 was slightly higher at 31.56, then 2019 was 30, a large drop of 1.56 mb/d. 2020 and 2021 can be thrown out as demand related issues. However by 2022 ME production had rebound to 30.7 mb/d, only slightly higher than 2019 and lower than 2016 thru 2018 average of ~31 mb/d.
My best guess is decline rate for ME of 1.5% between 2016 and 2023. By 2025 I would bet the decline rate increases to somewhere between 2.5-5.0%
It’s also possible that decline rates for ME could be much higher due to tech used to drill (water flood). A 10% decline rate for some time could be possible, regardless it’s unlikely that oil production decline will move in a steady organized fashion, more likely there will be massive drops then relative calm followed by more drops…
If the BAU machine is working properly it will all be a case of demand related cuts and smoke and mirrors, we’ll see soon enough…if Russia doesn’t hit the launch button…
Ron,
I would probably guess about 30 Mb/d.
Kengeo,
If we use Hubbert Linearization for OPEC to estimate URR, it is about 1200 Gb, with about 600 cumulative production through 2022. Note that a Hubbert curve suggests output at about 32 Mb/d at peak and decline from that peak is quite slow, this suggests a plateau at 30 Mb/d is quite feasible.
I have read the volley having to do with SLB pulling out of Russia and the possible effects with great interest, because there are some ironies involved in this. On this site a great number of people have posted horrible stories detailing how life without adequate hydrocarbons will be. I happen to believe those stories.
In that context, I would propose that if oil and gas scarcity hits hard, most people won’t care where their hydrocarbons came from. The curious relationship that Japan has with Russia is a living preview. Since WWII, Japan goes out of its way to be politically correct. As a member of the G7, Japan hit Russia with a bunch of financial sanctions as punishment for invading Ukraine. However, at the same time, Japan has retained its stake in S-2, the large LNG facility on Sakhalin Island that supplies Japan with NG.
If oil becomes scarce enough, countries will say, “Tsk, tsk, you naughty boy.” And follow that with, “Now where is my load of Urals Blend?”
A few comments on oil exportation and resource nationalism. I’ll preface by saying that my base tendency is to save things that are limited….I lean hard towards the saving type personality. That is my personal bias as a disclosure.
As oil rounds the top and becomes more expensive and scarce, the tendency will be for the producing countries to both save what they have for later and to sell what they do to favored customers. Shortage due to unequal distribution will be more severe than it has been during the growth phase of the past 100 years, and this patchy distribution will be a more important feature of post-peak global economic function than the absolute levels of oil production.
Consider some consequences of trade restriction of oil and of other key economic ingredients- Most of the ‘western’ industrial countries as well as China are heavily dependent on free trade in oil, and many other materials and industrial/manufactured goods. These are our trading partners and we are extremely reliant on them for modern economic function. If they come up short on function due to loss of energy…so do we. Many other key ingredients of modern economy will also be subject to resource nationalism- copper, semiconductors, motors, fertilizer, etc. The reversal of free trade/reversal of globalization will result in a much smaller economy for everyone who participates in modern economic life. A smaller economy with much less customers for your services and goods, much longer wait for supply lines to get filled (if at all), and much higher prices for goods and base materials. There will be a few winners, but the vast majority will be losers.
I suppose we will arrive there anyway, but I raise caution against hastening the development of opposing trade blocks. Or we’ll get there faster.
Hickory,
That has been my position in the past, basically the argument is that free trade makes everyone batter off.
See https://en.wikipedia.org/wiki/Comparative_advantage
Note that there are criticisms of this theory and also the US has a crude oil export ban for 40 years (1975 to 2015) with little ill effects. I stil think generally free trade is a good idea, just like free speech, but it is not necessarily a good idea in every case.
Agree,
My main point on this is that there are big consequences to retrenchment on international trade including with energy. Most people seem to take the incredibly fortunate position of the US for granted, seeming to assume that our unilateral actions have no karmic pushback.
Up above TexasTea and last week Gerry expressed hope that Nuclear Energy would be picking up the slack as Peak Global Combustion day gets closer.
Putting aside radiation to keep the discussion simple,
the hope for nuclear energy is understandable.
But I’ll point out that there is no chance it will be helpful at scale in the next twenty years at least.
Sure it will help in some localities, but the numbers come up very small.
Look over the data rather than take my word for it.
World Nuclear Industry Status Report 2022
with particular attention to the Key Insights and Executive Summary beginning on pg 16
https://www.worldnuclearreport.org/IMG/pdf/wnisr2022-v3-hr.pdf
I’ll also reiterate what a nuclear industry insider recently said on a podcast, paraphrasing-
‘It takes big government involvement for any country to have a viable industry…no company in the world is doing nuclear development successfully on their own.’
https://www.thegreatsimplification.com/episode/74-james-fleay
Basically, at this point the world is running hard to stay in place on nuclear.
I acknowledge that it is possible that a new era of nuclear fission or fusion could come be with surprising new technological development that has not yet arrived. But to characterize this possibility as anything but hope at this stage would have to be in the category of prayer, or magic.
Time and money are not on the side of significant nuclear energy sector growth for the foreseeable future.
France built 58 reactors in 15 years.
“As of mid-2022, 411 reactors were operating in 33 countries, four less than a year earlier, seven less than in 1989, and 27 below the 2002-peak of 438”
France has an old fleet, and has been having a lot of trouble with them in the past few years.-
“it posted a nearly 23% fall in nuclear power generation to 279 TWh, owing to a lower availability of the nuclear fleet as many reactors were offline for maintenance (stress corrosion affecting circuits). After prolonged maintenance times, the availability of the French nuclear fleet decreased to just under 35% of the installed capacity in August 2022 and power generation was cut at 10 reactors in December 2022 to save fuel amid mild temperatures, further reducing nuclear power generation. In early January 2023, over 2/3 of the nuclear reactors in France were available again, 44 operating and 12 shut down.”
https://www.enerdata.net/publications/daily-energy-news/edfs-power-generation-france-reached-record-low-2022.html
My point was that if France could develop the motivation to build 58 reactors in 15 years, it shows how quickly things can develop. Now, if only the nuclear industry can make the financial case for the cost, reliability, and safety. They haven’t done that yet, but they’re trying.
I see that Ontario is investing in more nuclear reactors.
GerryF , nothing new is going to be built . France and the world has enough problems maintaining what nuclear reactors already exists . There is just no nett surplus energy to carry out such endeavors . It took EDF 12 years to start their reactor in Finland . Times have changed .An old article by Art Berman on nuclear energy .
https://www.artberman.com/2022/02/15/nuclear-power-is-no-solution-for-the-worlds-energy-problems/
Really
https://www.newcivilengineer.com/latest/great-british-nuclear-launched-with-smr-competition-and-157m-nuclear-funding-package-18-07-2023/?tkn=1
Not every countries has lots of oil and gas.
In the UK we learnt the hard way what can happen when you rely on imports from countries run by nutters
Charles , blah , blah . They have launched nothing . Only a program on paper and plans for the future . They haven’t even purchased a brick or a shovel . As they say ” All air , no punch ” .
Hole in Head
No not blah
Hinckley point C is well on the way
https://www.edfenergy.com/energy/nuclear-new-build-projects
£679 million of government money for sizewell c
https://www.bbc.co.uk/news/uk-england-suffolk-66240489
I agree Gerry…the motivation to get serious on energy projects and spending will be getting a serious boost over the next 10 years.
We’ll see what we can do it.
I expect energy sector spending to go up and up…for oil and gas production, solar and wind, grid and storage, nuclear, and efficiency mechanisms (like heat pumps and electric vehicles).
All of it.
And I expect the money spent to purchase less and less net energy.
ND May oil production was essentially flat, down 2 kb/d to 1,134 kb/d
Ovi.
This is a BAD SIGN indeed for the Bakken.
Why?
Last year from Jan-May 2022, there were only 231 wells completed vs 389 during Jan-May 2023. Production is FLAT even though there are 168 more wells??
As Mike Shellman & George Kaplan continue to warn… the SHYTE is about to hit the FAN in the U.S. Shale Oil Industry. While we can make nice-looking charts with TRENDS that go up like toothpaste floating higher in the U.S. Space Station, the reality is….
… GRAVITY is a BITCH.
If we compare JAN-MAY 2022 vs. 2023 Oil Production in the Bakken, we see a troubling sign that the average production per well is heading lower.
But who knows… maybe the Hamsters in the Bakken can keep production Flat for another DECADE?
LOL
steve
> DECADE
I don’t think that it can stay flat for 10 months if anything, one thing that the tight oil production hates is flat, if history is any guide, is either up or down.
Svaya, It has been flat for 27 months. Depends on completion rate.
I don’t say region, counties or fields, I am thinking total. I don’t believe it can stay flat, once is flat people will panic and panic will drop production.
You can make controlled burnings in a forest but not in a theatre.
In regards to the above graphs, I would offer a gentle admonition.
The Bakken is a mature field, but not dead. With regards to your production graphs, consider that several hundred thousand Bakken wells are long in the tooth, and that the total new wells is a pittance against the backdrop of those old wells. This is actually a promotional chart for the Bakken. The new wells are quite good, carefully considered, and the reservoir pressure hasn’t plummeted.
When the Permian hit, with its multiple layered benches and magnificent Texas infrastructure and attitude for getting the job done, everyone fled the Niobrara, Bakken, STACK, Eagle Ford. They doglegged into the Permian where they could, migrated into wedges of the Delaware, flared and vented pretty much unwatched and unscolded by the TRRC, and rode the merry-go-round.
The Bakken and Powder River portion of the Niobrara, as well as the Uinta, were left with sturdy operators that put a careful eye to their operations. A lot of them are Canadians (what weather?). The results per well have been generally good and the reservoir integrity has been marshaled with care.
There will be a diaspora from the Permian at some point. Some operators will go to the barn, but most are programmed for an aggressive format, and they will head to the Powder River, back to the Bakken, and over to the Eaglebine. This will be like the eighties and nineties, scurrying for piecemeal oil.
I like the Bakken and the Niobrara. Whenever anyone examines them–especially the Bakken–they do so without considering that there are thousands of end-of-life wells with only a sprinkling of new ones. I submit that flat production is a testimony to the carefully thought out drilling operation up there, selling NG for zero, being price-docked on the oil, but still staying flat. And the Weld County portion of the Niobrara is simply stunning–but its production is flat too, for the same reason.
The Permian is gassing and watering out in the growth portion–the New Mexico part of the Delaware. At some point there will be a crisis over water management–maybe even a clash between the states. On a proportionate basis, considering environmental dereliction, the Delaware is in a much sadder shape than the Bakken—the many woes are simply hidden behind a massive drilling operation.
Most state regulatory bodies have failed. The TRRC is a massive complex that has ignored its purpose in exchange for it’s always bigger in Texas volume and profit. Allowing egregious violation of Statewide Rule 32 on limitations to venting and flaring of methane gas will eventually bite them in ass, as will the equally egregious practice of disposing of oceans of saltwater in dangerously overloaded disposal wells near quake faults. North Dakota had no place to go with their NG and vented and flared just as egregiously, only on a smaller scale because the field is smaller. Oklahoma dumped oceans of saltwater from the watery STACK until they wrecked hundreds of farmhouses.
The price of oil is falling again today. The propaganda machine has the world convinced that there is unlimited oil on this planet. I’m sure there’s quite enough; it’s just very expensive to get to, and furthermore, much of it is not profitable–it’s similar to a thin coal bed. I don’t think very many people have an understanding or appreciation of just what a behemoth the Permian shale basin has been. It has eclipsed oil and gas enterprises everywhere else, taken on a life and excitement that has mesmerized all but the most stalwart of men and women. You can’t even get an interested glint in the eye at a cocktail party if someone asks you what you’re doing and you reply that you are drilling a conventional well and the e-log looks good. They chuckle and say, “What about that damn Permian, eh?”
This started out to be a slight objection to the Bakken statistics (which I think are great!) and turned into a travail. Please excuse me. I can’t word the looming disasters in the Permian as well as Mike Shellman, but I probably have more intimate knowledge of the smaller basins. Carry on; your graphs are good.
Gerry,
Great stuff, spot on imo.
Steve
Good stuff. More drilling 68%. More oil 49%. looks like the economics must be getting worse.
Ovi,
Looking at only a 5 month window tells us very little, also keep in mind the most recent few months data is preliminary, so probably looking at Jan to March or better 12 month periods would tell us more. Note Enno Peters post showing productivity on a per well basis has been steady, so I think Steve is on the wrong track, not uncommon.
Misinterpreted your graph.
You’re right, the wells are less productive.
No Gerry your initial reaction seemed right. See Novilabs update on North Dakota.
Steve
Thanks for sharing that data, seems productivity has stayed flat with a very small increase in lateral length and proppants. Output has remained flat not really a big deal, 12 month completion data is more useful April to March, because most recent 2 months is preliminary data.
The logic is output is flat, when we see it change we can look further.
Steve,
If we look at all producing horizontal wells in North Dakota, in May 2021 average output was 60.56 bo/well and in May 2022 average output per well was 59.58 bo/well. It is expected that average output per well will fall over time, this is true for nearly every oil field, nothing surprising here.
Dennis,
You’re a Funny guy. Always appreciate your humor.
While it is true that wells will continue to show a decline, you are missing the BIGGER PICTURE.
And what is that picture… LOL.
The companies are now going to 3-Mile laterals in Tier 2-3-4 locations and the some of the RESULTS are absolutely horrible.
Chord Energy just completed a 3-Mile Lateral in January and peak production hit a massive 385 bopd.
So, I have no problem with you providing the BULLISH FOREVER OPTOMISTIC scenario, but on the ground things are changing quite quickly.
GOD HATH A SENSE OF HUMOR…
steve
Steve,
In the oil field things don’t always work out, maybe the 3 mile lateral idea is not a good one. No two wells are ever the same some are better than others. The big picture is reflected by average results, which is what I used. Also looking at Enno’s summary it looks like average well productivity has been stable from 2019 to 2022 in Bakken.
On being funny you are Johnny Carson. You definitely take the cake.
The Littlefield offset immediately to the south from the same pad is strong. Also a 3 mile lateral paralleling the one Steve referenced. Has made 122,000 BO Jan-May 2023 after completion in December 2022. Jan-April average production of nearly 1,000 BOPD each month before doing a partial shut-in in May for something.
Anyway, strong to me. Maybe your Littlefield is in a different zone Steve… looks like Threeforks instead of true Bakken.
Guys you realize a single well tells us nothing about the big picture, I hope.
This is stats 101.
Peak Oil in South East Asia and India – Part 1 Production and Consumption – Update 2022
BY MATT – JULY 17, 2023
POSTED IN: ASIA, AUSTRALIA, CHINA, INDIA, SINGAPORE, SOUTH EAST ASIA, VIETNAM
The Energy Institute published its first Statistical Review on 25 June 2023, thereby replacing the BP Statistical Review
https://www.energyinst.org/statistical-review
Let’s have a look at oil production and consumption in South East Asia and India. After all, this is one of the key regions in the world where perpetual growth is expected.
This peak year came about by a production spike in Australia which peaked in that year. Without Australia we observe a bumpy production plateau between 1995 and 2016 (20 years). Annual decline rates in the last 3 years have accelerated to 5% – 7% pa. We do not know how much of that is due to Covid.
Fig 1: Oil production peaked in 2000
Click on picture to enlarge.
And the accompanying display showing consumption (red line).
Dennis (couldn’t follow the strings above, so putting comment here) –
I actually think your 8 year old model is matching world production quite well (exclud. US)…
I think the point is that US has also peaked and steepish decline is imminent…
I think there are 3 areas to watch:
– US tight oil potential decline of ~1 mb/d annually (8-9%).
– The others that have been dropping at ~1mb/d annually (3%).
– OPEC+ with potential to drop ~1 mb/d annually (3%).
All in all we can see a path towards annual loss of 2-3 mb/d…
This could work out to decline rate of between 2.5% and 4.0%.
Resulting URR (Gb) in 2050 of ~2,100 (2.5%) and ~2,000 (4.0%)
In 2070, URRs of ~2,300 (2.5%) and ~2,100 (4.0%)
The take home is that decline rates of >3% result in a steep decline with minimal URR.
5% decline rate for example results in URR of only ~2,000 regardless of timeframe…
A loss of more than 1 mb/d annually will likely be catastrophic, there are many ways that happens…unfortunately
Kengeo,
My Model includes the US so no it was not good at all after 2015, by 2022 it was terrible, if we deduct tight oil or hold it at the 2015 level, the model is better, but I simply call it a failed model that did not appreciate future tight oil growth.
Note also I have revised my extra heavy oil estimate to 170 Gb from 500 in that model.
Using my current 70 Gb estimate for tight oil URR that suggests a URR for conventional C plus C of 2130 Gb for this model. That is at least 370 Gb too low imho.
It is strange that you expect decline when output is increasing.
Most experts expect URR of at least 2700 Gb with the chief expert in the peak oil community Jean Laherrere expecting 3500 Gb URR.
Disagree that steep decline will occur in the US before about 2033.
KenGeo- “A loss of more than 1 mb/d annually will likely be catastrophic”
I assume you mean that would be catastrophic for the world economy.
Well, better get ready for catastrophe then because at some point we are going to see that.
How long will you (all) continue to go about your life as if the party is just starting?
Bakken Well Productivity Declines For DUMMIES…
There seems to be a disagreement in regards to the Bakken Well Productivity, so I will… SET THE RECORD STRAIGHT once and for all.
Going back to the KISS – KEEP IT SIMPLE STUPID principle…
For some odd reason, oh… maybe Reservoir DEPLETION, the Bakken wells in 2022 experienced a significant decline in PEAK production vs 2019 and 2021.
Why is this bad news?
Because according to the Detailed data from NOVI, companies in the Bakken increased the average lateral length and proppants (fracking sand) while production has declined.
BAKKEN AVG WELL DATA POINTS FOR DUMMIES:
2019 Proppants pounds per foot = 928 lbs
2019 Lateral Length = 9,950 ft
2021 Proppants pounds per foot = 962 lbs
2021 Lateral Length = 9,983 ft
2022 Proppants pounds per foot = 1,005 lbs
2022 Lateral Length = 10,327 ft
So, if we still consider going by FACTS, DATA & LOGIC, we see a troubling sign here when compared to the Peak oil production for 2022 being significantly less than 2019 and 2021.
And… for those DENNIS-WANNA-BES who think… “Well… maybe they just completed shittier wells in 2022” due to the higher oil and natgas price, that would be a pretty good assumption. However, it turns out to be a WRONG ONE… indeed.
Why?
Because if we again go by the DATA…
BAKKEN TOP 4 COUNTIES COMPLETED WELLS FOR DUMMIES
2021 = 664 wells
2022 = 706 wells
Companies completed most of the wells in the TOP 4 Counties in the Bakken because that is where the higher quality proven reserves are located.
steve
Steve
Thanks for sharing that data, seems productivity has stayed flat with a very small increase in lateral length and proppants. Output has remained flat not really a big deal, 12 month completion data is more useful April to March, because most recent 2 months is preliminary data.
The logic is output is flat, when we see it change we can look further.
Nobody tries to complete crappier wells, there is this thing called statistical variation,
look it up when numbers are small it increases in percentage terms.
Also peak production doesn’t matter, it is the first 6 or 12 months cumulative output that matters. Mike Shellman has pointed out that companies play games with IP numbers, they mean very little.
That may be why Enno uses 6 month cumulative output, he probably learned that from Mike, just like me, though I have much more to learn.
Dennis,
I appreciate the IT’S NO-BIG-DEAL response. I can sleep better. Thanks
However, same thing is happening in the EAGLE FORD.
So, I suggest the folks who get up in the morning and PREY to the HOPIUM & IT’S NO BIG DEAL GODS, better get busy… LOL.
steve
Well said Steve –
Dennis is a little stubborn, but he does actually pay attention, so at some point he will reevaluate his assumptions and improve his estimates, not sure when that will be, guessing 3-6 months, we’ll see.
Kengeo,
Yes I adjust my thinking when data warrants.
Steve,
Eagle Ford has falling average will productivity, but output has also remained flat since August 2020.
Eventually output will peak for all tight oil plays around 2030, at current completion rates after this I expect oil prices will fall, complation rates will fall and tight oil output will fall at about 20% per year (2032-2040).
Cumulative output in kbo at 24 months for Bakken wells
2017=223, 995 wells
2018=239, 1269 wells
2019=232, 1272 wells
2020=255, 581 wells
The 2021 and 2022 wells are better than the average 2019 well at 12 months cumulative output, but not quite as good as the average 2018 well, 2020 was the peak year for average well productivity, probably due to high grading.
That’s a 12% increase in proppant for a 10% decrease in production for a total decrease in proppant efficacy of 20% over three years.
IP’s are manipulated at will by different operational methods and financial philosophies but in high product price environments like we’re in now, rarely to the downside. Everybody wants the most bang for their buck. I would not scoff at lower IP’s. Nor would I think wells are better because their IP’s are higher. EOG is textbook on this; their IP’s, wherever, are to the roof then… if you stand behind the ensuing decline, after 24-36 months, you will be swept off your feet. They have gutted their blocks in Lea County so they’re now off to Ohio to gut it.
IP6&12 months as a metric for liquids well quality, or well productivity, is not a good metric. It means very little to me. The only thing that matters is EUR, or rather, UR, and EUR’s ARE going down. Even in the Permian. 100% on that.
Wells in a field decline, then the overall field begins to deplete. Its human nature to refuse acceptance of the inevitable so more and more wells are drilled to offset the decline, which increases the rate of depletion. That enviably leads to lower EUR’s. It’s the nature of an oilfield. Tight oil is no different. Particularly US tight oil where reservoir management takes a backseat to money, money and ‘mo money.
Mike,
I agree URR or EUR is a better metric, we don’t really know what those are for recent wells. The 6 or 12 month cumulative is used as an indication of EUR, in my view it is better than IP as an indication of EUR.
Perhaps there has been a change in how companies are choosing flow rates, rather than trying to impress people with high IP, they may be choosing to maximize recovery by choosing more sensible flow rates. Maybe they have been reading your blog.
Since Shale is getting a lot of attention is this area of the thread, I thought I should add the latest Permian chart from the DPR. Many do not have much confidence in the DPR data but this chart may change their minds will warm their hearts.
Usually this chart is part of the US update but I decided to release it tonight to get your thoughts.
I have been pointing out the slow rolling over trend for the last 3 months. Note that we will not get real US August data till November.
Full update in Early August.
Thanks, Ovi. This is a real shocker, to say the least. Has the EIA
suddenly started to get realistic?
Ron
Did you mean to say DPR?
No, I meant to say EIA. I have corrected my error. Thanks for the correction.
Ron,
I think you have characterized the DPR as not being worth a warm bucket of spit?
Seems accurate.
Yes I have Dennis. However, their sudden turnaround just blows my mind. Did they read one of my posts characterizing their prediction ability as not worth a bucket of warm spit? Did they read that and wake up? Did they read that and say to themselves, “Hey, look at what folks are saying about us? “And then did they say “We need to get our shit together?”
Well, I don’t mean to take credit for their reality check Dennis. But if they did it because of one of my posts, I am proud of myself. 🤣
Ron,
The quality remains as you initially assessed, first guess is often best.
Dennis, I wasn’t guessing. What I stated about the DPR was obviously true because they had to revise their prediction every month. They always predicted an increase in production that would follow a 45-degree angle if plotted on a graph. And, of course, that never happened. So it was not a guess, just an “after the fact” observation, pure and simple.
But they now seemed to have had a “come to Jesus moment.” And it was way overdue. So let’s just be patient and see how their new paradigm of actually looking at the facts before making a prediction pans out.
Ron,
They continue to revise every month and will continue to do so.
Rigs are down, DUCs are way down, and frack spreads are down. No big surprise that production is rolling over. When will Wall Street notice?
Ovi – This is all temporary, as soon as I snap my fingers you will awake and oil will flow from all corners of the world. Oil production has risen for past 50 years therefore it must continue, I will probably be wrong but I ignore all data that might convince me otherwise…
I trust data more than models, the DPR has always been flawed, I ignore it. The analysis at Novi labs is better. When we see Permian rigs fall to 233, perhaps output flattens as Enno Peters projects.
The DPR will be wrong.
The DPR may be seeing a slowdown in output that might occur.
The scenario below assumes the completion rate falls to 450 wells per month by August 2023 (in June 2023, the DPR has Permian completions at 480 wells per month) and the completion rate then holds at 450 per month until Dec 2025.
The EIA estimate is extended to August 2023 by subtracting the Permian region non-tight output in March 2023 (511 kb/d) from the DPR estimate over the April 2023 to Aug 2023 period (I just assume it is constant because we do not have a tight oil only estimate (the April 2023 number is likely not accurate).
This is my guess for a 450 well per month scenario, no idea what completion rate will actually be.
Note that the last 5 EIA “data points” on the chart are based on the DPR model and not on actual output data, these are highly suspect in my view. A cursory look at past DPR reports shows that their most recent 5 months are often very wrong. and get revised significantly in the future. If one thinks a report is bad, it doesn’t make it better when it says what you believe to be true, the report remains suspect in any case.
Dennis
The problem I see here is a combination of management and geology.
On the management side, we don’t know if they have decided to just drill and complete to hold production flat. How many companies could be adopting that philosophy I can’t say. I did hear a report the other day from an oil conference where the reporter said that he kept hearing the same mantra, return more to investors.
As for geology, I have no idea of how much Tier 1 land remains and how management is blending the drilling and completion of Tier 1 and 2 lands.
I also note that your post 2023.5 production slope is lower than pre 2023.5.
Ovi,
Yes the slope is lower because the completion rate falls from about 490 per month on average in 2022 to 480 per month for first few months of 2023 and then decreases to 450 wells per month by August 2023, leading into 2022 the completion rate was increasing from 400 to 490 over the course of 2021. So a big change in slope due to the assumption of falling completion rate. It would need to fall by more (to about 375 wells per month) to get the flat output expected in the DPR. Maybe that will happen, but it only happens with bigger drops in rigs and frac spreads than we have seen so far.
I don’t mean to steal your thunder for August Ovi, but I just added all seven shale basins from the Drilling Productivity Report and created the below chart. I think this tells us that the US has peaked, at least temporarily.
There she goes . Just adding to the conversation . Down from here . The beginning ??
Ron
It was a toss up as to which one to post. Now everyone can see the whole story.
Ovi, Bloomberg picked up the story. They believe it means that US production is set to decline. Here is their short report, bold mine.
Shale Oil Production in US Set to Decline From July Peak, EIA Says
Updated on July 17, 2023 at 6:22 PM EDT
Shale oil production, which has revolutionized the energy industry and transformed the US economy, will stop growing in August, according to a government report.
After hitting record highs in June and July, US crude production is set to fall in August for the first time this year to 9.4 million barrels a day, led by a drop in the oil-rich Permian Basin. Combined with production cuts from the OPEC+ alliance, the US decline is expected to tip the world’s oil supply into deficit by the end of the year.
Ron,
All of the tight oil increases since pandemic have come from Permian so this is expected. The Permian projection is likely to be wrong.
Dennis.
I know you are always on the lookout for well costs.
I see where Chevron is auctioning its right to participate in two wells to be drilled by operator Diamondback in Reeves County, Texas.
One well will be completed in the Middle Wolfcamp and the other in the 3rd Bone Spring.
Chevron’s Gross Working Interest in the two wells will be 37.7% and the participation cost is $8.916 million.
By my math that means $16.2 million per well is what they will cost?
Shallow sand,
I would think that is the discounted net cash flow that is expected. In theory this should be more than the well cost or profits would be zero and nobody would be interested in the investment.
Think of it this way, imagine you have a well that you expect to payout in 60 months. I would think the discounted net cash flow over the life of the well would be higher than the CAPEX for the well.
Kuwait latest .
June-to-date monthly #Kuwait crude exports are lowest on record. Week ending June 25 was also lowest week on record. Comes in context of rampup of new Al-Zour refinery. 2 of 3 units now running, with the final set to start by end of year, further cutting crude exports. #
Update for the US Car Sales Diagram. The numbers are rising, a bit faster than i epected. Now they are about 1260 thousand/month. Without subsidies for EVs, the number would be smaller. How much less, is difficult to estimate. Could be 40 thousand/month.
Does Peak OIl matter any more?
Back in 2005 when several people claimed global oil production was just about to peak or had already peaked.
There were various doom predictions of $300 oil causing crushing inflation followed by a global depression.
https://www.sciencedirect.com/science/article/pii/S2214629618303207
Now people like Dennis think that electric vehicle production will increase at a sufficient rate to cause demand to fall faster than production decline. If this is the case then global production peak and fall is a mere intellectual observation and many many people have spent a lot of time and energy on a problem that has been avoided.
Charles , in 2008 when the GFC crisis happened the 2005 doomers were correct . Did you know about QE and unlimited budget deficits in 2008 ? If yes , then I will vote for you as the next FED chairman . The shale oil phenomenon would be impossible without ZIRP and a loose monetary and fiscal policy . Shale is nothing but a scheme to ” burn worthless Greenbacks in exchange for valuable ( low EROEI) energy ” . As an economist would I support this exchange , answer ” no ” . As an individual do I support the exchange ” yes ” . This has extended BAU by 15 years (2008-2023) otherwise the party would have been over . As to EV’s will post tomorrow , time to hit the sleep button here .
HiH,
I agree without ZIRP no low EROI projects would be developed, seems like a symptom of declining EROI of oil.
Hole in Head
QE bought bonds which helps to lift the economy, not directly related to shale companies.
Many of which went bust or were bought out. However the big companies don’t care too much
https://www.cbsnews.com/news/exxon-chevron-shell-conocophillips-record-profits-earnings-oil-companies-most-profitable-year/
A barrel of oil is equal to a year of physical labour so it is still worth drilling for.
fact remains oil production is 10 million barrels per day higher than 2005 and electric cars will make peak oil less important although it will have more of an impact than Dennis thinks
Charles,
EVs are hydrocarbon derivatives. They don’t even break even in carbon terms. And if they do, it’s years out and very marginal (EV batteries are a bitch.)
“They don’t even break even in carbon terms. ”
False speech.
And those guys were talking about energy, not carbon.
Charles , read carefully “The shale oil phenomenon would be impossible without ZIRP and a loose monetary and fiscal policy ” . It was QE ,ZIRP , bailouts etc, etc galore that was a part of the loose monetary / fiscal policy , It was a package of financial stimulus . Do not point out only to QE . It lifted up the economy ( a rising tide lifts all boats ) and gave impetus (catalyst) to go drill for the source rock . Fracking was known long ago and already applied in the Austin Chalk basin . Accumulated losses in the shale oil business are in hundreds of billions . Easy doing it with OPM (Other People’s Money ) . Ask the real oilmen here . As to worth drilling for (even if low EROEI) , I already have said I support it for it gave us 15 years of BAU .
Hole in Head
I get your points regarding zero interest rates etc.
I think they could get away with it as long as oil production increased and the energy benefits of increased production would be used in the economy.
Once oil production starts to fall year after year then there will be serious trouble.
I think oil production will start to fall in 2028 and by then there will be another 400 million people on the planet.
They will all need food grown and transported around the world. They will want their share of houses, food, holidays and air travel, water desalination will consume ever more energy.
https://www.cnbc.com/2023/06/13/water-scarcity-china-and-india-look-the-most-threatened-from-shortages.html#
Unlike Dennis I do not think electric cars will get us out of the hole we are digging.
I think by 2030 the world will no longer have spare grain stores and people will really see food price inflation.
Charles,
It just goes to show how hard it is to make predictions. We live in a very complex chaotic world. Sports betting is hard enough with limited players within a limited space within a given set of rules.
Luckily peak oil predictions are more for fun than money.
Given that the conversation is running to crisis and possible collapse…….. I think this is relevant here as well as the non petroleum thread.
Open in app or online
July 17, 2023
Heather Cox Richardson
Jul 18
Share
A story in the New York Times today by Jonathan Swan, Charlie Savage, and Maggie Haberman outlined how former president Donald Trump and his allies are planning to create a dictatorship if voters return him to power in 2024. The article talks about how Trump and his loyalists plan to “centralize more power in the Oval Office” by “increasing the president’s authority over every part of the federal government that now operates, by either law or tradition, with any measure of independence from political interference by the White House.”
They plan to take control over independent government agencies and get rid of the nonpartisan civil service, purging all but Trump loyalists from the U.S. intelligence agencies, the State Department, and the Defense Department. They plan to start “impounding funds,” that is, ignoring programs Congress has funded if those programs aren’t in line with Trump’s policies.
“What we’re trying to do is identify the pockets of independence and seize them,” said Russell T. Vought, who ran Trump’s Office of Management and Budget and who now advises the right-wing House Freedom Caucus. They envision a “president” who cannot be checked by the Congress or the courts.
Trump’s desire to grab the mechanics of our government and become a dictator is not new; both scholars and journalists have called it out since the early years of his administration. What is new here is the willingness of so-called establishment Republicans to support this authoritarian power grab.
Behind this initiative is “Project 2025,” a coalition of more than 65 right-wing organizations putting in place personnel and policies to recommend not just to Trump, but to any Republican who may win in 2024. Project 2025 is led by the Heritage Foundation, once considered a conservative think tank, that helped to lead the Reagan revolution.
A piece by Alexander Bolton in The Hill today said that Republican senators are “worried” by the MAGAs, but they have been notably silent in public at a time when every elected leader should be speaking out against this plot. Their silence suggests they are on board with it, as Trump apparently hoped to establish.
The party appears to have fully embraced the antidemocratic ideology advanced by authoritarian leaders like Russia’s president Vladimir Putin and Hungary’s prime minister Viktor Orbán, who argue that the post–World War II era, in which democracy seemed to triumph, is over. They claim that the tenets of democracy—equality before the law, free speech, academic freedom, a market-based economy, immigration, and so on—weaken a nation by destroying a “traditional” society based in patriarchy and Christianity.
Instead of democracy, they have called for “illiberal” or “Christian” democracy, which uses the government to enforce their beliefs in a Christian, patriarchal order. What that looks like has a clear blueprint in the actions of Florida governor Ron DeSantis, who has gathered extraordinary power into his own hands in the state and used that power to mirror Orbán’s destruction of democracy.
DeSantis has pushed through laws that ban abortion after six weeks, before most people know they’re pregnant; banned classroom instruction on sexual orientation and gender identity (the “Don’t Say Gay” law); prevented recognition of transgender individuals; made it easier to sentence someone to death; allowed people to carry guns without training or permits; banned colleges and businesses from conversations about race; exerted control over state universities; made it harder for his opponents to vote, and tried to punish Disney World for speaking out against the Don’t Say Gay law. After rounding up migrants and sending them to other states, DeSantis recently has called for using “deadly force” on migrants crossing unlawfully.
Because all the institutions of our democracy are designed to support the tenets of democracy, right-wingers claim those institutions are weaponized against them. House Republicans are running hearings designed to prove that the Federal Bureau of Investigation and the Department of Justice are both “weaponized” against Republicans. It doesn’t matter that they don’t seem to have any evidence of bias: the very fact that those institutions support democracy mean they support a system that right-wing Republicans see as hostile.
“Our current executive branch,” Trump loyalist John McEntee, who is in charge of planning to pack the government with Trump loyalists, told the New York Times reporters, “was conceived of by liberals for the purpose of promulgating liberal policies. There is no way to make the existing structure function in a conservative manner. It’s not enough to get the personnel right. What’s necessary is a complete system overhaul.”
It has taken decades for the modern-day Republican Party to get to a place where it rejects democracy. The roots of that rejection lie all the way back in the 1930s, when Democrats under Franklin Delano Roosevelt embraced a government that regulated business, provided a basic social safety net, and promoted infrastructure. That system ushered in a period from 1933 to 1981 that economists call the “Great Compression,” when disparities of income and wealth were significantly reduced, especially after the government also began to protect civil rights.
Members of both parties embraced this modern government in this period, and Americans still like what it accomplished. But businessmen who hated regulation joined with racists who hated federal protection of civil rights and traditionalists who opposed women’s rights and set out to destroy that government.
In West Palm Beach, Florida, last weekend, at the Turning Points Action Conference, Representative Marjorie Taylor Greene (R-GA) compared President Biden’s Build Back Better plan to President Lyndon Baines Johnson’s Great Society programs, which invested in “education, medical care, urban problems, rural poverty, transportation, Medicare, Medicaid, food stamps, and welfare, the Office of Economic Opportunity, and big labor and labor unions.” She noted that under Biden, the U.S. has made “the largest public investment in social infrastructure and environmental programs, that is actually finishing what FDR started, that LBJ expanded on, and Joe Biden is attempting to complete.”
Well, yeah.
Greene incorrectly called this program “socialism,” which in fact means government ownership of production, as opposed to the government’s provision of benefits people cannot provide individually, a concept first put into practice in the United States by Abraham Lincoln and later expanded by leadership in both parties. The administration has stood firmly behind the idea—shared by LBJ and FDR, and also by Republicans Lincoln, Theodore Roosevelt, and Dwight Eisenhower, among others—that investing in programs that enable working people to prosper is the best way to strengthen the economy.
Certainly, Greene’s speech didn’t seem to be the “gotcha” that she apparently hoped. A March 2023 poll by independent health policy pollster KFF, for example, found that 80% of Americans like Social Security, 81% like Medicare, and 76% like Medicaid, a large majority of members of all political parties.
The White House Twitter account retweeted a clip of Greene’s speech, writing: “Caught us. President Biden is working to make life easier for hardworking families.”
—
OFM
A truly scary scenario. Possibly one step away from a dictatorship.
Yes, this story has been all over the news, except for Fox, of course. Trump is making it no secret what he intends to do if elected. He is promising to do exactly what Mussolini did. The problem is that all the Trumpites are so stupid they think that is a good thing.
“purging all but Trump loyalists from the U.S. intelligence agencies, the State Department, and the Defense Department.”
How’s that supposed to work; any ya’ll ever work for the feds?
The story has the rhythm of daytime TV. Qtard boomers ain’t getting off the couch. January 6 was the high-water mark.
Hey Survivalist, That is what Trump said he would do. And yes, he has worked for the feds. He was once the Head Fed. Of course, it is a stupid idea. But Trump is just that stupid. So don’t criticize us; that is the “ya’ll” of this list like we thought it up.
Please try to understand the source of a story before insinuating someone is stupid for suggesting it. First, try to find out who the original suggestor was.
But hey, Mussolini pulled it off. Perhaps Trump would not be able to be as successful as he was. But I am sure he would try if we jus gave him a chance by electing him again.
@Ron – agreed. I would say Trump’s general laziness and lack of ideological commitment (beyond just letting standard right-wing notions prevail) have been the two things holding back a more serious authoritarian turn. But if you impeach and convict someone enough it might just light a fire under them. The Jack Smith indictments have raised the stakes a bit. As the saying goes, “You come at the King you best not miss”.
It’s not a stupid idea if you want a dictator and let’s face it. The Republican party no longer believes in democracy. It’s a very dangerous idea for those of us who believe that democracy and freedom as the best means of government and leadership. Survivalist most likely is still trying to figure out what third party to vote for.
Little of this is surprising if your not part of the cult and been paying attention. It really shouldn’t have been placed on the oil side, but I’m glad he did as a wake up call.
“not a stupid idea if you want a dictator and let’s face it. The Republican party no longer believes in democracy.”
I think you have hit on the most important point…which hopefully still a question up for grabs.
I do think they are heavily flirting with idea of autocracy, rather than democracy, whether conscious and intentionally or not. Or else they would have never voted for someone like trump.
Hickory, yourself and Mac would have been the first two here that I would have named who understand what the US is facing.
Sixteen electors in Michigan charged for falsifying the election for Trump. What next, burning book ? Already done, check. The Huntington Beach city council already on it along with Desantis.
Kudos to Liz Cheney, she has the biggest balls in the Republican party.
Ron/Survivalist
This may be the wrong thread but here is deeper insight on T. This is the scary part.
“Taylor fears Trump could use secret powers known by national security officials as “the doomsday book” to manipulate elections and satisfy his authoritarian impulses.
https://www.theguardian.com/books/2023/jul/18/miles-taylor-whistleblower-trump-biden-interview
All – Those who care to make a guess:
What’s WTI trading at in January 2024? Make it the date of January 19th, 2024 to match up with the USO option date…
My guess is $106.99 (WTI), my hypothetical trade is to sell 2 $90 Put contracts of USO at $21.75 each (net credit of $4,350). Note that adjusted for inflation, $107 WTI in 2024 would equal ~$76 in 2009.
I think price may spike a bit higher ~120-140, but settle near 100…
Maybe we should get to update our previous guesses too? Not sure where that thread is…think most of us were $80 plus/minus $10…
New posts are up
https://peakoilbarrel.com/opec-update-july-2023/
and
https://peakoilbarrel.com/open-thread-non-petroleum-july-19-2023/