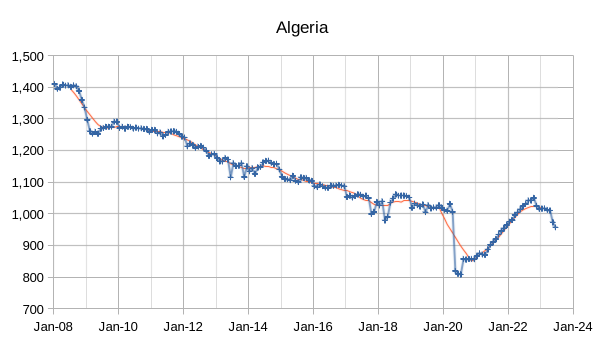
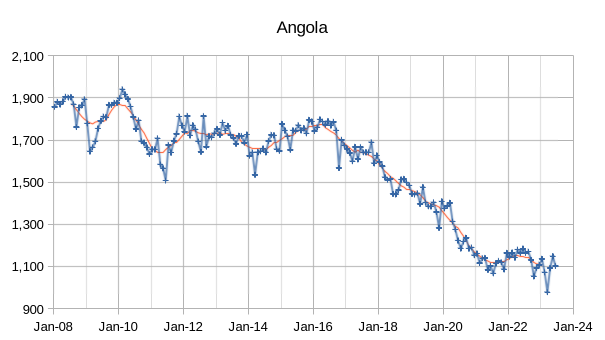
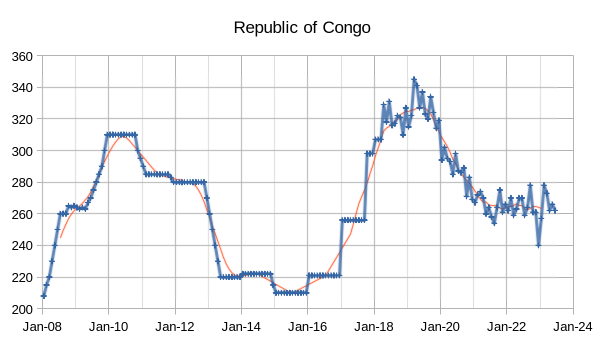
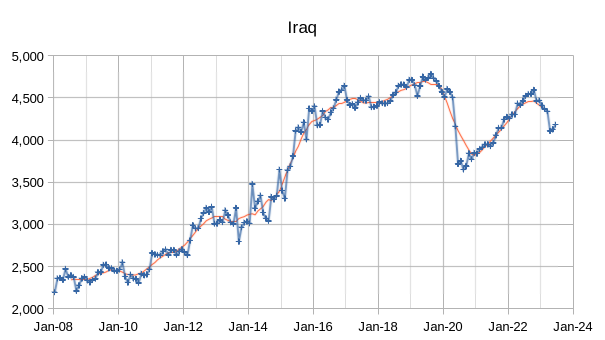
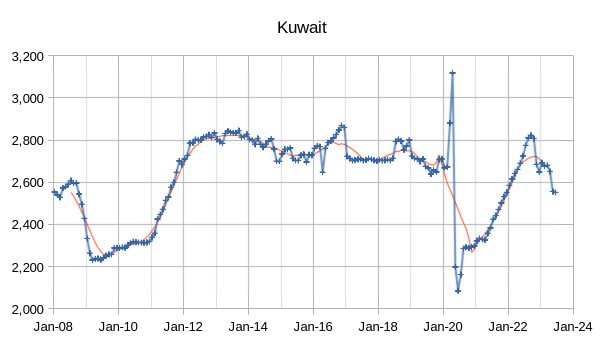
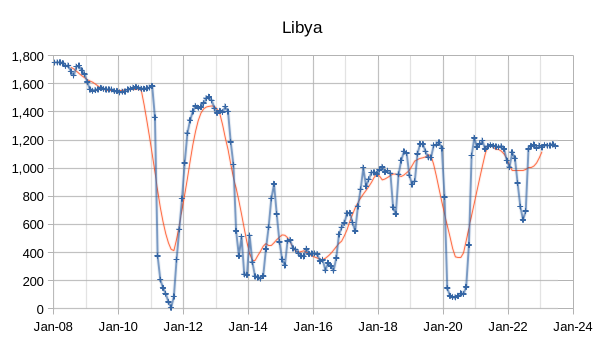
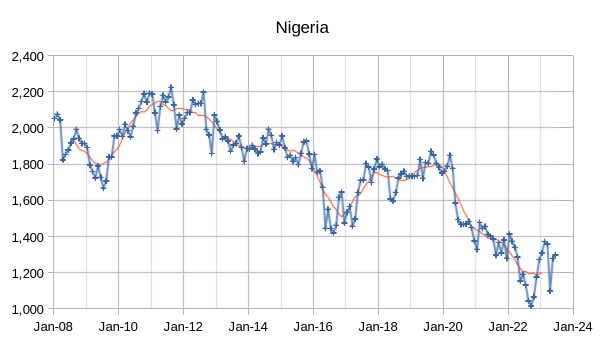
The OPEC Monthly Oil Market Report (MOMR) for July 2023 was published recently. The last month reported in most of the OPEC charts that follow is June 2023 and output reported for OPEC nations is crude oil output in thousands of barrels per day (kb/d). In many of the OPEC charts that follow the blue line with markers is monthly output and the thin red line is the centered twelve month average (CTMA) output.
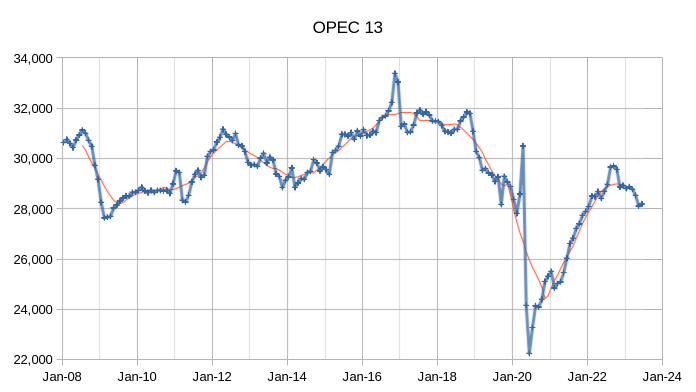
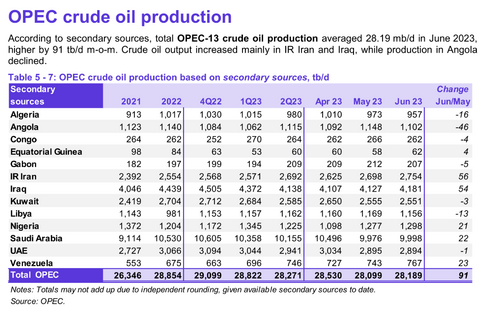
OPEC crude output was revised higher in May 2023 by 34 kb/d compared to last month’s report and April 2023 OPEC crude output was revised higher by 1 kb/d. When the World was at its CTMA peak for C+C output in 2018, OPEC crude output was about 31300 kb/d and by June 2023 OPEC crude output had fallen to roughly 3110 kb/d below that 12 month average peak in 2018.
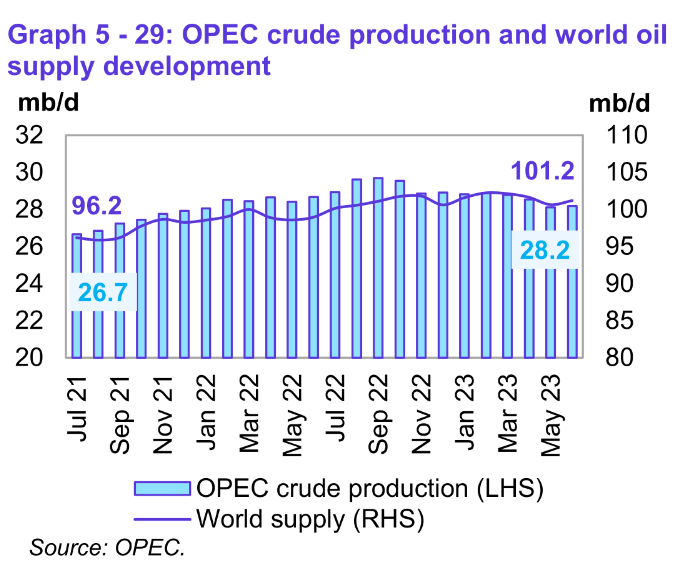
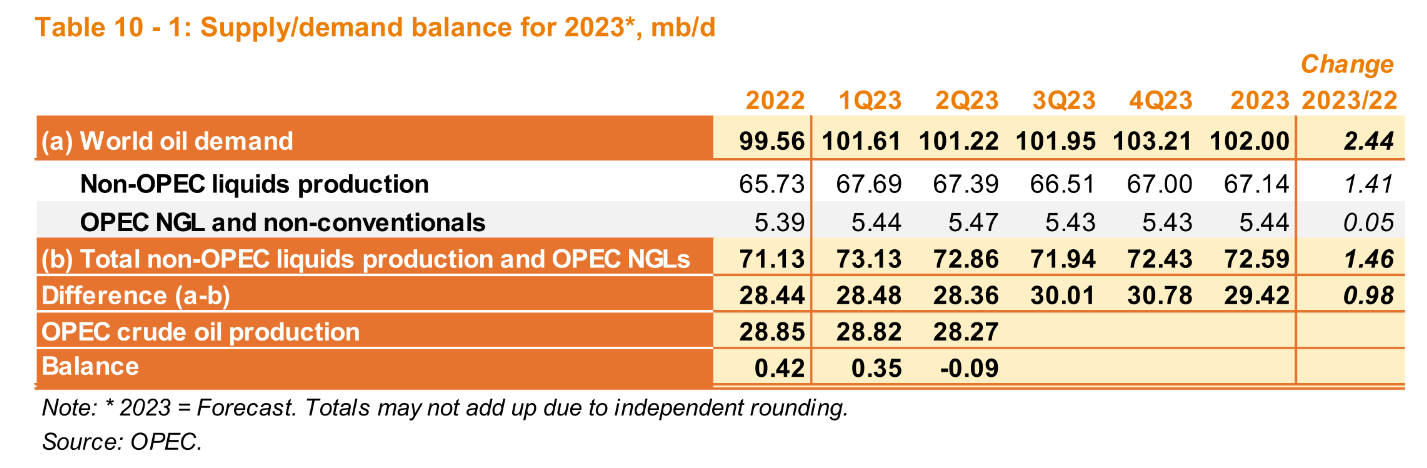
Preliminary data indicates that global liquids production in June increased by 0.6 mb/d to average
101.2 mb/d compared with the previous month. World liquids output increased about 4 Mb/d in the past 24 months (from 96.2 Mb/d in July 2023).
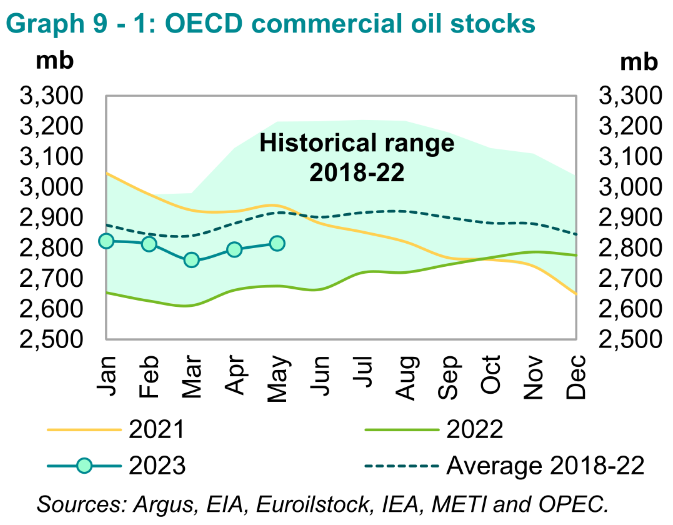
OECD stocks increased in May 2023 by 20.2 Mb and were 101 Mb below the 5 year average. Through May 2023 the World oil market looks fairly balanced with OECD stocks slowly rising. Looking at OPEC’s estimates for future supply and demand and considering recent OPEC quotas, it looks like the World Oil Market will be tight the second half of 2023 and in 2024,I if OPEC quotas are not raised at the end of 2023.
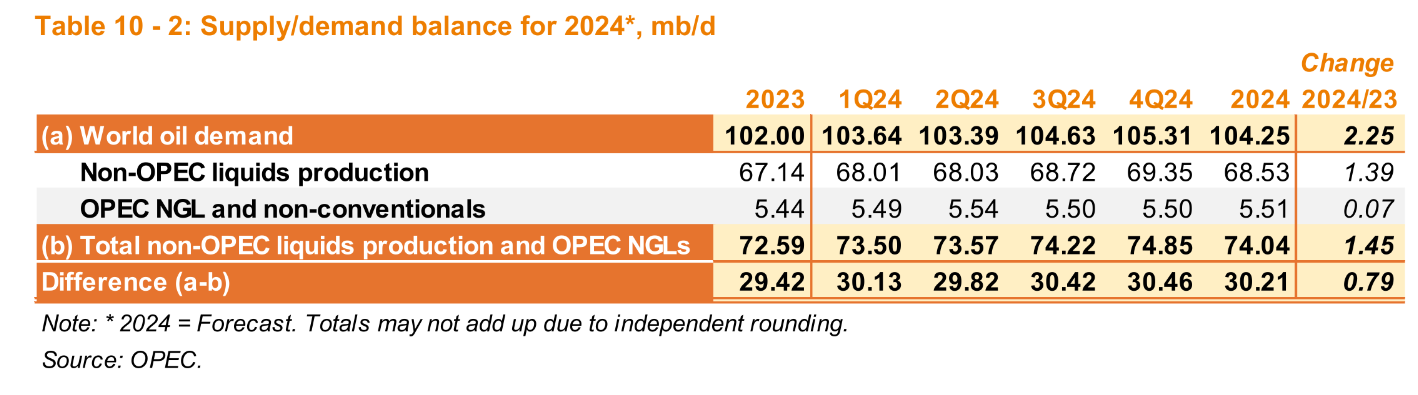
If the OPEC estimates for World demand and non-OPEC supply in 2024 are correct, OPEC may struggle to meet the call on OPEC in 2024, we will find out how much of the claimed OPEC “spare capacity” is real.
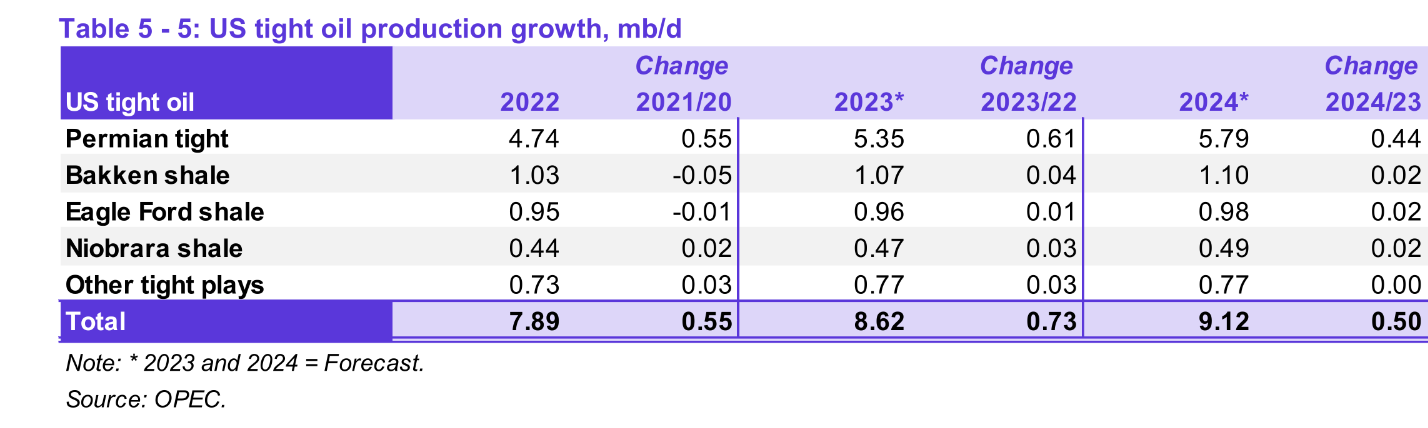
OPEC expects US tight oil output to increase by 730 kb/d in 2023 compared to 2022 (annual average output) with 610 kb/d from increased Permian basin output. In 2024 OPEC projects an increase in annual average US tight oil output of 500 kb/d with 440 kb/d coming from the Permian basin.
My best guess model has Permian basin average annual output increasing by 564 kb/d in 2023 compared to 2022 average annual output and in 2024 average annual output increases by 251 kb/d.
A spreadsheet with a Permian Model can be downloaded at this link, there are several scenarios included that can be shown by changing row 3 in the “output” sheet with one of the other scenarios in the “wells per month” sheet, any scenario can be created, though best to leave Jan 2022 to March 2023 as they are and change wells per month from April 2023 to September 2032, no wells can be added after that date (due to the number of rows in the spreadsheet, 129 rows). Three scenarios are presented below.
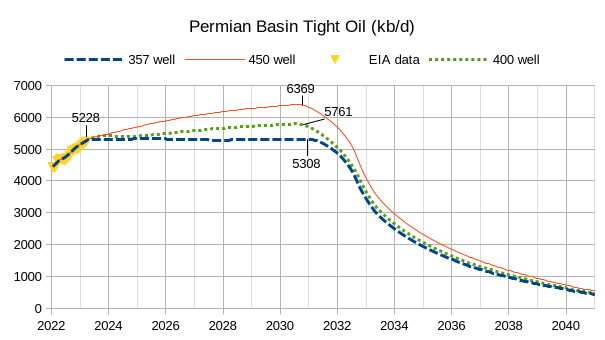
My best guess scenario is the 450 well per month scenario (URR=37 Gb), though my python program allows me to use a longer tail so that URR is 40 Gb for my best guess. The 400 well scenario has a URR of 35 Gb and the 357 well scenario has a URR of 33 Gb. The decline rate from Jan 2033 to December 2042 is about 25% per year for the 450 well scenario. Also the average annual rate of increase for the 450 well scenario from Jan 2024 to December 2029 is about 145 kb/d, a relatively conservative rate of increase.
The EIA’s Drilling Productivity Report (DPR) has Permian basin output levelling off from April 2023 to August 2023, the 357 and 400 well scenarios are both consistent with that projection, but we need to have the completion rate fall faster than suggested by the DPR in order to create a matching scenario.
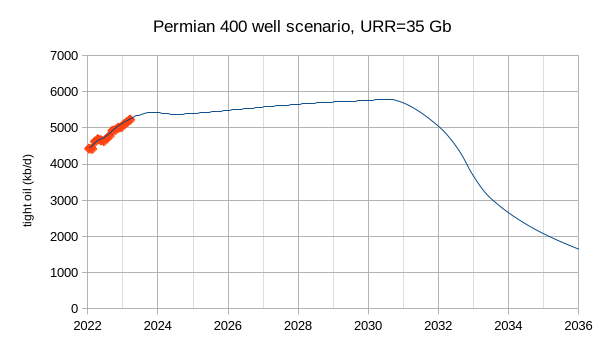
Below I show the 400 well scenario, note that the URR of this scenario is similar to the G &R blog estimate of about 34 G.
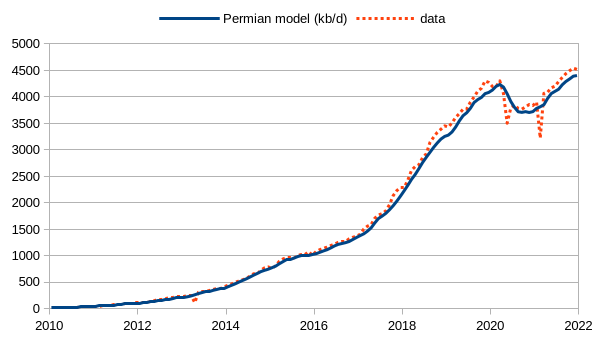
Note that it is possible that my model is incorrect, though it matches historical Permian data quite well from January 2010 to December 2021 with a correlation coefficient of 0.9982 over that period between data and model. See chart below.
282 responses to “OPEC Update, July 2023”
Thanks for the update and work Dennis.
Schinzy,
My pleasure.
As always, a good job by Dennis and the crew.
Some notes/questions: wasn´t Iraq thought to be extracting 12 kbpd by now? (old question, I know but still wondering what happened)
And Libya, quite a rollercoaster there, I wonder what happened there…
I have a slightly revised 400 well scenario below for the Permian basin. For the 357 well Permian scenario, (unchanged from post) the completion rate falls to 387 wells per month by December 2024 and the implied horizontal oil rig count in the Permian basin would be about 290 rigs (the June 2023 Horizontal Oil rig count in the Permian basin was about 325 rigs.) On the chart below, I show the DPR tight oil forecast for April 2023 to August 2023, the last five “EIA data” points (this forecast is likely to be to low in my opinion.)
test
Dennis… or anyone. My 13 year old isn’t here to help… why do I get this error message when trying to post:
Oops! That page can’t be found.
It looks like nothing was found at this location. Maybe try one of the links below or a search?
If you added an image more than 50 kb I believe that’s the result…
(resave the image either as png or jpeg, that’s how I get the image to the correct size limit…)
Kengeo is right. You can also try a gif which is sometimes the smallest image.
On e way to reduce size is to copy the image into a spreadsheet and then resave in another format, in the process you can sometimes reduce the size of the image (width and height are reduced to reduce number of pixels) eventually you can get the image size to less than 55 kB, which is the limit for the program I chose for adding images to comments. Unfortunately I don’t have the skills to change the size limit. I have tried and failed.
Thanks Dennis –
Out of curiosity, what scenario allows a straight line plot from current level of 5.3 mb/d to ~2.5 mb/d in ~2034?
This works out to a decline rate of 6.5%….which I believe matches Laherrere’s recent work (June 2023)…
If a ~10 year plateau were to happen, what is the mechanism for this? I thought it was fairly well understood that once a shale basin peaks there’s a fairly rapid decline?
Per Laherrere:
“the main reason for a sharp decline is the shale play displays a strong decline after few years and needs as the
Red Queen (keeping running to stay at the same place) to keep drilling: it is the EIA forecast AEO2022, which forecasts the O&G production peak beyond 2050 = completely unrealistic”
By definition, if there’s no where left to drill shouldn’t we expect steep decline at an average rate of 15-20%?
So there are 3 scenarios:
-Plateau with no additional growth -likely unrealistic (Red Queen)
-Average decline of 6-7% (some new wells are put in but can’t overcome the ~20% background decline rates).
Extreme decline of 15-20% (few new wells are put in due to limited area to drill).
I believe we are now seeing the roll over in real time, so plateau doesn’t seem like an option anymore…
Kengeo,
You assume the Permian has peaked, I do not. Let’s use the G & R estimate of 34 Gb and your standard assumption of peak at 50% of URR, that would be 17 Gb. A scenario can be created that meets this, but there is no reason it must be correct, Peak would be 2026 in that case. Note however that the G&R scenario assuming 35 Gb URR is likely wrong and 42 to 44 Gb is more likely for Permian URR.
As to whether we see decline, I have been predicting decline for 11 years, eventually it will happen, my best guess is around 2030.
There is plenty of area left to drill. The scenarios I present utilize less than half of the prospective net acres identified by the USGS for the 450 well scenario it is about 23 of 50 million acres, currently about 25% of the prospective area has been utilized. The scenarios presented result in the output shown.
I would suggest you download the spreadsheet and create your own scenarios. The one below has average annual decline rate at 9.6% from July 2025 to June 2030, about 33% of prospective net acres identified by the USGS mean TRR estimate is utilized in this scenario which has a very low likelihood (less than 1% probability) of being higher than actual output over the period covered. The URR of the scenario is 27 Gb (7 Gb less than the very conservative G & R estimate, note that Laherrere’s estimates for tight oil are not very good).
To get the kind of decline you are looking for you will have to play with different completion rate models.
In any case to get the scenario you are looking for you need to see decreasing completion rates, not all that likely unless we see a crash in oil and natural gas prices.
Dennis . good work , appreciated . Now your post above ” there are several areas left to drill ” . Where ? On the moon ? Permian is a pin cushion . Are the areas left to drill economical ? I will leave it there .
Hole in head,
There were about 50 million prospective net acres as of Dec 2015, about 11 million of these acres have been utilized for wells, roughly 20% of the total, I only consider the best 30 million acres as viable (profitable to develop at current prices) so about a third of this high productivity area has been developed leaving about 19 million acres, plus another 20 million of less productive areas.
Dennis . ” prospective ” ?? The whole planet is prospective . Try prospecting in Sahara . If all is prospective in the Permian then why have Tier 1, Tier 2 , Tier 3 differentiation ? See my post . The question I asked was ” Are the areas left to drill economical ? ” . Answer , ?? No , Amigo .
Dennis, I have been thinking of your prospective Permian acres number of 50,000,000. Is that surface acres, or multi zone acres in the proven shale fairways?
I often see the Permian as estimated to be 48-50,000,000 acres in surface area (250 miles X 300 Miles), but this number includes “dead Counties”, like Knox, Brewster, Coke, Kent, Stonewall, etc… and also includes the Central Basin Platform Counties which are out of the shale basins. These counties are really not contributing much to the shale growth (although there are some interesting things going on here and there).
To be focused on the shale production responsible for most of the recent and current growth, the area can be reduced to all or portions of about 16 Texas Counties and 2 New Mexico Counties. Below is a simple table showing these counties with an eyeball estimate of the percentage of each county in a shale basin and another estimate of how many proven zones are present in each area.
This is a conceptual work in progress… the proven zones number needs more research, but it’s a best guess for a quick look.
The way I see it, the productive shale acres in the Permian are more like the following:
*8,035,069 Acres if only one productive zone
*16,047,873 Acres when recognizing the estimated multi-productive zones
Kind of random thoughts… just wanted your opinion for your models.
Gungagalonga,
That is the acres in each of the benches evaluated by the USGS. If we consider only the most productive of the benches the 50 million acres is reduced to about 30 million acres. This excludes the benches already developed at the time of the various USGS assessments in 2016 (Midland Wolfcamp), 2017(Spraberry), and 2018 (Delaware Wolfcamp and Bonespring).
Dennis, I reworked some of the county acreage numbers and zone potential and feel more confident, but still working on it. I come up with 22,900,972 total shale basin acres now. Not terribly far from your 30,000,000.
Interestingly, when I back that number into your 290 acres per well tract, I get 78,969 total wells to be drilled, not far from your total well estimate. It also gets close to your estimate of 11,000,000 acres that have been developed… mine shows 11,194,290.
I will need to filter non shale play Hz wells out a bit better and maybe tweak the acreage per well tract county by county and zone by zone if some are tighter/looser on spacing than others. Not sure how useful this is, but it implies we are likely almost 50% developed in the core shale basins on known plays.
Word Press won’t let me post the Table now, not sure why. Will try again later. Thx
Ooops, meant 8,035,069 with a single zone and 20,846,003 with multi zone completions.
New table below.
Thanks Gunga for separating the wheat from the chaff .
Gungagalonga,
If your estimate is accurate, my average well requires about 290 acres per well at 10 thousand feet lateral spaced at 1320 feet between laterals and this would allow about 72400 total wells. There are many areas that have 4 productive zones in the core counties, Lea and Eddy have areas where the second and third Bonespring and Wolfcamp A and B are productive for example. Some areas of the core Midland Basin have Upper and Lower Spraberry and Wolfcamp A and B, so you might be underestimating total multizone acreage or I might be overestimating. Generally the USGS F95 estimates have proven to be a good minimum estimate and for the Permian that is 44 Gb which is fairly close to my best guess estimate of 42 Gb. I think the G & R estimate of 34 Gb is likely too low and your 21 million acre estimate is also low by about 9 million acres.
Gungagalonga,
Mr Shellman often mentions 660 foot spacing. If I used that instead of 1320 foot spacing, then your 21 million acre estimate, with about 150 acres per well, would give room for about 140 thousand wells.
My scenarios are around 100 thousand total wells.
Dennis, I agree. We are reasonably close from different perspectives/methodology.
I could play with adding additional zones to four in some areas, as you suggested earlier. Certain areas may warrant that… Others, like Glasscock have more potential in certain parts of the county vs. other parts, so it’s a blend approach. Glasscock, has more potential on the west half than the east half… but Vital (Laredo) is now cheerleading the Wolfcamp D on their East Glasscock acreage. A fun work in progress, but may not contribute much.
What I was originally attempting to clarify is that the big Permian Basin region the USGS outlines in their data sets is more of a political map than a geologic map focused on the highly productive shale zones. The USGS Permian map outline is too broad and often follows exact county lines which inflates the Permian size much greater than it should be for shale basin focused work.
Thanks Gungagalonga,
I am not familiar enough with the granular data on a well by well basis to create the kind of chart that you did, nor am I able to assess its accuracy. On the USGS assessments, I exclude the less productive net acres (about 40% of total area assessed) and would note that the 2013 USGS assessment of the North Dakota Bakken Three Forks has the F95 TRR (95% probability that TRR is larger) at a similar level to the G & R estimate of the URR (roughly 9 Gb). The lead author for the 2013 Bakken assessment was the same person who did the 3 Permian Basin assessments in 2016, 2017, and 2018, my guess is that the methodology would tend to get better with time rather than worse (as there was more data available with time). The Permian F95 TRR estimate is about 44 Gb, my 42 Gb scenario requires about 27 million net acres, if the wells are spaced at 1320 feet on average (95 thousand wells at 290 acres per well, average lateral length assumed to be 10 thousand feet).
Table for comment below… or above (gees!)… my 13 year old is cackling at me right now….:::
Dennis, I reworked some of the county acreage numbers and zone potential and feel more confident, but still working on it. I come up with 22,900,972 total shale basin acres now. Not terribly far from your 30,000,000.
Interestingly, when I back that number into your 290 acres per well tract, I get 78,969 total wells to be drilled, not far from your total well estimate. It also gets close to your estimate of 11,000,000 acres that have been developed… mine shows 11,194,290.
I will need to filter non shale play Hz wells out a bit better and maybe tweak the acreage per well tract county by county and zone by zone if some are tighter/looser on spacing than others. Not sure how useful this is, but it implies we are likely almost 50% developed in the core shale basins on known plays.
table now…
Gungagalonga,
Awesome work, thanks!
Note that for already developed wells from 2010 to 2020, you might want to estimate the lateral length as gradually increasing from about 5000 to 10000 feet so at 1320 foot spacing (Mr. Shellman often mentions 660 foot spacing in core areas) the acres per well would be 145 acres in 2010, 160 in 2011, …, 275 in 2019, and 290 in 2020.
Basically if you use 290 acres per well for all completed wells, you might overestimate acres already utilized, also if most wells are spaced at 660 feet (Mr. Shellman obviously knows more than me about this) the acres per well would be halved for any given lateral length. The 1320 foot spacing was suggested as optimal by LTO Survivor who also knows much more than me, perhaps reality is average spacing of 990 feet (or 220 acres for a 10 thousand foot lateral well). A better number would be 1056 foot spacing as this allows 5 wells per section width and would be 242 acres per well.
If we use the 242 acre per well guess for wells spaced at 1056 feet and your 23 million acre estimate, we get about 95 thousand total wells. This would be conservative as many of the already developed wells had shorter laterals from 2016 to 2019 so the average acres per well for the 37.5 thousand wells already completed over the Jan 2016 to April 2023, might be more like 220 acres per well on average which would utilize about 8.25 million acres, the 4500 wells completed before 2016 would have been perhaps 5000 foot laterals on average which would be 121 acres per well, so about half a million acres for a total of 8.75 million acres. Based on your estimate of about 23 million acres, that would leave about 14.25 million acres left to be developed. At 242.4 acres per well that would allow about 58.8 thousand more wells to be completed for a total of roughly 101 thousand wells (this assumes 1056 foot spacing between wells or 5 wells per section width).
I would note that for Lea and Eddy Counties that there are 4 zones to be developed (2nd and Third Bonespring and Wolfcamp A and B). The expectation is that there might be quite a bit of Delaware area that might be developed.
Consider the following chart at link below for Delaware basin counties in your list.
https://public.tableau.com/shared/HZP2NSGZF?:toolbar=n&:display_count=n&:origin=viz_share_link&:embed=y
Of 20608 wells completed as of Jan 2023, 7233 were Wolfcamp A, 2006 were Wolfcamp A (XY), 2160 were Wolfcamp B, 2596 were Second bonespring, and 1552 were Third Bonespring, also there is a Second Bonespring Lime with 267 wells, and a Third Bonespring Lime with 642 wells. So perhaps 5 formations in Delaware counties if we lump Bonespring lime formations with the Bonespring formations and add the Wolfcamp A (XY) formation, to the 4 formations I originally mentioned.
Since 2020 most of the wells completed in the Delaware basin have been in New Mexico.
@kengeo
Can there be extreme decline even more than 20%, I mean there is a human psychology component to it, we have seen it during the COVID19 decline,
per this report:
https://blog.gorozen.com/blog/the-permian-basin
>We now believe the basin could peak within the next twelve months. The implications will be as profound as when United States oil production peaked in 1970, starting a chain of events ultimately sending prices up five-fold over ten years. If we are correct, this could not come at a worse time for oil markets: inventories are tight, production in the rest of the world is declining, and investors are incredibly complacent.
So the report expects a crisis like that, with a low SPR reserve. If that crisis is worse than COVID19 on the economy thus demand.
Svaya,
As I have pointed out before G & R made a mistake in their analysis and have cumulative Permian output at 14 Gb, in fact it is about 10.7 Gb, the anaysis is flawed.
will they issue a correction?
Svaya.
No idea. But you can check by adding up output at the EIA, note that one has to use the tight oil estimate by play rather than the DPR which includes conventional output aling with tight oil output.
The correct cumulative US tight oil output is 10.7 Gb from Jan 2000 to April 2023.
SVAYA, the R&G analysis of the Permian Basin has been well received by many; a discrepancy of 3.3 G BO in Permian HZ cummprod since 2014 is likely a difference in time frames, or definitions, or whatever; it means nothing. R&G used Novi Labs extensively; you decide for yourself who is the best source of information, actual State regulatory agencies, which Novi relies on, or the Energy Inaccuracy Agency that is notoriously wrong about most everything.
In any case a difference in cummprod does NOT make R&G’s analysis “flawed.” Mr. Coyne is worried about his models; in case you haven’t noticed, EVERYBODY is always wrong about everything. Except him. It has become an American pastime now that if one does not agree with the an opinion, attack the ‘opinionator,’ and the more the dung heap, the better.
3.3 G BO, by the way, is two (2) years of Permian tight oil exports. If 3.3 G BO was discovered in the North Sea, off West Africa or Brazil, it would be a BIG deal. In the US it’s nothing. We’ve got boatloads of the stuff and free trade with close allies like China, is vital to our national security. Hell, this administrations allows the sale of oil from our SPR to China, while at the same time trying to pick a fight with them over Taiwan !
3.3 G BO is peanuts. It represents half of US total C/ C consumption every year, but so what ! Its un-American not to give all of our shit away.
Mike – Leave poor Dennis alone, he’s grasping at straws afterall…
Svaya,
Perhaps 3.3 Gb doesn’t matter to Mr Shellman, I agree the analysis is good, except the 14 Gb cumulative production estimate. They use that to get to 50% of their URR (17 Gb) by 2024, (note at about 5.2 Mb/d we have annual output of 1.9 Gb per year), so 3.3 Gb os about 1.5 years of current Permian output, in one case we reach peak in 1.5 years and with a correct estimate of cumulative output we reach that peak in 3 years, if the 34 Gb URR estimate is correct. I also use Novi Labs data and reach a different conclusion, I think the G & R URR estimate may be 7 to 8 Gb too low, if I am correct the peak would be at about 20 Gb cumulative output which at current levels of output would be 9.3 Gb down the road or about 9.3/1.9=4.9 years in the future (or roughly 2028).
Time will tell if the G & R estimate of a 2024 peak in the Permian is correct. The major producers CEOs suggest a peak of 2029 or 2030 for Permian basin output, which coincides with my estimate, they may also be wrong we will see how things play out.
Mike,
The analysis may be perfect, but certainly the cumulative output from the Permian is not 14 Gb, so they are wrong by 31%, a pretty big error.
Aside from this they might be eaxctly right.
Svaya –
With these models, my assumption is that they are the most likely result, in theory all production could fall to zero tomorrow for a variety of very unlikely reasons (meteor, nuke, etc.). I think reality is too difficult to model but will look like a stair case down from current levels to 50 mb/d sometime near 2050, it appears that regardless of the URR this is a shared value that all models have in common. Using the KISS principle, peak was ~2016 for conventional oil and we can expect downward trajectory, not flat, and certainly not growing… minimum decline rates for next 25 years will be 4% plus or minus 2%, shedding at least 1 mb/d annually for the foreseeable future.
The bigger problem/threat is the global economy/monetary policy&system, without these the oil goes nowhere…
“The bigger problem/threat is the global economy/monetary policy&system, without these the oil goes nowhere ” —- Kengeo
I have long maintained that before we see lines at the petrol pumps we will see an economic collapse and lines at the food banks . Money ( currency) is a lien on energy . Energy is the economy . Once the energy declines so will the economic/financial system . It is inevitable . Suggested reading Dimitry Orlov’s ” Five stages of collapse ” . Where are we today ? The financial system is now firing all guns just to avoid a collapse but in the process it has no resources to stop the decline in prosperity ( growth ) . However under our current debt based system ” The end of growth , is the beginning of collapse ” .
“Energy is the economy” No. Useful work is the economy, not energy. Free market determines what is useful work. This is why Soviet Union collapsed. They had lots of energy, but little useful work, because there was no free market to determine what is useful work.
Whatever , useful work ?? Who will define that ? Difficult to say . Is making ghost cities useful work ? Making defense equipment which will expire before even it is used ,useful work ?Is making aircraft carriers that never sail (USS Gerald Ford ) and planes that never fly (F-35) useful work ? Making roads to no where (Japan) useful work ? I don’t know . The better word is ” misallocation of resources ( energy ) ” . The problem is that we could afford this “misallocation ” when we had nett surplus energy , now we can’t . This applies to all , no exceptions .
Yeah HOLE IN HEAD, once one realizes that the current system requires forever debt increases, with the limit being infinity, one realizes it was always just a matter of time before it had to implode without the resources to support it . Allot of empty office space around where I work since the great plague of 2019, so think that GFC-2.0 is already here, just the deciders are waiting for something to pull the plug.
Peakaboo , GFC 2.0 is here . The fish rots from the head down and crisis moves from the periphery to the centre . The periphery is already there . One of my favorite teacher is David Korowicz who coined the term ” Synchronized System failure ” . The start is commercial real estate specifically office ,warehousing and industrial . This is from Tokyo-Shanghai- Brussels- London- New York- SF . Is this the trigger ? Don’t know . Too many ” black swans ‘ flying right now . Starting from CC to nuclear confrontation .
https://wolfstreet.com/2023/07/11/third-wave-of-hotel-cre-defaults-has-started-triggered-by-cmbs-maturities-and-variable-rate-mortgages/
CRE is a $ 800 billion time bomb . This is only in USA .
https://seekingalpha.com/article/4618810-commercial-real-estate-the-new-potential-subprime
I don’t write the news , just report it .
Something like $1 trillion in CRE mortgages come due in next 12-18 months. They’ll all have to be rolled over at interest rates that are twice as high. The underlying collateral doesn’t support the valuations anymore. Most of these loans are no recourse loans and will be walked away from. Leaving banks a pile of shit to deal with.
Inflation isn’t going to be a problem. However deflationary recession will be.
Anyone wanting to be long oil needs to wait till after the storm passes.
“I don’t write the news , just report it .”
People used to say “I saw it on TV so it must be true”
Takes some judgement and skill at filtering opinion, falsehoods and political bias from “news”, if you expect people to give some respect in a discussion.
Kengeo,
Expert analysis by Hook and others suggest 2 to 5% decline rates with larger areas (such as the World) tending toward the lower estimate.
See section 4 d of paper linked below
https://royalsocietypublishing.org/doi/10.1098/rsta.2012.0448
Svaya,
Tight oil output may decline at 25 to 30% in the 2030 to 2040 time frame, but World output is unlikely to decline by more than 3.5%/year in any decade before 2070, unless we see demand for oil crash as the World transitions to electric land transport. I doubt the transition will lead to demand falling by more than 3.5% per year unless self driving cars become widely adopted in perhaps 10 or 15 years (assuming the problems of this technology are solved).
Dennis.
In the last thread, the participation cost is calculated as AFE times GWI percentage.
I think I made a mistake. $8.916 million for 37% GWI would be $24.1 million. So about $12 million per well.
Shallow sand,
What is AFE? I assume GWI is gross working interest. Thanks for the information. I believe Mr Shellman has mentioned average well costs around 12 million per well, so this makes more sense. I was looking for an explanation for why it was not 12 million as I expected. Obviously I don’t understand this stuff as well as you do.
So it seems you are doing 8.9/0.37=24/2=12, is that right?
Thanks for this information.
Authorization for expenditure. The operator sends to other working interest owners before drilling begins.
Shallow sand,
So AFE is essentially CAPEX?
It’s defined as an estimate of a proposed operation such as drilling, completing, equipping or plugging a well. The operator sends it to the other WI owners and usually requires partial prepayment.
Yes, regarding most expenses they will be CAPEX. LOE consists of ordinary expenses incurred in operating a producing well, such as power, labor, down hole chemicals and minor repairs.
Shallow sand,
For a new well (or wells) that is/are being drilled/fracked/completed, would it be fairly safe to say that AFE for the project is approximately equal to the CAPEX for the wells and associated equipment (pads, holding tanks, gathering lines to bring the product to the tanks, etc).?
With regards to the Permian, it will be completely drilled out, in my opinion. Through freshwater scarcity, horrible saltwater overload, godawful perversion of the air, it will be completely drilled out. And I imagine your curves will be pretty close, Dennis. At this point in time the AFE (Authorization for Expenditure) is $12M per well. In other words, this estimate of the amount needed to stake, drill, frack, and connect a well is sent to the various prospective owners. Eventually the dreaded cash call will go out; they have to pony up and hope for the best. That’s getting harder to do, sober at least.
At some point, unless a replacement feedstock for the massive petrochemical industry if found, and all the billions of ICE vehicles are replaced, the price of this inelastic commodity called crude oil will achieve its rightful perch. After all, it takes at least a million years at just the right pressure and temperature for nature to produce a barrel of it–this ain’t some fancy cuppa coffee selling at highway robbery prices.
At that point, or maybe sooner, the beautiful waxy crude of the Uinta Basin will come unto its own. Beautiful because it has nearly the ideal API gravity of 35-40, is almost free of sulfur and metals. Other places that were passed over in the Gold Rush for the Permian will be looked at anew. With names like the Buda Shale, the Hogshooter, the high-country Piceance on the other side of the Douglas Arch from the Uinta. Many places will make a small contribution.
At about the same time the pre-salts could make a big contribution. Millions of years ago there was a supercontinent named (after the fact) Gondwana. The same thing that caused a massive salt layer to form–the perfect oil trap–also brought about a massive rifting, and under each continental shelf of Africa and Brazil lies this bounty. If you drop a drill bit through a mile or two of seawater, then drill through the dense sedimentary rock of the post-salt, you’ll eventually come to this thick rind of complex salt capable of changing chemistries and plugging the borehole. Under that is the pre-salt oil in ideal form. Some of those wells produce 60,000 bopd.
I believe that if you visit this forum in ten years the names and numbers would astound you. In ten years there will be a worldwide ban on coal, quality oil will be highly valued, LNG will be a mature enterprise, and Occidental, Exxon and Chevron will be making the bulk of their money from carbon capture. After an expensive experiment with wind and solar, nuclear will be generating most of the serious electricity. I may look into cryogenic preservation, so I can wake up and look around.
New nukes in 10 years? impossible! There is no mechanism whatsoever to have nuclear ‘generating most of the serious electricity’ within 20 years. 10 years isn’t enough to decide on a design, much less find ground, permit ground, and break ground.
BTW, you’ll produce millions of tons of CO2 before your very first kWh of juice.
However, in 2 weeks I can put new solar production on line. You will be out Billions of dollars in the first few years of going nuclear, while decades away from a single kWh. All the parts you need for solar electricity can be delivered in a week. Your nuclear fantasy does not even exist, and has no capacity to do so.
“However, in 2 weeks I can put new solar production on line”
Do you install solar for your work? Surfing and home installations/repairs seem to go hand in hand. You can take off work when the surf is right.
“Your nuclear fantasy does not even exist, and has no capacity to do so. ”
No capacity to do so is bullshit. It most certainly has the capacity.
And we definitely could of pulled it off with thoughtful planning ( especially Thorium ).
Whether we can do so now is debateable.
But the Chinese and Indians are going for it!!!!!
And don’t forget URGENCY and the red tape getting flushed down the toilet….to Git R Done!!!
As a matter of fact I do install solar, and take off from work when the surf is good. We call it a ‘board meeting’ out in the water.
Last I heard there was 1 (one!) manufacturer globally of containment vessels for nukes. There is not the capacity to open a new nuke every week for the next 30 years. We (USA) haven’t commissioned ONE in the last 30 years. That’s what I mean by no capacity.
What about the fact that money spent on renewables can earn a return in mere months, as opposed to decades for nuclear? Who’s gonna put money up for that??
Andre
Countries like the US and UK are crippled by planning consultations which take years and years.
In China the dictatorship says build 20 nuclear power stations and everyone jumps to it.
https://www.iaea.org/bulletin/how-china-has-become-the-worlds-fastest-expanding-nuclear-power-producer
This is what is possible and China knows you need reliable energy to have an economy where people earn enough to buy houses and food.
At the moment China burns as much coal in a month as the U.K. in 22 years.
They know they have to come up with something better than solar and wind and they are
https://www.energymonitor.ai/sectors/power/weekly-data-chinas-nuclear-pipeline-as-big-as-the-rest-of-the-worlds-combined/
I’m thinking of scenario where the USA realizes its oil supply is dwindling.
And the USA is sitting on the largest Coal reserves in the world.
As soon as people get gas rationing concerns for the environment will disappear..
The “smartest” design is to hook a nuclear reactor ( thorium would be best as there is thorium in the coal )….to a CTL facility
and get your electricity and liquid fuel in one spot.
Kind of like the KFC and Taco Bell dual stores.
Andre
I agree if the US does not start building nuclear power stations as China is then it will have serious blackouts in 10 years time. Natural gas should have been kept for heating homes and cooking only and not wasted inefficiently burnt in power stations.
I think the US will end up like Germany, having lots of wind and solar yet burning more and more coal.
https://www.channel4.com/news/why-is-germany-turning-back-to-coal-for-energy
But the Chinese and Indians are going for it!!!!!
Just for a sense of perspective:
China has about 56 GW total nuclear capacity. The 2016 plan was to have 58 GW by 2020.
Total solar capacity is over 400 GW. In 2022 alone, China installed 87 GW of solar. This year estimates of the total installation range of 100-150 GW. In other words, China will install more than twice as much solar capacity this year as they have nuclear in all history.
The story with wind in China is similar. Total capacity is over 300 GW, more than five times nuclear capacity, and growing very fast. Some estimate that capacity will double by 2026, but we’ll have to wait and see.
As for India, the country has about 70 GW of solar and 7 GW of nuclear.
The other big player in new nuclear is Russia, but the government seems more interested in reliving the good old days of WWII than building the future.
Alimbiquated,
Capacity is less important than output, output or consumption of power from these sources is the important metric.
Deniis,
Capacity is less important than output
I was replying to the remark “But the Chinese and Indians are going for it!!!!!” which I interpreted to mean that in the future a lot of new capacity will come online in those countries.
Alimbiquated,
I am just pointing out that capacity is a poor measure. Output is more useful.
At 2:00am on a calm night in the dead of winter there better be plenty of nuclear plants running. Gerry you expect a very bleak world indeed.
For anyone who is interested in nuclear industry future this is one of the US companies working hard to gain new reactor design approval and contract for installations if all goes well-
https://x-energy.com/update/x-energy-completes-first-joint-regulatory-review-under-cnsc-nrc-memorandum-of-cooperation
https://www.utilitydive.com/news/energy-northwest-x-energy-xe-100-nuclear-small-modular-reactor/688460/
Utility Dive is a great website for keeping up on Electrical/Utility Sector news
https://www.utilitydive.com/
For example, this article posted today about Fervo geothermal is also worthy of watching
https://www.utilitydive.com/news/fervo-energy-enhanced-geothermal-system-google/688620/
From Javier BLas Twiter
Vattenfall will stop the development of a major wind project in the UK after a surge in costs.
The Swedish utility said a wind farm planned in the North Sea, which would provide power for 1.5 million UK homes, is no longer viable after costs for the technology soared 40%.
and
COLUMN: The number of new offshore wind power turbines ordered in Q3 from European manufacturers?
Zero. Nada. Rien. Nichts.
My latest @opinion column on the ‘other’ European energy crisis: one of permitting obstacles, windfall taxes and soaring costs.
https://bloomberg.com/opinion/articles/2022-12-01/onshore-wind-farm-ban-rishi-sunak-needs-to-reverse-course
Now who was it predicting this a few months back… oh yea it was me.
add in
UK Looks To Boost Energy Security With Small Modular Nuclear Reactors
Tyler Durden’s Photo
BY TYLER DURDEN
THURSDAY, JUL 20, 2023 – 02:30 AM
Authored by Tsvetana Paraskova via OilPrice.com,
The UK has launched a competition for small modular reactor technology and created a new nuclear body.
The focus on small nuclear reactors is part of the country’s efforts to produce more zero-emission energy domestically.
As well as backing SMRs, the UK remains committed to traditional nuclear projects including Hinkley Point C and Sizewell C.
This week saw the UK launch a competition for small modular reactor (SMR) technology and created a new nuclear body, Great British Nuclear, in a bid to provide more zero-emission energy from locally-developed sources.
So predicable. It might have been possible to first replace an energy system without a new transpiration system but it is impossible to replace both at the sometime in a singular country much less several at the same time. The demands on existing materials, both in mining as well as transportation and labor are much too restrictive. Nat gas, LNG and coal and in the liberal NE USA, oil will be used, just like always to generate the required electricy until nuclear buildout is complete. Until then nat gas baby will be king, and its good to be the king🤠
In most of the worlds countries, including US, nuclear power will be running hard
just to stay in place over the next 20 years. Sorry to burst the hope bubbles floating around here.
Beyond that its ‘to be determined’.
Meanwhile close to 1/3rd of world electricity generation will come from solar and wind by 2030 or within a couple years after that. And will be growing capacity installation faster and faster.
Coal will still be in play for a long time, although peak is close at hand.
The world will get by with less oil…it doesn’t have a choice.
What does ‘get by’ mean? Unfortunately we will find out the hard way.
Chart -21 years of Global Energy Consumption by source
You are absolutely wrong about solar. But after reading your smug, self assured and generally erroneous comments over the years, I’m not surprised. See my post above as to why you’ve f*cked up so badly regarding your predictions for solar. Nuclear is going to be the only viable option going forward, and both wind and solar will never be anything more than minor power adjuncts in a few markets. Most certainly, neither of them will ever be used for baseline load generation – just go ask the Germans how that is working out for them.
Mike…yes indeed nuclear energy serves as a strong base-load role. Regardless of the aspirations you and others may have, its global contribution to energy supply over the next 20 years will not grow much.
Swimming hard to stay in place.
I’m sorry that the data on these issues puts such a thorn up your backside.
“both wind and solar will never be anything more than minor power adjuncts in a few markets”
This is not 1970 Mike.
Wind and solar are producing 20% of US electricity, higher than the amount of nuclear. Odd thing to say that this is not a significant amount when it is more than the nuclear resource you are advocating for.
https://electrek.co/2022/05/10/us-hits-a-record-20-of-electricity-from-wind-and-solar-in-april/
These intermittent resources are held back by lack of availability of cheap storage. At the current pace of battery development, this issue has a good chance of being resolved by the end of the decade. Sodium, zinc, and other inexpensive batteries that can cycle tens of thousands of times are viable in the laboratory and one of them is very likely to break out at some point.
Also it’s important to note that both renewable and fossil resources are intermittent.
Renewable resources are intermittent in the very short term (days and weeks) but very stable over long periods of time (hundreds and thousands of years). Fossil resources are stable for short timeframes (years and decades) but completely unreliable long term. Nuclear has the capacity to be stable for longer term but is not cost competitive with current models. Hopefully the cost issues and waste issues with nuclear will improve over time but that doesn’t seem to be happening right now.
Hren
Do you understand the cost of an intermittent energy source that it not there when the factories hospitals and shops need it?
The economic destruction of having to shut down manufacturing because there is little wind again this morning and yesterday afternoon.
One country understands that has approved another 20Gw of coal along with 16Gw last year and along with 50 nuclear plants being built or planning
Charles….that same country is building out wind and solar capacity much faster than its building out nuclear.
Charles, indeed I do. That’s why I do not want infrastructure built on an intermittent resource like fossil fuels that will only last another generation or two. I am not anti nuclear but until we start seeing some viable functional reactors I think it’s wiser to go with the alternative that is more promising, and that’s renewables. Of course one doesn’t exclude the other. Can you show me a paper to convince me nuclear is getting anywhere near cost competitive with renewables?
I found this comment on another blog interesting . Copy/paste .
” As a former alps/Norway glacier guide ( late 60’s and early 70’s) I can assure you that the ‘disaster scenario’ scientists you quote have it right on their side.
Whether I sit there eating a bag of popcorn and watch the mountain regions lose their ice and water storage in Europe at breakneck speed with disastrous consequences for really anything and everything is another matter. Perhaps you are in favor of nuclear power and perhaps hydro as well.
In France, nuclear is “the” energy source and hydro still accounts for about 11%. Meanwhile, almost every one has to shut down several nuclear power plants to prevent surface water temperature from rising too much. At the same time, the energy production of hydro plants is declining due to too little precipitation. Doesn’t seem like a win win situation 🙂 Certainly in Europe, nuclear power plants have a curious problem, namely where do they get their fuel from?
Also, the “key question” with nuclear power, and perhaps you know the answer, is until how long will the “oil age” last? Right now, it is assumed that the extractable period might last a few more decades. Isn’t that precisely a reason to switch to nuclear power? I don’t think so:)
Nuclear power from the construction of the plants to the (still not conceived waste storage) is inextricably linked from the first to the last gasp to the availability of let’s call it diesel. Nuclear power plants where France is now going to build another 6 (and upgrade the rest) should last for 80 years. Their demolition then takes another 25 years and the storage cooling of “waste” another…..???? say it.
Add in the 15-year construction phase and surely anyone planning a nuclear power plant, such as the French government, should be able to guarantee that there will be enough ‘diesel’ for at least 110 years! enough “diesel” is available and long after that to keep the “waste” in good working order……. Any child understands that the fossil era will be long gone by then and ‘we’ will be stuck with ‘something’ that you, whether or not eating popcorn, cannot oversee either.
Apparently you see something in the weird SMR thingies….. That’s totally tying the cat to the bacon…. But before that, all new “gadgets” are conveniently marketed until proven otherwise. That goes for wind turbine toys but just as much for nuclear fusion and SMR toys 🙂
The only advantage of windmills is that they only last 25 years and can be used as a landfill. You can’t say that about nuclear waste”
ICE rules .
US total vehicle fleet remains 98% internal combustion engine powered in 2023 as consumers prefer the convenience and energy-density of gasoline and diesel.
Growth in the total fleet means that ICE vehicles rose materially in 2021 + 2022 despite increased EV sales! 🛢💰
Shubam Garg
On the last thread I had reported that VW has cut it’s EV production by 30% , That was Europe . Now in the USA ,
https://mishtalk.com/economics/despite-huge-incentives-supply-of-evs-on-dealer-lots-soars-to-92-days/
Ford was loosing $ 60,000 per vehicle and now they cut their price by $ 10,000 . Guess what we loose in profits we will cover via increased sales is a good strategy .
https://www.teslarati.com/ford-cuts-f-150-lightning-price-nearly-10000/
The reported death of the electric car has been greatly exaggerated…
https://www.weforum.org/agenda/2023/05/electric-vehicles-ev-sales-growth-2022/
Up 55% yoy
A company makes 1 tractor a year and the next year it makes 2 tractors . Up 100% yoy . A company makes 100,000 tractors a year and the next year it makes 110,000 tractors . Up 10% yoy . Where will you invest ? Makes me go –hmmm . Understand the baseline .
HiH
A few years ago the range for most models was around 120 miles and sales were around 2% of the market. Today most electric vehicles can do 250 miles after a full charge and that make all the difference for most people.
Sales of fully electric cars have increased from half a million in 2016 to 7 million in 2022.
That is a very respectable increase in business.
Head in hole,
You show your prejudice with your inane comment. More new investment this year in EV manufacturing than in ICE worldwide.
How long have you been on here preaching imminent economic collapse? That EVs are just a passing fad, etc etc. Every day you wake up wrong again, and start surfing the internet looking for articles to support your bias. Take a deep breath and try to reset your mind.
Does more investment mean ” intelligent ” investment or ” misallocation of resources ” ? There is a lot of investment in wind turbines . Want me to list the companies that loose money in the industry . I have always said the problem with EV’s are ( 1 ) affordability (2) sustainability due to lack of minerals/ metals . I was and am not wrong . We have hit the affordability factor now wait for number two . Can you name me one pure EV manufacturer ( except Tesla) that makes a profit ? Not one , all money looser Rivian , Lucid , Lordsdown , Nikola , Fiskars , NIO . MG want me to continue . If you want I can draw up a list of at least 10 companies (SPAC’s) that went public to manufacture EV’s and went belly up even before they made a prototype . Three years ago there was a thing ( fad) they called it 3 D engineering . How all machine shops will close and all will be 3 D engineering . Housing was going to be cheap because they would be 3D engineered . Mass produced . What happened ? Now the thing ( fad) is AI . Hype is hype and I can sense it . I have no bias ( by your definition all peak oilers are biased ) just early to see the reality behind the curtain . You are free to believe what you want if that comforts you but you can ignore reality only at peril .
Right. I’ve been following this for a long time. At least fifteen years. For a decade it was no way in hell Tesla will ever make money. Now it’s Tesla is the only one that makes money. Guess what? They were first. That’s what happens when you can see a new trend coming down the pipeline and get out in front of everyone.
Building enough infrastructure to build a new type of car takes a long time. 5-10 years apparently. Many will fail. Many will not. But current trends are very clear. China will be 90% EV for new car sales by 2030. Europe by 2032. U.S. 2035-37. Anyone still trying to sell ICE cars will be long gone bankrupt.
Stephen , 15 years ? Myself I don’t know , since inception I would say . This will be my last post in this exchange . The EV market is now a mature market . This is now similar to the browser market . There is Google and then there are Firefox , Duck gogo , Microsoft Edge or is Binge , Yahoo etc . Tesla is the Google the rest Rivian etc are just to pick up the crumbs . Tesla allows them enough breathing space so that it does not face a breakup like Standard oil . You can believe in what comforts you . Not a problem for me .
Disclaimer : My nephew ( sister’s son ) is a top honcho at Rivian . Started his carrier at Boston Consulting Group ( Google it ) . Member of the team that convinced Amazon and Ford to invest in the IPO . I have much more insider info on this industry than I can disclose for jeopardy .
Dennis , still looking for a recession indicator ?
Recession? What recession? 🔥🔥🔥
Federal government tax receipts are plunging.
I found this article on SBL , A lot of info on what they were selling in Russia . Turnover , equipment etc . Also info on Baker Hughes and Halliburton operations in Russia . According to the author Total is still there and will probably plug in the gap . Enjoy this .
https://apnews.com/article/russia-ukraine-oil-slb-baker-hughes-halliburton-6f596774f713dd44d5bd6b7e5011d48a
Dennis
Nice Job. Looks like the Permian has become a hot topic. Hopefully there will be some clarity in about three or four months on whether the Permian is on a plateau or hinting at a dramatic drop in the rate of production increase as shown in one of your projections.
I am trying to rationalize some of the numbers in the OPEC report with what is happening with the price of WTI.
According to the OPEC production table, June crude production was 28.2 Mb/d. According to the demand tables Q3-23 and Q4-23 demand will be 30 Mb/d and 30.8Mb/d respectively. That implies that in Q3 and Q4, the supply deficit will be 1.8 Mb/d and 2.6 Mb/d respectively. Now let’s move into July and August where SA production drops by another 1 Mb/d and the deficits will be 2.8 Mb/d and 3.6 Mb/d respectively.
Here we are in July and you would think with those kind of supply shortages that the price of WTI would be soaring. While WTI is up, it is not dramatic. Makes me think there is something wrong with the supply numbers and also possibly demand.
Attached is a WTI chart showing the price did start to increase at the end of June, possibly anticipating the SA cut. The July 20 price is as of 11:00 EST, not settled.
Ovi,
Thanks.
The OPEC supply and demand forecasts might be wrong. One measure the World pays attention to is OECD stock levels (this is the most transparent measure, but it leaves out a lot of big importers such as India and China). The market may be waiting on movement in OECD stock levels, if the OPEC estimates are correct and OPEC sticks to current quotas and Saudis actually make the cuts in July and August then we will see a large World stock draw and prices might rise.
My guess is the “rollover” that you see in the Permian either is not real or will be temporary, but as you said time will answer this question.
The dramatic drop was a Kengeo projection that is very unlikely (less than 1% probability in my view). It requires a significant drop in the completion rate which seems unlikely.
A Permian scenario with a temporary decrease in completion rate to 400 wells per month and then a gradual increase in completion rate from Jan 2024 to Feb 2026 by 3 wells per month and peaking at 475 wells per month (similar to the current completion rate of 480 wells per month). The completion rate holds steady for 12 months and then decreases by 3 per month until March 2040 when the last well is completed. Total wells completed from Jan 2010 to March 2040 is 99633 wells (about 42 thousand wells have already been completed from Jan 2010 to March 2023). URR is 41.6 Gb, peak occurs in 2027 at 6200 kb/d and at cumulative output of 20.1 Gb (about 48% of URR).
A scenario with fast decline after 2024 below, very low probability scenario 0.5% chance output will be this low or lower. total wells completed from Jan 2010 to Jan 2032 (no wells completed after that date) is 64.7 thousand wells (about 43 thousand wells have been completed from Jan 2010 to April 2023).
Basically this scenario has about 400 wells completed in October 2023 (same as 400 well scenario up to that date) then each month the completion rate decreases by 4 wells. until the rate falls to zero, no more wells are completed after that date.
Several Permian Scenarios with URR from 34 Gb to 45 Gb. Total wells completed from Jan 2010 to March 2040 are:
99633 for 42 Gb URR
81701 for 34 Gb URR
90713 for 38 Gb URR
103206 for 45 Gb URR
Gerry said ” If oil becomes scarce enough, countries will say, “Tsk, tsk, you naughty boy.” And follow that with, “Now where is my load of Urals Blend . ”
If you don’t want us we will find an alternative . Got to have energy .
https://www.swissinfo.ch/eng/business/how-dubai-became–the-new-geneva–for-russian-oil-trade/48672510#:~:text=For%20decades%2C%20the%20lakeside%20city,in%20the%20United%20Arab%20Emirates.
I have for over time said that the two scenarios that keep Washington awake are Iran shutting down the Strait of Hormuz and China invading Taiwan . These will expose the helplessness of Washington .
https://www.zerohedge.com/energy/seized-iranian-oil-stuck-texas-coast-us-companies-afraid-tehrans-retaliation
Iran is not waiting for US sanctions to be lifted . They really don’t even care , They control the strait of Hormuz .
Oil flows will be redirected but never stopped .
“China claims it imported 1.5m b/d of **Malaysian** oil last month. That’s triple the real output of Malaysia. The reality? Iranian oil.
I wrote last week for
@Opinion
about the smoke-and-mirrors of oil sanctions:
Javier Bias
Update on the tanker episode .
https://www.reuters.com/business/energy/iranian-oil-remains-stuck-off-us-coast-shippers-fear-repercussions-2023-07-25/
HiH, sooner or later, you will get realistic. Yes, Iran is smuggling oil out of Iran. They are smuggling a lot of oil. But that has nothing to do with their ability to shut down the Strait of Hormuz. They do not have that ability and will never have that ability. Almost every nation on earth would oppose them if they tried that. And that includes every other oil-producing nation in the Middle East. And that includes Oman, which controls the other side of the Strait of Hormuz. They would ALL assist the US Navy in keeping the strait open. To believe that Iran has the power to overcome every other nation in the area, as well as the US, is just absurd. Damn, HiH, you should know better than that. You should know that Saudi Arabia would go to war with Iran before they would let them shut down their livelihood. And Kuwait, Iraq, and the UAE would gladly help them in such a war.
It is totally not related to that story, but China will not invade Taiwan. They can plainly see what is happening to Russia, and they want no part of that situation. Also, China needs the rest of the world far more than the rest of the world needs China. Putin was too damn stupid to realize that about Russia. Xi Jinping is not nearly as dumb as Putin.
Neither the threat of Iran shutting down the Strait of Hormuz nor China invading Taiwan is keeping Washington awake at night. I think it is perhaps your contempt for the USA that is causing you to contemplate these really absurd situations that you believe are haunting the USA. But keep them coming, HiH. I really enjoy a good laugh now and then. 🤣
HIH completely underestimates the power of a US Carrier fleet.
The USA Navy has the right of way in the Strait of Hormuz.
I think the British and the French patrol in there as well.
If Iran threatened to shut off the Strait.
There would be 3 USA carrier fleets there.
Peter Zeihan suggests that the USA will be pulling out of the region
because the USA no longer needs to import oil.
If that were to occur than that would be bad for people that import oil from that region.
I like Peter, but I think he gets this wrong.
I think he misunderstands USA Shale ( doesn’t know about 80% decline rates, and the problems Mike S has highlighted) in general.
He thinks because there is a large resource it will be produced.
Hi Dennis,
Kengeo might find this interesting too. I have adjusted my model to which i thought may correlate with how things might play out. Bear in mind this is weak analysis at best and probably doesnt equate to the reality we live in. But anyways i created a linear model based on world CplusC growth rate so, if we look at chart of world oil growth rate there seems to be a linear decline, in which we are making lower lows.
Taking this trend I created a specific random number generator based on the trend forecast which basically takes the inputs of mean and standard deviation of the dataset and outputs a random number based on the uniform distribution of the inputs. You’ll get a better idea if you look at the chart.
Here is the same graph and the projection with Hubbert’s method.
Thanks Professer Korpela.
What URR does Hubbert’s Method suggest? This can vary depending upon which years are included in the analysis. Chart below shows a combined conventional oil and unconventional oil Hubbert Model and annual rates of change in output for the combined models (URR=2600).
Here is the average as well as the low and high based on 95% confidence interval.
Decline analysis based on the method of Arps. World C&C.
Seppo –
Something off with this model, 2800 Gb wouldn’t be reached until sometime after 2200…
2500 Gb would be reached in ~2088 and production would be 19 mb/d….
2060 production would only be 35 mb/d and total of 2230 Gb.
2050 production is ~44 mb/d and total is 2088 Gb
2040 production is ~55 mb/d and total is 1909 Gb
I think it’s missing an increase in decline rate, I’d think by the early 2040’s decline rate would shoot up to ~10%. From what I can tell the only way to get lower decline rates for that long is if we were to have a massive 50% drop in production…
I think the point is that even if there’s 2,500 or 3,000 Gb, once decline sets in it’s a relatively steep drop (55 mb/d in 2040 would certainly spell trouble for anyone living…).
Dennis – What’s a more reasonable expectation for when production would get to such a low point there’s not point in counting the minuscule amount being removed.
I asked ChatGPT about decline rates, answer was between 1 and 3%…
The plot based on Arps method eliminates time from the analysis. I do not take much stock in long term predictions by either Hubbert’s method or any other. I am inclined to believe more in the Seneca Cliff as better part of the recoverable oil has been used and the Pareto principle 20% of the effort recovers 80% of the oil and the last 20% will take 80% of the effort, might be rough guide. In any case, I think by 2040 we will have much more important things to worry about than predicting the decline rates of oil.
Kengeo,
Shock Model with annual decline rate (yellow solid line) on right axis and World C plus C output on left axis (red dotted line). URR=2700 Gb. Annual decline rate stabilizes at about 3% per year from 2150 to 2300. Cumulative output in 2080 is about 2510 Gb and in 2150 cumulative output is about 2670 Gb. In 2150 World C plus C output has decreased to 1.65 Mb/d. In 2080 annual decline rate is 3.37% per year.
Here is a graph that shows how the peak year moves forward to the future. The horizontal axis is when the prediction is made and vertical is the calculated peak year. When the graph crosses the diagonal the peak your is in the past.
So taking this linear model which outputs a normal distributed ‘randomly’ generated decline rate based on mean, std of the data and the linear model trend. The model gets a URR ~ 2550 > URR > 2250. An example of which is shown in the chart. So i think the potential for another peak is possible but only within this criteria; 2028 > Ultimate peak > 2024. Otherwise there would not be a new peak based on this model.
Iron Mike,
A better model would use the 1982 to 2019 trend as clearly there was a shift during the 1975 to 1982 period from high growth (of about 7% per year) so slow growth of 1.2% per year. You can do a statistical test to see if there has been a change in the data, I am confident you would find such a structural break in the data around the 1973 to 1982 period.
See
https://en.wikipedia.org/wiki/Structural_break
From an environmental perspective, it would be nice if your model was correct, I am not that optimistic, using the trend from the past 40 years is likely to result in a more realistic model in my view. The decline rate looks pretty realistic at roughly 3% from 2025 to 2055, the URR is in the right ballpark, but my guess is that it is 350 Gb too low for the scenario presented above.
Here is an example of the model making a second peak.
If we use the trend from 1983 to 2019 the result is very different, even using 1974 to 2019 gives a very different result. If we chose 1935 to 1978 (43 years) and compared with 1979 to 2022 (43 years), it would be interesting to see the results. The later period might not result in any decline before 2050.
But what would be your reason to do a linear regression from 1983 ? We are talking about a variable which is CplusC production. From start to now, why start from 1983 ?
It is clearly obvious the growth rate of oil yoy is declining over time, so is world real GDP by the way. For me the hypothesis for this is declining EROI. It is taking more and more energy to grow less and less. Like a drug addict building tolerance. That is what i see from this analysis.
But again this is just my speculation.
Iron Mike,
Consider the following chart where I show the average rate of growth from 1935 to 1978 (44 years) and from 1979 to 2022 (44 years). For the earlier period the average rate of growth was 6.7% per year and for the later period the rate of growth was 1% per year. Clearly there was a structural difference between these two periods, a Chow test can be used to confirm that there is a significant statistical difference, but it is rather obvious from looking at the chart.
I agree there is a difference but obviously on a physical level something changed to cause the shift. I cannot ignore that because statistics says so. Looking at that chart one can make a hypothesis that the next shift would make a plateau.
Iron Mike,
The shift was to higher prices around 1974 to 1979 as OPEC started to assert its power over World oil supply. Higher oil prices led to a lower growth rate in oil demand.
This is pretty well known and the reason for the change in growth rate, the statisics just substantiate the hypothesis.
Dennis,
That’s true, and the price was more stable too. Oil prices began returning to lows in 1986-1999 (barring the spike during desert storm) before the prices began to increase again. How would you account for that ? Why didn’t the trend return to pre 1974 levels ? Population growth rate declining ?
Iron Mike,
You need to look at real oil prices (adjusted for inflation).
From 1986 to 1999 prices were lower than from 1980 to 1984, but not like they were from 1955 to 1972. The average oil price from 1955 to 1972 in 2022$ was $17.61/b, from 1986 to 1999 the average price of oil in 2022$ was $37.75/b, more than twice the price of the earlier period. From 1973 to 1979 the World was adjusting to the Oil Price Shock of 1973-4, after this cars and trucks became more fuel efficient, much less oil was used to produce electricity and generally oil was conserved due to higher oil prices. I can remember we turned the thermostat to lower temperatures in winter after 1972 as my parents house used oil for heating. I am fairly sure we were not alone.
Iron Mike,
From 1986 to 1999 there was a surge in Non-OPEC output as Alaska, North Sea, and other projects came online in response to the high oil prices from 1979 to 1985, it takes some time to bring such projects online. In addition the War between Iran and Iraq from 1980 to 1984 ended and some OPEC output that had been offline due to the war came back online. OPEC tried to regain its market share and oversupplied the market driving oil prices down, but the World had become more efficient in its use of oil, cars an trucks got better fuel economy, oil was no longer used much for electricity production and many homeowners switched heating to natural gas as it was cheaper. In addition real oil prices (adjusted for inflation) remained about 2 times higher on average during this “low price” period (1986-1999) compared to 1955 to 1973. The structural economic adjustment that occurred during the 1975 to 1985 period when oil prices were relatively high would have still resulted in low demand for oil even if oil prices had fallen back to pre-1974 levels, though supply might have been lower as some of the high price oil projects may not have been developed under a lower oil price scenario.
The World’s response to climate change might lead to another structural shift (to electric transport) where oil demand falls and drives oil supply lower as oil prices fall.
Iron Mike,
Actually we are using less and less energy to grow GDP over time, the reverse of what you speculate.
Chart below shows Real GDP per unit of primary energy is rising over time.
Dennis,
Sorry i meant world gdp growth rate. The linear regression decline rate correlates with oil decline rate. See the chart. One discrepancy is I could only get real GDP growth rate from 1961. But there is a downward trend.
My speculation is this is an EROI issue.
Iron Mike,
No it is a population issue, just look at real GDP per capita. Also it is a development issue, less developed nations grow faster than more developed nations. So there will be a tendency for GDP growth to fall.
Chart below has real GDP per capita 1975-2022, steady at 1.6%.
Dennis, I cannot make sense of your legend inside that chart. That is, f(x) = some really strange number.
Anyway, is that number, 1.6%, adjusted for inflation?
Dennis,
I don’t understand, where did i mention population ? I am purely looking at world GDP growth rate y-o-y. I dont want to look at GDP or GDP per capita, because none of those metrics include debt or inequality, which is generally ignored by economists.
GDP is a faulty metric. I can buy a house knock it down and rebuild the exact same house and it will add to GDP. For example the mere expansion of debt to deforest a whole area adds to GDP.
I am purely looking at the growth rate. Which has a downward trend even in a largely expansionary debt world.
Again my speculation is EROI. More debt -> More energy -> downward trend in GDP growth rate.
Ron.
That is an exponential function see
https://en.wikipedia.org/wiki/Exponential_function
Yes real GDP is by definition adjusted for inflation, in this case it is constant 2015 US$.
Iron Mike,
So you think real GDP does not matter but the growth rate of real GDP does matter? That’s a head scratcher.
You didn’t mention population, I am explaining the well known fact that GDP (which is basically income) grows with population.
On debt at the World level, unless there is interplanetary lending, for every load there is a creditor and a debtor, the total is a wash.
Not as important as many believe, except when financial markets seize up as durin the GFC, then a lack of lending is a problem and can lead to lower GDP as projects are unable to move forward, workers get laid off, but fewer goods due to lower income, leading to further contraction of the economy. How do we measure this?
I use GDP. When you knock down a house and then rebuild a newer house, generally one uses bricks or wood, some concrete, etc, workers are hired to do the construction, all of this leads to economic activity. Wars also lead to increases in GDP as in World War 2 and the creation of ships, planes, tanks, and other weapons led to increased economic activity, this actually ended the Great Depression in the US. After the War ended there was a post war boom in Europe as the continent rebuilt after all the destruction.
Likewise GDP growth rate depends in part on population growth.
Population growth rates have been falling since about 1965 and this reduces real GDP growth rates.
You said World GDP growth rate, as population grows GDP grows, if the rate of population growth falls (as it has been doing since 1965) then the rate of GDP growth also falls. In order to account for this we use GDP per capita. I agree GDP is a flawed metric as is EROI. If we want to measure something we use data, GDP is the measure we have. There are not very good measures of inequality at the World level.
If you dont like GDP, why did you bring up GDP growth?
If we fit and exponential function to GDP we get the average growth rate of real GDP.
Trends in growth rates of GDP probably just measures changes in the growth rate of population.
We can speculate about EROI, it is very poorly measured.
If we look at energy use per unit of GDP produced it has decreased over time (since 1965).
Perhaps at point of use, efficiencies in the system have led to increasing EROI.
Dennis,
I see so you’re saying because the population growth rate is declining so is the GDP growth rate. Yea i see that makes sense to me.
I got to think more on it but that’s a satisfactory explanation for the GDP growth rate linear regression. I’ll do more research on this to see the correlations.
R^2 of the correlation between CplusC growth rate and GDP growth rate is ~75%. Which is expected. So there is definitely a relation as well to energy. I’ll do some further inverstigation.
Iron Mike and Dennis –
The oil is/was there for the taking, it’s a supply (infrastructure) and demand (insufficient) issue, that’s why growth was slow from 1980 to present. If supply and demand were high enough, the peak would have been in 1998 instead at ~125 mb/d (almost 50% higher).
Cumulative production under this hypothetical scenario would have been 1,115 Gb meaning a estimated URR of ~2,230 Gb (note that 2P reserves currently stand at 2,000 Gb). We were able to stretch out production of 1,115 Gb all the way to 2010, at that point shale oil came to the rescue but also made it trickier to understand what’s going on. Once decline had set in, post 2,000 data points, it’s now clear.
For these reasons it may not be useful looking at data from ~1980-2000, and should also exclude unconventional oil. By reaching a 50% lower production level, we were able to increase the amount of time before decline (50%, stretched to ~30 years instead of 20 years).
Kengeo,
One can use your belief that peak occurs at cumulative output of 50% of URR and the conventional peak in 2016 at cumulative output of 1273 Gb to gat a conventional URR of 2546 Gb, this roughly coincides with an HL using data from 2008 to 2019 (URR about 2500 Gb). Chart below shows decline rates for a Hubbert model for conventional oil.
World Energy Consumption per unit of real GDP produced 1965-2022. Note the change in slope after 1979.
“Actually we are using less and less energy to grow GDP over time”
In part this is because GDP includes all sorts of ‘unreal’ items that don’t require as much as energy as ‘real’ components of GDP. And these unreal components have grown in proportion of the total over the past 4-5 decades.
Examples of ‘real’ components of GDP-
agricultural production, energy production, lumber, minerals, vehicles, appliances, all sorts of manufactured commercial and industrial goods, housing, physical infrastructure,
Examples of ‘unreal’ components of GDP-
advertising, legal proceedings, political campaigns, fashion, entertainment, sports, financial transactions, gaming, gambling,
Too bad we don’t have a good and widely used measure of ‘economic activity that matters’.
We also could use an indicator of destructive economic activities vs constructive.
Destructive- explosion of ammunition (of any size), combustion of energy supplies, frivolous use of equipment or energy, etc
Constructive- building of essential infrastructure or energy production capacity, the growing of food or fiber, manufacture of tools, insulation of buildings, etc
Hickory,
Luckily we don’t have dictators deciding what is useful and what is not, it is up to individuals to make those choices. Well regulated market capitalism is not a perfect system, just the best devised by humans so far in my opinion.
Who decides what is important? We do as a society.
I hear ya, just saying that we have a marginally useful indicator [GDP] when it comes to the physical existence of humanity, and the health of the sustaining economy.
Hickory,
I agree there is a lot that goes into GDP that seems unimportant and very important stuff is often excluded, such as a parent or spouse preparing a meal at or a parent caring for their child at home or a child caring for their parent at home. The choice of what is useful and what is not varies from person to person.
conventional field recovery seems to exploit thin oils first and thick oils later. As a result such things as Saudi importing Russian oil may be more they need thin oils (they no longer have) to recover thicker oils (they do have). If true then the oil dependency is a ever tightening loop of nations who’s interests are divergent.
Iron Mike – That’s fantastic, I plotted your model decline on a figure comparing different assessment methods (2P vc 2PC vs visual est.). Yours is right between a visual fit and decline based on 2P reserves (results in a URR of ~1500 + 500 = 2,000) , and I believe your decline rate is ~2.3%.
Add this to a bag full of multiple lines of evidence that peak global oil production occured 5-6 years ago and big declines are on the horizon…
I think we’ll be able to confirm this all within 6 months or less, likely oil price will sky rocket and there will be no excuse for the decline in production…
Kengeo,
Thanks, I am hoping you are right and we will know soon whether the decline would be inevitable or not. I am on the fence and honestly have no idea if any of these scenarios will even be remotely correct or not.
Here’s Iron Mike’s data thru 2030:
Year MB/D Change
2023 80.3 –
2024 78.5 -1.8
2025 76.7 -1.8
2026 74.9 -1.8
2027 73.2 -1.7
2028 71.5 -1.7
2029 69.9 -1.6
2030 68.2 -1.7
Interesting, Iron Mike’s work matches Laherrere’s almost exactly…
Some interesting analysis/discussion by Dennis and Hole in Head from ~15 months ago:
https://peakoilbarrel.com/decline-in-world-conventional-oil-output-and-peak-oil/
Looking at Dennis’ shock model then, (2,800 Gb), I would argue all of his scenarios essentially land at the same point:
*Peak is in the past (~2016 for conventional and a combined total peak in ~2018/2019)
*50 mb/d or less by 2050, this results in a decline rate of 2% plus or minus ~0.2%, or 1.8% to 2.2%.
By definition, the midpoint being 2016 and conventional cumulative production being ~1,250 at that point means that URR is equal to 2,500 Gb.
We can start to paint a worse case conventional oil scenario as follows:
End of 2023 there’s less than 1,000 Gb of conventional oil left, at best, unconventional oil can account for ~10-15 mb/d, at decline rates between 1.5% to 3%, production is cut in half by 2050 plus/minus five years. Production is down from current level by more than 10 mb/d in less than 10 years…
I don’t think there’s an argument any longer for tight oil growth to offset conventional oil declines, so any hope of a plateau for the next 7-10 years seems very unrealistic.
Dennis – I think the major issue with your model currently is it doesn’t factor conventional oil decline rate of ~2%, loss of ~1 mb/d annually.
HOLE IN HEAD
04/28/2022 at 8:28 am
Iron Mike , all of projections made by Mr Coyne are inaccurate . So here goes :
1. Conventional oil peak 2016
2. C+C peak 2018
4 . US peak 2019
This will not change and I don’t care what Dennis , Mckinsey or a Tom , Dick and Harry says .
Why ?
1. All reserves reported by OPEC ( main source of conventional ) are bullshit crap . Only some one with an IQ=0 believes those figures .
2. Conventional oil cannot/ will not grow because there have been very few ECONOMICAL discoveries onshore in the last 10 years .
3 . It takes 10 years from discovery to pumping and 8 years from FID( First Investment Decision ) . None were made .
4. Dennis does not make any space for decline rates and how / what will replace this . Sorry Dennis LTO is not a replacement .
5. He makes no space for geo political shifts . As total energy flows decline conflicts will increase . Libya , Sudan, Nigeria will be the new normal .
6. He makes no space for a financial meltdown which is a WIP ( Work In Progress) ‘ OPM is already declined .
7. He makes no space for a ” Black Swan ” . How about an unintended Houthi drone hitting Ran Tura ? How about events get so bad ( whatsoever the reason , Shia vs Sunni , JCPOA fails etc) and the Strait of Hormuz is shut off .?
All his estimates are ” if ” and ” but ” and nothing imperfect happens . His talk about EV’s has been shattered by Matt Mushalik’s post . Sorry Mike , we don’t live in a perfect world . S*** happens .
You can come to your own conclusions . The unravelling has began .
Last something about Mckinsey and the ” Big Three ” . My son and daughter in law are in the top posts at E&Y . He tells me that most of the companies they provide consultancy are in such awe of their reputation that they never question what they write about . They make reports ( I have seen many ) with ” if ” and ” but ” caveats etc that they cannot be held accountable . Anyway he says 95% of the reports provided to the customers are in file 13 ( wastepaper basket ) . This is from the horses mouth . Take care and be well .
Kengeo,
Conventional output is not likely to decline as quickly as you foresee, Chart below compares a Hubbert model for conventional oil with the Shock model (which matches EIA data through 2022), the Hubbert model has a URR of 2473 Gb and the Shock Model has a URR of 2503 Gb. Cumulative output for the two models is 1603 Gb in 2029.
Pay attention to how badly a Hubbert curve follows actual World conventional output from 1965 to 1990, this is also true for the period from 1935 to 1965 not shown on chart. So for those who might complain that the shock model does not match the Hubbert curve from 2023 to 2060, the question I would ask is why would they have that expectation when the Hubbert curve never predicts output accurately as shown by history. Note that the Hubbert curve and my Shock model are both very unlikely to predict future output accurately and also that in the past my best guess scenarios have been too low about 90% of the time.
Another conventional model
Dennis’ 2022 shock model mentioned above:
Kengeo,
This model is from 2012. At the time I threw out the 2795 Gb High Model as being unrealistic. See
http://oilpeakclimate.blogspot.com/2012/07/further-modeling-for-world-crude-plus.html
The only change with this chart from the original post is the addition of updated EIA data through 2021.
We will see what happens in time, conventional output is low lately due to cuts in OPEC plus output.
My model is quite conservative at around 2680 Gb compared to Laherrere’s estimate of 3500 Gb.
Dennis – Of course it is, and we will see…
In the meantime, this is a qualitative/semi-quantitative check on peak production of the 10 key regions that produce oil:
As you can see, top 3 regions peaked 2016-2019 at 56 mb/d and currently producing ~50 mb/d.
All the other regions are essentially flat/no change in similar timeframe (except the Misc – Europe-Argentina-Australia). If Misc is grouped with the top 3, then we have an average date of ~2013 at 67 mb/d, currently only ~56 mb/d. This large group of 4 regions/areas is declining at ~1.8% annually.
The projections shown below assume similar rates of decline as past (1.5-2.0%), I think there is evidence to support this not being the case and that this projection is too conservative, I think a decline rate that Iron Mike identified above (~2.3%) is more realistic…my guess is we will see a minimum decline rate of 1.6% next year, likely increasing at 0.1% annually for 5-6 years.
Lastly, I would argue that your model is not at all conservative, if it were, you’d model 70% of your URR, 90%, and 95%. That is ~1,900 Gb, 2,400 Gb, and 2,550 Gb. Doing so would allow you to best fit the data to each scenario…
Kengeo, your chart looks good. Did you generate it, or did you get it from somewhere else? Either way, I think it just might be spot on. You must have put a lot of thought and effort into this. Thanks. It is far better than anything I might have come up with.
Ron – Thanks, I looked at the most recent posts on here (Dennis – 19 July and Ovi – 12 July), then I filled in the gaps using Statistical Review (former BP spreadsheet). It’s quasi-quantitative, but really just a qualitative line-of-evidence. See my post below, I think we can look at changes in decline rate to get an idea of where things are headed…
And it’s amusing to see that I agree with the Dennis of 10 years ago! I could see how he has built too many assumptions and that’s what is likely throwing off his models…HIH comment from 2022 is valid.
I also agree with HIH on all the negative economic indicators…my best guess is that the economy is running on Post-Pandemic reopening fumes but there will be a reckoning in 1-2 quarters, possibly associated with a massive oil price shock…how else will demand destruction happen?
Can’t say for a lot of places, but you are wrong on Canada. Canada has been constrained by export pipeline capacity. In the next year they get another 600k barrels of capacity, and they will fill it over the next 2 or 3 years. All the producers, large and small have plans to grow output. From both oil sands and conventional production. There are plenty of reserves available. So plan on Canada growing 200k bbls a day for each of the next 3 years.
I seem to recall Canada peaking in a few years at about 1/2 a million more a day than it’s doing right now. As well, Canadians are an energy hungry lot. I’m curious of an ELM type analysis on Canada. When do their exports dry up?
There used to be a guy, RockyMtnGuy who posted on The Oil Drum who I believed worked in the Alberta Tar Sands.
He made a comment that always stuck with me.
He said something to the effect
“Unlike conventional oil it is certain that the Tar Sands are there, no guessing about it”
If there is a will there is away and I bet all options will be on the table to get that out of there and make tons of money.
Not sure on their peak but they don’t care much for oil apparently…
KenGeo…look at it on a per capita basis, then you will understand the situation he was talking about [“Canadians are an energy hungry lot. “]
Not clear US has peaked in terms of 12 month average output, I expect a new peak in 2023 or 2024 at the latest with a final peak in 2027 or 2028.
It could be that Russia and OPEC have peaked, but they may be able to maintain a plateau for 5 to 7 years, we will see increased output from Canada, Brazil, Norway, Guyana, and Argentina and perhaps Iran, Iraq, UAE, and Saudi Arabia from current levels. The decline that some expect to occur in the next few years is unlikely unless we see a severe World recession in the next 5 years, I think that unlikely as well.
Dennis –
Take a look at Ron’s figure from June, you will notice that world decline rates are between 0.7% and ~3%, with the average at ~1.5%…by now we’d be well above 83 mb/d if a new peak were forming, it’s not and that’s it, decline from here on out…(credit to Ron for using his figure to plot various decline rates).
Kengeo,
There is both conventional and nonconventional oil. I focus on 12 month average output, so decline should be referenced from the red one in Ron’s chart. As is clear from the chart, World output is rising not fallng, this is because conventional output is rising. Chart below has decline rates for 2 Hubbert models (one for conventional oil and another for unconventional oil) combined for total World output.
Shock model and Hubbert models (convent and unconvent) compared.
Looks like the models Ace used to post on the oil drum 2006-08. Wherever we are, then an immediate cliff. Not gonna happen, too many varied oil resources to ever contract more than half a percent a year for the foreseeable future.
Stephen Hren,
We will see, my expectation is that demand will fall after 2032 or so as the World transitions to electric transport. I assume self driving robotaxis never become widely approved or profitable, if this assumption is incorrect the transition accelerates as the miles driven by ICEV fleet can be replaced about 4 times faster as people move to robotaxis and opt to reduce car ownership.
In short my scenario is conservative on the speed of the transition to electric land transport, the steepness of the oil consumption curve, if robotaxis are widely adopted, may be far steeper than my scenario which has an average decline rate of 2.9% from 2032 to 2050.
” The decline that some expect to occur in the next few years is unlikely unless we see a severe World recession in the next 5 years, I think that unlikely as well.”
In five years the medicare and medicaid expense for the USA will be 3.4 trillion at the current 9% growth rate per year.
Anyone without insurance will go bankrupt if they have to go to the hospital unless they are super wealthy.
Either that, or the US Government collapses the medical industry to start over.
A severe recession is baked into the cake in the USA and that will have global repercussions.
And the USA must reign in deficit spending to halt inflation or risk
civil unrest with Congress and the Fed being the targets.
I know you disagree with that Dennis, which is fine.
Those ideas are based on my readings of Karl Denninger
https://market-ticker.org/akcs-www?blog=Market-Ticker
Andre the Giant,
US inflation is coming down, I base my thinking in part on the analysis of Paul Krugman.
Denninger is not one I follow, he seems to be a clown.
“Denninger is not one I follow, he seems to be a clown”
Denninger is a Peak Oil and Climate Change denier. Those ideas are bizarre and clownish. His ideas on CTL in the USA may very well come to be however.
Karl is not a dumb guy. He just has some blind spots IMO.
Cognitive Dissonance.
I think it is clear a 9% per year growth rate in medical expenses cant continue. And this claim is supported by the evidence.
The key with Karl is to focus on his strengths.
to each his own.
Andre,
I agree 9% growth in medical expenses cannot continue, so it won’t. Lots of developed nations have a national healthcare system which controls costs, perhaps the clowns in the US will realize this at some point. We could also have higher tax rates especially on the wealthy, Perhaps Karl has strengths, or these may be imagined.
MSCnet was one of the first internet companies. And Karl was CEO and founder.
He sold it and now doesn’t have to work and sits around blogging all day.
He also founded the Tea Party, which he later abandoned because it had been hijacked by Nut Jobs. To his credit.
The Tea Party in the USA was originally based on fiscal responsibility. And the Rule of Law
It than got taken over by idiots who wanted guns to shoot homosexuals. Which is ridiculous.
Karl left it and denounced it. Where do you see that integrity in our current politics?
Again, I don’t like a lot of Karl’s ideas. I focus on his strengths.
Karl is on the correct team. He is a patriot. He just has some blind spots ( a birther ). But I’ll take him over the average citizen or republican.
We all have our strengths and weaknesses.
I hope people remember my few strengths instead of my “lots of weaknesses”.
Again, I respect your opinion Dennis and thanks for providing this platform.
Andre the Giant,
I am not familiar with all his work, perhaps he has some nuggets of wisdom sprinkled with the crazy stuff. In my view successful business people are not as smart as they believe themselves to be.
I stopped listening to Karl when he became a birther. He claimed Obama’s birth certificate was a fake because it was typed on a pre-printed form, and everything lined up perfectly. He said if it were typed on a typewriter, then after the first line, nothing would have lined up perfectly. The dumb jackass has apparently never heard of a carriage relief lever. Secretaries who regularly use pre-printed forms have no trouble lining everything up perfectly.
Dennis,
I am a fan of your work. And I respect your opinion.
thanks for expressing it.
Since it peaked the earliest, I would say that the Misc group might be an indication for future decline rates of all the others?
Looking at it, not that straightforward…
1990-1995 – Growth of >5% annually until 1997 peak…
1997-2002 – Flat/slightly negative, average of ~0.5% decline…
2002-2013 – Accelerating decline, 3% increasing to 6% by 2012
2013-2022 – Average decline of ~1.1%.
Applying this to the world conventional, 2016-2021 would see minimal decline (<1%), 2022-2033 would see increasing decline rate of 2-3% (which matches Iron Mikes model). After a peak in decline rate of ~3-4% in ~2030, decline rate might stabilize at ~1-2%…
I think Iron Mike is on to something, look for the acceleration in decline…
Kengeo and Iron Mike , Great analysis . +1
I found this picture for shale production by accident by doing a search on Eric Nuttall, an oil fund manager. Does anybody have access to the Sanford Bernstein report stating the assumptions to generate the chart?
Looks pretty flat going forward.
Ovi,
That looks like the AEO forecast for tight oil. They expect flat tight oil output at around 9 Mb/d from 2024 to 2040. I think the AEO projection is absurd.
https://www.eia.gov/outlooks/aeo/data/browser/#/?id=14-AEO2023®ion=0-0&cases=ref2023&start=2021&end=2050&f=A&linechart=ref2023-d020623a.10-14-AEO2023&ctype=linechart&sourcekey=0
Dennis
In the lower left of the picture it lists the sources.
Dennis, from your link, US Total C+C. I agree. It is absurd. They do have the US peaking in 2028 with production matching that peak in 2030. But how do they arrive at their estimate of production to 2050. Perhaps they are psychic, or think they are. 🤣
The data is in million barrels per day.
Ron,
I think to 2030, their estimate is not bad, but after 2030 the scenario is not realistic in my view, especially the tight oil estimate.
We have often talked about resource nationalism . Here is one
https://www.cnbc.com/2023/07/21/indias-rice-export-ban-could-send-decade-high-prices-higher.html
Russia’s deputy president talking about export quotas . Oil will go to friendly countries . Make’s me go –hmmm .
This is what will happen when OPEC says no more exports . Rice buying by Indians in Dallas after export ban ,
https://twitter.com/i/status/1683252561862873088
Hug your bag of rice . 🙂
https://www.zerohedge.com/markets/so-it-begins-us-supermarkets-hit-buying-panic-india-bans-rice-exports
I no longer receive an email about new posts here. That’s why I am always late.
My latest research using the recently published Energy Institute data (instead of the BP Statistical Review)
17/7/2023
Peak Oil in South East Asia and India – Part 1 Production and
Consumption – Update 2022
http://crudeoilpeak.info/peak-oil-in-south-east-asia-and-india-part-1-production-and-consumption-update-2022
This is important because Asia is supposed to be the centre of growth in future, with talk that India will become the 2nd China. But the oil isn’t there.
Matt,
There is a new post every 7 to 8 days, just check back weekly.
Matt charts from your SE Asia article were shared on last weeks post.
Thank you. great information.
Peak Shale Oil & Gas For DUMMIES…. LOL
According to the Investor Relations Depts at the Shale Companies, supposedly they can make money at $50-55 oil. So, why cut Drilling Rigs when the oil price is now heading up above $76??
Baker Hughes Rig Count FRIDAY, JULY 21st
OIL DRILLING RIGS = -7
GAS DRILLING RIGS = -2
Permian cut 4 Rigs.
Also, if we thought 3 mile laterals were LONG, they are now drilling 4 mile laterals in the Marcellus. EQT POLECAT 11 Well is 19,993 feet while Southwestern drilled and completed its PAGE 5 H Well that is 21,000 feet.
The Amazing DECLINE RATE of a 4-Mile Lateral… LOL.
steve
Steve,
The decline rate will not be much different for a 4 mile vs 2 mile lateral in percentage terms. The CAPEX per unit EUR is lower for the 4 mile lateral and thus it is more profitable. Some don’t understand that profits are the name of the game.
Dennis,
I would have been shocked if you replied in a different manner.
Always the optimist.
I believe I am beginning to realize Mike Shellman is correct about you. 🙂
steve
Leave me out of this; I can pick my own fights when I want to, on things that matter.
Whatever EQT does with 4 mile laterals doesn’t matter…they’re an American natural gas company that will run over their own grandmas to export LNG to Europe, while natural gas prices in people’s homes in Pittsburg, in January, is $22. They’re desperate to compete with Permian associated gas now… which will soon, temporarily, overwhelm even Qatar.
Equally irrelevant is the statement that longer laterals equate to higher EUR’s, better well economics and more profit. That statement might work on AOB; try putting THAT out on social media, particularly with regards to liquids productivity per well in the Permian Basin.
I noticed, Dennis, you don’t do that much.
I understand.
“In my view successful business people are not as smart as they believe themselves to be, ” Dennis Coyne.
Okeedokee, then. Depending on what you WANT to believe to fit our own narrative, or personal agenda, I would stick with that.
Mike,
Longer laterals result in lower cost per barrel produced. Overall well productivity probably decreases when normalized for lateral length, or that is what I have read experts claim, also costs decrease per foot of lateral as lateral length increases according to experts. As long as the decrease in output per foot of lateral over the life of the well is less than the decrease in costs per foot of lateral over the life of the well, then profits will be larger at any given set of prices.
Karl Denninger, knows less than he thinks, in my view. He has a big following for his blog, and some people seem to think he is worth listening to, my reference was to him.
I should have said some successful business people are not as smart as they believe they are, others are probably smarter than they think.
My models depend on what future completion rates are. There are several tight oil CEOs that claim they have 10 years of drilling inventory and predict a peak around 2029 or 2030, they probably are smart about their business, I just think when they claim to be experts on areas outside of their field, they probably know less than experts in those fields.
Just as I know far less about the oil industry than you.
As I have said repeatedly, my models will be wrong, just as they have been in the past.
Steve,
Also we need to consider that a single well does not tell the whole story. Why have you chosen a single well?
The average 2022Q2 well in the Marcellus had an average decline of 32% over the first 4 months after peak output (month 2). So a bit lower, but we are comparing the average of 152 wells in 2022Q2 with a single well that you present.
I am not so much an optimist as I look at actual data and think a bit.
The fact that capex per unit produced is lower for longer lateral wells is well known.
See for example
https://jpt.spe.org/the-trend-in-drilling-horizontal-wells-is-longer-faster-cheaper
Excerpt:
Increasingly, the laterals seem to come in two sizes: 10,000 ft and 15,000 ft. On a recent research trip to Midland to meet with drillers, Richard Spears, vice president ofSpears and Associates, an oilfield market data firm, said he heard so much about the cost advantages of 15,000-ft wells, he had to ask why anyone was drilling shorter ones.
“The universal answer was that the 15,000-ft lateral was the most capital-efficient, meaning you got a lot of reservoir exposure at a lower cost than with a 10,000-ft lateral, but many times the lease lines did not allow for a lateral greater than 10,000 ft,” he said.
Another article on lateral length
https://www.spglobal.com/commodityinsights/en/market-insights/latest-news/oil/052121-us-upstream-industry-relying-on-longer-lateral-drilling-to-boost-cash-flows
4 mile laterals = more straws in the glass to drain it faster . Desperate for cash .
HOLE,
You know what they say… a MILE here and a MILE there, and it begins to add up. 🙂
steve
Mr Shellman on the horizantals , rigs , fracs and stupidity . 🙂 . Read the comments ,
https://www.oilystuffblog.com/forumstuff/forum-stuff/uh-oh?origin=notification
Dennis –
Here’s my OPEC projection from a year ago, you will notice it matches relatively well…
Interesting, do you think this is a temporary downturn for OPEC?
Kengeo,
Yes I think the decrease since Sept 2022 is OPRC cutting output to support oil prices, when oil prices increase, output will increase to about 30 Mb/d. Doesn’t look close to me, looks like you were too low by 1200 kb/d (about 4.6% too low only 12 months in the future).
Kengeo
What do you think Saudi Arabia will be producing in 2027?
Have you seen any articles by a knowleable oil professional to back it up?
My guess is they will still be producing oil, maybe they will open a couple lemonade stands?…it does get hot there….
Ballpark guess they will be around 8-9 or so…this all assumes the market is still functioning then…
In other words you have not got a clue.
Your guess implies SA has around 100 billion reserves
I will go with people who could go to prison if they failed to do assessment properly
https://www.demac.com/dm-confirms-independent-assessment-of-reserves-in-saudi-arabia-for-the-saudi-arabian-oil-company/
Charles , I would have to search the posts of 2019 to tell you that this report was junked . Why ?
1. This was not an independent report since DM was commissioned by Saudi Aramco to carry out the audit , Saudi Aramco paid DM , so the auditor had a vested interest .
2. Why was this audit commissioned when KSA is confidential about it’s reserves and financial data ? Saudi Aramco wanted to be listed at NYSE so they had to present this audit to SEC .
3. SEC rejected the audit because Saudi Aramco could not justify the bump in reserves and many other details in the report .
4. Saudi Aramco then withdrew its application for listing on NYSE and went in for a listing at the Saudi stock exchange . The House of Saud purchased most of the shares .
Nobody is going to prison now days for falsification . All you get is a rap on the knuckles and a fine . The last big one to go down was Arthur Anderson for the Enron scam and that was way back in 2001 .
HiH
Of course Saudi Aramco paid for the independent study, there is no international body that will do that.
I guess we will find out Saud Aramco max sustainable production in about 4 years time and maybe before.
Charles –
Saudi peaked in 2016 (12.4 mb/d) with estimated cumulative production of ~165 gb.
However they also had an earlier peak in 1980 at 10.3 mb/d. Current 1P reserves fell by 60% between now and last year (33 Gb down from 56 Gb). 2P reserves fell by half. Statistical review has total reserves at 300 Gb. I believe that they had a true midpoint in production around the year 2000 at cumulative production of ~100 Gb. This implies total URR of 200 Gb meaning they only have 35 Gb remaining (matches 1P). This is about 9-10 years at current production level. Now that their “proven reserves” are 10 times their actual 1P, it’s clear that the sham is up. They realize how little time left they have to sell their oil and are demanding the highest price possible. While they are claiming their production cuts are related to price, there may be other factors at work…the article you linked to looked extremely hokey…didn’t waste much time on it…sounds like you are under the impression that they have several hunred Gb of oil remaining? If true, then they would still be able to increase production above the 2016 value, no?
Here’s a graphic of average production growth from 1996 to present.
You may notice there’s been minimal growth since 2016…
In 5 year increments, their growth had been extreme up to 2005:
’85-90 – ~100% growth
’90-95 – 26%
’95-2000 – 1%
’00-05 – 19%
’05-10 – 1.9%
’10-15 – 9%
’15-22.5 Negative 8%
’20-25 (right now it looks production will likely be less than 11 mb/d by 2025).
I would guess that an annual decline rate of 2-3% will be confirmed by then (loss of ~0.3 mb/d annually).
Saudi will be ~8 mb/d in 2030, 6 by 2038, and 5 by 2042.
Here’s a closer look at their production and likely decline forecast:
Kengeo,
Lots of examples of peak not occurring at 50% of URR. Using Hubbert Linearization on 2005 to 2018 data gives a URR estimate for Saudi Arabia of about 368 Gb, if output continued at the 2018 output level then 50% of URR is reached in 2026. When demand for oil increases Saudi Arabia will increase output. Generally the HL estimate tends to increase over time, so the 368 Gb estimate would be a minimum URR estimate.
Dennis – So you assume there’s 90% of their oil yet to be discovered and added to 1P????
Or is there some other reason 1P is only 33 Gb? This seems like a huge discrepancy, does this pass the giggle test?
Dennis – It’s also interesting that they spend very little time at max production level, they’ll hit 10/10.5 mb/d for a month or two then drop back to the 9-10 range. Surely their average production would have moved above that range by now if they could produce more, they are 100% maxed out once they hit ~10, that’s clear.
In fact, the only time they were able to sustain >10.5 mb/d was when they were attempting to flood the market with cheap oil and drive the shale folks out of business in late 2016. Coincident with their production peak. Even with prices thru the roof last year they were unable to keep production above 10.5 for long (3-4 months).
Seems like whenever they make a run up in production it’s followed by 1-2 years 9-10 range…
“The kingdom’s production for the month of August 2023 will be approximately 9 million barrels per day,”
Excluding covid, the last time Saudi production was 9 mb/d was in 2013…tells you something right there.
Kengeo,
1P is not very useful, 2PC is probably a better number to use, which is 257 Gb, cumulative production is 165.5 Gb, this implies a URR of over 400 Gb, somewhat larger than the HL estimate. They kept output high until prices started to head lower. Their maximum capacity is around 10.5 Mb/d and is constrained by pipelines, storage and GOSP (gas and oil separation plants) facilities as well as water oil separation facilities. They can build more of these if they think they need them, so far they are able to meet World Supply, so no need.
The 9 Mb/d output level tells us they have decided to cut output to create a supply shortage and increase oil prices, we will soon see if this move is successful.
They choose not to produce more so that oil prices remain high.
Note that Sudi Arabia has produced about 165 Gb of oil and there are another 50 Gb of 2P reserves, that’s about 215 Gb of oil, the rest is contingent resources, which has been discovered, but is not currently considered set for being developed for whatever reason (perhaps because demand does not require it.)
See also
https://blog.gorozen.com/blog/analyzing-the-degolyer-macnaughton-audit-of-saudi-crude-oil-reserves
Where about 163 Gb of reserves through 2077 are verified with another 52 Gb produced after 2077, so roughly 215 Gb of reserves as of 2019 with 150 Gb having been produced, so this would be a URR of about 365 Gb, if there are no discoveries or reserve growth in the future.
July 21 Weekend Hz Rig And Frac Report.
Rigs down, Fracs up.
– Hz Oil rigs were down 4 to 483
– Texas down big time by 7
– Permian down 3
– NG down 2
Fracs up by 11
Will they get back to 300?
Thanks Ovi. Looks like your guess last week of 275 frac spreads was excellent.
Dennis
Looks like the fracs prove Mike’s point. Heat does not affect Texas fracking activity.
Ovi,
It does seem that it has been hotter than normal in West Texas, eventually this may affect things. They may have more frack spreads, but completion rate could be similar if they cannot get as much work done due to heat. We don’t yet have the data to make a judgment, the latest real data for Texas is for May 2023.
I did a comparison of RRC and New Mexico Permian region data with DPR and the DPR looks accurate through October 2022, after that data from state agencies becomes incomplete. For the data from August 2021 to August 2022 the conventional Permian basin output averaged about 563 kb/d, I subtracted this amount from the DPR Permian estimate from July 2023 to get Permian tight oil output only based on the DPR estimate and I compare that with the EIA’s official tight oil estimate in the chart below. The DPR estimate may be a bit on the low side for Sept 2022 to May 2023, if the EIA’s official estimate is accurate.
Chart below is for Permian basin tight oil output.
Unsold EVs piling up in Dealer Lots
Have most of the early adopters done their thing? The next task is to convince average Joe.
– The nationwide supply of EVs in stock has swelled nearly 350% this year, to more than 92,000 units.
– That’s a 92-day supply — roughly three months’ worth of EVs, and nearly twice the industry average.
– For comparison, dealers have a relatively low 54 days’ worth of gasoline-powered vehicles in inventory as they rebound from pandemic-related supply chain interruptions.
– In normal times, there’s usually a 70-day supply.
– Notably, Cox’s inventory data doesn’t include Tesla, which sells direct to consumers.
https://www.axios.com/2023/07/10/unsold-electric-cars-are-piling-up-on-dealer-lots
China has huge fields full of unsold EV’s that just sit there rotting away. Thousands upon thousands of unsold EV’s. That won’t ever be sold.
Certain Chinese provinces do this sort of thing just to keep people employed. If they ever catch fire that will be a sight to see and a ecological disaster.
The economic train wreck going on in China will weigh down oil prices more than the incoming CRE implosion that the US is just beginning to experience.
And German trade volumes are at 2008 lows. Already
Keep dreaming.
China- “Sales of gasoline-electric hybrid and pure-electric vehicles rose 44.1% in the first six months of 2023 to 3.7 million, according to CAAM. Their share of total sales rose to a record 28.3% from last year’s 25.6%.”
Keep in mind that EV’s spare petrol for use by those with ICE’s.
I’m surprised that those with ICE vehicles aren’t great cheerleaders of the EV industry.
I conclude that those who shun the EV industry are hoping to profit from petrol shortage, as their primary motivation. Or is it just some demented form of partisanship?
-postscript. I realize that a third possibility for the shunning of EV industry is the environmental position that all vehicle production should be rapidly phased out.
HHH , EV graveyards of China . This guy was also one of the first to report on China’s ” ghost cities ” .
https://www.youtube.com/watch?v=1SEfwoqKRU8
Collapse of Chinese EV sales in Norway explained .
https://www.youtube.com/watch?v=O6Sqgo81gNc
“Thousands upon thousands of unsold EV’s. That won’t ever be sold.“
Says the individual who insisted oil would be at $25 last March.
Oil will be at $25. Recessions take time to play out. Yield curves will in the end will turn out to be right. The lag between inversion and recession can take a while. Yield curve inverted back in October 2022.
And facts are there is thousands upon thousands of brand new never been sold EV’S sitting in fields in China.
Speaking of inversion. FED is likely to raise interest rates this week which will deepen the inversion more than it already is.
Which happens to already be the deepest inversion since 1982. Market doesn’t agree with the FED’s reasoning for raising interest rates. Which is why the inversion is.
This was never an abundance of money creation like in the 1970’s. It’s not even like the run up to 2008. Where pre 2008 Eurodollar market was creating an abundance of dollars outside US.
It’s a dollar shortage on top of a supply side shock.
HHH
Right now the technicals are beating the inverted yield curve. The 50 day MA crossed the 200 day MA. Golden cross. Implies that SA’s cuts are working and maybe Russian decline is beginning to show up.
As I keep saying 90 before 25.
Recession projected between September 2023 and March 2024…
https://www.reuters.com/markets/us/us-leading-indicators-point-recession-starting-soon-2023-07-20/
“Elevated prices, tighter monetary policy, harder-to-get credit, and reduced government spending are poised to dampen economic growth further,”
You do realize CTA’s are designed to inflict maximum pain right? They will get everyone in on momentum, then exit.
Goldman, TD bank and all the rest that count are near max long. When those algorithms start taking profits. Prices will go the other way.
While technicals are fun to look at. There is way more to it than technicals. Oil isn’t like a stock. There is no buybacks of shares to drive valuations endlessly higher regardless of what the CTA’s are doing.
All the leverage these companies are using to do buybacks is created in REPO market. Not the FED.
There will come a day when the REPO spigot gets turned off long enough for theses companies doing all the buybacks to become net sellers of their own stocks instead of buyers.
Likely in next recession. Then the bubble pops. Understand 99% of all the gains in the stock market since 2008 are solely due to share buybacks.
What happens when they have to sell with no buyers buying?
GDP Now estimate is 2.4% growth for US
https://www.atlantafed.org/cqer/research/gdpnow
Ovi ,” As I keep saying 90 before 25 . ” Yes I think you are going to be correct . The conundrum is — high oil prices = deeper recession = lower demand = more oil cuts= higher prices . This is a negative loop . Irresistible force vs an immovable object . Reminded of Dickens opening paragraph in ” The tale of two cities ” .
Hole in head,
Real Oil prices were about $130/bo in 2023$ from 2010 to 2014, real GDP grew at about 3% per year for the World during that time period. Ninety dollars per barrel is not likely to be a problem for World economic growth. My guess is $80/bo for the rest of 2023 with a possible increase to $90/bo in 2024, though slow economic growth might keep prices around $80/bo. Your $25/bo in 2025 will need a severe World recession before the end of 2025. My estimate is that the odds are about 1 in a thousand that oil prices average $25/bo or less for the average monthly WTI price in any month before January 2026.
Nobody ever won against the inverted yield curve .
https://www.bloomberg.com/news/newsletters/2023-07-25/is-the-us-treasury-yield-curve-really-wrong-this-time?sref=866aH6XX
Now who did that ?
https://www.zerohedge.com/markets/tesla-attempts-stoke-demand-84-month-loans-amid-affordability-crisis
I put copy /paste from ZH but the same is available at Bloomberg behind paywall . Affordability .
We have 7-8 tech companies who have together a combined market cap that is larger than the entire industry of real estate, banks, energy, and materials. Think about for a minute.
It’s the very definition of a bubble. Tesla and its 84 month loans leading the way. Now that doesn’t mean that it will pop today or next week. But be warned that even though they can go higher. They are way over priced.
Now is the time to be defensive. This applies to tech stocks and oil futures.
We need a credit boom for prices and valuations to go higher. Yet there are lots of data pointing towards credit contraction.
Kengeo,
What do you think the cumulative output of tight oil from the Permian basin is. Mike Shellman has said it is a little less than 11 Gb, which is what I gat also.
Honestly don’t pay much attention to Permian. It’s over before it started. It’s a last ditch attempt to keep the BAU model running. Just an exchange of high density energy for lower.
For US, the future is undeniably natural gas, this is the last hurrah for oil. I’m sure there will also be coal that kicks back up sooner than later, wind and solar will get in the mix but nothing worthwhile.
I think the next 10 years will all be about export land model, there will be 2 groups those that have oil and those that can’t get it…North America and Middle East have it, pretty much everyone else doesn’t, not looking good for Europe, Asia, Africa, or South America….
Dennis – Cumulative for the permian would be somewhere around 10 (I get 9 running a visual count on Novilabs graph): https://novilabs.com/permian-basin/
Cumulative Permian:
2017 = 1.4 Gb
2019 = 4.4 Gb
2023 = 8.8 Gb
Kengeo,
Try
https://www.eia.gov/energyexplained/oil-and-petroleum-products/data/US-tight-oil-production.xlsx
Add Spraberry, Wolfcamp and Bonespring columns together to get Permian output, then sum the column and multiply by 365.25/12.
The result is 10930.83 million barrels from Jan 2000 to May 2023, The 10.7 Mb estimate is cumulative production through April 2023, the May data just came out.
Also see chart below from Novi labs
https://public.tableau.com/shared/CW9DF6YFK?:toolbar=n&:display_count=n&:origin=viz_share_link&:embed=y
Dennis – Agree, looks to be ~11 Gb.
FYI, Russian update. Russian C+C production through March 2023. March production was down 300,000 barrels per day to 10,177,000 bp/d… and headed lower.
Just playing with the EIA’s World C+C data. I found that the combined production of OPEC plus Russia in September 2016 stood 8,469,000 barrels per day above the combined production of the rest of the world. In March 2023, the rest of the world stood at 318,000 barrels per day above OPEC + Russia. That is an 8,787,000 barrels per day gain of Non-OPEC less Russia over OPEC + Russia.
It is interesting to note that they were about equal just before the covid collapse, and they were just about equal in March of this year. They made up the difference in just three years but are still about the same just over three years later.
I am not trying to make anything out of that, just yet anyway. I am only pointing out that it is interesting.
I have been investigating some of the Permian plays in more detail.
Attached is Reeves county. It produces more condensate than crude oil. What does this mean? Is Reeves county oil very light, i.e. much lighter than WTI?
The production data after January 2023 may not be final, especially May, due to late reporting.
WaHa Hub is in Reeves.
Huge gathering station for the Delaware.
Separates ethanes, pentanes, butanes.
A lot of the “crude” in that catchment is condensate.
Gerry
Thanks. Back to my question. Does that mean that Reeves tight oil is very light?
Yes
Gerry
Thanks. Got it
Latest post by Mr Shellman on Delaware and other basins . As usual he has an ear to the ground .
https://www.oilystuffblog.com/forumstuff/forum-stuff/the-alamo?origin=notification
HIH
Attached are a few charts showing what is happening in the Permian using state production data. The state data is probably up to date to February. Clearly the April and May data are preliminary.
This first chart shows oil production in the Texas and NM Permian basins along with the EIA NM oil production.
The Texas data is for the top five counties, Midland, Martin, Reeves, Loving and Howard. For NM it is Lea and Eddy. Also shown is the EIA production for NM.
The EIA data goes up to April and includes their best guess on where March and April will end up.
The big drop in Texas may be due to production dropping in Howard county, see next chart.
If someone would like to see another chart on Permain counties, just ask.
Howard County
I am assuming the data up to January is correct.
Ovi, Immediately above you have unwittingly (or perhaps wittingly) plotted the curve of what would be, in a single well, a thing called BDF (Boundary-Dominated Flow), better known as “End-of-Life” well characteristics. If you’d used oil plotted against a GOR curve, they would go wildly divergent at this point, which is commonly (for a single well) called the bubble point. This was, in a silly extrapolation by an internet expert, called the “Bubble Point Death” (of a field).
Importantly, there has been double-speak about the importance of BDF and GOR. In 2015, the avuncular “voice of the Permian” said that a sharply rising GOR was a good thing, and that it portended greater-than-estimated EUR’s, not less. That claim was refuted by some well-published reservoir engineers, and even the more savvy shale oil investors. But it took, because of who said it.
This early extrapolation of the initial oil cut (traditionally 70-80%) throughout the life of a well, even in the face of rising GOR, is now being stated by a different voice of the Permian. I’m not in the business of trying to harm the reputations of these people, but this is so terribly incongruent that it may be influencing an entire administration to be too coy over our oil future. Who in their right mind would listen to Mike Wirth boast that his company had such elite acreage that it would soon produce 10% of our domestic production and immediately extrapolate that to a bright and enduring future for the other 90% of the Permian group? Well, more than you think, though clearly not the ones who are laying down rigs.
First the gas cap goes with a mighty belch known as the IP (Initial Production or flush), then solution gas drives the oil, and finally, lo and behold, gas comes out of the rock. Throughout this fascinating display, the gas, religiously adhering to Boyle’s Law, is pretty much in control of the situation. It is axiomatic that when the oil cut drops off sharply, with a corresponding rise in the GOR, the well has hit Boundary-Dominated Flow parameters. This phenomenon will be occurring all across the Permian Basin. This is not doom and gloom; this is the maturation of a shale oil field, one well at a time.
Howard County GOR.
The GOR starts to climb at the same time that oil production starts to drop.
Is it gassing out like Mike says
Ovi, that’s it right there.
Take your green line (oil) on the upper graph and juxtapose it with your red line (GOR) on the graph immediate above.
That wild divergence is the defining characteristic of an end of life shale oil well. That splayed-out configuration is the bubble point, and after that it’s Katy bar the door. You are merely seeing it for Howard County. They’ve been here before, about 1935 or thereabouts. My friend’s father bought all those old abandoned wells from the thirties and forties. Some weren’t even plugged; they just left them. They made a lot of money so don’t cry for them.
You can plot these damn curves all day long on wells that are five years old and older. And you can bet that if I can plot them, all the hotshots can plot them. These curves have been reproduced by hundreds of thousands of shale oil wells. And unless someone comes up with something exceptionally revolutionary, these are the curves that will continue to be drawn by shale oil wells, even Chevron’s.
I mean, if you want to, go to the records and take one well after another, graph it out. You can literally take hundreds, thousands, of these wells and they will almost superimpose. Make a family of curves. Together, ultimately, they make up the shale basin in that county. That’s what you did in Howard County using a much simpler process.
I’m not bashing the shale industry. But there’s been enough conflicting reports on this to drive a man crazy. This doesn’t mean that Chevron, say, can’t make money on their acreage. What it means is that, in five years the wells that are so highly touted now are going to inscribe curves exactly like this. Why? Because on the bottom of a Delaware well is a lake of water in a carbonate stroma, and on top of that are benches of shale containing oil with gas in solution, and also free gas in rock. The lighter the oil, the more gas it will absorb, so trust me, this oil holds gas. After the fracture of the rock, the gas is always in control, due to this funky law of physics that goes by the name of Boyle’s Law (which I’ve worked on understanding for the last fifty years).
Okay, I’ve done the best I can do. I hope you can make some sense of it. I’m sure there are a lot of guys out there who can explain it better.
Gerry
I think this is what you are looking for.
No, Ovi, two curves.
The green one is the one in your top graph, “Howard County Oil and NG Production,” drawn at 3:13.
The red one is of your bottom middle graph, “Howard County GOR,” drawn at 3:14.
I don’t know how to draw curves.
That splay point marks the beginning of the end, for any shale oil well. You are seeing the countywide culmination of thousands of wells that have passed the bubble point.
Reeves County
Gerry
The last data point for Reeves may not be correct because of late reporting.
Thanks Ovi and Gerry .
Ovi, to examine an individual well–and ultimately counties such as you’re doing–it’s much more illuminating to plot one curve as oil, and. the other as the GOR.
Why?
Because in the depiction above, it would appear casually that the NG production has increased only modestly while oil production fell off modestly. But the GOR has gone ballistic. Believe it or not, this one fact belies the craziness of many of the cases made by CEO’s regarding their future. At a definitive point in time, about 2015, the “voice of the Permian” actually proclaimed loudly that a rising GOR portended a larger EUR for a well. It was exactly the obverse. Sounds crazy, I know, but until you plot GOR against oil production, you’ll never get a full sense of the bubble point–because these curves diverge quickly and dramatically. I mean, it happens on a Wednesday.
Gerry
Attached is the two graph chart which you suggest.
However I think the Howard Oil Production vs GOR chart above may be more informative because it shows the relationship between production drop and GOR. The higher the GOR, the more that production drops.
We will need more recent data to see if the relationship is almost linear once the drop starts.
Warsaw, Poland. Third best modern skyline in Europe (after Frankfurt and London): https://www.skyscrapercity.com/attachments/img_20230608_081104-jpg.5417841/
Looks like a random suburb in Vancouver
Outside the Permian, US land oil production is off its peak.
Let’s look at how production has fallen in some big plays.
“Chevron CEO Mike Wirth on Q2 earnings: We’re delivering strong results in a turbulent world
Chevron chairman and CEO Mike Wirth joins ‘Squawk on the Street’ to discuss the company’s Q2 earnings results, which reported earnings of $6 billion and record oil production in the Permian Basin, lowering the carbon footprint, and more.
2 HOURS AGO”
Expects to be producing more volume out of the Permian at million barrels a day in 2040 than is currently producing. States best place to invest.
https://www.cnbc.com/video/2023/07/24/chevron-ceo-mike-wirth-on-q2-earnings-were-delivering-strong-results-in-a-turbulent-world.html
“Chevron Reported 2Q23 Permian Basin Production Of 772,000 Barrels Of Oil Equivalent Per Day, An 11% YoY Increase
1:12 am ET July 24, 2023 (Benzinga) Print
Permian Basin production of 772,000 barrels of oil equivalent per day set a new quarterly record. Early 2023 Permian well performance in company-operated assets is on track with our full year guidance. The company’s deep resource inventory and advantaged royalty position is expected to deliver strong cash flow through 2040”
From a real important oilman who sees the Permian production data everyday! Or you can relay on a delivery driver combing the web for misinformation for dummies.
BOE
Watcher , the lies will never stop . Smoke and mirrors . In Q4 2022 they had adjusted earnings of $ 7.9 billion and now approx $ 6 billion and they are doing a victory lap after being down approx 25 % . BOE , DUC , Longer laterals, frac spreads , refracs etc etc all BS . Shale is a Ponzi . Been saying it for years now .
https://www.chevron.com/newsroom/2023/q1/chevron-announces-4q-2022-results
HOLE IN HEAD says – “the lies will never stop . Smoke and mirrors”
“DELIVERY DRIVER EDUCATION REQUIREMENTS- Usually, delivery drivers don’t need a college education. The most common degree for delivery drivers is high school diploma with 45% graduates, with only 21% delivery driver graduates earning bachelor’s degree. Delivery drivers who decided to graduate from college often finish University of Phoenix or Central State University. Some good skills to have in this position include math, basic math and cdl.”
https://www.zippia.com/delivery-driver-jobs/education/?src=chatbot_popout_displayed
“con art·ist- a person who cheats or tricks others by persuading them to believe something that is not true.”
“A Ponzi scheme is an investment fraud that pays existing investors with funds collected from new investors.”
From HIH (A Delivery Driver) link- “Chevron reported full-year 2022 earnings of $35.5 billion ($18.28 per share – diluted), compared with $15.6 billion ($8.14 per share – diluted) in 2021. Adjusted earnings of $36.5 billion ($18.83 per share – diluted) in 2022”
HIH or The Mouth is a Putin conman troll- I’ve “Been saying it for years” as he spreads gloom and doom of western democracy. Who can’t distinguish between a legitimate international oil company and Bernie Madoff.
Ask yourself, is it intentional or ignorance? Or maybe even both. His opening line tells you everything you need to know about himself. “the lies will never stop . Smoke and mirrors” This is psychological projection
“Psychological projection involves projecting undesirable feelings or emotions onto someone else, rather than admitting to or dealing with the unwanted feelings. Have you ever disliked someone only to become convinced that the person had a vendetta against you? This is a common example of psychological projection.
https://www.everydayhealth.com/emotional-health/psychological-projection-dealing-with-undesirable-emotions/#:~:text=Psychological%20projection%20involves%20projecting%20undesirable,common%20example%20of%20psychological%20projection.
If history repeats itself (recession next year):
U.S. Shale Slowdown Weighs On Oilfield Services
The U.S. shale industry is experiencing a slowdown marked by reduced drilling activity and declining well yields, a reflection of potential natural depletion and decreasing oil prices.
Financial results of oilfield service providers, such as Liberty Energy, substantiate this trend, forecasting lower activity in the U.S. shale industry in the latter half of the year.
A combination of factors including lower quality inventory, higher costs, demand uncertainty, and an anti-industry government is encouraging the shale industry to curb production growth and await changes in growth-discouraging factors.
The above was all bold highlighted in this article. Much more, just click on the link above.
How much are we to trust claims of “anti-industry government”? I keep hearing this from the industry but how much does it really effect production? If we had a rabidly pro-oil govt. would they not just drill through what remains even faster?
I find this to be a reasonable view of the current US natural gas market.
https://hfir.substack.com/p/natural-gas-is-sitting-in-the-comfort
Looks WTI is now knocking on $80 seems like a retest of the $82-83 level is just matter of time.
for those who like to read common sense just the facts with an appropriate amount of logical conclusions on energy put: https://twitter.com/HFI_Research on your reading list.
https://oilprice.com/Latest-Energy-News/World-News/Buffett-Bets-On-Fossil-Fuels-Amid-Cheap-Market-Valuations.html
“I love ESG” because oil and gas stocks are cheap now partly due to this, Cole Smead, CEO at Smead Capital Management, has told Bloomberg.
“I’m sure Buffett and Munger love ESG as well,” Smead, whose firm manages $5.4 billion worth of assets, including Berkshire Hathaway and Occidental shares, said. ”
I like this article because it agrees with me. As I said months ago the arbitrage between energy fiction and energy reality leaves a great profit opportunity. Now this is not to say Warren Buffet is right (or me) but it is to say they do their homework, have great resources and experienced, talented and intelligent leadership to make those decisions. While I don’t have those resources this one seems to be a no brainer. 👑
I’d agree with you, the hypothetical puts I sold on 7/19 have gone up about $100 each day…
However, I also believe volatility is here to stay, big ups and downs to be expected but generally oil price needs to hit $100 plus if there’s any hope of balancing demand…
Oil volatility may return but is currently at multi-year lows and has been trending down since October of last year. And speculative longs are coming off decade lows. As these shorts are forced to cover it will almost certainly lead to a grind higher. I believe we’ve seen it before where even if the economy tanks oil becomes a temporary safe haven as a physical asset before finally collapsing under demand destruction.
https://www.bloomberg.com/news/articles/2023-07-25/buffett-lifts-fossil-fuel-bets-as-global-esg-push-mints-bargains?utm_medium=social&utm_source=twitter&cmpid%3D=socialflow-twitter-markets&utm_content=markets&utm_campaign=socialflow-organic#xj4y7vzkg
“Warren Buffett Lifts Fossil Fuel Bets
Energy is cheapest sector in S&P 500 yet generates most cash
Berkshire adds to stakes in Occidental, LNG, Japanese traders”….yep that sums it up pretty well
Art Berman’s latest video with Adam Taggart , 75 minutes .
https://www.youtube.com/watch?v=t1URKfULArI
Mr B– The Honest Sorcerer latest on Peak oil and collapse . 12 min read
https://thehonestsorcerer.medium.com/collapse-too-might-come-sooner-than-expected-eb3f16e8542d
Interested to hear what others think of this article. Made sense to me, but I’m more the big picture type.
They said the sanctions were working . 🙂 . Repeat , oil flows will be redirected but not stopped .
Javier Blas
@JavierBlas
With Urals, Sokol and ESPO trading now above the $60-a-barrel level, we should **assume** that all Russian crude is now flowing into the global market without using Western banking, insurance and shipping. Either that, or “attestations” are getting rather creative .
more from javier
Javier Blas
@JavierBlas
·
35m
Dear Lord, the
@EIAgov
“adjustment” factor climbed last week to a record of 2.415m b/d (we have only data for the weekly adjustment since 2002). The outsized adjustment isn’t a good look, at all, for the EIA | #OOTT
chart wont post https://twitter.com/JavierBlas
Contrary Opinion-
It would be good if oil supplies in the world started to decline now.
Its going to happen soon anyway…might as well get on with adapting to the downside.
Country, business and family plans to continue on with oil product consumption at current levels
need to be scaled back or more money needs to be budgeted for purchase of those products.
The sooner that the inevitable oil product decline is acknowledged, the more quickly that the appetite can be actively restrained. No need to wait for insolvency to force ones hand.
This commentary has a worthy perspective on a related topic-
(Thanks George for the link)
https://www.chathamhouse.org/2023/07/climate-change-threatens-cause-next-economic-mega-shock
Hickory – You are spot on, it’s rationing time…with less than 500 Gb of 2P reserves (probability actual reserves 50% higher or lower than this amount), the only control we have is how steep the final drop is….a soft-ish landing would require 10% annual drop in production for next 5 years. At that point we could likely make it kinda work for longer (buys ~10 years):
500/30 = 17 years vs 400/15 = 27 years…
The drop will mean less people flying around the place…
Covid was the primer on what the future holds…
“it’s rationing time…”
I don’t think we are there yet in most countries.
Far before it gets to that point we will see prices rising for oil/ oil products.
It will indeed be interesting to keep an eye on air miles traveled. That may be the canary in the coal mine for oil product supply/affordability. And almost 100% of that consumption is optional.
EIA weekly adjustments from Javier Blas
HICKORY
IGNORED
07/26/2023 at 11:18 am
Contrary Opinion-
It would be good if oil supplies in the world started to decline now.
Good Lord! You can’t be serious!
Where do you live, on a private island?
The USA is only as strong as its military, and last time I checked, that still runs off hydrocarbons.
You don’t see China reducing its holdings of oil and gas. Xi has filled the bunkers.
I’ve seen some irresponsible comments on this forum before, but this takes the cake.
Holy smokes!
You know, Ryan Gosling got paid for playing Ken.
Hi Gerry. I am not saying that I prefer a world or country short of energy.
Rather I am acknowledging the fact that our industrialized world is on the verge of a big change in status when it comes to energy supply…the growth story of fossil fuels is close to the end.
The sooner we get on with shifting gears the better.
I am a fan of gradual transitions when it comes to huge macroeconomic events.
I don’t know who Ryan or Ken are???
Possible decline rates for tight oil:
…shock and awe…
2024 – 3% decline
2025 – 6% decline
2026 – 12% decline
2027 – 21% decline
2028 – 32% decline
2029 – 19% decline
2030 – 12% decline
2031 – 9% decline
2032 – 5% decline
While this might seem extreme, it still produces 55 Gb recoverable oil by 2080, 43 Gb by 2050, and 36 Gb by 2040…
US 1P reserves are 41 Gb, and 2P reserves are 55 Gb….
So this works out to US conventional URR of ~250 Gb plus ~50 Gb tight oil. Midpoint of both peaks occuring in 1990…
What’s even more shocking is that the last time US conventional oil production was this low was 1938, when our friend Ron was born….
How did everyone think the shale experiment was going to end?
Kengeo,
The tight oil URR is more likely to be about 70 Gb, rather than 30 Gb, and decline probably won’t start before 2027.
It will be fast. Chart below has tight oil annual decline rates for my model, URR=73 Gb, first decline year after 2027 peak is 2028.
By 2048 tight oil output has decreased to 0.16 Mb/d and cumulative tight oil output is 72 Gb. World output of C plus C is 52 Mb/d and World C plus C output is decreasing at 3% per year.
Dennis – Your scenario requires US 2P reserves to grow by ~2 Gb (3%) each year for next 30-40 years…
Does that seem reasonable to you? At current production level 2P reserves are gone by 2045, my scenario has limited growth of 2P reserves, which may be wrong to assume, but I would say that your reserve growth estimate is too high.
I think we will know very soon which way things going, we both agree that US decline rate of >20% is on the horizon, my guess is 2027, yours is ten years later, 2037…
End of the day our estimates are pretty close, only talking about 5 years or so difference…
Kengeo,
US reserves have been growing for a long time and will continue to do so.
Kengeo,
From Dec 31, 2011 to Dec 31, 2021 Tight oil 2P reserves grew by about 50 Gb roughly 5 Gb per year on average. At the end of 2021 there were about 40 Gb of 2P tight oil reserves in the US and about 21 Gb of cumulative tight oil production through Dec 2021. That is a total of 61 Gb of tight oil. My scenario is for 73 Gb of tight oil output, so only 12 Gb of future reserve growth would be needed. Lets assume reserve growth ceases in 10 years, then we would need only 1.2 Gb per year of reserve growth on average to meet my scenario a rate that is 4.17 times smaller than over the 2012 to 2021 period (5/1.2=4.17).
My reserve growth estimate is in fact quite conservative, if anything too low.
Let’s face it, we were complete suckers for overproducing the permian like we did…it will haunt us…”drill baby drill!”
Here’s this analysis applied to world production…URR=2300 Gb, production decline of 1-2 mb/d per year, then ~3 per year after 2030…
This scenario assumes 2P reserves grow annually ~0.5 to 1% thru 2100.
If that doesn’t happen then there will be no production past 2050…and URR = ~2,000 Gb. Decline will then accelerate in 2035 instead of leveling out…
Kengeo,
You often assert peak is reached at 50% of URR, conventional output was in 2016 and conventional cumulative production was 1273 Gb which would imply conventional resources of 2546 Gb. That would be our minimum unless you contend that there are negative 246 Gb of resources somewhere. Typically unconventional resources are estimated at 200 Gb minimum, but if we use my very conservative 170 Gb estimate for unconventional resources we would be at 2716 Gb for total World C plus C.
https://oilprice.com/Energy/Crude-Oil/The-Oil-Eldorado-Guyanas-Stabroek-Block-Surpasses-Analyst-Expectations.html
“Oil estimates for the Guyana Suriname Basin, particularly Guyana’s Stabroek Block, are being revised upwards, with Exxon’s 35 discoveries believed to contain over 11 billion barrels of oil.
Various oil discoveries in both Guyana and Suriname indicate the presence of up to 32 billion barrels of oil resources in the basin, a number that is likely to grow as exploration and development operations escalate.
The surge in oil resources is attracting foreign energy companies and investment, fueling what is projected to become South America’s largest oil boom and promising significant economic benefits for Guyana and Suriname.” good thing EXXON is in there rather then Russia or the Chinese. chalk up one for the goods guys.
I will respond to the posts regarding oil rationing above. That is what price is for. For reasons I do not understand there are those here who think they “know” more about the worlds producible oil reserves than the general market. There is no hint in the market place of an oil shortage on the near term horizon. My gut tells me we can keep worldwide oil production steady to a small single digit growth for the foreseeable future. General markets work, when the time comes for rationing the market will be the first clue. How do I know this, money is flowing into the oil and gas sector while fleeing the “green energy sector” because there are NO profits and the government subsidies can not be counted on from bankrupt governments. While I hate to take clues from communist china, the all of the above approach will be the model outside of places like California. All of the above means… what is affordable, by industry or government, that can source the needed materials. Take that to the bank.
That’s great, now if we can keep finding that amount of oil every year, there will still be no growth in production…
New posts are up
https://peakoilbarrel.com/steo-and-tight-oil-update-july-2023/
and
https://peakoilbarrel.com/open-thread-non-petroleum-july-26-2023/