A guest post by Ovi.
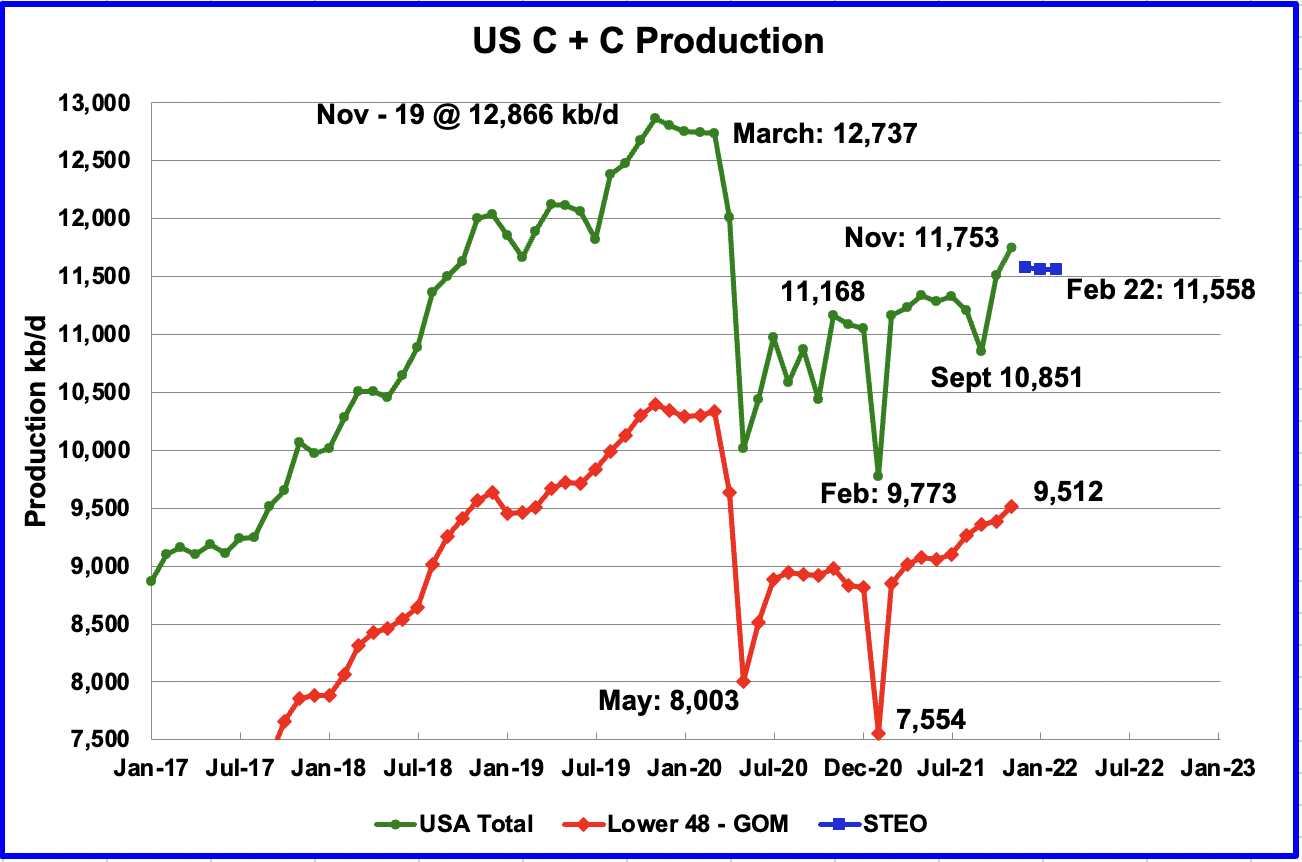
All of the oil (C + C) production data for the US state charts comes from the EIAʼ’s Petroleum Supply monthly PSM.
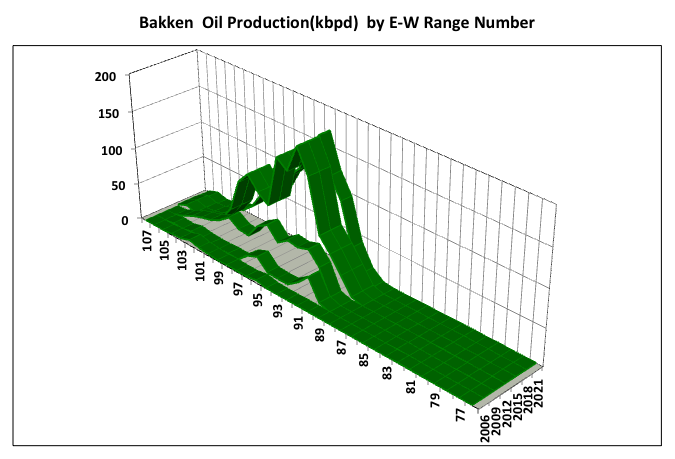
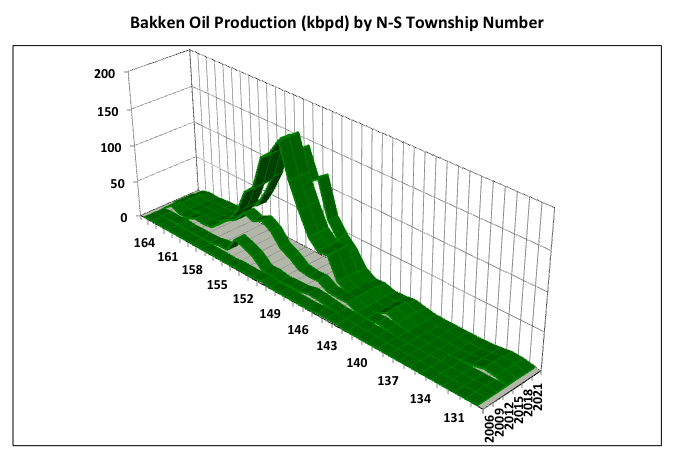
The North Dakota area of the Bakken LTO basin has accessible data from the ND Department of Natural Resources, Oil and Gas Division. Production here seems to be past peak and in general decline. The data presented here is therefore more a historical perspective than of much interest in predicting issues that may have significant impact for the future. However it may give some indication on what to expect in the Permian basins, the only ones left in the US that may have capacity to increase production. The Texas RRC does also produce good data but a global data dump produces files that are too big for my computer to handle and splitting into smaller subsets is too man-hour intensive for me to pursue.
These charts show how the oil production has changed every three years by range (almost equivalent to lines of longitudes) and township lines (latitudes). These lines run every six miles and the area they contain is called a township, consisting of 36 square mile sections (that’s the simplified explanation, earth’s curvature and irregular land features make things a bit more complicated).
A post by Ovi at peakoilbarrel
All of the oil (C + C) production data for the US states comes from the EIAʼs Petroleum Supply monthly PSM. After the production charts, an analysis of three EIA monthly reports projecting future production is provided. The charts below are updated to June 2020 for the 10 largest US oil producing states.
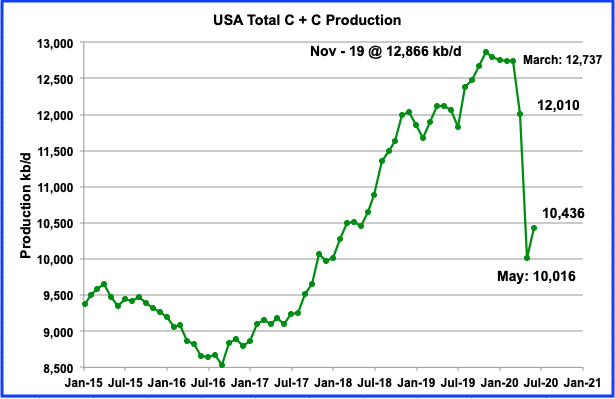
June’s production rebounded from May’s low by adding 420 kb/d. May’s output was revised up by 15 kb/d from the EIA’s July report.
Read MoreThe data for the charts below were taken from the EIA’s Monthly Energy Review. It is crude plus condensate through March 2019 and is in thousand barrels per day.
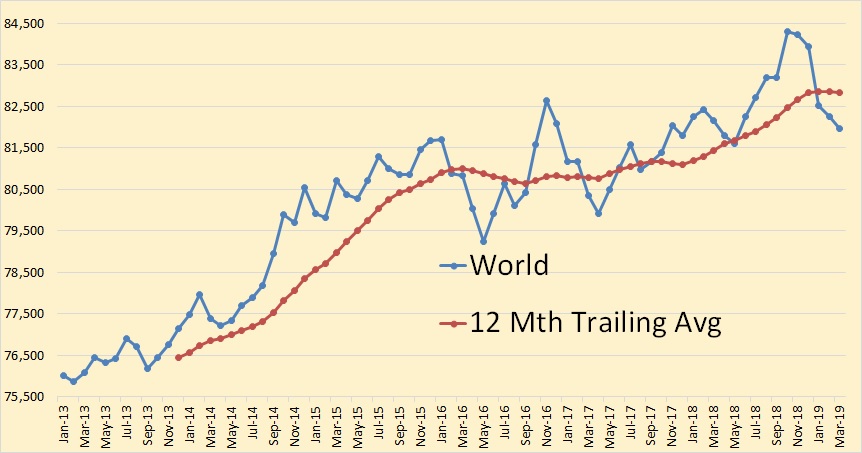
World C+C was down 281,000 barrels per day in March.
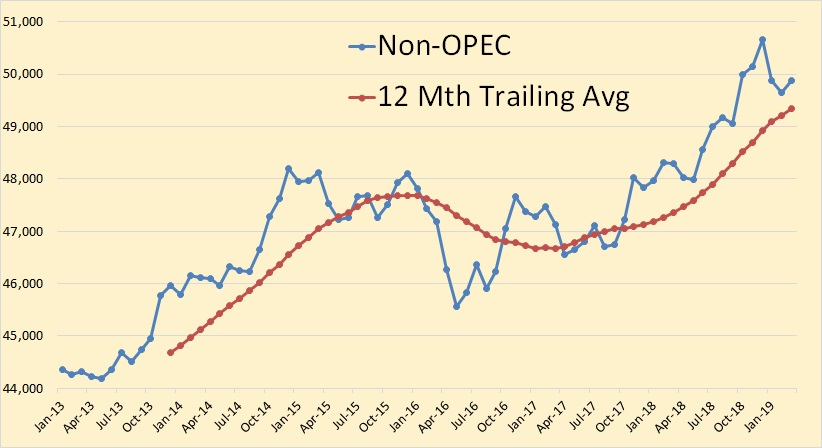
Non-OPEC was up 218,000 barrels per day in March.
These first charts are taken from the EIA’s Monthly Crude Oil and Natural Gas Production. The data are through June 2018 and is in thousand barrels per day.

US C+C production was up 231,000 barrels per day in June to 10,674,000 bpd, an all-time high.
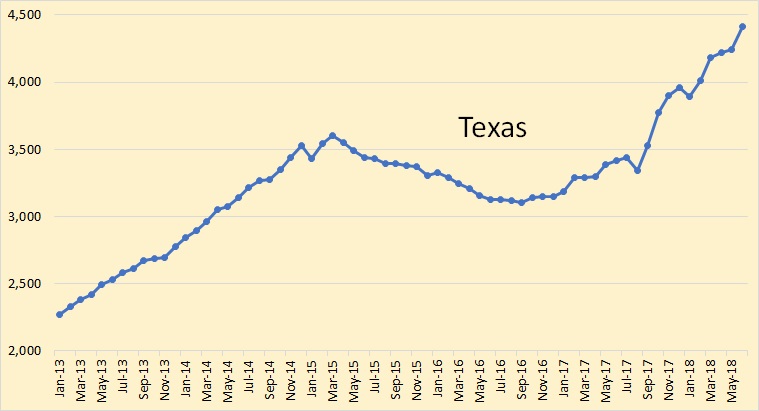
Texas was up 165,000 barrels per day in June to 4,410,000 bpd.