A guest post by George Kaplan
The North Dakota area of the Bakken LTO basin has accessible data from the ND Department of Natural Resources, Oil and Gas Division. Production here seems to be past peak and in general decline. The data presented here is therefore more a historical perspective than of much interest in predicting issues that may have significant impact for the future. However it may give some indication on what to expect in the Permian basins, the only ones left in the US that may have capacity to increase production. The Texas RRC does also produce good data but a global data dump produces files that are too big for my computer to handle and splitting into smaller subsets is too man-hour intensive for me to pursue.
Production Across the Area
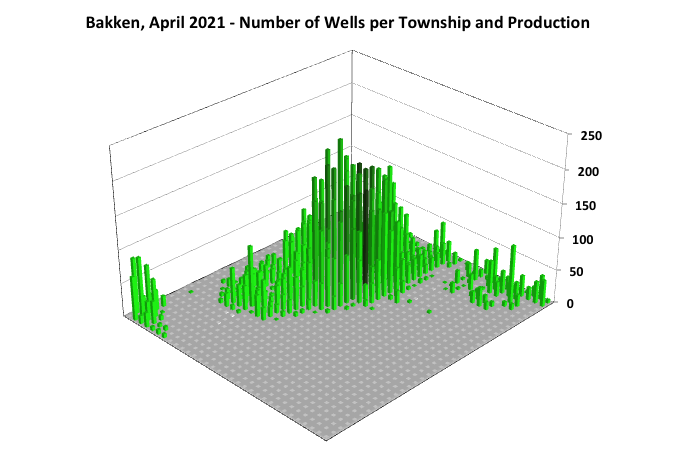
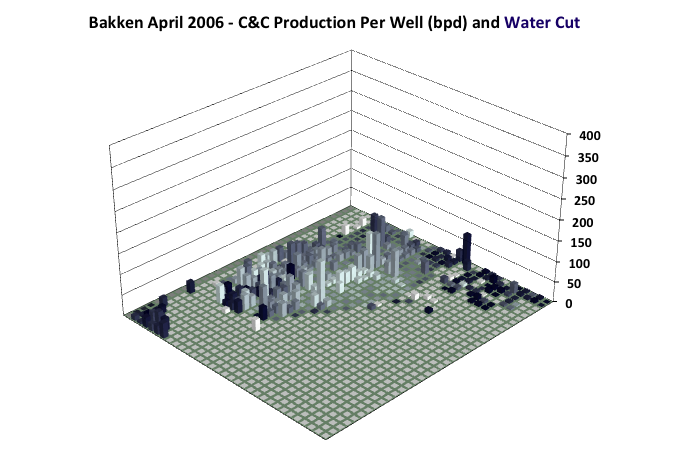
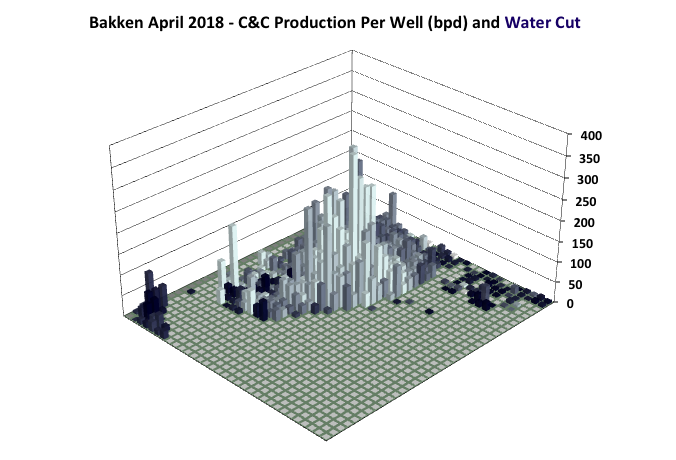
These charts show how the oil production has changed every three years by range (almost equivalent to lines of longitudes) and township lines (latitudes). These lines run every six miles and the area they contain is called a township, consisting of 36 square mile sections (that’s the simplified explanation, earth’s curvature and irregular land features make things a bit more complicated).
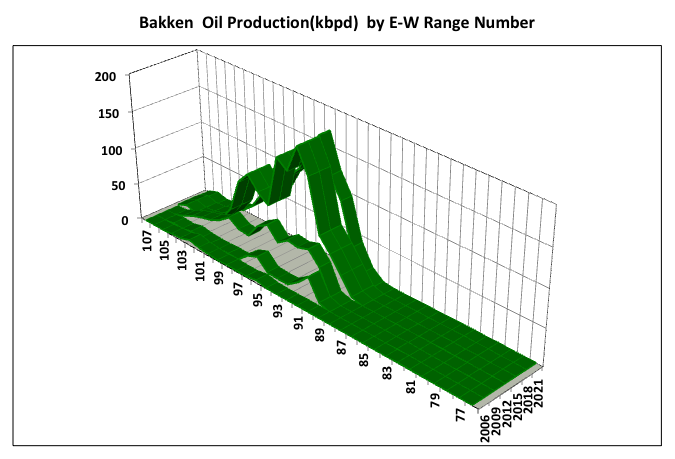
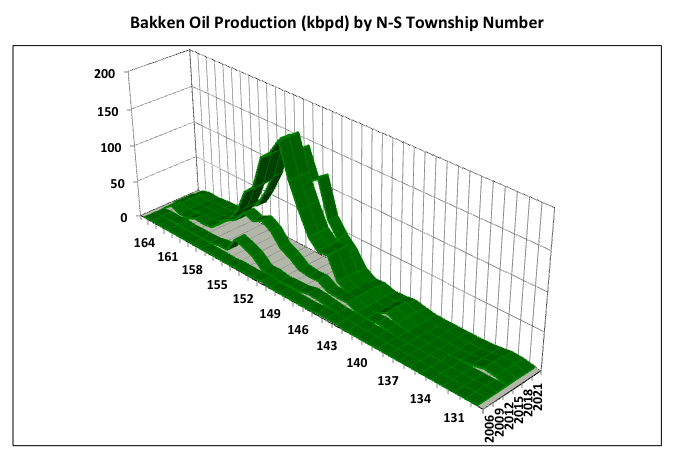
The production shapes indicate that there aren’t core (tier 1) areas with surrounding poorer quality areas. There is a single, small central peak area (I think geologists might call this a bright spot) and the reservoir quality declines steadily to the edges of the basin, outside of which there is no meaningful production and never will be no matter what oil prices, technology improvements or USGS fantasies come along.
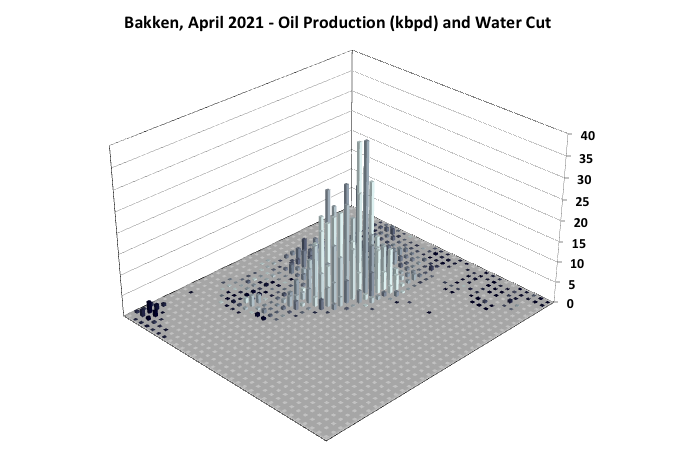
The chart below shows the production over the whole area for April 2021, looking towards the north-west. The colour shows the water cut, the darker the blue the higher the cut. All areas have about 50% water cut as soon as production starts but the peripheral areas, which are more conventional oil rather than LTO, tend to have 90 to 95% water cut, with very low oil production. Only the North Dakota production is shown and the north-south lines should really be slightly jagged as the cross each of the east-west latitude lines to account for curvature, but that’s beyond me and Excel.
Gas Production
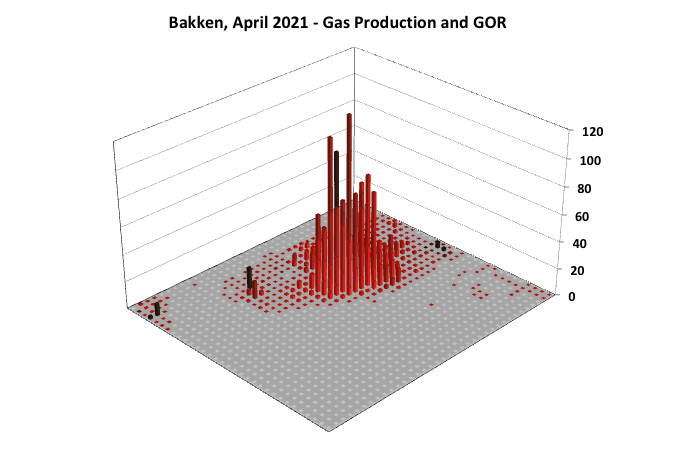
There are a few small areas that are gas prone but mostly, especially in the central region where the horizontally fracked wells are, the GOR is pretty constant with a slight correlation that higher producing wells have slightly higher GOR. The darkest red shows GOR above 10000 and the lightest at below 500, with linear gradation between.
Number of Wells
More wells are drilled per section are drilled in the centre and, like production numbers, decline steadily to the edge of the productive area. The darker greens in the section show the higher production areas. In terms of well density the highest shown is 222 wells in an area of 36 sections giving an average of 104 acres per well.
Well Productivity
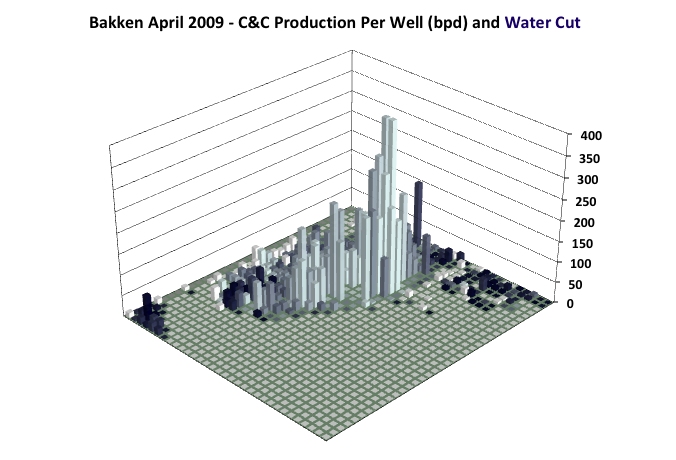
The highest average production per well occurred for a couple of areas in 2009 (they are actually off scale in the chart above).
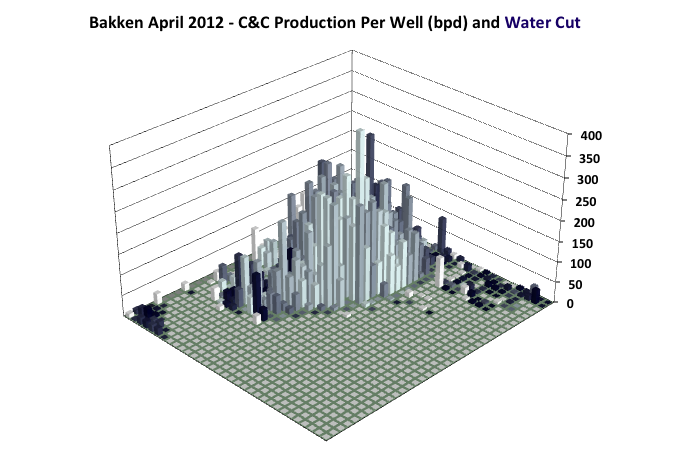

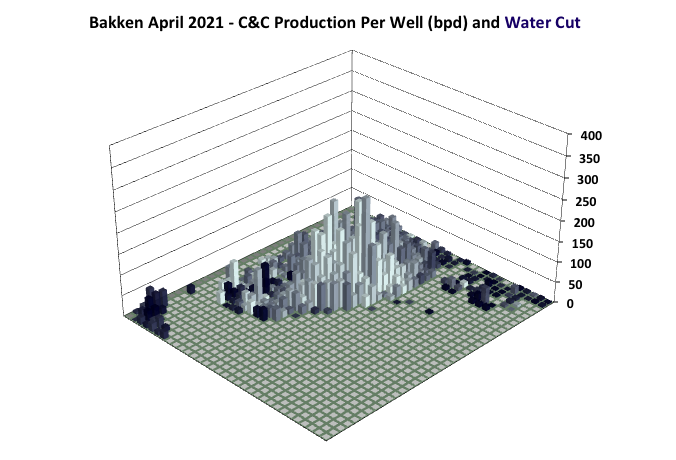
There is a marked drop in the average well productivity from 2018 to 2021, and the high water cut regions closed in from the peripheries towards the centre.
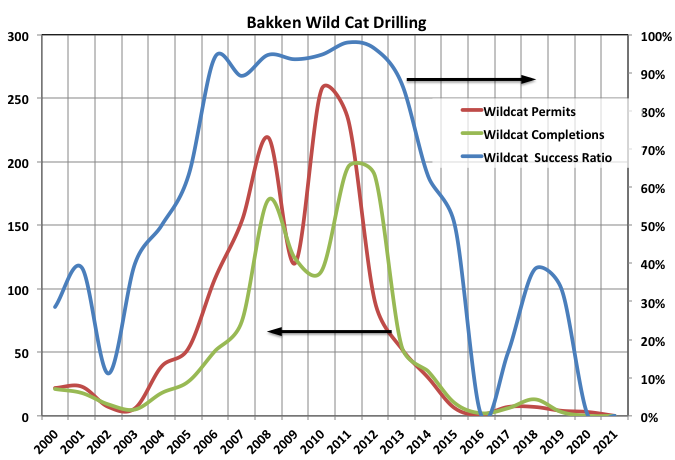
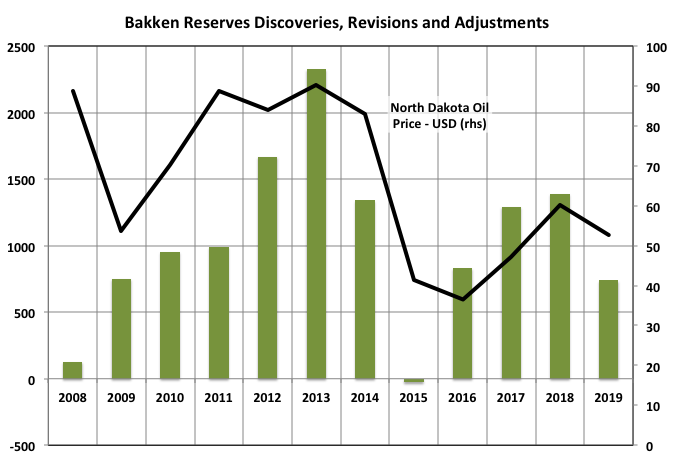
Exploration
The intense exploration phase ran from about 2007 to 2014 with many wild cats drilled and a high success rate. Since then real exploration has dropped to zero and has not revived as oil price has increased. The E&Ps know where the oil is, any increases in reserves are coming because of SEC rules that limit booking until known exploitation plans are in place. Each year there are technical adjustments, generally down-wards because recovery factors have been found to be lower than originally thought and some economic adjustments because of fluctuations in oil price (but these seem to ameliorate each year).
Development Drilling
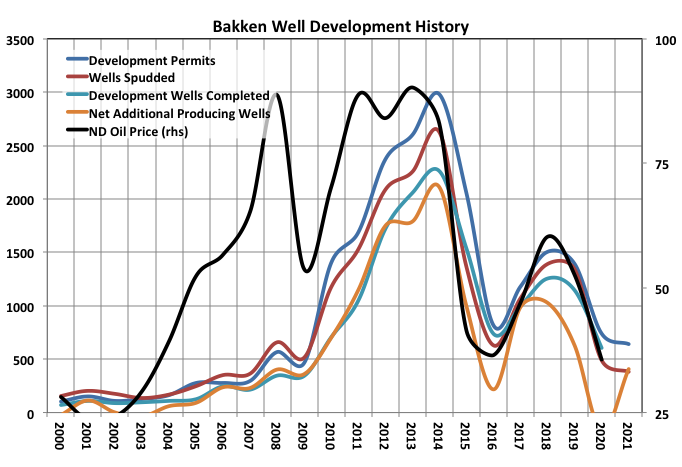
The strong correlation between price and development drilling has continued through the pandemic. There seems to have been a minimum required price around $25-30 before any thing gets permitted and then a close and fairly linear relationship between new permits (with slightly later and fewer drilled wells and similarly for completions). This has to break down sometime as the resource becomes exhausted and 2021 may be the beginning of that as drilling and permitting activities remain at 2020 levels (the graphs have been prorated through May to give annual figures) even as monthly prices have been increasing (2021 price is not shown). One thing the pandemic definitely did is to cause a number of wells to be taken off-line and a significant proportion of those appear destined to be P&A’d (which will cause downward adjustments in reserve estimates).
Well Activity
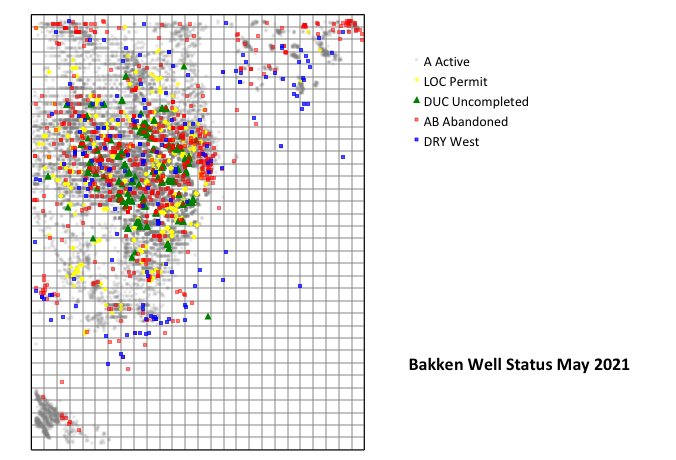
The visible dry well symbols neatly delineate the productive area. The DUCs and active permits are pretty evenly spread out, suggesting there are no particular surprises to be expected in production (i.e. continued decline, with most production concentrated in the centre).
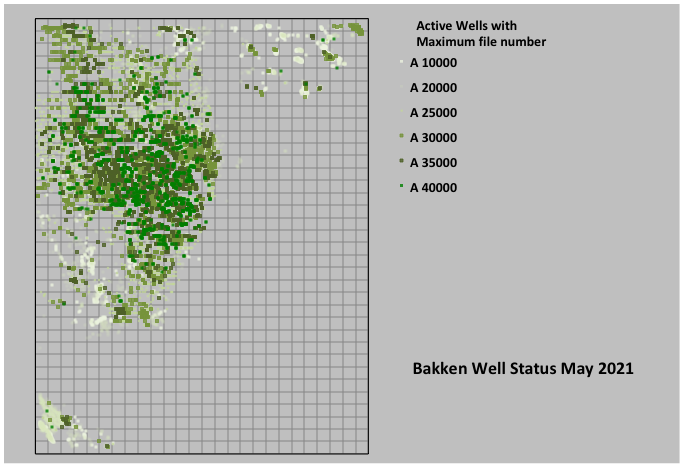
The darker spots show the higher file numbers and therefore the more recent wells. If anything the newer wells are becoming more concentrated towards the centre of the production area rather than spreading to the peripheries.
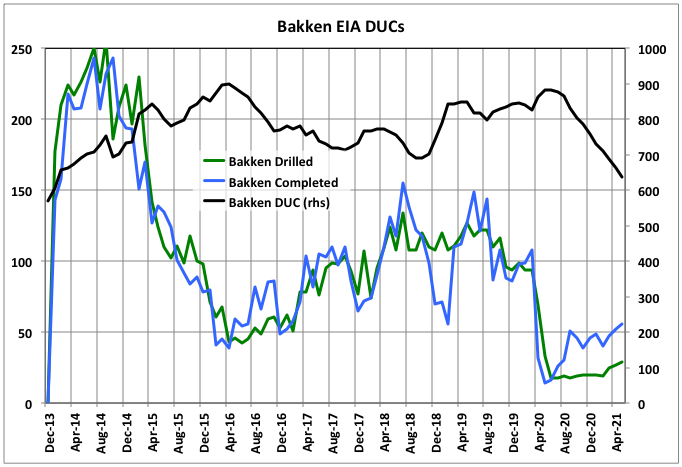
The number of DUCs (drilled uncompleted wells) has been steadily declining over the last couple of years. For logistical reasons there need to be 3-6 months inventory, at present rates that’s about 200 to 300, a level that could be hit in about 18 months if the current trend continues. Given that some of the DUCs might be quite poor quality there could be a sudden drop in new wells coming on line as soon as a year unless the economics of the remaining prospective areas improve enough to justify significantly increased drilling activity as well as the completion costs.
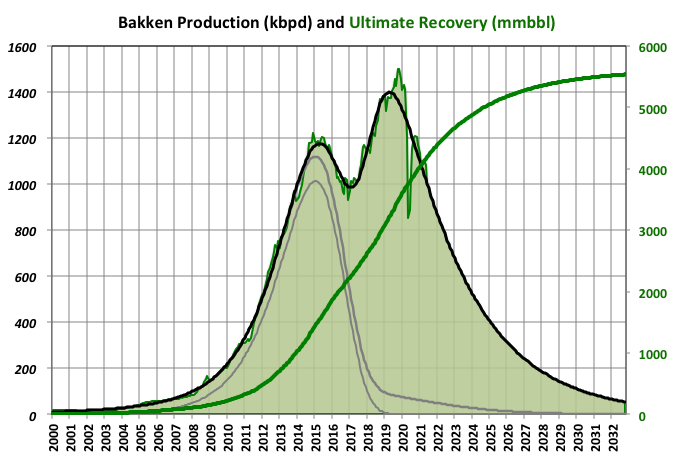
Production Projection
This is not so much a projection, certainly there’s no attempt at bottom up analysis) as an extrapolated curve fit using three Verhulst curves. However, given the rate that the DUCs are being used up, the lack of interest in adding new drilling rigs, the marked drop in well productivity in the most prospective areas, the rise in water cut and general downward trend in revisions and adjustments irrespective of oil price volatility the rapid decline shown may not be unjustified.
Off Topic Finish: Global Unrest and the Risk Analysis Industry
I’ve been reading a recent OECD report called “Perspectives on Global Development 2021: From Protest to Progress?” I love that question mark, and my answer is “No!”
I wonder with such reports what the ratio is of all the man-hours spent by people reading them to those spent producing them. My guess is it may be below one, especially if you discount readers who are only doing so as part of research for a similar such report – the reference lists are always huge) and in these days of internet challenged attention spans reading mostly will consist of skimming with little real attempt at understanding especially of anything that contradicts the reader’s pre-existing conclusions.
Notwithstanding that I would recommend everybody read at least the executive summary. Although from the OECD, whose members could be blamed for most of the ills that the report addresses, it is a balanced look at the rise of social discontent over the past thirty years, especially the acceleration since the 2008 financial crisis. If anything it is liberal leaning, anti growth, environmentally aware and fully recognizing that BAU cannot go on.
There are the normal omissions (not much on overpopulation) and assumptions (humans as rational actors who understand and look after their own interests above all else) and the normal happy-clappy “all is well” conclusions but even here I can see signs of nasty reality starting to impinge. Here are some of the summaries paragraphs:
To begin, the report identifies an apparent paradox of discontent that underlines the importance of looking beyond gross domestic product (GDP) as an indicator of development: why were people increasingly unhappy before the COVID-19 pandemic when the global economy had performed so well? Over three decades from 1990 to 2019, developed and developing countries alike grew almost uninterruptedly. Per capita GDP and wealth rose, extreme poverty declined sharply, middle classes emerged in a large number of developing countries and living standards improved across multiple dimensions . The report identifies four keys to unlocking this paradox: widening inequality within countries; the fact that not all well-being indicators followed the same upwards trend as income and did not reach all parts of the population; the strains imposed on the global labour force; and the worsening environmental catastrophe.
The report then dives deeper into discontent itself. While showing that protests hav e risen over the past decade in all regions, it finds that middle-income countries and middle-c lass citizens are the main drivers of this increase. It also finds evidence of contagion and commonalities between countries that lend weight to a sense of generalised discontent. Acknowledging that evidence of discontent is visible not only in protests, the report also points to declining trust in government, declining voter turn-out and declining support for democracy as proof of citizens’ dissatisfaction. Although these variables are biased towards countries with democratic systems of government, protests have also been rising in authoritarian states.
Public attitude surveys from different regions reflect this discontent and articulate citizens’ most pressing worries. They reveal that many people were struggling to get by even b efore the pandemic and that life was falling far short of their expectations. Economic issues were a source of concern for many people around the world; so too were security, governance and public services. These concerns correspond to a number of traps that confront developing countries related to low productivity, weak institutions and social vulnerability. The report also emphasises the importance of voice: if people took to the streets or refused to vote, it was often because they were not being heard.
These factors alone do not explain the rise in discontent. The report contend s that discontent emerges from interactions between the factors outlined above and fault lines within a country’s social and political context – a complexity exemplified by the relationship between inequality and discontent. These structural factors evolve over a longer timeframe and tend to be exacerbated by the megatrends of our age. The report identifies the erosion of traditional social networks and secondary institutions, the decline in interpersonal trust and the emergence and intensification of so-called culture war s as evidence of social atomisation and polarisation. Technology is exacerbating a number of these phenomena: digital divides are worsening inequalities and leaving some people feeling more alone or less satisfied with their lives, while the increasing use of online networks to share information risks exacerbating polarisation. Social media has emerged as an important tool for social movements to mobilise support. At the same time, political systems are becoming less adept at mediating social divisions.
There is a whole library of OECD publications (often in collaboration with other organisations like the FAO or World Bank). If they are all as good as this one I’ll be impressed. One new realization to me is how much damage technology has done to our social cohesion I think the pressure of increasing population density is equally damaging but not considered in the report, and the increasing heterogeneity of cultures (normally one of the better things about life today, I think) will become problematic. As a consequence people who think we are all going to pull together in the face of the coming global catastrophes, as in the spirit of the blitz, are likely to be disappointed.
The OECD output is part of an industry of academic departments, government agencies, NGOs and business consultancies coming out with reports on global risks, sometimes the discipline is called peace studies. For example:
I have found none of these others to others to be as balanced or comprehensive as the OECD paper. The organisations aimed at the business world tend to have a narrow focus on the coming year and how to profit in it, while the academic papers can feel divorced from reality, especially concerning proposed solutions.
256 responses to “Bakken Summary”
Thanks George.
Not had time to read it all yet but thought this report also adds to the debate.
https://info.gorozen.com/2021-q2-market-commentary-iea-ushers-in-coming-oil-crisis
08/07/2021 at 1:15 pm Edit
Thanks, Lightsoout, this damn PDF is a bombshell, and from the IEA no less. In the past, the IEA, like the EIA, has always been overly optimistic. Now they are turning pessimistic. What a turnaround. From page 5, bold mine:
In previous letters, we have carefully outlined our belief that non-OPEC+ oil supply outside
of the US has already started to decline. Over the last 10 years, the only source of non-OPEC+
oil supply growth has been the shales. Except for the Permian basin, every shale in the US
is now in persistent decline. The shales remain 1.4 m b/d below their highs and our modeling
suggests they will never regain previous production peaks. Even before the massive upstream
capital cutbacks now being forced on the supermajors by ESG pressures, production from
this group was in decline. These declines will only accelerate.
And speaking of reserve growth, they post these majors reserves, and how they have shrunk, not grown.
Ron- are you quoting the IEA or the publishers of that investors newsletter?
For comparison, cumulative North Dakota Bakken/Three Forks output at the end of 2019 was about 3.3 Gb, based on NDIC data. EIA has North Dakota proved C plus C reserves at 5.9 Gb at the end of 2019, roughly 0.5 Gb of the North Dakota reserves are conventional with the rest being tight oil, so about 5.4 Gb of proved tight oil reserves.
This suggests an estimated URR of about 8.7 Gb if probable and possible reserves and contingent resources are equal to zero. My most recent Bakken scenario (assumes WTI maximum of $75/bo in the future) has North Dakota Bakken/Three Forks estimated URR at about 8 Gb. Cumulative production through May 2021 is about 3.9 Gb, so I would agree Bakken is likely past its peak.
So many peaks claimed, so many peaks refuted in the future. It strikes me that this website, comprised of quite a few holdovers from TOD, once thought this was the peak. Check out conclusion #3. http://theoildrum.com/node/3868
It should also be noted that years after this petroleum engineer ventured an opinion as discredited as that of Colin Campbell’s 1990 global peak oil, another TOD editor had this to say in 2011. “Truth in Energy” being the title by this gang of Happy McPeaksters. The quote from Art is at about the 13:45 mark, “when I look at the volumes of oil, I don’t see enough to make a difference” when referring to the US. Watch the entire thing, because moments like this were the beginning of the end for both ASPO and TOD. https://www.youtube.com/watch?v=dcFYB3gelyA
Rinse, recycle and repeat didn’t work when Colin Campbell began doing it by the turn of the century. Endlessly claiming peaks just because there was one (or 2, 3 or 4 prior) is faith based belief in action. Why is the most recent peak THE peak? Because I want it to be. Because I can’t study the past and understand WHY multiple peaks have happened, or the distances between them, or the independent variables involved that aren’t related to some amateurs bad guess on how resource economics basics work. Come on folks, surely the remnants of TOD can do better than rinse, recycle and repeat?
Mr. Reserve Growth Rulz, I agree. Any damn fool should know that reserves will just keep on growing and growing forever. And because they will keep growing, oil production will never peak.
And it should be obvious to everyone that because peak oil predictions were wrong in the past, they will continue to always be wrong in the future. Hell, that’s just common sense. Isn’t it?
Not to mention the fact that oil is clearly abiotic in origin and not “finite” as these “happy mcpeaksters” seem to think … The nerve of these killjoys.
Mr Patterson, my nom de plume isn’t ReserveGrowthRulzForever, but ReserveGrowthRulz. This was based on the obvious fact that starting sometime after 1980, something else was causing production volumes to be replaced. The WHY volumes were being replaced is called “reserve growth”.
As far as those who cannot learn from past mistakes constantly rinse-recycle-repeating peak oils, that is nothing more than historical fact. I would challenge that the object of this exercise is no longer the silliness of declaring every peak that comes along as THE peak oil, but the true genius will be in forecasting how many more will occur before FINALLY the Broken Clock McPeaksters can collapse, exhausted, after their 3rd-8th-13th peak claim, and declare victory. Of course peak will happen, Hubbert’s expression of 3 distinct points related to the extraction of a finite resource has never been in question. A beginning at 0, a maxima along the way and a return to the the final point of 0, once again.
I understand that your demonstration of the techniques used to dismiss my LUDICROUS claims (otherwise known as perfect foresight 🙂 )of peak oil being ridiculous 15 years ago is nothing more than proof of what HASN’T been learned among the faithful remnants of that wildly entertaining time. Let the Broken Clock routine continue!
A beginning at 0, a maxima along the way and a return to the the final point of 0, once again.
I’m glad that you admit the reality of the mathematical neccessity of a maximum. Considering the importance of that peak for modern civilization and the earth’s climate, why disparage people who are urgently attempting to discover when it has or will be reached?
And considering that the peak will almost certainly be closer to the year 2000 than 2100, fixing such an important event within a decade or two is accurate enough. There is no need to ridicule people for being a few years off.
I’m sure that there are a few people, perhaps like yourself, who take a very long view and want to wait a hundred years or more after the peak before declaring it, but some people are understandably anxious about peak oil and its consequences; peak economic output, peak civilization, peak population, peak peace.
Anyone who isn’t on pins and needles about the timing of peak oil is not paying attention.
Why would you be glad that anyone recognizes mathematical necessities? Like faith based belief is somehow the assumption of what works? While folks might want to assign to me all the typical strawmen, saying it don’t make it so.
I consider all peak oils. So your question about peak being closer to 2000 than 2100 is EXACTLY the question that needed answered. And of COURSE I get to ridicule people for being deterministic in their thinking, regardless of the date they choose. There are no facts in the future, so the instant someone simply picks a year, odds are it will be wrong. That is just a given of a simplistic deterministic method. Pile on top of that the idea of resource size being the main independent variable, and you’re already halfway to why the broken clock routine might be the only option available to those who operate this way.
As far as declaring peak oil, anyone who continues to randomly pick dates in the future without considering why it has been wrong in the past (and here is the key…LEARNING FROM IT) are simply playing the broken clock game.
As far as declaring peak oil, anyone who continues to randomly pick dates in the future without considering why it has been wrong in the past (and here is the key…LEARNING FROM IT) are simply playing the broken clock game.
Reserve Growth Guy, now I see why you are so full of shit. You just assume dates are picked randomly, with no other criteria than pulling the dates right out of our ass. And you assume the data from each nation cannot be analyzed, that any nation now in steep decline might easily turn things around and suddenly reach new heights of production.
Russia, one of the world’s three largest producers, has already stated that its oil production has peaked. Many other nations have been in decline for years. I have analyzed every major oil producer on earth and have concluded that world oil production very likely peaked in 2018-2019. The below article was published this past December.
The Very Real Possibility Of Peak Oil Supply
Peak Oil Supply
Though rarely discussed seriously, Peak Oil Supply remains a distinct possibility over the next couple of years.
In the past, supply-side “peak oil” theory mostly turned out to be wrong mainly because its proponents invariably underestimated the enormity of yet-to-be-discovered resources. In more recent years, demand-side “peak oil” theory has always managed to overestimate the ability of renewable energy sources and electric vehicles to displace fossil fuels.
Then, of course, few could have foretold the explosive growth of U.S. shale that added 13 million barrels per day to global supply from 1-2 million b/d in the space of just a decade.
It’s ironic that the shale crisis is likely to be responsible for triggering Peak Oil Supply.
In an excellent op/ed, vice chairman of IHS Markit Dan Yergin observes that it’s almost inevitable that shale output will go in reverse and decline thanks to drastic cutbacks in investment and only later recover at a slow pace. Shale oil wells decline at an exceptionally fast clip and therefore require constant drilling to replenish the lost supply. Although the U.S. rig count appears to be stabilizing thanks to oil prices rebounding from low-30s to mid-40s, the latest tally of 320 remains far below the year-ago figure of 802.
Although OPEC+ nations currently have about 8 million barrels of oil per day of spare capacity, the current price levels do not support much drilling at all, and the extra oil might only be enough to cover the shortfall by U.S. shale.
One comment on the above article. Anyone who believes OPEC has 8 million barrels per day of spare capacity “at any price” just fell off a turnip truck.
Sir , we all knew about fracking in 2010 but did you know about QE? It was only free funding that made shale oil possible and extended the date . Now as the funding dries up so will shale oil . You and others here know that all increase in supplies since 2010 has come from shale . If you knew about QE in 2008 ( when Bernanke and Paulson triggered it ) then I will recommend your name as the next chief of the FED .
P.S : I support QE because it gave us an extra 10/15 years of the good life , but I don’t take my eyes of the ball . Unfortunately for us QE has run out of road . What next ? I think the tool box is empty . Second question for you ? Was Malthus wrong or just early ? Was Hubbert wrong or too early ?
QE funded Shale oil in around about way. US pension funds needed 7% return and could no longer make that happen. Still do and still can’t. Even with leverage they couldn’t make it happen investing in fixed income or government bonds. QE pushed $19 trillion in pension fund money to invest in all kinds of stuff. Including shale oil. It’s the corporate debt these pension funds are buying.
QE is not money printing contrary to popular belief. Corporate debt is in a bubble, Bid there by yield starved pension funds. Stocks are in a bubble bid there by CEO’s who sold debt to pension funds and used the money to do stock buybacks. Housing is in a bubble. In order to keep bubbles inflated we have to have lower interest rates. Not higher.
Money isn’t coming from the FED because they can’t print money. All QE does is transfer assets to it’s balance sheet via a collateral swap. So the collateral that underpins the entire economy both real and financial doesn’t get repriced or market to market at a much lower value.
I expect FED’s balance sheet to double to 16 trillion then again to 32 trillion. They have no choice. It does create a problem though. If they are unwilling to let collateral reprice lower in any meaningful way to make things more affordable it creates a huge gap between the haves and have nots.
I’ll just assume that pension fund money will be funneled into going Green. And I’ll assume that these pension funds will be on board with the whole ESG movement. So yeah money will be cut off to fossil fuels.
I’ll also assume that when quality of life falls off a cliff things like ESG and carbon neutral will be abandoned.
HHH,
Very well said and I wholeheartedly agree. Thanks
I know I hardly post as I feel intimidated with all the smart commenters here. But please know that as a long time lurker, that I am quite sure there are many other people like me on this great blog site.
Doc Rich , you are welcome here . Don’t feel intimidated or embarrassed even if you make an incorrect observation . We are bozos on the same bus looking to avoid the ill effects of ” peak oil ” and the end of the oil age . Hope we will see more of your comments .
What the Fed did during the bailout of 2008 was pretty much a pure assetswap though. They bought questionable mortgages at 100c on the dollar and gave treasuries in return.
QE is funded by freshly created (“printed”) money. A bank gives the Fed a bond and the Fed gives the bank reserves. Those reserves can be lend out (currently they are overall not lend out which is why reverse repos are at an all-time high).
The net result is that yields are pushed down below their free market level which is causing distortions as we see (saw?) in the funding of – for example – shale companies.
QE can be a collateral swap but it that does not seem to be case – the consideration that banks are receiving aren’t treasuries but newly created reserves. Keep in mind that both the private sector as well as the public sector can create money.
Rgds
WP
Bank reserves aren’t money.you can’t buy anything with bank reserves. Banks can’t take these bank reserves and go buy stocks or anything else with bank reserves. You also can’t extinguish debt with bank reserves. Bank reserves aren’t money. They sound like money and the Fed wants you to believe they are printing money but they are not. And reverse repo pays 5 whole basis points. Think about that 0.05 is what that looks like. Bank reserves are useless. Banks use these bank reserves at reverse repo to access the treasuries the Fed has on its balance sheet as collateral to fund their market positions. And there is a huge collateral shortage due to Fed buying all the T bills. That’s why reverse repo is at 1 trillion $
@HHH
I thought the FED buys the bonds in an open market operation. They have to pay somehow – and if they pay with useless reserves nobody would sell to them, or at least with a big premium.
I think the bonds can be used as collateral directly, or sold, so why sell them for useless reserves? Who sells the bonds to the FED – they can’t buy directly from the state.
Guys, the Fed does not buy bonds on the open market and they do not buy them from banks. They buy only Tresurary Bonds from the US Treasury.
How does the Federal Reserve buy bonds?
The Federal Reserve monetizes the U.S. debt when it buys U.S. Treasury bills, bonds, and notes. When the Federal Reserve purchases these Treasurys, it doesn’t have to print money to do so. It issues credit to the Federal Reserve member banks that hold the Treasurys. It then puts the Treasurys on its own balance sheet.
Ron : the Fed does not buy treasuries from the Treasury:
https://www.federalreserve.gov/faqs/how-does-the-federal-reserve-buying-and-selling-of-securities-relate-to-the-borrowing-decisions-of-the-federal-government.htm
Rgds
Vince
Yeah, I misspoke there. The bonds are actually bought by the public as Treasury Bonds. The money actually goes to the Treasury to finance the debt. That is over and above the money collected via taxes. But it is the same thing. The money from the sale of the bonds goes to the Treasury. The Fed is just the middle man.
QE is this exact opposite of what they say it is. They say it’s loose monetary policy. Fact is low interest rate are a sign of tight monetary conditions. They are a sign that money isn’t really following through the economy like it should. If the FED was actually printing money. Flooding the economy with money. You’d see liftoff. Only inflation we have is supply side disruption. Which will remain or get worse due to lockdown in China and elsewhere and drought in western USA.
FED tightens monetary conditions to lower interest rates. Hoping lower interest rate will spur leading. And it doesn’t work. And higher interest rates will surely not work either. Japan has been doing QE for 30 years and it hasn’t worked.
Only reason why markets are still bid is $19 trillion of pension fund money that has to have 7% return. The need for 7% return on capital trumps all logic. They have to invest otherwise they have no chance of meeting obligations. That is why every dip has been bought. Why we don’t see any meaningful correction or revert to the mean in equity markets.
Yes it will end one day. And oil or lack there of will play big part in why it all comes to an end one day. Timing is the only real question.
With 7.5 million people in the next 5 weeks losing not just their federal unemployment benefits but state as well. A lot of the open job will be filled. Which there are 1.4 million more open jobs currently than people on unemployment benefit. If you believe what the data says about that which I don’t. A lot of those 10 million available job were double counted. But in any case the unemployment number is set to drop very low if you go by government numbers. Which is a problem for the FED. They have to talk about tapper at that point.
FED is going to need bad data. And a lot of it. Because it would be major policy error to allow interest rates to rise.
Reservegrowthrulz.
We will see if the North Dakota Bakken/Three Forks has peaked. There have been many peaks for World output, that is correct, eventually World output will also peak, perhaps due to a peak in demand and demand falling faster than supply at market clearing oil prices.
There are many examples of individual nations that have peaked, I doubt that the current peak in UK C plus C plus NGL output will be surpassed for example.
A scenario with prices over $130/bo (in 2021 $) could potentially lead to a new Bakken Peak, if the completion rate was high enough (about 160 wells completed per month).
Even such a scenario does not reach the monthly peak, but I focus on centered 12 month average and a scenario can be created that has a new peak, but very optimistic assumptions must be made (a very high oil price scenario with a very high completion rate). In my view such a scenario is low probability, perhaps about 5%.
Dennis, we are ALWAYS seeing things peak. We saw it at TOD in the Bakken, just as we did the world, just as we saw it for the world in 1990 when Colin began trying his hand at randomly trend fitting production. You are correct that there are plenty of examples of regions peaking. Including ones used by Hubbert as examples of how the concept works. Go check out his 1956 work and examine his Ohio example, and compare it to what happened AFTER 1956. Do I need more than Hubbert’s own examples to demonstrate that claiming a peak most certainly doesn’t make it so? Sometimes years, decades or even of a majority of a century are required to reveal what was missed in the now, when claiming a thing in the future. I know we have discussed probability before, and how you throw out a number for a particular scenario. I believe I have previously mentioned that the probability flowing from the system is my preferred method, rather than guessing.
Rulz says:
Do as I say not as I do is his byline. What else is the shock model but a careful analysis of probability flows given that the laws of finite supply exists? This is actually more tractable than trying to predict the flow of a virus through a population, as that can always reappear after it has seemingly disappeared. Not the case with a non-renewable resource of course.
Rulz needs to go through these contortions to try to save face.
“What else is the shock model but a careful analysis of probability flows given that the laws of finite supply exists?”
If memory serves, you once claimed that the less you knew about the thing you are predicting, the better the answer was. My response to that, even back then, was that building from the ground up, rather than the top down, was a better approach. I demonstrated this by asking you what the resource estimate was, in your system, for the Falkland Islands. You answer was “subtract everything else from the world, and the remainder is the Falklands answer” which, while entertaining, demonstrated that you couldn’t use a single geologic piece of information to answer that question, and couldn’t answer the question because you didn’t even know WHAT to subtract. Compare this to a bottom up approach, where the information a geologist knows and can quantify, the sedimentary history, the generation window and timing, the organic material available to make oil or gas, can be turned into a small scale estimate. I read parts of your book Paul, and it demonstrates exactly what you told me before it was written. Pick some data, and apply complex and purposefully uninformed trend fitting. Call me old fashioned, thinking it comes in handy to know some of the particulars involved. Remember the good old days? Which one of these was yours? Let me guess…one of the ones that said a peak would happen, rather than what reality revealed? http://theoildrum.com/files/PU200804_Fig3b_small_0.png
“Rulz needs to go through these contortions to try to save face.”
I was the one who knew where random trend fitting would get you back then. And interestingly, you should now as well. Have you ever heard the phrase “married to your model”?
Reservegrowthrulz,
There is no doubt that an analysis that mapped every cubic meter of the Earth’s crust would be more accurate. Go do it, looking forward to seeing it. I do not have the time or resources to produce such an analysis.
Has there been a lot of output from the Falkland Islands?
Note there is a lot of information in the World that is proprietary, so you could claim that we are not using all the information that exists. This is true, we use the information we have access to. Note also that curve fitting is done all the time in the oil industry and in science when confirmation of a proposed theory by utilizing empirical evidence is performed.
I agree using probabilities is a good idea, though probabilities of future economic conditions will necessarily be quite subjective, so determining the “probability flowing from the system” will yield a different answer for any given analyst. For example I would probably put the probability that the North Dakota Bakken/Three Forks has peaked at 65% and you might think the probability is 5% (or less). On UK C+C+NGL output I would say the probability that the peak has passed is about 95% probability, perhaps you might think 50%.
For World output the peak is likely to be determined more by demand than supply as the transition to electric land transport reduces demand growth and keeps oil prices in check (likely to less than $130/bo in 2021$). This is likely to keep conventional World C plus C URR under 2800 Gb and unconventional C plus C (defined as tight oil plus extra heavy oil with API gravity less than 10 degrees) URR at less than 300 Gb (World C plus C URR of 3100 Gb with a 90% confidence interval of 2800 to 3400 Gb).
Dennis,
I would go further in that every mathematical model representing some physical data is an example of curve fitting. It’s just a matter of what dimension the curve is. If it’s one dimensional curve it’s essentially fitting to a point. If it’s more it will be a multi-dimensional curve or manifold. So slamming something by calling it “curve fitting” is not much of an insult 😉
Rulz is also very confused about assigning this assertion to me ” the less you knew about the thing you are predicting, the better the answer was”. Perhaps what he is trying to recall is the Maximum Entropy formalism of making predictions about a data distribution via a minimal number of assumptions. Thus if all one knows is the mean one can apply a damped exponential and if all one knows is the mean and variance, one can apply a normal Gaussian distribution. This is nothing new, but it works very well and actually forms a basis of the field of statistical mechanics in physics.
Overall Rulz is upset that we are digging through the available data and taking responsibility by putting our names to our analyses, while he is not.
RESERVEGROWTHRULZ Is your argument that oil production hasn’t peaked, therefore it will never peak ?
Hint:
As we know, global peak was in Nov of 2018.
That is getting a ways in the rear view mirror.
But we shall see
That is the latest peak oil in a long line of peaks, both real and claimed (before and after sometimes). It would seem more useful at this point to estimate how many more peak oils there might be rather than pretending that only the most recent is likely to be THE peak.
I’m waiting—-
We will see who is right
Of course not. But that seems to be one of the first claims assigned to me regardless. I absolutely state for a fact that oil will peak, and anyone who says otherwise is an idiot. The clue is that Hubbert was exactly right about a finite resource having 3 defined points through the time of extraction, a beginning at 0, and end at 0, and a maxima somewhere in between. Between those two 0’s are where all the fun is.
Reserve Growth/Adam,
The biggest innovation, at the moment, that will upend current projections will be EOR … Enhanced Oil Recovery.
Several factors are in the process of bringing this about.
One big one is the near universal adoption in the Bakken of the relatively new gas lift iteration termed Single Point High Pressure. This is prompting the implementation across the Basin of umpteen number of compressors.
Second factor is the use of solvents (unidentified, but sounds like d-Limonene) that Liberty is testing in another EOR pilot in the Bakken.
The results of Liberty’s Stomping Horse EOR project pointed out the obstacles needed to be overcome so that much of the remaining OOIP can be economically produced. Several of these challenges are being addressed by current EOR pilots by Hesse and others. Public results should be more readily accessible in 12 to 18 months.
COFFEEGUYZZ
Thanks for that post.
Single point high pressure gas lift is not new but may be a new application up there or perjuring the name. One benefit of increasing GOR over time is the availability of the gas for gas lift or gas lift assisted plunger lift. Pads with multiple wells make gas lift between wells feasible. Gas lift is the only process, by my way of thinking, that could be applied to purge the lateral from stem to stern however it would be very inefficient but way better than the alternatives that come in second such as N2 jobs.
I am curious as to the use of solvents in the EOR process by Liberty as the oil is light and thin unless there are paraffins or other residuals that drop out under pressure depletion and gas breakout. If you have more specifics let me know.
That is great info because this is the type of exploitation evolution that changes the decline curve and EURs. Looking forward to your follow up.
Rasputin,
Regarding ‘purging the lateral from stem to stern’ …
There are numerous approaches from different outfits tackling just that topic, clearing slugs/solids/crappola from the lateral with some touting a ‘tube within a tube’ approach.
Little outfit out of Michigan (Horizontal Lift?) has an interesting video describing their hardware.
Using the numbers posted on Bruce Oksol’s Milliondollarway site (all publicly accessible on the ND DMR site), some new wells are ‘using’ between 50 thousand and 150 thousand cubic feet of gas per day. This is produced gas that is neither flared nor sold. If it is being re-injected for AL, it is, essentially, being recycled.
As for the ‘other residuals’ dropping out under pressure depletion, you may very well appreciate looking at the ~18 page pdf put out by the UND EERC describing the results of the Stomping Horse EOR project.
The chart showing the asphaltene recovery (C10 – C20) with propane is astonishing
This seems to validate the idea that the larger molecules are unable to ‘squeeze’ through the micro pathways and, thus, promote both blockage and an increasingly lighter hydrocarbon product at the wellhead.
Regarding Liberty’s solvent in EOR .. it was only described as some type of eco friendly type of bio agent, or some such.
I immediately thought of that colorful, tiny outfit (out of Colorado? Utah?) that was – literally – washing kerogen-saturated earth in heated tanks loaded with tons of Fast Orange type cleaner.
Preposterous sounding, sure, but an intriguing concept nonetheless.
(The SAGD boys up in Canada have been successfully using solvents for years).
The scope and pace of innovation never ceases.
Coffee.
As I recall, you have been discussing EOR in the Bakken for several years and have touted Liberty’s efforts in that regard.
Isn’t it correct that thus far EOR has resulted in few extra barrels in the Bakken and other shale plays.
If I am wrong, can you point to some data backing the barrels shale EOR has produced?
Shallow, there has been virtually no successful recovery in the Bakken to date via EOR.
The pilot project by Liberty – Stomping Horse – failed due to insufficient gas supply. (Sounds like an odd reason to me). However, the ability to both track and control the injected gas was – according to them – both achieved and repeatable.
This is no small accomplishment.
As far as successful EOR, you are certainly aware of EOG’s success in the Eagle Ford for several years, now.
Likewise, that tiny outfit up in Canada, Granite Oil, has also been successful using reinjected field gas for repressurization and – to an extent – a miscible sweep. They were bought out by a bigger outfit last year, I believe.
The geology up there (Viewfeild Bakken?) is conducive to that approach.
I no longer track these matters closely, but a determined, diligent observer might be surprised at what is out there.
Coffee “As far as successful EOR, you are certainly aware of EOG’s success in the Eagle Ford for several years, now. ”
Maybe they succeeded on the technical side but did they make additional money ? Did they pump additional oil or did they just pump the existing oil faster ? Sometime it is all about showmanship . You know better .
Coffee.
I am aware of the huff and puff by EOG and others in the EFS. My reading indicates that multiple compressors, which can push gas at up to 9,000 psi, are required and these compressors cost about $4.5 million each. So maybe if oil gets back up over $100 sustained. Based on a review of shaleprofile, it looks like these wells aren’t making much of a dent.
As for Granite Oil, it sold for $79.7 million. A very small producer in the grand scheme of things.
My point is that, thus far, EOR is no game changer in shale, unlike how EOR has been one in many conventional fields throughout history.
An example would be our little field, where by the late 1930s, production had fallen to just over 1 million per year. Then came WW2 and waterflood. By 1960, production had increased to a secondary peak of over 4 million barrels per year.
Only since 2014 has our little field fallen back below the lows of the Great Depression. Waterflood resulted in extending our field’s life for decades.
It remains to be seen if shale EOR can do that. The oil is there, I suspect what is really needed is a very high oil price.
Shallow
If that 9,000 psi compressor qualifier came from Exterran, you may want to look at the copy just below the graphic, to wit, ‘access to lean fractionated gas’ … aka methane.
This implies that field repressurization is the primary mechanism for that application of EOR.
The Bakken is different.
Theŕe is a 2018 presentation online (46 pages) from James Sorensen of the UND EERC that describes the Stomping Horse project in an excellent fashion.
Where methane has been found to have a Mean Miscibility Pressure of over 4,500 psi, ethane is only ~1,360.
Propane plummets to ~650 psi MMP.
Operators in North Dakota have very strong incentives to use their abundant rich gas for its miscibility characteristics as much as for field repressurization.
As of the other day, per Justin Kringstad, North Dakota produces about 600,000 barrels of NGLs per DAY …over one half its oil output.
With high pressure compressors springing up all over the Bakken, with thousands of 2 mile laterals sitting underground … surrounded by rock still holding 90% of its original oil, with a quarter of a million barrels of ethane being rejected every day into the gas stream (bumping the parameters of the Northern Border takeaway pipe), there are many, many factors falling into place that would lead one to surmise that Bakken EOR will become a hot topic within the next 2 years.
The additional 25%+ recovery rate garownteez it.
25% more recovery is good.
But expensive compressors, extra installations and huge utility bills for pumping lot’s of gas into the hole at high pressure make this a financial zero sum game easiely, or even a loss.
It’s the same problem as in the hydrogen car discussion in the other tread – compressing and decompressing lot’s of gas to high pressures eats up a lot of energy.
Water flood recovery looks like to use up much less electricity for the pumps, making these extra barrels cheaper.
You can always have better recovery technics, but they have to pay out financial and energetic.
As an exteme example, you could dig out all the all the source rock with mining equipment like coal and queeze out 100% of the oil in a processing plant. You’ll yust have to power it with an atomic plant (or a giant solar farm) and sell it for 500$ a barrel – but you would have lot’s of oil. So recovery technology has not only to work.
Eulespeigel
Those are valid points, but – again – they are being addressed in rapid fashion.
When a retired EOG engineer proposed, in 2016, his new concept of Artificial Lift using a single injection in place of the historical ~15/20 points which necessitates using relatively expensive valves, an immediate problem arose as no large volume high pressure compressors were widely available on the market. Hence, custom made units were expensive.
EOG collaborated with a compressor company, had a few units built which showed success, and now other companies are using this process.
Eliminating the problems and expenses with Electric Submersible Pumps has been a big upside to this high pressure gas lift approach.
However, this new reality of having a large, expensive (but getting cheaper) compressor on a pad with 6 to 12 wells greatly facilitates – both operationally and economically – the concept of rich gas re-injection for EOR if the technique can be proven to work.
The Stomping Horse project showed that it can work.
As for power expenses, these units use onsite gas to fuel electric generators which provide the electricity.
This is a reason why so many cryptocurrency miners are now in the Permian and Bakken capturing the unwanted flared gas to power generators for their mining needs.
This gas flared or wasted for useless things like bitcoin mining sells in the Asia market for lots of $, and even here in Europe it costs 6 cents per Kwh (burn value) at the moment. So it is 14 us cent / Kwh electricity when you take a modern 50% turbine.
So think again what you are burning there. You are just waisting a ressource because someone forgot to build a pipeline (or everyone is still pumping too fast and forgot earning money by bumping more then pipeline capacity).
Imagine they forgot the oil pipeline and build the gas pipeline. Then there would be big lakes of burning oil to be able to sell the gas fast.
PS: Bitcoin mining is a complete waste. There are modern proof by stake concepts for digital currency – then you could run the complete bitcoin network on round about 10,000 Rasberry Pis for 100Kw electrical power when they convert.
You are certainly discussing why reserve growth rulz Coffeeguy. But in order to create a system to handle everything currently known in order to predict a peak, you’ve got to be far more inclusive as to the mechanisms that haven’t been properly included in the past.
I had posted this at the fag end of the last post . Dennis and Ron had made comments but I am bringing it on to this thread to know as to what members or lurkers think about this .
“I am going to toss a ball , let us see where it goes . Some bullet points .
1 . There is now a consensus (yes a few holdouts ) that the world peaked in 2018 .
2 . There is now a consensus (yes a few holdouts ) all the major producers Russia , USA and Opec 5 are past peak .
3. Shale oil is now a ” sunset ” play .
4. USA peaked in 2019 .
5. The price of oil will not touch $ 100 on a sustained basis (+6 months in continuation )
6. ELM will trigger unintended consequences that we do not know of just like the ” war on terror ” .
7. Anything or any addition or subtraction to my bullet points is most welcome . Agree or disagree let us churn the mixture . Let the games begin .
P.S : To lurkers , this is a civilized blog (tks Ron , Dennis and bloggers ) come out of the woodwork and post your opinion .
HinH-
I would be very surprised if oil did not sustain above $100 in this decade.
Probably we come at this differently because I don’t see demand being as price sensitive (fragile) as you do.
We also see a countervailing force very differently- I suspect that in late decade electric vehicles will start making a significant dent in petrol demand.
Hickory —
In my view there s a huge gap between what consumers are willing to pay for liquid and what it costs to provide it. As evidence of this consider the high taxes in Europe, which make $5 a gallon prices normal.
As a result, in the short term it’s mostly just market psychology that drives oil prices, not supply and demand. For example when Bush started his little adventure in Iraq, prices shot up, on fears that turmoil in the region would reduce supply, and stayed high even when there was very little actual interruption. When people noticed that the Arab Spring didn’t do much to interrupt supply, prices fell.
So I don’t expect prices to go above $100 again unless some new panic like the 9/11 hysteria occurs.
Alim-
I’m thinking that in this decade that supply will indeed fall below demand (not just expectations or psychology), and the shortfall will be sustained long enough for higher oil prices.
Severe global recession for some reason would make this notion false.
Hicks , we are now not in a recession we are in a depression . Selling inflated priced houses and shuffling overvalued paper is a ” zero growth ” . It only leads to increasing inequality . No economy in the world has reached “pre covid ” status and it is already 18 months . The way things stand today it seems 2021 will also be a washout like 2020 . Why do i say we can never go back ? The reason is that Covid killed the travel , tourism industry which was 17% of the total world’s GDP . This is not coming back . One cannot kill such a dominant contributor and expect to regain lost ground . What we are now experiencing is a REBOUND it is not a RECOVERY . If you are in a hole 50ft deep and regain 30 ft you are still in the hole .
Regarding prices , what quotes we get are futures prices which at this stage are difficult to gauge with the rolling lockdowns in the short term (12 months) . In the medium term my guess is that demand will not rise at a fast rate because the world is going to get poorer . Demand will be stagnant or show a small increment due to population rise ( even the poor, very poor use kerosene ) but the demand per capita will decline . The growth engines which were South East Asia have been the worst hit by the Covid crisis and it will take anything from 3 years (extremely lucky ) to 5 /7 years for them to reach pre covid levels . This will keep a lid on price of oil .
Just something of interest , India imported the same level of oil in 2021 what it imported in 2018 but the import bill is up by 190 % . Luckily they have a good buffer of US dollars but not all economies are so well geared to face such a rise .
P.S : The USD surplus in India is not due to trade but by remittances of workers in USA , Europe( software etc), KSA , Dubai , Qatar(construction ) etc . India has a negative trade balance .
https://www.livemint.com/market/commodities/indias-crude-import-bill-rose-over-190-at-24-7-bn-in-q1-11628190965940.html
Its been about 7 months since vaccinations started.
Within another year everyone who wants one will have had a chance.
Baring new variant or other economic body blow, the world economy is on track to resume energy demand at prior levels, and above.
Is what it looks like to me.
Hicks , the vaccine is a single point solution to a health issue , it is not a solution to a multi-dimensional issue like the economic system . Vaccine will not wipe out the debt , it will not bring back jobs . You put too much hope on the vaccination . When do we get herd immunity ? 80%-90% ?
Just for laughs ” We will get herd immunity when Pfizer has a turnover of $ 1 trillion ” 😉
Hickory,
It’s worth noting that $100+ oil barely dented consumption. If it really comes to shortages I think prices might go significantly higher, unless there is a concerted government push to cut consumption.
Alim, last $ 100 oil was July 28 2014 . The whole environment has changed . 7 years is a long time ago . It is a much poorer world . With the pandemic it is now an absolute new paradigm .
Comments from previous thread at link below after 1st comment
https://peakoilbarrel.com/us-may-oil-production-growth-surprises/#comment-722680
You might be right, but I am just an ignorant passerby here.
Ron , did you get around to reading the book recommended by Steve ? If yes , your viewpoint .
HH, probably not because I have no idea what book you are talking about. Refresh my memory.
Ron,
“TOO MUCH BY HALF” Coming Cut In Proved Oil Reserves, by James Dietrich.
steve
No, I did not read a lot of it. But I did skim it and read a lot of it. I was disappointed. It is just this guy’s life story, his life in the oil patch. Only in the last few pages does he get into what we thought the book was all about. From page 232:
There’s a wide variation of the proportion of total hydrocarbon volume that will not flow, varying from nearly “0” for most parts of really great reservoirs–like those of Johan Sverdrup (Chapter 22) — to nearly “1” for many parts of really poor reservoirs — like those of Novy Urengoy (Chapter 16). A number of “1/3” is a reasonable single low estimate for applications worldwide, implying that “2/3”, or less, of so-called proved reserves are movable. In other words, proven reserves on average are Too Much by Half.
The book was not what I expected.
That’s what put me off too. I read the sample on Kindle on a train ride and was disappointed that it didn’t seem to have the meat. I guess it is purely memoir rather than some dry textbook sprinkled with anecdotes.
Saudi rig count at ten year low:
https://ycharts.com/indicators/saudi_arabia_oil_rotary_rigs
July 31, 2021: 27
July 31, 2020: 48
July 31, 2019: 66
Evidently nothing worth drilling . That is a big down leg , from 66 to 27 in just two years . Tks for the update .
Hole in head,
I would think they have cut back on CAPEX spending just like non-OPEC nations have done. US oil rig count for example went from 776 to 385 over the same period (July 2019 to July 2021). As prices rise and market stabilizes we are likely to see the rig count rise both in the US and elsewhere in the World. Rig counts will follow oil prices as the fluctuate higher and lower, usually with a 6 to 9 month lag.
Dennis,
True that – capex for all oil companies has declined. However, with oil rigs at 27 vs around 60 before the pandemic, the Saudis can hardly claim to have higher capacity than before. Their historical peak annual production is around 10.5mmbpd (the max they produced in a year) and now they have got a baseline of 11.5 and claim 12mmbpd of capacity.
Is that believable in light of the rig count cut by half? Especially because we have to consider that some of the rigs will be required to offset base declines. They used to require 60-70 oil rigs in the 2014-20 timeframe with minimal increase in production. So, I would guess 2/3rd of the oil rigs were purely to offset declines i.e. to maintain production. Now suddenly, without a year of investment, they can claim higher capacity with less than half the oil rigs. They must have sprinkled some magic dust on those rigs, I think
Ancient Archer,
Saudis have claimed 12.5 Mb/d of “capacity” since 2010. They have been producing less oil lately due to OPEC cuts so less need for rigs. When they ramp up output we will likely see rig counts rise.
Not also that if rig count were high, people here would say, “see their rig count is high and they are not increasing output”, if it is low they say “see there are no prospects to drill”. This seems to lead one to think that no matter the rig count people have preconceived notions that no amount of evidence will change.
I look at output first and the reasons it might have changed. Saudi Arabia remains the World’s swing producer, it is pretty well advertised that OPEC is limiting production to support prices. I do not think this is a grand conspiricy to hide declining output, World demand is lower than 2019, OPEC has adjusted output, nothing more.
Dennis, I’m more inline with your thought here. Saudi capacity has been in the same ballpark for the last half century. I think this is their hard infrastructure capacity of ports and pipelines moving product out of the country. If you think about it, they have had no reason to increase it for the last 50 years. Clearly 40 years ago they could have exceeded 12.5 mbd on a medium term basis and I suspect on a short term basis they still can. Surely Iran and Iraq being politically constrained for the last 40 years have geo ability for more capacity.
I think all three of these countries can increase production with additional capex. I keep hearing here “they” are producing “all out”. I don’t even know what that means.
I keep hearing here “they” are producing “all out”. I don’t even know what that means.
“Flat out” is the more common term. And I really think you know what that means.
Your right, “flatout” was the term. Which could mean a foot on the floor of the accelerator of a straight six powerglide 57 Chevy. Or, the pedal to the metal of a 70 Hemi 426 Barracuda 4 speed. They both have a top and quarter mile trap speed but their different. My point, it’s all about the difference in Capex.
Production is a function of Capex. No investment, no oil. More investment, more oil. Are the Saudi’s at flatout investment? I don’t think so.
No, of course not. We now have the Covid oil consumption depression. No one should be producing flat-out right now. Nevertheless, a lot of countries are doing just that. But not Saudi, not right now anyway. But that is exactly what they have been doing for most of their history of oil production. Saudi could produce perhaps 10,000 Kbp/d right now, but not much more.
Their highest yearly average was 10,388,000 bpd reached in December of 2016. They will never ever reach that level again.
Ron,
Have you been able to correspond with the oil geologist, Jeffery Brown? I really enjoyed his discussions on his Export Land Model (ELM). He is on record that Saudi Arabia will not be able to export oil by 2030. Have a hunch he is right. Thanks
No, I haven’t heard from Jeffrey in about a year. I don’t know what has happened to him. But he still might show up, I am hoping.
sure. when you want to produce flat out, you also invest flat out. In fact, I think that investment will continue going up when the peak is reached and production plateaus or declines. but that’s another discussion topic.
My point here was that the Saudis are going to produce more in the near future. At least that’s what they have promised. They have already announced a monthly increase in production to the end of next year and global demand is also going to increase, so I don’t think there is any doubt that they are going to want to increase their production.
My question is this: If they want to be positioned to increase production in the next few months, shouldn’t they be investing more capex? shouldn’t they be drilling more and using more oil rigs? Right now, and not in the far future. What am I missing here? This is the point where I would expect them to increase their capex and oil rigs. However, oil rigs have just touched the lowest point since 2005. Rigs were at 33 at Jan 21 and now they are at 27. Again, what I am missing here?
Dennis, as to the veracity of Saudi capacity notwithstanding their claims regarding the same, who knows! They have never produced even close to their capacity – actually that’s not true – they produced 12mmbpd for only about a month during the OPEC Russia oil price war in April last year. But that number was surely bolstered by drawing down from their reserves. Their reserves number at 268bn bbls has not changed over the last 30 years, so excuse me if I doubt their word as to their production capacity.
If you have ever dealt with Arabs you would know that positioning, bluffing and extraordinary claims are part and parcel of their business dealings. It’s not that they are lying intentionally, but that’s how they do business. Don’t make the mistake that everyone in the world follows your Anglo-Saxon method of doing business.
Ancient Archer,
Saudi reeported reserves are likely to be proved plus probable rather than proved, reserve estimates change over time, in the US proved plus probable reserve estimates grew by about 63% from 1980 to 2005. Let’s take Saudi reserves as reported in 1980 ( at that point they may have been “proved reserves”) and then multiply by 1.5 to estimate proved plus probable reserves and then assume there was reserve growth of 63% as was the case in the US.
In 1980 proved reserves were 168 Gb times 1.5=252 Gb times 1.63 (63% growth)=411 Gb, then subtract 66 Gb produced from 1981 to 2005 and we get 345 Gb in 2005, they actually reported 264 Gb of reserves in 2005 so their reserves grew much less than US reserves over the same period. If we take the 264 reported and add 66 Gb produced we get 330 Gb, then divide by 252 Gb in 1980 and we get only 31% reserve growth for Saudi Arabia, half the level seen in the US over the same 25 year period (1980 to 2005).
As to increased oil rigs, they probably don’t need many at present as they are producing a considerably less than capacity, as they ramp up output and need more wells they will employ more rigs.
At some point Saudi Arabia will reach a maximum annual output level, I doubt Ron will be correct that 2016 will be the peak. In fact when we use EIA data for centered 12 month average C plus C output, the peak was June/July 2018 at 10597 kb/d. I expect this peak will be surpassed as oil prices rise and Saudi Arabia continues to increase their capacity.
We will see, I expect this to occur between 2024 and 2032.
Dennis, according to OPEC’s secondary sources, Saudi 12 month average peaked in December 2016. I am sure you are aware that Ghawar is in decline. Abqaiq is over 90% depleted. I am sure that Safaniya and Berri are in decline also. After all, Saudi admitted in 2006 that their fields had an average of 8% decline. How in heaven’s name can you doubt that they are not in decline today?
The decline of oil has already begun Bold mine
Most of Russia’s oil comes from aging fields in Western Siberia that are in decline, and Minister of Energy, Alexander Novak, has warned that Russia’s oil production could drop by 40% by 2035. Saudi Arabia – in spite of threatening to increase production – also appears to be in decline. According to Bloomberg, the giant Ghawar oil field in Saudi Arabia is “fading faster than anyone guessed.” Last year, Saudi Aramco oil company published financial figures, revealing that Ghawar’s historic production has declined by 24% in six years.
Aramco reports a natural decline rate of 8%, which means their production would fall by half in less than nine years, without investing billions annually into new wells and new technology on marginal sites. In 2005, Saudi Arabia increased its operating rig count by 144%, to increase oil production by 6.5%.
Ron,
For the World we use C plus C data and generally the EIA data for International C plus C data is pretty good, for crude only the peak may have been 2016, but that is not an apples to apples comparison with World data which is C plus C.
Another good source for data is BP statistical review of World energy, which has the Saudi peak in 2016 for C plus C. In any case the difference from 2016 to 2018 12 month averages is quite small, about 1.4%. As to the decline, it is decline after investment that is of interest. Since 2004 it has been claimed that Saudi Arabia is going to decline soon. From Jan 2005 to December 2019 the average trend in KSA output was (using EIA estimates) about a 115 kb/d average annual increase in output over that 15 year period.
As I suggested we will have to see if a new peak is established, perhaps not, but certainly a plateau is likely to be maintained for 5 to 10 years maybe longer if World demand for oil continues to increase.
Profits thru the roof though. So, there’s that.
Yes , thru the roof , but their is a difference between “gross ” and ” nett ” . If so honky dory then why borrow to pay the dividend ? The argument that Saudi Aramco is separate from the House of Saud does not hold . Aramco’s balance sheet is the balance sheet of KSA . 95% of the revenue of KSA is oil . Very similar to PEMEX being the proxy for Mexico . If and when PEMEX defaults so will the Mexican government .
P.S : High oil prices helped of course .
George
Thank you for your work and your addendum. Truly, both are very much appreciated and food for much thought.
On the technical side, have you included the Three Forks/Sanish in with the Bakken? Forgive possible errors in my memory but I recall a well we had in the Antelope Field that produced from both and the Sanish was a conventional reservoir. Since getting out of ND over 15 years ago I have never looked back as dealing with the other HZ strippers was a monumental money and mental sink. At any rate, isn’t the Antelope Field a sweet spot; to which I will imply the result of the TF/S reservoir and production? It would be of great import to sort this out and see how much the TF/S cumulative production has skewed the Bakken ultimate recovery to the positive which would be implied upon the basin in general by Dennis and others. No slight intended but this may be an issue of no minor significance; I just can’t say so myself.
In my opinion, the Williston Basin is hell on earth for production in the US although I only have experience in a few basins but have followed the industry long enough to make that reasonable generalization. Most of the production is sub salt and if you do not know what that implies ask and I’ll explain it later. Several of the reservoirs have highly divergent water chemistries which make commingling problematic. The Silurian produces super salt saturated waters which, if not diluted downhole with fresh water, will yield free salt in the produced oil. The service sector in my time was still priced for the very large or major companies operating there and the mindset was cutting a fat hog and not efficiency. Back then, there were only two big gas gatherers so your wellhead net backs were horrible. I could go on, but when you add in well known weather, logistical and labor issues, this basin is not for the faint of heart. There are some benefits as well such as very sufficient water disposal zones and multiple pays so it’s not all negative.
Perhaps my inference here is that the Bakken has a much higher breakeven price and barrels to payout than other unconventional plays.
As always, please educate me and correct errors and bad assumptions.
Rasputin
I have been keeping an eye on these DUC’s but not seen any data so far.
From company announcement.
“Williston Basin update – Whiting operated wells
In March 2021, Zephyr completed the acquisition of non-operated working interests in five wells located on three separate pads operated by Whiting Petroleum Corporation (“Whiting”):
· The producing Iverson 11-14HU well;
· The S-Bar 11-7HU and 11-7TFHU wells (which were drilled but not completed (“DUC” wells) at the time of acquisition); and
· The Feehan 11-9HU and 11-9TFHU wells (which were also DUC wells at the time of acquisition).
In the period since the completion of the acquisition, Zephyr has received its scheduled monthly revenue payments related to its interests in the producing Iverson well. In addition, the S-Bar and Feehan wells were all completed by Whiting during the second quarter of 2021 – completion operations progressed as envisioned, at expected lateral lengths and ahead of schedule.”
More from Lightsout’s link up top: The IEA Ushers in the Coming Oil Crisis
The foundation for the upcoming oil crisis is now firmly set in place. The world is re-opening
and global oil demand is recovering strongly. By the beginning of 2022, global oil demand
should be making new highs. Non-OPEC oil supply has fallen by over 2 mm barrels per day
from its 2019 peak and non-OPEC oil supply growth will turn negative as we progress
through this decade. A structural gap will soon emerge between supply and demand. As
early as Q4 of 2022, demand will approach world oil-pumping capability — a first in 160
years of oil history. The ramifications will be huge and the investment implications monumental.
They are saying that as early as Q4 of 2022, demand will outstrip supply. That is the opposite of peak demand. And, at that time, supply will likely still be far below the 2018-2019 peak.
From Ron’s link above:
Over the last 10 years, the only source of non-OPEC+ oil supply growth has been the shales. Except for the Permian basin, every shale in the US is now in persistent decline. The shales remain 1.4 m b/d below their highs and our modeling suggests they will never regain previous production peaks.
Ron
I also found the section of the report on Gas production very interesting, here in Europe gas markets are in turmoil and there was an expectation that LNG from the US would save the day, however…..
Too bad the Bakken is a bust. Don’t worry though, I’m sure the Permian will come through to make Dennis’ dreams of a new US peak come to fruition. Meanwhile, over in Africa…
https://oilprice.com/Latest-Energy-News/World-News/African-Oil-Producers-Struggle-To-Raise-Oil-Production-As-Investment-Lags.html
Stephen,
It is not clear to me that Verhurlst curves will give an accurate forecast, If oil prices rise as I expect, the completion rate in North Dakota Bakken Three forks is likely to rise in the future.
We might see a new US peak if oil prices rise to over $85/bo for WTI, I would put the odds that this will be true by 2023 at about 3 in 4.
George Kaplan,
Excellent detailed write-up on the Bakken. What a difference in ten years since Continental Resources, Harold Hamm stated in 2011 that there were 24 billion barrels of oil in the Bakken. This is precisely what the book, TOO MUCH BY HALF was getting at. Basically, the oil industry transitioned from using Oil Reserve Engineers’ estimates of oil in a reservoir and how to produce it (using fluid dynamics), compared to the glorified Geologists today who focus more on OOIP- Oil Originally In Place. The industry wanted the more OPTOMISTIC & INFLATED oil reserves from the Geologists who were glad to do it for a nice salary. It was a WIN-WIN for everyone except the investor and public.
This was the main beef by the author and Oil Reserve Engineer, James Dietrich.
Unfortunately, very soon, the market is going to realize the SOBER TRUTH that there are a lot of overstated RESERVES & inflated ASSETS.
That being said, while some companies plugging away in the Great U.S. Shale Oil Black Hole are making some Free Cash Flow finally, ExxonMobil isn’t one of them. If it weren’t for ExxonMobil’s International Sector, they might as well SHUT DOWN THE DOORS here in the United States.
ExxonMobil’s acquisition of XTO did more to GUT Exxon of its profits and Free Cash Flow than anything else in the past 20 years.
Hopefully, this chart will show how ExxonMobil invested $32.8 billion from 2016 to Q2 2021 in its U.S. Upstream Sector to lose $3.8 billion in Earnings compared to the much more profitable International Sector.
However, it’s even worse because I have omitted two quarters:
Q4 2017 = $7.0 billion Earnings U.S. Upstream Sector due to one-time Tax benefit
Q4 2020 = $16.8 billion Impairment write-down U.S. Upstream Sector, mostly due to the Shale Oil Black Hole
So, the net of those two quarters is an additional $9.8 billion in losses. If we tack that on to the $3.8 billion, it would be a total of $13.6 billion in losses in its U.S. Upstream Sector. I’d imagine Exxon Management was glad they were able to generate most of their Free Cash Flow from their International Sector to pay U.S. Shareholders dividends.
With U.S. Oil Production likely to decline 75% by 2030, the country will become a much different place.
steve
A medium Bakken oil price scenario where WTI prices rise to $75/bo in 2021 $ by April 2022 and remain at that level until Dec 2035 and then decline to $27.50/bo in 2021 $ by 2075. The high price scenario presented earlier has a maximum completion rate of 160 new wells per month after 2020 (read from right axis), prices of Brent crude in 2021$ also on right axis, subtract $5/bo for WTI price. The medium price scenario presented below assumes a maximum completion rate of 110 new wells per month (this is about the maximum 12 month average completion rate from 2017 to 2020). My expectation is that there is about an 80% probability that actual output will be higher than this scenario, as my expectation is that the price scenario used for this scenario will be lower than actual oil prices.
See chart below, clicking on it will make it bigger.
The analysts who worked on the Rystad energy data concerning USA found a decrease of oil production of 20% or so for 2030 by supposing that oil shale will maintain more or less its production untill 2030. It’s in the report of the shift project of 2021 about future oil supply of Europe.
A high price Bakken scenario where oil prices rise to $125/bo in 2021 $ by July 2030 and remain at that level until July 2033, oil prices rise by $6/year from July 2022 to July 2030, then decline by $3/year until reaching $30/b in 2067, all prices in 2021 US$. Note that my expectation is that there is a low probability this scenario will be correct, perhaps an 80% probability that output will be lower than shown here.
See chart below.
Comparison of high price and medium price scenarios presented above on a single chart,
my expectation is that there is about a 65% probability tht actual Bakken output will fall between these two scenarios as the “medium” oil price scenario is likely lower than future oil prices and the “high oil price scenario” is likely higher than actual oil prices will be. It is also highly likely my scenarios will be incorrect as there are many assumptions built into these scenarios and any (probably all) are likely to be incorrect.
Chart below, click on chart for larger view (medium price model URR=8.5 Gb, high price model URR=10.3 Gb).
A final very low Bakken scenario using the medium oil price scenario, but assuming a completion rate of 35 new wells per month for most of the future (from October 2021 to Jan 2041, last well competed in May 2041), this is similar to the current assumption made by shaleprofile for the North Dakota Williston basin supply projection as of August 6, 2021. My expectation is that there is about a 95% probability that future North Dakota tight oil output will be higher than the scenario presented below. ERR is about 7.8 Gb with about 24000 total wells completed. Note that about 16471 horizontal wells had been completed in North Dakota as of May 2021 (data from Shaleprofile).
The scenario below uses shaleprofile data as the basis for North Dakota Bakken well profiles developed by me using decline curve analysis, mistakes in the analysis are by me.
The shale profile supply projection has North Dakota Williston basin output at 791 kb/d in December 2029, my model has output at 516 kb/d for North Dakota Bakken/Three Forks in December 2029. A difference between these models is that I assume productivity decline in Bakken starting in July 2019, the shale profile supply projection assumes no productivity decline after May 2021 (this is just a model simplification that is different from my model).
Quick comment on scenario above. My expectation is that there is about a 98% probability that North Dakota Bakken/Three Forks output will be higher than presented in the scenario above after Sept 2021. North Dakota tight oil output is likely to remain above 900 kb/d for the next 9 years at least.
On one hand we hear about the lack of capital investment in new oil projects, and on the other we hear that very little return on investment has come of the money invested in E&P over the last decade.
Both of these stories are true.
And other aspects in the mix is the growing realization that oil is limited, and that global warming isn’t just some political movie.
We also hear that money is going to ESG companies, rather than oil capex.
I was curious just what are these ESG companies.
If you want to know what Vanguards big ESG etf is and does- here is the summary page
https://investor.vanguard.com/etf/profile/ESGV
My take on all this is that if a new oil project has good prospects, there will be money for it despite all the things people say. Same goes for all energy related projects.
It’s not just vanguard. It’s Blackrock and it’s sovereign wealth funds that are saying they will divest from fossil fuels. It’s vast pools of money, trillions saying if you want access to cheap money you’ll have to offset your carbon emissions with carbon credits. If not money might be available but it won’t be cheap and effectively put you out of business.
To add to the conversation on Blackrock and Vanguard read the link . What awesome power they have accumulated .
https://theconversation.com/these-three-firms-own-corporate-america-77072
I think the price of oil is going to get crushed by EUR/USD headed down btw. And there is correlation between the two. Not perfect correlation but enough if EUR/USD heads south it takes oil price with it.
And the beginning of this move is happening right now.
HHH
I keep hearing that both gold and silver move inversely to the US dollar/DXY. You keep insisting that WTI is linked to EUR/USD. That makes no sense to me since I believe the price of oil is affected by the supply demand balance.
Can you provide a chart that backs up your thinking that EUR/USD affects WTI. Alternatively can you provide an explanation as to why it is linked.
I think oil is getting hammered by DELTA variant hitting hard.
We have a daughter who is heading into her junior year of college. She is very smart (better grades than her dad at the same school) and has had one semester in four in person. The second one lasted six weeks before it went online and she was sent home. She went back for 2020-21, but all classes were online. Same with classes she took this summer.
So, early this summer we went to visit and she was happy as could be, and walked us to where each of her classes would be for Fall, 2021. Now here we are, and we are all assuming lockdowns and online again. We know people who are in the hospital w COVID again, after going many months without that.
Sorry for the anecdotal, but this is what is hitting oil IMO. This damn COVID nightmare just won’t end.
After reading Gail’s post: https://ourfiniteworld.com/2021/08/05/covid-19-vaccines-dont-really-work-as-hoped/ I was struck that vaccinated people can infect other people. I wrote down a simple model. According to my model, it is more important to bring down the infection rate in vaccinated people than in those without vaccines. It’s actually the vaccinated and those resistant to the virus that can wreak havoc. If the vaccinated can infect others, we are not at all close to the end of the pandemic.
I saw that post. Gail has become a fruitcake, I hate to say it. She even thinks Fauci is complicit in all this. She says,
“An erroneous, one-sided story is being told to the general public, in part because the pharmaceutical lobby is incredibly powerful. It has the support of influential people, such as Anthony Fauci and Bill Gates.”
I’m sorry to see you spreading this cockamamie bullshit to this site.
Gail is a goddam actuary. She’s knows shit about infectious disease. She is pushing dangerous horse shit about ivermectin and vitamin D, like that insane islandboy who posts here.
People who have been vaccinated come down with much less serious illness. Open your goddam eyes: over 90% of those hospitalized are unvaccinated. It’s the unvaccinated who are dying.
Are there breakthrough cases? Yes. But Gail is arguing that the perfect is the enemy of the good.
The problem is people refuse to believe they live in a world ruled by the principles of evolution–natural variation and selection.
I wish people would consult Science-Based Medicine.
The botching of this health disaster spells the end of the US as we know it. We are fucking doomed.
I don’t care about the messenger, I care about data. The CDC has 5 scenarios for COVID https://www.cdc.gov/coronavirus/2019-ncov/hcp/planning-scenarios.html. The lowest rate of infection they have is 2.0. My model says that the rate of infection of the vaccinated, say R_v, must be less than 1.0, otherwise even 100% vaccinated does not stop the pandemic. If R_0 = 2 and R_v = .75, the model says 80% vaccinated stops the pandemic. The formula for stopping the pandemic (valid if R_v <1) is v= (1-1/R_0)/(1-lambda) where v is the proportion of the population that needs to be vaccinated to stop the pandemic and lambda = R_v/R_0 . The model is simplistic but I think the principle would be correct for a more realistic model. What this means is that even if you are vaccinated you must still social distance and remain masked. That is not the message we have been receiving.
There is now much data showing the effectiveness of Ivermectin as a prophylactic.
Having a satisfactory level of Vitamin D prevents the Bradykinin storm which is a harmful aspect of Covid.
Gail Tverberg is a statistician; useful when analyzing vaccine data.
There should be a more subtle approach to this than just promoting a leaky vaccine to combat an evolving virus. Encouraging better public health would be a good start.
https://www.cureus.com/articles/64807-prophylactic-role-of-ivermectin-in-severe-acute-respiratory-syndrome-coronavirus-2-infection-among-healthcare-workers
MIKE B
This is my only comment on any site ever so I am not a typical spreader of misinformation as you might think.
The science as stated often doesn’t match up with the data and generates more questions than answers. Left unanswered, people arrive at their own conclusions.
Fauci said that the vaccinated carry a much greater viral load than the unvaccinated and that raises a couple of unanswered questions. First: how is it even possible as the vaccine should reduce that part of the viral load generated by active covid in those people? Second; does not being vaccinated somehow have an actual positive effect on the viral load by unknown mechanisms?
I know exactly where I was sitting when the former president gave his big press conference on covid in early March of 2020; it was in the presence of my very old, infirmed parents. At the time I stated that this could be our Dec 7, 1941 moment as a nation. However, before the president’s words hit the back of the room, the political backlash started and the confusion, acrimony, sanctimony, mistrust and you name it metastasized at that moment.
Data does not always reflect the reality right before our eyes. Early on, just east of here, there were 5 counties with packing houses and feedlots with some of the highest infection rates on the planet yet few hospitalizations and a miniscule death rate. I was the outlier that maintained that no one should die one day earlier due to covid nomatter their health condition. But in my county where cases were tracked, the cases all existed in the area were the packing house employees lived not where all of the other Walmart shoppers lived. How was that possible? That is just one of myraid inconsistencies between data/reality and conclusions.
Thus began the data dive for months on end that about burned up my mind. Cognitive dissonance has been the destructive order of the day for me for well over a year. As an engineer, my pursuit was not political, but reporting and politics didn’t match up with so much data. I was criticized because I pushed the narrative that we would know more later and should be very conservative trusting our guidance but what we were being told, data aside, varied too often and followed other influences; political agendas not being the least of them.
This blog is about people looking at the same data yet yielding disparate conclusions and the data is clear and tangible. The weeds get pretty deep after clear industry data get applied and the outlying influences get factored in varying, if any, measure. Should OECD countries base their futures on these often rigidly held conclusions? Sound familiar?
We should be allowed to beat covid to death openly in the pursuit of the best path forward for humanity; and, in this forum, to the effects on demand and sometimes supply.
Rasputin-
There is a lot of information/misinformation/and poorly understood information circulating. So I’m not too surprised that people are having trouble seeing the important points regarding vaccination and Covid-19
Regardless whether one understands the immunologic mechanisms at play, the outcome is very clear, and is thankfully very good news- The vaccines are extremely effective
As of Aug 6th -“Among adults aged 65–74 years, effectiveness of full vaccination for preventing hospitalization was 96% for Pfizer-BioNTech, 96% for Moderna, and 84% for Janssen [J&J one dose] COVID-19 vaccines”
https://www.cdc.gov/mmwr/volumes/70/wr/mm7032e3.htm
Most of the rest of what you will hear is a distraction from this basic truth.
Sure there are open questions- with the two biggest ones being-
1. How long will immunity last, will certain people need boosters, and when?
2. Will new viral variants arise that the current set of vaccines does not cover?
[So far all the variants are covered by the vaccines referenced above]
Lack of vaccination comes down to basic fact that this puts you and your community at risk for a severe illness, puts and the economy at risk for recession/depression.
https://www.cdc.gov/mmwr/volumes/70/wr/mm7032e3.htm
Don’t be fooled by ivermectin bullshit. Get vaccinated. Wear an N95 in crowded places to be extra cautious. And don’t allow the perfect to be the enemy of the good.
I have given some more thought to the vaccination issue, and have a change of attitude.
Anyone in the USA who has not yet made the effort to get a vaccine should just move to the back of the line. By that I mean that all available doses in the US should be donated to other countries where people are waiting eagerly for a chance.
First priority should be Mexico and the rest of this hemisphere.
People in the US who change their mind can apply to get a dose ordered from their doctor or local clinic, as they become available.
Schinzy
Could you post your model. Is it a function that includes the variables you mention or is a model driven by differential equations.
I saw her once, years ago now, doing her canned presentations.
She’s always been a fruitcake.
Her shit makes sense to people who know just a little bit, enough to fall for it.
If you know a good deal, it’s obvious she knows very little, based on my observation.
Straying from oil here, but not enough people have been vaccinated. The counties around here are 25-35% vaccinated of total population. It’s been just a trickle for months.
Concern now is how long vaccine lasts.
So, as long as this hangs around, oil prices will be weak and oil production will not grow. OPEC+ may need to rethink plans.
Shallow sand,
Is the Delta variant causing some who have chosen not to get the vaccine to rethink their decision? Are people aware that over 99% of people hospitalized with covid19 in the US are not vaccinated?
It is true that the Delta variant can be spread by those vaccinated who may have a case of covid with no symptoms or mild symptoms (which can be mistaken for a cold or allergy symptoms), that is why the CDC has revised their guidance to wearing masks indoors for both vaccinated and unvaccinated.
Unfortunately people can’t keep up with the changing scientific recommendations as the virus mutates.
My county was down to less than 10 shots a week, but the most recent week over 50 were given shots. Still a drop in the bucket when around 8,000 who are eligible haven’t been vaccinated.
There was a big rush early, of course, big clinics. But by early April, pretty much everyone who wanted a shot had gotten one, and we were at about 32%. Now at 36%, just looked it up.
Dennis , wearing a mask after being vaccinated is like ” wearing a condom after a vasectomy ” 😉
Thanks Shallow sand.
Maybe we should rebrand the vaccines as the “Trump vaccine” to get the rural population to get vaccinated? Those folks do know that the Trump and the former first lady were vaccinated in January, hopefully.
https://www.foxnews.com/media/trump-urges-all-americans-to-get-covid-vaccine-its-a-safe-vaccine
Have you talked with folks about why they are choosing not to be vaccinated?
I am all for personal choice. Maybe the hospitals should choose not to treat those who have chosen not to be vaccinated. These people are putting health care workers at risk with their choice not to get a vaccination.
My advice is to wear a mask in indoor public spaces to protect both yourself and others, double masking is probably better.
Dennis , it was a cheeky quote , nothing serious , see smiley at end of sentence . Relax .
Hole in head,
Simply concerned not to spread misinformation here.
Darwin sorting things out—
Hightrekker , we are on the same wavelength .
Shallow Sands
One would hope OPEC is looking to cut barrels after China went into lockdown again.
1: You will not be told any truly bad virus news. Certainly not before insider families can take advantage of the information.
2: Variants that can escape vaccines will statistically evolve versus the most popular vaccines. J&J is rare and variants dodging it will be, too.
3: Temperatures drive people indoors, to either AC or heat. Southern states and pro Trump or anti vax matters rather less than southern states are hot.
4: At winter’s peak the US had 250K daily cases and 4400 daily deaths for a ratio of < 2%. Peru in April/May, with temps in the upper 80s, had Lambda uncork 10,000 daily cases. Of which 1000 died each day. 10%, coming soon this winter.
5: https://en.wikipedia.org/wiki/COVID-19_pandemic_in_Russia Notice heavy cases in the oil areas. The Lancet reported Russia/Japan's Sputnik V vaccine is 90%+ effective against the virus.
Watcher , to add point number 6 to your post . The virus can and does mutate , the vaccine does not .
The vaccine does, too – but it must be approved first.
I know at least Biontech has a version tailored for the delta variant, but it is in clinical tests. So they still deliver the original variant.
It will be like the flu vaccine – every year a new shot for the new variant. My parents are taking the flu shot every year since a decade.
At least the current shot helps a lot. Spain, the Netherland and GB had a delta outbreak with high numbers, but the death numbers didn’t shoot up as with the outbreaks before.
Towards end of previous oil post, I made a comment with an incorrect chart (pointed out to me by Mike Shellman, thank you). The chart has PDP reserves for Permian basin in millions of barrels on left axis (that part was done correctly) and the PDP reserves to production ratio on right axis(this I did incorrectly by using monthly production rather than the correct annual production rate so the number was too high by a factor of 12).
Corrected chart below for Permian Basin tight oil scenario with ERR=55 Gb.
Also I revised the OPEX per barrel estimate so that current OPEX per barrel average for the basin wide Permian basin is about $13/bo at present which LTO survivor said was a reasonable estimate (I thought I originally got this estimate from Mike Shellman, but he has said that is not the case so I must have remembered incorrectly).
For the Permian basin scenario with 55 Gb ERR the OPEX per barrel estimate over time is shown in chart below.
For Permian basin 55 Gb scenario, I recently updated the average 2019 well profiles for oil and natural gas in the Permian basin, this changes the GOR (Mcf natural gas per barrel of C plus C) as shown in chart below. This updates an earlier chart produced before I made these well profile updates.
The Permian basin scenario for all 3 charts above is shown below with completion rate on right axis and output on left axis.
I don’t know your models but all your curves representing the future production of oil for countries or oil fields have the same aspect : a peak or several peaks (the real data) and, after, a parabole with a greater or a lesser maximum value. When I see the repetition of these curves, I have not the impression that it represents the reality as each oil fields has its peculiarities. Of course, that’s words of a beotian.
Jean-Francois Fleury,
The curves are not parabolas, they are the result of assumptions about future well profile decreases (based on USGS studies of tight oil plays and the mean estimate of TRR, and the informtion on prospective acres and total technically recoverable resource) as the field is developed (I assume more productive areas are developed early and then development moves to lower productivity areas). In addition economic assumptions are made to estimate operating costs, transport costs, royalty and tax payments, capital cost, oil prices, natural gas prices, and NGL prices. Using data gathered at shale profile on well quality I use decline curve analysis to develop well profiles for both oil and natural gas, exponential terminal decline at 15% annual rates is assumed after an initial hyperbolic decline over the first 5.5 years of production. After December 2019, I assume each month new wells are less productive (smaller EUR per well) than the previous month) with the amount of decrease depending on the number of wells completed per month.
Output is the sum of number of producing wells times the output of each individual well at any time, t based on the well profile.
See post below to see how it works,
https://peakoilbarrel.com/oil-field-models-decline-rates-convolution/
Also there are some good comments starting at link below
https://peakoilbarrel.com/oil-field-models-decline-rates-convolution/#comment-42514
Also a great comment by Mike Shellman at link below, where he points out that maybe 7 to 9 BOPD will be the economic limit for Bakken wells, he as recently said for the Permian basin it will be 20 BOPD or higher.
https://peakoilbarrel.com/oil-field-models-decline-rates-convolution/#comment-42643
I used this suggestion by Mr Shellman for many years and assumed wells would be shut in at 8 BOPD, later I revised this to 10 BOPD and recently on Mr Shellmans advice increased the limit again to 20 BOPD.
OPEX increases over time for a host of reasons other than inflation. OPEX is higher in the Permian and will become much higher as produced water becomes more and more of a problem than it is already. Economic limits change with product prices; shale oil wells are produced below economic limits because they represent exaggerated collateral to companies that already don’t have “real” assets to cover real debt. Lenders are quite aware of all that. GOR is often not predictable; in pressure depletion drive mechanisms, when death is near, it actually goes down.
I did not contribute to these models/predictions; I do not believe that is what will occur. Mother nature is beginning to put Her foot down already about this shale oil crap, certainly in the Bakken and EF, and is just beginning to in the Permian. The more relevant question is where will the money come from to make this miracle happen? $70 is NOT the answer.
PDP R/P in America’s shale oil basins is less than 3.5, in everything but the Permian, < 3. It HAS to keep drilling wells to offset steep declines, its actual reserve replacement ratio needs to be upwards of 150% or more. The shale oil sector has cut its rig count in half and is now spending less than half of its revenue on new wells; its RRR is way less than 100%. The snapshot you see today of production levels is based on budgets and guidance made 6 months ago…and DUC's ! If PDP is not replaced, production declines and along with it, revenue. For these models to work the shale oil biz will require more credit/debt than ever. This drilling "time out," the shale sector was forced in to by lenders…is hurting it, badly.
Mike,
Not sure what you mean on inflation. The OPEX chart has inflation adjusted costs (so inflation is not a part of the story) costs rise because of increased water cut and disposal costs and higher maintenance and repair costs of older wells.
Consider the scenario below where output increases at about 5% per year (an amount suggested by LTO survivor as feasible), WTI is assumed to rise to $75/bo by Jan 2022 and remain at that level (in 2021 $) until 2033. For this scenario RRR remains above 100% (mostly over 111% up to 2025) until October 2029. Then RRR gradually declines to 97% by the end of 2037, then it declines steeply as completion rates decrease rapidly after 2037 as prices drop in the scenario to levels that are no longer profitable due to rising costs per barrel and lower oil prices.
Yes you had no part in these models and errors are mine alone. Wells are shut in when they reach 20 BOPD after 140 months of production. The average 2019 well has an estimated ultimate recovery of 406 kbo (using Arps DCA for month 18 to 65 and 15% terminal decline after 65 months, first 17 months use shaleprofile data.) After Decenber 2019, I assume that average well productivity decreases each month with the amount of decrease depending on number of completed wells (productivity decreases more when a larger number of wells are completed).
This scenario differs from the other Permian scenario (55 Gb) due to lower maximum completion rate of 450 new wells per month, previous scenario had a maximum completion rate of 624 new wells per month, URR is lower at 46 Gb and peak is 5426 kb/d in 2029.
All wells in this scenario after May 2020 are financed from cash flow and I also assume 7.5% interest rates are paid on debt and that 25% of positive net revenue is paid out in dividends.
Click on chart for larger view.
Story on Politico about water problems in North Dakota.
Where Republicans Are Starting to Worry About Big Oil
https://www.politico.com/news/magazine/2021/08/06/north-dakota-republicans-oil-fracking-environment-502308
Gerry F , I am not based in USA but follow US events closely . Nobody Reps or Dems care . At the end of the oil age it is every man for himself . Get the Afghan quote on survival : Me , my family , my clan , my tribe and all of us against the infidels . Wonder why the Brits , Russkies and the US were defeated in Afghanistan ? Afghanistan is called is ” The graveyard of Empires ” , now you know why . My opinion ” look out for yourself ” , there is no safety net , Rep or Dem .
HiH:
i agree. I didn’t read the story as a necessary Republican/Democratic partisan issue. I read it more as unabashed oil boosters are starting to worry about the so-called side effects, and some are worried about peak oil etc.
If the livelihoods of you and most of your neighbours are dependant on any one industry, it can be difficult to vocalize the negatives.
From above- “if a new oil project has good prospects, there will be money for it despite all the things people say. Same goes for all energy related projects.”
An example of this is Namibia. Both onshore and offshore oil prospects are being actively worked on and eagerly pursued. Any shortage of funding?
“Supermajors Are Flocking To This Booming Oil Frontier”
https://oilprice.com/Energy/Crude-Oil/Supermajors-Are-Flocking-To-This-Booming-Oil-Frontier.html
https://www.yahoo.com/now/why-namibia-could-become-biggest-230000550.html
https://www.geoexpro.com/articles/2019/10/the-hydrocarbon-potential-of-onshore-namibia
Bottomline- development money will be chasing affordable energy projects no matter what the source
I love their disclaimer .
” In this case the Company has not been paid for this article. But the potential for future compensation is a major conflict with our ability to be unbiased, more specifically:
This communication is for entertainment purposes only. Never invest purely based on our communication. We have not been compensated but may in the future be compensated to conduct investor awareness advertising and marketing for TSXV:RECO. Therefore, this communication should be viewed as a commercial advertisement only. We have not investigated the background of the company. Frequently companies profiled in our alerts experience a large increase in volume and share price during the course of investor awareness marketing, which often end as soon as the investor awareness marketing ceases. The information in our communications and on our website has not been independently verified and is not guaranteed to be correct.”
As per their words ” This communication is for entertainment purposes ONLY ” . Yes sir , I am completely, absolutely entertained .
And does that have bearing on the content of this discussion, or just provided for the purpose of distraction from the topic?
Hicks , first this was a general comment not meant for anyone . Just an attempt to show how far journalism has fallen when you have to put a disclaimer as this . Read carefully ” has not been verified or guaranteed to be correct ” . So what was this a fairy tale ? Request to all, please your personal filter(also called the brain ) to separate the grain from the chaff .
Coming back to the gist . As we stand today ESG will decide where the money will go for CAPEX in the FF industry (thanks HHH ) . Off shore at $ 70 WTI is uneconomical . Period . This was a puff up piece and I realised this as I went thru the article . No intention of distraction, but yes the intent is clarification and correction . You post good thoughts ( your intention is not in doubt ) , we all make errors . That is all what it was an error , not even a mistake . Relax .
Hicks , interesting . Mr Kennedy writes an other article but without the disclaimer .
https://oilprice.com/Energy/Energy-General/Peak-Oil-Is-This-Top-US-Refiner-Ditching-Oil-For-Batteries.html
You now make a comment on the Namibia oil story as if you actually know something about it.
Do you indeed know anything about it- the quality/quantity of the discoveries and the success or difficulties in obtaining funding? That would come as great surprise.
Lyric- “please don’t dominate that rap Jack, if you’ve got nothing new to say…”
btw- telling Dennis or myself to ‘relax’ when you have trolled a comment of ours is frankly condescending
Regarding this whole onshore Namibia, Kavango Basin story: I still feel like we are being teased in their press releases.
They say things like (from the Yahoo link in Hickory’s 8/10/21 9:45 AM comment)
“On April 15th, Recon Africa (TSXV:RECO, OTC:RECAF) in a joint press release with the Ministry of Mines and Energy of Namibia announced the results of its first of three drills (6-2), showing clear evidence of an active petroleum system for this nearly 9-million-acre basin. The samples provide over 200 meters of light oil and natural gas indicators/shows over three discrete intervals in a stacked sequence of reservoir and source rock.”
Why don’t they just say how much net pay they encountered? I’m sure they have a log analyst who has made that estimation.
In another Yahoo press release
https://finance.yahoo.com/news/reconafrica-provides-operational-covid-19-130000541.html
they say:
“As reported on June 3, 2021, the initial analysis of the first section of the 6-1 well established 134 m (440 feet) of light oil and gas indicators (shows). Thus far in the deeper section of this 6-1 well, the Company has encountered an incremental 209 m (685 feet) of hydrocarbon shows comprising a variety of light oil and natural gas. Collectively, the 6-1 well has encountered 343 m (1,125 feet) of hydrocarbon shows, further confirming an active petroleum system in the Kavango Sedimentary basin.”
Again, is this 1125′ net or gross? If it is net pay, then it starts to be come a big deal. But, if its say 100-200′ (or 10-20′) of net pay over a 1125′ gross interval,, it’s a whole lot different.
It also would be nice to know something about the rock properties. Is it 5% porosity, or 25% porosity ; 10 mD perm or 1000 mD perm.
Thanks for the thoughts on this. I am not qualified to separate the wheat from chaff on these reports, or to know what cost of production would eventually be- probably far too early to know that with any certainty.
Are there any other potential sizeable new areas of production on the horizon?
Vaca Muerta shale perhaps? That seems to be on the slow path for now, and likely indefinitely.
My point above was that there is no lack of funding for good energy projects of any sort, except coal in some countries.
Non-ESG investment funds in the USA alone is at over $34 Trillion as of 7 months ago.
Rather it is the geologic limitations, the recent glut of shale oil, and the chronic low price of oil that has held back spending for new E&P.
Unlike some others here, I think demand for oil products will recover to new highs and will not be curtailed by $100 oil. Everyone is so heavily dependent on it.
Anyone know of any solid potential energy projects, with the prospect for good return on investment, that are having a hard time coming up with funding?
Southlageo
This might interest you
https://reconafrica.com/wp-content/uploads/ReconAfrica-Press-Release-080521.pdf
Good stuff Lightsout, thanks.
I’ll spend some time looking through it.
So they have certainly demonstrated that they have a working petroleum system. They only show mud log data for the 6-2 well, the first well they drilled. This is the well with less oil/gas shows. They may do a future production test on what looks to be the best looking zone from that well.
They are planning to run vertical seismic profiles (VSPs) to tie these wells to 2D seismic that they still plan to acquire. So apparently they don’t have a good understanding of the details of the structural geometry of the area – like, were these wells drilled within structural closures?
I wonder if they can they correlate the stratigraphy between the 2 wells they have drilled. This starts to answer the question as to whether the hydrocarbon accumulations are stratigraphically controlled (more difficult to place development wells with high confidence) or structurally controlled (easier to place development wells with high confidence).
Good news is the reservoirs are shallow, and onshore – so future development drilling should be pretty cheap. But I suspect they would need alot of infrastructure investment to get the hydrocarbons to market somewhere.
A “show” is not, and never has been, the same as “pay”. I read it is as: Gross pay = net pay = 0′.
Despite the hype, the “press release” really is clear. No commercial discovery is claimed…only an “active petroleum system” … which I take as stating they found viable source rock. That’s something I guess.
Thanks for the clarifications Roger.
We always had our best “shows” in the tightest low porosity and low permeability rock. If it truly looked so good based on conventional log analysis they would have immediately production tested the zones. This reminds me of the Vintage Petroleum Palo Duro Basin phony hype story. Vintage told everyone at an IPAA conference break out session in NYC that their test wells had significant shows to which I replied “ I will drink all of the oil you make out of that well”. It was a total hoax to push up the stock price. I do t know if the whole Namibia basin is barren of commercial oil but this sounds a little like that story. They aren’t keeping secrets due to a competitive acreage situation. They already have the rights to 8 million acres. I call bullshit.
I’ve been involved with the drilling of dozens of conventional oil and gas wells. In my experience, shows, and most are mud log derived, are an initial indicator that you may have producible pay. Then, you come back later with conventional logs, and sidewall cores. After those assessments have been done, you can really hone in the net pay intervals.
So, you may start out with hundreds of feet of shows, and end with up only tens of feet of net pay.
Th third source of info I had linked above is GeoExPro
Does the impression of ‘hype’ information on Namibia also apply to this?
https://www.geoexpro.com/articles/2019/10/the-hydrocarbon-potential-of-onshore-namibia
If the Namibia story does turn out to be just ‘investment media hype’, then it further supports the notion that there are just not many legit prospects for new E & P in this world.
The GeoExPro article is “hype” free. I’ve read articles before in GeoExPro and find them to be good, semi-technical overviews of fields, trends, basins and countries, often with good historical summaries. Not as technical as the AAPG Bulletin; more in line with the occasional semi-technical articles in AAPG Explorer, but longer. This particular article only briefly mentions the Kavango basin.
Ovi asked me to post my pandemic model. The model is the standard model of epidemiologists with the weaker assumption that the reproduction number of the vaccinated sub-population is not zero. This is obviously true because vaccinated people can get sick. I do not know why it is not used by epidemiologists as it is much more accurate and provides more information. My guess is that there are standard methods for estimating the reproduction number of a pathogen when it is assumed that the reproduction number of the vaccinated sub-population is 0 (it can be related to the rate of change in the number of cases) but that estimating two parameters in two sub-populations is much more difficult and would require significantly more organization and testing. The model is very simple and can be understood with elementary algebra. I have posted it here: https://www.math.univ-toulouse.fr/~schindle/articles/pandemic.pdf
Schinzy
Thanks. Will take a look at it.
Biden thinks oil prices are too high?
I thought the world needs to get away from using oil? Why should OPEC produce more oil to cause prices to fall, encouraging more consumption and pollution?
Why doesn’t he call on US shale to produce more? Still down around 2 million BOPD?
Shallow Sand
U.S. calls on OPEC and its allies to pump more oil
Certainly sounds a bit cheeky and hypocritical after cutting Keystone XL and stopping drilling on Fed Lands.
https://finance.yahoo.com/news/u-calls-opec-allies-increase-110111086.html
Before 2005 Saudi had no problem pumping 9,000,000 barrels per day with little to no infill drilling. They just opened the taps wider to produce more oil. Then they started to experience a steep decline, averaging over 8% per year. Then they initiated a massive infill drilling program and got their decline rate down to almost 2% per year. They slowed production when the 2008 recession kicked in. But the infill drilling picked up in earnest after the recession.
Then they produced within half a million barrels per day of maximum production until May of 2020. Then they cut because of the Covid demand hit. Today they are producing about one million barrels per day below their maximum sustainable production level.
That sustainable production level, in my opinion, is now in decline. And that decline will become more evident in the next few years.
Big reserves in this region should be in Iran and Iraq.
Simply because these 2 countries have been interrupted by lots of wars and boycotts and revolutions the last 50 years. During this time SA was pumping with access to state of the art technology. And they could only pump with reduced power the whole time.
Now they should have lots of reserves left, especially when applying as much capital as sunken in SA oil fields.
Ron,
Mostly your story sounds about right. One thing that might change the maximum sustainable production level is higher oil prices, that might lead to higher rig counts and perhaps higher sustainable output levels.
USA oil reserve/production ration = 10. Ten years (as of 2018 data).
Definitions for those unfamiliar-
“Oil reserves denote the amount of crude oil that can be technically recovered at a cost that is financially feasible at the present price of oil. Hence reserves will change with the price, unlike oil resources, which include all oil that can be technically recovered at any price.”-
https://en.wikipedia.org/wiki/Oil_reserves
And further-
“Proven reserves are those reserves claimed to have a reasonable certainty (normally at least 90% confidence) of being recoverable under existing economic and political conditions, with existing technology. Industry specialists refer to this as “P90” (that is, having a 90% certainty of being produced). Proven reserves are also known in the industry as “1P”.”
“Until December 2009 “1P” proven reserves were the only type the U.S. Securities and Exchange Commission allowed oil companies to report to investors. Companies listed on U.S. stock exchanges must substantiate their claims, but many governments and national oil companies do not disclose verifying data to support their claims. Since January 2010 the SEC now allows companies to also provide additional optional information declaring 2P (both proven and probable) and 3P (proven plus probable plus possible)”
Question Dennis, and pardon if you’ve discussed many times before, but in models such as for US LTO do you use sources of information for 1P, or other larger estimates of Ultimate Recovered Resource?
Hickory,
I try to estimate economically recoverable resources for tight oil. I start with the mean estimate by the USGS for technically recoverable resources, then I utilize a set of economic assumptions, well profile estimates and completion rates to determine a reasonable estimate of economically recoverable resources (ERR).
For the North Dakota Bakken/Three Forks, cumulative production plus proved reserves (1P) is about 8.5 Gb, my medium oil price model for the North Dakota Bakken/Three Forks matches this number closely. For the Permian basin there is a much bigger mean technically recoverable resource estimate compared to the North Dakota Bakken/Three Forks (Permian TRR=75 Gb, ND Bakken/Three Forks=11 Gb). Currently for the Permian Basin about 5 Gb has been produced (at the end of 2019) and proved reserves are about 12 Gb and 2P reserves about 20 Gb, so we would expect a minimum output of 17 Gb (if we assume probable reserves are zero) and more likely there would be at least 25 Gb of output, if possible reserves and contingent resources are zero. My best guess remains in the range of 45 to 55 Gb of economically recoverable resources from the Permian basin for a medium oil price scenario (WTI no higher than $75/bo in 2021 US$) with oil prices declining after 2033 as transition to electric transport reduces demand for oil. Even a very conservative completion rate of 350 new wells per month maximum and the oil price scenario outlined would lead to an ERR of 43.5 Gb with a peak in 2028 at 4542 kb/d, this would be about the minimum ERR I would expect, but I think there is about a 90% probability this level will be exceeded.
Note that even for this very conservative scenario all Permian debt is paid back by 2024, if the assumptions of the model are correct. Debt reached a maximum of 98 billion at the end of 2020, based on the model. Mike Shellman has told me that debt is larger than this at 170 billion, if Mike’s estimate is correct and we assume that is the debt level at the end of 2020, then all debt would be paid back by the end of 2026. My debt estimate is based on the model and assumed well costs and operating costs, it is possible that costs early in the Permian basin for 2010 to 2018 were higher than I have estimated in my model. I have not been able to find a good estimate of total E&P company debt in the Permian basin.
Thank you very much for the explanation.
Why do you not use 1P? Has that been shown in other LTO cases to be an underestimate of what has actually been produced?
Hickory,
Check the following link and look at data from 2011 to 2019.
https://www.eia.gov/naturalgas/crudeoilreserves/
It will become clear that proved reserves grow sustantially over time.
As a very simple example Permian reserves in 2019 were about 12 Gb, in 2011 all tight oil plays besides Bakken, Eagle Ford, Niobrara, and Barnett had 0.25 Gb of proved reserves so permian tight oil reserves would have been no larger than 0.25 Gb. So the bottom line, in 2011 Permian proved reserves for tight oil would have been underestimated by at least 18 Gb and by 25 Gb from a 2P reserves perspective. Note that the 2P estimate is the engineering best guess so this is the reserve number that should be used. Typically 2P=1.7 times 1P reserves.
Why do I not use proved reserves only? I like to give realistic estimates of future output rather than underestimates of future output. Also note that despite my attempts to avoid this mistake and give peak oil analysis some measure of credibility, I have consistently underestimated future oil output.
See https://oilpeakclimate.blogspot.com/
for some of the underestimates in my early work particularly
https://oilpeakclimate.blogspot.com/2012/07/an-early-scenario-for-world-crude-oil.html
and
https://oilpeakclimate.blogspot.com/2013/12/when-will-us-ltolight-tight-oil-peak.html#more
In short, I do not used proved reserves because it will lead to an underestimate of future tight oil output. Likewise for World oil, and natural gas. Coal is a different story where resources are significantly overestimated.
Thanks for the feedback Dennis. I have some serious reservations about the reserve assumptions however.
One is that you say “It will become clear that proved reserves grow sustantially over time.”
Well prior to LTO production in 2009, US reserves were steadily falling, as clearly shown in the graphs on your link.
Now we all know that the LTO industry has been a tremendous innovation and has brought a lot of oil to the table. But as far as we know this a one time deal. And will not lead to future proved reserve increases unless there is some further innovation along the lines of what Coffeeguy was describing above (further enhancements in recovery). At this point it is a speculation and nothing to rely on.
Secondly and more important i think- it is walking on thin ice to use the LTO story to support the hypothesis that 1P underestimates the URR. Its based on N=1. If there was 7 examples of such it would seem much more relevant.
Anyway, thanks for the food for thought ( and all the effort!). The energy consumer in me hopes your estimates of LTO output are correct. The skeptic in me hears all the voices saying how this industry is running on fumes. This despite huge Capex over the past 10 years flowing to it, and very little elsewhere.
I feel like the probability is high that high price of oil within the next 5 years will give a clear test and indication of what reserve assumptions were appropriate.
It would be interesting to see a chart with 1P as the reserve assumption.
Hickory,
Over the period from 1980 to 2008 US 1P reserves grew by 63%.
See
https://peakoilbarrel.com/us-oil-reserve-growth-2/
and also chart below from that post. Note that I showed a Bakken chart with 1P reserves see link below
https://peakoilbarrel.com/bakken-summary/#comment-722850
For the Permian Basin we would have a scenario with 17 Gb of output which would be absurdly low. The USGS F95 TRR estimate is 44 Gb with perhaps an ERR of 30 Gb, that is about as low as is reasonable (with perhaps a 97% probability output would be higher than this). A Permian scenario with ERR of 17 Gb would have about a 99.99% probability of underestimating output, sorry I won’t waste time doing that, but see older chart from 2018 before we had the most up to date USGS Permian basin estimate (from November 2018) in next comment.
For reserve growth chart below, 50 Gb reserves in 1980 and 20 Gb of discoveries from 1980 to 2008 for a total of 70 Gb=50 plus 20. Cumulative US C plus C output from 1980 to 2008 was about 70 Gb so 70 minus 70 is zero reserves in 2008, actual 2P reserves in 2008 were about 35 Gb rather than zero, reserves grew by about 70% over this 28 year period. Also had we predicted output for the US in 1980 based on 1P reserves (about 29 Gb), we would have estimated 29 Gb of output, but in fact the output was 70 Gb so we would have been too low by a factor of 2.4.
So as a rough guess we could take Permian 1P reserves (11 Gb) and multiply by 2.4 which is 26.4, then add cumulative production of 6 Gb and we would get 32 Gb, note however that this assumes no output from the US after 2008 (to get our factor of 2.4 earlier). In short the 32 Gb estimate is likely very conservative.
Reserve growth chart for US 2P reserves below, click on it for larger view. Bottom line is reserve estimates increase over time.
I think if you check the numbers. You will find the US has produced about 3 times more oil since 1980, than the stated reserves at that time.
Hickory,
A Permian scenario from August 2018 before I had the most recent information on the Delaware basin, I was using a mean TRR estimate of around 45 Gb at this point (I had underestimated Delaware basin TRR by about a factor of 4 at this point). The “average scenario” has a URR of about 27 Gb. Obviously I didn’t know about the pandemic at this point and thought the average 2017 well would be as high a EUR as we would see (in fact EUR went up a bit, but not if we normalize by lateral length). Notice how in 2019 this scenario underestimates output by about 1000 kb/d, I underestimated completion rate by a large margin for 2018 and 2019. The average scenario has a peak of about 4000 kb/d, we have already hit a peak of 4400 kb/d (shaleprofile data) for Permian basin in March 2020.
As always click on chart for larger view.
Huntington beach,
Thanks so perhaps by 2060 we might see at least 39 Gb output from Permian basin, though even that is conservative in my opinion. Permian 1P reserves were under 1 Gb in 2015 and grew to 12 Gb by 2019 with about 3 Gb of cumulative output from 2015 to 2019, so total URR grew by at least a factor of 14 over that period (if we use 1P reserves as the basis for estimating URR). Note that I do not expect we will see URR grow from 17 Gb to 17 times 14 (or 238 Gb). I happen to think using mean TRR estimates from petroleum engineers and geophysicists at the USGS and then applying reasonable economic assumptions in the future yields the best estimates. Chart below has a more recent estimate based on low completion rates (likely in a low to medium oil price environment) and a low TRR scenario (TRR=60 Gb rather than the USGS mean of 75 Gb). ERR=35 Gb, maximum completion rate is 460 new wells per month, total wells completed=108500 from Jan 2010 to May 2036. I would estimate that the probability that the ERR will be more than this scenario at about 99%. Click on chart for larger view.
Another thing to keep in mind is that 1P estimates don’t add. You can think of it this way: 2P estimates are you’re best guess. You could be wrong so you make a 90% confidence interval around your best guess. 1P estimates are the bottom of that confidence interval and 3P estimates are the top. But if you add the two 1P estimates, they are not necessarily the bottom of the 90% confidence interval for the two regions combined (probably too low, the sum of 3P estimates will probably be too high). However the sum of the 2P estimates will be your best guess for the two regions combined. So summing 1P or 3P estimates will probably not yield the 1P or 3P estimate for the total region, but summing 2P estimates will be the 2P estimate of the combined region.
Schinzy,
I’ve seen that comment before – that 1P estimates don’t add – yet, isn’t that how oil companies determine their total 1P reserves? They just add the 1P reserves from all their fields?
SouthLaGeo,
Perhaps they do, but the best estimate would be the 2P reserve estimate and I imagine that is what is used internally, the proved reserve number is used for finacial reporting, it is likely the engineers sum up th company reserves at the 2P level and then tell the bean counters the P90 estimate.
Schinzy,
Correct, Jean Laherrere often points this fact out, but most people just don’t get it and want to use proved reserve estimates. To me it would be like looking at a group of people and guessing at their average weight, say 70 kg, but then with a confidence interval saying 60 to 80 kg is our 90% confidence interval. Now when we build an elevator we don’t use 60 kg, we might use the 80 kg estimate when giving the elevator capacity, but the engineering best guess is 70 kg per person, in North America this number would be higher about 81 kg, in Europe 70 kg is about right and World wide the average is about 62 kg for adults.
In any case 2P estimates make the most sense to me and based on UK data 2P reserves are about 1.7 times the 1P reserves. Unfortunately we do not have good 2P data available Worldwide though a peer reviewed paper from 2014 stated that BP proved reserves for the World were roughly equal to the IHS 2P reserve estimate in 2011.
Agreed Dennis,
Also in statistics, errors tend to cancel out over larger data sets. The larger the sample size, the more canceling out you will have. This is reflected in probability theory. So if you sum up all your best guesses, that becomes your best guess for the group of regions. Some of your best guesses will be too low, others will be too high. This is reflected in the probability theory used to compute the 90% confidence interval for the group, it will be tighter than if you make the sum of the confidence intervals for the sub-regions.
That’s why I say that summing your 1P reserves will in general underestimate the 1P reserve for the group of regions while summing your 3P reserves will in general overestimate the 3P reserves for the group. This is precisely why Jean Laherrere complains that it is common practice in the industry even though it is not justified by probability theory.
Dennis, please! In 2011 no one had any idea that tight source rock could be used as an actual oil reservoir. The idea was that if it was too tight to escape the source rock then it was too tight to ever produce any amounts of commercial oil. But it was then discovered that they could blow the source rock to smithereens and make it release its very tight oil.
So your point is very disingenuous. The new technology was not then known, now it is. So the expanded proven reserves were due to entirely new technology, not that the old reserves were underestimated.
So…. is there some entirely new technology that you see coming soon that will dramatically increase proven reserves as we saw with the shale oil phenomenon.
I really don’t think so.
Ron, I doubt if your 2011 source rock statement is correct. Do you remember back 20 years at the beginning of the W administration and Dick Cheney’s energy meets with oil executives? It’s my understanding those meetings paved the way to fracking we see today. Also on the table was the idea of removing Saddam Hussein under the fears of WMD. Oh, to have been a fly on the wall of those meetings. Well, we all know now which one was Cheney’s plan A and which was plan B.
Twenty years ago with oil in the 20 dollar range and the additional cost of fracking. What oil executive in his right mind would want to have invested into expensive fracking when it could get undermined easily by cheap produced Middle East oil? Let me help you, none.
The point, there were insiders in the industry that knew the potential of shale, but it just hadn’t been tried on a large scale at the time. Which rises the question, how many other potential opportunities are there that you don’t have calculated in your 2018 peak belief ?
The US went 48 years from peak to peak, 1970 to 2018. You state the Saudi’s peak is 10400kbd and can ownly produce 10000kbd max now. That’s only a 4 percent decline. History isn’t on your side.
Ron, I doubt if your 2011 source rock statement is correct.
Not a problem HH. Just tell me in what year the shale source rock was added to proven reserves? Then tell me how much the proven reserves increased that year?
You know proven reserves are based on economics, that is how much oil can be econocially produced. You seem to be describing oil that everyone believed could not be economically produced. That would not, at the time, be considered as proven reserves.
Ron, now you are changing your argument. You just went from “no idea” to it needing to be “proven reserves”. How many billions of shale barrels have been now produced? Your better than that. Reread your original statement. In 2011, WTI was runnig around $100 until shale oversuppled the market in late 2014. Just because the production was mismanaged economically, does not make it a reservoir.
Would you like a little barbeque sauce with that crow ?
Oh, for God’s sake HH. Before the shale revolution no one had any idea that shale oil could be economically produced. Then when it was proven that shale oil could be economically produced, that shale oil potential was added to the proven reserves.
HH I think you knew damn well what I meant so please stop the dramatics.
As to your estimate of 3 times the production since 1980, please see my post below.
I was doing multi-stage slick water hydraulic fracturing on shale formations (exclusively Devonians aged) starting in the late 1980’s. And operating open hole shale wells that didn’t even require a completion that had been drilled in the late 1970’s, and there I was, producing them a decade later. Unfortunate that folks who want to pretend to know things about crude oil development can’t be bothered to learn stuff first. Just out of curiosity Ron, which of the many internet experts told you that no one had any idea (other than those of us DOING it of course) that source rocks couldn’t be reservoir rocks? I was exclusively drilling horizontal wells in the late 80’s and early 90’s as well, onshore and off, in 2 different countries and across at least 4 basins here in the US, do you have similarly uninformed internet sources who told you that was NEW and UNCONVENTIONAL as well?
Damn RG, you are so fucking good. You should have informed the USGS about all that shale oil and how easily it could be produced. Then they could have added them to the US proven reserves decades earlier.
The quality of my understanding isn’t in question. I am mostly recommending you learn more history prior to misrepresenting it. As far as the USGS knowing about continuous oil and gas (the correct term versus those who don’t even know what the word unconventional means, let alone what to apply it to), Chuck Spencer conceived the term back in the 80’s somewhere. Started with continuous gas, but the concept applied to oil as well. Funny how those geologists know stuff that others can’t even wrap their minds around the terms. The USGS did their first assessment using a new grid based methodology for continuous resources during the 1995 US assessment, if memory serves. Only 5 years after the modern peak oil era began when Colin Campbell declared global peak oil in 1990. Learn the history, lest being forever doomed to repeat it. If that isn’t the peak oil tale, I don’t know what is, right?
RGR, None of you could be bothered to derive the dispersed diffusional dynamics of shale wells that we documented in our book Mathematical Geoenergy a few years ago. Ain’t it cool how that happens?
“By 2060 the world’s second-largest economy aims to transform its power generation mix from roughly 70% from fossil fuels today to 90% from renewable sources such as wind and solar, as well as hydro and nuclear power,”
Sorry to burst the bubble energy planners, but this is not a lofty or auspicious goal.
Its more a story of desperation that all nations will be engaged in- a struggle to keep things moving despite being far beyond peak oil, and gas, and coal, and forests.
https://daily.energybulletin.org/2021/08/china-is-redrawing-the-worlds-energy-map-bloomberg/
This will be an herculean task to carry out, nearly impossible given their current dependency from coal.
Anybody following the lack of gas flowing from Russia to Europe via pipeline? It’s not clear if this was a voluntary move made by Russia or forced move due to lack of flow on Russian side.
I heard they had a fire in a processing station at this pipeline. Trying to cover the real damage, and how long it takes to repair.
Delivery of condensates is down, too.
From 5 to 6 August, at a gas condensate processing plant in Novy Urengoy, a fire destroyed one line on one of four technological lines. At the plant, methane was separated from heavy gas fractions. Methane was sent to a pipe for consumers. The old plant was built in the USSR. plans to replace equipment with modern ones. What decision will be made is not clear yet, most likely the line will not be restored, but the construction of a new plant will begin. No decision has been made.
For information:
The plant for the preparation of condensate for transport belongs to OOO Gazprom pererabotka, which is the largest industrially organized oil refining enterprise and the main producer of high-quality products of hydrocarbon processing in the Yamalo-Nenets Autonomous Okrug. Abbreviated name: ZPKT.
The raw material for the ZPKT is the unstable gas condensate of the Urengoyskoye and Yamburgskoye fields.
The condensate preparation plant for transport is located 18 kilometers from Novy Urengoy.
Factory products
The main product of ZPKT is deethanized condensate, which is a raw material for the Surgut Condensate Stabilization Plant.
Currently, the plant produces more than 10 types of commercial products with a quality that meets state standards:
Stable condensate,
Diesel fuel,
Aviation fuel TC-1,
Automotive propane,
Butane,
and others.
Since 2014, more than 11 million tons of unstable gas condensate has been supplied to the ZPKT annually.
After the commissioning of the facilities of the alternative scheme, the capacity of the plant for receiving raw materials will be about 16 million tons per year.
Alexander , now that is what I call information . Spasiba .
And more. I heard that there is an opinion in Gazprom to replace the retired capacities of the Novo Urengoy plant by increasing gas production at the fields where “dry gas” is produced. Gas processed at the plant “fat”.
HUNTINGTONBEACH Wrote
I think if you check the numbers. You will find the US has produced about 3 times more oil since 1980, than the stated reserves at that time.
Well I did check the numbers HH. Using the latest EIA Monthly Energy Review, I totalled the daily production from January 1980 thru June 2021. Multiplied that times 30.4375, (the number of days in the average month), then multiplied that number by 497, (the number of months, Jan. 1980 through June 2021), and I got 55,246,065,012.
The chart below shows about 30 billion barrels of proven reserves in 1980. So, we have produced about 1.84 times the estimated proven reserves in 1980.
By the way, the spike beginning in 2009 and ending about 2011 is the Shale explosion. Tight oil became economical to produce around that time therefore it was then added to US proven reserves.
Ron,
I use annual output from page below
https://www.eia.gov/dnav/pet/hist/LeafHandler.ashx?n=PET&s=MCRFPUS1&f=A
I add all C plus C output from 1981 to 2020 and the total is 107 Gb. Proved reserves for crude oil in 1980 were 29.8 Gb link below
https://www.eia.gov/dnav/pet/hist/LeafHandler.ashx?n=PET&s=RCRR01NUS_1&f=A
In 2010 crude reserves were 23.2 Gb. US cumulative output from 1981 to 2010 was 74 Gb.
This roughly excludes most tight oil output. 74/29.8=2.48. In other words, had we assumed that output would be equal to proved reserves (1P) in 1980, we would have underestimated output 30 years in the future by a factor of 2.48. We can deduct tight oil output before 2011 which was about 1.9 Gb and this reduce the cumulative conventional output to 72 Gb, then we get 72/29.8=2.41. Now we could also look at US conventional output from 1980 to 2020 by deducting tight oil output so 107.3 Gb total US C plus C from 1981 to 2020 minus 18.8 Gb of tight oil output for conventional C plus C total of 88.5 Gb. Going back to the 1980 C+C proved reserves of 29.8 Gb we would have underestimated output by 88.5/29.8=2.97, or roughly a factor of 3 as suggested by Huntingtonbeach.
If we instead use 2P reserves at an assumed 1.7 times 1P reserves, we do a bit better at 88.5 divided by 50.7, but we are still too low by a factor of 1.74. On possible solution is to take 2P tight oil reserves (Permian 2P=20.4 Gb) and assume they grow by 63% (to 33 Gb) then add 5 Gb of cumulative production to get an estimated ERR of 38 Gb. My estimate is that there is a 90% probability this ERR will be too low. It would roughly be consistent with a high oil price scenario (oil prices rise to more than $85/o for WTI in 2021$) and a low TRR scenario similar to the USGS F95 TRR estimate of 44 Gb for Permian basin.
Dennis, I have absolutely no problem with your data. It is your conclusion, that is, your estimate, that I have problems with. Guesses about how much oil is left in the ground are not worth a bucket of warm spit. It is only what eventually comes out of the ground that counts.
Looking forward to your OPEC post. The data came out today. No surprises, huge increase in OPEC production. They predicted it.
Ron the data shows that reserve growth in the US has been substantial, the argument that it cannot occur elsewhere such as in OPEC nations is specious in my opinion.
Dennis, we have been over this many times before. We have thrashed this straw over and over. US publically owned oil companies have always underestimated their early reserves. Strict SEC rules have huge fines and other penalties if they over-estimate reserves. So as time passes and they get a better estimate of reserves, they update them. Nationally owned companies have no reason to underestimate reserves.
Also, reserve growth is something that happens to young fields, and occasionally middle-aged fields. Very old fields have already experienced all the growth they will ever experience.
But I must add, I really don’t give a rat’s ass about estimated reserves. Production is all that matters. When a field goes into terminal decline, like Prudhoe Bay or Cantrell, or Ghawar, people can speculate about the reserves left in these old fields until the cows come home but nothing will turn that decline around.
Ron,
What are the new fields from 1980 to 2008? The reserve growth happened, it’s in the data for those willing to see. If it happened before, then it is likely happening now. It has little to do with SEC rules, both proved and proved plus probable reserves grow as knowledge and technology improve over time as fields are developed, it is the nature of the industry.
Dennis, of course, it’s happening now in all those tiny fields that we have found in the last 20 years or so. But there are no more giants Dennis. Publically owned company’s reserves have dramatically shrunk in the last few years. How is that for reserve growth? There have been some pretty good fields found lately by nationally owned reserves. The reserves in these fields, by and large, have been greatly exaggerated. Expect some “reserve shrinkage” in these reserves.
Dennis, there has been considerable reserve growth in the past. However, reserve growth from recent discoveries by publically owned companies will be miniscule.
“In fact, between 1980 -when U.S. reserves were 36.5 billion barrels -and the end of 2014, the U.S. produced 111 billion barrels of oil. Further, despite the 111 billion barrels that were produced, U.S. crude oil reserves at the end of 2014 had grown to 48 billion barrels:”
https://www.forbes.com/sites/rrapier/2016/05/23/the-explosive-growth-of-u-s-oil-reserves/?sh=62f10fb56b22
Ron, “please!” Even if Forbes and Rapier got it wrong. 3 or 1.84, shale reservoirs are viable and have effected the world price of oil for almost the last 7 years. It has turned OPEC’s pricing abilities upside down along with the advancement of EV’s. Shale has sent a political message that America is not subservient to OPEC and that message is worth ten times all the debt accumulated in the shale patch.
Who knowns what the future holds? Clearly you were caught off guard 10 years ago.
Never say never, peak will be decided by demand
Clearly you were caught of guard 10 years ago.
HB Everyone was caught off guard 10 years ago. No one but a few drillers in the oil business saw the shale revolution coming. Did you? Hell no! So please stop throwing that one up to me when you cannot name even one prognosticator who did see the shale revolution coming.
Never say never, peak will be decided by demand.
That’s just your opinion. My opinion is that the peak was decided by supply.
I will have more to say on this subject when Dennis publishes the OPEC post in a few days.
Ron, I can’t understand how you can claim your 2018 peak is supply induced. During your claim of peak, the US had been adding for a couple of years in a row an additional million barrels a year. OPEC was fighting among themselves for market share. But most of all, it was the demand collapse of Covid in March of 2020. That has turned the oil market on it’s head for the last 18 months. In addition, we were not seeing a price spike from shortage in 2018.
HB, not all oil producers were producing flat out in 2018, just most of them. In any year there will always be a few companies or nations that could produce more barrels than they are currently producing. And someone is always doing maintenance and has cut production as a result.
But by and large, in 2018 and 2019, the world was at, or very near, producing the maximum number of barrels they could possibly produce. Today, of course, we have the demand cut brought on by the Covid Pandemic.
Nevertheless, increasing nations cannot produce enough oil to replace the declining nation’s lack of production. Some nations will get back to their pre-covid production level. And a few may even increase production above their pre-covid level. But most will not. And the pre-covid level was 2.5 million bp/d below the 2018 average. That 2018 level will never be surpassed.
Not everyone Ron. Please don’t lump me in with the faith based “fit a curve to it quick…and we’ll pretend its predictive in nature!!” gang. YOU might have been caught off guard, and deservedly so. While the congregation members were slapping bell shaped curves and linearizing everything in sight, some of us were already figuring out how to put this problem in a proper context. But please, acting as though peak oil circa 1990 or 2002 or Thanksgiving Day 2005 didn’t work out surprised EVERYONE is a crock. You are welcome for me having warned folks at the time.
Reserve Growth, I am through discussing anything with you. I know I missed the surge in US production. But you did not? Well whoop de doo, I am so goddamn proud of your predictive abilities.
Bye now.
Found another chart of US proven reserves. This one shows 1980 proven reserves at about 31 billion barrels. Also, this one is through 2016 and better shows the reserves added because of the shale revolution.
Yes. It would be interesting to see the US reserves trend- minus LTO.
It would tell a very different story than ‘perpetual reserve growth’.
Nonetheless the US has a very big LTO resource, along with a huge degree of uncertainty on the ultimate production that will come of it.
Its dangerous to make plans or economic projections based on so much uncertainty- but thats our situation.
Ron and Hickory,
Note that the reserve growth post I did only used data through 2009 to avoid growth in oil reserves from tight oil.
Also see
https://www.eia.gov/naturalgas/crudeoilreserves/archive/2007/full.pdf
especially page 9.
Hickory,
When I talk about reserve growth, I am talking about revisions to reserve estimates.
Consider the following hypothetical example.
A nation has 100 Gb of oil reserves at the end of 1980 and produces 100 Gb of oil from 1981 to 2000. Over that 20 year period no new oil field discoveries occur in that nation, but at the end of 2020 their reserves are 50 Gb.
The absolute amount of reserves has decreased by 50 Gb, has there been any reserve growth?
Obviously there has otherwise the oil reserves at the end of 2000 would be zero. How much did reserves grow? By the 50 Gb of oil reserves that exist at the end of 2000. How much did reserves grow in that 20 year period as a percentage of original reserves at the start of the period (Dec 31, 1980 in this example) by 50 Gb/100 Gb or by 50%. For the US from 1980 to 2008 reserve growth was about 63%.
From Dec 31, 1976 to Dec 31, 2007 US reserves grew by 66.8%. See the 2007 Annual reserve report linked above. Reserve growth is real and will continue. This does not mean reserves will grow by more than production, only that there is more oil in the ground than current estimates of proved reserves indicate. This is not likely to end any time soon.
Thanks Dennis for taking the time to explain your rationale on all this (over and over).
It takes balls, and great attention to detail, to put your name on projections like these.
Appreciated.
It takes balls, and great attention to detail, to put your name on projections like these.
Appreciated.
Yes it does, it takes balls, and much appreciated Dennis. You have more balls than I. I would not dare put my name on such projections.
Thanks, Dennis. 🙂
Its the stupidest stuff I have EVER read in 50 years of being in the actual oil business, but it sure is entertaining. So yeah, thanks.
“Starting with USGS estimates for technically recoverable reserves…” reminds me of a fella that just days after the USGS report came out in 2018 on the Permian Basin fell for the same TRR bullshit, forgot completely about how it was all going to be paid for, and said this…”For America, conserving oil is no longer economically imperative.”
Thanks Mike,
There was a time you thought my analysis was pretty good and said so. With tips from oil professionals I think it has gotten better over time. Mike can you explain why the same type of analysis for the North Dakota Bakeen/Three Forks results in an estimate for ERR that roughly matches the 1P reserves plus cumulative production? ERR about 8.5 Gb. The same methodology for the Permian Basin results in an ERR between 43 and 55 Gb, depending upon future completion rates. All wells completed after May 2020 are financed from cash flow, interest paid on debt at a 7.5% annual rate and 95 billion in debt is paid back by 2024 assuming 25% of net revenue is paid out as dividends. RRR is over 100% up to at least 2025 ( depends in part on completion rate in the future.)
LTO survivor has been in the business for 40 years and thinks the analysis is pretty good considering it is from an industry outsider.
There is no doubt there is much more I have to learn, and I much appreciate industry professionals pointing out my mistakes.
I get PDP R/P a bit lower than your 3.5 estimate for Permian basin, more like 2.8. RRR is about 112% for Permian basin in 2021. For a 46 Gb scenario with maximum completion rate of 450 wells per month, RRR falls to less than 100% in 2030, reaches 97% by 2038 and then decreases rapidly as completion rate drops from 450 to zero over a 4 year period (Jan 2038 to Dec 2041.)
Thanks Hickory.
Sorry if I am too pedantic, I have explained this stuff on many occasions, but most don’t seem to get it, I must not communicate very well, I try too leave out all the details so as not to bore everyone, then excellent questions arise (such as yours) and I probably over do the details.
As I often say, all projections of the future are wrong, there is only one correct future scenario, but the possible future scenarios are endless. Several Permian scenarios gathered together on one chart, TRR=75 Gb for all, ERR shown on chart 43 Gb to 55 Gb, monthly well completion rate maximum 350, 450, 550, and 624 from low ERR to highest ERR. My expectation is that for the price scenario assumed (maximum WTI price about $77/bo in 2021 $ from 2022 to 2033) there is about an 80% probability the actual future scenario will fall between the high and low scenarios in this chart, assuming no major shocks (atreoid strike, WW3, new pandemic, or unknown unknowns.
click on chart for bigger view.
While a lot of big picture stuff gets debated here, in the oil patch there continues to be a huge labor shortage.
We had an injection well that did not pass MIT due to a tubing hole. State gave us 90 days to repair, knowing there is a lack of rigs. Normally 30 days are given.
We are near 90 days and still no rig. We have proof of all communications made to secure one. We asked for another extension but state says they already gave us the most time allowed per admin code.
Admin code never contemplated no workers to operate and be hands on a workover rig. State trying to figure out what to do. We could be fined, but thus far it is looking like they will work w us. We have a pretty good record. But higher ups in state office are new, and haven’t visited the field much. So we shall see.
I guess maybe we are an isolated case, being in a small, old stripper well field?
We now have another injector that has a hole and also are up to six producers off w hole or pump issues. We have been able to have only two wells serviced since the first part of June.
Production in our county hasn’t recovered from 2020 due to this labor shortage. First six months’ production was the same as 2020. Many wells are still SI from the COVID lockdown.
Wife and I received another mailer from a local factory asking us to apply.
Shallow Sand
I just can’t resist the temptation to comment about government, lack of experience/wisdom and the application of non engineering.
There really shouldn’t be a time problem if you are not disposing into a well while it has a leak. If the disposal zone is supercharged, then the fluid level in the annulus should drive the urgency of the repair. If the fluid level is sufficiently below any aquifers then no emergency. But the rules say……
Speaking to rules and timing, have you ever wondered where the compliance timeframes come from? Why is 30 days the magic number? Why is 90 days the magic number? These are arbitrary at best and do not speak to the real issues. If regulators are going to hire “professionals” that can only regurgitate the rules then they are wasting the taxpayer’s money. Almost all of these operational issues should be negotiated at some level to produce the best outcome for the specifics of the well or field. In some states they push for hearings which require legal representation which is a monumental waste of money; read resources.
This stuff is crazy making for me and, as a former regulator, I operated as one without bureaucratic DNA and things went well. After all, pushing on a rope is tiresome and seldom accomplishes much.
All the best. Maybe the end of unemployment and stimmies will drive hands back into the oil patch. Hopefully they’ll be competent and not liabilities.
Rasputin.
Yes. No issues with freshwater zone. Just a tubing hole. But of course have had well SI for almost 3 months, which isn’t good as you know.
But an update, service company owner (who is a really good guy) is going to get a rig on it tomorrow. Not sure when crew can be there, he has about three workover rigs for every crew, which is about the way it is around here.
We shall see about labor, but I am afraid we won’t be putting the genie back in the bottle on that one. Rig work is hard work, not many want to do it. Notice we aren’t ourselves. I did work as a hand on a single drum rig one summer, 1991.
Funny story. I was green as they come. Operator immediately didn’t seem to like me much. Nor did his cousin, who was a hand on the other rig. Finally, one day operator flat out asked what I was making an hour. I said $6. He said, ok, good. Later his cousin came up to me and said we were good. He was making $7.75.
It turns out the operator on the other rig told the cousin I was making $8. Made them both mad. Thankfully he asked me, it would have been a long summer otherwise. Those guys taught me a lot, and I have forgotten most of it. Will never forget the wet strings.
Shallow Sand
Great news. After the rig arrives order prime rib from grub hub and see who shows up.
Great story too however wet strings being bad depends on how hot it is and how fresh the water is! We make virtual drinking water from two of my CO wells.
How much production have you had shut in while the SWD has been down?
Rasputin. Our water is salty enough that it isn’t a great thing. I know there are places where the water is so fresh it doesn’t have to go back down a well, but can be utilized on the surface. If ours was like that, we truly would be sitting on a gold mine. But, the oil production is maintained by the re-injected water.
We haven’t had to shut a producer in. The lease has 18 producers and 11 injection wells. The other ten aren’t having a problem taking the water. Cumulative 324,000+ since 1985, still producing 18-20 barrels a day. 920’-960’ with 20’-40’ sands.
The other injection well that has a hole is in a similar position. 16 producers, 7 injection wells in that project. But that lease is “water starved” only disposing of about 400 BWPD there, versus about 2,000 BWPD on the first lease I discussed. This lease just makes 10-11 BOPD, but the electric bill is $2,000 less per month, so it all evens out.
We have a few one or two well leases where we haul the water. One of those one well leases makes almost 1 BOPD, but just one 70 BW tank of water per year. Part time well, electricity around $50 per month. 1/2 gallon of chemical every four weeks. Owned since 2003. Pulled twice during that time. 950’. Wish they were all like that. Handing water is our second highest expense, only after labor.
Our little field was really crushed by negative oil, and the low prices since Thanksgiving, 2014. 2014 saw a mini peak of just under 1 million BO. Since then, slowly declined, but 2020 was just 585K, and first six months 2021 was just 303K. Have to think this decimation of stripper oil is very common throughout the USA, maybe the world.
Part of our problem is our inspectors toured the Marcellus a few years ago. The boss was so impressed with how clean and new everything was that he decided our field needs to look the same. Not realizing the Marcellus is very new, almost all gas and financed by Wall Street, whereas we will be 116 years old on August 29, are all oil and are financed by ourselves. So we have spent a lot of $$ trying to emulate the Marcellus as far as “looks” are concerned.
Shallow sand,
Great information thanks.
Heck, I made a mistake. We are 116 years old. The first well, which was mostly gas, hit pay on 8/5/1905. The oil gusher was later in the month.
The drill bit hit pay at about 4 pm that afternoon. IP reported at 25 BOPD and 1.5 million cubic feet of gas per day.
Shallow Sand
Thanks. That pay depth explains your handle and much of your commentary along the way. I should have thought about the fact that you operate a waterflood so an injection well being down is one of many. Your explaiation of stripper waerflood economics is very familiar and should enlighten folks here of the realities of about 5% of US production that hopefully will be here when shale is done.
Don’t think for a minute that water below federal drinking water TDS standards that is produced in CO isn’t treated like nuclear waste; it is. And for those waiting to pounce, there are no radioactive trace elements in it either. Also, with all the shiny new Niobrara wells around the government thinks we can look as pretty too. If any of the folks had ever run a lemonade stand that set these policies, life would be different.
Sure hope that you get your well fixed and off your list.
New post will be up in the next 36 to 48 hours.
I just read today that Exxon is divesting itself of all of its shale assets. They know the end is near. Their cost structure can’t stand thousands of stripper wells plus they don’t want the environmental liabilities coming down the pike as the industry is targeted once again. So there you have it. The full cycle of shale. No more buyers and no more consolidators. If one wants to play in the sandbox, they should plan on owning it forever and run it like a business. There will still be fortunes made but know how, knowledge, hard work and perseverance will be the character traits of those who survive. Meanwhile we will spend trillions of dollars that we don’t have looking for fairy dust and magical inexhaustible “green” energy. I am hopeful but not optimistic that we will avoid energy poverty and the misery that accompanies that predicament. The golden goose that produced the golden eggs is now on death watch. RIP.
Thanks LTO survivor,
We do need to move to non-fossil fuel energy as quickly as is feasible or sequester carbon produced to avoid a climate catastrophe.
Read latest IPPC report or realclimate.com for brief summary. The more we study this the worse it looks, we need to take our collective heads from the sand imho.
LTO. What ExxonMobil is selling right now looks to be gas assets. Not selling Permian yet.
‘Smacks of hypocrisy: Alberta slams White House for demanding more OPEC oil after cancelling Keystone XL
“The Biden administration pleading with OPEC to increase oil production to rescue the United States from high fuel prices months after cancelling the Keystone XL pipeline smacks of hypocrisy,” Alberta Energy Minister Sonya Savage said in a statement Wednesday. “Keystone XL would have provided Americans with a stable source of energy from a trusted ally and friend.”
Politicians=Hypocrites=Grifters. Term limits is our only salvation.
President is term limited, perhaps this should be so for US Senators and Representatives, perhaps 2 terms for Senate and 6 terms for representatives (12 years each). Guess it would require a Constitutional amendment, though I am not familar with legal or constitutional matters so I may be wrong.
Let’s eliminate the Senate, Supreme Court, and the Electoral College first.
But 6 terms for representatives would be proper.
Let’s joint the rest of the First World, and not cling to a 1700’s system designed to support an elite class.
Slavery, and denying women the right to vote, were not bright spots also.
John Kerry ( Climate Tsar -John Kerry) flew to Obama’s birthday party at Martha’s Vinyard for the afternoon on his private jet. As Marie Antoinette once said , “Let them eat cake”. He better hope that his PJ will take him to a private island when the masses come for his scalp. The political ruling class is treasonous on a criminal level. It saddens me greatly. They are all such reprehensible hacks on both sides of the aisle. Someone recently sent me the highlights of the infrastructure bill just passed by the senate. It is beyond wasteful and irresponsible on so many levels.
LTO Survivor
For the most part, the bill that just passed is investment in roads and bridges and water systems. Is it the charging infrastructure you don’t like? Seems like a good idea to me, but I own a Tesla M3 and the infrastructure is pretty good for Teslas.
It would be nice if Ford and Chevy had some places to charge their EVs.
Dennis. I hope you agree that Biden’s call for more OPEC oil is hypocritical.
Biden can’t have it both ways. He needs to admit that gasoline needs to be much higher priced to help the world transition away from it.
Of course, admitting that will likely lose the House and Senate to the R’s in 2022. Which was my prediction soon after Biden’s election when oil prices started to rise.
Shallow, no it’s not hypocritical. A pipeline is major infursturture with the intentions to last 30 to 60 years. A call for OPEC to supply the current market with a few extra barrels is totally different.
I read yesterday you needed to repair one of your wells because of a citation. You could purchase the equipment and do it yourself. But your not. Instead, you just want to hire someone with the equipment and want them in and out.
The goal is to transform away from fossil fuel transportation to renewable EV’s. Cutting fossil fuel in half over the next 15 years would leave new pipelines as a stranded asset. Inaddition, there is also a political game that must be played with the price of gasoline and reelection. Are you ready to go back to sub $50 WTI of the last 4 years? How quickly you forget. Do you want to sell your product for below cost for some political parties gain of power?
Huntingtonbeach,
I disagree, Biden’s actions are indeed hypocritical. As to stranded assets that is up to the company making the investment, and it is always a risk, but it is the the government’s role to allocate private capital in the US. Nor is it the government’s job to decide how oil companies should allocate their capital. It sounds like the government does a poor job of regulating the oil industry where Shallow sand lives which is unfortunate. I hope things go well for him.
A pipeline is long term and takes years to build. You wouldn’t build a auto manufacturing plant if you need 10 trucks next week. It’s not apples to apples and not hypocritical.
The current up tick in oil prices started 3 months before Biden entered office and the cancellation of the pipeline is not the reason of the increase price of oil today.
We can agree to disagree, but your wrong
but it is the the government’s role to allocate private capital in the US.
Hell, I did not know that. I guess you learn something every day. 😉
Planet earth is on fire. Government regulates almost everything, autos, building, phamacical, insurance, highways, drinking, water, etc. It would be anarchy if they didn’t and you wouldn’t be a happy camper Ron.
Huntingtonbeach,
You are silly, this is a matter of opinion, opinions aren’t right or wrong, hey and only my opinions are correct. 🙂
Perhaps hypocrisy is not the best term, certainly cancelling the pipeline which would tend to reduce supply and lead to higher oil prices, is inconsistent with asking OPEC to increase supply in order to reduce prices. Every comparison is not likely to be an apple to apple to comparison unless we happen to be at an apple orchard.
HB. As you might imagine, where I live the populace voted over 75% the Donald, including almost all of the upstream oil people. But Trump was terrible for oil prices. Of course, the problems the Donald were much worse than that.
Just because I am critical of Biden on this one statement, you somehow think I am a Trumper? Seriously?
IMO, the oil price is not that high. Gasoline is high because some states have raised gasoline taxes and because there have been many small refinery closures. Really, even gasoline isn’t that high, IMO.
Dennis, I thought I make my case and just going to let it go. But, then you called me silly. So now I have to reply.
If I said, E=MC2 was wrong. And you said, it’s correct! Then I said, That’s my opinion. Am I no longer wrong ? Just because it’s your opinion doesn’t make it right.
Hypocrisy- the practice of claiming to have moral standards or beliefs to which one’s own behavior does not conform; pretense.
If “Drill Baby Drill” is ones personal, mindset view and viewed Biden the same way. I could see how one would view Biden a Hypocrite. But Biden is committed to trying to transform to a low greenhouse gas economy. He’s being realistic about getting from point A to point B. Biden would be a hypocrite if he didn’t stop the pipeline.
Shallow, your probably a little left of center. I just wanted to push back on your statement. I suspect the market is pretty fairly priced now.
HB.
I think any President asking OPEC and Russia to produce more oil is a bad look. It was a bad look decades ago.
Politically I don’t fit in with either. But the R’s throwing in w the Donald is a pretty scary thing, “It Can’t Happen Here” stuff.
I’ll soon be 52. I need to work myself into better shape to work on a rig. But might just have to do it if this keeps up.
My friend who owns and operates a rig and pulls a lot of wells for us had his wife help him run in a well when a hand didn’t show. If she can do it, I should be able to also.
I really wanted a $55-65 WTI band, but the cost of most things has really risen since COVID. Not just labor, but anything with steel, fiberglass, rubber, plastic. Electricity is higher because natural gas prices have risen. Chemicals surprisingly haven’t risen much yet. Insurance goes up every year.
Dennis. Not sure regulations are bad. It’s just the odd ways they are enforced. But each government employee has his/her motivation. More write ups might help obtain a promotion, especially if the operator “corrects” the issue immediately.
Recently got a couple “minor” tickets for weeds. They had been sprayed, and were dead, but hadn’t been cut yet. We decided to wait a couple weeks before cutting, we were given 30 days. Inspector called after a week, said he was surprised we hadn’t taken care of yet, that we usually are on top of that. I assume he likes to hit us because we make him look good by resolving stuff fast.
I kind of wondered about why weeds have to be cut everywhere anyway. The code says “excessive weeds”. I don’t think a few dead straggler weeds growing through the gravel on a tank dike are excessive.
However, we don’t like weeds. Kind of embarrassed those got by us. We have had a lot of rain this summer, have sprayed some areas 4-5 times. Really, it’s probably not good for the environment to spray the weeds with chemicals and/or cut them with fossil fuel burning weed eaters? We have 35 tank dike walls and over 200 wells that need to be maintained. We normally hire kids to help w that in the summer, but instead we had them painting tanks.
What is odd is the “minor” things are emailed to us ASAP. But the more serious things (which thankfully we get few of) are sent by regular mail, and the time from the inspector noting till when we receive notice can exceed 30 days.
I also still contend having inspectors come upon leases for routine inspection unannounced is a bad idea. Yes, there should be unannounced spot checks. Yes, there should be an exception for landowner complaints and emergencies. But, there should also be an annual inspection performed on a schedule. Safety issues having a solo inspector there.
In fact, if one of our personnel happen to come on the lease while the inspector is there, the inspector apparently cannot discuss issues with the worker. A few times that has happened, with no mention of any issue, on to later get a “ticket.”
It’s kind of like police trying to catch speeders. Probably worse, really.
Shallow sand,
Yes I agree.
Biden is in a tough spot, he could reverse his decision on Keystone XL and remove sanctions on Iran and Venezuela so that he can claim to be doing something, though OPEC is now in control of the market, he can also cajole OPEC into producing more.
Of course higher oil prices are needed for a transition and they will come regardless of what any president can accomplish, the main thing is to convince voters that something is being done. Also reversing course on permits for oil and gas drilling on Federal lands would help the optics, but again any of these “actions” will have little effect on oil prices, in the run up to the mid terms he will likely put more pressure on OPEC to increase output and maybe get a deal in place with Iran and announce a removal of sanctions on Venezuelan oil imports. The Keystone XL pipeline is unlikely to be completed without a major effort by Biden to mend fences with Alberta.
The average US citizen, unfortunately, does not see past their wallet, have you looked at latest from IPCC?
Some info at link below
https://www.realclimate.org/index.php/archives/2021/08/the-ipcc-sixth-assessment-report/
Shallow Sand-
Its a matter of timing. Short term vs longer term.
And we are all in the same boat on this.
Affordable energy is a goal for any person, business, country…
An immediate goal. Always.
On the other hand, an urgent and profound longer term move towards non-depleting sources of energy is in order. Lack of strongest effort in this endeavor is like expecting country building to be a successful experiment in Afghanistan. Both are a recipe for failure.
Up-thread a derogatory comment was made regarding ‘green’ energy. Brief comment on this- the terms ‘green’ or ‘renewable’ are poor choice of words for anything that humans do on an industrial scale, And any energy source of relevance is massive industry, and is therefore highly destructive to the living planet. No doubt there. However, both the wind and solar energy source are huge and inexhaustible.
Perpetual Energy [PE] would be a better term for the inexhaustible wind and solar energy sources.
Of course the collectors of these energy sources are not ‘green’ . Maybe a little less black than other methods of gathering and energy?
But the energy itself is free and inexhaustible.
These are not a complicated set of facts, and in the longer term the US will learn to consider itself very lucky to have such great solar and wind reserve to compliment what we have left of oil and gas.
Hickory,
Of course nothing is “green”, it is a matter of more or less damaging to the environment. A life cycle assessment of greenhouse gas emissions and other environmental impacts would be one way to compare.
True, but in the end we just don’t have many choices no matter how such an analysis of these things turned out.
The face of new industry- [Workboat, Jones Act, Naval Engineering]
https://www.workboat.com/wind/dominion-to-charter-first-jones-act-offshore-wtiv-in-the-u-s
30 years ago John Kerry led the attack on the Integral Fast Reactor on the Senate floor. The project was killed by the Clinton regime. Kerry has a lot to answer for.
I think it was more a sign of the times.
The IFR was cancelled during the backlash against nuclear after Three Mile Island. Also, even though the IFR had passive safety systems, and design and operational advantages, there were still concerns about safety and proliferation.
There are newer designs based on the IFR.
It seems unfair to blame one politician when there were lots of federal, state, and local politicians against it, as well as some in the nuclear industry.
And since that time, there haven’t been many politicians of either party lobbying to resume Gen IV or Gen V nuclear reactors. Without political will, or deep-pocket investors pushing it, it’s an uphill climb.
Some people think any nuclear renaissance will be led by China, with other countries following. Who knows?
Using 4 scenarios for Permian Basin presented at comment linked below (see chart at end of comment)
https://peakoilbarrel.com/bakken-summary/#comment-723182
I plotted averages for all 4 scenarios (Avg 4), for 3 highest scenarios (3H), 3 lowest (3L), 2 highest (2H), and 2 lowest (2L), also plotted are the highest scenario (H) and the lowest (L). The ERR for each scenario is also indicated, the oil price scenario is fairly conservative with WTI no higher than $77/bo in 2021$ for these scenarios, higher or lower oil price assumptions would increase or decrease the ERR estimates, assuming all other economic and physical assumptions of the model are unchanged.
A very subjective probability estimate (assuming oil prices are roughly as I have modelled with a high oil price of $77/bo for WTI in 2021$) would be about a 95% probability the ERR falls between the low (L) and high (H) scenarios (43.5 to 55 Gb), 80% probability the ERR falls between the Avg 2L and Avg 2H scenarios (45 to 52Gb), and a 65% probability the ERR is between the Avg 3L and Avg 3H scenarios (46 to 50 Gb), with a 50/50 chance the ERR will be below or above 48 Gb. Unfortunately the oil price scenario will be wrong, but lower oil prices would simply shift all of these ERR estimates to lower values and higher oil prices would shift the ERR higher.
The ERR limits based on the physical assumptions of the model and any reasonable oil price scenario are likely 35 Gb to 75 Gb. My expectation is that oil prices are likely to be higher than I have assumed for this scenario, probably more like $100/bo for a maximum WTI oil price in 2021 US$ would be reasonable. The reasonable low oil price scenario might have a maximum oil price of $60/bo for WTI in 2021$ at minimum.
Well hell, you cannot please everyone. Biden does not grant fracking permits. This idiot must think he has to sign every one of them.
Is Biden serious about climate? His 2,000 drilling and fracking permits suggest not
Just when we must be rejecting new drilling, fracking and pipeline infrastructure, Biden isn’t just tolerating fossil fuels – he’s uplifting them.
Interesting Ron, thanks.
In the article you linked was a link to another article on fracking during Biden’s first 5 months in office link below
https://www.npr.org/2021/07/13/1015581092/biden-promised-to-end-new-drilling-on-federal-land-but-approvals-are-up
An excerpt:
If the recent trends continue, the Interior Department could issue close to 6,000 permits by the end of the year. The last time so many were issued was fiscal year 2008, amid an oil boom driven by crude prices that reached an all-time high of $140 per barrel that June.
I had not realized the Interior Department of the Biden administration was approving so many new permits on Federal land and water.
Here is a relevant post on oil/finance from NakedCapitalism.
https://www.nakedcapitalism.com/2021/08/the-oil-gas-inflation-trap-that-no-one-wants-to-talk-about.html
Worth a read.
Dennis, question: The EIA’s Short Term Energy Outlook has US oil production at the end of next year, down 3/4 million barrels per day from the peak of 2019. Do you agree? If not what is your guess. My guess would be it will be down 1 million barrels per day in December 2022.
I would be stunned if we see a half a million barrel increase from today. I just don’t see it. Consolidation in the industry, political headwinds, the Delta Variant, Parent/Child wells (best locations already drilled) and lack of capital. I see a small increase and mostly flattish (up and down but slightly up) for 3-4 years followed by a steep decline…… and my prediction might even be optimistic.
My take , good luck 11.9 mbpd , bad luck 11.5 mbpd or lower .
Thanks for your views LTO Survivor,
What if WTI goes to $120? What kind of supply do you see from the shale patch if prices increase to that level. I guess you can afford to pay more to workers, drill more of the marginal areas. Let’s say WTI goes up to $120/bbl next summer, surely that would lead to supply catching with the prior peak by end of 2022?
Thanks
If it goes to $120 will PE come back in? Will the banks participate? Will Pension funds invest? Will Wall Street demand higher dividends? I don’t see that we will ever get near the peak again.
Many thanks LTO Survivor!
I guess as well that costs will shoot up if/when oil prices go up. That will act as a dampener.
Higher dividends are a given. The vociferous ESG brigade has created an environment where investing in oil and gas is difficult for the large institutional investors like pension funds – that is not going to change in the near future. PEs are a lot more flexible, banks will probably invest more but there will still be restrictions.
All in all, these supply issues portend a good outlook for the oil price going forward.
New forecasts, despite the fact that I believed that the decline in oil production in the Russian Federation had already begun, apparently I was wrong. The decline in Western Siberia is likely to continue The growth will be on the new projects of Rosneft + Lukoil on the shelf of the Caspian Sea …. Here:
“Russia will reach a record level of oil and gas condensate production in the summer of 2022
August 14 / 08:00
Moscow. A record level of oil and gas condensate production can be reached in Russia in the summer of 2022, and peak production is expected in 2023. This forecast was released on Friday evening by the Norwegian consulting company Rystad Energy.
“The recent decision of the OPEC + alliance to gradually increase production gives Russia the opportunity to gradually recover from the reduction in indicators associated with COVID-19. of condensate per month – 11.6 million barrels per day (b / d). After that, production in Russia will further accelerate and the peak level of 12.2 million b / d will be reached by mid-2023, “the company believes.
The average annual production level is expected to be at a record high in 2023 – 12.16 million bpd. Thus, about 600 million tons of oil and condensate will be produced over the year, while the current peak figure is 568 million tons in 2019.
In the short and medium term, the growth of oil production will be provided by new projects of Rosneft and Gazpromneft, Izvestia reports. It will be difficult and costly for producers to resume production at fields where it was previously halted due to Russia’s commitments to cut oil production under the OPEC + deal. “
New posts up
https://peakoilbarrel.com/opec-update-august-2021/
https://peakoilbarrel.com/open-thread-non-petroleum-august-14-2021/