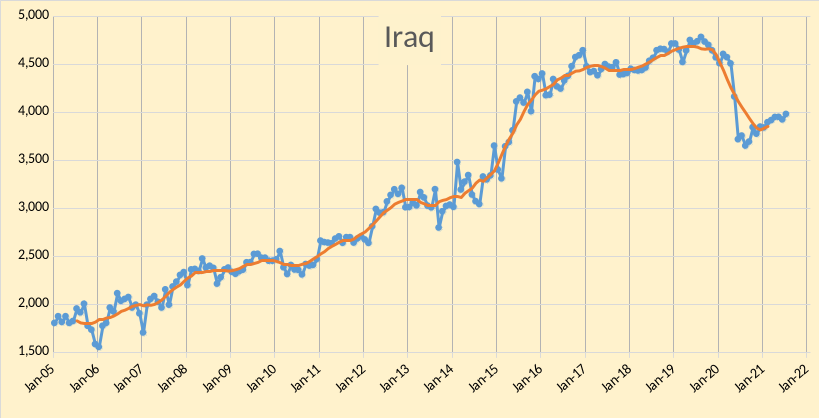
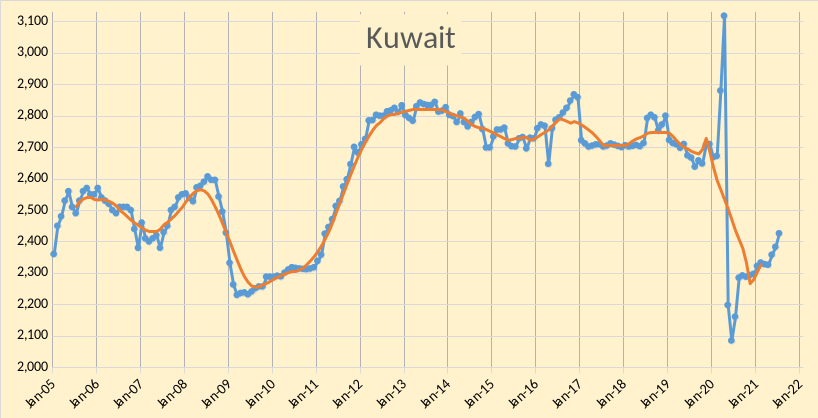
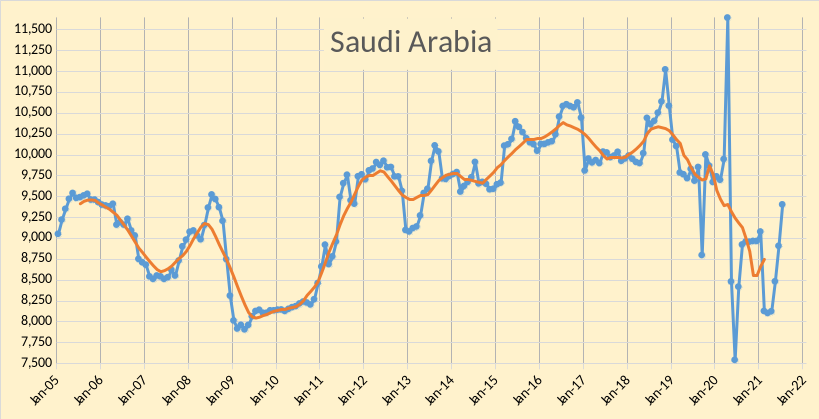
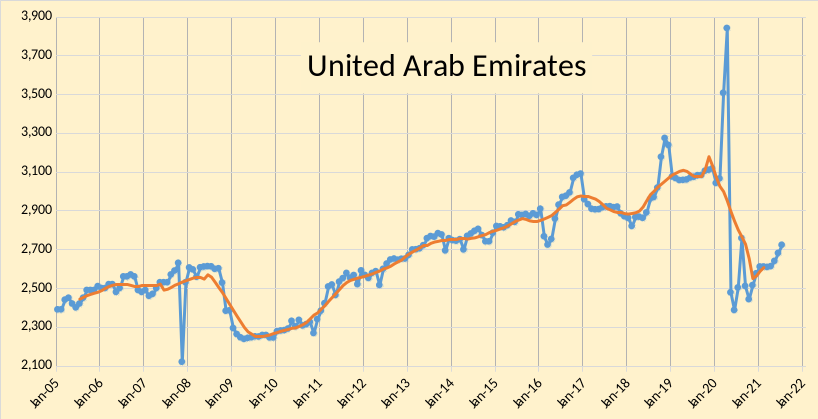
The OPEC Monthly Oil Market Report for August 2021 was published this past week. The last month reported in each of the charts that follow is July 2021 and output reported for OPEC nations is crude oil output in thousands of barrels per day (kb/d). In the charts that follow the blue line is monthly output and the red line is the centered twelve month average (CTMA) output.
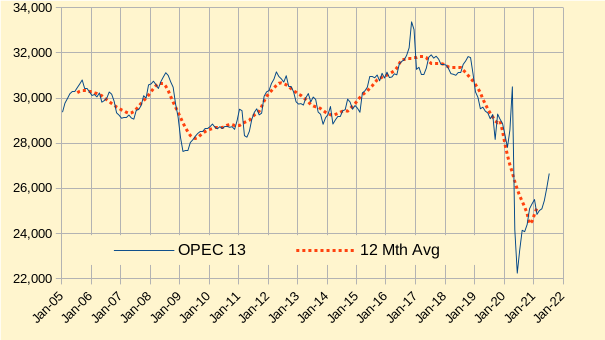
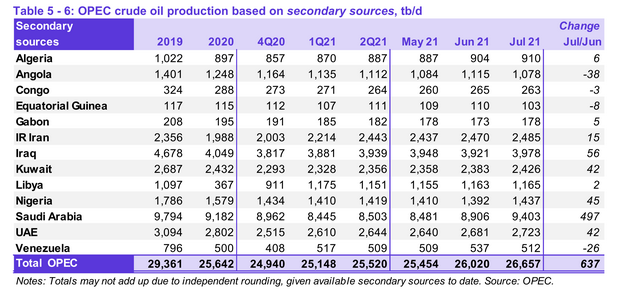
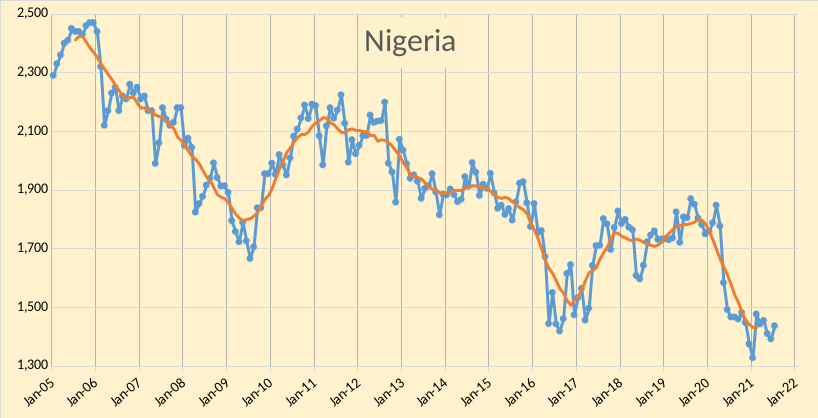
OPEC produced 26657 kb/d of crude oil in July 2021 based on secondary sources, an increase of 637 kb/d from June. June output was revised down by 14 kb/d from what was reported last month and May output was revised up by 6 kb/d. Most of the increase in OPEC output was from Saudi Arabia (497 kb/d) followed by Iraq (56 kb/d), Nigeria (45 kb/d), UAE (42 kb/d), and Kuwait (42 kb/d).
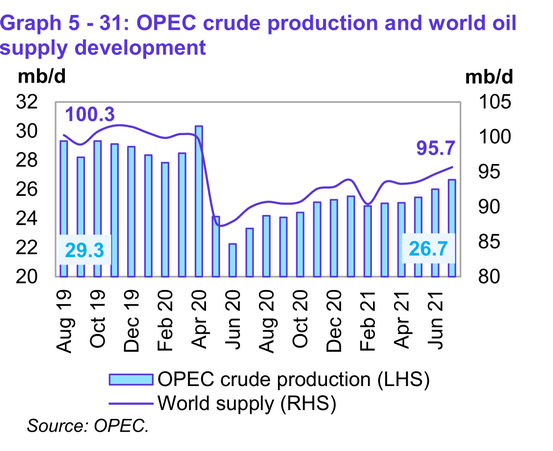
World liquids output was 95.7 Mb/d in July 2021 about 4.6% below the August 2019 level of 100.3 Mb/d. OPEC crude oil output in July 2021 was 2.6 Mb/d (about 9%) below the August 2019 level of 29.3 Mb/d.
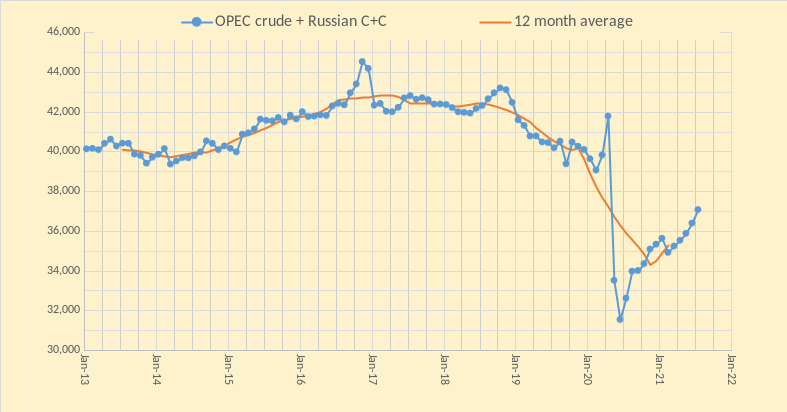
The chart above uses data from the Russian Energy Ministry and converts from metric tonnes to barrels at 7.3 barrels per tonne, the combination is OPEC crude plus Russian C+C output. Russian output increased by 42 kb/d in July 2021 to 10418 kb/d. OPEC13 crude + Russian C+C output increased by 679 kb/d in July 2021 to 37075 kb/d. The centered 12 month average OPEC crude plus Russian C+C output in Feb 2021 (most recent data point) was 35283 kb/d an increase of 372 kb/d from the Jan 2021 level.
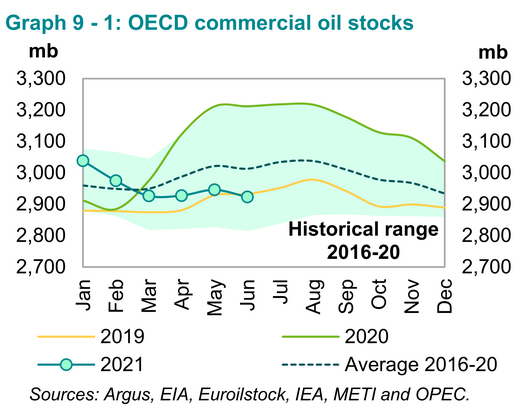
OECD commercial oil stocks are 90 million barrels below the 5 year average (2016-2020) and have been below the 5 year average for the March to June 2021 period (4 months). OECD oil stocks have now have fallen below the level of June 2019, see figure 18 above. Typically we see oil prices rise as commercial OECD stocks fall below their recent 5 year average.
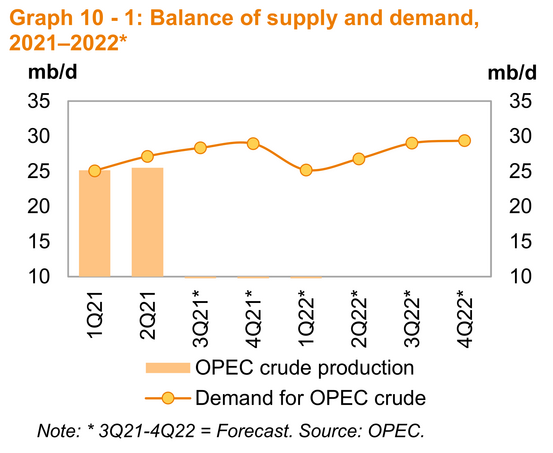
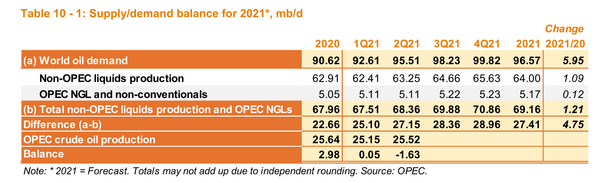
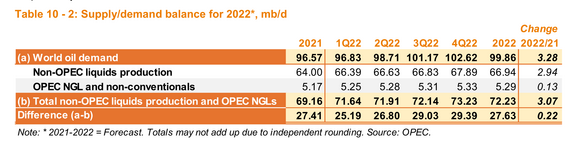
Figures 19 to 21 cover the difference between World demand and non-OPEC liquids production and OPEC NGL and non-conventional oil production shown in the last line in figure 20 and 21. This difference is also referred to as the “call on OPEC” for crude oil production. Based on the trends in OPEC output it seems unlikely OPEC will be able to meet this level of output of roughly 29 Mb/d for the fourth quarter of 2021 and the 3rd and 4th quarters of 2022, without sanctions being lifted on Iran, at current levels of Iranian output OPEC is likely to come up short by at least 500 kb/d in the last quarter of 2021. This assumes OPEC projections for non-OPEC output and World demand are correct. I believe the “call on OPEC” estimates are conservative and that actual demand for OPEC crude is likely to be higher than OPEC has estimated due to higher World demand and lower non-OPEC output than OPEC is forecasting.
It looks like oil prices will continue to rise until at least 2023, by that time the high prices might lead to higher World output and lower demand growth and potentially a more balanced oil market.
233 responses to “OPEC Update, August 2021”
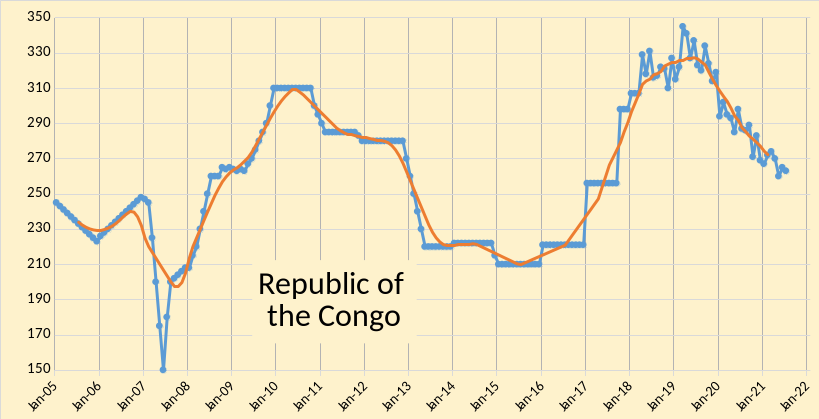
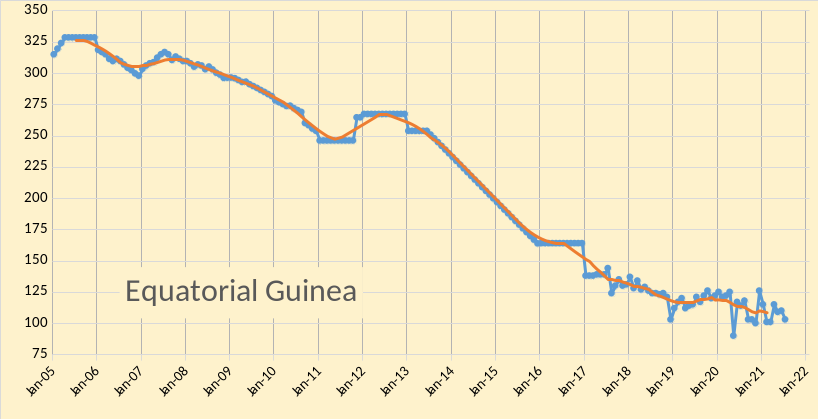
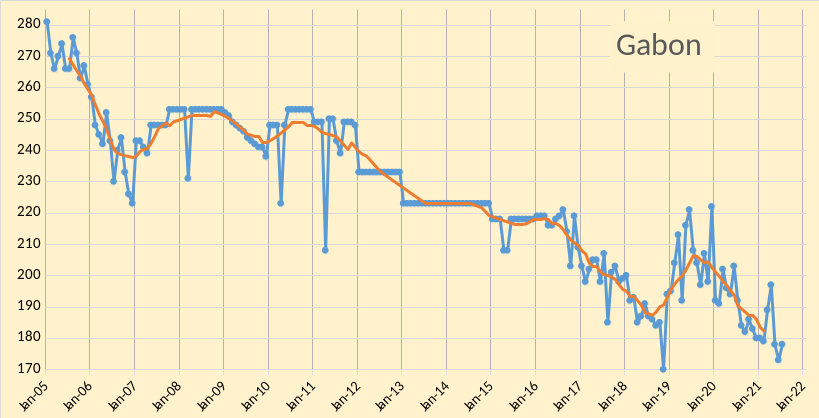
OPEC is now basically five nations, Saudi Arabia, the UAE, Iran, Iraq, and Kuwait. They produce about 80% of OPEC production. The other eight are Algeria, Angola, Congo, Equatorial Guinea, Gabon, Nigeria, Libya, and Venezuela. The combined production of these eight OPEC nations has been declining since 2008.
While the big five have been ramping up production, with plans to reach their pre-covid level in a few months, the other eight have done nothing for the last 9 months. In fact, since February of this year, the big 5 have increased production by 1,886,000 barrels per day. Since February, the other eight’s production has declined by 70,000 barrels per day.
The other eight have recovered by about 1.14 million barrels per day from their post-covid lows. But it looks like that is about as far as they are going to go. In fact, their current level of production matches their decline trajectory perfectly. Here is the important point: They are down just over 1 million barrels per day from their pre-covid level. And they are down about 2.25 million barrels per day from the OPEC 2017 12 month average peak.
This all means that OPEC’s Big Five, in order to get back to their pre-covid level would have to increase their production by 1 million barrels per day, over and above what they produced pre-covid. And if they were to ever surpass their 2017 peak, the Big Five would have to increase their combined production by 2.25 million barrels per day over and above what their average production was in 2017. I seriously doubt they can do it. (Their monthly peak was Nov. 2016.)
The moral of this story is: In the rest of the world, as in OPEC, the declining nations are a very serious headwind in any attempt to increase world oil production. Every year, some producing nations are going from being increasing nations to declining nations. Russia just recently entered this group. So unless your prognostications take into consideration this declining nation headwind, it is destined to be in error.
Ron,
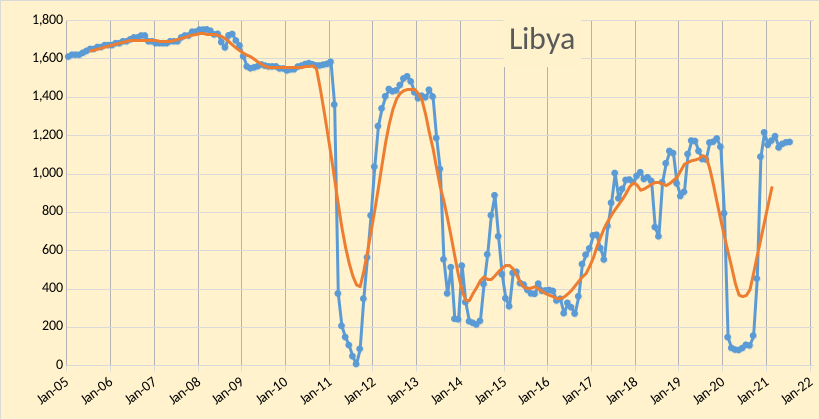
Much of the decrease in the other 8 is due to decreases from Libya and Venezuela, a better chart would be the other 6 (excluding Libya and Venezuela). Venezuela cannot decline by more than another 512 kb/d. Libya might stabilize or resume its civil war, lately things seem to have stabilized there (1160 kb/d is average for past 9 months for Libya).
Dennis, Libya is already back to producing at her pre-covid level. Most likely, Libya is currently producing flat out. So no, none of the decreases is due to Libya.
Venezuela is another story.
Venezuela’s Oil Reserves Doomed To Become The World’s Largest Stranded Asset
The aggressive push to decarbonize the world economy is forcing big oil to examine how the carbon emissions of its operations can be reduced with a goal of becoming carbon neutral. That coupled with the threat of peak oil demand has seen oil supermajors reevaluate their business strategy, with many now choosing to eschew high-cost carbon-intensive petroleum projects. This poses a major threat to Venezuela and the crisis-torn petrostate’s economic recovery. The OPEC member possesses the world’s largest oil reserves, estimated to be around 304 billion barrels or enough crude oil to meet global consumption for roughly 8 years. Most of Venezuela’s petroleum reserves, as much as 77% or possibly more, are composed of the extra-heavy and heavy crude oil found in the Orinoco Belt in the East Venezuela Basin. That heavy and extra-heavy crude oil, most of which is very sour and has an API gravity of 10 degrees or less, is highly carbon-intensive to extract and refine. For those reasons, there is a growing likelihood that a significant portion of Venezuela’s vast petroleum reserves could become a costly stranded asset.
Venezuela is gone forever. Or at least gone for the remainder of our lifetimes. So its decline is a legitimate decline. Not something temporary.
Game over Dennis. But my prognosis remains as it is, including Libya and Venezuela. There is no need to revise my charts or estimate.
Ron,
I have assumed Venezuela will not recover, but future decline from Venezuela can be no more than the July 2021 level of about 500 kb/d. Or Venezuela might stabilize at 500 kb/d.
The decline from Venezuela going forward will be considerably less, so using the decline of the other 8 based on decline from Libya and Venezuela which is inlikely to continue gives a false impression. The 6 countries of interest which are likely to continue to decline, did so at a rate of 120 kb/d per year over the period before OPEC cut back on output (Jan 2019). Much less than increases from other OPEC nations.
Ron , thanks for your analysis . The ” savior 5″ could very soon become 3 . Climate change is drying up the rivers and creating electricity problems . Hydro power is as good as dead in this part of the world . A good read .
https://oilprice.com/Latest-Energy-News/World-News/Baghdad-Says-Iran-Halted-Electricity-Exports-To-Iraq.html
Tks Dennis . Proficient as always .
Thanks Dennis,
I am actually surprised by the resilience of Saudi production in the face of declining rig counts. Didn’t expect them to be able to continue up by 1/2 mbd. In fact world supply is higher than I expected it to be at current investment levels also.
A big reason for OPEC decline after 2017 was decreases in Iranian and Venezuelan crude output. Venezuelan output is unlikely to recover near term, Iranian output will only recover with a removal of US sanctions and might add 1.4 Mbpd to OPEC output. That might allow OPEC output of close to 30 Mbpd. Note that the absolute level of decline from the declining group of OPEC nations has been much less than the increase from Ron’s big 5 minus Iran over the 2013 to 2018 period. I exclude Iran because sanctions were imposed in 2017 driving down Iranian output by 1800 kb/d through mid 2020 with some recovery since the low point.
Dennis , the water problems in Iran and Iraq are unfathomable . While Iran is an Islamic republic are you aware that the “Sikh” community(religion) is the only one allowed temples in Iran . Fortunately when I was in India my immediate neighbor was a “Sikh” whose inlaws were in Tehran and I still keep in touch with him . According to his report the sanctions have had a terrible effect on the economy . Hyperinflation ( $ 1 for a doughnut )shortages are the order of the day . The only thing keeping the cohesion is the hatred for the US regime which is pinned for all problems due to sanctions . Iran survives because of smuggling of every item ( rice to spare parts ) via Dubai . They print and devalue their currency but unfortunately they cannot print water . They have no coal ,nuclear only hydro and gas for electricity production . The choice now is water for drinking or electricity .
Iraq is even worse . Saddam diverted the waters of the Tigris and Euphrates . Constructed a dam near Mosul but on unstable ground and soil . It needs 24/7 cement gritting to keep it stable . Drinking water problems are just as bad as in Iran . The choice is now between water for drinking or electricity here also .
Your assessment based on the situation 2013-2018 is invalid , just as invalid would be the situation in Afghanistan in July and August . There are tipping points and one ignores them at peril. . Had to edit because Biden is crazy .
https://news.antiwar.com/2021/08/13/us-sanctions-companies-for-transporting-iranian-oil/
Only sanctions aren’t going to be removed. And prices are likely going lower not higher. Vaccines aren’t sterilizing vaccines. They don’t stop the spread of the virus and likely lead to more variants. Because they don’t stop the spread of the virus. Only matter of time before a variant comes along that is truly deadly. 10% or greater death rate.
Herd immunity isn’t possible without a sterilizing vaccine. Which nobody has.
Beirut is experiencing an energy collapse currently. Seems when the oil, the diesel stop flowing. The lights go out soon after.
HHH , I agree . Every nation has its reasons . UK would rather have continued lockdowns or partial lockdowns and subsidise salaries . If it ends with the stimulus program it is going to face a wave of bankruptcies and will destabilise the banks . Commercial real estate is the biggest threat and that is where the municipalities and pension funds have parked their funds .
UK imports coal from Russia. Natural gas from Norway and uranium from Kazakhstan. If Russia has a large drop in oil production. It likely won’t be mining as much coal. You could see coal exports from Russia go to Zero. How much uranium comes out of Kazakhstan if oil is not as plentiful there?
Apparently, the world coal production is flat since 2010. Don’t have hope with coal.
https://ourworldindata.org/grapher/coal-production-by-country
My point was when the oil supply starts to shrink so will coal, natural gas and nuclear. If your a place like the UK that has to import energy. You will look like Beirut currently is looking today. No central bank can save the UK. The rich in the UK will likely try to move their money out. Watch for currency movement GBP/USD will go to below parity. Ditto with the EUR/USD because Europe is largely in same boat as UK is in.
And Putin is an idiot for accepting Euro’s as payment for energy resources. Accepting Euro’s is a long term bet the Eurozone stays together when energy resources are in decline.
If the US Navy ever just ups and leaves 80% of China’s oil just doesn’t make it to China. China’s coal production goes off a cliff. As so does their carbon emissions.
Europe is China’s number 2 customer for exports behind the US. Lack of energy in Europe takes China down anyway.
China is also completely 100% dollarized. They can’t do anything without US dollars because nobody will accept their currency as payment except maybe Iran. And maybe Russia on some gas deals. Which Russia again will be left holding the bag of worthless currency for it’s resources.
When the writing is on the wall clearly for everyone to see. Energy exports basically go to zero over night. Unless you have something of value besides currency as payment.
The graph is incomplete. I found an other one from the same website. For coal, the world is producing flat. https://ourworldindata.org/grapher/coal-production-by-region
Yeah, it looks like coal has been more or less flat outside of a little variation up and down in a range since 2010.
And yes, the UK is in for some massive shocks. We already have our bills going up a lot because of the wholesale cost of gas and oil. The North Sea is basically a giant liability at this point, not an asset, and we’ve gone from exporting gas and oil to importing vast swathes of the stuff in the last 15 years.
The pandemic is less of a thing here, with most people vaccinated now and Delta being less harmful than expected. But the winding down of the furlough scheme among other relief efforts by the BoE and Treasury for stopping job losses will lead to… job losses. Next month. And this at a time when we have many positions, like HGV drivers and retail, being unfilled.
Hell, KFC is having supply shortages! Again.
So, if the energy prices go up much more, the population will be massively pinched (fuel poverty is already a major concern, even with that pathetic price cap that isn’t a cap). I know people who commute with diesel cars, and they’re now having to reconsider doing a bit of overtime at their workplace since just going in for a couple of hours means they don’t breakeven on the cost of fuel to get to work.
All this, and the Tories with a clueless idea about levelling up the devastated Northern cities which would cost something on the order of £2tn. The same amount pissed up a wall in a certain Asian nation that’s currently in the news.
HHH-
you paint a picture of complete collapse of the international oil market as soon as the oil starts to decline- that being the most extreme case.
It would interesting to hear your thoughts on a much more likely scenario (in my view anyway) where oil supply available for export declines after peak something like 20% in the first ten years. Thats about 2% a year, or take 3% if you think I’m far too optimistic about the incentive that higher oil prices will have on oil production.
What happens in that kind of scenario, which is still a very disruptive one? What happens before any wars of desperation.
I don’t have a clear idea of how things will play out, but clearly there will a reshuffling of the global order, with a new set of losers and some who lose less than others.
I suppose Russia could demand payment for oil, gas and coal in whatever currency they choose to since they will be the driver seat, for example.
Hickory,
We might have a handful of years that seem ok. Russia will have a choice. Do they use a shrinking oil supply to continue getting coal out the ground just to export it to UK. Or do they produce just enough coal for their own use saving oil. If your Russia at some point you cut everybody off. And it really depends on how fast their oil production goes down as to how soon that will be.
Putin might take Europe’s gold in those handful of year where things seem ok. But in the end he cuts everybody off. Including China
Russia has been creaming those old oil fields for awhile now. There is a seneca cliff somewhere ahead we just don’t know exact timing of it.
HHH,
US oil fields are older than Russia’s and no Seneca cliff (even after subtacting unconventional oil). US oil will see steep decline after 2035 or so as tight oil declines much more rapidly than conventional oil. I doubt this occurs in Russia, decline will be 2 to 3% unless demand falls faster than this.
As to oil prices decreasing, doubtful. Oil supply will be short and prices will go up. Changes in dollar valuation in foreign currency will be countered by actions by other central banks.
Dennis,
Maybe US conventional oil falls of a cliff too. Same method are being used to limit natural decline here in US as in over in Russia. Just because it hasn’t happened yet don’t mean it won’t.
To believe that the decline rate won’t accelerate and accelerate drastically at some point is foolish.
To believe that a 2%-3% decline can be maintain through out the remaining life of an oil field is idiotic. Cliff is coming Dennis.
HHH,
We will see, US fields are older than Russia’s, conventional onshore in L48 started in 1970, so 50 years, no Seneca cliff so far, perhaps it will come, I did not say it would not. I don’t know when it will occur or if it will. You assume it will and you may well be wrong.
Just because you think it is so, does not make it so. Check the data for US L48 onshore C plus C output for the US, you will see that I am correct on the historical data. The future is unknown. I think I have said this before.
Coal producing can be much less oil needed than you think.
The DDR had this problem already solved in the 80s – they got their cheap oil deliveries cut up from the UDSSR.
I visited a museum at a brown coal site. All big machines have been electric – even the moveable one. These had flexible power lines. They spend round about 10% of the power plant output (which was fed from this pit mine) to power them.
So they could use their spare oil for chemical, agriculture and a bit for cars (it was hard to get a car for normal people).
The biggest piece of equipment there:
https://www.f60.de/en/
Ron the Original Seneca cliff idea was from Ugo Bardi.
See
https://cassandralegacy.blogspot.com/2011/08/seneca-effect-origins-of-collapse.html
He is actually talking about World output. I think the only thing that brings on such a cliff is lack of demand. Perhaps we see a demand cliff as the World moves to EVs in the 2035 to 2040 period, though it seems unlikely we can produce enough cars to create such a cliff, though robo taxis might cause this, but that may not arrive until 2040 at the earliest.
Bardi’s figure for the Seneca cliff looks like a literal cliff, probably a 70% decline rate, I doubt this occurs without a nuclear war or large asteroid strike, or some unknown unknown of similar magnitude.
US oil fields are older than Russia’s and no Seneca cliff (even after subtacting unconventional oil).
Good gravy Dennis, you know that is not so. Prudhoe bay is far younger than Russia’s old fields, and Prudhoe bay definitely underwent a Seneca cliff. But the oldest and largest field in the USA, and once the largest field in the world, definitely underway a Seneca cliff, the great East Texas oil field. It is now almost nothing. That is what happens to all oil fields eventually.
THE HISTORY
OF THE
EAST TEXAS
OIL FIELD
Eulenspiegel,
I understand the excavators are electric. You still have to transport all that coal out of a mine and to market. Coal production takes a massive amount of oil to get to market.
Ok say you go all electric, Electric trucks, trains and even ships. That is a lot of damn electricity getting that coal to market. You’d have to export less way less to just get it to markets.
When oil goes down it takes coal and natural gas and nuclear production with it. Yet we think we are going to be able to build out a massive amount of EV’s powered by wind and solar during this to continue BAU
Ron,
Talking about regional output, for a region to experience a Seneca Cliff all fiels would need to hit their steep decline phase simultaneously, I also exluded Alaska, that is what lower 48 onshore conventional C plus C means (no tight, offshore or Alaskan production).
From 1970 to 2017 this is what the decline looked like for US L48 onshore conventional C+C, that is the metric most comparable to Russian output which is mostly onshore conventional oil.
See chart below, click on chart for larger view, annual decline rate averaged about 3.18% over the 1970 to 2017 period.
HHH,
Natural gas output won’t be affected much by a decline in oil output. If we are short on natural gas prices will rise and rate of resource development will increase. Probably little affect on nuclear or coal as well. Prices will rise if supply is short of demand, as long as it is profitable to produce, it will be produced.
You are right Dennis, my mistake. A Seneca cliff is caused when the natural decline of a field is not allowed. Like when a field has a natural decline rate of say 8%. But infill drilling brings that decline rate down to say… almost 2%. So depletion is greatly increased while decline is decreased.
That is exactly what they have been doing in Saudi Arabia. That is exactly what they have been doing in Russia.
So a Seneca cliff is brought about by massive infill drilling with horizontal wells. We did not do that with Prudhoe bay or East Texas.
It is inevitable that if you pull the oil out a lot faster while disguising the natural decline rate the decline rate must eventually catch up, with avengence. That process is called a Seneca Cliff.
@HHH
In the local market here, main transport is by (electric) train, under the earth and to the customer. Street transport is not cheap enough. A typical coal train here has 100 wagons, pure coal not mixed up with other goods and drives directly to the customer. If you need 1000 tons coal a day, you’ll build a local rail access.
Only the international market is by ship, and therefore by oil. Theoretical you could power them by coal, too, as in the 19th century. I hope not.
The coal economy was invented before oil – and therefore it has little oil components.
We may not have oil here in Germany, but a coal past. And coal was a mostly rail centered business, or on ships. On the road there was only transport until the 60s for home heating, from the station to a home. But most coal was consumed for power plants and factories / iron production.
You have always to spend energy to transport things to the market. That was why old heavy industrial centers have been cluttered around the coal – cheaper not to transport it wide before using.
You’ll see the effect again when solar is the solution – heavy industry will move to the sun belt states.
From Russia I know it’s mostly by rail and some by ship, too – and all russian main lines are already electric.
It looks like this:
https://jamestown.org/wp-content/uploads/2018/04/Russian-Coal-Train-EDM-April-3-2018.jpg?x44080
Coal is so old industry – I hope we can phase it out some time. It’s always dirty, no matter how much you do.
Ron,
We will see, the US has developed its oil resource more aggressively than any other nation on the planet, if there was going to be a Seneca cliff, we would have seen it in the US. If we are going to claim a 3.2% decline in output is a Seneca cliff, then yes there will be a “cliff”, but this strikes me as more of a wheelchair ramp than a cliff.
Dennis , USA peaked for onshore production in 1970 . 52 years ago was there horizontal drilling ? I don’t think so . In that case it followed the Hubbert curve(cliff) . Now all that is left from onshore is 3.5mbpd from L48 and 0.4 –0.5 mbpd from Alaska . L48 is mostly stripper wells . They don’t have a cliff because they are the tail . This is my understanding of the situation . There will be no Seneca Cliff because the conditions for this are long past .
We will see, the US has developed its oil resource more aggressively than any other nation on the planet, if there was going to be a Seneca cliff, we would have seen it in the US.
I am sorry Dennis but you just don’t seem to understand the whole horizontal well infill drilling process. You cannot do it in shale because each well has its own tiny reservoir. It’s source rock, not a sandstone or limestone reservoir. Also, such infill drilling does not lend itself to deep offshore.
What they are doing in Saudi Arabia, Russia, and other nations, especially the Middle East is creaming the top of the reservoir, pulling the oil right off the top of the reservoir instead of lower where the water cut is much higher. But eventually, the water hits the top of the reservoir, then you have your Seneca Cliff.
This is a process that is necessary only in giant and supergiant fields. We just don’t have any of those in the USA anymore.
Ron,
Note that horizontal wells have been used in the US since the 1980s, and I agree that for most of the history of the US oil industry they were not a factor.
Your theory sound reasonable, can you cite any onshore regions where we have seen a Seneca cliff in output that have not been the result of a war or political turmoil that has disrupted most new investment in the oil industry in that region?
Off shore is a bit different because the expensive nature of the projects results in a sharper end of life (there are no stripper wells for deep water off shore oil production), for off shore production a Seneca cliff like production profile is entirely possible. Note that Mexico is sometimes though of as a good example of a Seneca cliff type output profile with the crash of Canterell. For Mexico as a whole from 2005 to 2019 average annual decline in output was about 4.4% (using least squares fit to annual data for that 15 year period). Doesn’t seem very cliff like to me.
United Kingdom is a better example where average annual production fell by 8.2% from 1999 to 2014. That is pretty steep, though if it were a ski slope, I would call it a beginner slope and not really a cliff.
can you cite any onshore regions where we have seen a Seneca cliff in output that have not been the result of a war or political turmoil that has disrupted most new investment in the oil industry in that region?
No, not yet. The point is, it is about to happen in Western Siberia. And… Ghawar… and perhaps is a few of Saudi’s other super giant fields.
Ron,
I will wait for evidence, I do not doubt there will be decline, I doubt a “cliff like” decline profile. Can you define a Seneca cliff in terms of average annual decline rate? Maybe 30%?
The gradual shift of discussion from date of peak oil to decline rates of oil supply is an indication of the time in history.
The Seneca cliff would be applied to a field, not a nation. And no, it would not be 30%. 10% would be a pretty stiff decline, as opposed to the 2% they reached by infill drilling.
Dennis
This tracking company (I do not subscribe) has repeatedly claimed that Iran is exporting much larger volumes than reported and has evidence of cargoes arriving in China with false origin documentation.
https://tankertrackers.com/
Lights out,
Are they saying how much more? If they are correct then World output is higher than claimed, I just assume reported World output by the US EIA is roughly correct (though they seem to under report Russian and Canadian output due to differences in how pentanes plus [C5 plus] from natural gas processing is accounted for, the EIA excludes this from C plus C and most other national agencies correctly include this in total C plus C produced). EIA data is far from perfect, but is the best monthly World output data that is readily accessible.
https://www.eia.gov/international/data/world/petroleum-and-other-liquids/monthly-petroleum-and-other-liquids-production
I have oft commented that Iran is producing all it can and shipping all it can . They are masters of deception . A country does not survive 42 years of sanctions without knowing and learning new tricks daily . Just this year they sent 3 tankers of gasoline and diesel to Venezuela right under the nose of Washington . Washington plays blink, blink because the alternatives are closure of the Strait of Hormuz , war against US proxies KSA and Israel .
The same goes for Iraq . They pump all they can but from 2020 electricity is becoming a constraint to raising production . The oil produced in Kirkuk ( Iraqi Kurdistan ) is underreported and smuggled to Turkey big time . Erdogan and his family run the show .
And talking about Kirkuk ,
https://oilprice.com/Geopolitics/Middle-East/Islamic-State-Attacks-Iraqi-Oil-Field.html
Dennis
In my previous US post, I wrote the following.
From April to June, OPEC added 1,100 kb/d. Using an approximate 85 – 15 split for OPEC and the remaining members, of the 2,100 kb/d, OPEC would add 1,800 kb/d and the members 300 kb/d. So for July we should expect OPEC to add close to 700 kb/d since they have already added 1,100 from April. This will bring their output in July close to 26,700 kb/d.
Below is my best guess for which OPEC countries will supply the expected 700 kb/d.
Guesstimate. ——————— July Actual Increase
Saudi Arabia 300 kb/d ——— 497 kb/d
Kuwait 150 kb/d. —————- 42 kb/d
UAE 150 kb/d. ——————— 42 kb/d
Iraq 100 kb/d. ———————- 56 kb/d
Another article I saw later indicated that the actual July increase could have been 760 kb/d. So OPEC under produced by 100 kb/d in July, since their increase was only 637 kb/d.
Looking at the above numbers, we can see which countries are not meeting their targets. Clearly SA raised their target as part of the UAE compromise and I think they will get their output back to more than 10,000 kb/d.
Why are Kuwait, UAE and Iraq so far below their potential. Not sure about Kuwait and UAE. However, I recall reading that BP and EXXON were trying to get out of their Iraq contracts. They may be holding production back or maybe the fields aren’t as productive as they originally thought. Other issues could be pressing.
Going forward, we will see how OPEC meets its 400 kb/d increase from August to December. This could provide a clue as to where the spare capacity is in OPEC.
If we look at “big 4” OPEC producers from 2013-2018 (before they cut output in 2019 and 2020) we can see the trend in their output over that period by applying least squares linear regression on the Jan 2013 to December 2018 data, the CTMA (centered twelve month average) is shown simply for reference it is not part of the regression. The trendline is projected to 2025 which would lead to about 24000 kb/d in 2025, the pandemic interruption likely reduces this growth by 1500 kb/d so I would expect perhaps 22500 kb/d in 2025 from these 4 OPEC producers, if the 2013-2018 trend continues. No doubt there are differences, the important one being oil prices in 2022-2025 that are considerably higher than 2015 to 2018. Note also that the peak 12 month centered average output for these 4 nations was 20483 kb/d in Sept 2016.
Annual average increase in crude output for the big 4 was 517 kb/d each year on average over the 2013 to 2018 period (6 years or 72 months). See chart below.
Dennis
Are you seriously expecting the “big 4” trend line to continue with only a small blip attributed to Covid?
Lightsout,
No, I do not know the future. Note that many show evidence of declining output in the past as suggesting future decline, showing the 6 year trend of increasing output is no different. I do not think that I said that I expect the trend to continue, I said that if it were to continue, this is what output might be. When there is less demand and output decreases, rig counts decrease. Also note people claim the increase in rigs indicates a problem, now it is the decrease in rigs indicating a problem. Seems many are predisposed to citing any evidence (even if it contradicts previous claims) as indicating a problem. I am not buying it, rigs simply reflect operating companies capital spending plans based on current and expected future market conditions.
Ovi,
Why would we expect that nations producing 3 times less than Saudi Arabia would see increases that are half as large?
June output
Saudi 8906
UAE 2681
Kuwait 2383
Iraq 3921
% increase July increase/June output
saudi 5.6%
UAE 1.6%
Kuwait 1.8%
Iraq 1.4%
Saudi increase is larger because they cut an extra 1000 kb/d of output below their quota.
Your estimate had Saudi increases of 3.37% above June output, if the other big producers were to have increased by a similar percentage UAE would be up by 90 kb/d, Kuwait by 80 kb/d, and Iraq by 132 kb/d.
My reading of the media was to expect all OPEC to increase by about 400 kb/d each month or about 1.2 Mb/d per quarter. That would get them to about 28 Mb/d by the end of the year and to 30 Mb/d by the middle of 2022, they are being careful to ramp up output slowly and not tank oil prices. I doubt they will be able to reach 30 Mb/d by mid-2022, unless they are able to increase capacity more quickly than I have assumed.
Dennis
The 400 kb/d OPEC plus monthly increase starts in August. July was the last month of the first agreement and OPEC was 760 kb/d short of their first agreement target. I had estimated 700 kb/d. Actually they could have added 760 kb/d in July and be in complaince. They ended up 100 kb/d short of their target, possibly more.
“Moving to supply, and we are starting to get preliminary OPEC production estimates for July. According to a Reuters survey, OPEC output increased by 610 Mbbls/d MoM to 26.72 MMbbls/d, which is the highest output from the group seen since April last year. The increase was still below the 760Mbbls/d they could have increased by (including the return of voluntary cut volumes from Saudi Arabia). Unsurprisingly, Saudi Arabia saw the largest increase over the month, with output growing by 460 Mbbls/d.”
https://think.ing.com/snaps/the-commodities-feed-opec-supply-grows-in-july
(An aside. Parsing the statement above, I am wondering if OPEC could have produced more. The base for the early 26.72 Mb/d estimate was for adding 0.610 Mb/d to 26.11 Mb/d to get 26.72 Mb/d. So if the increase could have been 0.76 Mb/d, then OPEC’s July output could have been 26.87 Mb/d, [26.11 plus 0.76] instead of the reported 26.66 Mb/d, 200 kb/d short of target.)
Since all of these countries have spare capacity they could all increase to their agreed limit. This is not a question of percentage, it is a question of their shut in spare capacity since they are all below their pre-pandemic levels.
That is the basis for my question. Why was their output increase so small. For instance the UAE complained that they should be allotted more, yet they only produced an extra 42 kb/d. Similarly for Iraq and Kuwait. Only SA completed their return of their earlier unexpected 1.0 Mb/d cut to the market.
Ovi,
Some OPEC and OPEC plus producers were supposed to produce less to bring their overall cumulative production in compliance with the past quota agreement by September 2020. I cannot find the details of the quota agreements, but perhaps that is the reason output was less. Also note the NY Times on June 1 said total OPEC plus output would increase by 840 kb/d in July, but that is all OPEC plus. The June increase was supposed to be 700 kb/d. Unfortunately we don’t have the data for the “plus” part of the equation so this is difficult to track. Reportedly OPEC plus raided output by 750 kb/d in July, so 90 kb/d short of expectations in early June. Also as a group, OPEC plus produced 106% of their target, so some members are still over producing, Libya, Iran and Venezuela are exempt from quotas.
Ovi,
I have this backwards, compliance was 106% do they held back 6% more than the agreed quota levels, but this may be nations making up for overproducing early in the quota agreement to bring their overall cumulative output in compliance with the original quota agreement. Unfortunately, OPEC is not very transparent about the specific targets.
Article below details OPEC plus overproduction above quotas (cumulative totals) through March 2021.
I found quotas at link below
https://www.opec.org/opec_web/static_files_project/media/downloads/15th%20ONOMM%20-%20Production%20adjustments%20table.pdf
Overall OPEC 10 (excludes Iran, Venezuela, and Libya) output in July was 22495 kb/d and the quota target was 23033, so output was short of quota by 538 kb/d. Of this total Angola was short by 241 kb/d and Nigeria was short by 142 kb/d, for a total of 383 kb/d. the other 155 kb/d is probably individual nations reducing their output below quota to bring overall cumulative output in compliance with the quota agreements.
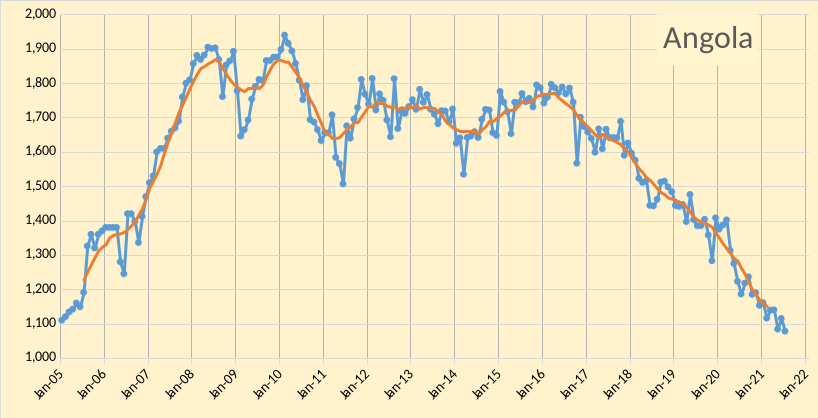
Much of the shortfall is Angola and Nigeria where perhaps output is in permanent decline (I expected as much from Angola, but thought Nigeria might recover, though there are political struggles in Nigeria and a lack of new investment as a result).
The group of declining OPEC nations without sanctions or civil war over the 2013 to 2018 period are 6 in number. They are Algeria, Angola, Republic of Congo, E. Guinea, Gabon, and Nigeria. Over the Jan 2013 to December 2018 period these nations saw an average annual decrease in crude output of 123 kb/d per year over the 6 year period. The least squares linear regression on the 72 months of data is projected forward to 2025. Output would be about 4100 kb/d at the start of 2025 if the 2013 to 2018 trend had continued. The pandemic dropped output of these 6 nations below that level to about 4000 kb/d and we may see output stablize at that level as some nations (Algeria and Nigeria) increase their output as quotas allow while the other 4 nations may see continued decline offsetting the increases from Algeria and Nigeria.
Do you think really that Nigeria and Algeria will be able to produce more than they do currently?
Jean-Francois,
Yes, mostly Nigeria, Algeria will probably be up another 100 kb/d and Nigeria about 300 kb/d, both have reduced output due to OPEC cuts since early 2020 when OPEC got more serious about output cuts in response to the pandemic.
Revised my thinking on Nigeria, they have been producing significantly under their quota for past 2 months, so it looks like they are struggling to increase output, this may be due to lack of investment due to political turmoil there.
Dennis ,places like Libya , Nigeria will always be in turmoil so to expect anything from these is wishful thinking . Also regarding Algeria it is mostly NGL ( I think 80%) . Algeria is like Qatar , mainly gas very little oil .
Well, the gas production is also decreasing.
Hole in Head,
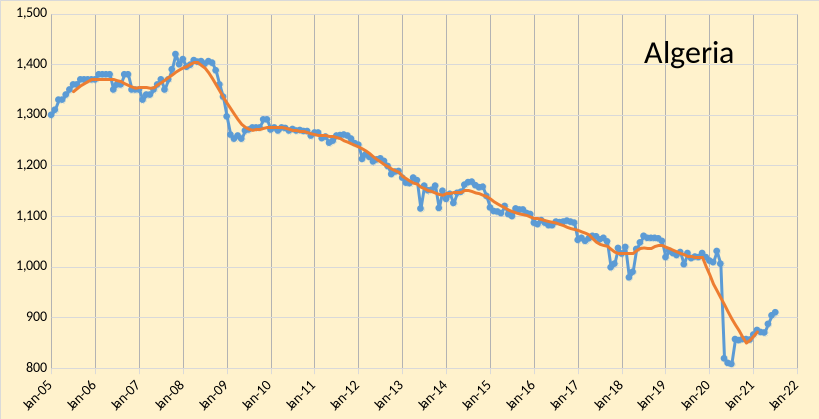
The OPEC monthly oil market report reports crude output from the OPEC nations, it includes neither NGL (C4, C3, and C2) or condensate (C5). In July Algeria produced 910 kb/d of crude oil according to secondary sources, see figure 2 in the post. Also in the comment above I was talking about Angola, if you meant Angola, they produced 1078 kb/d of crude oil in July, also in fugure 2 of the post. Algerian output has increased from 808 kb/d in July 2020 to 910 kb/d in July 2021 and they are producing almost exactly what their quota allows. So Algeria may indeed return to their previous level befor the pandemic and Libya has already done so, but I agree they will remain unstable and Nigeria probably will also. I don’t really expect big increases from the group of decliners, Algeria may return to pre-pandemic levels, and it looks like Nigeria will not, difficult to foresee.
Nigeria may bump along at current level for a while or may continue to decrease as they did from 2013 to 2018.
As to significance of hydro power in Iran and Iraq, in 2020 for Iran 21.2 TWh of hydropower wer produced and for Iraq, 2.5 Twh of hydro power electricity were produced. Total generation of electricity in Iran in 2020 was 331.6 TWh and for Iraq in 2020 131.3 TWh of electricity was generated. Hydro provided about 6% of Iranian electricity in 2020 and about 2% of Iraq’s electricity in 2020.
The hydro power could be replaced with oil or natural gas fired electricity, or with solar or nuclear power.
Dennis , your comment was about Algeria and Nigeria , so I posted accordingly . Angola is not in the picture . Regarding Algeria IIRC a comment(lament) by a top man of Total ( they own and run the fields) that they were getting low prices because their output out of Algeria was not crude oil but NGL’s .
As to % of hydro in Iran and Iraq , the % is immaterial . For countries that are in deficit of a critical resource additional shortfall has a compounding effect . Anyway if the Iraqis say that Iranians are not supplying them electricity and the Iranians say they themselves are short because of drying rivers that feed their dams ,then I am the last one to argue . It is from the horse’s mouth .
Regarding mitigation , the solution are known but ” easier said then done ” especially in the political and economic conditions that prevail in both the countries .
Hole in head,
The US sanctions on Iran are a bad idea, lack of hydropower is a problem, but it is a minor source of electricity, especially in Iraq, perhaps in Iran where it is a larger source, it has reduced the ability to export electricity to Iraq.
Algeria probably produces a significant amount of NGL, but the numbers I focus on is the crude output reported by OPEC.
According to BP in 2020 Algeria produced 233 kb/d of NGL and 1098 kb/d of C plus C. I ignore the NGL and focus on crude reported by OPEC or C plus C reported by the US EIA. You are correct that Algeria does produce a lot of natural gas, but in 2020 they were the 17th largest producer of C plus C in the World. They are somewhat similar to Qatar in that they produce about the same amount of crude plus condensate (over 2011 to 2020 Qatar produced about 7% more crude than Algeria), but Qatar produced more than double the natural gas that Algeria produced over the 2011 to 2020 period.
Tks , Dennis .
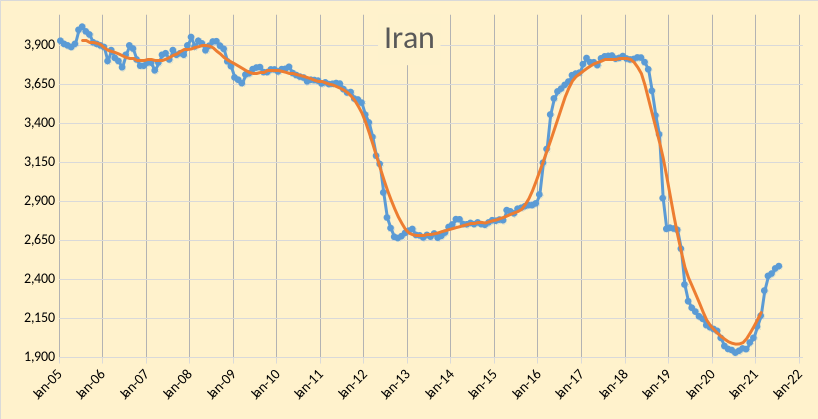
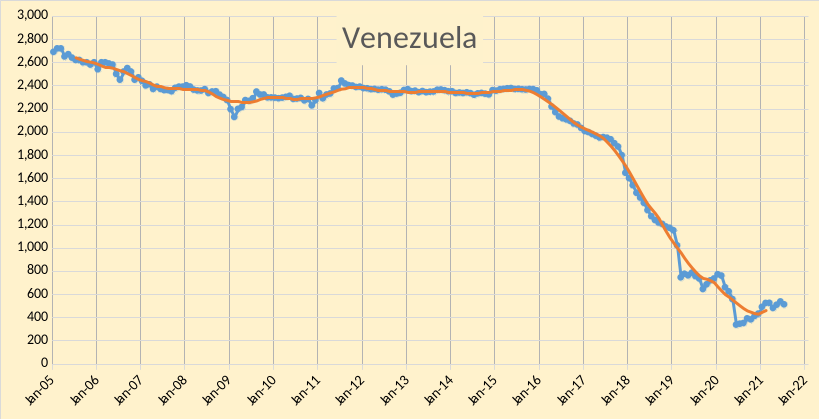
A final group of 3 OPEC nations have been affected by political turmoil, civil, war, and sanctions (none have experienced all 3 problems, but all have been victim to 2 of these three problems). Output has fluctuated quite a bit in Iran and Libya, Venezuela has mostly seen a steady decline in crude output from 2016 to 2020 from 2400 kb/d to about 600 kb/d (Jan 2020). For the period from July 2017 to July 2021 Venezuelan output fell by about 1401 kb/d.
The peak for these three nations was in July 2017 when centered 12 month output was 6541 kb/d, if we subtract the Venezuelan fall in output from July 2017 we get a potential increase in these three nations of 5140 kb/d (this does not include the 350 kb/d increase in Libyan output from July 2017 to July 2021, but assumes Iranian sanctions are lifted.
For all of OPEC we would have 22500 kb/d from big 4, 4000 kb/d from 6 declining OPEC nations, and 5140 kb/d from the troubled 3 OPEC nations for a total of 31640 kb/d by Jan 2025, if Iranian sanctions were lifted. Without sanctions relief fro Iran the 5140 kb/d estimate becomes 4162 kb/d (output of these 3 nations in July 2021) for a total OPEC output of 30662 by Jan 2025 and assuming the trends from 2013 to 2018 in the big 4 and declining 6, continue from July 2021 to Jan 2025. Higher oil prices would make these estimates conservative.
A final note is that the OPEC decrease in output after 2017 is largely explained by the steep drop in output from this group of 3 nations from Sept 2017 to July 2019.
Chart below for troubled 3.
Looks to me like a long plateau at 6 mb/d for these three countries, IF they get more stable. Not even enough to offset the decline of other countries that are in decline.
West Texas Fan club,
I think for these 3 it will be more like a plateau at 5400 kb/d due to a drop in Venezuelan output. Note that the big 4 (Saudi Arabia, Iraq, UAE, and Kuwait) will easily be able to offset the small decline from the 6 declining nations (Algeria, Angola, Congo, E.Guinea, Gabon, and Nigeria). The big 4 increased output on average by 500 kb/d from 2013 to 2018 while the declining 6 had their output fall by about 125 kb/d, note that if Iran never has sanctions removed then the 3 “troubled” OPEC members will see a plateau at about 4000 kb/d.
Iranian output could increase by 1400 kb/d with an end to sanctions. At some point this may happen if oil prices reach $100/bo or more.
Environmentalists Slam Biden For OPEC Plea
Environmentalists have lashed out at President Biden after he called on OPEC to boost oil production in a bid to arrest the price climb at the pump.
“If Biden’s going to urge OPEC to increase oil production one day after the UN’s ‘code red’ climate report, he may as well come to California and personally light more wildfires,” the director of the Center for Biological Diversity’s Climate Law Institute, Kassie Siegel, told The Independent.
Yeah right, when I want to know what environmentalists are thinking oil price dot com is my go to place.
Quo Vadis ? Now what ?
https://www.zerohedge.com/markets/bidens-abysmal-day-just-got-worse-opec-snubs-plea-more-oil-says-wont-pump-more
Zero Hedge is a Russian propaganda outlet. They intentionally spread misinformation, so take their output with a grain of salt.
https://www.rand.org/content/dam/rand/pubs/research_reports/RR2200/RR2237/RAND_RR2237.pdf
@Ali
No, it’s just a right wing site, not one of the zillion left wing or liberal sites.
A russian propaganda site won’t fight critical race theory – Putins loves critical race theory in the USA, dividing the country instead of uniting it.
Years ago when the term was “in”, it was called a teabag site. That describes it best. They’re conservative, but not 100% pro Trump, too. I think they would like a president like Bush at best.
Yeah, not sure how citing a well known US DoD funded think tank works with pointing out Russian propaganda. We’re okay with American propaganda now?
As the Russians say: trust, but verify. Zero Hedge has a lot (LOT) of bullshit, but now and then it does find that diamond in the rough before the MSM outlets get to it.
And
And
And
Thanks for these Lightsout. The NOCs and the large public oil companies seem to be taking the same path: endgame. Invest little in future production with low CAPEX, large dividends and share buybacks, and act like everything is hunky dory. They’ll be others to blame when prices spike through the roof in a year or two, especially the greens.
It makes sense to me that all oil producers would be cautious. COVID is a huge unknown regarding future demand. Electric vehicles are a huge unknown regarding future demand. Major consumers can’t borrow trillions forever, can they? Also uncertain regarding demand.
We have not drilled a well since September, 2014. I question if we ever will again. Our production has declined, but it hasn’t made sense oil price wise to drill. Now, with all of the uncertainty, our goal is to downsize and ultimately get out.
Has been a very demoralizing 7 years for oil producers. 2018 was decent. Keep in mind our average price for 2021 is still just $52, even though currently our price is $64. That is a big difference. The volatility has been brutal.
I am still surprised Biden asked OPEC for more oil. Besides his policy to transition the USA from oil, it is never a good look for a US President to make such a request from the Middle East and Russia.
“I am still surprised Biden asked OPEC for more oil”
Agree, and much the same with other public statements on this issue by previous presidents.
It seems that these kind of public statements do nothing for bargaining, diplomacy, or market influence.
What Biden wants to communicate is: “Covid is under control, the economy is recovering and we’re returning to pre-pandemic conditions.”
Thats probably complete BS, but that’s how politics work.
Shallow, just for my curiosity:
Are there still spots in such an old field as yours to drill a new well? I would think everything viable is already drilled and the only thing thinking about would be some enhanced recovery stuff.
We have many locations. We drilled 2-4 per year from 2005-2014, except for 2009. Also have drilled a few injection wells.
Logic, due to the numerous geopolitical problem they faced, they have still half of their reserves still intact.
Iran Oil Output Falls To 40-year Low In 2020
Iran’s crude oil production fell to the lowest in 40 years, according to an updated analysis by the U.S. Energy Information Administration.
At less than 2 million bpd, the EIA said, the country’s oil output was affected by both the pandemic, which decimated demand for oil, and U.S. sanctions targeting specifically the Iranian oil industry.
Frugal , from your link ,
“Before the U.S. withdrawal from the Iran nuclear deal and the snap-back of sanctions, Iran was pumping around 2.6 million barrels daily and exporting some 2.5 million bpd, the EIA also said.”
Doesn’t make sense . Iran’s domestic consumption is not 2.6-2.5 = 0.1 mbpd (100000 barrels ) . Doesn’t add up .
Yes there must be a typo in this report unless Iran is importing oil.
They import gasoline and diesel.
Before the US pulled out of the Iran nuclear deal (May 2018) Iran was producing about 3822 kb/d, that was the centered 12 month average crude output in December 2017 (includes average output from June 2017 to May 2018). The low point for centered twelve month average crude output was 1988 kb/d for July 2020 (January 2020 to December 2020). Output has recovered to 2485 kb/d in July 2021 and the most recent centered 12 month average was 2190 kb/d (Feb 2021). The peak monthly output since the nuclear deal was agreed was 3835 kb/d in Sept 2017. If Iran can return to 3800 kb/d with a removal of sanctions (I don’t know if this is possible) that would add roughly 1300 kb/d to OPEC output. If Biden wants more output from OPEC, this is a simple solution, return to the Iran agreement. Of course nothing is simple in international diplomacy.
Dennis , does that infer that they have little to export as of today ? You said that they produced
2.45 mbpd in July 2021 and they have a refining capacity of 2.3mbpd locally OR it could be as Lightsout and I have said that they are producing and selling all they can ? The second argument is difficult to prove since it is all ” off the books” but if the first one is correct then it is a problem also . As a matter of fact if the first is correct then Iran should not be a part of OPEC . What is your opinion ?
Hole in head,
It is possible they are producing more than the secondary sources are reporting, I won’t speculate. I think the secondary sources are probably correct and Iran is exporting very little oil currently, the US sanctions are likely to be hurting the Iranians, I think this was a dumb move by Trump, unfortunately undoing the damage is not easy to accomplish.
It is unlikely that Iran is producing anywhere near capacity, but we won’t really know until sanctions are removed.
Note that I don’t know what actual production of oil is anywhere, I only have the numbers printed in reports, they could be right or they could be wrong, I am just reporting what I read in the Monthly Oil market report from OPEC.
Hole in head,
Iran was pumping about 3.8 Mb/d of crude oil before US left the JPCOA. In 2017 Iran consumed 1677 kb/d of C C NGL and in 2018 they consumed 1717 kb/d of C C NGL (BP data), so roughly consumed 1.7 kb/d before US left nuclear deal, leaving at least 2.1 Mb/d for exports. Actually BP has C plus C for Iran over these two years (2017 to 2018) at about 4300 kb/d and NGL at about 366 kb/d for a total output of 4660 kb/d for C C NGL, that would leave about 2940 kb/d for export according to BP data.
Obviously a typo, see
https://www.eia.gov/todayinenergy/detail.php?id=49116
Great post & comments. Thanks everybody.
Up above there was talk about rapid collapse of the oil industry after peak.
As I indicated, I think that rapid collapse is a very unlikely scenario on a global basis.
But what may be extremely rapid is the change in mentality/psychology, especially as it pertains to security issues and financial behavior [examples- collapse of the Afghanistan 300Kstrong security force, or the 2009 financial crises].
These kind of human mob immediate shifts in mentality can cause extreme instability in the global economy when applied to an issue like peak oil supply. When the times arrives where the global mainstream understanding is that oil has peaked, and especially when oil first becomes harder to for countries to purchase, there may be a rapid panic reaction.
In fact I would very surprised if there wasn’t such a reaction.
What will countries/populations do when they first realize that the oil spigot is starting to close?
Reactions will vary depending on how dependent a country is on imports, and it varies tremendously.
There will a very rapid scramble to arrange priority customer relationship with oil suppliers on a much bigger and desperate scale than we now see (ex China-Iran). All previous alliances will be up for re-shuffle. There will be closed door deals for food supply, essential materials, and security, in return for oil supply guarantees. This will include big promises and big threats, as international ‘diplomacy’ always does.
Governments that are seen as slow to react will be removed- like we have seen in the middle east over the last decade. A big opportunity for authoritarians, nationalists, fundamentalists, and anarchy or civil war. Think Iran in 1979, or Iraq and Syria more recently.
There will be a massive scramble for all thing electric, for example battery manufacturing capacity/material supply . What is now a trickle will become an industrial tsunami. Shortages of solar components and electrical vehicles will likely be severe in most countries. Much worse than we see with semi-conductors this past year.
Countries may have to take drastic financial steps to shore up accounts. All mechanisms will be up for consideration- competitive currency devaluation, pension/social spending rollback, asset seizure. special taxes are some of the things that have happened in past episodes of instability. These kind of things will all be on the table.
I emphasize that some countries are much more vulnerable to these kinds of disruption than others, but the ripple effect on all countries will be very, very large.
While the global oil supply may not fall of a cliff anytime soon. the global mentality may change extremely rapidly.
Hickory,
There are a lot of different ways that things could play out, but keep in mind that the main stream media will not be convinced of peak oil until well after it has occurred (perhaps 5 or 10 years later). In the interrim oil prices will be high and a transition to electric land transport will accelerate as a result, governments may start to digest the realities of the IPCC AR6 report and create policies that accelerate the transition away from fossil fuel. These two forces may lead to demand for oil falling faster than the supply of oil. How does OPEC plus react to such a circumstance? My guess is the cartel falls apart and we see large producers start to develop their resources more agressively in an all out war for market share in the shrinking oil market. Oil prices could fall very steeply in such a scenario driving high cost producers (tight oil, deep water oil, newly developed oil sands projects, and Arctic oil) from the market with most oil production coming from the middle east former OPEC producers and Russia. We might see oil prices stabilize at $25/bo in 2021$ by 2045 under such a scenario.
Bottom line, we see very different futures for the oil market.
Agreed- there are lot of ways things could play out. I was describing some of the possible ramifications of a sudden change in global sentiment after peak oil is felt. Global sentiment is not rooted in facts and reality all that well.
Regarding “main stream media will not be convinced of peak oil until well after it has occurred (perhaps 5 or 10 years later)’
I see it differently- The global perception of the arrival of peak oil could happen very quickly, maybe well before it even has occurred. I acknowledge that it will take 5-10 years for the charting to clearly depict an irreversible drop in the monthly trailing averages. But human reactions to the perception could be extremely rapid.
Regarding messaging- there may come a time when large producing companies or countries decide it is in their best economic interests to proclaim peak oil supply, as a way to boost their bargaining power. That message will have a big effect on sentiment. Ron has been often repeating the message that the Russians have proclaimed their peak, for example.
When other big players start saying the same thing loudly in the media- it won’t matter whether or not the charts agree. It will be perceived as true, or at least imminent.
5-10 years after peak is 2023-2028 so really any time now. Unless of course Dennis gets his 30 trifectas in a row and we squeak out a new peak in 2023-24.
Stephen,
You are way off on your odds. I would say it is less than one in 4 that there will not be a new centered twelve month average (CTMA) peak in World C plus C output. You seem to believe a transition to EVs will occur much more rapidly than is likely. We don’t produce that many EVs now Worldwide and don’t have the battery manufacturing capacity to produce a lot more at present.
It will take time for the transition to occur and demand for oil will quickly rebound to the 2019 level, probably by 2023 at the latest.
High oil prices are likely to create a resurgence in capital spending in the oil industry and the increased demand will be met with increased supply of crude plus condensate. The main unknown is at what oil price will supply and demand match in 2028. Will it be $100/bo for Brent in 2021$ or will it be $150/bo? My guess is the middle of this range at about $125/bo in 2021$.
There are many that argue for an undulating plateau, even if Ron is correct that 2018 is the final peak, if we see World oil output approach that peak then we might be on a plateau that can be maintained many years or might see a new peak in any future year. I think the peak will fall in 2025 to 2030 and until we see steady decline for 5 to 10 years beyond that we won’t have much consensus on a final peak being reached.
If my guess is correct that puts us at 2030 to 2040, with a best guess at around 2035 for this realization. It is likely (perhaps 60% probability) that by 2035 there will have been enough EVs and plugin hybrids sold that demand for oil begins to fall more quickly than the supply of oil is falling and drives oil prices lower to reach a market clearing price. This will make OPEC fall apart and may well lead to a price war and supply glut.
It will be all about peak demand rather than peak supply at this point and the oil industry will become a shell of its former self within 5 to 10 years (so 2040 to 2050 or so).
It is all speculation of course, but that is how I see it playing out at this moment in time.
Dennis , the key is exportable surplus oil . The world is depending on OPEC 5 + Russia (Total 6 countries ) to save their butt . Out of 6 we have 2 (Iran and Iraq ) on crutches and all are past peak . Skating on extremely thin ice . The collapse of Kabul is well defined as ” Nothing happened for 20 years and then 20 years happened in 20 hours ” . Downhill momentum catches speed real fast .
Hole in head,
Doubtful that as a group these nations are past their peak. Time will tell who is correct on this question. Either of us claiming that our claim is correct is silly, trends can change, direction unknown.
Also exportable surplus is less important than total output. You take US out of your calculus, but more output from US means less net imports to the US leaving more oil for other nations.
So US, OPEC big 5, Russia, Canada, Brazil, Norway, and China, in fact the top 20 World producers will be important. They have produced about 87% of cumulative World output of C plus C from 2011 to 2020.
See comment at end of thread for chart.
I do see EV adoption adding great uncertainty, like Shallow Sand started above, in addition to the Covid picture, the debt bubbles in consuming nations, the civil wars in producing nations, the unknowns about how much oil is left underground in KSA, Russia, the Permian, etc. You believe in a stable world that I do not think exists any longer and won’t again in our lifetimes. If oil prices are high and then they are low the next year, CAPEX will not increase like you expect it to. Your assumptions are widely optimistic. There’s only a 10-20% chance everything holds together long enough to reach a new peak imho. Oil prices that are high enough for long enough to induce significantly higher investment will be highly destabilizing economically, while simultaneously inducing a much more rapid effort to transition to EVs, which will immediately dampen investment sentiment. There’s just no way your oil price scenario is possible, and without that, the CAPEX won’t be there.
Stephen Hren,
The problems you suggest have been with us a long time 50 years or more, you think the future will be much different than the past (much worse), I think it will be much the same (progress, backslide, etc) there will be problems, some of them will be new (unknown unknowns), I cannot predict unknown unknowns, some of them may help and others will hurt and there will likely be some of each.
An assumption that only bad things will happen is just as bad as an assumption that only good things will happen, my guess is that there will be some of both as has been true for all of history. Perhaps the future will be completely different from the past and every event will only have negative consequences, this seems statistically unlikely in my view. I will wait and see what happens.
I generally don’t think of reality as a 3 sigma event, your perspective may be different.
Oh and your assumption that I believe in a stable world is incorrect. A model is a simplified expression of the World where stable assumptions are made to make the math easy as well as the model easy to understand.
Oil prices have been unstable since 2004, has capital investment stopped? Generally we have seen reduced capital investment in response to low oil prices.
As to high oil prices resulting in instability, Brent oil prices were over $120/bo in 2020 US$ for most of the period from early 2011 to mid 2014. Today the World GDP is much higher than that period so we could likely afford $130/bo in 2020 $ with little problem. World real GDP growth over that high oil price period was around 3% per year.
Will we see stable oil prices at $130/bo, of course not. I use stable oil prices as a model simplification to represent average oil prices over a period. So when I use an $80/bo maximum oil price, one could easily add a random fluctuation in oil price up and down by 20% or more and little would change in the model. I expect there will be oil price volatility, though I expect it will be in the range of $80 to $120/b for 3 month average oil prices. I use the $80/bo maximum oil price as a very conservative assumption for real oil prices that are likely to be a minimum of $80/bo in 2020$ from 2022 to 2033 for any 12 month average. I would say $100/bo for average Brent oil prices for the period from 2022 to 2033 with fluctuations from 80 to 120 per barrel would be a more realistic model.
Hickory,
Yes sentiment can change very quickly, I agree. I just disagree on when that is likely to occur. My expectation is 2035 or so about the time when the peak will be seen as due to a lack of demand rather than a lack of supply. It may not be a big problem for the economy in general, but it will be a bad time to be invested in the oil industry. Those with foresight will sell out at the peak in 2028 or so when oil prices may be close to their maximum, maybe 2030 at the latest. Those who wait may be left with stranded assets.
Ovi , I know they had a Rupee payment agreement with India for crude before the Trump sanctions . Their main buyer was Reliance but they stopped . They have a lot of refining capacity . They shipped gasoline and diesel to Venezuela against their gold .
https://www.tehrantimes.com/news/440117/Iran-s-refining-capacity-reaches-2-3m-bpd
I think WTI is heading back to $60 ish where there is support from buyers but if that gives way it is back to the low 50’s
50$ will finally collapse shale. All giants will speed their exit – they are already leaving, and production will decline a few mbpd.
Big offshore will slow down, too, and the result will be a supply crisis.
Cool. Let’s see if WTI hits $60 before it hits $70. Currently $66. If it hits $60 first I might take your US$ predictions more seriously…
Frac spread count through Aug 13, 2021, frac spread count is 238 up 3 wow but down 5 from 3 weeks earlier. Up 168 from one year ago when count was 70.
Frac spread count was 245 on March 27, 2020 and it was 319 on Feb 14, 2020 (highest value on chart below. On Jan 17, 2020 the count was 359 (highest in 2020). The peak frac spread count in 2019 was Jan 26 at 463, and for 2018 the peak was June 22 at 503, the 2017 peak was 437, 2016 peak was 239, and 2015 peak was 405 in January. No data before 2015.
Blue hydrogen, (hydrogen from natural gas), far worse than just burning the gas.
Blue Hydrogen Worse Than Natural Gas: Study Bold mine
Blue hydrogen, the kind that involves fossil fuels combined with carbon capture, could be worse for the environment than natural gas or even coal, a new study has suggested.
The study, conducted by researchers from Cornell University and Stanford, also suggested that the carbon footprint of blue hydrogen is as much as 60 percent higher than that of burning diesel for heating, Energy Live News reports.
“Politicians around the world, from the UK and Canada to Australia and Japan, are placing expensive bets on blue hydrogen as a leading solution in the energy transition,” one of the authors, ecology and environmental biology professor Robert Howarth from Cornell University, said in a statement.
“Our research is the first in a peer-reviewed journal to lay out the significant lifecycle emissions intensity of blue hydrogen. This is a warning signal to governments that the only ‘clean’ hydrogen they should invest public funds in is truly net zero, green hydrogen made from wind and solar energy,” Howarth also said.
The study’s authors have suggested that because of the enormous amounts of natural gas that blue hydrogen requires, its emission footprint is bigger than gray hydrogen, which does not use carbon capture at all. The emission footprint also does not depend on the specific carbon capture and storage technology used.
Ron,
Makes sense. If you are going to burn natural gas and capture the carbon, better to not waste energy converting to hydrogen. That is pretty obvious.
The use of hydrogen as a storage medium is to utilize excess capacity from wind and solar when more is being produced than can be utilized. The “free” electricity which would just be dumped to ground in the absence of some storage method would be used to produce hydrogen which could be stored and burned later, other possibilities are large stationary batteries (these do not need to be lithium ion for stationary storage). Whichever method is cheapest and does the least amount of envoronmental damage should be encouraged with proper policy measures, or just let the market decide and have good regulation of the industry.
I wonder if you meant to put this in the Open thread perhaps?
Feel free to move it, I don’t care if my comment gets deleted.
No, I thought hydrogen and natural gas should be part of the energy discussion.
Ron,
I have read several of your comments in this thread and agree with your sentiments about peak oil. I do believe we are heading more towards a SENECA CLIFF.
In researching the collapse of the Late Bronze Age, Ancient Roman Empire, and the Mayan Civilization, what I found quite fascinating is the COLLAPSE PERIOD in all three was quite similar… 10% of the overall period. Thus, the Collapse of Major Empires & Civilizations occurs quickly, not over a slow period of time.
While the PEAK of the Empire may have been for 100 years, the collapse occurs suddenly.
If we assume the same fate to the Modern High-Tech Global SemiConductor Economy which depends upon a massive amount of fossil fuels to sustain itself, the collapse will occur in roughly 25 years.
If we throw a DART at the wall and say the Modern Industrial Revoluation started in 1800 and the peak of Global Oil Production (High & Low EROIs) occurs in 2025, then by 2050… most the global economy will be in ruins.
Lastly, the idea we are going to transition to SMART ENERGY like Wind, Solar, Blue Gas, Green Algae or whatever, will not happen because all those energy sources need OIL-NATGAS-COAL to be possible.
GOD HATH A SENSE OF HUMOR…
Steve
I think China get’s it right. They are working on energy independence, and getting rid of oil and later coal.
No need to maintain a global military presence to protect the oil ways then. Normal trade doesn’t need the same protection than this oil business.
Since China has it’s own chip industry, they can build anything else they need. They can persist even when the west collapses.
You do realize China imports something like 80% of their energy needs right? Normal trade doesn’t need protection because US Navy is still providing that protection. If the US wanted to see China collapse all they’d have to do is go home.
China’s neighbors all of who hate them would see to it that China collapses. Only reason China exists as it currently does is because of US led order. US led order allows anybody to buy and sell whatever they want to whomever they want. Anywhere in the world. World goes back to pre Bretton Woods. Imperialistic world if US ever decides just to go home.
China has never in it’s history been able to breakthrough what they call the first island chain. They can’t even interface with rest of the world without US led order.
China is nowhere near energy independence. And they, like everyone else, are reliant on Taiwan for semiconductors en masse. Good luck invading that place so long as the 7th Fleet and Taiwan’s SDF have anything to say about it.
Top 20 producers of C plus C in the World (lest axis) and World C plus C minus top 20 (rest of world or ROW) on right axis. I do not think trend higher will continue at same slope, but I do expect output will rebound from pandemic eventually and then continue higher at a lower rate of increase (perhaps 300 kb/d on average from 2023 to 2028, rather than the almost 1000 kb/d average rate from 2011 to 2020).
Data from
https://www.eia.gov/international/data/world/petroleum-and-other-liquids/annual-petroleum-and-other-liquids-production?pd=5&p=00000000000000000000000000000000002&u=0&f=A&v=mapbubble&a=-&i=none&vo=value&&t=C&g=00000000000000000000000000000000000000000000000001&l=249-ruvvvvvfvtvnvv1vrvvvvfvvvvvvfvvvou20evvvvvvvvvvnvvvs0008&s=94694400000&e=1609459200000
Dennis, why do I get totally different numbers from you, especially for the “Rest of the World”.
In 2019 before any covid decline set in, the Top 20 declined 47,000 barrels per day from 2018. However “The Rest of the World” declined 671,000 barrels per day from 2018 to 2019.
That was of course a total decline of 718,000 BPD or almost a 3/4 of a million barrels per day the year before the Covid 19 decline.
Interesting to note, that in that same year, 2018 to 2019, the USA increased production by 1,284,000 barrels per day while Iran declined by 1,283,000 barrels per day. Of course, both are in the top 20.
Note: On the chart below the Top 20 is left axis while the Rest of the World is right axis.
Ron,
Are you using crude plus condensate from the EIA international energy statistics?
Perhaps we defined top 20 differently. I used cumulative production from 2011 to 2020 for all nations in EIA database and then sorted high to low.
My top 20 are:
Russia
Saudi Arabia
United States
China
Iraq
Canada
Iran
United Arab Emirates
Kuwait
Brazil
Mexico
Nigeria
Venezuela
Kazakhstan
Angola
Norway
Qatar
Algeria
Oman
United Kingdom
Rest of World is World total minis top 20 listed above (using C plus C only from EIA).
Maybe we used different data sets?
Yes, I am using C+C. But I am using production data for 2019, the last year before the Covid demand hit. Here are my top 20 in order of the highest production.
United States
Russia
Saudi Arabia
Iraq
Canada
China
United Arab Emirates
Iran
Kuwait
Brazil
Nigeria
Kazakhstan
Mexico
Angola
Norway
Qatar
Algeria
Libya
United Kingdom
Oman
That explains it, our top 20 producers are different, ranking on the basis of a single year didn’t seem like the best idea to me.
Yeah, that explains it. My top 20 are the current top 20. And my “rest of the world” includes many nations that have gone into decline in the last decade. And that part, the “rest of the world” is where my chart so radically differs from yours.
Ron,
The difference between the two lists is Venezuela is in my top 20, but not in yours and Libya is in yours but not in mine. Over the period you focus on the difference is significant. Note that the number you quote for rest of world decline from 2018 to 2019 of 671 kb/d is mostly from Venezuela which saw output plummet by 608 kb/d that year. So for rest of World minus Venezuela we saw only a decrease of 63 kb/d. For top 20 we saw a drop in output from 2018 to 2019 because OPEC cut back output in 2019 (this is true even if we exclude Iran and Venezuela which both dropped a lot in 2019).
If Venezuelan output dropped another 608 kb/d they would be producing negative 82 kb/d for average output in 2021, so that is pretty unlikely, they cannot produce less than zero.
Also for your rest of world drop in output of about 3300 kb/d from 2015 to 2020, 1962 kb/d or 59.4% of the drop was from Venezuela.
When we look at your “rest of world” without Venezuela, the average annual decrease from 2015 to 2019 was about 176 kb/d.
For your top 20 the average annual increase in output from 2015 to 2019 was 990 kb/d.
I am confident the top 20 producers will be able to increase their output by more than the rest of the World will see their production drop over the next 5 to 10 years.
Dennis, the Venezuelan decline can be considered permanent. If you have Venezuela in your top 20 producers then it is obviously in error.
I am confident the top 20 producers will be able to increase their output by more than the rest of the World will see their production drop over the next 5 to 10 years.
Well hell, that may very well be the case. But both, the top 20 and the rest of the world have declined a combined 7 million barrels per day since 2018. 1.65 million barrels of that were from the rest of the world. That 1.65 million barrels, plus further decline from them, will not be coming back. So the top 20 will have to increase by 7 million bpd, plus all further decline from the rest of the world, just to break to their 2018 level.
So even if your confidence is well-founded, that will still not be nearly enough Dennis. 2018 was the peak year for world oil production. Get used to it Dennis.
Ron,
I agree the Venezuelan output will not increase and this is the second time I have said it. Should I repeat it yet again?
Most of the “rest of World” decline was from Venezuela as I showed.
Do you think Venezuelan output will decrease by more than the 2020 level of output in the future?
Including Venezuela in your “rest of World” category is silly, a few years ago in 2015 Venezuela was in the top 10 World oil producers.
Of the 1.654 million decline in output for your “rest of world” group, 58% was Venezuela (959 of 1654 kb/d). In 2020 Venezuela’s output was 527 kb/d, so it cannot fall by more than this. After output falls to zero (if it does) it will fall no further.
For your rest of world group output in 2015 was 12368 kb/d and for Venezuela in 2015 output was 2489 kb/d. In 2020 rest of world was 9067 kb/d and for Venezuela in 2020 output was 527 kb/d.
So for rest of world output fell by 12368 minus 9067 or by 3301 kb/d and Venezuela fell by 1962 kb/d, so 59% of the decrease was from Venezuela. Obviously World output fell a lot during the pandemic and it is likely to rebound in 2022, if we only look at 2015 to 2019 rest of world fell by 2318 and Venezuela from 2015 to 2019 fell by 1613 kb/d, so Venezuela was about 70% of the fall in rest of world output over that period.
Rest of world minus Venezuela fell by 705 kb/d (2318 minus 1613), then divide by 4 years to find annual average decline of 176 kb/d. No increase in Venezuelan output needs to be assumed, simply that Venezuelan output remains at 527 kb/d in the future. Or if it continues at the 2015 to 2019 decline rate of 1613/4 or 404 kb/d each year, then Venezuela would be at zero output by 2023 and could not decline any further.
That is the reason it makes sense to exclude Venezuela from “rest of World” decline estimates.
In short, you will get a poor estimate of future decline if you assume the rest of world will continue to decline at the rate we have seen from 2015 to 2020 (when Venezuela is included in the rest of world estimate), if you use the 2010 to 2015 period, the estimate is more reasonable.
We could exclude Venezuela and take the 2010 to 2019 rest of world decrease in output and divide by 9 (1863/9) to get an average annual decrease of about 207 kb/d. For the 2010 to 2019 period your top 20 increased output by an average annual 940 kb/d. This is a factor of 4.5 higher than the rest of World less Venezuela decrease in output. Seems pretty doubtful we will see the top 20 see their rate of increase fall to less than 207 kb/d which would require a drop by a factor of 4.5.
We will see.
Dennis, I will post a reply, with chart, when the new posts are posted later today.
Hey Dennis- up above you said ” exportable surplus [oil] is less important than total output. ”
I see it in the opposite way.
For all net oil importing countries, which are the vast majority in the world, it is only the oil available on the world market that matters.
As that goes, so goes the fate of the world economy in so many ways.
I know it is a fuzzy number, since so much product is exported as crude, and refined elsewhere and then re-imported in the form of finished product or as various petrochemical feedstocks.
Is the USA now a net exporter or importer of oil product?
Hickory,
You are correct. I stated my point poorly.
Hole in head excluded the US from the list of important producers. My main point is that the demand for imported oil changes if one of the largest importers of oil reduces their oil imports because they are producing more oil. From 2004 to 2007 the United States had net imports of over 10000 kb/d on average each year. In 2020 this dropped to 2700 kb/d and in 2019 it was about 3800 kb/d of net imports of crude oil. So compared to 2007 this reduces demand in 2019 on the World oil market for exported oil by 6200 kb/d. In 2018 the World exported about 46656 kb/d of C plus C, in 2007 it was 42962 kb/d (data from EIA). In 2007 the US imported 23.2% of the World’s oil exports and in 2019 (BP data) World exports were 45497 kb/d and the US share was 8.3%.
The point was simply that if net importers of crude produce more oil, then their net imports will be less than if they had produced less crude oil. In short, their demand for crude exports will change in response to the amount of oil that they produce.
So looking only at those producing nations that are net exporters of oil will miss the changes in demand for crude oil exports that are determined in part by domestic oil production.
Bottom line is that crude oil output from China and the US will affect demand for crude oil exports, and can affect things significantly as it has from 2007 to 2020 for the US and its affect on World crude oil markets.
In 2020 the US was a net exporter of crude oil plus petroleum products, in May 2021 we had flipped to a net importer, also in March we were a net importer, to date in 2021 (through May) the US is a net exporter of crude plus oil products.
https://www.eia.gov/dnav/pet/pet_move_neti_a_ep00_IMN_mbblpd_m.htm
Here is the US net oil import charge since the early 70’s, from the eia link provided by Dennis.
Would be nice to have this info for all countries, and all energy sources.
We are currently close to zero oil import/export currently.
A fleeting moment in history I suspect.
Hickory,
The information is available from BP statistical review of world energy
https://www.bp.com/en/global/corporate/energy-economics/statistical-review-of-world-energy.html
download spreadsheet from link above. There is a lot of information, probably has information for all fossil fuels.
Looked at BP, for imports it has only US China, India, Europe, Japan and Rest of World, for exporters there is a larger list including the US and Europe.
The US has been a net importer of oil almost every year since 1949.
Interesting . If correct then shale is in the rear view mirror .
https://oilprice.com/Energy/Oil-Prices/The-Main-Reason-Oil-Prices-Wont-Go-Above-80-Per-Barrel.html
Hole in head,
Note that the scenarios I have done recently for tight oil assume a maximum Brent oil price of $80/b, similar to the level referenced in that piece.
Dennis , $ 80 is the upper limit i.e it can hit the price but it will not be sustained there at 6 months + as a few have argued . HHH has a price range of $55 -70 so let us say an average price of $ 62.5 . I am more in agreement with the price range for the rest of 2021 and 2022 .
Hole in head,
I doubt the $80/bo upper limit proposed by the author, supply is likely to be short from late 2021 to 2030, people can complain all they want about high oil prices, prices will rise to a level that balances suppy and demand and this price is likely to be higher than $80/bo rather than lower as the World recovers from the pandemic as more people get vaccinated and we get covid outbreaks under control.
In short, I agree with LTO Survivor and Hickory, see below.
I don’t agree. There is no upper limit if demand is one barrel more than supply.
Agree. No upper limit
There has to be enough dollars available to bid price. What people don’t understand is $147 oil happened during a stretch of time where there was an over abundance of dollars in the Eurodollar market. Then 2008-2009 happened. Which was a Eurodollar shortage. I know everybody believes it was subprime and too high oil prices and those were symptoms of what was happening. But 2008-2009 was a blow up in Eurodollar market. Which is why it was a global crisis.
Right now China has been selling US treasuries for 4-5 months straight. Net seller that is. Contrary to what people are told about why. China sells US treasuries because they don’t have enough dollars. When China cuts their RRR rate it’s because they don’t have enough dollars. They getting ready to do another RRR rate cut.
So there is a dollar shortage on going right now. And it’s not just in China.
Alright do you believe that Banks are ready to lend US dollars to the moon and back? If so then maybe there is no upper limit to price of oil.
Banks are too busy buying government bonds at all time high prices. Because banks use the bonds as collateral in REPO market. Not much lending going on. There is nothing that will come along and change this trend.
Heck when we get an actual oil shortage. Banks are really going to clamp down on lending. Which will be very contractionary for the price of oil.
China can break out of the dollar system.
They can start buying oil for Yuan, at least at lesser oil states. For Yuan you can get now lot’s of things, cars chemicals, all kind of stuff.
After the Afghanistan disaster the US will be even more weakened. And China is strong enough now to resist any bullying from the USA. Trump did not win the trade war with China.
They already buy unkown amounts of oil from Iran. Time is on their side at the moment.
Not seeing dollar shortage in chart below, see link
https://fred.stlouisfed.org/series/DTWEXBGS
Also
https://fred.stlouisfed.org/series/DTWEXAFEGS
Dennis your not even looking in the right place or charts. Commercial bank balance sheets are they expanding? Are their loan books expanding? And the most important bank balance sheets are ones you have no access to. Those European banks that make loans denominated in dollars. Start with total bank credit in US. It is easy to find.
HHH,
You claim a dollar shortage, if it exists it will show up in forex markets, it doesn’t.
For credit to the non-financial sector I use
https://stats.bis.org/statx/srs/table/f1.2
For 2020 credit for all nations reporting data to the BIS expanded by 28 trillion US dollars (from 2019Q4 to 2020Q4).
For US Bank credit we have this
https://fred.stlouisfed.org/series/TOTBKCR
HHH,
BIS does a pretty good job of tracking World credit, that is my go to source.
https://www.bis.org/
China to US foreign exchange past 10 years. Lately the Yuan has become weaker relative to the US dollar, in other words the price of the dollar has increased to 0.1543 USD per CNY on Aug 18, 2021 from 0.1413 USD per CNY in early 2020, this does indeed indicate a dollar shortage relative to yuan in currency markets.
Broad dollar index trade weighted, lately the dollar index has dropped from about 123 in April 2020 to 113 on Aug 13, 2021. So dollars may be short in the China-US Forex, but not worldwide.
https://fred.stlouisfed.org/series/DTWEXBGS
Alternative index focusing on highly developed economies, suggested as substitute of old USDX index by Fred.
https://fred.stlouisfed.org/series/DTWEXAFEGS
Bottom line is that the US dollar is depreciating against most currencies with the broad dollar index falling in value against a basket of foreign currencies weighted by their level of trade with the US. I do not see the dollar shortage HHH seems to imagine.
I take it that your old enough to remember the bubble in Japan. And how it came crashing down. That was also a dollar shortage. US banks cut Japan off of dollar funding. Mexico and Brazil have also experienced a dollar shortage in not too distant past. Tequila crisis remember that? Every major crisis we’ve had over past 40 year or so has been due to a dollar shortage. The dollar market outside US is twice as big as the dollar market inside the US.
HHH, correct . All financial crisis after the closure of the gold window in 1971 have been a dollar crisis . Give them any exotic name , Japan crisis , SE Asia crisis , tequila crisis , Latin America crisis etc . All had the same base viz the entities ran out of dollars .
HHH,
There can certainly be financial crises, whether we will have one soon, I do not know. There are plenty of prognosticators who claim there will be a crisis next week or next month, for every week and month. Eventually they will be right, just like a broken clock.
Does this indicate a reverse flow of the USD to USA ??? HHH???
https://www.zerohedge.com/markets/emerging-market-etf-outflows-hit-11-month-high-brazil-troubles
HiH
Yes it means dollars are flowing out of emerging markets. The reflation trade is starting to go in reverse.
Iron ore price is rolling over. Housing in the US, high prices are getting rejected too.
And Fed is talking tapper of QE
LTO, you are looking at the issue only from the prism of supply and demand . Unfortunately oil is a financialised commodity . The price is not exclusively determined by the supplier and buyer but also a man in a suit sitting across the computer screen in New York . This man has never seen an oil well except in the movies . His motive is speculation and not price discovery . Besides this there are several factors example geo politics , storage space ,quality, exchange rates, shipping etc .Last word ” affordability ” . If you can’t afford it then you can’t have it .
Hole in head,
LTO is quite familiar with how the oil market works. This must be how I sound when I respond to Mike Shellman. I should refrain in the future or choose my words more carefully at minimum.
Tks , Dennis. Apologies to LTO if it seems I am lecturing . Just clarifying .
I agree that it is a complex commodity affected by geo political issues, storage, capital availability and now the political will to go green. However, this industry requires significant capital for reserve replacement and production replacement. As I view the landscape, the Majors are beginning to divest of non core assets and I am not so sure they have the stomach to re-deploy capital back in the industry. In the United States we have consolidation on a massive scale in the shale arena. When an these Shale E&P growth stocks trade for 4 times earnings, it is sending a message that the life of the shale component of the industry is coming to an end. I know for a fact that at these prices and with the debt currently on most company’s balance sheets that the business is just working to pay off debt or dividends. I know what the inventory looks like and it is not pretty.
We have a world market however and as this post suggests there are only a few countries that can add production in a meaningful way so maybe the next two years will be choppy in terms of supply and demand due to the virus mutation but after that, I really don’t know where the supply will come from to fill a 100 million barrel per day market.
I understand the charts and money outflows but I also know that the industry is being starved for capital everywhere including Saudi Arabia (lower rig count). This will have a significant effect on future supply. We are lulled into thinking that because we didn’t hit peak supply 15 years ago that it will never happen but under the current scenario, I don’t see anyway it won’t happen. There are no untapped basins that can rival a Gawhar field and Russia will start it’s decline very soon. On top of all of the geological limitations, the lack of capital reinvesting will soon be felt.
The question is whether the green new energy will fill the gap to keep the price of oil down over time. Right now, I don’t see any meaningful solutions that will preserve our current standard of living and way of life as we have known it with relatively cheap energy.
LTO Survivor,
I agree. I expect oil prices will rise. Consider the following chart which focuses on days of forward suppy of OECD quarterly closing stock levels (left axis and Brent Oil price in 2020 $ (right axis). I also assumed OECD consumtion will be flat at 2021Q2 level in 2021Q3 and 2021Q4 and that the OPEC estimates for the “call on OPEC” for 2021Q3 and 2021Q4 are correct. In addition I assume OPEC adds 400 kb/d of output for each month from August 2021 to December 2021 in order to project days of forward supply for OECD commercial on land stocks for the final 2 quarters of 2021.
The indication is for a drop in OECD stocks that should lead to higher oil prices (if OPEC estimates are correct). Note that I expect OPEC estimates for non-OECD output are too high and for demand are too low, in other words this would be a conservative estimate if my guess is correct. This guess seems to be in line with what you say above.
Note also that if the same assumptions are made for 2022 then there could be an oversupply of OPEC crude, though these assumptions fall apart if Iranian sanctions are not removed because OPEC supply will not be able to grow beyond 28 Mb/d without higher output from Iran, also the call on OPEC is likely to be higher than OPEC currently estimates in ealy 2022, but if all assumptions were just continued up to 2022Q4 (assumption the OPEC estimates are correct and OPEC output continues to increase by 400 kb/d each month up to 29 kb/d, the we would see an oversupply of crude in the first half of 2022 (not shown on chart). Also the chart suggests that oil prices rise to over $100/bo if days of forward supply for OECD stocks are less than 95 days, that level is reached in 2021Q3 (94 days) and in 2021Q4 it falls to 91 days.
Above I said OPEC estimates of non-OECD output are too high, I meant to say estimates of non-OPEC output are too high.
Also I noticed that before 2015 the days of forward supply being below 95 days for OECD stocks led to high Brent oil prices (above $100/bo in 2020 $), but this was not the case in 2017 to 2019 when days of forward supply fell to as low as 91 days and Brent prices were in the 60 to 80 dollar per barrel range (2020$). Thus there has been a shift in the relationship and it may require even lower oil stocks (perhaps under 90 days of forward consumption for OECD stocks) to push Brent oil prices above $80/bo.
It will be interesting to watch.
Taiwan in the news, at least the Chinese news, as the Chinese are loudly telling them they better not presume the US will help them in any separation attempt, given the evidence of US penchant for abandonment blah blah.
Taiwan, assuming 2020 recovery, consumes 1 mbpd. The majority comes in at primary import oil port of Kaohsiung. Southwest tip of island per: https://mapcarta.com/Kaohsiung. Few miles north of there is the
Mailiao Refinery. Lists at 545K bpd throughput. The rest for the island scattered.
LNG imports Taichung and Yung-An terminals. Both on the west side of Taiwan, facing China mainland.
There need be no occupying force.
US companies are starting to move some supply chains out of Taiwan and closer to home. To places like Dominican Republic. I think US is slowly moving to exit parts of the world that it doesn’t really want to maintain. So maybe some merit for abandonment.
At some point US will have little interest in keeping Saudi Arabia maintained. What happens to Saudi oil production without US protection?
I think it will get oil production under Russian or Chinese protection.
This is the big game – there will be no vacuum. And SA is a juicy bit. Perhaps the reagion will get more peaceful with China controlling Iran and SA then. At least somewhat.
Another shale exit
https://www.bloomberg.com/news/articles/2021-08-17/conocophillips-puts-williston-basin-oil-assets-up-for-sale
But I was told shale was a good investment and would only go on to grow for years and years? Am I being duped?
😉 . 😉
Lightsout,
Maybe just an exit from Williston in order to buy more assets in Permian basin, so perhaps not a tight oil exit but simply a move to a more profitable tight oil play.
From piece you linked, bold added by me:
Major oil companies are shedding assets as they focus on less carbon intensive operations. Royal Dutch Shell Plc’s portfolio of Permian Basin oil fields, which could be worth as much as $10 billion, is said to attract suitors including ConocoPhillips.
Dennis, missing the woods for the trees . The key sentence is ” they focus on less carbon intensive operations. ” Shale is not less carbon intensive . As to Conoco Phillips they themselves want out . See link posted by Lightsout . Now an interesting situation . For long it was argued that the majors are waiting in the wings with loads of money and will buy all bankrupt shale operators for pennies on the dollar . Now that the majors themselves are quitting , who ? In my opinion the mini majors like CLR , Pioneer etc are not in a position to do buyouts . Best I think will be mergers between bankrupts but the motive will not be to produce but to strip all assets , pay the executives bonuses and then abandon the project leaving the govt or whosoever holding the bag .
P.S : I know COP is offloading Williston but why buy Permian ? From the frying pan into the fire .
Hole in head,
Just pointing out that the post linked by lightsout which I quoted says that COP is interested.
COP produced about 328 kb/d in Permian basin in April 2021 from 2564 wells.
There are a total of 31152 horizontal oil wells producing in the Permian basin as of April 2021 with output of 3712 kb/d (data from shaleprofile.com).
So COP produced 8.8% of Permian output and operates about 8.2% of the horizontal tight oil wells producing in the Permian.
Perhaps they will want to add to their portfolio if Shell has wells operating near theirs or prospective acres that are adjacent to undeveloped acres leased by COP. I am not familiar with the details, can’t find where RDS wells are in Permian at shale profile.
Dennis,
The post from Lightsout regarding COP’s rumored spinoff of some Bakken assets – and several follow on comments – could provide an excellent example of so many aspects of the present situation of information presentation, understanding, dissemination and the resultant ‘world views’ thus formed by the global audience.
The article from Bloomberg – sourced from supposedly informed individuals – is most likely accurate.
The COP CEO said as much just a few weeks ago.
What the article describes as Bakken assets will almost certainly turn out to be some peripheral acreage in both Montana and North Dakota.
Operating in ND as Burlington Resources, COP has 620,000 net acres and produces 83,000 bopd.
While you regularly dismiss Investor Presentations, despite the wealth of data frequently put forth therein, the June 30 presentation fully explaining the Concho acquisition might offer you, specifically, an eye opening perspective on just what is going on in the hydrocarbon world.
While you continue to make sincerely grounded projections regarding future output, the few slides (pp #36 ff) touching upon recent technological advances should, at a minimum, pique your interest.
The smaller casing sizes, dual frac fleets, refracs using mechanical isolation are only a few of the ongoing innovations that continuously display the ultra dynamic status of this industry.
When one employs primarily historical information in forming future scenarios, one is apt to be continuously surprised at witnessing what actually is taking place.
Coffeeguyzz,
There may be some useful information, but a lot of it is hype. The typical wells they often cite in these presentations ar usually nothing like their average well, kind of like citing Andre the Giant as a typical man.
Coffeeguyz , ” The COP CEO said as much just a few weeks ago. ”
The Taliban will never take Kabul . The CEO Biden said as much a few days ago .
They all have come to the conclusion 1. They cannot make money in Shale 2. Inventory is dwindling 3. There is no EOR for the shale at this time 4. They can’t afford to operate a ton of stripper wells with plugging and environmental liability. When the majors start getting out, it is only a game left for the small independents. Stripper production is soon approaching. COP is not buying the Permian. COP bought Noble and has done nothing with their Permian assets and word has it that some could be bought today. They will sell those next. COP only really wanted the Gas Assets off the coast of Israel.
If I remember correctly Chevron bought Noble and COP bought Concho…
I am sorry. You are right. I still think they aren’t as enamored with the shale as they once were.
… and wasn´t Concho a pure play Permian operator?
How many barrels of oil did the 20 year Afghanistan reaction consume?
Is this considered a discretionary use of oil, or essential?
Was there ever a recipe for successful outcome?
These are not questions I expect an answer to, offered up as food for thought.
It is so very important to think hard about failed experiments, whether it is marriage or war.
Bakken DUC data.
Lightsout,
Indeed, the Bakken DUC data shows another net 27 decline. At this rate, the companies still trying to stay alive in the BAKKEN will be out of DUCs within another year. Of course, there will be maybe 100-150 remaining, but these will not be completed unless the Debt Holders put a gun up to their head to do it because the last percentage of DUCs are likely SHYTE-DUDs that no one wants to complete in subpar uneconomic areas outside the 4 Top Counties.
Of course, I’d imagine Dennis will offer some positive spin on this. And why not?
Isn’t DENIAL the first STAGE OF GRIEF? The next is ANGER. I look forward to seeing what that one looks like here.
steve
.
.
.
This seems to ssuggest about 2 years of DUC inventory if all of them are viable, for the past 12 months the DUC count has decreased at an average rate of 24 per month. If prices increase as I expect they may employ more rigs and increase drilling rates and employ more frac spreads and increase completion rates.
See Shale profile for a look at Enno Peters projections if rig count and completion rate is unchanged from today’s level. The projection has Williston Basin output at 796 kb/d in Dec 2029.
https://shaleprofile.com/blog/north-dakota/north-dakota-update-through-june-2021/
Dennis , 12 months bad , 18 months good . 24 months not going to happen . 12 months will be 300 DUC’s ,18 months is 450 DUC’s . The balance is crap as Steve has pointed out . Any new DUC’s will also be crap since the drilling is now in tier 2 or tier 3 locations . So let us look for start of Aug 2022 to Dec 2022 . Things will be interesting and testing .
Hole in head,
Much depends on future oil prices, and rig counts. Reportedly there were 5.8 Gb of proved reserves in the Williston basin at the end of 2019.
See data table 2 at link below
https://www.eia.gov/naturalgas/crudeoilreserves/
Note that proved reserves have an engineering estimate of greater than 90% probability of being produced at the economic conditions prevailing in December 2019. The average price of WTI in December 2019 was $59.88/bo. I expect oil prices are likely to remain above that level for at least the next 10 years (12 month average WTI price level).
Using a lower oil price scenario with a maximum WTI oil price of $57.50 per barrel in 2020 US$ a scenario can be created with a lower ERR (economically recoverable resource) of 6.8 Gb (note that cumulative production plus proved reserves for Williston basin is about 8.5 Gb). This scenario is very conservative, but the usual suspects will claim that it is wildly optimistic when in fact the opposite is likely. Also note that about 16500 wells have been completed in the Bakken through June 2021, the scenario below has 20700 total wells completed through 2026 (no wells completed after 2026 in scenario). Output rises to a secondary peak of 1200 kb/d in 2024 for this scenario with a maximum completion rate of 110 new wells per month after 2020. Output falls to 290 kb/d by Dec 2029.
Click on chart for larger view.
Could a graph be not possible?
On WTI chart there is a support zone call it $60 give or take a dollar or two where buyers are. They will want to protect their longs here. So I expect a bounce to happen somewhere in this support zone. Should get a bullish looking daily candlestick in this zone and price should attempt to rebound. It will look like a consolidation pattern. Right now I’m in the camp that is the rebound fails an we head back to $50-$55 at minimum. Possibly low as $40-$35 where there is a whole lot of support. But it’s wait an see. It’s already broken down the little bit of support it need to get through to reach $60 ish zone.
Yes, I got a bad feeling when oil closed below $66 today. Below $65 on WTI in overnight.
I guess this is delta plus end of QE?
We sold oil for almost $69 last month. Was a joyous occasion that apparently won’t be repeated anytime soon.
I have heard of one well being drilled this year in our field. That’s after zero last year. Maybe we are finally kaput.
There were over 100 wells drilled in 2014. 25-75 per year 2007-2013. Some multi-well waterflood projects that cost $1- $2 million by my estimates and have cumulative 50-100K BO, with 80-87.5% of the gross to the working interest owner(s) who paid for the wells. The ones that came in 2008-12 probably paid out without a problem. The later ones not sure, our LOE is much higher than shale.
Lots of the wells were infill, that is all we did 2008-2014, with a couple of very small exceptions. So none of the gathering infrastructure costs besides laying a line from the new well to the gathering system.
The oil price outlook has been too low and unstable for us to drill since the 2014 Thanksgiving Day crash. Same for most everyone here. There were some wells drilled in 2015, remnants of plans made during $90 oil. Almost nothing in 2016 and 2017. Slight activity in 2018. 2019 very little. 1 well since, just completed. The company that drilled it owns the rig, it was mostly a family project, I am sure they can do one dirt cheap for themselves.
I just cannot figure out how world production continues to hold up with the generally low prices from 2015-2021?
2020 seems to be the final nail in our field’s coffin. There just isn’t any capital, and even if there was, there aren’t any oilfield workers for drilling, let alone operating existing wells.
Things were rolling over before FED mentioned anything about tapering QE. High prices are getting rejected across the board. US housing starts fell I think it was 7% yesterday due to high prices. Home buyers are also starting to reject high prices. Used autos are also getting rejected because of high prices. The list is long. Overall picture paints a dark cloud over higher priced oil. Even if supply could be shrinking.
Bingo!!!
Shallow sand,
WTI average price in 2020 US$ was about $52 to $53/bo over the period from Jan 2015 to July 2021, Brent was $57.57/bo and I assume about a $5/bo spread on average between Brent and WTI over that period. If oil prices in the future are similar to prices from 2015 to 2021, World oil production is likely to decrease. I doubt oil prices will remain low if oil output remains at the current level or less. I believe that LTO survivor may agree, I think that may be what he meant by bingo, or simply that he agreed with all that you said. Perhaps he will clarify if I have misunderstood what is meant by bingo.
I did agree with everything Shallow sand wrote. The average price was $53 a barrel and there was over 200 bankruptcies and billions of dollars were lost. Easy money did not lead to profits or a healthy industry. $53 per barrel is not enough to keep the industry alive. I suspect that if the oil price keeps dropping the rig count and frac spread numbers will fall accordingly.
Thanks LTO Survivor,
Agree 100%.
Dennis.
I continue to be surprised that few seem to care that the majors have clearly stated either A. “Our oil production will fall from here,” or B. “We are going to try to hold production flat from here.”
I do not ever recall such a strategy by the likes of Shell, BP, Total, ExxonMobil and Chevron. Recall that BP gobbled up Amoco, Chevron ate Texaco and Exxon and Mobil merged. These companies are not only responsible for a large chunk of North American production, onshore and off. Who develops a large amount of second and third world country oil? Of course, they do, or did!
I also never thought I’d see the day where many of the little companies in our tiny little old depleted field could perform better financially than a company such as ExxonMobil. Yet it has been happening. ExxonMobil has borrowed a ton of money to stay afloat and pay its dividend. This is a company that for decades was considered bullet proof. Steve S posts here a lot about how the majors have went to crap. Yet our little producers here in this 116 year old field haven’t been borrowing. It’s not been fun, but nobody has BK yet that I am aware of. A couple have given up and sold out.
The majors seem to have decided, “screw it, we aren’t going to bend over backwards to produce more oil.” Yet the market could care less.
We all know this energy transition is going to take a long time and be very difficult.
A large percentage of USA citizens won’t even get a COVID vaccine. I suspect the same issues will arise when it comes to buying an electric vehicle. Lots of politics there. We have as our county’s number one employer an oil refinery. No surprise there are just three EV registered in our county last I checked. Lots of peer pressure here not to buy one.
So, if people won’t get a COVID shot because it seems “woke” or whatever stupid reason, I bet they also won’t buy an EV or put solar on their roof, even if same is in their best interest, if same are deemed “woke” or whatever proper term there is for a “liberal” policy. Never mind the real challenges to convert over 200 million vehicles from gasoline to electric.
I agree with LTO, we will need sustained $150 WTI to see a boom like we saw onshore lower 48. Even that price might not cause us to drill, at least for awhile. We’d just be happy cranking out the cash on the existing wells. Drilling is a lot of work. Lots of paperwork. Since we are being told not to drill anyway, why would we fight it?
I know, never say never.
It’s just this oil price complacency is stunning. Our President just asked OPEC for more oil. They didn’t respond.
It is apparent the USA isn’t going to willingly be the cop on the beat in the Middle East anytime soon. Is a politician going to send troops in if Iran attacks Iraq or KSA? Where does oil go if Iran invades Iraq or attacks KSA? Are we going to stop such actions after this Afghan debacle? We are apparently now an energy powerhouse, so why sacrifice our troops for KSA or Iraq?
So, with all of this oil is headed back to $50. Crazy! With the majors, Russia and most other oil producers of the world clearly stating, “We have peaked.” It’s nuts.
Shallow sand,
I agree with all you say.
A few caveats. After full approval by FDA there will be more of a tendency for businesses and schools to mandate the vaccine, this is a public health issue and they will be required. On EVs, once people see how well they perform, people everywhere will see them as superior, prices will drop so they will be cheaper than ICEVs (already TCO for similarly equipped cars is on a par).
I imagine there was a time in your town (well before you were born) when most people were skeptical about motor vehicles and used a horse or horse and buggy for transportation. Do you still see a lot of those in your town?
On solar panels and wind, these can be invested in by utility/energy companies, you don’t need them on your home, though in a storm with battery backup they are nice to have, though backup generators using propane work fine as well.
A good OP-ED by an infectious disease specialist at link below, share it with your unvaccinated friends (and enemies).
https://www.latimes.com/opinion/story/2021-08-17/vaccinated-covid-doctor-shot
It is surprising that oil prices are decreasing. Part of the problem is optimistic estimates of future oil output at low oil prices, I suppose the fact that even with low oil prices during the 2015 to 2019 period that we managed to have a glut in 2018-2021 makes people think there will be plenty of oil at $60 or $70/bo.
I agree with you and LTO Survivor that we will not see oil supply increase very much at $70/bo. OPEC can increase output another 1.5 to 2.5 Mb/d at $70-$75/bo, at that point it will take more output from Brazil, Canada, Norway, and the US to offset decline elsewhere in the World and to potentially raise output. I think it could happen at $80/bo, but I am doubtful that oil price will be enough for supply to keep up with demand after 2022. I don’t think $150/bo will be needed, but we may need $125/bo to balance supply and demand at first (say 2023 to 2024). Beyond that we might see oil prices rise to as much as $150/bo for Brent (12month average price) in 2020$ by 2027 or so, but much depends on whether people choose keep riding their horses.
Dennis.
You make good points about people eventually warming up to transitions.
Except, this time thus far seems different.
My parents recall going to the high school gym to receive polio shots in the 1950s. They do not recall the kinds of outcry against those that we are seeing now.
The first auto here in the county arrived in 1902, three years before oil was discovered in the county. The first auto owned by anyone in my family was purchased in 1923. My great-grandfather bought it. Family legend is the first time he drove it, he caught the soft top on a low hanging tree limb and ripped it. He allegedly never drove it again, and made his sons drive it. My grandfather and his brother drove it to the state fair in 1923, 150 miles away, with two older sisters. They were 13 and 15.
Point of the story, transition will be slow and people will be hesitant. Especially now that Facebook is available to spread nonsense myths like wildfire.
My feeling is – when this crashes more, we’ll see an Opec emergency meeting for first talking production lower, or even actions to postpone the increase.
Or even voluntary reduction from SA. They cannot afford 60 or 50$ oil. With this, they’ll help shale companies to stay alive.
Yes, another opportunity to say that they are cutting voluntarily and avoid announcing that they are past peak . Smoke and mirrors .
What’s happening to the price of oil, and why? It has been a while since I have seen a one day drop like this.
Covid? And the realization that extreme stimulus can’t last forever.
They can for a long time.
Japan is stimulating the last 20 years – all on the nod. It helps at least at a stagnation and companies going nowhere…
This is the month OPEC was slated to start increasing production. Perhaps we will learn that OPEC August production has jumped in September?
Schinzy,
See Figures 1 and 2 of post, OPEC output has increased every month since Feb 2021 and almost every month since June 2020, only 2 months saw falling output since June 2020 (output was 22244 kb/d in June 2020), Sept 2020 (output fell by 61 kb/d that month) and Feb 2021 when output dropped by 659 kb/d due to a Saudi cut of 951 kb/d. The net increase in OPEC output over the past 13 months is 4413 kb/d, they plan to add 400 kb/d each month until they reach capacity or market is balanced. If they do too much the market will be oversupplied in the first half of 2022 so I imagine they will stop adding when they get to about 27.5 Mb/d, if they go to 28.5 Mb/d by December 2021, they may need to cut back starting in Jan 2022 to avoid a supply glut in first half of 2022 (this assumes OPEC estimates of call on OPEC are accurate, which is doubtful),
Ron, it seems like the oil traders are worried about the World economy slowing down because of the Delta variant with attendant lower oil demand. I my opinion, this worry is overblown.
For anyone interested in a clear-eyed look at where the world is in the long energy transition (survival) challenge the report linked here is an excellent fact based summary of where things stand.
https://am.jpmorgan.com/content/dam/jpm-am-aem/global/en/insights/eye-on-the-market/future-shock-amv.pdf
From pg 29 of this report is a chart showing the developing gap between oil production and demand (under a series of scenarios), with a Seneca ‘slump’ in oil supply projected. [source BP 2019].
Clearly this is just one version of a simulated outcome, but the message is clear- large and growing imbalance in demand and supply of oil.
Hickory,
That slump in supply is under an assumption that there is no new development of oil supply, essentially capex=0. It is not a realistic assumption by any means imho.
Agree, but the point they make is valid.
Hickory,
People will decide where it is best to allocate capital, if there is a lack of capital, there will be a shortage of oil, it will lead to higher oil prices, higher profits, and capital will flow back to the oil sector. The industry was starved of capital because too much capital had been applied leading to over supply of oil, the market tends to balance this stuff out over time and perhaps becomes a little better at capital allocation over time.
I agree that higher prices will drive more capital toward production.
But I am skeptical that the reintroduction of capital will produce enough oil to meet demand, and in a time frame of relevance.
I think the report presented by JPM does a good job spelling out that theme, as well as many others. They hit the head of a lot of nails.
Dennis , CAPEX is not zero ,yes but it is also not enough . Medical journals recommend drinking 8 glasses of water per day . You can get by with drinking one , not going to die but if you continue along the path for a year you are going to have some sort of a physical disfunction . That is what is happening . We are now feeling the effect of the long period of CAPEX shortfall in the past . This CAPEX shortfall will continue into the future with all the headwinds like ESG etc .
Hole in head,
If oil prices are low you may be correct, if they are high perhaps not, high oil prices will both increase supply (with some lag) and decrease demand (also with some lag). The market finds a way to bring supply in line with demand with higher or lower prices. Not a perfect system, just the best found so far.
I don’t think it is the best system found so far. I think it is a terrible system and the only reason people have accepted it for so long is growth in economic production which I think has come to an end. I think we will have a reset of our monetary system in the coming years and I am hopeful that some innovative ideas will be considered.
SCHINZY
All of the isms work on the concept of more. Be it capitalism, socialism, communism, fascism. They are all obsolete in a world where there is less not more. None of them work.
@HHH
Communism and fascism will work.
The first one will find a social group that has the guilt and will eliminate them. That takes a few years. If that does not work, they’ll take the next group.
The later one will start a war. If it’s a small, this will not work. Than they start the next. Or eliminate some people, or both.
Sometimes the communsim will start a war, too. Most times against “evil” capitalism. This can be another comunistic country, too – but with the wrong leader.
All this won’t help against a shrinking economy – but it will keep the people busy and in fear.
HHH,
Agreed. Could go into this discussion at length, but its the wrong thread.
The text from the report that is just before the chart above in Hickory’s comment is:
This is the “oil wedge” chart: it shows different projections of future oil demand and the amount of oil supply from existing fields assuming no new development. Even in the IEA’s highly ambitious Sustainable Development scenario, world oil demand in 2040 is still twice the level of supply from existing fields. Is everyone sure that we should starve this industry of capital starting now?
‘’ Is everyone sure that we should starve this industry of capital starting now?”
Love it. Are you sure it’s from JPM??
Roger,
Author is
MICHAEL CEMBALEST | JP MORGAN ASSET AND WEALTH MANAGEMENT
I assume this means he works at JP Morgan.
Maybe OPEC Plus said NO to Joe to increase production. However there are other ways to drop the price because they say the paper boys have more leverage than the physical suppliers.
Could SA be dumping paper contacts. Just a guess.
Note that the futures contract are still in backwardation which implies that demand is strong and sending the message refiners want crude now, not later
Ovi,
Why would Saudis want lower oil prices? They have cut back output in order to raise oil prices since May 2020. The explanation strikes me as unlikely.
Dennis
I realize that. However this could just be a short term thing to appease Joe. I still think they need $80 oil on average and they could reverse this rather dramatic drop by buying contracts and then getting out of the paper world and let the traders do their thing.
I just can’t see what has changed in the past week to cause such a rapid drop in WTI. The drop in crude inventories reported by the EIA yesterday was larger than expected.
This just made me think that something out of the norm was happening.
Today was just a broad risk-off kind of day. It wasn’t just oil that fell. I don’t believe any manipulation of price was happening here. Inflation is currently a problem. And not a small problem. So much of a problem that high prices are getting rejected by consumers and producers. High prices are deflationary in the current environment. High price are like break on the economy.
WTI chart looked like a technical move to me. Flushed out some weak hands in a low volume area. High volume area is the support zone I was talking about. Price pretty much hit what I call an air pocket today. Just nothing there support wise to keep it from falling.
As US dollars start flowing back out of virtually everything they flooded into over last year and a half. The reversal of the reflation trade I’ve mentioned before. Prices will continue to fall. Won’t be in a straight line down never is.
HHH, Ovi has already informed that a new post is upcoming but I am risking it . What if China starts a ” gold backed yuan ” ONLY for international trading . Something like a two track yuan . Would that be the end of the ” petro dollar ” ? Tks Ovi for the advance notice .
P.S ; If Ovi makes the new post we can continue tis thread there .
“…because they say the paper boys have more leverage than the physical suppliers.”
That works until there’s a physical shortage…then, burning fiat isn’t a viable option. [Hence, the “shale revolution”…which was as close to burning fiat as we will ever get; but it’s done].
It’s more like a chicken game China is playing with Opec, burning more from storage for at least the last 4 (high price) driving seasons month and massive reducing purchases. Delta adds on this now.
They have the power – and storage filled up cheap.
When they or others like India come back massive on the physical markets (or Opec counters) – the bottom is there, but Delta is making the rythm for now, with US numbers still on the climb.
However, paper market was already not so bullish before the down move, which prevented more violent selloffs so far.
https://twitter.com/BrynneKKelly/status/1427999825455419405
https://asia.nikkei.com/Business/Markets/Commodities/China-s-oil-imports-plummet-20-for-2nd-straight-month-in-July
ROGER —
All this panic about “fiat” currency ignores the real reason interest rates are so low — the flood of cheap labor into the increasingly interconnected world market is pushing down real costs, and that makes capital cheap.
Added to that, technical change is allowing services to be delivered at much lower material costs than ever before: For example there isn’t enough copper around to provide a billion Africans with land lines in their vast continent, but now they have mobile so it doesn’t matter.
The world has no idea that this is the new ERA of the PANDEMIC. Ancient Civilizations, like the Roman Empire, were inflected with Pandemics during the Collapse.
This COVID-19 Virus seems to be the RUSSIAN-ROULETTE of viruses. Some bullets have no impact on the victim, while others die from it. With the ongoing mutation of this and subsequent viruses-pandemics, the world better get used to BUSINESS AS USUAL is over.
China has closed one of its major ports due to Delta Variant and is dealing with a Massive amount of Rain and Floods as Mother Nature has other plans for the CCP who thought transitioning an agricultural country into a High-tech Metropolis in a few decades, wasn’t going to come back to haunt them.
Now, we are seeing Asian countries, that were virtually LEFT ALONE last year from the ravages of COVID are now getting it in SPADES.
Malaysia, Thailand, and even Indonesia are experiencing record cases and deaths, while each country is in different stages of Lockdowns.
Don’t expect the future to look anything like the past….
AND… here come SERIOUSLY VOLATILE OIL PRICES.
steve
There will be a Non-OPEC update within the next 24 hours
Affordability . Whether houses , cars ,diamonds or oil . If you can’t afford it you can’t have it .
‘Capex for the oil industry hasn’t declined, rather it has accelerated in the decade (2010-2020) and all gone towards Shale Oil’
Are there any new prospective projects in the USA that could be profitable at $70/b?
Hickory,
Permian basin tight oil wells ( the average 2019 well) are profitable at $62/bo at wellhead and $67/bo at refinery gate (assuming a $5/bo transport cost.) The annual rate of return would be about 30% over the life of the well. In other words, for a $10 million dollar capital cost for a new well (full cycle cost) will be roughly equal to the discounted cash flow over the life of the well when using an annual discount rate of 30%. I assume an oil price of $62/bo over the life of the well, royalty and tax cost of 28.5%, average OPEX cost over the life of the well is $14.27 per barrel, natural gas assumed to sell for $1.80/MCF at well head and NGL sells for $20.46 per barrel. Note that I expect well productivity will decrease over time as sweet spots become fully drilled, so the “breakeven” price at a 30% discount rate will increase over time. Note also that I assume the average well is shut in at 20 bopd output, which happens at 145 months after first flow for the average 2019 Permian basin horizontal oil well at a cumulative output of 406520 barrels. The well profile uses actual shaleprofile data for the first 17 months (cumulative output is 193007 after 17 months) and then I use an Arps hyperbolic fit to the data to estimate future output for month 18 to month 66. The Arps has q_nought at 52542, b=1.101, and D_nought at 0.60826, after month 66 I assume exponential decline at an annual rate of 15%. At month 66 cumulative output is 328856 and daily output is 54.6 bo/d (monthly average for month 66).
For my Permian basin model with 450 well maximum completion rate the last well is completed in 2041 and estimated cumulative output from the well is 332 kbo over its life. A wellhead oil price of $74/bo over the life of the well at a discount rate of 30% is needed for this less productive well to reach “breakeven”. NG price same as earlier $1.80/MCF and NGL is assumed to be 33% of wellhead oil price ($24.72/b).
So Permian basin tight oil is an ongoing project that is profitable at $70/bo.
Ralph Nader ” Unsafe at any speed ”
Dennis ” Permian basin tight oil is an ongoing project that is profitable at $70/bo. ” Is it ?
😉
Well that is nice to hear Dennis, for the sake of economic stability.
“So Permian basin tight oil is an ongoing project that is profitable at $70/bo.”
It follows that there should be no problem with raising capital then , since $70 seems highly likely going forward….
So, beyond the ongoing shale project I take it the answer is no ? (Are there any new prospective projects in the USA that could be profitable at $70/b?)
Hicks , 2010-2020 is history . Shale fooled everyone . It was a Ponzi from day one . What got me started was Art Berman’s quote ” Shale and fracking is not a birthday party but a retirement party ” . It is the future CAPEX that is the issue . As the JPM analyst says ” Is everyone sure that we should starve this industry of capital starting now? ” .
I am sure that CAPEX in the oil industry is not coming . The music is playing but the party is over . As to oil projects in USA profitable at $ 70 in the USA , the answer is nil, nada , nulla , shunya etc .
U. of Houston Energy Fellows say $70 is shale oil’s full cycle breakeven costs.
https://www.forbes.com/sites/uhenergy/2021/08/18/oil-price-predictions-bank-on-how-quickly-shale-production-resumes/?sh=2bec90885e8f
Of course the idea is not simply to breakeven, but to be profitable. And “profitable” now must be defined by the ability to pay down ALL debt, wherever it came from, make lenders happy with returns/dividends and the ability to replace declining reserves from net revenue, without getting deeper in debt. This in the face of increasing costs, declining well productivity, anti-oil public sentiment, increasing environmental regulations and fewer and fewer drilling locations that are not subject to pressure depletion, rising GOR and declining liquids production.
That will actually take well over $100 oil, sustained.
30% ROI’s (?!!) over 15 years meets the definition of profit, but its not nearly profitable enough.
I trust people do not accept the false premise that $70 oil is a magic fix for US shale; try and remember it GOT in the pickle it’s in with oil prices higher than that and the hearts of all of America’s shale oil watermelons are eaten, gone; we’re now chomping our way toward the rinds.
Mike my analysis was specifically for Permian basin. You have said in the past a well needs to pay out in 36 months to be worth doing. For the average 2019 Permian well payout is at 32 months. At a 30% discount rate, discounted net revenue is $10 million at 81 months. when average well is producing 45 bopd.
Dennis , a question . The TOD site and also peak oil com have the facility to go thru old posts of a commentator .
So let us presume if I remember something which HHH posted and need it for reference all I did was click on HHH and all his old posts would appear . Does POB has this feature ? If not is it possible to incorporate . This will avoid the hassle of sifting thru old posts . Thanks .
TOD was a marvel of functionality and usability.
When TOD died, I was involved with a group that wanted to do what Ron did here (I was a UX Designer at the time). We wanted all that functionality that you talk about. Sadly, TOD was a proprietary system built on an old version of Drupal; I was told it couldn’t be updated. So it can’t be licensed, and would have been expensive to duplicate.
POB is a WordPress site, and I have never seen a WordPress theme with functionality anywhere close to TOD’s.
Hole in Head,
Sorry no the search feature does not work well.
A new thread on Non -OPEC production has been posted
https://peakoilbarrel.com/april-non-opec-oil-output-declines/
A new open thread for Non Petroleum comments has been posted
https://peakoilbarrel.com/open-thread-non-petroleum-august-20-2021/