November World & Non-OPEC Oil Production

By Ovi

Below are a number of Crude plus Condensate (C + C) production charts, usually shortened to “oil”, for oil producing countries. The charts are created from data provided by the EIA’s International Energy Statistics and are updated to November 2023. This is the latest and most detailed/complete World Oil production information available. Information from other sources such as OPEC, the STEO and country specific sites such as Brazil, Norway and China is used to provide a short term outlook. 
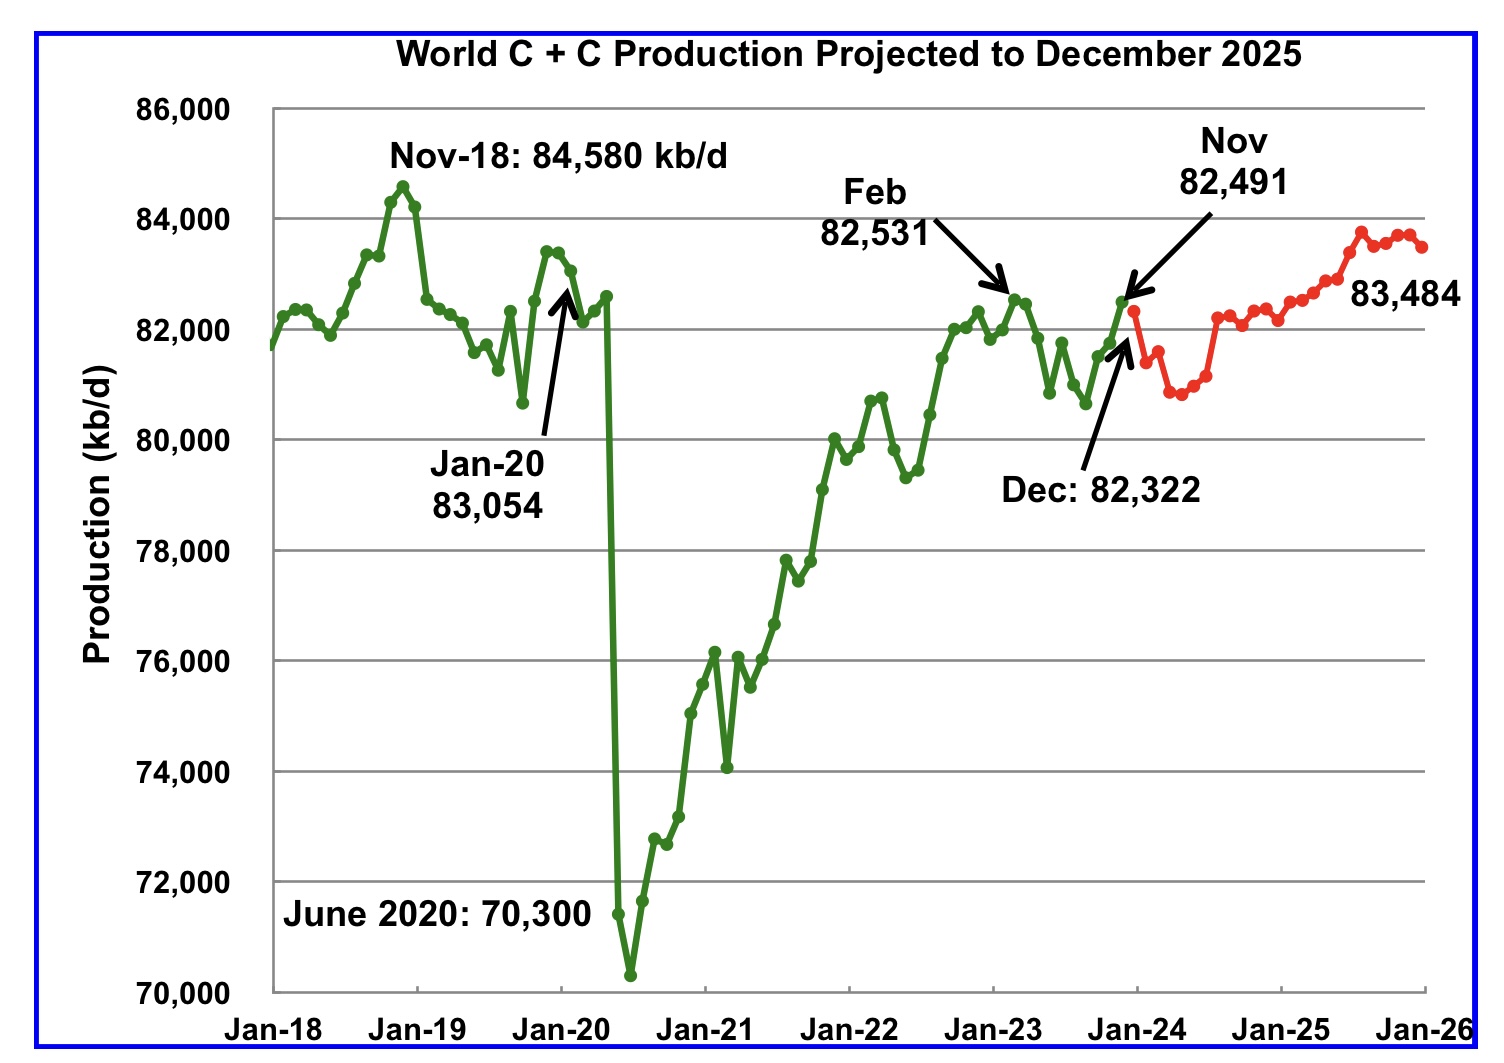
World oil production increased by 745 kb/d in November, green graph. The largest increase came from Canada, adding 360 kb/d. December World production is projected to drop by 169 kb/d to 82,232 kb/d.

Read More
October World Oil Production Continues to Rebound

By Ovi

Below are a number of Crude plus Condensate (C + C) production charts, usually shortened to “oil”, for oil producing countries. The charts are created from data provided by the EIA’s International Energy Statistics and are updated to October 2023. This is the latest and most detailed/complete World Oil production information available. Information from other sources such as OPEC, the STEO and country specific sites such as Brazil, Norway and China is used to provide a short term outlook 

World Oil Production and Projection

World oil production increased by 302 kb/d in October, green graph. The largest increase came from Canada and Kazakhstan with both adding 123 kb/d each.

Read More

US October Oil Production Held Steady

By Ovi

All of the Crude plus Condensate (C + C) production data for the US state charts comes from the EIAʼs Petroleum Supply monthly PSM which provides updated information up to October 2023.

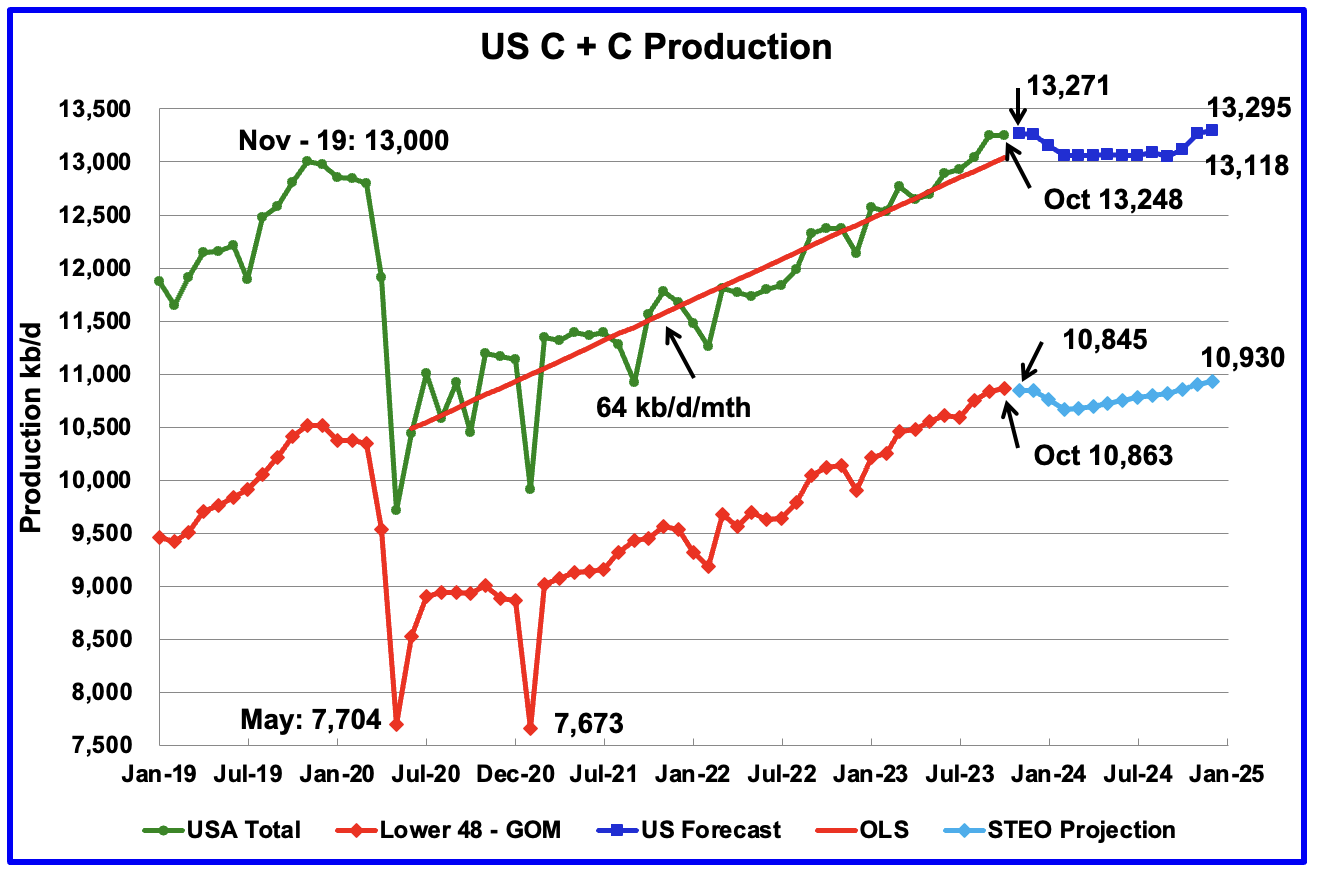
U.S. October oil production decreased by 4 kb/d to 13,248 kb/d. The decrease was primarily due to decreases in the GOM and North Dakota being partially offset by increases in Texas and New Mexico. Note that September production was revised up from 13,236 kb/d to 13,252 kb/d.

Read More

US May Oil Production Little Changed

By Ovi

All of the Crude plus Condensate (C + C) production data for the US state charts comes from the EIAʼs Petroleum Supply monthly PSM which provides updated information up to May 2023.

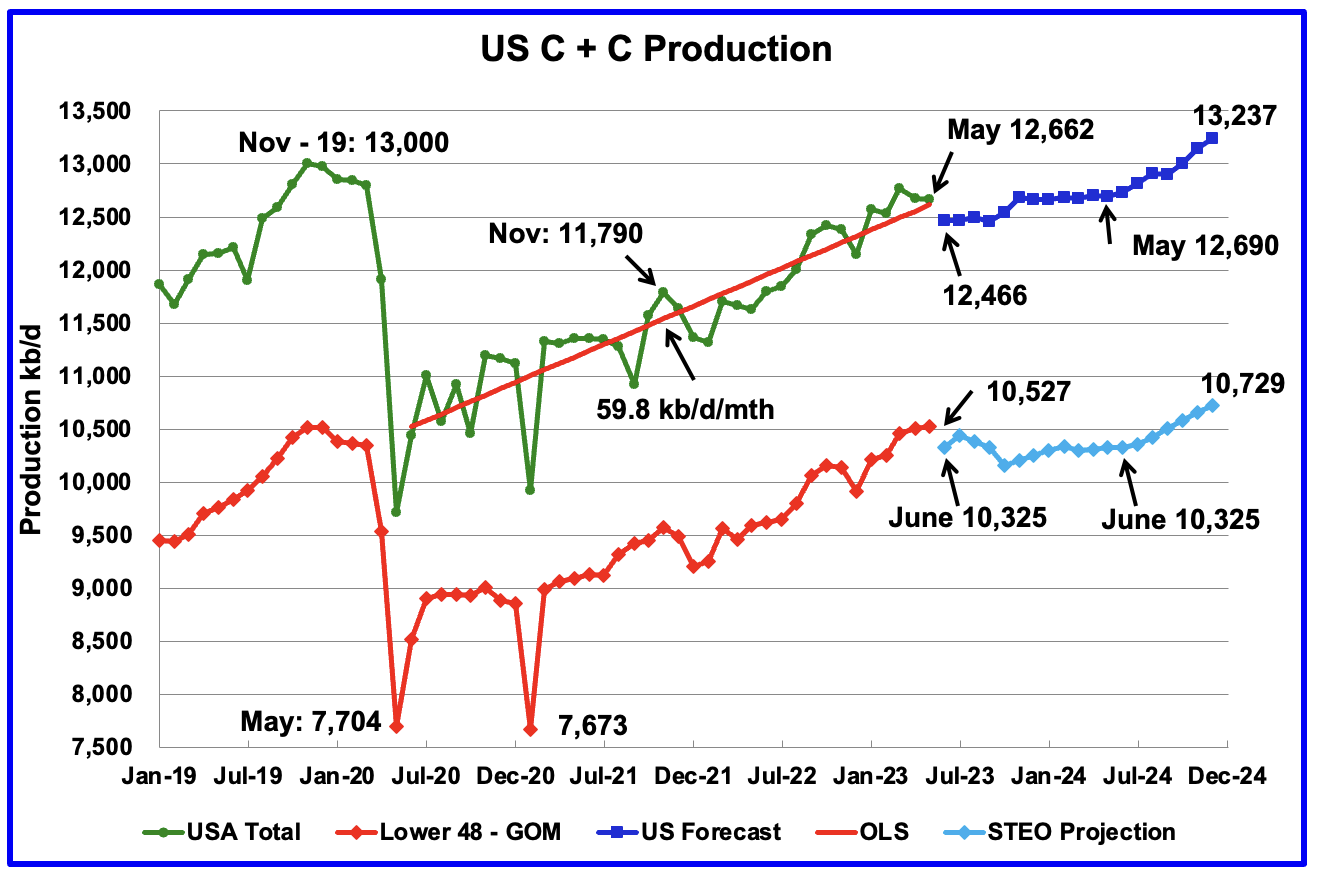
U.S. May oil production decreased by 15 kb/d to 12,662 kb/d, an atypical small change. The small change is primarily due to the upward revision of April output from 12,615 kb/d to 12,677 kb/d, an increase of 62 kb/d.

Read More

GOM Drop Drops US April Oil Production

A guest post by Ovi

All of the Crude plus Condensate (C + C) production data for the US state charts comes from the EIAʼs Petroleum Supply monthly PSM which provides updated information up to April 2023.

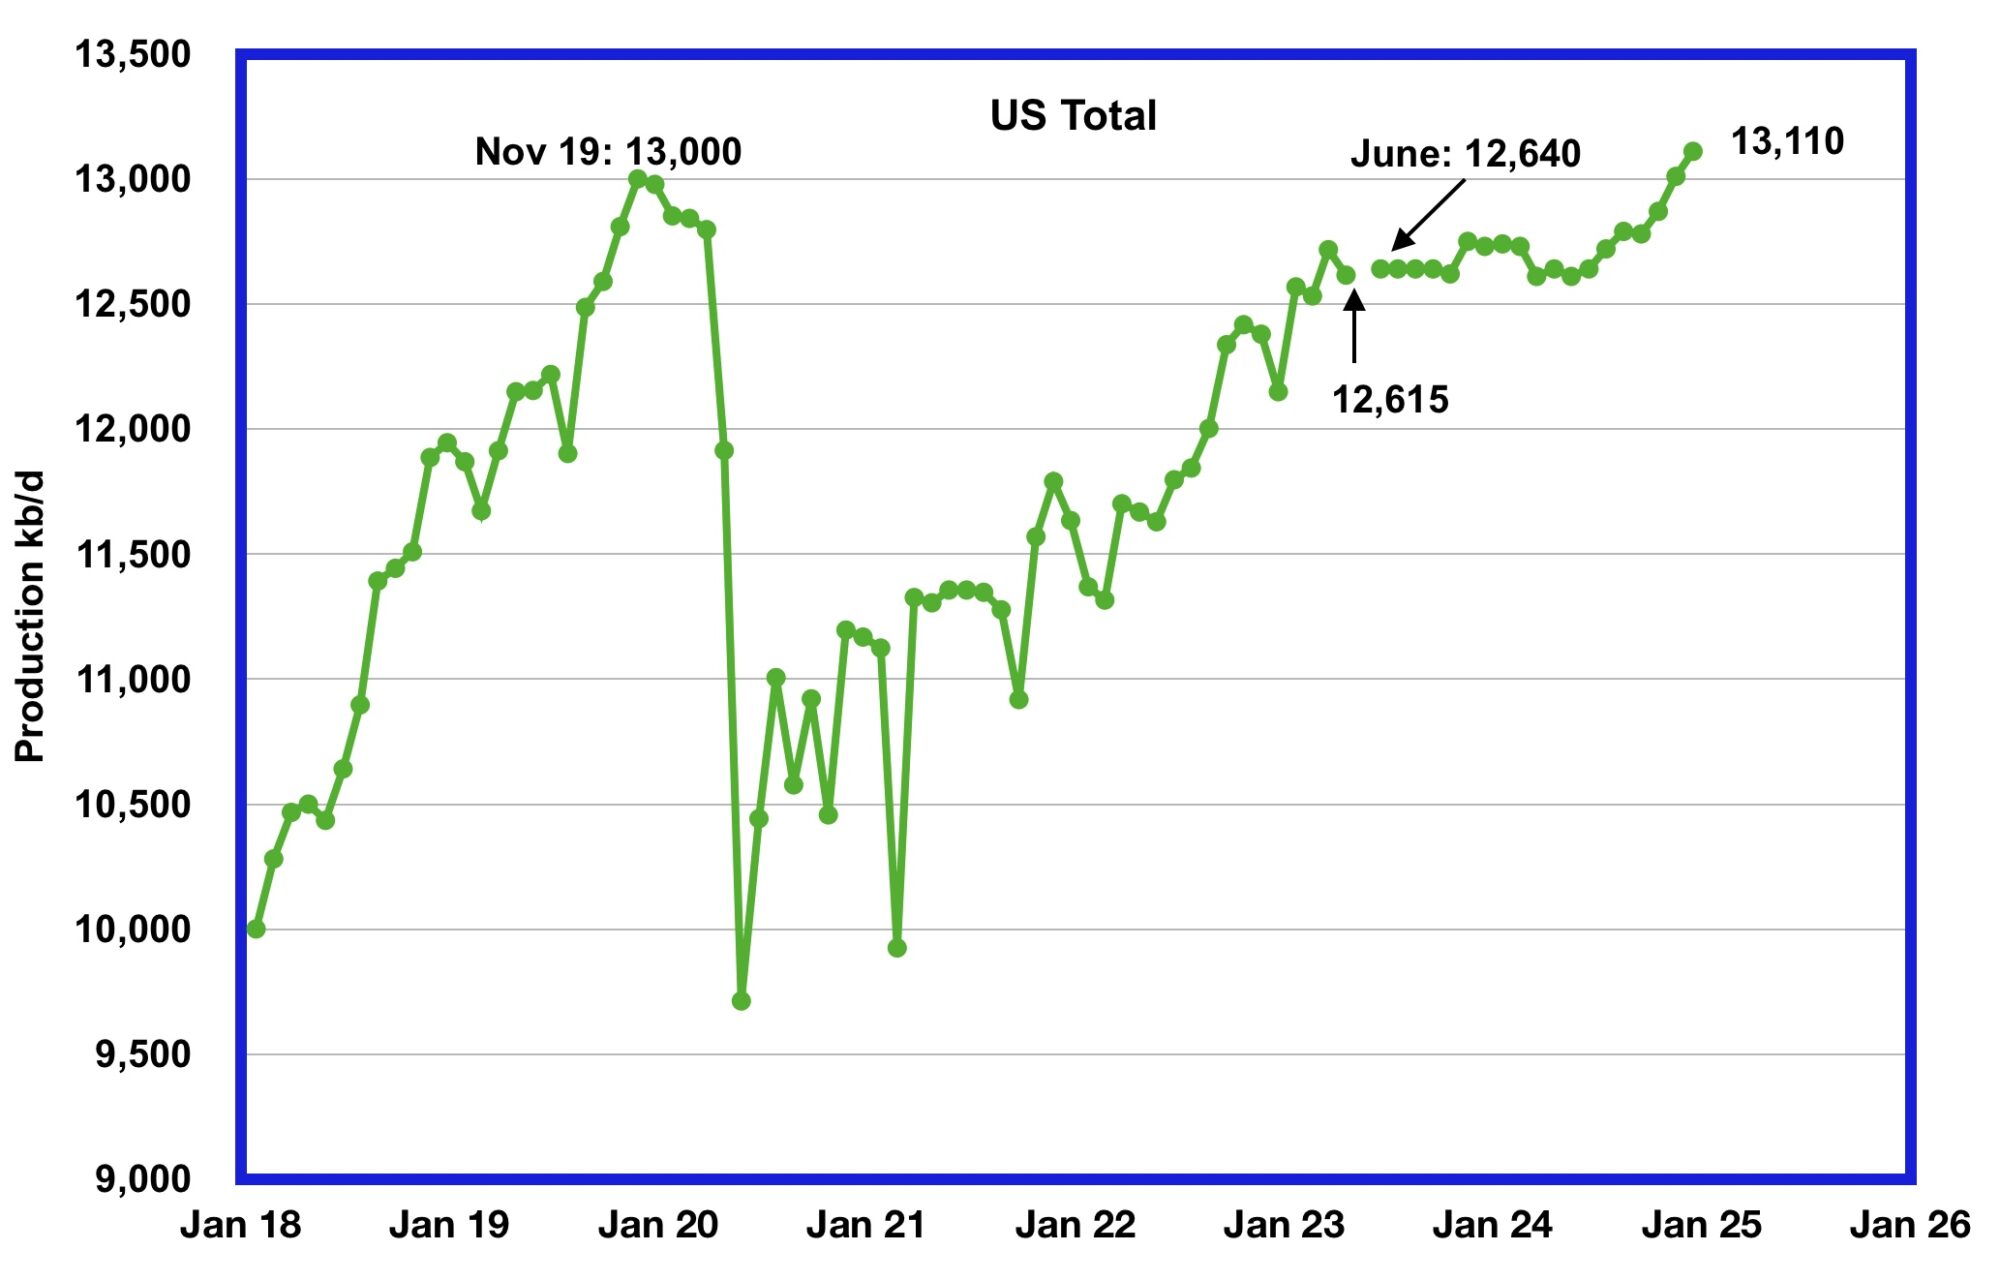
U.S. April oil production decreased by 102 kb/d to 12,615 kb/d, a drop from last month’s post pandemic high of 12,717 kb/d. Note that March’s output was revised up by 21 kb/d from 12,696 to 12,717 kb/d.

Read More