US Oil Production Nears Previous Peak

The EIA’s Monthly Energy Review came out a couple of days ago. The data is in thousand barrels per day and the last data point is July 2015.

Consumption

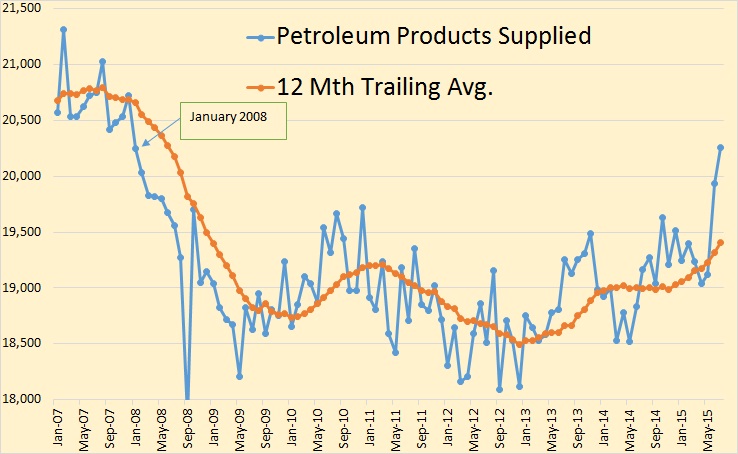
US consumption of total liquids, or as the EIA calls it, petroleum products supplied, reached 20,000,000 barrels per day for the first time since February of 2008.

Something I never noticed before, consumption started to drop in January 2008, seven months before the price, along with world production, started to drop in August 2008. This had to be a price driven decline. Could the current June and July increase in consumption be price driven also?
Read More

Bakken April Production Data

The North Dakota Industrial Commission is out with the April production Data for the Bakken and all North Dakota.

Bakken Production

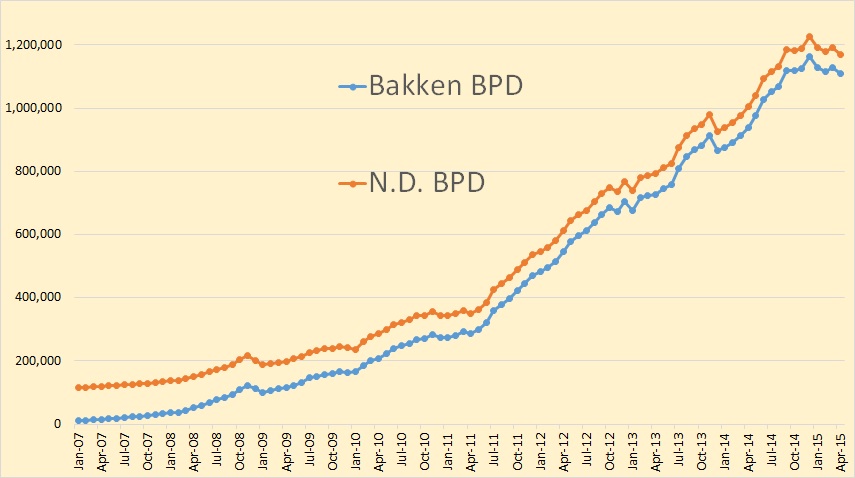
Eight month of flat to down production from the Bakken.

Bakken Amplified

I have shortened the data to 16 months here to give a better picture of what is really happening. North Dakota reached an 8 month low. North Dakota, in April, was 17,631 barrels per day below their September 2014 production. The Bakken was only 11,024 below September 2014 so conventional wells seem to be dropping off pretty fast.

Read More

US Crude Storage, Production and Other Peak Oil News

There has been a dearth of oil production data lately so I have been scratching to find something to post. So I have gathered this and that in hopes of making it interesting.

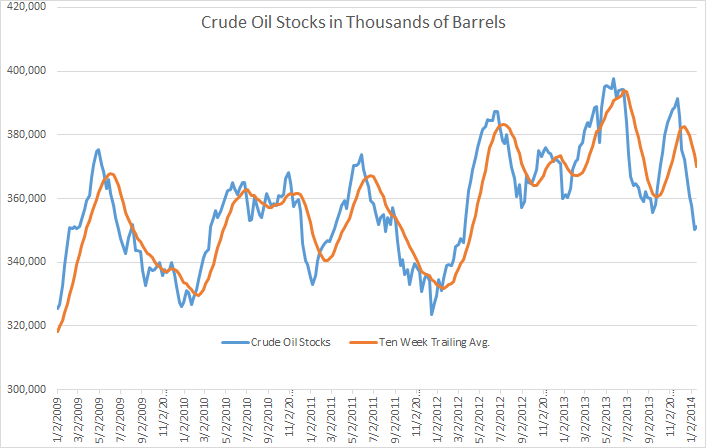
US stocks had the first uptick in nine weeks, gaining 990 kb. (See the slight uptick in the blue line.) But they still stand at their lowest point in 21 months.

Stocks

Incidentally the EIA’s Weekly Petroleum Status Report had US crude oil production down last week. Their estimate of production went from 8,159 kb/d to 8,052 kb/d. That was the first decline in nine weeks. Of course that is really just a guess by the EIA.

Based on the weekly US production data I have charted US production through Januay 2014. The data through November 2013 is from the EIA’s Monthly Energy Review. The data for December and January is from the Weekly Petroleum Status Report, link above. That data is through January 17th. I have estimated the rest of the month.

Read More