By Ovi
Below are a number of Crude plus Condensate (C + C) production charts, usually shortened to “oil”, for oil producing countries. The charts are created from data provided by the EIA’s International Energy Statistics and are updated to October 2023. This is the latest and most detailed/complete World Oil production information available. Information from other sources such as OPEC, the STEO and country specific sites such as Brazil, Norway and China is used to provide a short term outlook
World Oil Production and Projection
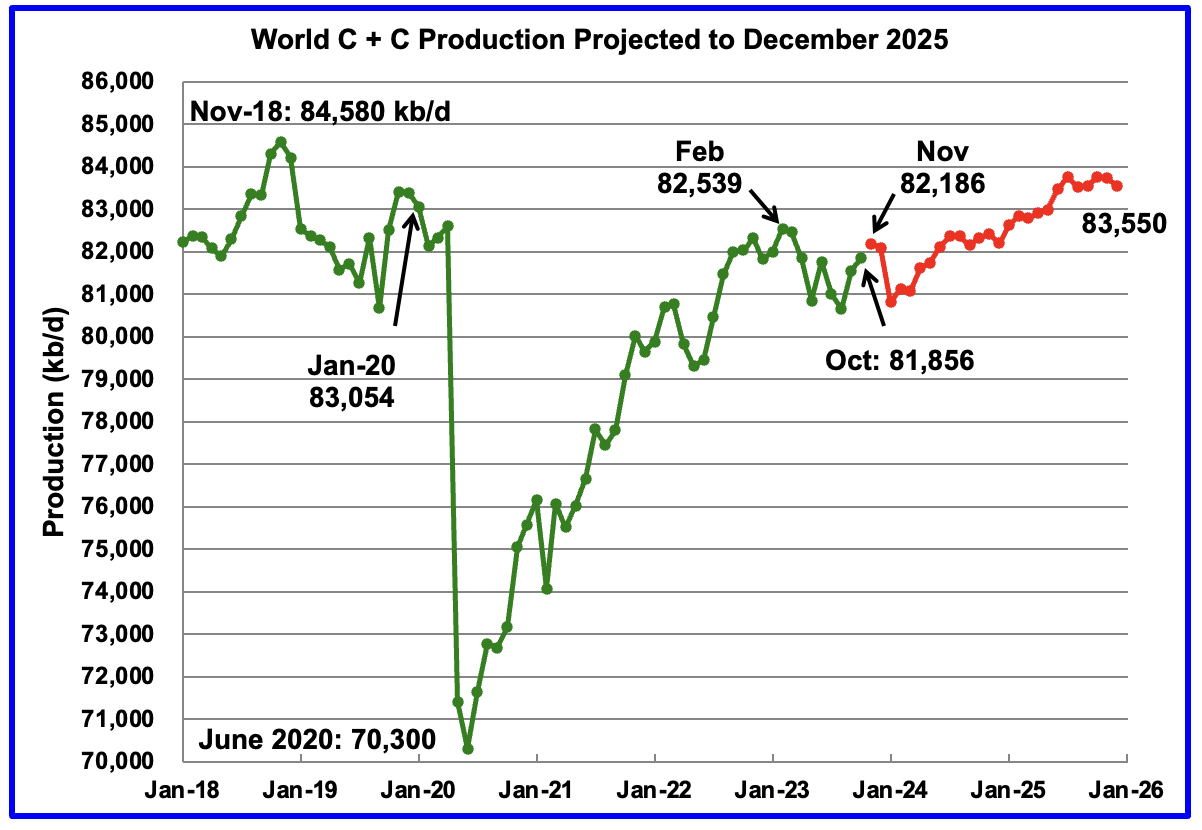
World oil production increased by 302 kb/d in October, green graph. The largest increase came from Canada and Kazakhstan with both adding 123 kb/d each.
This chart also projects World C + C production out to December 2025. It uses the February 2024 STEO report along with the International Energy Statistics to make the projection. (Red markers).
The red graph forecasts that World crude production in December 2025 will be 83,550 kb/d and is 1,030 kb/d lower than the November 2018 peak.
From November 2023 to December 2025, production is estimated to increase by 1,364 kb/d or an average of 59 kb/d/mth. Part of the big drop projected for January 2024 is associated with the expected drop in US January production due to bad weather.
Over and above the projection to 2025, keep in mind that OPEC + has close to 3,000 kb/d of cuts in reserve if required.
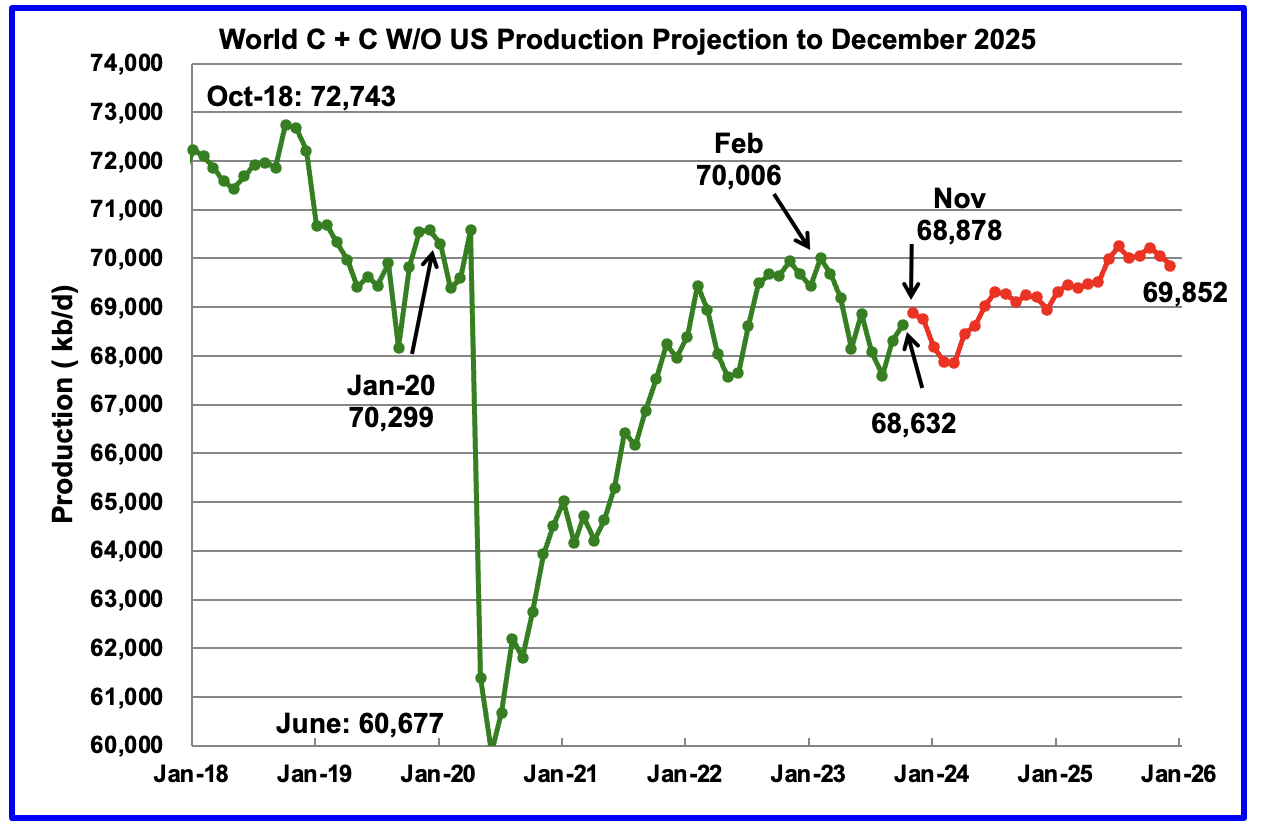
World without US October oil output increased by 304 kb/d to 68,632 kb/d. November is expected to add 246 kb/d to 68,878 kb/d.
Note that December 2025 output of 69,852 kb/d is lower than February 2023.
World oil production W/O the U.S. from November 2023 to December 2025 is forecast to increase by a total of 974 kb/d.
A Different Perspective on World Oil Production
Instead of dividing the World oil producing countries into OPEC countries and Non-OPEC countries, this section divides the countries into two groups on the basis of their production capacity. The division will be The Big Three, US, Saudi Arabia and Russia, and the Rest, i.e. the World oil producers W/O the Big 3. The top producer in the Rest, currently Canada, produces close to half of the lowest producer in the Big Three.
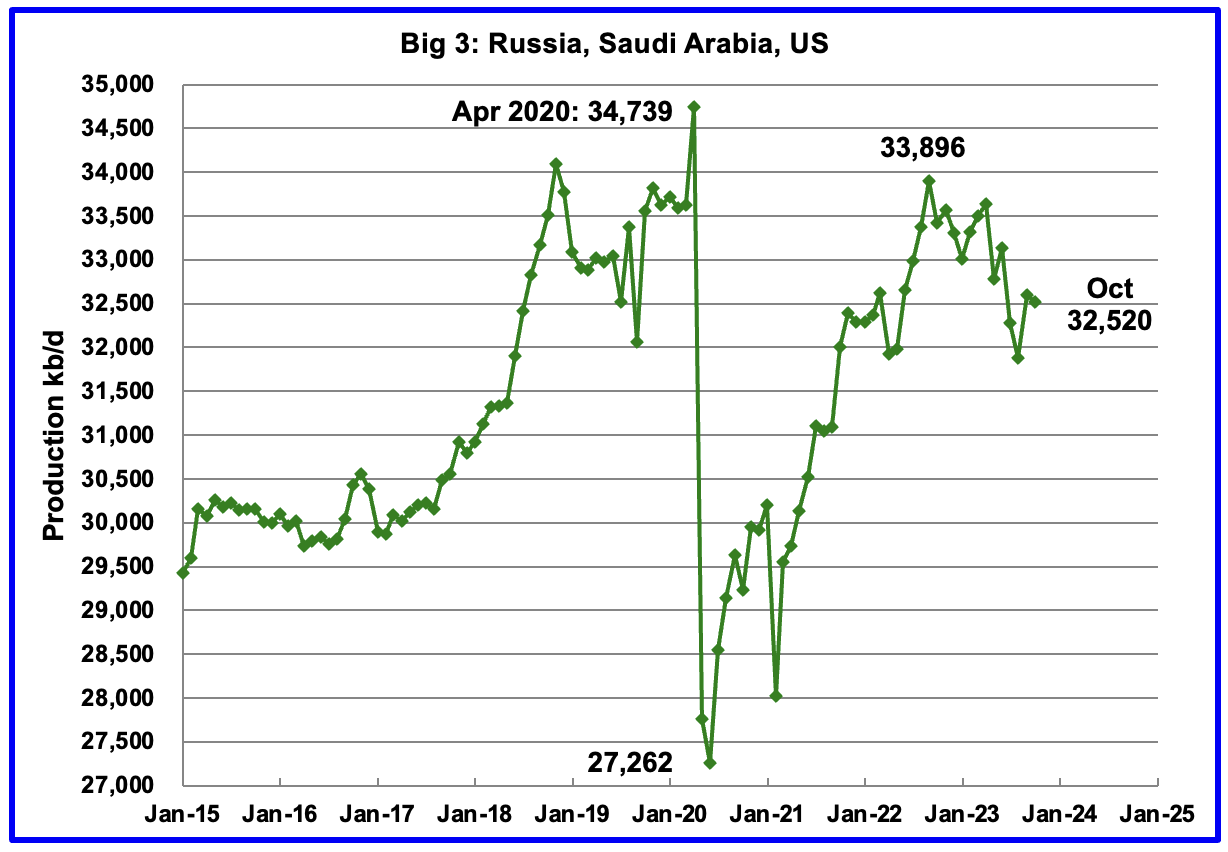
Peak production in the Big 3 occurred in April 2020 with a rate of 34,739 kb/d. The peak was associated with a large production increase from Saudi Arabia. Post covid, production peaked at 33,896 kb/d in September 2022. The production drop since then is due to cutbacks in Russia and Saudi Arabia.
October production from the Big 3 decreased by 74 kb/d to 32,520 kb/d.
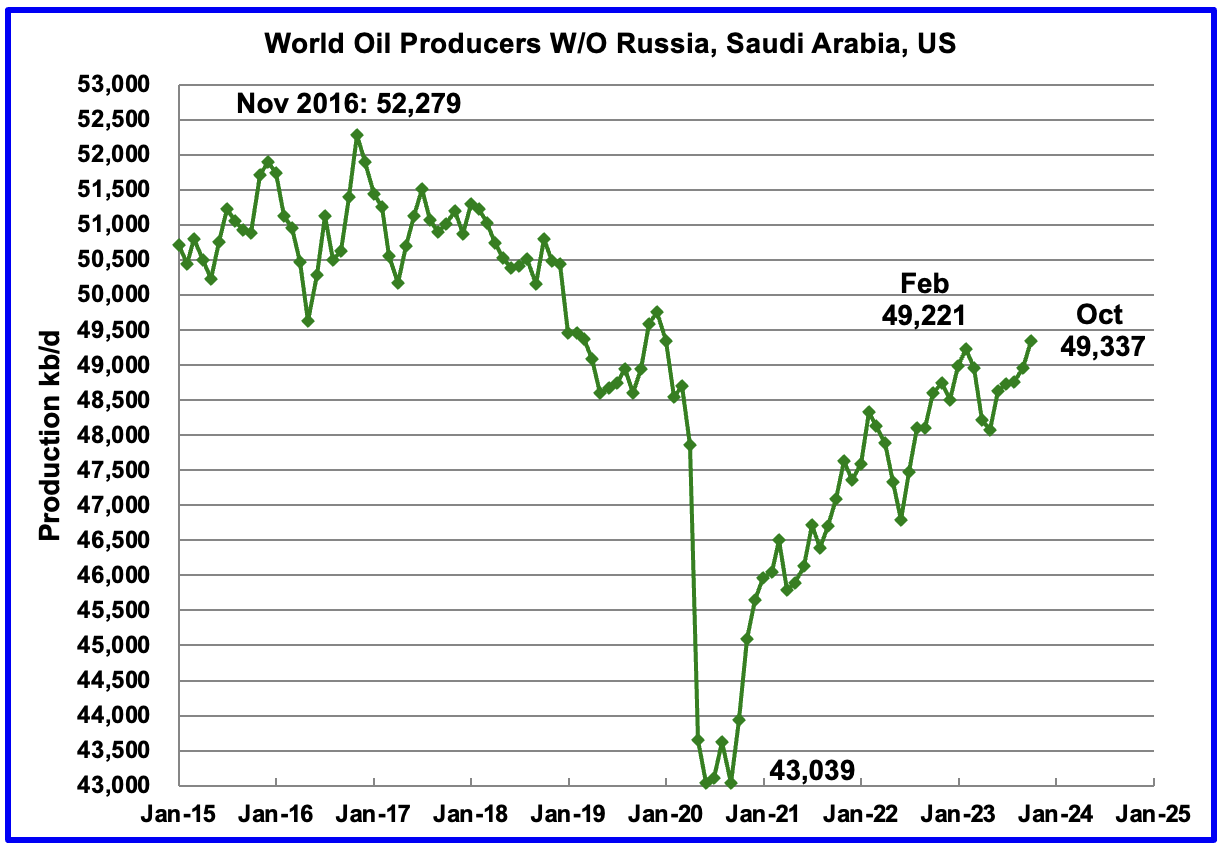
Production in the Rest has been slowly increasing since the low of September 2020 at 43,039 kb/d. In February 2023 production rose to a post covid high 49,221 kb/d. Output in October was 49,337 kb/d, an increase of 375 kb/d over September and exceeding the February 2023 high by 116 kb/d.
Production is down 2,942 kb/d from November 2016.
World Oil Countries Ranked by Production
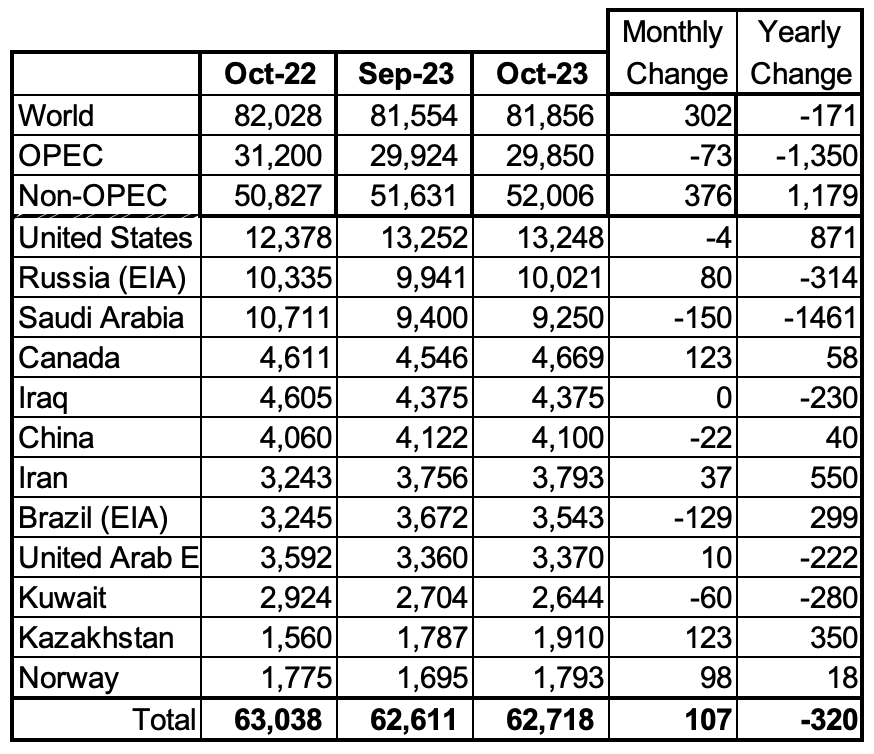
Above are listed the World’s 12th largest oil producers. In October 2023, these 12 countries produced 76.6% of the world’s oil. On a MoM basis, these 12 countries increased production by 107 kb/d while on a YOY basis, production dropped by 320 kb/d. On a YoY basis, note how the size of the Saudi Arabia production drop overshadows the US increase.
Non-OPEC Oil Production Charts
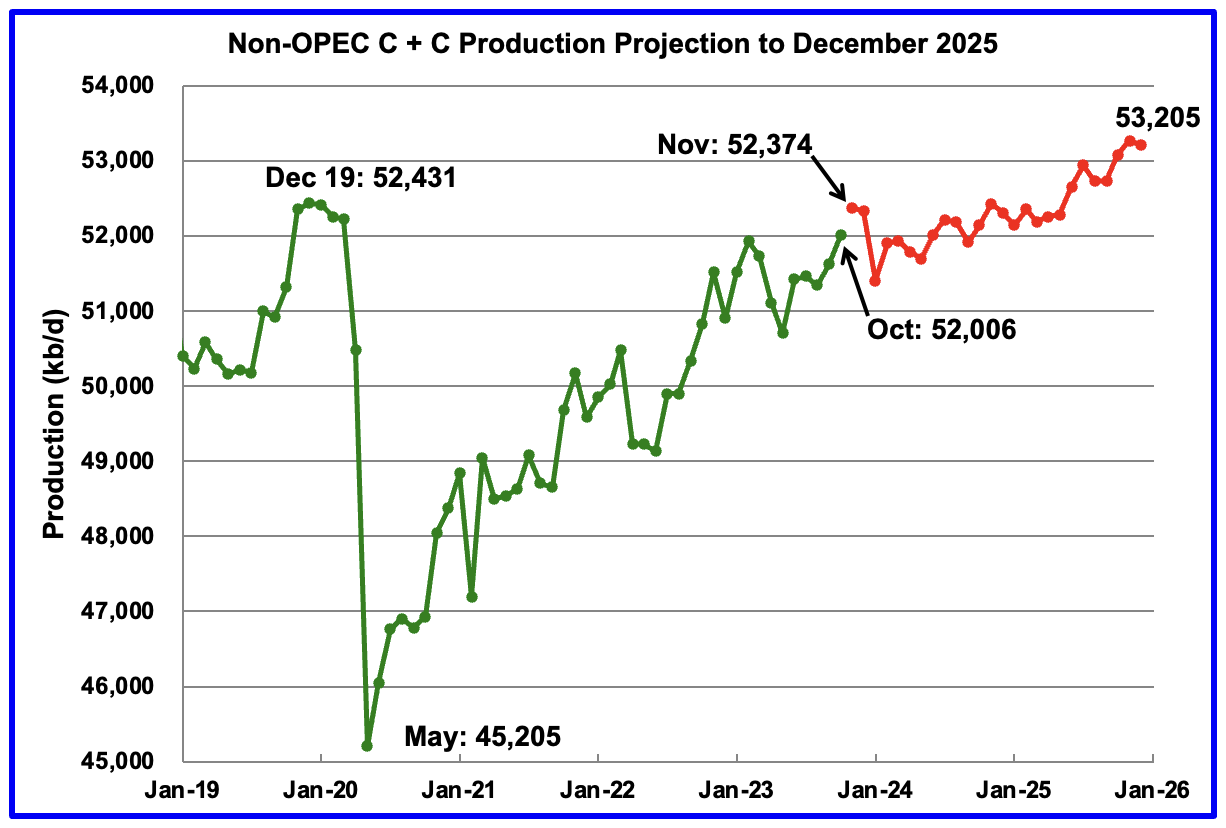
October Non-OPEC oil production rose by 376 kb/d to 52,006 kb/d. The largest increases came from Canada and Kazakhstan.
Using data from the February 2023 STEO, a projection for Non-OPEC oil output was made for the period November 2023 to December 2025. (Red graph). Output is expected to reach 53,205 kb/d in December 2025, which is 774 kb/d higher than the December 2019 peak of 52,431 kb/d. The updated December 2025 output is close to 100 kb/d higher than reported in the previous world report.
From November 2023 to December 2025, oil production in Non-OPEC countries is expected to increase by 831 kb/d. According to the STEO, the major contributors to the increase are expected to be the US and Guyana.
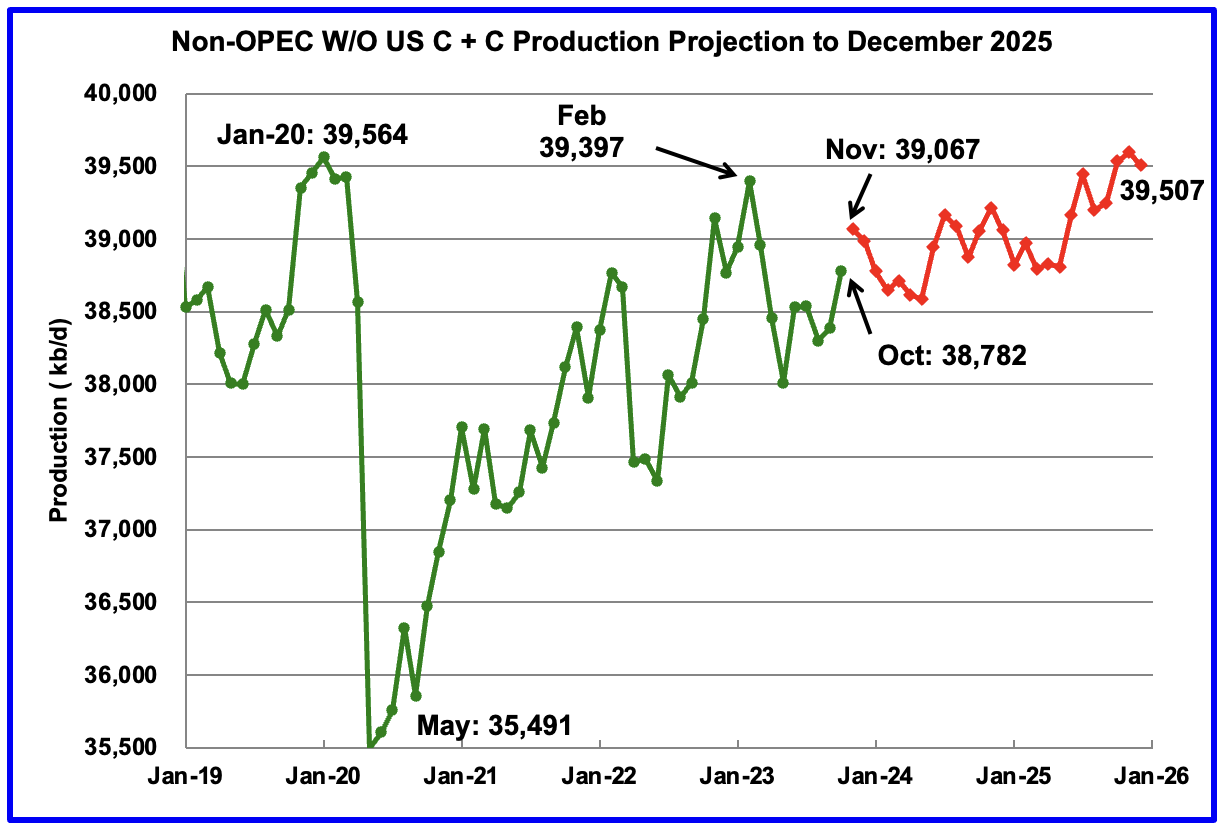
October Non-OPEC W/O US production increased by 298 kb/d to 38,782 kb/d. November production is projected to increase by 285 kb/d over October.
From November 2023 to December 2025, production in Non-OPEC countries W/O the US is expected to increase by 440 kb/d.
Note that December 2025 output is 110 kb/d higher than the February 2020 high of 39,397 kb/d. It is also 57 kb/d lower than the pre-pandemic high of January 2020, 39,564 kb/d.
Non-OPEC Oil Countries Ranked by Production
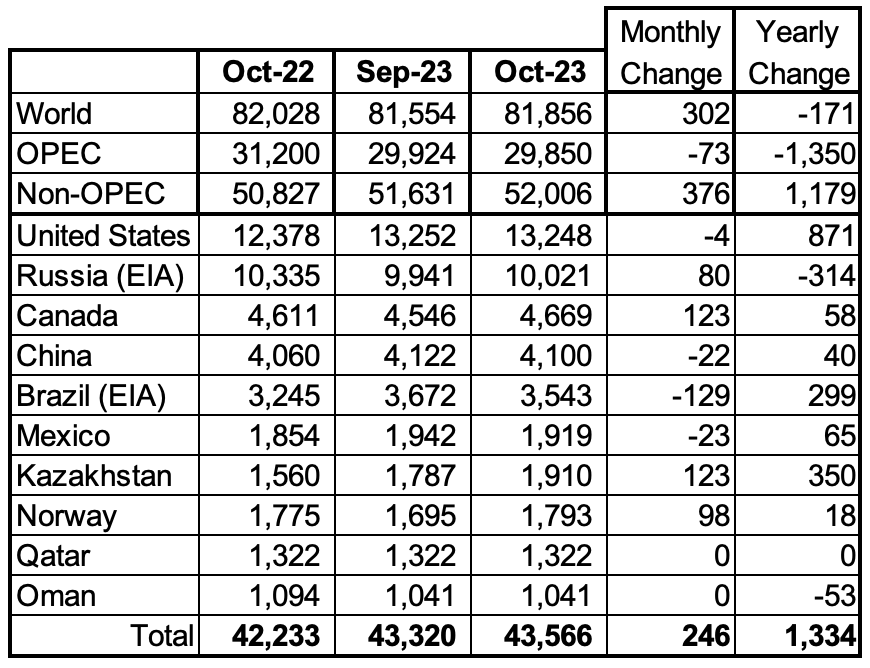
Listed above are the World’s 10 largest Non-OPEC producers. The criteria for inclusion in the table is that all of the countries produce more than 1,000 kb/d.
October’s production increase for these ten Non-OPEC countries was 246 kb/d while as a whole the Non-OPEC countries saw a production increase of 376 kb/d.
In October 2023, these 10 countries produced 83.8% of all Non-OPEC oil production.
OPEC’s C + C production decreased by 73 kb/d MoM while YoY it decreased by 1,350 kb/d. World MoM production increased by 302 kb/d while YoY output decreased by 171 kb/d.
Non-OPEC Oil Production Charts

The EIA reported that Brazil’s October production decreased by 129 kb/d to 3,543 kb/d.
Brazil’s National Petroleum Association (BNPA) reported that output in November rebounded to 3,678 kb/d, a new high. December production dropped by 93 kb/d to 3,585 kb/d.
From March 2023 to November 2023, production increased by 563 kb/d. A similar rise in production is not expected in 2024. For 2024 the MOMR is expecting a smaller increase, closer to 100 kb/d while the EIA is forecasting flat output. The January MOMR also notes that : “increasing costs in the offshore market and inflation might also continue to delay projects and could temper growth in the short term.”
Production from Brazil’s off-shore “pre-salt” region has been added to this chart. November oil production increased by 103 kb/d to 2,825 kb/d while December dropped by 83 kb/d to 2,742 kb/d.
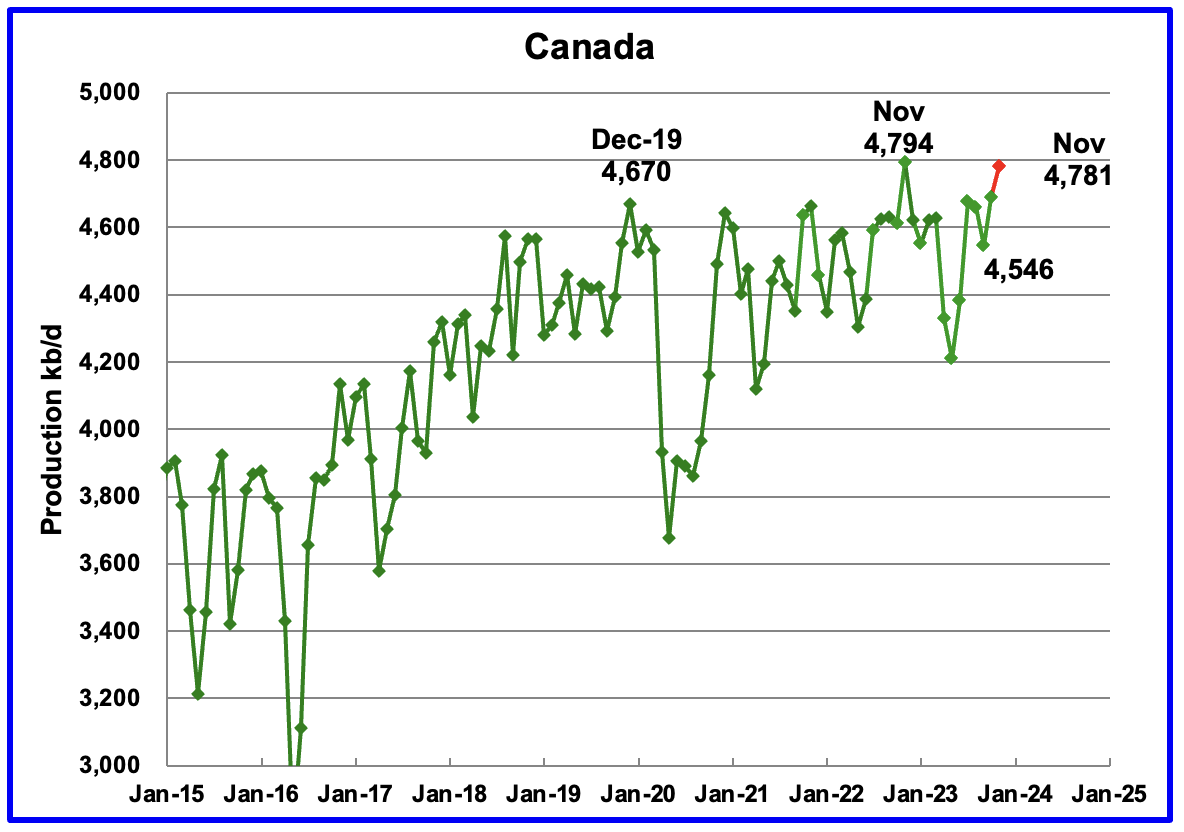
According to the EIA, Canada’s production increased by 123 kb/d in October to 4,669 kb/d.
The STEO is forecasting that Canadian production will rise by 93 kb/d in November to 4,781 and could be at a new high in December, red marker.
In January 2024, the Canada Energy Regulator approved another variance request by the Trans Mountain Pipeline (TMX). Line fill of the TMX pipeline could start in March/April.
A later Report indicated a later start date and additional problems.
“Calgary, 29 January (Argus) — Canada’s 590,000 b/d Trans Mountain Expansion (TMX) will now be completed in the second quarter at the earliest, as complications while pulling pipe through a tunnel this past week created additional delays, the company said today.
Technical issues encountered during pipeline pullback activity between 25-27 January in British Columbia “will result in additional time to determine the safest and most prudent actions for minimizing further delay,” Trans Mountain said in a statement.”
That second paragraph indicates TMX started to pull the pipe through the tunnel and it then got stuck and hence had to pull it back out. They now need time to figure out the problem and the fix. For TMX, it has been one problem after another.
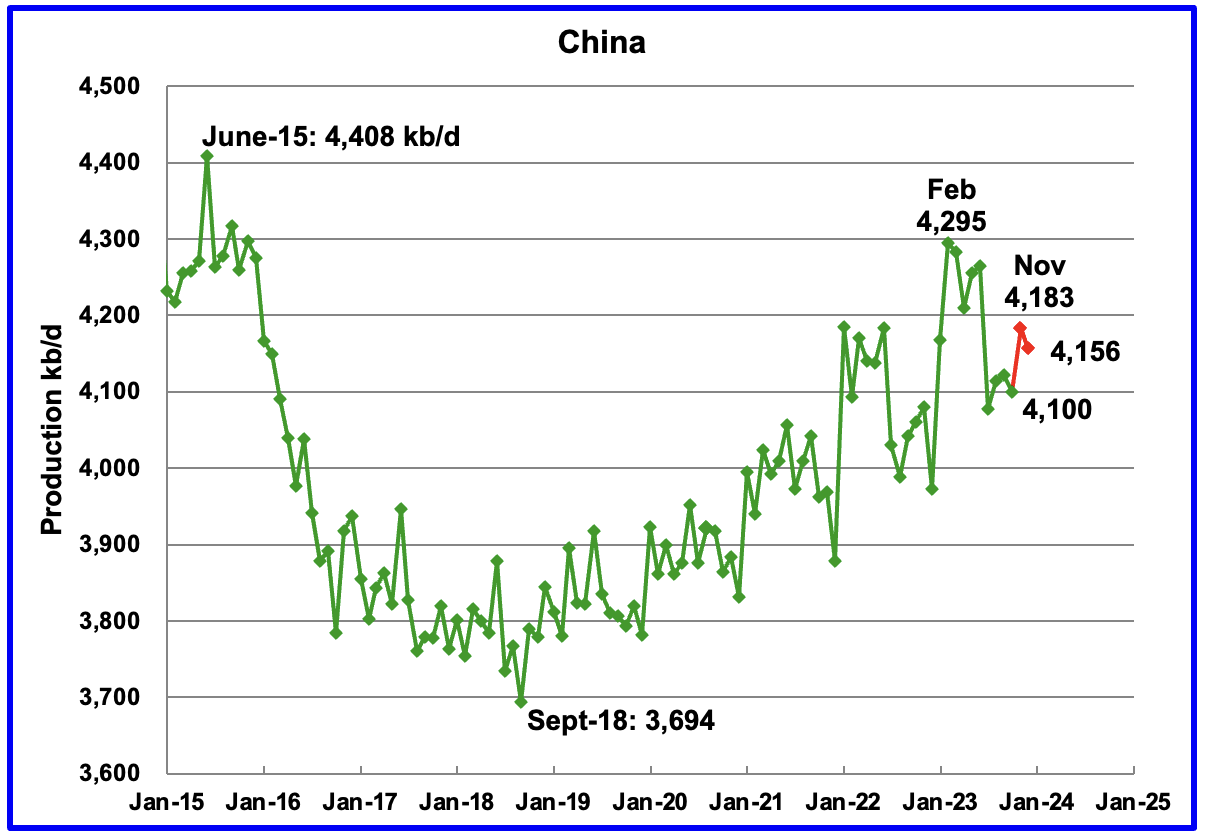
The EIA reported China’s oil output in October dropped by 22 kb/d to 4,100 kb/d.
The China National Bureau of Statistics reported that output rebounded in November by 83 kb/d to 4,183 kb/d and then dropped in December to 4,156 kb/d.
Every January for the last four years, China’s production has seen a massive increase. In 2022 production jumped by 322 kb/d from December 2021 to February 2022. However according to the January MOMR: For 2024, Chinese liquids production is expected to remain steady at the 2023 level of 4.6 m/d. The EIA generally agrees in that it is also projecting no growth for 2024.
While China’s production growth has risen steadily since 2018, it may be approaching its post pandemic high as inferred by the January MOMR and the EIA.
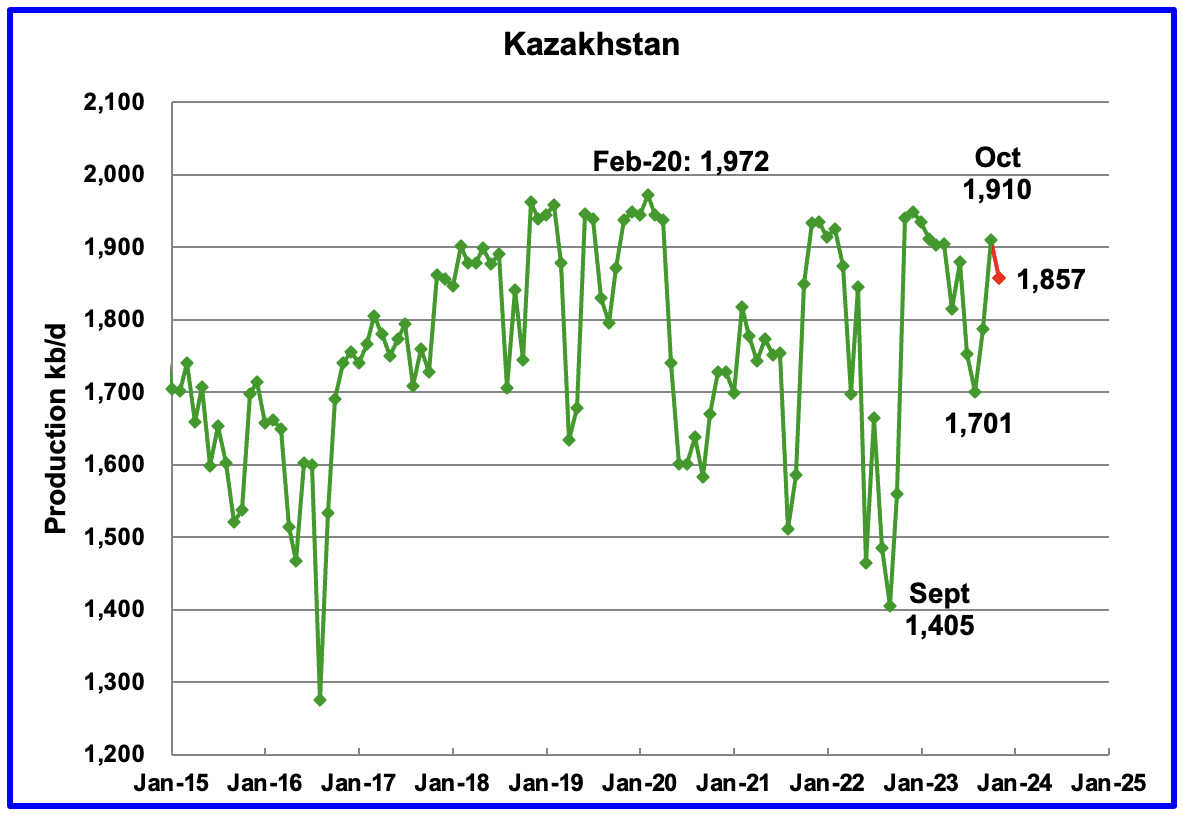
According to the EIA, Kazakhstan’s output increased by 123 kb/d in October to 1,910 kb/d but then dropped in November according to the STEO.
The January MOMR is reporting that “November Crude production dropped by 44 tb/d, m-o-m, to average 1.6 mb/d.”
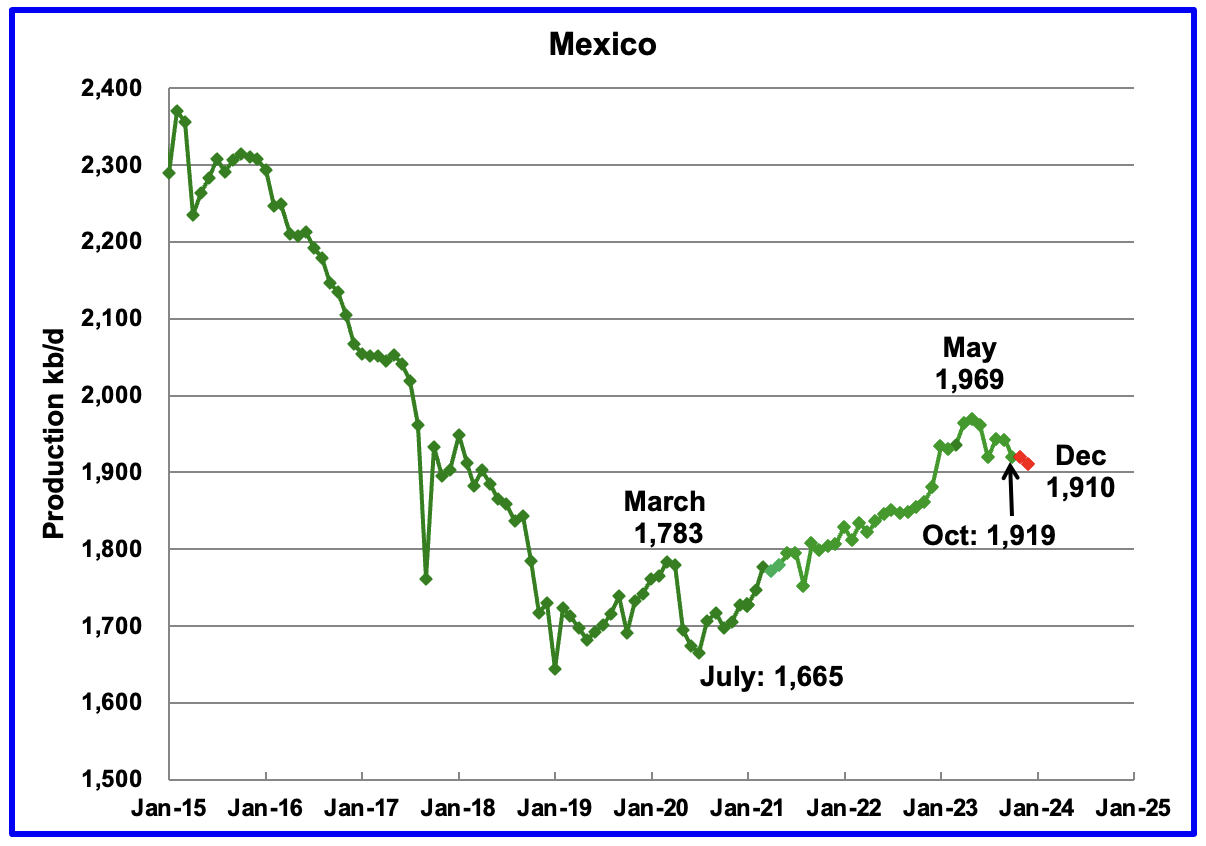
According to the EIA, Mexico’s output decreased by 23 kb/d in October to 1,919 kb/d.
According to Pemex, Mexico’s oil production dropped in December to 1,910 kb/d.
Mexico has recently revised its definition of condensate. This has resulted in the EIA adding an extra 55 kb/d to 60 kb/d, on average, to the Pemex report. The red markers include an additional 60 kb/d.
According to the January 2024 MOMR: “Pemex’s total crude production decline in mature areas like Ku-Maloob-Zaap and Integral Yaxche-Xanab is forecast to outweigh production ramp-ups in Area-1 and El Golpe-Puerto Ceiba, and from a few start-ups, namely TM-01, Paki and AE-0150-Uchukil.“
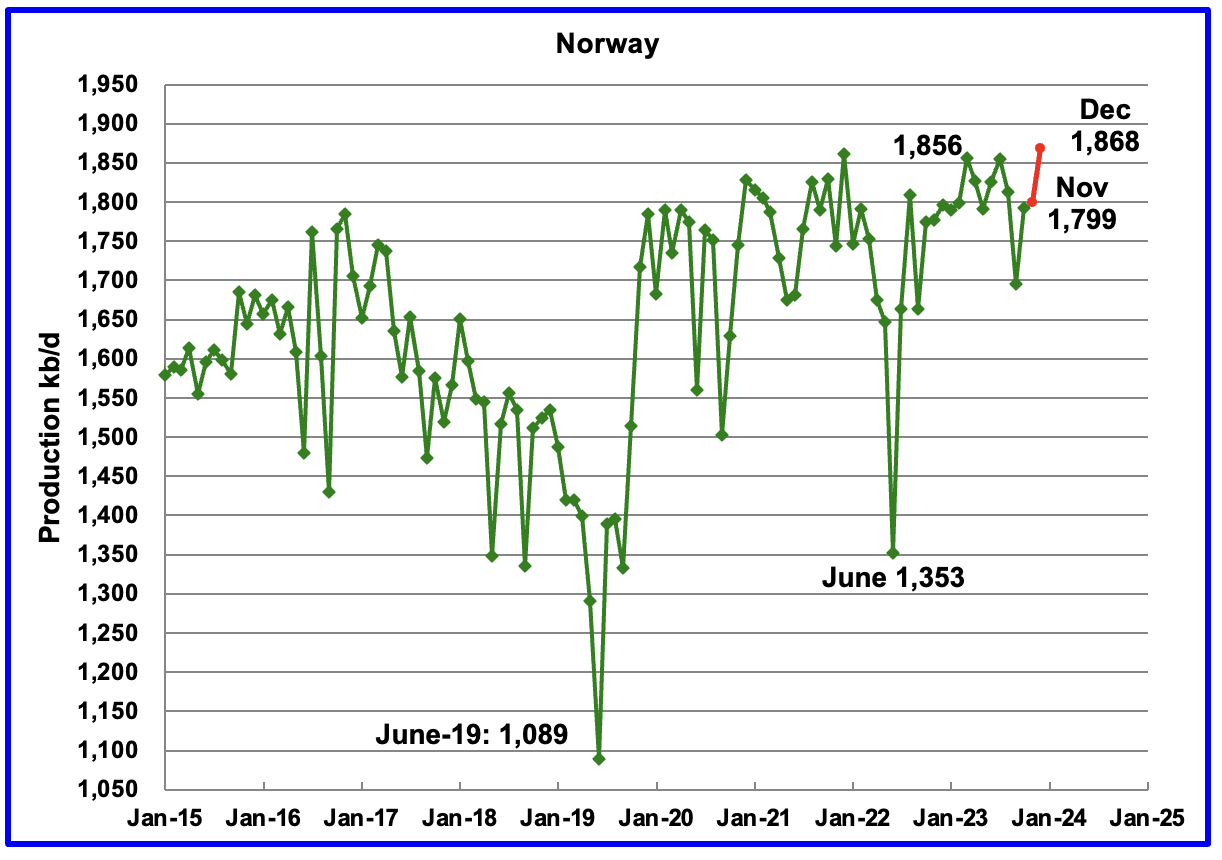
The EIA reported Norway’s October production increased to 1,793 kb/d.
Separately, the Norway Petroleum Directorate (NPD) reported that November’s production added 6 kb/d in November to 1,799 kb/d, red markers, and December made a new post pandemic high of 1,868 kb/d.
According to the NPD : “Oil production in December was 1.9 percent higher than the Norwegian Offshore Directorate’s forecast and 0.5 percent lower than the forecast this year.”
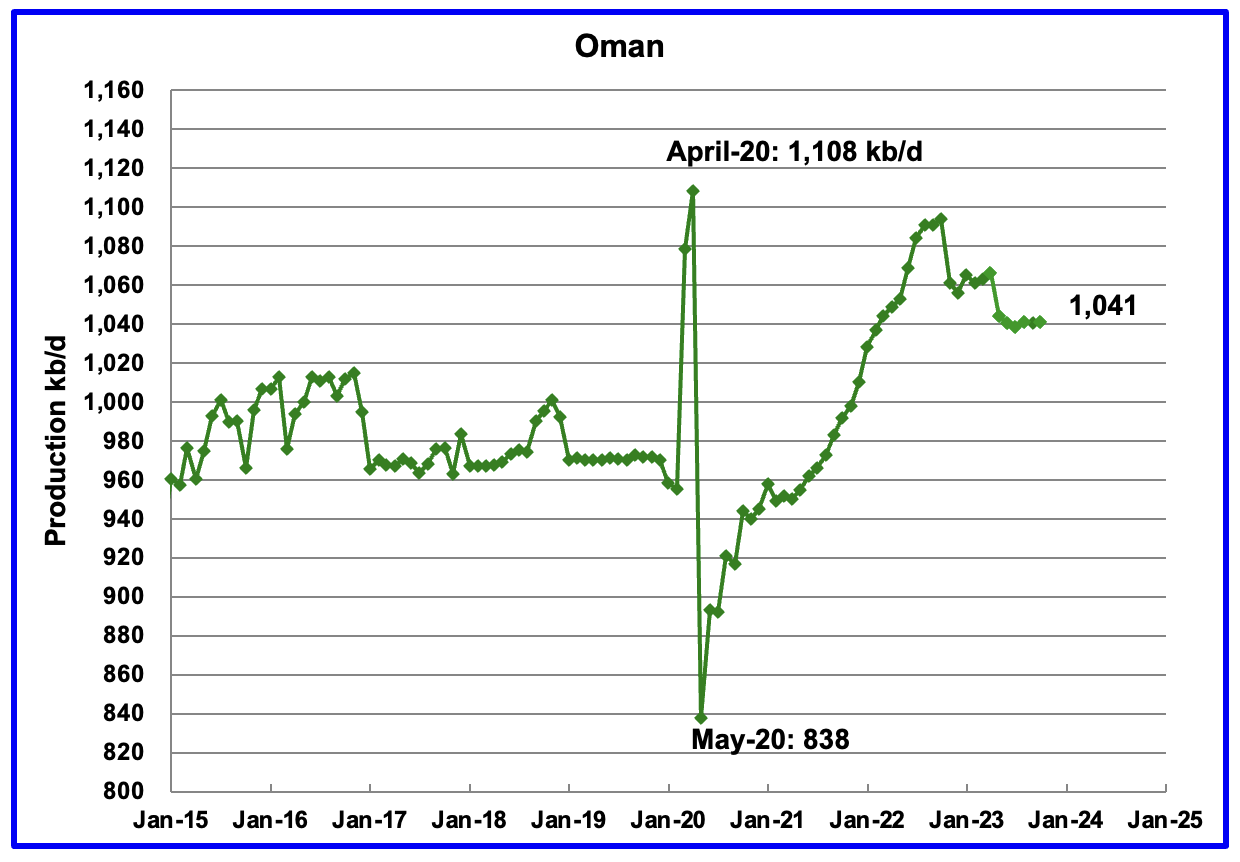
Oman’s production has risen very consistently since the low of May 2020. However production began to drop in November 2022. According to the EIA, October’s output was unchanged at 1,041 kb/d.
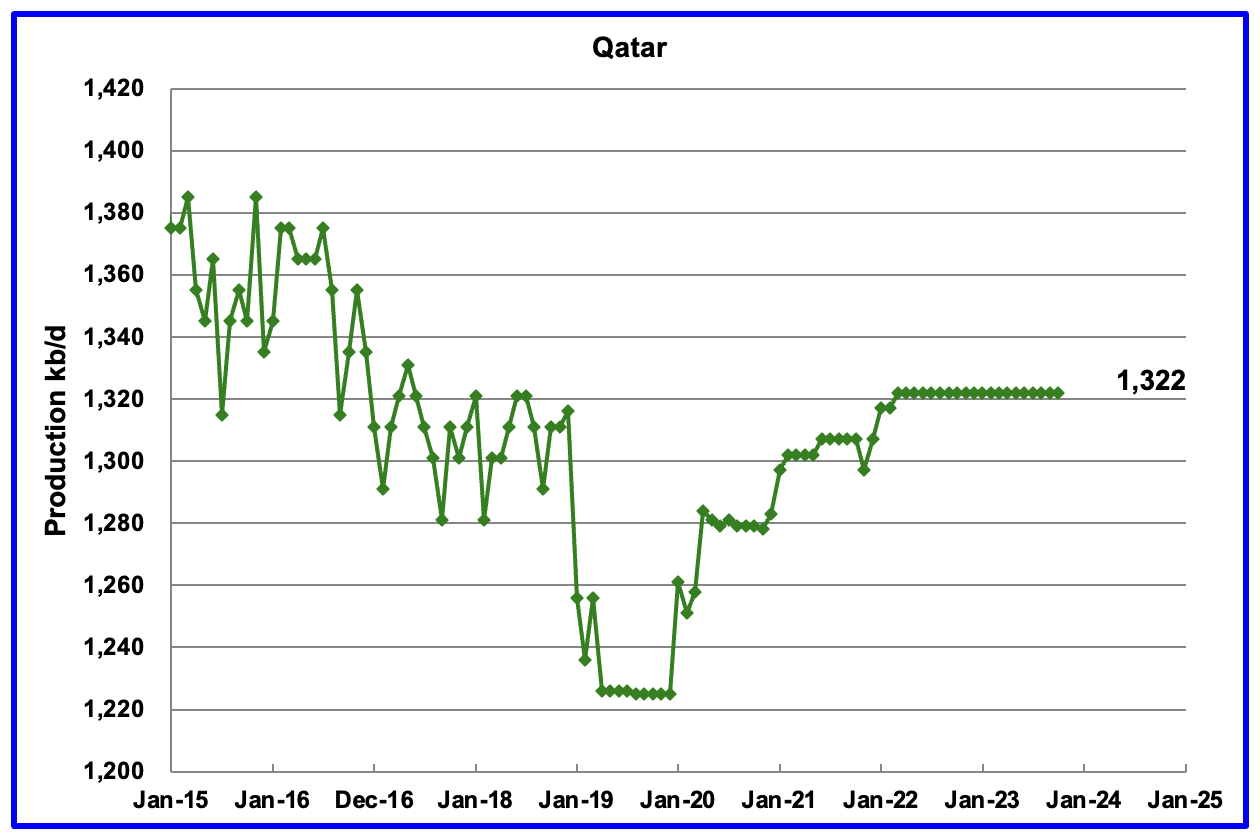
Qatar’s October’s output was unchanged at 1,322 kb/d, possibly due to lack of updated information.
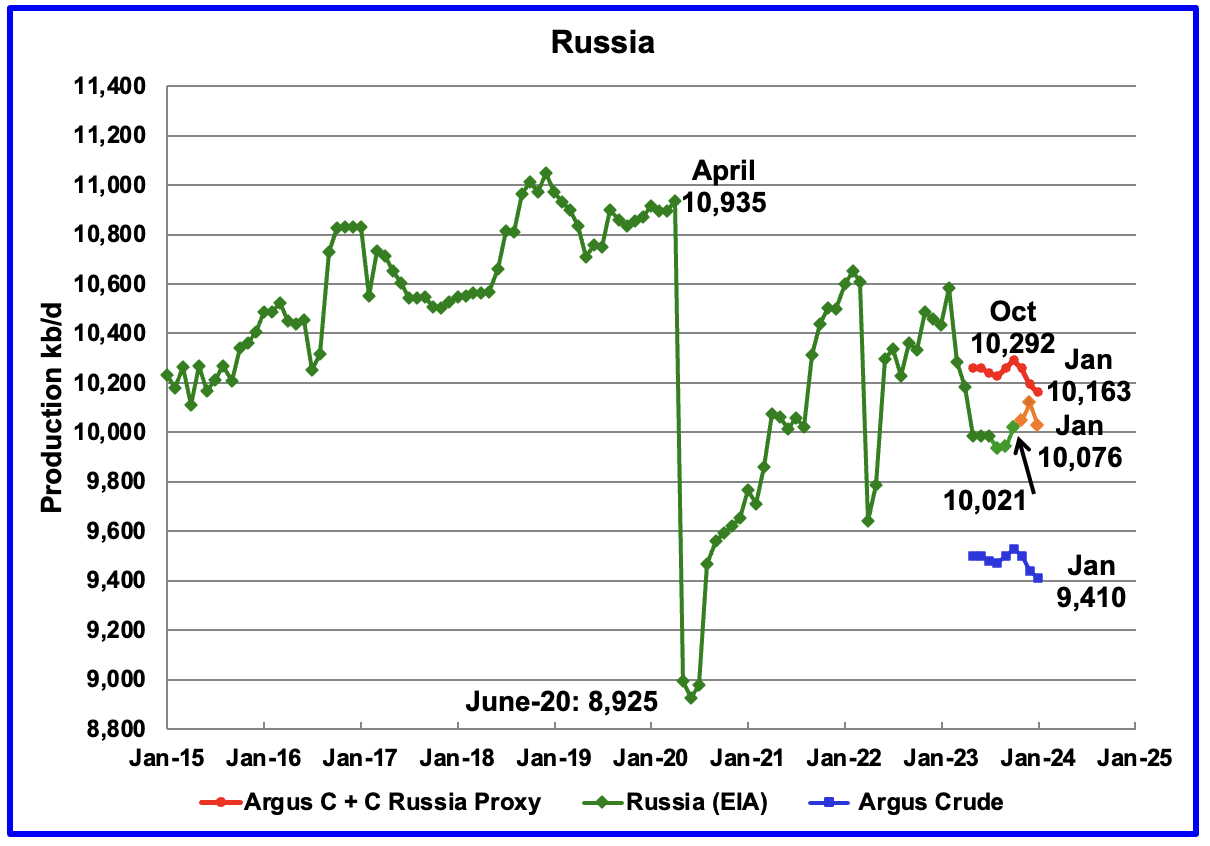
The EIA reported Russia’s October C + C production rose by 80 kb/d to 10,021 kb/d. Using data from the February STEO report, Russian output is expected be slightly higher at 10,076 kb/d in January 2024, orange markers.
Using data from Argus Media reports, Russian crude production is shown from May 2023 to January 2024. For January 2024, Argus reported that Russian crude production was 9,410 kb/d, a decrease of 30 kb/d, blue markers. Adding 8% to Argus’ January crude production provides a C + C production estimate of 10,163 kb/d, which is a proxy for the Pre-War Russian Ministry estimate, red markers. S & P Platts reports that Russian January crude production was 9,420 kb/d, down 10 kb/d from December, very close to the Argus estimate.
Comparing the Argus crude data with the latest STEO projection indicates that the EIA’s estimate for Russian C + C is between the two Argus estimates for Crude and C + C. Prior to the war, the Russian Ministry estimate was alway 404 kb/d higher than the EIA estimate for C + C. The current October Russia Proxy output is 216 kb/d higher than the EIA’s Russia estimate.
If the EIA’s STEO Russian production projection is correct, this indicates that there is no sign that Western sanctions are affecting their oil production at this time. However the trend in the Argus data indicates that Russian production has been slowly declining since October 2023. Note the trend difference between the EIA and Argus production estimates after October. Is this an indication EIA’s estimate for Russian C + C is too high or Argus is too low?
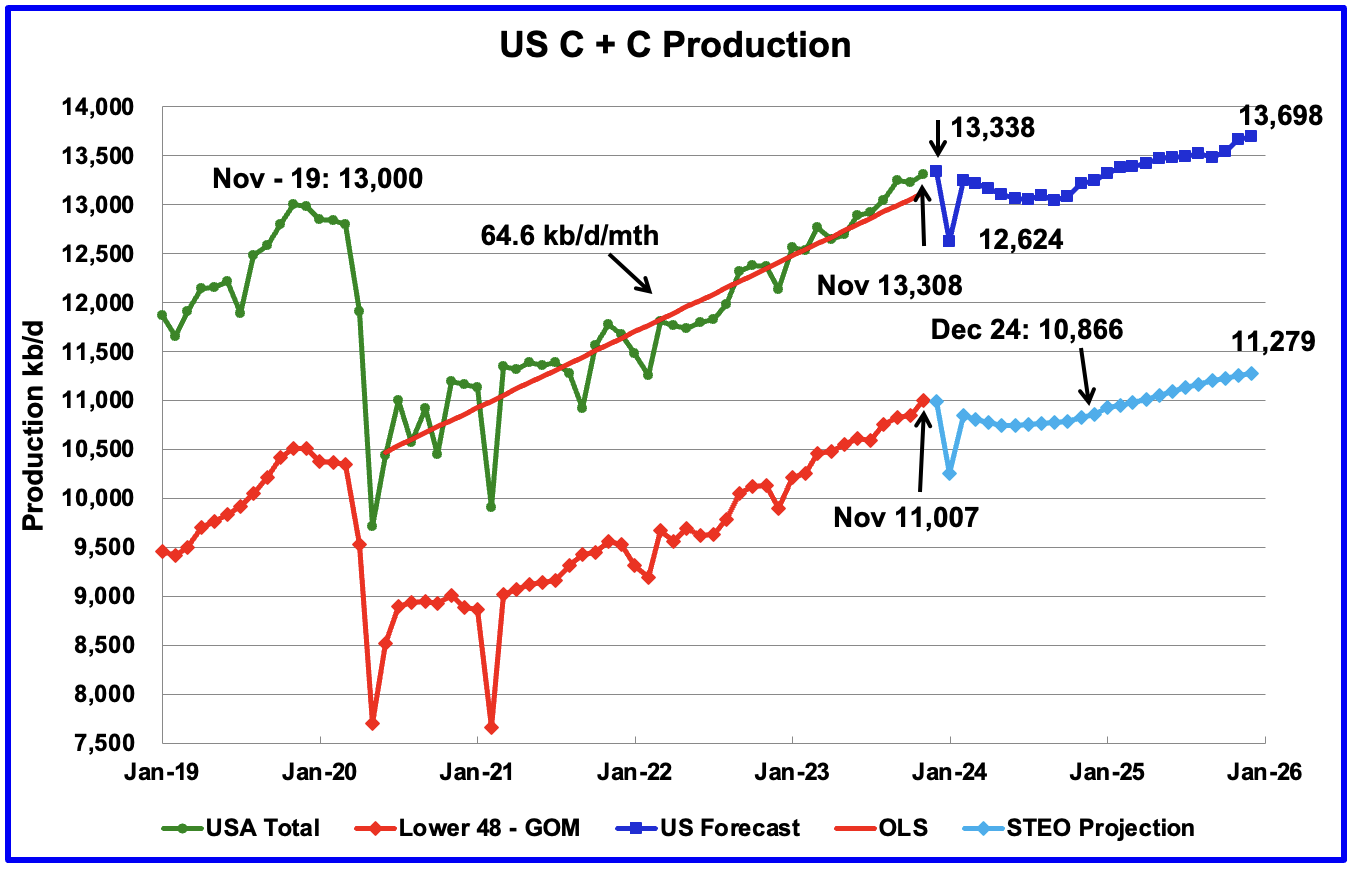
U.S. November oil production increased by 84 kb/d to 13,308 kb/d, a new record high. The increase was primarily due to increases in Texas and New Mexico offset by a decrease in the GOM.
The US projections in this chart has been updated using the February STEO.
The dark blue graph is the forecast for U.S. oil production from December 2023 to December 2025. Output for December 2025 is expected to reach 13,698 kb/d, close to 100 kb/d higher than forecast in last week’s US post.
The light blue graph is the STEO’s projection for output to December 2025 for the Onshore L48. For 2024, the STEO is forecasting dropping production in the L48 states. From December 2023 to December 2024, production is expected to drop by 127 kb/d.
Rig Report for Week Ending February 9
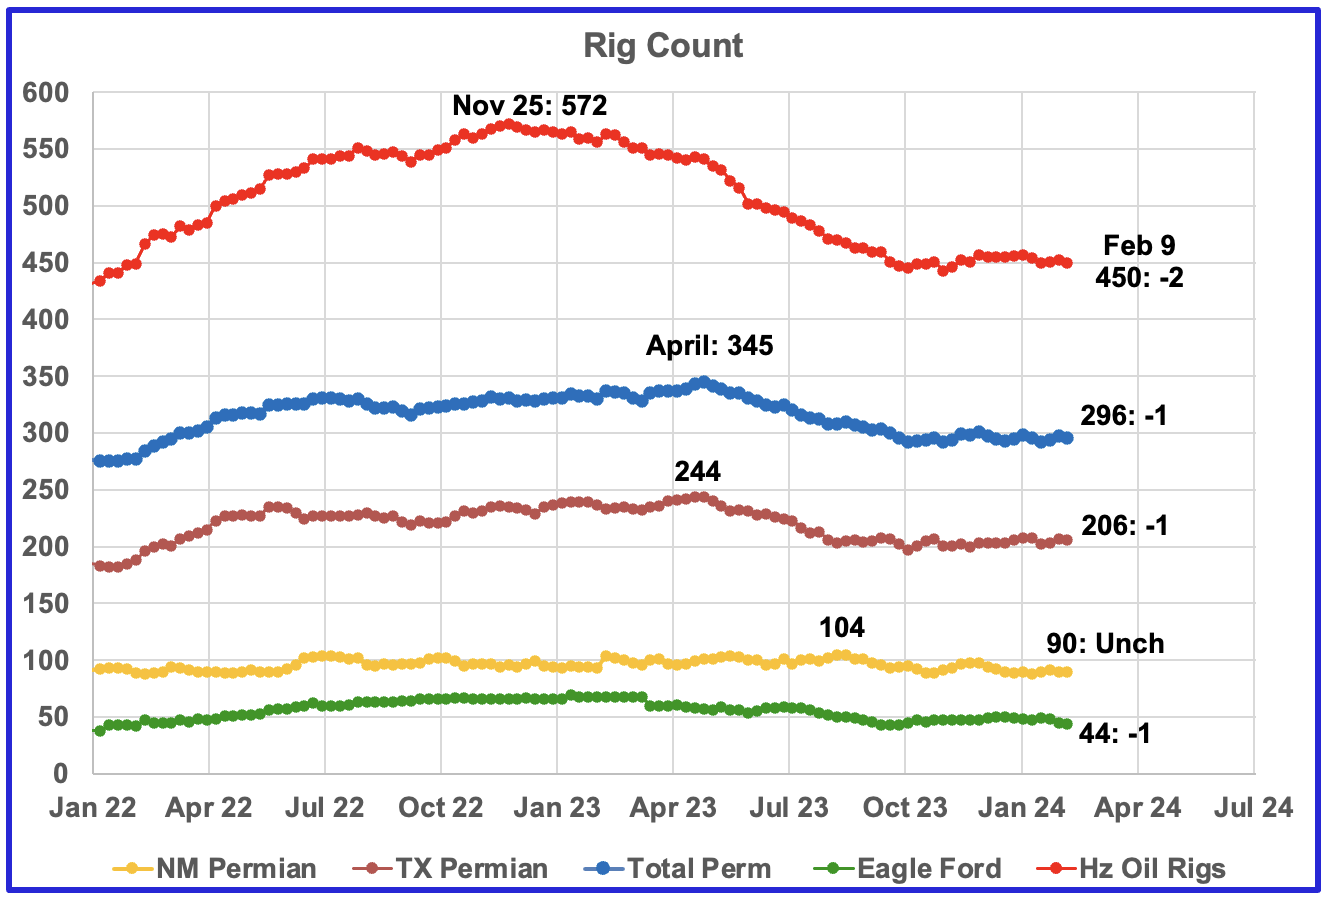
– US Hz oil rigs decreased by 2 to 450. The rig count has been close to 450 since the beginning of October.
– Permian rigs were down 1 to 296. Texas Permian was down 1 at 206 while NM was unchanged at 90. In New Mexico, Lea county added 3 to 43 while Eddy dropped 3 to 47.
– Eagle Ford dropped 1 to 44 and is 1 rig above the low of September 2023.
– NG Hz rigs added 4 to 109 (not shown)
Frac Spread Count for Week Ending February 9
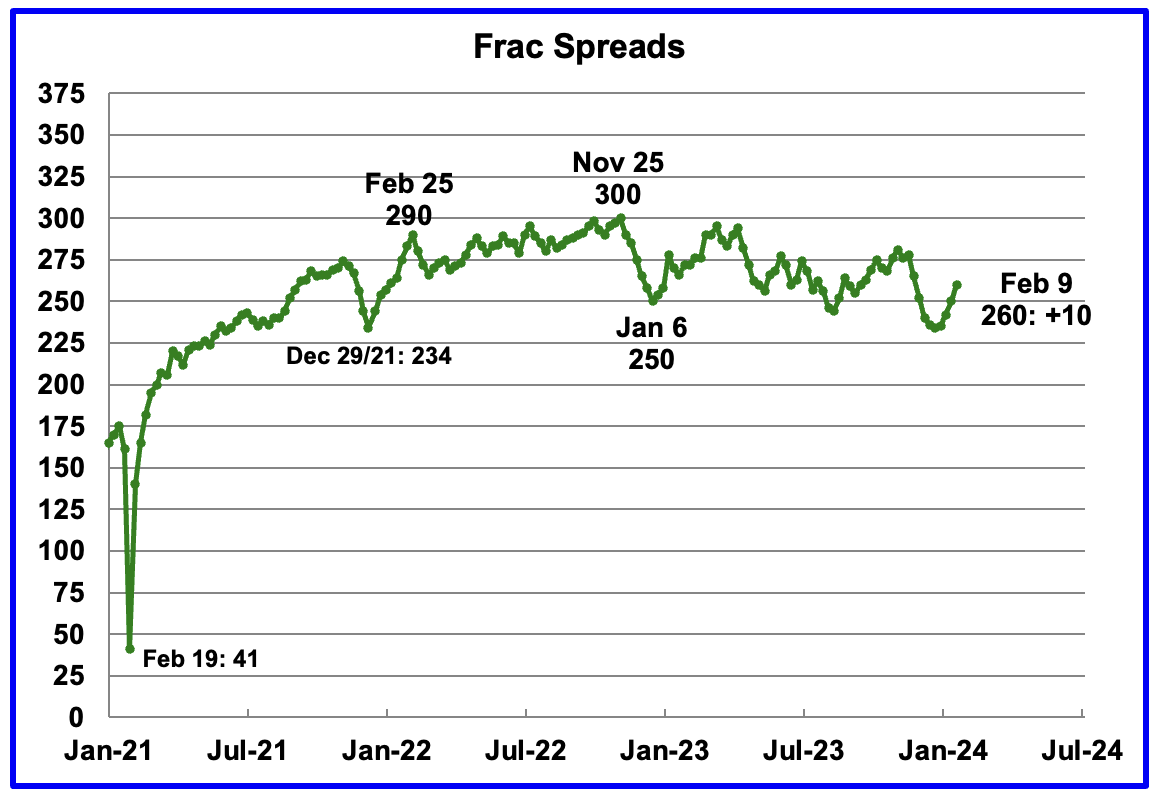
The frac spread count was up 10 to 260 and is down 6 from one year ago.
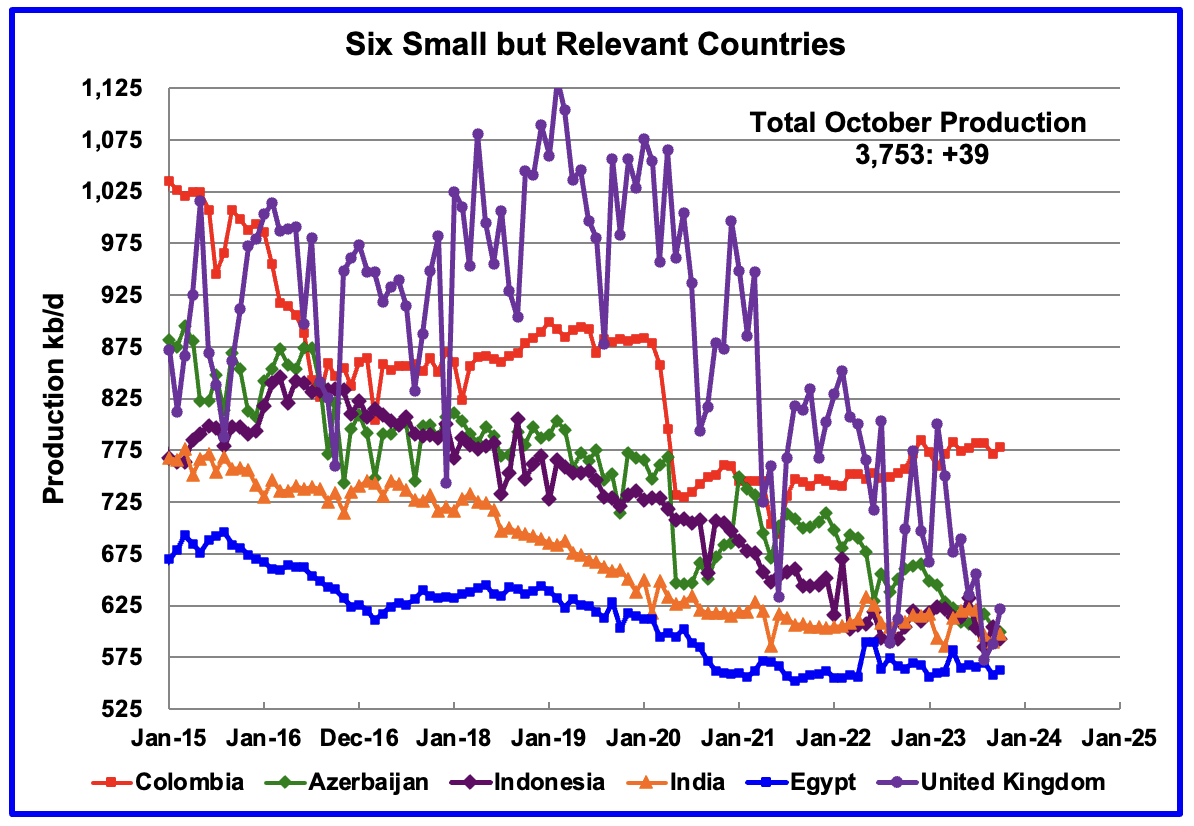
These six countries complete the list of Non-OPEC countries with annual production between 500 kb/d and 1,000 kb/d. Note that the UK has been added to this list since its production has been below 1,000 kb/d since 2020 and fell to a new low of 573 kb/d in August. in October, the UK added 33 kb/d to 621 kb/d.
Their combined October production was 3,753 kb/d, up 39 kb/d from September. The main contributor to the increase was the UK.
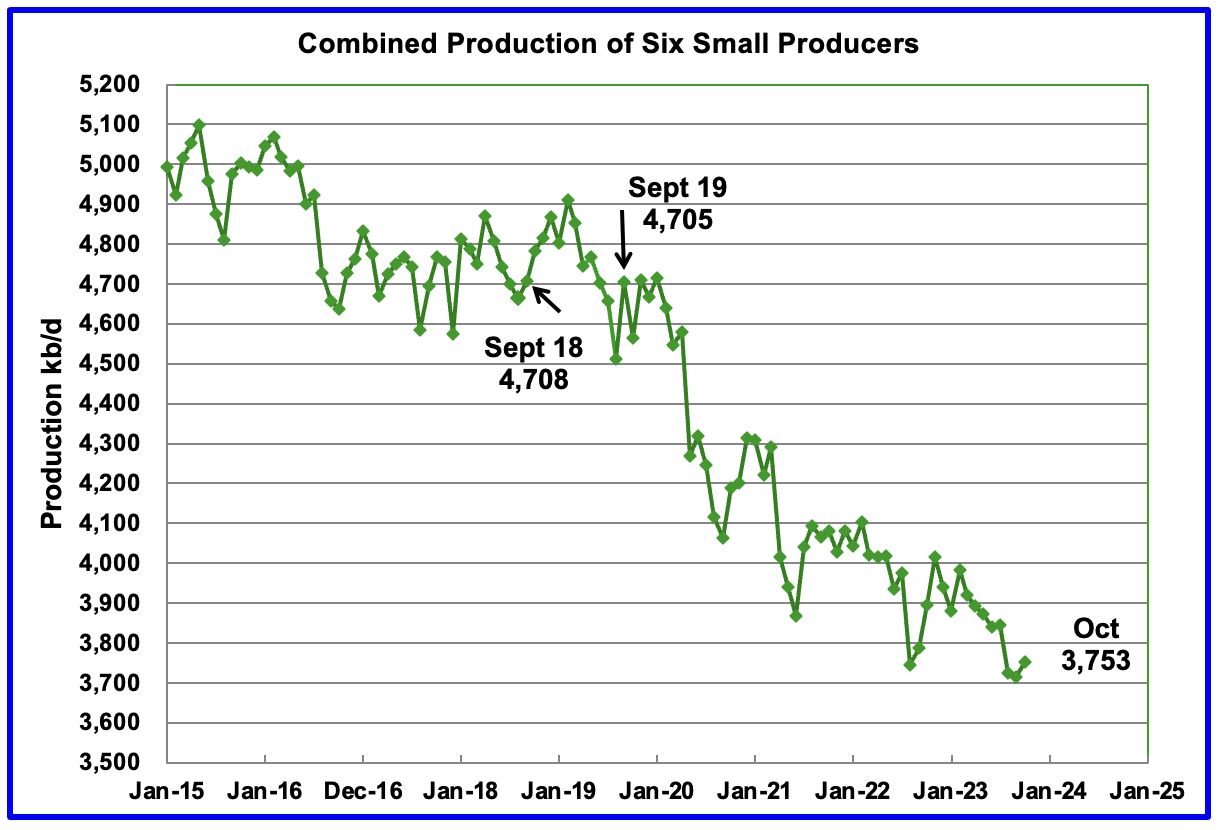
The overall output from the above six countries has been in a slow steady decline since 2014 and appears to have accelerated after 2019.
The decline from either September 2018 or September 2019 to October 2023 is essentially 1,000 kb/d. This means that the combined average decline rate for these six countries is somewhere between 200 kb/d/yr and 250 kb/d/yr.
205 responses to “October World Oil Production Continues to Rebound”
Thanks Ovi.
Excellent job as always.
A suggestion for future posts is to add Angola to top 10 non-OPEC producers, or do top 11 perhaps. In October 2023 EIA has Angola at 1199 kb/d.
Dennis
Thanks
I was thinking of doing it for the January report because that is when Angola is officially out. I guess it would be OK to start in the next report and note that the change is being done ahead of time.
Attached is the Non-OPEC chart updated with Angola removed. The projection is essentially the same except that the graph has been shifted up by over 1,000 kb/d.
One difference is the production change between December 2025 and December 2019. With Angola removed, December 2025 is 514 kb/d higher than December 2019. In the original chart, the gap is 774 kb/d. The difference is due to Angola’s falling production that started prior to 2019.
Ovi,
That makes sense to start in January, though EIA is now reporting OPEC 12 for OPEC output rather than OPEC 13. Just an idea for future reports in any case.
What is the highest 12 month average for your new non-OPEC projection? Prior to May 2023 the highest centered 12 month average for non-OPEC output was in November 2019 at 52728 kb/d vs the very rough eyeball estimate for 2025 annual average output of 53900 kb/d or so. OPEC output is projected to remain about 3000 kb/d below the World peak in 2018 while non-OPEC 12 month average output is projected to be about 2800 lower in 2025 than the 2018 non-OPEC average. So based on these projections, the 12 month average World C plus C output would remain below the 2018 peak through 2025 if the most recent STEO projection is correct.
Dennis
Thanks. I think everything is OK.
So the Non-OPEC chart in the post is based on Angola still being in OPEC.
The February STEO does not contain Angola as part of OPEC but in the EIA World C + C sheet, Angola is still in OPEC where the calculation is made. So the program just changed the ratio of EIA OPEC (C + C)/OPEC STEO OPEC crude from 1.076 to 1.12 to make up the loss of Angola. While not perfect, I decided it was good enough rather than start making wholesale changes to the program.
The chart in the comments section takes Angola out of OPEC in the EIA World C + C sheet and the six month ratio of EIA OPEC (C + C)/EIA STEO OPEC crude reverts back to 1,076. Note the six month and current ratio are both 1.076.
So here are the numbers for October for the new updated chart
EIA OPEC C + C: 28,652 kb/d
Non-OPEC:53,205 kb/d
Total: 81,856 kb/d
WRT to the 12 month centred average, the previous peak was 51,328 kb/d on November 2019. The current peak with Angola out has shifted up to 52,728 kb/d for November 2019.
Hi Ovi,
What is the 12 month average for your projection for Jan 2025 to December 2025 for non-OPEC and World?
Dennis
TMCA
World: 83,289 kb/d
Non-OPEC: 53,857 kb/d
The highest pre-covid TMCA I have is 83,009 kb/d in February 2019.
Ovi,
Thanks, so based on the STEO projection the World 12 month average peak would be surpassed in 2025, interesting indeed.
Ovi – I would guess that the Jan-2026 value of 54.4 mb/d is overestimated by around 5%. More likely production would be somewhere around 52 mb/d based on long term trends for many of those producers. With around 300 Gb of 2P reserves at the beginning 2023, by 2026 there would be only ~240 Gb. If peak Non-OPEC bares any similarity to peak OPEC in 2016, then 1.5% annual decline rate could be expected. That would be an annual loss of almost 1mb/d from the Non-OPEC group.
A large contingent of that group has been losing 0.5 mb/d since peaking in 2006 (world excluding N.A., CIS, and OPEC).
This rest of world group produces ~40mb/d and has 2P reserves of 60 GB (~4 years) and 2PC reserves of 260 GB (17 years). Decline rate for this 40 mb/d (50% supply) group could increase significantly over the next few years depending on when 2P reserves run out…
The biggest wildcard is clearly US production for your chart above, a drop of almost 3 mb/d by 2026 would not be surprising, so there is a chance production for your Non-OPEC group could plummet by several mb/d beginning anytime…
Indeed, thank you Ovi.
Another relevant country cluster would be non-OPEC Latin America production.
This would include significant producers like Brazil, Mexico, Colombia, Guyana and Argentina.
(Venezuela is an OPEC member).
Hickory thanks.
Thanks for the thought regarding a new cluster. Yes it would be interesting to see how South American production increases going forward now that Argentina has started to grow and Guyana will be a major addition in a few years.
These posts are getting long and they already take up a lot of my time to prepare and cross check everything.
About Russia oil production, the recent drones attack on oil refineries in Western Russia caused a fall of oil product exports by a third.
https://news.yahoo.com/sbu-set-two-more-russian-125000356.html
2 more.
“Without it, the enemy will not be able to produce diesel fuel for military needs,” the source stated.
”Not only do they work for Russia’s defense industry and provide fuel for Russian troops, but they are important for the Russian economy. Russia is a Goliath that stands on its oil legs. We are systematically cutting them off. And we will continue to do so until Goliath falls.”
IMO, militaries are the most conscious entities (not counting POB) on the planet regarding Peak Oil.
It is a natural rational progression to go from “Let’s oil embargo our enemy” to “How much available oil is on the planet”.
This is a threat to low oil prices generally overlooked in the press at the moment.
Everyone looks at Iran in the gulf, but reduced production from Russia if these attacks continue isn’t on the radar.
For Ukraine this is a logical step: Reduce Diesel supply to the army, reduce the money income used for smuggling chips and buying weapons – and last but not least Russia must pull troops from the frontline to defend this critical infrastructure against sabotage and drones.
I would argue that if there is a a reason for Russia to use tactical nukes it would be the Ukraine trying to destroy their domestic oil supply.
Russia has shown a vulnerability to drones within its borders.
It’s the tactical games from every stalemate war:
Ukrainians target now the oil infrastructure, Russians the energy infrastructure and sometimes people.
Then air defence must be relocated from the front to these facilities, lessening the pressure on the front. Or allowing tactical attacks like on air fields and amunition depots and headquarters where the air defence was withdrawn.
It’s actually been more hands off in some ways than the norm, versus civilians. The US would have taken down the Ukraine electrical grid, across the entire country, the first day of the war, and kept it down. (We did it in Iraq for instance. The Israelis did it in Gaza.)
Right now, you can go party at the discos in Kiev and not even feel like the war is going on. Americans would have made sure everyone was huddling in the dark. “Pour encouragez les autres.” And we don’t even think that’s harsh or a war crime. It’s not firebombing civilians. It’s just first day of air war 101. (I served on a couple JFACs.)
The Russians mistakenly think that not taking down the whole country’s infrastructure will buy them some empathy with the Ukrainians, but they are fools. Ukraine has turned much more anti-Russian than it was before. Nobody likes being invaded. Russians were fools to invade. Should have just dealt with their shit sandwich, even if it meant Kiev joining NATO. Still better than the massive waste of money and lives and reputation that the invasion has been. The Chinese are smarter…they bide their time.
Did it in Serbia too.
You say that comparing Big 3 to ROW is more meaningful than OPEC versus non, but I disagree. I understand you think you want to do something different and have some better insights. However, I think the conventional comparison is more meaningful.
Why is this? Because OPEC is a cartel of net oil exporting countries that exists to raise price. It has done so periodically over all of its history. It is not all powerful. However, that is what it does and why it exists. Not to hobnob in Vienna. Not to confound ASPO or TOD (oh wait…POB). Really…you are not that important to them. The reason for making the split the conventional way is that you are comparing price-setters (who restrict supply) versus price takers…who do everything they can (economically) do. So…when OPEC cuts…price goes up…and eventually non-OPEC increases…as more production becomes economical.
Now, sure there may be parts of OPEC that can’t pump more, especially if affected by sanctions or war. I think this is much more the issue than geology. The ME is an incredibly rich oil province…way more fertile, cheap, easy to get massive new wells (with lower decline) than shale for instance. But the main story is colluders versus free competitors.
Actually, you really should add in the + in OPEC, also. Countries like Russia that are not formally part of OPEC…but do formally coordinate with it, and reduce production, have quotas, etc.
Talk to people really in the know (e.g. Fereidun Fesharaki, not the very tiny slice of the industry…and non-analysts who frequent this blog) and you will hear the same story. It’s basic micro economics. Heck even both sides of the US political spectrum (Republicans and DOE Secretary) agree with the basic economics here…that OPEC is a cartel (Jenny G has used these exact words) and that US oil production helps to fight cartel actions. They disagree on long term actions and speed of response and the like…the congressional Republicans want a long term pro oil policy to engender more drilling and JennyG thinks she can wax hot and cold and the industry should trust here. But in terms of the basic issue of OPEC, they agree.
Honestly, even if you are wedded to your different from the norm view, I think it makes sense to graph the conventional view as well as Big 3, versus non. I.e. do both.
Anonymous
I did not say “comparing Big 3 to ROW is more meaningful than OPEC versus non”. The headline says “A Different Perspective on World Oil Production”
I don’t understand your last paragraph. Did you miss the section shown in the picture below?
As I noted to Hickory above; “These posts are getting long and they already take up a lot of my time to prepare and cross check everything.”
OK.
Ovi,
I think your perspective is of interest because all of the increase in World Production has come from the 3 largest producers since 2016 (US, Saudii Arabia and Russia). In addition the only OPEC members currently subject to quotas that have any spare capacity are Saudi Arabia, UAE, Iraq, and Kuwait. Possibly looking at the top 10 producers vs the rest of the World might be useful, but I don’t think it adds much. OPEC vs non-OPEC doesn’t tells us much in my opinion, it is as arbitrary as any other grouping.
Your big 3 is simple and excellent.
If you want to break out SA, Gulf Allies, and Iraq versus world that works also. The point is to break out price makers versus price takers.
SA in particular is sort of a “strategic player”. In the 1980s, SA dropped it’s production from ~9 MM bopd to 3 MM bopd, while trying to keep price up. Eventually they threw in the towel and raised production back up. That had a massive impact on oil prices…and on oil production from the free competitors (who have higher cost of production and get pushed out of the market with low prices). To a less dramatic extent we saw similar behavior in the last twenty years.
Here is the dynamic, Dennis:
https://twitter.com/MOAR_Drilling/status/1346532124581634053/photo/1
Anonymous,
It has mostly been Saudi Arabia that has acted as the swing producer since 1973, I agree, the other Gulf producers have contributed much less to the attempt to control oil prices. Whether a nation is a price maker or price taker makes little difference, the fact is that since 2016 all of the World increase came from US, Russia, and Saudi Arabia. In the future these increases are likely to be smaller and soon these increases may no longer offset decreases in the rest of the World, perhaps as soon as 2026, if the recent STEO estimate proves accurate (often this is not the case).
Much depends on the price of oil on World Markets, if it remains around $80/b in 2023$ for Brent, then 2018 may remain the peak in World C plus C output.
Saudi Arabia Says Energy Transition Drove Decision to Halt Capacity Expansion
The decision of Saudi Arabia to abandon plans to expand its crude oil production capacity is a result of the energy transition, Saudi Energy Minister, Prince Abdulaziz bin Salman, said on Monday.
In other words, we can’t produce any more oil than we already do.
Steve Where are You?
Why is NG below $2?
Take a bow.
Ovi,
Low natural gas prices are due to reduced demand due to a warmer than normal winter.
Dennis
When you make your Permian production projections, how much does the projection change when going from $1.50 NG to $2.50 to $3.50. I have just arbitrarily used a $1 spread.
Ovi,
Not sure off the top of my head.
Ovi,
I looked at this briefly, for Oil at $75/bo at wellhead and NGL at 30% of crude price and Natural gas at $1.50, 2.50, and 3.50 per MCF, I get well payout for the average 2020 Permian well (which may be similar to the average 2022 well) at 49 months, 41 months, and 36 months respectively assuming CAPEX for the well is 12.5 million. These are rough calculations, OPEX averages about $13/BOE over the life of the well. Royalty and tax payments are assumed to be 28.5% of gross revenue.
As I understand it, Shallow sand aims for 60 month payout and Mr Shellman aims for 36 month payout for a prospective well, so 48 months would be the midrange of their rules of thumb. If we assume natural gas is 50 cents per MCF at wellhead the well would take 62 months to reach payout.
The price of natural gas, NGL, and crude oil are all important in understanding the well economics and it is no doubt far more complicated in the real world than in my oversimplified model.
I would anticipate it being minor. The Permian is not as oil rich as the Bakken, but is still a pretty good oil producer. The gas is associated. In most cases, the oil alone justifies investment. Of course, in a few cases, the gas makes a difference to a marginal oil well. But it’s different from the Eagle Ford, or especially from Ohio (where you can almost think of associated oil to gas production).
The bigger issue in the Permian is takeaway. Oil you have some flexibility with, but gas has to hit a pipeline. And if they are full, they are full. Producers would willingly flare in some cases, but are not allowed to.
Local Permian gas prices (Waha hub) can even turn negative. (So can Bakken gas prices.) Right now Waha (the main gas hub in the Permian) is about $.75 lower than Henry Hub (national gas hub).
https://www.eia.gov/naturalgas/weekly/
Note that gas prices are really a short/medium term issue. I would say it doesn’t make sense for Dennis to try to model when pipes come in (or how NG prices gyrate with weather). He is looking at longer term production. And in that case, might as well figure $3 gas (or something close to it) in an economic model. And the pipes will get straightened out over time…in the worst case, if the tree-spikers stop construction, the production would just wait for declines to allow space on the pipe, stretching out decline a bit and leading to a smaller peak, longer tail.
This is a stupid comment made by someone who never owned WI in his/her/it’s sheltered life. Its clearly becoming more obvious why this person chooses to remain anonymous. “Minor” my Texas ass.
A cursory review of nat gas prices in the US show that price stuck in the $2/MMBTU range, /-. Little upticks don’t last long and one thing America can ALWAYS count on is that when the shale industry, oil or gas, has a chance to shoot itself in the foot with oversupply, its gonna. Its porch lights are on but nobody is ever home.
Because of pressure depletion, rising GOR and declining liquids production in the Permian (AKA, depletion) gas and natural gas liquids, including all the little nuiances assocatiated with gas, now represent fully 50% of the production stream. That will only increase. When you can only muster a buck and change for half your revenue stream, you are stuck in the mud and 4WD don’t help. You have to pay the bills to understand that. RI, ORRI and make believe experts with no skin don’t, that.
At the WH in the Permian, at the moment, try 40 cents.
Whatever future strips hold for gas, that’s lame hope. Don’t buy it.
How associated gas goes in the Permian Basin is how the Permian goes. Not crude and condensate, but gas. If you want to understand the future of oil from the single biggest source of oil in the world, sort out associated gas. It’s no longer a by-product.
The things people say to be releavant, Jeezy. If you happen to be remotely associated with the American oil industry, yet don’t feel a responsibility to the public to tell the truth, I am embararassed for you.
At $2.50 gas and $75 oil, the average 2022 Permian well would have had a 12:1 ratio of revenue from oil versus gas. (170,000 bo and 441 mmcf gas, in first 12 months.)
Source, Novilabs blog: https://novilabs.com/shale-oil-and-gas-insights-blog/
Of course, operators want that gas revenue. But a 50% drop in gas price is 1/12th the problem that an oil price 50% drop is. For a good well, operator probably resent not being allowed to flare if it means waiting a year (time value of money lost is more than the value of the gas).
Also, Dennis is interested in the long term. Not current gas price complaints, which are related to weather, which varies from year to year.
“For a good well, operator probably resent not being allowed to flare if it means waiting a year (time value of money lost is more than the value of the gas).”
You don’t know that gas prices will be higher in a year. You are guessing. Weather aside, which varies from year to year, and accordingly is called weather, most of the problem with gas at the moment is oversupply. You’re hoping for $4 gas again, and are willing to make other people’s decisions based on that (that don’t include your money) but its not the same world we lived in just 2 years ago. Now tight oil wells are turning into tight gas wells and gas is oozing out of every orfice the oilfield has. Your hope is based on LNG exports.
But well said. Clever. Guys like you now run the American oil and gas industry and that is precisely why it is so fucked up. None of you have skin in the game, nor wish to put country first. You guys seem to take some sort to twisted pride in <10% recovery rates while you whine about flaring, and methane emissions. Waste is not a big deal because you so mistakenly think there is enough of it TO waste.
God bless America's long term energy security, uh?
It is strange that Novilabs and Enverus with huge database did not do a study on the spacing or density of drilling, and find out the optimal spacing after balancing EUR, ROI etc, so as to derive an optimal URR for Permian or Bakken?
Instead, they count just the drilling rigs and project the future oil production based on past results.
“did not do a study on the spacing or density of drilling”
When secondary infilling occurs on a contiguous region such as the Bakken, a good approximation is to estimate the future production as a fraction more (50%?, 25%, 10%) than the cumulative extracted so far. That’s just common sense in applying the law of diminishing returns.
Associated gas within the 3 major formations of the Permian, Bone Spring, Spraberry and Wolfcamp, are operating in two different groups. Spraberry and Bone Spring are both increasing, call it a doubling from initial production GOR within a year or two from original conditions. The Wolfcamp is doing it faster, and has a higher starting point. Of the 3, it is the main concern. Later today I’ll have the split between Delaware and Midland for that formation, just as a curiousity thing. There are other differences between the two sub-basins as well, so I’m speculating there might be a GOR growth difference as well. Built all the software a week or two ago for the basics, figured I’d do the Wolfcamp this weekend.
Oil is still the primary Permian product, gas certainly hasn’t overwhelmed oil on a volume equivalent or energy equivalent. Yet.But answering that question should be something easily calculated, as to the when. The answer as of this moment is….not yet.
Let others do the arm waving, quantify it or it doesn’t count.
the associated gas from Permian is wet and at a natural disadvantage to dry gas if you just want to directly market the gas — operators can not send the wet associated gas into the pipeline, and have to pay a big fee to process it dry before collecting the gas price.
This might explain that the big operators like vertically integrated majors could benefit because they could process/sell the NGL out of the process at a much larger return price premium or pass the savings to their downstream, while small operators can not? Otherwise, it is quite puzzling to see majors like CVX and EXXON are still planning to overdrill, even wells are getting gassy fast. For example, although Shell sold its Permian, it still control a huge global LNG trading, investing in LNG terminals and shipping etc.
You have to pay for the processing, but you do get the value of the NGLs. If there is decent capacity of gas plants and transmission lines (to include Y-grade), then the value of the NGLs more than makes up for the cost of the processing. In some cases, it doesn’t. If you want to figure, it’s a wash, that’s probably conservative, industry-wide.
At times in the Bakken, there’s capacity for gas processing, but a lack of methane gas transmission capacity (Canadian producers feel the same pain, it’s the same pipe). Plants have asked reasonably in that case to be allowed to strip the NGLs and flare methane at the processing plants…but that has been denied. It’s actually less wasteful than flaring at the wellhead…but no. Nicht erlaubt.
Unless they have a superbig field and their own infrastructure (and I doubt the majors do, in the Permian), I don’t see why they have any advantages for gas processing. That’s a midstreamer situation. You have to contract with the gas processing plants, with Targa or the like…like you contract with gas (or oil) transmission pipelines.
https://www.targaresources.com/operations/gathering-processing-segment
“Producers would willingly flare in some cases, but are not allowed to.” Well F*ck you too! For the sake of personal profit, we’re willing and happy to screw everyone else on the planet. Thanks Buddy. Flaring gas is a crime against humanity and should be prosecuted.
Tree-spikers? A right wing media hoax. For the good of humanity, people are willing to fight for their children and the future of life on the planet, to discount their humanity is to show your inhumanity.
+1
Not sure which Steve, you mean, but I still remember a 2016 “Steve” POB article with shale gas being predicted as about to have massive declines.
https://peakoilbarrel.com/collapse-of-shale-gas-production-has-begun/
[Was dramatically wrong.]
Shale Gas output since 2016 in chart below using data from EIA. For the past 15 months output has not increased a lot.
1. So up ~78% since 2016. (35/45). Pretty dramatic for a “mature industry”. And it sure ain’t the “collapse”. Collapse means fast decline. And instead it went up. Pretty impressively.
2. Just go easy on interpreting the last year or so, Dennis. There is a long, long, longitty, long-long pattern of peakers predicting peak too fast every time production turned down of shale gas (and here it’s not even turning down…just not growing fast enough for you).
3. P.s. Interesting how this is the one chart you show with a true zero axis. I’m actually in favor of it (almost always). But fascinating to me…that you go for it here and so rarely elsewhere. How does that graph look like if you make it a 40 to 90 axis? 😉
Shale gas has increased a lot since 2016, lately it has increased more slowly. My expectation is that the peak will be 85 to 90 BCF/d in 5 to 7 years perhaps followed by an undulating plateau for 5 to 7 years depending upon the price of oil and natural gas.
It’s pretty hard to export natural gas. In a lot of ways, it’s more like electricity than it is like oil. (I.e. market limited.) So, you have to think about the natty story differently than the typical geology emphasis of peak oil Internet analysts. You also have some interesting dynamics of “ass gas” (essentially a byproduct of oil) and of gas on gas competition, within the US. Very different dynamic from oil, with a world price.
Of course if the production is restricted (because of lack of extra LNG capacity), that just means a longer run rate for the existing resource. And I would seriously entertain the PGC analyses. Those are real academics and industry professionals…WAY more compiled expertise than Art Berman, David Hughes, and Laherre. I know you don’t like big numbers, Dennis…but you’ve been time over time too small with your outlook. Need to dream bigger:
https://www.youtube.com/watch?v=0juabdtMzN4
Anonymous,
I use the USGS estimates, in some cases these may turn out to be low as the entire US may not be covered completely. The USGS mean assessment for undiscovered continuous gas technically recoverable resources is 1640 TCF vs PGC estimate of 3368 TCF of undiscovered natural gas resources. The USGS F5 estimate of continuous gas URR is 2981 TCF which is close to the PGC estimate, but note that this estimate has a 95% probability of being higher than the actual TRR for shale gas and coalbed methane whereas the 1640 TCF estimate is an scientific best guess (far more useful than the F5 estimate).
Just as using the F95 estimate makes little sense (except perhaps as a likely lower bound) it also makes little sense to use the F5 estimate except to create a possible upper bound.
If we want a realistic guess, we use the USGS mean TRR estimate and then apply a bit of economics to create a best guess based on both physics and economics and create an ERR best guess. If the mean TRR estimate is revised, then redo the analysis.
I agree in 2012 my outlook was a bit too low as I was using a URR of only 2500 and 2800 Gb for World C plus C.
Dennis:
There is a lot of structural uncertainty in these resource assessments. Different respected professionals come up with very different TRR estimates. In the Marcellus, it’s like 95 versus 560 (TCF). So talking about the within USGS method 5-50-95 percent probabilities is missing the story…when USGS might be out to lunch by 95 versus 560 TCF on the mean.
And you can’t automatically say that the other studies are crazy high and you don’t like them. Maybe. Maybe so. But maybe USGS is crazy low instead. Who knows. We have different people that are all good professionals, coming up with widely different estimate. But as a Bayesian, knowing these different estimates exist, my personal span of uncertainty need to be at least 95-560 (for the Marcellus).
USGS has a history of revising upwards. Marcellus went from 1.9 to 84 to 95. And it should be going down…since wells are drilled, moving TRR to production (and PDP reserves). For instance the 84 and 95 sound similar, but over 100 TCF between assessments had already moved to production/PDP! Bakken had a similar trajectory…195 MM BO to 4 B O to 8 BO. Now…sure, they learned more and adjusted up. But why always up. What is going on to be so conservative early? Shouldn’t they tend to be wrong in both directions? Or is there something about their method that is biased conservative, especially when knowledge is lacking? Oh…and did the new revisions fall within their old 5-50-95 boundaries? I bet not. Which goes to my point that you think you are capturing uncertainty with the 5-50-95 (or different scenarios), but really are not.
P.s. See this document for some perspective:
https://www.osti.gov/servlets/purl/1805223
In particular, look at Exhibit 1-2 (numbered page 4, or page 12 of the pdf).
Edit: look at numbered pages 20 and 21 also. Those are actual fully drilled sections. It’s a great methodology really. See also, final figure 5.1 on numbered page 32. basically, this (quite good) study agrees with the high studies for the Utica and Marcellus (done by excellent academic groups). USGS is the outlier, low.
Again…who know who is right. Maybe it is USGS. But, you don’t get to say “nobody could have known”, when you are making a conscientious choice to always pick the outlier lower estimates.
Also, of course, USGS really doesn’t do country-wide assessments (or if they do, please point me to them…I might be wrong). They do this area by area thing, sweeping in again every few years.
Anonymous,
Yes there is a lot of uncertainty and yes the USGS does not do the entire nation at one time. The PGC estimate has also grown over time, in 2006 it was 1532 TCF vs 3978 TCF in 2022, note that about 870 TCF of this estimate is speculative resource. If none of the speculative resource is recovered and the 2022 estimate is accurate, the US reaches 50% of URR in 20 years assuming constant production of 38 TCF per year (the average rate of 2020 and 2021). If all of the sopeculative resource is eventually recovered and the 2022 estimate is accurate then 50% of URR is reached in 32 years assuming contant natural gas output at 38 TCF per year. Obviously the peak is reached sooner if output grows, if we assume 1% growth in NG output per year peak is reached in 2041 with zero speculative resources and in 2050 if the speculative resources are 870 TCF with peak assumed at 50% of URR.
See link below for summary of PGC report
https://www.aga.org/wp-content/uploads/2023/09/PGC-2022-Report-Executive-Summary.pdf
Anonymous,
The 2021 USGS estimate for Bakken Three Forks has TRR at 8.7 Gb for mean estimate and 11.7 Gb for F5 estimate, in 2013 the estimate was 11 Gb for the mean and 15 Gb for the F5 estimate for Bakken/Three Forks TRR.
We also have to account for the roughly 3.6 Gb of oil produced from Jan 2013 to Dec 2021. If we add this to the 2021 TRR estimates to make it comparable to the 2013 USGS estimate, we have 12.3 Gb for the mean URR (assuming all of the mean TRR is extracted) and 15.3 Gb for the F5 estimate for URR. Thus the new mean estimate for TRR is well within the F95 to F5 limits of the 2013 USGS estimate for the Bakken/Three Forks formations of the Williston Basin.
See
https://pubs.usgs.gov/fs/2013/3013/fs2013-3013.pdf
and
https://pubs.usgs.gov/fs/2021/3058/fs20213058.pdf
Dennis:
You also need to account for the change in PDP reserves. But yes, the two last Bakken ones are the best for USGS.
Other places like Marcellus or Utica, they are way more out to lunch, looking at changes over time. Like big upratchets needed.
Anonymous,
The proved reserves are included in each of my TRR estimates as USGS evaluates undiscovered resources and proved reserves need to be added to those estimates, I have done that for both the 2013 estimate and the 2021 estimate.
Note that there are a number of different formations in the Marcellus, you have to add up several to get the full USGS estimate. For the 2019 estimates of Utica and Marcellus the USGS has UTRR at 214 TCF, when we add the proved reserves of 159 TCF the total is 373 TCF for the mean estimate, if we use the F5 estimate (which you seem to favor) the estimate is roughly 462 for UTRR (with a 95% probability that actual UTRR is less than this) adding proved reserves the TRR is 621 TCF. I think the mean estimate is likely more accurate than the F5 estimate.
OK on PDP reserves.
I’m well aware of the Utica. I’m comparing apples to apples. If you look at USGS (U and M) versus others U and M, it’s a similar story as just comparing M from one to the others.
Yeah, USGS has 214 for U and M. But if you look at EIA, PGC, Boswell (or BEG and Utica Playbook)…they are ~1000. Not just 25% higher or lower, but ~5X. So, it’s the same basic story as just looking at the M. Are you a technical expert who can show why one estimate uses a better method than the other?
FWIW, I think it’s simpler to stick to M itself as it is much better understood. (Also the two strata are over a thousand feet apart…you don’t even winerack.)
Talking about 5-50-95 within USGS is missing the bigger issue, when the mean uncertainty is so much larger. You have a choice on who to use and pick the TRR that is the lowest. That’s a choice, Dennis. Heck, maybe it is right. But you have no way of knowing that. So the true uncertainty is much higher.
I strongly urge you to read at least the few pages of the Boswell paper I called out. You don’t even need to look at the Boswell estimate itself. But look at the pages talking about how radically the USGS and other estimates differ. Heck, even Patzek notes this in his introduction (where he has a ~2X versus USGS number).
Anonymous,
The PGC does not break out the Marcellus, it lumps Appalachia together, I hadn’t looked at Boswell paper.
A couple of things with Boswell, it uses 50 year estimates, probably not the best method for shale gas, downhole problems will make repairs not viable for low output wells and they are likely to be shut in in 20 to 25 years. Also he assumes 6% terminal decline, Novilabs shows Pennsylvannia Marcellus wells have terminal decline of about 10%, this makes a difference in EUR.
Like I said, you can look at U+M or just look at M. You will have some data that are available for either way (as they do both and break them out). In other cases, you have some available for U+M only (say PGC implicitly) or M only (say BEG). Implicitly it is a similar story though. Massive 200-600% alternatives to USGS. And it’s not just the Boswell paper. Patzek, EIA, BEG, PGC.
I sort of lean towards looking at the M as I think there’s slightly more comparables. Also, there’s massively more wells drilled in the Marcellus. Utica is still very much a puzzle, something for later (wells are big but very deep and difficult). But again, it’s same problem either way. USGS is still ~5x off if you add the big U and M estimates together (Boswell, PGC Atlantic, or UT plus West Virginia). You can’t compare the 214 of USGS U plus M to the 506 of BEG for M only. Even though it would still be a massive difference.
In any case, you are not a technical expert to be able to say why one is right or preferred over the other. You’re just picking the smaller estimate. Really, your uncertainty ought to include the span of the competing estimates. Not the within method uncertainty of just one of them.
Boswell also shows examples (drilled sections) where the USGS method fails even because of existing production.
Also, somehow I doubt that tail of late production (10 versus 6%, 25 year wells versus 50) is driving a 5X difference. We both know most of the production comes early. Boswell has alternatives in his paper with lower decline or higher and they are the sort of 15-30% variations of his mean, that you are familiar with.
USGS has a lot of issues too…I think the biggest being their lack of cell-based granularity. E.g. if you look at their 2019 assessment,
https://pubs.usgs.gov/fs/2019/3050/fs20193050.pdf
They evaluate essentially all of NE PA as one area (see Table 1, top left). And figuring on 3 wells per section (120 acre spacing, 75% success factor), at 3 BCF EURs. These EURs are much lower than what we have seen for modern wells in NEPA, even just based on completed production (source NoviLabs, etc.). Spacing is also low. Now, you can say they’ve drilled the best first and the rest will not be as good. And everyone will agree (Boswell even shows a contour map of production EURs in Susquehanna County). But this is the reason everyone else (BEG, Patzek, Boswell, PGC) uses a more granular approach. And probably this is why they are getting bigger numbers. The big wells really do produce a lot. And USGS is (I speculate) missing that. It’s sort of the opposite problem of assuming a whole play will behave like the core. They are (I speculate) assuming the average salesperson will produce like the median one. (If you know the 80-20 Pareto principle, you’ll know that actually undercounts total sales…the average is higher than the median…you aren’t giving enough credit to the performance of the core.)
Also, USGS in the Marcellus (and Utica if you want) is a 5 years old publications. A lot of the data will be even older since you need say 12 (or better 24 ) months to establish a type curve. How sanguine are you that such dated UGS surveys won’t need a revision up again? At least PGC updates every two years.
But who knows. Maybe USGS is right. Neither of us is a good enough technical expert to say. I would love to moderate a work session with the different authors locked in a room though. But in any case, you really can’t tell that USGS is right. You haven’t studied it hard enough to know that. And good people (well qualified) are coming up with radically different answers.
Also keep in mind that Marcellus productivity has been decreasing since 2020 and likely longer than that if we normalize for output per acre.
Dennis, yes, good point. But how important is that? And what else has happened, before 2020, but after the dataset for the USGS study? Let’s look.
I don’t have the normalized production, but you are likely right that lateral length has been creeping up. Maybe not as much as Permian, but maybe some. The Bakken is the one basin that has had relatively fixed (2mi) lateral length for forever. Normalizing doesn’t help you there. 😉
[Parenthetically, I take away a little of my spacing criticism of the USGS. If we think about two-mile laterals, 120 acres, with 75% “success” implies 6 well spacing. And 6-8 wells is the operator pattern of development. So, I step back from that crit.]
Novilabs, based on state data from MAR2023:
https://novilabs.com/blog/pennsylvania-update-through-march-2023/
Here is some analysis, based on 12 month cums (I like longer ones, but this is so we can assess recent vintages):
year BCF
2022 3.59
2021 4.05
2020 3.98
2019 3.14
2018 2.96
2017 2.68
2016 2.00
2015 1.65
2014 1.72
2013 1.48
2012 1.11
Here is the same thing, but comparing to 2020 as a baseline:
year pct2020
2022 90%
2021 102%
2020 100%
2019 79%
2018 74%
2017 67%
2016 50%
2015 41%
2014 43%
2013 37%
2012 28%
OK. Discussion.
1. Yes, 2022 wells are worse than 2020 ones. 10% worse.
2. Total values are very high. Yes, even with 2 mile assumed laterals, the spacing is likely 6-8. So this is a fair comparison to USGS. And what we are seeing is the 12 month cum is already more than their EUR! Now we can worry about later degredation and the like…but this just goes to show why you need to grid and look at core versus non…the way everyone else, cornie or peaker does…and they are basing future EURs on old type curves….and somehow coming up with 3 BCF cums, that get obliterated in 12 months!
3. 2021 is actually slightly better than 2020. For all intensive purposes, it’s the same. And if you look at the whole grapht, they are on top of each other. So I don’t think “dropping since 2020” is fair. More like 2022 was worse than previous two.
4. It’s mostly a story of increases prior to 2020. And dramatically. 2021 is almost four times better than 2012.
5. It’s mostly monotonic increase to 2021, but not totally. Look at 2014 and 2015. It actually dipped slightly before going up. Now, I agree that the 2022 dip is bigger (12% dip, versus 5%, relative to prior year). Still something to watch out for, before assuming every year after will keep going down. What would an evaluation in 2015 have said about well quality starting to go down?
6. With respect to 5, it is interesting to look at 2023. We have very limited data here. So no firm conclusions. But if you look at the 3 month cum (only one month of wells here for 2023), you will see it was actually up versus 2020. 1.186 cum versus 1.144 cum. Again…not making too much soup out of this onion. Limited data. Early. Blabla. But just beware of assuming wells will keep going down like the 2022 generation. 2023 is looking like a recovery. (Maybe 2022 is just one data point also.)
7. I would also recommend to think about what data USGS had when they were building their type curves. Their last M assessment was released in 2019. Probably done in 2018. If we posit 12 month cums, that means 2017 was their most recent generation. 24 month cums implies 2016. And a lot of older wells mixed into the average also.
8. Pretty much everyone (including peakers like Patzek) makes the point that you can’t equate older wells and newer ones. There has been a massive change in completion methods (with much higher EURs). Point 4, here. Patzek accommodates this by splitting into old and new generations. Others just use new only. But in any case, USGS is missing a beat and likely mixing in a lot of oranges (or at least crabapples) with their apples, when developing type curves based on production history.
Shale Gas and especially Marcellus has been an exception in US shale revolution,
1. It has never seen more than 10% drop in total production over 1 year or extend period of time, while maintaining upward trend and see it more than double over the past 10 years, while average gas price has been low $2 range in the Appalachians.
2. It has never seen more than 10% drop in basin wide per well IP and EUR drop more than 12% always seen IP and EUR increase for each average well in the past 10 years,
Looking into the details, the major drop in 2022 IP or EUR come from NE PA, i.e. Cottera and Chesapeake, and probably are due to their constraint capital and testing less productive upper Marcellus with actually shorter lateral, as there as they are running out tier one in lower Marcellus.
see,
https://thecapitolforum.com/coterra-energy-pennsylvania-drilling-signals-early-shift-towards-less-promising-targets-as-legacy-marcellus-wells-underperform-peers/
Other major operators actually also have constraints and limtied dropping rigs and don’t want to rush the production even with the gas surge as a result of the war in Ukraine,but they are still seeing upward trend in IP and EUR.
Dennis:
One other general thing to watch out for is high/low grading. We have seen in the past where wells got better during low prices (because of high grading) and then worse as prices recovered. I’m not saying this happened (seems like well count is pretty stable across last three years). But just something to watch out for.
Sheng Wu:
Interesting. Donno. But one more reason we need more vintages before saying Marcellus in general is drilled out of good sites.
Anonymous,
I did a very rudimentary analysis of Marcellus, for production after 2019 I get about 182 TCF assuming only 3 best AUs get developed (Northern, Southern and Southwestern Interior Marcellus) for wells completed after Dec 31 2019. This vey rough estimate assumes that the average 2020 well reflects mostly the Northern Interior AU and that the releative EUR for Southern and Southwestern AUs is similar to the ratio in the USGS assessment (with the South and Southwestern AUs having EURs that are about 67% od the Northern Interior).
When we add 2019 proved reserves (139 TCF) and cumulative production to Dec 2019 (45 TCF) we get a URR of about 366 TCF for Marcellus. This would be my best guess based on this very abbreviated analysis. Probably 200 to 500 TCF would be a good window.
By the end of 2023 about 82 TCF has been produced from Marcellus, but at end of 2021 about 64 TCF hasd been produced, proved reserves at the end of 2021 were 145 TCF, so if peak occurs at half of my best guess URR that is cumulative output of 183 TCF. If output was equal to the average 2023 output for the next 11 years the peak would be reached in 11 years for the Marcellus if my URR guess is correct. If we assume output grows at 1% per year the peak is reached in 2034.
Dennis:
Shake your manly hand.
Dennis and Anonymous,
Boswell 2021 NETL report gives uTRR at 609~997TCF for Marcellus (PA WV OH NY, but mainly PA WV), Exhibit 4-8 table.
Patzek 2024 AAPG paper gives
“The Marcellus Shale is predicted to produce 85 trillion SCF (TSCF) of gas from 12,406 existing wells. By drilling ∼3700 and ∼7800 new wells in the core and noncore areas, the estimated ultimate recovery is poised to increase to ∼180 TSCF. In contrast to data from the Energy Information Administration, we show that drilling in the Marcellus outer area is uneconomic.”
I made an error in my analysis, I get a URR of about 340 TCF for this preliminary analysis, but need to do further work to get a better estimate. The EUR for a single Pennsylvannia Marcellus well is about 14 TCF for the average 2020 well. I don’t have data on wells from West Virginia or Ohio. Roughly 80% of Marcellus output comes from Pennsylvannia. The estimate does not take account of decreasing Marcellus well productivity since 2020 and for this reason is likely an overestimate, perhaps an F25 estimate (with a 75% probability the actual URR will be lower than this estimate.)
Dennis, something wrong in the math here…
” The EUR for a single Pennsylvannia Marcellus well is about 14 TCF for the average 2020 well.”
That would mean a single well was flowing at 50,000,000Cuft/d for 767 years. Perhaps you should look up these details again…perhaps it’s BCF?
Hideaway,
Thanks.
Yes I got the units wrong it is about 14 BCF for EUR of average 2020 Pennsylvannia Marcellus well.
is it possible the mid-stream gas pipeline and NGL consumers are making money?
They are also funded by the majors or the banks that finance all the gas producers.
In China, a reverse way happens, the majors also own the pipelines, and does not even allow private smaller operators’ gas to get in. They could lose money when importing Russian gas or LNG and sell at discount to end user, but the fee in the pipeline will make up all the losses and more.
You can see massive growth in USGS estimates at times, as they add new areas. I think the PGC method is more holistic and Bayesian reasonable than the USGS, one place at a time, method. PGC feels a lot more like the Hubbert “all the sedimentary basins” ideal, than the USGS, one place at a time. And any way you cut it…USGS has grown. And has long delays. And we will get more efficient and find new things over decades.
But I completely understand you liking lower numbers as a peak oiler. But you don’t get to claim nobody warned you and a meteor hit…not when PGC is there and you decided to ignore it. And PGC is real industry and academia. Not Laherre or the like.
Anonymous,
PGC estimates have more than doubled since 2006.
Yeah, you’re cherrypicking a bit though on start date. Growth has been slower more recently.
And in any case, if you look at estimates of same vintage, PGC is much higher than USGS.
Also, PGC doing whole country and updating every two years is better than the USGS process (less frequent and more hit/miss coverage).
I also suspect the PGC method is more granular (cell based). BEG, Patzek, PGC all have done estimates using much more granular approach. You would think the wide coverage approach would bias large, but it may actually be the opposite. I suspect USGS of implicitly undervalueing the core production. Pareto principle. The average is higher than the median. (Donno…but suspected.)
P.s. Have you read the Boswell paper yet? Very readable. And I even gave you specific pages if you are being a Zoomer who doesn’t like reading. 😉
P.s.s. Even Patzek, Hughes et al (hardly cornies) are double the USGS for Marcellus. I mean there is something screwed with USGS. Like they are mechanically operating an algorithm and not thinking, learning. (They don’t even comment on why their estimates changed. No mea culpa needed…just as a curious analyst what factors drove the change (EUR revision of existing? Bigger wells? Spacing? Other?) They don’t even explain…just drop off their sterile reports.
Anonymous,
You often cite peak oil estimates from 2005, so 2006 is hardly cherry picking, yes the increases have slowed may even reverse in time.
Dennis:
It’s not just about neener-neener. The point of showing that previous estimates had to be revised up is that we should not be sanguine this may not be needed again. Also that one should evaluate the reasons for changes and discuss why/how it has affected methods going forward.
PGC is not as transparent, reflective as I would like. But at least they do an every two year update, which is…something, I guess.
FWIW, if you graph the changes (plus production and deltaPDP reserves), PGC sort of looks to be converging. Doesn’t actually mean they are right. We may have much less (or more, watch out…remember the mensch!) production in the end than what they posit in TRR. But it does seem like their evaluations are becoming more stable. Or…at least their evaluation of their evaluations!
In general, with USGS (yes except maybe the last couple in the Bakken), we don’t see this sort of narrowing down, as they don’t do assessments frequent enough versus the evolution of the relevant growing production areas.
Again, the point is not just good guys versus bad guys…but about all of them being off and off low. I remember when BEG came out and said the Haynesville would continue decline unless prices rose to $5 natty. Instead the H turned around and had a whole new peak, and in a $3 environment.
I guess given all the history of people underestimating the shale, I would not be so quick to pick the smallest estimate among competing versions. Or to discuss uncertainty as small flavors of that lowest estimate (versus the uncertainty being estimate versus estimate). And if you have to bet, consider taking the “over”. (I warned you, year ago.) But even if you don’t decide to take the over (OK), embrace the idea that uncertainty is much higher. And include at least occasional spaghetti from the higher estimates (yes, like from the PGC). You could do it on 01APR, you mensch, you. 😉
Anonymous,
Consider that the USGS Bakken estimate from 2013 was very similar to their estimate from 2021, this suggests their methodology was sound in 2013. The methodology for the 2019 estimates for the Marcellus and Utica was no different than the methodology used since 2013.
We have had experts make all kinds of estimates, both high and low, industry insiders were claiming the Bakken/Three Forks URR would be at least 3 times more than the USGS estimates, I didn’t believe them then and I would not believe it now,
I am not an expert, I rely on the expertise of the USGS. Some industry professionals believe the USGS estimates are much too optimistic, you seem to think they are much too low, the fact that there are those that think my estimates are much too high and those that believe they are much too low might mean they are about right.
Time will tell. On the Marcellus, I have never analyzed this very carefully, I simply think the USGS estimates may bound the eventual URR fairly well. I will investigate a little further.
Read the part of the Boswell paper where they talk about different estimates (lit review). And read a few of the different ones. (Also look at the Patzek/Hughes 2024 Marcellus paper.)
It’s not just about me liking the big one and you liking the small one. Or Boswell being magic. (If I want to criticize it, I might ask why it is so little cited, e.g.) But you’ll learn something. Resource total is the key uncertainty. Not the faux physics “shock model” specific spaghetti. Even if you decide you hate the big ones and like the small ones, you should have some intuition why you favor one versus the other (hopefully more than just the answer looking nicer, but methods comparisons, data inputs, etc.)
I already gave you that they did better (so far) with the two most recent Bakken numbers. (But not the two before.) Like I said, lot of other place where they had to revise up. Including the Marcellus (the 2011 and 2019 look similar until you account for production and PDP increase, where you see a big upratchet). Since 2019, we’ve produced another 40TCF (and probably replaced or increased PDP reserves). Nothing about the production would seem to indicate incipient peaking. So I’d be pretty wary of buying into us having produced half the M. Odds are they will need to ratchet up again there too.
Anonymous,
The 2019 Marcellus estimate from USGS has 96.5 TCF for mean estimate of undiscovered resources, to this we add proved reserves (135 TCF) and cumulative production through the end of 2018 (37.5 TCF), this gives a total mean TRR estimate for the Marcellus of (96.5 plus 135 plus 37.5=)269 TCF. The Saputra et al, 2024 paper has an estimate of 180 TCF for the Marcellus, far less than the USGS estimate. You seem to forget that the USGS estimates undiscovered resources and we need to add in cumulative production and proved reserves to get the full TRR estimate. The USGS estimate looks pretty reasonable and perhaps too high based on the Saputra analysis.
The Saputra et al 2024 paper is excellent, see link below
https://archives.datapages.com/data/bulletns/2024/01jan/BLTN21078/images/bltn21078.pdf
Looking at the paper more carefully the mean URR estimate for the core areas is about 140 TCF, when the non-core areas are added the estimate increases to 180 TCF, it may be that the non-core areas of the Marcellus never become economic to produce, so a more realistic estimate might be 140 to 160 TCF for the Marcellus which suggests the peak may already be here as there has already been about 82 TCF produced from the Marcellus.
This paper produces a far better estimate than my quick back of napkin analysis (which was probably 2 times too high.)
Thanks for taking a look at it. I thought you would like it.
I think it is important to look at various different estimates, methods. Aristotle said “It is the mark of an educated mind to be able to entertain a thought without accepting it.”
I was blown away to look at the chart in the Boswell paper:
https://www.osti.gov/servlets/purl/1805223 (numbered page 4, pdf page 12, Figure 1-2)
1. To be honest, I need to reread each paper to see if their meanings for TRR differed. (Patzek different from USGS.)
2. Note Boswell (and others) have argued that what USGS uses as “TRR” excludes PDP reserves, but not PUD reserves. As they use undrilled locations as the basis of their TRR. (PUD are undrilled areas, essentially spots for infill wells…you didn’t even used to be able to call that a reserve.)
3. Also, for the Patzek paper, watch out that it came out in 2024, but is based on an (early I think, but have to check) 2021 dataset. Look at the methodology and the publication history. For all these papers, it is useful to see exactly when they drew the line for data timing. I remember the Montgomery paper did this well and in general USGS does it worse than academic papers (that are more detailed). But in many cases, there is some uncertainty about the exact timing of their analysis.
4. Note also that the year end reserves don’t come out until DEC FY 1. I.e. 12 months later. Or for 2022 until FEB FY 2, 14 months later! So, for example the USGS 2019 paper didn’t have the 2018 reserves number available (did not come out until DEC2019).
[None of this is to fuss at your numbers. Just FYI.]
Anonymous,
My understanding is that USGS does not include proved reserves, but there might be an issue with reserves that have been booked, but not yet developed, I do use 2018 reserves for the 2019 TRR as I realize that USGS would not have had the 2019 reserves when the paper was written, I also use cumulative output through the end of 2018. Note that only about 71 TCF of the 97 TCF of undiscovered resources is likely to be developed, so the TRR estimate would be reduced by about 26 TCF to about 243 TCF, still quite a bit higher than the Saputra et al 2024 estimate (at about 180 TCF), perhaps some of this is due to proves undeveloped reserves that should not be included in the TRR estimate, I do not have figures on that specifically for the Marcellus.
For the US L48 natural gas proved reserves in 20 about 38% of the total was proved non-producing reserves. So we could assume the proportion is the same for Marcellus shale gas. For Pennsylvannia and W Virginia the proportion of proved undeveloped reserves is about 43% for 2019, so this might be a better estimate.
If we use the 43% number on 135 TCF of reserves, that is about 58 TCF, so the TRR estimate would be reduced to about 185 TCF which matches closely with the Saputra et al 2024 estimate.
Dennis:
In 2019, USGS would (extremely likely) not have even had the 2018 reserves. They didn’t get released until 13DEC2019.
https://www.eia.gov/naturalgas/crudeoilreserves/archive/2018/
“U.S. Crude Oil and Natural Gas Proved Reserves, Year-end 2018
With Data for 2018 | Release Date: December 13, 2019”
I actually think the point is kind of philosophical though. Since what USGS does is look at undrilled locations. They never pull a reserve number at all (that’s others outside of them, doing that.)
What really matters to their estimate is the timing of their study data (like the vintage of the IHS or DI data that they bought.) I guess if they bought well data from end of year 2018, it would actually line up well to consider year end 2018 reserves as additional. (Even though USGS didn’t have that–we DO have it in retrospect.)
I do think it’s likely PDP reserves that matter. PUD reserves are probably implicitly part of the USGS TRR. As they are undrilled locations.
Another thing you mention is Saputra using smaller areas than USGS, it is not clear you are correct on that. They use 4 areas, the USGS has 6 assessment units for the Marcellus, 2 more than the Saputra et al 2024 paper. They have more cohorts, but that is because they use 4 different time periods combined with 4 areas for a 4 by 4 matrix, a nice analysis. I tend to use basin wide averages for different time periods, often annual EUR estimates. I may try to do a better analysis for the Marcellus and see what I find.
Dennis:
1. Saputra (what I have been calling the Patzek paper) says “Due to regulatory restrictions, it is impractical to drill and produce inside-city boundaries. Therefore, we exclude every grid cell that intersects urban areas, shown as the dark gray areas in Figure 3.”
As you can see, Pittsburgh is smack dab in the “red polka dot” SWPA sweet spot. I don’t think this radically changes things. I donno, 25% at the most? That is good land (and undrilled, for most parts). Everyone else includes that land. Not even arguing if you should include it or not…just that it is not apples to apples to exclude it, when nobody else does. I’d actually rather he have done two cases and showed us the with/without.
As far as the number of AUs…that has no bearing on which study has more area. I can take the same pizza and slice it less/more. And for that matter, it’s probably not about total acres, if they define the fringes differently, as there is so little relative resource there. But excluding part of the core , moves the needle (some).
2. I like their different well vintages. Everyone else has noted this. But USGS does not seem to make any allowance for it. 🙁
3. I relooked at Saputra and it is not as good as I thought in terms of gridding. (He gridded for infills remaining, but not for quality.) It’s actually a lot like the USGS approach in terms of just having those super big AUs and assuming the wells are the same and just having a haircut for the whole mass for sweet spottedness. BEG and Boswell are much more granular, which is sort of a very industry, geological way. In the past peakers have criticized too broad areal estimates. E.g. touting the Montgomery paper about the Bakken and EIA.
Probably you could drive estimates falsely in both directions. Imputing sweet spot performance to large areas (giving overestimates)–something peakers have always worried about before. Or smearing out the core into the non-core and losing the Pareto benefit of areas that more than carry their weight. I’m not clear how Patzek does their GEV and how “physical scaling” (whatever that is) works. Would have to reread those papers and they may be a little too technically worded. But there’s the potential of this latter effect (or even the former) occurring. Would rather he gridded the whole thing as someone like Montgomery would advise.
4. Relooking at USGS and even downloading one of their “input forms”, I get the impression the EURs and % success are very SWAGish. Big round numbers like 1, 3 or 6 BCF for EURs, e.g. in the NE AU input form. WTF? I really wonder how much work they did…or if it was sort of Fermi estimation (piano tuner business case). In the past, I have seen more detailed work from USGS (E.g. showing EUR development from well result type curves. At least Saputra DID show type curve development.) And more detailed reports, academic publications around the reports. But the USGS 2019 is sort of a mystery. (Let’s say we give them a pass on the 2011 one, which was even skimpier.)
5. I also wonder a bit about the “physical EURs”. If his EURs are much lower than others, is he right and others wrong? And how can we really tell, now? He cites old Barnett wells, but it’s really kind of a black box without digging through his method and basis for it. He could even be right. But it’s just not clear. We are not technical experts and end up in “trust me bro” land.
I wish he had some comparison of how his EURs perform versus others. And for granular areas, that we have lots of data and estimates on. (Not the type curves meant to show a massive AU.) Like, I liked the part of the Boswell paper where he compared 3 different EURs and sort of had his estimate and a couple that were 15-30% better/worse.
Now…this might actually be a case where his whole number is way off. (Like my comments about you using slightly different flavors of USGS…when there’s a 5:1 difference versus the BEG estimate!) I donno.
Again, if Patzek is just a bit worse than others (e.g. 25% worse), it’s not that big a deal. It doesn’t explain the 5:1 (or more) difference versus BEG or Boswell. And I’m not saying he should match them. Just…I want to understand what is driving the difference. Intuitively, it must be spacing or EURs.
Note, that BEG is not ideal here either. As their final report kind of looks like it was done to satisfy a grant requirement and there was no detailed academic publication on the Marcellus (as there had been for their much earlier work…even if wrong, you got the details). Boswell has a pretty decent explication, but I’m unclear of it’s quality.
Again, it’s not about low ones are great and big ones are crap. Or visa versa. But of what is driving the differences…and based on that, we can, maybe, evaluate which one is more likely correct. Boswell has only 3 cites, not a good sign. BEG doesn’t have a detailed paper. And Saputra is not maybe perfect either. Why did it take them 3 years to get published? (And yes, they just came out…but it’s been a preprint forever…and has 7 cites…all from Patzek and Saputra!)
The gas rig count has been pretty low for awhile, when new liquification capacity comes online they will bring on more gas, to meet market demand somewhere.
Does anyone have a data source for Quatar? 1332 daily production is stale, but I haven’t found anything better. Their largest oilfield Dukham started production in the 1920’s and was said to have been over 80 percent produced by turn of century.
Another big one is Al Shaheen which is uphole from the North gas field and wasn’t developed until the 90’s. It was developed with extended reach horizontal drilling, including a record setting well length of 40,320 feet in 2008. Production in 2000’s was 240,000 bopd.
The public natural gas weighted companies have been an awful investment over the past ten years. EQT, RRC, AR all down 40-60%.
I can attest these long term, low prices have hit conventional US gas hard. All of the majors and large independents fled the Hugoton gas field years ago. Its but a shell of its former self.
I am starting to get shut-in payments for dry or mostly dry gas wells. Mostly conventional vertical wells so far and in areas with old legacy O&G leases more favorable to the operator. Dry gas shale may be next to see a wave of shut-ins where they can and when it makes sense. May help to balance things out a bit in 12-18 months with LNG growth (Biden’s LNG antics aside) and reduced NG rig count.
Henry Hub prompt/spot is below $2. We have seen shutins before in that sort of environment. During Covid all over…and earlier than that in the Marcellus, when takeaway was too restricted.
Strip shows prices getting above $2 in June. And above $3 in DEC. Won’t happen exactly like that…who can predict the weather. But help is on the way. We are not going to be sub $2 forever. It’s not sustainable. Cure for low prices is…
Like I said, we have periodic slowdowns that are too quickly celebrated. Usually, it’s a pretty simple price story. Look at 2016. Look at 2020.
For US gas overall look at late 2011 to early 2013. The “shale gas” shows a decent increase there, but overall US gas was flat. See this post, “The shale gas revolution: is it already over?”:
https://cassandralegacy.blogspot.com/2013/07/the-shale-gas-revolution-is-it-already_7.html
P.s. And I’m not saying you made that error…just “Danger, Will Robinson”. Peakers are extremely ready to interpret a recent slowdown as a peak. Heck, we used to get this with the Bakken every winter! 🙂
You really tihnk they’ve forgotten? The problem isn’t that they don’t remember they claimed ridiculous things way back when, but rather they don’t modify the way they came to that conclusion so generally just keep repeating the same consequences with different dates praying for the day that the broken clock routine applies. Again.
Anonymous, you like to point out how all these ‘Peak Oilers’ got it so, wrong. In the previous thread, I pointed out at least 3-4 sources that actually nailed the 2018 peak oil date about 10 years before it happened, all your ranting and raving and you’ve never gave any estimate for URR, just that it’s an enormous number several times what USGS estimates…stop living in the past man!
You’re hard to keep up with. Who nailed 2018? Top 3 is fine.
And how long before 2018? And was this their sole prediction or did they have a tendency to predict a peak every few years? And how did they do on US predictions? And did they predict Covid demand drop and Ukraine war supply drop?
Frenchfries and I both provided you with the Energyfiles 2009 projection for a peak in ~2017 (2685 Gb).
I also provided several others from the 2009 ‘Global Oil Depletion’ report:
Uppsala forecast: Between 2008 and 2018. Initial rapid decline then leveling out to ~2%/year.
Miller bottom-up: 2018 w/ 2800 Gb.
BGR forecast: 2020 w/ 3000 Gb.
Total forecast: 2020
What’s interesting is that there were so many projections that all landed near 2020 timeframe.
2020 would have likely been the peak if it weren’t for Covid. If peak oil is not in the rearview, I would think there would be a lot of projections for some time in the future, but it does not appear to be that way. Multiple lines of evidence point to current post-peak environment…Saudi’s just said their decision to cut spare capacity from 13 to 12 is due to future energy transition…
Give me the links again, please. I really didn’t see your comments.
Look at previous thread.
Just did a “find” search for FrenchFries in that last thread. There’s no world peak predictions, of the 7 instances of his name. There is some SA stuff.
I THINK (hard to tell, but maybe) I found the post Kengeo is referring to.
https://peakoilbarrel.com/another-new-high-for-us-november-oil-production/#comment-769902
It was not addressed to me. And did not have a link. Not sure why this is perceived as me ducking a challenge. If anything, it didn’t seem worth a response, worth wasting time on…and I was dominating the conversation too much anyhow. But, if he will give some links, I will engage.
There are several good scenarios in the historical document below. Although the curves Jean Laherrére has fitted since then have changed, in 25 years his URR estimate has moved no more than 10%. Compare that with the IEA/IIASA folly.
http://www.energycrisis.com/laherrere/iiasa_reserves.pdf
Luis,
For C plus C less extra heavy, you are correct this have moved from about 2200 Gb in 2013 to about 2500 in 2023, roughly 10%, His estimates for unconventional have moved from about 500 Gb in 2013 to roughly 1000 Gb in 2023, about a 100% increase. In 1998 his estimate for conventional oil was about 1800 Gb, so an increase over 25 years of 700/1800=39%.
Dethreading, Sheng Wu:
“It is strange that Novilabs and Enverus with huge database did not do a study on the spacing or density of drilling, and find out the optimal spacing after balancing EUR, ROI etc, so as to derive an optimal URR for Permian or Bakken? Instead, they count just the drilling rigs and project the future oil production based on past results.”
1. I don’t know that either of those companies is really in the predicting basin URR business. They exist more to sell more granular information on existing production to operators.
1.5 Maybe you are confusing in EIA, which does a rig-based prediction in the STEO. However in that case (1-24 month timeline), it actually is rigs (well, really completions…but frac data sucks…so use rigs as a proxy) that drive production. And degredation (especially normalized by foot) is not really relevant to a near term prediction. What matters is amount of rigs and rig productivity. Yes, even if you chew up more rock. That will affect the long term outlook, but not the STEO.
USGS does some basin URR calcs, essentially based on type curves and spacing assumptions, usually dividing into a few subareas (core and fairway and fringe and the like). Rigs don’t come into their analysis at all. They are just trying to extrapolate production based on “nearology”.
2. I guess you can think of Rystad as a data provider company that opines on basin URR or makes several year projections. But really that’s PR. Their main business is not confirming or repudiating remnants of the Peak Oil movement. They exist to sell stuff to operators (“ShaleCube”). Like the rest of them.
3. A quick Google search shows that all the “shale data” consulting firms (Rystad, Novi, IHS, etc.) will sell you tools/data to look at spacing optimization. So…it’s not something they don’t do. Just something you didn’t know. And again, they exist to sell stuff…not to show analyses for peak oiler arguments.
4, Some operators have tried their own spacing tests. CLR had some interesting public results that they shared on spacing in OK. While the answer was unfortunate and hurt their stock price (it showed less downspacing feasible than expected!), it was a good analysis in structure and helped to educate the lay reader.
Basically EVERY extra fracked horizontal in a section has some combination of new oil and cannibalization (maybe except for parts of the Bakken, see below). You don’t want 0% interference as you’d leave massive amounts of oil behind–this is not a sandstone where everything will flow eventuall–gotta crack rock and prop it open. But at some point (Mike is right to use the term), diminishing returns kick in. So what really matters is the marginal additional production from the marginal additional cost.
If you look at it on a section basis, the insights become clear. Sure, add the extra well if it’s 90% extra oil (versus a fresh parent well). For one thing your pad costs or at least road/gathering costs are sunk. But if you’re getting 10% (of a fresh well), the extra well is not economically viable. Note that you still “get more oil”. It’s just too tiny an amount to justify the cost. It’s an NPV calculation…you keep adding wells until the marginal extra well has negative NPV. It’s not about having perfect isolated individual wells…not about getting every drop of oil. It’s about max NPV from the section. Not even max NPV/well (that would mean zero child wells). Max NPV of the land.
You can even get fancier and think about how to adjust the frac intensity versus spacing (NoviLabs has an article on this).
Also, from the Bakken, the main reason why “child” wells don’t seem to show as big a problem as in the Permian or Eagle Ford is because of the amount of older wells with lighter initial completions. In those cases, the frac hit actually is beneficial to the old well or at least neutral. But it doesn’t apply with fresh Bakken parent wells, with modern (bigger) completions. Or maybe the Bakken has different geology. Or both. The “earl” business is complicated. 🙂
Any comments on the Endeavour Diamond Back Deal?
Apparently this will be the largest Permian pure play. If the Permian is near peak, what is the game plan. Reduce overhead in combined company?
In theory, the combined DB/Endeavor entity could increase production in a declining overall “Permian” production environment. They claim ~6,100 premium (<$40 wti) locations combined, so lots of dial it up potential if they want to.
Appears the combo has good acreage overlap for efficient development and a good footprint of Viper minerals to raise NRI without increased development cost.
Overall, probably a healthy scalable combo with good synergies, but I don't own any DB or Viper so not involved.
Here is the press release, with some details on production and employees, and the transaction.
https://www.diamondbackenergy.com/news-releases/news-release-details/diamondback-energy-inc-and-endeavor-energy-resources-lp-merge
I’m not sure what the end game is. Actually I sort of don’t like it…prefer a Permian that is less concentrated, not more (more free trade).
From the Endeavor POV, I’m sure they just sold to the highest bidder. And there would have been an auction. They’ve been waiting years for this moment. And had Goldman advising them.
From the Diamondback POV, not entirely sure the rationale. The cynic in me wonders if this is about Diamondback trying to avoid getting purchased themselves, by getting bigger. (Like Oxy a few years ago.) By that, I mean the CEO and board and execs avoiding getting purchased…the shareholders would benefit from getting purchased.
Here is the lease map:
https://rbnenergy.com/sites/default/files/field/image/Fig2_Diamondback and Endeavor Acreage in the Permian’s Midland and Delaware Basins.png
Diamondback didn’t emphasize boundaries in the press release although there are some. Also, it’s same basin (not Delaware). FWIW, Endeavor looks like it has the better rock.
P.s. Listening to the conference call (at 2x speed) and looking at PPT now. Will make comments in second post.
The Diamondback acquisition puts the spotlight on the ‘land grab’ across Permian Basin
This seems to be the bottom line, dropping price for NG is an issue.
“At this point the upside from exploration is gone. The geology is very well known. They know the technology now well, ” Ed Hirs, economist and energy fellow at the University of Houston, told Yahoo Finance. “There really will be savings … you don’t need extra CFOs, CEOs.”
A by-product of oil drilling is natural gas, often referred to in the industry as associated gas. As operators drill further into the ground, the gas-to-oil ratios on wells increase.
Hirs said companies have been forced to lower costs amid an oversupply of associated gas. “As the wells turn more gassy, they have to lower their operating costs,” he said.”
https://finance.yahoo.com/news/the-diamondback-acquisition-puts-the-spotlight-on-the-land-grab-across-permian-basin-200518520.html
I think his point on less exploration, more development efficiency is good. I don’t think the “getting gassier” is really relevant financially. Just word salad for the media. If you look at revenues, ESPECIALLY in the Permian, with depressed gas prices, it’s really the oil that matters, 10:1 versus the gas. Yes, even if you are becoming more gassy. And it’s not THAT awfully gassy, even if it is a bit more gassy than it used to be.
Anonymous,
The lower gas prices make more of the wells marginal, the profits from these wells are not that good at $80/b oil and $3.50/MCF gas, a drop in natural gas price to $1.50/MCF (as is the case for many operators in West Texas) or less is a problem. Prices might rise, but claiming it doesn’t matter suggests that it is not a problem, that is not the case, no profits for an oil or natural gas producer is indeed a problem.
It’s not binary, Dennis. It is relative. You can’t make the point that BOE is silly…and then at the same time complain about depressed gas prices. It’s a 10:1ish ratio of oil to gas revenue. Sure, gas matters. But a 50% drop in oil is ~1/10th the problem that a 50% drop in oil is. Duh.
it is not “gassier” really bad, it is the accompanied sharp drop in oil
I listened to the conference call and went through the PPT, related to the deal.
1. FANG is actually much more logical and transparent than the average fluffhead IR call. Doesn’t mean they will make money. But still…way better than the EOG fluff or the XOM “trust me bro”. At times, they were even conservative or pointed out downsides.
2. The one thing I hate about FANG is the whole minerals side business. Hate complicated structures. Hate monopoly/monopsony relationships. But that’s not really an aspect of this deal.
3. Most of the synergy is supposedly from taking Endeavor to FANG’s lower completion cost. Simulfracs…whatever those are. Not much from other laterals or lease boundaries…that is upside.
4. They do posit some synergy in GA (corportate structure, finance, etc.).
5. Not huge boundaries, but a fair amount. They are honest with saying some are developed already, so not long lateral candidates.
6. At the end of the day, oil price will have a huge say on if this deal makes money. If you are a peak oiler permabull…then great. If not…watch out. But at least the two companies are very similar and close and FANG will do fine running the assets. It’s not a moonshot.
7. There are some aspects of antitakeover prohibitions in the Endeavor equity that concern me. That is good for FANG execs…bad for shareholders.
I look for FANG to be bought within a year or two after this closes.
The OPEC MOMR is out with OPEC 12 data for January. OPEC crude was down 350 Kbpd to 26,342 Kbpd in January.
Preliminary data indicates that global liquids production in January decreased by 0.6 mb/d to average 101.8 mb/d compared with the previous month.
I think that the total liquids data is a major upward revision from last month.
Norway’s Top Oilfield Could Hit Peak Production by Year-End
The Johan Sverdrup oilfield in Norway, Western Europe’s biggest oilfield which came online in 2019, will likely reach peak production rates by late 2024, earlier than expected, Upstream reported on Tuesday.
While this is bad news for Norway’s ambitions to continue strong oil production, Johan Sverdrup is now producing more than initial expectations and operator Equinor hasn’t changed the estimate of recoverable reserves of almost 3 billion barrels of oil equivalents, Upstream’s Norway Correspondent Russell Searancke writes.
The biggest European oil field discovery in decades is peaking in just 6 years. This should be big news.
Frugal
That is more or less the news. If it is bad or good is not so easy to state these days. The field being the last big “hurray” before tail production overall is the case from the Norwegian sector of the North Sea. Admittedly, I still think there will be a long tail production planned from offshore in Norway in the long term. A guess would be that the mentality in Norway and also the rest of the Nordic countries would allow to take measures to make a low carbon society work sometime in the future. Because it is somewhat realistic – the main bottleneck being dependency on global trade for the economy to function like now (the global trade dependency is also probably applicable to most other nations around the globe).
By peak it means end of plateau. The peak month might turn out to be last June, which was the first month of full production from the phase II development. It is cutting water quite quickly rising from around nothing to over 10% in the last year, and accelerating slightly recently. Often at around 20% the total liquids handling and/or water injection capacity of a platform will start to be reached and wells may need to be choked back.
I think someone here thought that Sverdrup would be creamed quite fast a couple of years ago? And also got some flak for it.
Quite sure it was me…
(But I still hope for a long tail)
Equinor hasn’t overproduced, it wouldn’t be allowed by NPD. It is that the nameplate throughput was designed to be higher than normal for the given reserves so the plateau would likely be shorter, and with the normal uncertainties around well and reservoir performance as another factor..
I.e creamed faster than normal, whatever that may be.
But I´m not surprised, given the state of things.
Javier Blas
@JavierBlas
·
Feb 12
One statistic that blows my mind:
Together, the US and Canada pump today a **quarter** of the world’s oil. One-in-four barrels; 25%!!!
(Think about the magnitude of that market share, and now think about the climate policies — and politics — of Justin Trudeau and Joe Biden
what can I say…..other I told you so…US energy enjoying the the best of times and in a short 8 months when we change governments and get the wind behind our backs we can breath easy as energy security for ourselves and our allies can be counted on for the foreseeable future. I wont go into how green energy companies are crashing faster than Joe Biden’s mental acumen or the fact that EV growth is moving slower that “molasses in the winter time”. All good news. Missed by nat gas forecast but can’t win them all.
Trump was terrible for oil prices.
I’m not seeing how he will be the wind at producers backs. He brags about $40 WTI and thinks that should be the high end.
Texas Teat Wo said:
“Together, the US and Canada pump today a **quarter** of the world’s oil”
Yet the USA has to import far more crude oil than they export. I’m not going to show the data unless you challenge as this was discussed here recently.
Yet the USA has to import far more crude oil than they export.
No, they do not. You are still confusing C+C with Total Liquids.
Petroleum Overview
The last three columns in the data below are:
“Imports,” Exports,” and “Net Imports.” All data, in those three columns, are total liquids. All data in the first three columns on the left are C+C.
As you can clearly see, in December, Imports were 8,520 kbpd, Exports were 10,796 Kbpd, and Net Imports were -2,276 Kbpd. That’s negative 2,276 Kbpd. Negative imports are exports. In December, we exported 2,276 Kbpd more than we imported.
Please Paul, learn to tell the difference between C+C and total liquids. Total liquids are C+C and also natural gas liquids, biofuels, and refinery process gain.
2019 was the last year we were a net importer. Every year since then the USA was a net exporter.
Ron,
(1) I specifically called out crude oil
(2) Unrefined crude oil imported into the USA is relabeled a domestic source after refining.
“Together, the US and Canada pump today a **quarter** of the world’s oil. One-in-four barrels; 25%!!!”
Deconstruct this number. We can look up that the USA extracts about 12 million barrels/day and Canada about 5. So that means 17 million barrels is the sum and if that’s 25% , then the world is 4*17 = 68 million barrels/day.
This is low so next iteration is to consider what “oil” implies.
I find myself reluctantly backing you up. Round numbers (been a while and estimating, so exact numbers may be off, mea culpa):
We need about 18.5 MM bopd C&C to go into the US refineries. We are making about 13.5 MM bopd. So we need net 5 MM bopd from outside.
However, we are a net exporter of refined products. Probably need something like 14.5 MM bopd to keep the refineries churning to supply soccer mom SUV needs. The excess is products that can be sold. We are (slightly) a merchant refiner. Our refining industry is bigger than needed for domestic needs. Singapore is the most famous extreme example of this. Doing about 5 MM bopd, but 3MM bopd is headed to export (China and the like) and only 2 MM bopd for own needs.
The point of including refined product net exports is that if we just think about keeping the soccer Mom’s healthy, we don’t need the full 18+ MM bopd, but the 14-15 MM bopd serving domestic needs. It would suck for refiners. But if you just think like a mercantilist, we don’t need those extra barrels…so netting out exported products for imported crude could make sense.
However, massively complicating this is the export of NGLs. In particular propane. The issue is NGLs are considered a “product” . This sort f makes sense. they didn’t coome out of the 3 phase separator. And the gas plant is a big facility sort oof like a refinery. (Not really, but still way more massive than the wellpad three phase separator). However, propane and ethane are mostly used for petrochem crackers. Don’t serve the transport market. Very different than gasoline/jet/diesel (or C&C).
Pentanes plus (“plant condensate”) are actually a liquid HC NGL. Are blendable into gasoline. But this is pretty small part of NGLs. (Butane is sort of in between…but I would argue closer to propane, economically.)
And then add on top of that, ethanol and “refinery gain” and the whole thing becomes a bit of a mess.
So…yeah, depending how you slice it, you can say we are a net exporter. But more realistically we are still a slight importer to keep the soccer moms happy (although getting close to par). and definitely an importer to keep merchant refiners running.
USA is a net importer of crude oil.
Agreed. That’s what I said.
“Round numbers (been a while and estimating, so exact numbers may be off, mea culpa):
We need about 18.5 MM bopd C&C to go into the US refineries. We are making about 13.5 MM bopd. So we need net 5 MM bopd from outside.”
Pretty similar to your chart (which is maybe still a little Covid depressed, but similar shape.) ~16MM needed. 12 MM from the field. Need net 4MM imports. (6 imports minus 2 exports.) Same story like I said. And I said I was backing you up.
Agree, my take:
20.1 mb/d of crude/products which are from the input of 19.1 mb/d crude (production+imports+stocks). The adjustment is the refinery gains of ~5.5% (20.1/19.1).
The average gain in 2022 was 6.3%.
So excluding the gain, we have:
6.6 mb (19.1-11.87) – 2.8 mb (3.8-1)
meaning the net imports are 3.8 mb (1/4).
This means that every 3 barrels produced we need 1 barrel imported.
Pretty far from being a net exporter….
https://www.eia.gov/todayinenergy/detail.php?id=60622
“Although exports increased in the first half of 2023, the United States still imports more crude oil than it exports, meaning it remains a net crude oil importer. The United States continues to import crude oil despite rising domestic crude oil production in part because many U.S. refineries are configured to process heavy, sour crude oil (with a low API gravity and high sulfur content) rather than the light, sweet crude oil (with a high API gravity and low sulfur content) typically produced in the United States.”
Why did American and British soldiers die in Iraq?
https://oilprice.com/Energy/Energy-General/Russias-Gazprom-Awarded-Iraqs-Huge-Nasiriyah-Oil-Development.html#:~:text=Russian%20gas%20giant%20Gazprom%20has,barrels%20of%20reserves%20in%20place.
https://oilprice.com/Energy/Crude-Oil/Russia-Takes-Control-of-Iraqs-Biggest-Oil-Discovery-for-20-Years.html
Tax payers paid for the bombs which destroyed the country and then paid Halliburton to fix some of what was destroyed. The oil wealth should have been controlled by the American and British until all the destruction to the water plants electric Grids and homes was fully repaired.
https://www.aljazeera.com/news/longform/2023/4/5/iraq-war-20-years-on-visualising-the-impact-of-the-invasion
The Iraqi government is utterly corrupt and the Americans allowed this to happen.
It is utterly sickening that the Russians have any control there.
Why do Americans think they can kill people anywhere in the world?
These questions are to be directed to the Bush/Cheney administration and their voters.
You didn’t mention that the total price tag of that invasion will approach $3T when all is said and done.
And that the aftermath gave a magic carpet of enhanced influence and control to the
Islamic Republic of Iran.
Hickory
What did Obama do in all those vital years?
They are all incompetent scum, only good at feathering their own nests.
The history of American brutal foreign policy goes back a long time. America overthrew the only democracy in Iran and installed a dictator, the chaos lasts til this day. America overthrew the democracy in Chile and thousands were killed by the government installed with American help.
US supported the dictatorship in El Salvador and helped cover up murders
I think America has attacked and helped destroy more countries than any other in the history of the world
Charles…we can review all sorts of history,
however you brought up Iraq.
I was responding about that.
Hmm, charles did you mean to post this here? And aren’t you in Europe? Might you know anything about the Marshall Plan?
Obviously it swings both ways, Iraq being maybe the worst example of impact from american geopolitics.
Over 60 years of Peace Corps has surely had a net positive effect on areas served.
Likely many billions of dollars spent.
As a (the) global superpower, mistakes were certainly made…not sure calling heads of state ‘scum’ is entirely accurate, sounds like you hold some serious resentment though, hope you can work thru/come to terms with those issues! best luck
Charles,
Pretty sure UK takes the cake in that regard.
Charles, you are clearly nothing more than an American-hating ignorant asshole. Knock it off NOW!
Charles, The history of American foreign policy goes back not very long at all. The Brits have invaded the most countries. Here’s a list of the 22 countries NOT invaded by Britain:
Andorra
Belarus
Bolivia
Burundi
Central African Republic
Chad
Congo, Republic of
Guatemala
Ivory Coast
Kyrgyzstan
Liechtenstein
Luxembourg
Mali
Marshall Islands
Monaco
Mongolia
Paraguay
Sao Tome and Principe
Sweden
Tajikistan
Uzbekistan
Vatican City
https://en.m.wikipedia.org/wiki/List_of_invasions
It’s important to note that the concept of “invading” countries can be complex and controversial, and different perspectives may exist on specific events.
My take on the FANG/Endeavor M&A: https://www.oilystuff.com/forumstuff/forum-stuff/grasping-at-straws.
The Permian tight oil “revolution” is winding down.
If the vast, unexplored USGS assessement of the Permian were actually valid, why is the shale sector spending $130 billion dollars on buying every available parking spot left there is, at $4MM a pop, in core areas?
Because the USGS thing, and all that stupid URR, is not valid…its a hobby for Reservegrowthrulz and Dennis Coyne. Ignore that. Use common sense.
Out there on the flanks, in T3/4 & 5 stuff, wells sucks in West Texas and New Mexico. Nobody wants to go out there. EUR’s will be half of what they are now, and in the good stuff, the T 1/2 stuff, EUR’s are declining rapidly…now. Down 30% in three years.
Do your own work, from the bottom up. If you can’t afford to buy the data, don’t offer an ANALysis. Please don’t listen to a lot of the bullshit here.
Natty is down again today. In the Permian (and I keep referring to that because that is where ALL of the world’s hope remains), it matters. Gassy oil wells are turning into oily gas wells and a buck difference in gas prices and all the goodies associated therewith, now means the loss of $2MM over the life of a typical well. When you are trying to work with 150% total ROI over the life of a well, thats a big deal! Dismissing the benefit of gas to Permian well economics is shortsighted and agenda driven.
RGR, or Annoymous, whomever it is, is correct…with natty prices this low, most of the Permian will just take to burning it up a fucking flare stack. I dont blame folks for being pissed about that. Its a crime. I never did that in 50 years of being a Texas producer and I am ashamed of anybody that even offers it up as an…excuse.
Why in God’s name is America doing this stupid shit to itself?
For crude oil, and hopefully LNG exports. Over 80% of all Permian tight oil production goes to the beach and sails away, forever. To make a buck. Now. The future does not matter. Our country’s energy security does not matter, your children’s energy future does not matter, none of that dumb stuff matters. Its all about money.
Idiots are in charge of YOUR oily/gassy future. This November, conservation of US oil and natural gas is about the single biggest vote you can cast.
Try and think past next week.
Mike and Anonymous,
two observations,
1. The URRs are based on initial production/pilot mode, and not considering overdrilling.
I watched Scott Lapierre’s “bubble point death (BPD)” in the shale oil patch about 5 years ago with suspicion, and only to be fully convinced just about one year ago. There are still many hold the unconventional view — “BPD is not happening with shale oil”. Now, it is time to give an estimate of how much extra capital is wasted to get how much less oil and gas.
2. The gas part
The methane or dry gas part processed from the associated gas only is about 1/2 of the total ass gas input, and with the Waha difference the price realized is only about $1.5/MCF on average for dry gas after processing? Then, at current GOR of 3MCF/bbl, and oil average price of $72, then each BOE will break down roughly to 0.67BO, 0.17BOE of NGL and 0.16BOE of processed dry gas (PDG), or valued at $48, ~$10, and $1.5, for BO, NGL and PDG respectively.
The price for NGL is based on EIA link here, https://www.eia.gov/naturalgas/weekly/#tabs-prices-4
after taking account into heating values , note the price for NGL has been quite stable compared to dry gas, and the natural gasoline price per 6MCF or BOE by volume, is currently at $78, same or higher than WTI.
So, if the discussion that TX shale oil getting heavier due to denser oil and more natural gasoline separation, then there is really not an incentive to get denser API<30deg oil, but rather to get more natural gasoline.
However, don't get confused — the BPD accompanied denser oil and more natural gasoline is still at the expense of precipitating accelerated decline of oil production and also faster gas decline as well.
1. Bubble point death. What a great name! Even if the EURs aren’t shifting, it’s such a cool term, you can scare people. I don’t want to die at all…but definitely not from bubble point.
2. Oh…and the core is all drilled up and wells will turn to crap. Been hearing that one for over ten years. Maybe finally starting to come true–normalized of course! Had several false alarms…remember hearing this in 2015 and instead wells got better . And that improvement sure didn’t get well reported in peak oil land as they were getting better. But OK, maybe finally, worm is starting to turn your way.
3. All that said, somehow we are still doing 13.3 MM BOPD and 128 BCFPD. And with less than 650 rigs in the field. Those evil frackers must be getting really fast at poking holes in the ground. Don’t they know that it’s bad manners to outrun the Red Queen!
https://www.youtube.com/watch?v=tuxbMfKO9Pg
Mike,
Do you expect, or do you think it’s possible that drilling stops altogether across all the basins despite there being some Tier 1 and 2 inventories left?
The poor economics, high indebtedness and lack of adequate shareholder returns makes me think a sudden stop in drilling is coming. No one is going to want to continue drilling at these prices.
Anon, the difference in today’s tight oil business and the one that Annoymous believes will never disappear is the availability of outside CAPEX. Nobody will touch these guys anymore, and rightfully so. So the shale sector is now forced to function standing on its own two financial feet and working from net revenue. It never had to do that until just 18 months ago and its managed to keep up the facade, mostly because of DUC’s drilled with OPM, COH and deferred debt. Thats all over and the tide is going out. The days of growth before profit, and incinerated investment money are over.
Now the shale oil sector’s well productivity is declining, its wells are getting gassier, and watery, and inflationary costs have eaten their legs off. Now there is so few Grade A drilling locations left the industry is going deeper into debt with M & A’s to pay $3-4 MM per remaining parking spot. The economics of adding $4M to well costs is devestating. That will reduce net revenue even more and make it even more difficult to stay on the drilling hamster wheel.
They’ll drill that flank crap out in Culberson, and Irion Counties, because they can’t help themselves, but those well costs will be higher and EUR’s even lower.
Its winding down now, no big deal, and just part of the oilfield. So yes, I agree with you. If all that stuff out yonder was so good they’d be out there trying to make it work. $75 is a great price. Chevron’s wells in the Delaware have declined 25% the past three years; if they could go somewhere else they would. Oh yeah, they did…to the DJ. Just like EOG hauled ass from New Mexico to Ohio.
Actually the tight oil sector is scared to death of the flank Permian stuff. That is why they have spent $130B the past year or so trying to stay rooted in the cores drilling wells 660 and 330 feet apart. Its the nature of the business today, all these shale “Wildcatters, end up money engineer weenie necks.
Thanks Mike.
I’m assuming you’re in the cliff camp when its comes to shale – Wile E. Coyote is a 100 yards over the edge?
February IEA Report
Highlights
– Global oil demand growth is losing momentum, with annual gains easing from 2.8 mb/d in 3Q23 to 1.8 mb/d in 4Q23. A sharp drop in China underpinned an 830 kb/d decline in global oil demand to 102.1 mb/d in the last quarter of 2023. The pace of expansion is set to decelerate further to 1.2 mb/d in 2024, compared with 2.3 mb/d last year. China, India and Brazil will continue to dominate gains.
– World oil supply in January posted a sharp decline of 1.4 mb/d m-o-m after an Arctic blast shut in production in North America and as OPEC+ deepened output cuts. Record output from the US, Brazil, Guyana and Canada will nevertheless help boost non-OPEC+ supply by 1.6 mb/d this year compared to 2.4 mb/d in 2023, when total global oil supply rose by 2 mb/d to an average 102.1 mb/d.
– Global observed oil stocks plummeted by about 60 mb in January, preliminary data indicate, with on-land inventories falling to their lowest level since at least 2016. In December, global stocks rose by 21.6 mb as a surge in oil on water (+60.7 mb) more than offset draws in on-land inventories (-39 mb). OECD industry stocks fell by 24.1 mb in December, reflecting declines in all three regions.
It is interesting to compare what the EIA STEO has to say regarding increased Non-OPEC Supply for 2024.
Canada 126 kb/d
US -90 kb/d
Guyana 80 kb/d
Brazil 68 kb/d
Total 184 kb/d vs 1,600 kb/d by the IEA. Where is all the rest coming from?
Those production numbers are for all liquids except for the US which is C + C.
Dec Jan
Russia 9.48 9.44 (Close to Argus in post and heading down)
Total OPEC 27.01 26.73
https://www.iea.org/reports/oil-market-report-february-2024
Curious, I would think a lack of demand would have WTI prices in the $60-$70s, yet they are at ~$80…
The demand discussion is a bunch of nonsense, even the near complete shutdown of world economies in 2020 still had strong oil demand…
Kengeo,
Wrong, demand was very low during the pandemic, that is why oil prices went negative for a brief period.
ND Director’ Cut is out. I didn’t see the pdf or video on the website yet (at least the former should be up soon). I did listen in live on the MS Teams call.
Oil: down slightly, -7,000 bopd. Cause start of winter. DEC weather not that bad, but completion dropped because of operator planning for winter.
Gas: up over a percent. Set a new record.
Big picture, oil: Oil crossed the 5B from Bakken threshold. They expect next few year to be flat to slight (10% growth). Few places where regulatory issues (flaring restrictions, gathering snafus, ownership fights) are holding up specific small spots of the basin.
Big picture, gas: Expected to grow 30% over next few years (very different from oil). Gas processing OK now, and is added periodically. However out of basin methane interstate transfer is a concern. They don’t have the power to fix that and it is pretty hard to get new interstate pipelines past the anti-infrastructure protestors and regulators.
Prices: Oil OK, they’re happy. Whining about natty gas prices. Lowest since mid 90s.
Interesting podcast, with one of the guys from Enno’s company:
https://www.youtube.com/watch?v=t5HUD3gEhQg
Listen to it at 2x speed if you hate the time for long podcasts. From ~20:00 to ~35:00, they discuss Permian well quality drop since 2020. The NoviLabs guy says it’s mostly a “de-highgrading” phenomenon, post Covid.
Interesting discussion on 3D drilling. They are drilling above and below the main levels. Best Permian part is from 27:00 to 40:00. At 40 they discuss Vaca Muerta. Better than Permian.
Here is one of these financial articles that politicans love so much (I’ve seen more of them). No problem bringing oil price down to 40$, shale production growth will continue…
https://oilprice.com/Energy/Energy-General/Oil-Majors-Pursue-Projects-with-30-Breakeven.html
Exxon doubles output of Permian wells, and reduces costs.
Let’s see what Mike says about this BS.
I’ve seen nothing of this in the free part of the data, too.
I don’t know what to say about this, Eulen; Woods said this about frac technology and refrac’s almost a year ago. Old news, it is. Exxon has been promising 1MM BOPED tight oil volumes since 2018 and have been backing up ever since. At the end of 2024 it hopes to be a 650 BOEPD. Breakeven prices are the 2nd dumbest metric in the shale biz, behind rig efficiency.
Tight oil and tight gas are always getting better, cheaper, more of it awaiting even more technology that will make it even better still. It will never end. Like refuting peak affordable production by the peak oil defamation league. Its similar to getting older and refusing to accept it. A face lift, a new Corvette, Botox…you keep getting older but at least you feel better about it.
Mike/Eulen
Here is a more realistic story
Occidental Cuts Two Permian Rigs as It Targets Flat Oil, Gas Output
(Bloomberg) — Occidental Petroleum Corp. will reduce spending on US shale operations as it seeks to improve cash flow to repay debt, resulting in largely flat production this year.
Capital investment in shale and exploration will be trimmed by $320 million, and two rigs in the Permian will be idled this year, the Houston-based company said Wednesday. Spending will increase in the Gulf of Mexico, chemicals and the enhanced oil recovery business.
The drop in Permian spending is “due to efficiency and moderating activity,” Occidental said in a presentation.
The move is a reversal from years of increasing drilling activity in the Permian, where Occidental is one of the biggest producers. The extra cash flow generated from the slowdown will help pay off debt linked to its recent $10.8 billion acquisition of private Permian producer CrownRock LP.
Occidental is targeting production equivalent to 1.25 million barrels of a day this year, just 1.3% more than its output in the fourth quarter. Capital spending will be about $6.5 billion, less than the $7 billion estimated by analysts.
Does moderating activity translate into less drilling/fracking?
https://www.bnnbloomberg.ca/occidental-cuts-two-permian-rigs-as-it-targets-flat-oil-gas-output-1.2035006
Mike,
You are 100% correct. The dirty little secret is that the new wells being drilled have far less pressure than original pressure than the first wells drilled. The Permian Pin Cushion has been over drilled and when you see consolidation like the Endeavor-Diamondback merger, all in the industry know the game is just about over. The narrative will be “greater efficiency” but the truth is actually the only way for companies to grow is consolidation and reduction of overhead coupled with a reduction in capex for drilling. 1+1=1 in terms of increased overall production for the consolidated companies post merger.
The wells are getting gassier meaning significantly lower profitability as well as a clear sign the reservoirs have reached a bubble point and gas will be coming out of solution at an ever faster rate.
I have no clue when the Permian Production will peak but I do know the latest waves of consolidation loudly rings out the fact that production growth in the Permian is getting harder and harder.
Oxy knows this and is doing the right thing by dropping Rigs and I anticipate other companies will find some sanity and do the same thing.
The party is getting late and almost over………………………….
Mike is the king of the metaphor.
The story is nothing new, it played out with the conventional peak, too. Hubert theory says the production profile should be a symmetrical bell-curve. But if you look closely at the decline side, it’s a much fatter tail.
That’s Mike’s botox/facelift story: improved technology, secondary/tertiary floods, stripper wells, other EOR. It’s not nothing, but didn’t reverse the peak…
Kdimitrov,
For the US, tight oil did indeed reverse the 1970 peak.
Dennis,
Tight oil is chemically oil, but geologically it is different than what Hubert considered “oil” in the 1950s. All these “peak oil” theories considered a very specifically defined “oil”: liquid hydrocarbons pools that have migrated into a porous reservoir and are capped by a cap rock.
They were more or less proven accurate, but like I said, the decay deviated slightly from the predictions due to various EOR improvements…
LTO and tars are a completely new game in terms of geology/extraction.
KDIM:
1. Hubbert excluded oil shale (you know the Synfuels stuff). And tar sands. He did NOT exclude shale oil, which is not the same as oil shale. Very different.
1.5. Note: He actually does somewhat discuss both tar sands and oil shale later…and includes them in total hydrocarbons, but says they are just starting to be developed…and does not include them in his crude over time estimates (and does not make estimates over time for either of these).
2. Shale oil (not oil shale) actually was produced in limited quantities, but still for sure it absolutely was, from sweet spots, with vertical wells. The Permian was produced (from deep shale layers) in spots. And so was the Bakken. So, those are not new strata. Not new basins!
3. Hubbert makes the very interesting point of looking at multiple peaks and a future peak larger than the old one, in IL state. He explains this as a step change from technology. Moving from surface geology to seismic exploration. He posits the possibility of future technological advances releasing even more oil.
4. Note also that neither horizontal drilling nor hydraulic fracturing were unknown when Hubbert wrote hiss paper.
——–
Net, net: the fundamental problem with Hubbert 1956 was a too low resource number for world, US, TX (oil and gas). This is a very old problem with total resource estimates. Hubbert had actually made a similar mistake in the 1940s. (Mason Inman discusses it in his book). And we’ve had people since (Campbell, Dennis Coyne, USGS) who have had to ratchet up their TRR numbers.
It is a very common thing. Even when the people doing it think they are being generous, they’re not. And they end up having to kick the can down the road and make a revised “eventually the clock will break” prediction. But given these repeated mistakes, they really should be careful about their TRRs, especially when they pick low ones from competing estimates. Conservatism has been a bad bet.
Kdimitrov,
Perhaps, but I imagine Hubbert was aware of the existence of this oil, but believed it would never be profitable to extract.
Anonymous,
Yes, I underestimated both extra heavy oil and tight oil URR when making early estimates in 2012. In July 2015 I had World C plus C estimates for URR that ranged from 3100 Gb to 3700 Gb with a best guess of 3400 Gb. I doubt these estimates will be accurate, though the low end seems most likely to me, but my current best guess is on the order of 2800 Gb, similar to one of my estimates from 2012, I expect it will be in the range of 2600 to 3000 Gb for World C plus C URR.
I wonder if that is a little bit of recency bias making you adjust your forecasts. Did we grow a little faster and you revised up? Then had a pause last few years and you revise down?
Or did you learn something different about the resource or how to evaluate it to make you change your Bayesian priors?
Anon,
Thanks for the illuminating comment.
Clearly, though, LTO is a qualitatively different resource, which was grossly underestimated by Hubbert, even though his estimates of conventional were pretty good.
We can say, I guess, that there are two real-life deviations from the Hubbert model: a small one in the decay of conventional, and a larger one in the LTO. The former is the result of technology, the latter is the result of another resource completely.
The discussion here started with comments from XOM on new recovery tech, that was supposed to be a game-changer. I think, given history, it will probably be incremental improvement but I am skeptical that it will be a game-changer.
Historically, the game-changers (step increases in TRR) have come from including new resources, not from technological improvements in recovery factors. This is not pure semantics. As you say, the HZ well and fracking tech was there in the 1950s, people were just not interested in the shale oil. Same for tars. Somebody here even mentioned coal retorting: people were getting liquid hydrocarbon from coal 200 years ago, and that resource is far, far from being exhausted… Should we include bituminous coal in oil TRR? Why not? The tech has been there for centuries, the resource is there…
The point is, you are being too harsh on people estimating TRRs: they have done it historically in the context of a particular resource and the estimates have been more or less accurate. Adding qualitatively different resources is not a fair way to criticize them. Where you are on point, however, is that the alarmism by the peakers is often misplaced. Just because a particular resource (conventional oil) may be getting exhausted doesnt spell the end of civilization.
Anonymous,
I take account of both physics and economics in my scenarios. My expectation is that there is unlikely to be enough demand for 3400 Gb of World crude plus condensate.
The basis of the 3400 Gb estimate was 2800 Gb of conventional resource (midway between a Hubbert linearization for conventional resources in 2015 and the USGS estimate for World conventional C plus C), another 600 Gb was inconventional oil (about 100 Gb for LTO and about 500 Gb for extra heavy oil.) I have since revised these estimates for unconventional oil to about 160 Gb and have revised conventional oil lower on the basis of lack of demand as the World transitions to electric land transport.
Dennis:
1. So, “no, it wasn’t growth/stall that shifted your thinking back and forth–it was Tesla”?
2. You might be right on demand. After all, there was the Saudi minister who said “the Stone Age did not end from running out of stones”. We have sometimes had transitions to other forms of energy that were superior (usually cheaper, but sometimes other aspects). E.g. whale oil to kerosene. Or kerosene lighting to electric lighting. So, could happen with cars.
I could imagine very cheap electricity, leading to reduced demand, especially if you think decades-long. E.g. what if we ever got the “too cheap to meter” electricity from some nuclear technology?
In other cases, we’ve really just added new fuels. E.g. the world has not dropped coal on an absolute basis. Just added oil and natural gas. So, you could imagine rich people like you driving Teslas, but poorer countries continuing to use gasoline. Maybe even growing, as they level up. Look at coal usage in China, e.g.
Kdim:
Nice comment. I don’t want to beat the horse too much more. I do think that if we have a pattern of moving to new resources in the past, that this may happen in the future. And peak oil style concerns are misplaced if they omit it. Also, it can be a little tricky to say what is fundamentally new versus an evolution. But the history of the industry has been one of technological development (sometimes gradual, sometimes step change) to allow accessing more resource. This happens in mining also.
To call this story complete BS I just need to take a short look into the balance.
Exxon does round about 8-10% earnings from every $ revenue.
So with world wide producing at 35 and selling at 70+ they would be nearer at 50%… or do really bad hedging…
And calling just a part of your cost costs so you can brag about 35$ is just lying. Costs is everything, including private jets of the managers. Not only paying the guy maintaining the pump.
Interesting to go back and look at Mason Inman’s Nature article analysis from 2014.
https://www.beg.utexas.edu/files/content/beg/research/shale/Natural%20gas_%20The%20fracking%20fallacy%20_%20Nature%20News%20and%20Comment.pdf
He sounded the alarm that EIA was being too optimistic about natural gas, based on early work by UT, that differed from EIA.
Looking at the “big 4” (Marcellus, Haynesville, Barnett, and Fayetteville), UT had early work showing a lower forecast than EIA. This was a warning that EIA might be off in general for future total gas production. There is a whole kerfuffle on how Mason covered it and wrote the story, but ignoring that as a meta-issue, where I really think both sides have points, let’s just look how the game itself played out…
I did the work to download EIA current production by play and convert bcfpd to bcmpy. And looked at how the forecasts compare to what happened, 9 years later. (I am estimating by eye from Mason’s charts for the forecast numbers for end 2023.)
Big 4 end 2023 production (bcmpy)
Actual: 450
Woodmac: 400
Navigant: 400
EIA: 320
UT: 220 (and post peak)
So…yes, everyone was wrong. But in what direction were they wrong? First EIA was not wrong high, they were wrong low. And UT (and peakers touting them) were wrong low. The only ones close were the “crazies” from the financial world. And even they were a tad not high enough.
My point is not just neener-neener shale beat the peakers. (And after shale was a well covered industry. This is not 2006. Is well after the Obama 100 years remark. Not a meteor from space.)
In Mason Inman’s defense, he was covering a very good UT study, done by good people, with great methods and data and the like. And In UT’s defense, they learned their lesson and were adjusting estimates way up the second time they did their basin estimates.
My point is that don’t just worry if EIA is too high. They might be too low, also. They really might. They have been, sometimes.
Same thing applies to Dennis. Is he too much an optimist who needs to be pushed to sooner, lower peaks? Is it possible the opposite is true? We don’t have to decide now, who knows. And it is fun to argue about. But at least consider the chance. It’s not just Dennis versus more negative. Need to add a third option, that is the higher than Dennis.
Anonymous,
I often do several analyses like I did in December 2018 for Permian Basin, low, medium and high. Here is a high model I did in Dec 2018, I have filled in Permian Data through October 2023, when I did the model I had data through Sept 2018.
Note that I now think it unlikely this model will be correct.
And yes the EIA was far too low in its estimate for tight oil back in 2013, as was I.
https://oilpeakclimate.blogspot.com/2013/12/when-will-us-ltolight-tight-oil-peak.html
Looked like you were pretty close, slightly less than actuals in 2018 and 2019. And from 2021 to 2023, you have a similar rate of growth, slightly more, than the actuals.
The problem is that strange dip in 2020. If that wasn’t there, your forecast would be doing great. What the heck was that big drop in 2020 and why didn’t you predict it?
Crystal Ball was in the shop, otherwise would have nailed it. This was just a lucky guess, I have created many scenarios that were not close at all, most of them in fact. My current best guess is a peak around 2028 at about 6300 kb/d for the Permian basin tight oil output. If oil and natural gas prices remain low the peak may have already arrived for Permian Basin output, I agree with Mike Shellman and LTO Survivor, the party is either already over or nearly so.
there are still quite some wildcats drilling in new rocks.
The youtube blog above, https://www.youtube.com/watch?v=t5HUD3gEhQg
still gave so much upbeating new possibilities, but seems “high flying” compared to what really is possible with shale oil.
Anonymous,
I share your view when looking back the views on shale gas all have been quite low or conservative, to some degree awfully conservative.
But I kinda don’t remember similar contrast, i.e. 10 years forecast and reality now, for shale oil.
I remember some debacles in shale oil, i.e. MissLime, and some small basin/fields that had big dreams never realized, and many 1MBOE or larger forecasts just getting more and more remote;
While shale gas could really turn around and show the EUR dreams come true to Art and Patzek.
Sheng:
Yeah…and that California play. EIA jumped the shark there briefly. (Although I still wouldn’t rule it out in a decade or two….maybe we figure out how to deal with faulted geology and California regulations. There’s hydrocarbons there.)
You can find good/bad examples on everything. In general, the shale estimates were too conservative. You can look at the EIA STEOs and AEOs and they got a lot of criticism here and from David Hughes and the like for being too high. But it ended up working out the other way (they were generally too low.) My favorite is the people who said you just need to look at Bakken and EF for your estimate. (Kinda leaving something out in retrospect!)
2015 estimates were high, because of the price driven decline from 2014. But then in 2017, EIA got huge criticism (from industry and peakers) for being too optimistic about growth…and it ended up EIA was not cornie enough. We added 1 MM bopd in 17 and 2 (!?) MM bopd in 18.
Also, something happened in 2020 to drop us and stall us for a year. Not sure what that was. Dennis’s Xtal Ball malfunction.
But, yeah…I think you can reasonably say that despite each outperforming skeptical (or even neutral) predictions, gas is the more prevalent. There’s just a LOT of gas. And it flows way better. And higher recovery factors.
Tuscaloosa Marine Shale was another one. It’s being produced a little.
Just need much higher prices.
If they start drilling TMS and Miss Lime again, then we know the laissez les bon temps roulez is back.
Might need $100 oil, though. Maybe get OPEC to make some more room for US production?
https://twitter.com/MOAR_Drilling/status/1346532124581634053/photo/1
(Dethreading, Dennis discussion, re Patzek paper)
Yeah, you made me re-skim that paper:
0. Yes, they do say they are consistent with the USGS report.
1. It’s actually kind of confusing to me, what is past production, proved reserves from drilled wells, PUD, new resource and total. They discuss it a fair amount and have some tables and such. But it’s STILL confusing. I’m also not clear if his estimate of PDP rserves is from the EIA end of year report or from his own type curves for the wells.
2. One thing that is not 1:1 is that Patzek excludes Pittsburgh from his area and every other study includes it. And there is a fair amount of resource in there. You can argue if we drill it or not. (Probably not…but it is available if there were a war or whatever. You can put a pad in a city. They just put a fence around a vacant lot…and the pipes are underground.) But if you are comparing apples to apples they should all list it or not list it. Patzek is the only study that excludes it.
3. Since the time of that Patzek study, we have produced another 32 TCF (82 total, and he said 50 at time of his report, in 2021). Since the USGS report, it would be even more.
4. I’m not quite clear on all the percent success stuff in his paper and the low numbers for it. I’m actually used to a very low percent of dry holes. Wasn’t aware there are so many in the Marcellus. Wonder if that is a model flaw. (Not accusing, just curious.)
Net: All in all…sorta feel like he (and USGS) are going to end up being conservative again. We did 30 TCF since his report. Maybe 50 since the USGS report (figuring end of 18 as their cutoff). I mean we do about 10 TCF a year.
And PDP reserves have (probably?) increased or at least maintained. We are growing the “tail” of older, slower declining wells. So…as long as production is flat or growing, PDP reserves should grow…there’s just more old wells.
Rig Report for Week Ending February 16
– US Hz oil rigs were unchanged at 450. The rig count has continued to stay close to 450 since the beginning of October.
– Permian rigs were down 2 to 294. Texas Permian was down 2 at 204 while NM Permian was unchanged at 90. In New Mexico, Both Lea and Eddy counties were flat at 43 and 47 rigs respectively. Midland dropped by 3 to 18.
– Eagle Ford added 2 to 46.
– NG Hz rigs were unchanged at 109 even though the price of NG is close to new lows. (not shown)
The strip shows natty recovering to over $3 by DEC2024. Something you are drilling now, once it gets done and completed, maybe comes on line in SEP2024, and lines up heading into next winter.
https://www.cmegroup.com/markets/energy/natural-gas/natural-gas-last-day.html#venue=globex
So I can see someone in the Haynesville not dropping a rig, given they expect prices to recover. They are making decisions on future price expectation, not current. And natty is just very well known to have radical gyrations like this from a warm winter or a cold one. You kind of have to drill based on the outlook for next winter. And the outlook is “average”, since we don’t know if it will be colder or warmer than normal.
Only the lonely, with NO skin in the game, drill wells based on a natural gas strip and “hope” for a bad winter. Strips change every day. Nobody with a square centimeter of cranial capacity would drill a Haynesville well at $1.50 when it takes 2 X times that just to breakeven. Besides, there are more DUC’s in that part of the world than there are crawfish at the moment… $14 a pound because of the drought. The Delaware Basin will make more natty than the Haynesville soon enough, and its a bi-product.
Permian is huge for gas. #2 size and about halfway between the App and the Haynesville.
Basins (BCFpd, EIA DPR)
App: 36.4
Permian: 24.8
Haynesville: 16.5
In terms of natty growth, Permian is #1
Basins (YOY growth, BCFpd, EIA DPR)
Perm: 1.9
App: 1.1
Nio: 0.4
Bakken: 0.3
(others are ~flat)
https://www.eia.gov/petroleum/drilling/
But there are still 45 rigs in the Haynesville. I guess those people think it’s worth spending the money. Maybe they have 12-month contracts and it’s not worth paying the penalty. That’s their skin in the game.
When you think about it historically, it is amazing how much oil and natural gas the whole US is producing with well under a thousand rigs. I remember people talking about how shale would need more rigs. It’s actually sort of the opposite, especially in gas. Yes, the wells are faster decline. But they are huge. 20 BCF EUR not abnormal in the App. Those are like offshore wells. Not some crappy 1970s Pennsylvania gas well!
I really doubt we are sub $2 forever. We’ve had cheap gas before.
It was sub $2 in 2016 and 2020 also, for a few months and recovered.
https://www.eia.gov/dnav/ng/hist/rngwhhdm.htm
People often say that natural gas is cheap in Europe because of a warm winter. Actually, Europe has had 8 warm winters out of the last 10. The main reason for the lower gas price in Europe is that Europe is de-industrializing. According to Rystad, Europe shut in 15% of its industrial production in 2022. Probably dropped more in 2023 but I haven’t seen numbers.
Neoclassical economists understand neither economic production nor prices. They do not understand economic production because they underestimate the importance of energy. They do not understand prices because they think the law of supply and demand says something. It doesn’t. It does not satisfy the Karl Popper’s principle of refutability. Nothing can be deduce from it.
Frac Spread Count for Week Ending February 16
The frac spread count was up 4 to 264 and is down 8 from one year ago. Will the frac spread count get back to the 275 level where it will find an equilibrium with the rig count?
Midland and Martin rig count
Midland’s rig count is down by 3 to 18, one half the number that were operating in July 2023. Production is also dropping rapidly. It is the first of the four main Permian counties, Midland, Martin, Lea and Eddy that is showing a steep decline in production.
Ovi, the four counties in the Permian Basin you just referenced are huge; I’m guessing 65-70% of all tight oil production from the Permian comes from those counties right now.
I’ve been spending lots of time out there lately; I still know lots of folks working in the Midland. I operated out there long ago. Martin County must have half the rigs working in the entire basin. There is not enough room to put a porta pottie in Martin County. The real story, like everything else in the US right now, is way different than what people WANT you to believe.
But thats ancedotal and Lord knows nobody likes that stuff. They’d way rather rely on Energy Inaccuracy Agency data.
So, Ovi, why do YOU think production is declining in these Permian counties? Prices have been over $70, 2X time breakeven BS for the past 6 months…something seems amiss. What do YOU think is going on?
Mike
I think we are seeing the beggining of production decline associated with the drilling decline that started about a year ago. Allowing for the 6 to 12 month delay from spudding to production, we will now begin to see production starting to drop. Many have been saying the Permian has peaked but because of the time lag, it has not shown up in the production data. Up till now production data has flattish but I think that is about to change. With all of these four basins in the bubble point phase, pressure is dropping and so is oil production. Also fewer T1/2 wells to drill.
100%, Ovi. All of which has been predictable given how “centralized” the best rock was in both sub-basins and how poorly the resource has been managed, almost from day one.
I’m going to venture a guess and say after the T1 &T2 inventories are depleted, rig counts are going to have to go up significantly to keep the hamster wheel spinning at current rates of production. It’s going to take more money and effort to get less. Red Queen syndrome.
No one is going to do that anymore. This shit is over. The last of the T1 wells won’t get drilled either.
Seems a bit extreme Anon. T1 and T2 are not depleted, if they were, then the rig count should be at zero… But it isn’t, hundreds of rigs are turning in the M/D basins. Also, what does “this shit is over” mean? The Permian is producing over 5,000,000 BOPD and new discoveries and plays continue to add to the pipeline. $325,000,000 of gross revenue per day is a lot to chew on.
Lastly… “the last of the T1 wells won’t get drilled either”… do you want to edit that before I crush it?
Gunga Galonga (that’s the way I break it down for myself, or is it Gun Gaga Longa?),
I was being hyperbolic.
How will shale compete with other (cheaper) sources of oil now that companies have to deal will 1) prioritized returns to investors, 2)increased capex/inflation 3)higher interest rates?
The problem shale faces is demand destruction i.e. the recession. Demand destruction will depress prices possibly to the point where the drillers might not be able to break even. Should oil prices surge, then it follows the fed might be forced to hike rates, making it difficult for drillers to raise capital and roll over debt.
I think shale is facing volatility unlike any other type of oil play has. If shale’s break even is higher than it’s at now, then standard pricing might have to change and there will have to be an LTO benchmark price now. It won’t make sense for cheaper producers (like OPEC or Russia) to lose revenues/market share on higher prices. Shale is just going to be less competitive. The economics of shale could possibly be over, which means drilling will be over.
If what Mike Shellman has been saying is true, that investors have barely seen a nickel from this stuff in the past decade, and that it’s burned a lot of money, then the market won’t fund anymore shale activities. It’s very possible the damn thing could implode altogether – I wouldn’t dismiss it.
In a few years, if this scenario plays out, we’ll see that shale was a one hit wonder. It’s just confirmation of shale simply being an ultra low EROI source to begin with and something has got to give. Money is a claim on energy and low EROI sources cannot support too many claims. It’s possibly never going to be fully exploited without serious sacrifices in compensation/wages/standard of living/profits.
I won’t be surprised if these M&A’s turn out to be turds.
I think it’s interesting to hone in on certain parts of the data, but just beware reading too much into it. I know there has been a long history of taking an operator or a part of the basin and saying “look, well quality is dropping…this is what will happen to the basin”. I remember hearing this in 2017 or so. And actually basin overall performance was improving, during that same time period. Definitely that was by far the more important story. But those who liked declines only saw declines. And missed the massive other story.
And yes, I know there was a recent overall drop. Not debating that at all. Making a philosophical point on selection bias.
P.s. If I very simple mindedly look at your Christmas graph, Midland is down12 rigs, over the time shown. And Martin is up 14. Is the story that rigs left Midland? Or that they moved to Martin. If I add the two, it’s a wash.
Don’t worry, Ovi, I just heard from this really trustworthy guy named Anonymous and he told me that there’s literally gazillions of barrels of light oil in Iraq and Alaska so peak oil will not be a problem for like, another ten thousand years or so. Also technology is so awesome we’ll be making crude oil out of sea water in like, five years. So I don’t even know why we worry about these things. See peak oil didn’t happen earlier like a decade ago when someone said it was so therefore it can never be an issue. Also a friend of mine told me it was gonna rain this morning and it’s not so therefore it will never rain again thank god because I want to go out and mow the lawn in a bit. Lmfao
Stephen
Thanks. Good to hear that you have deep sources in high places.
🤣🤣🤣🤣🤣
Where is the next Permian?
https://www.aapg.org/videos/super-basins/articleid/51399/bob-fryklund-where-is-the-next-permian-basin (click play on video)
Summary: Lots of exploration spots left. Alaska, Iran/Iraq, Caspian Sea, North Africa.
Also, the App gas basin is sort of a Permian itself, in BOE terms.
TRANSLATION
Summary: Few exploration spots left. Alaska, Iran/Iraq, Caspian Sea, North Africa.
You don’t seem to have watched the video (based on that comment). Since, there are many more basins listed. Give it a watch. You could still absolutely hate it, be a peak oiler, etc. But you would at least be exposing yourself to thinking from someone else who is a technical guy and in the industry.
Tribalism is fun. We are war-monkeys in our DNA, after all. But we also have an incredible ability to process information and analyze and reflect. Again, just give it a watch. You can rip it to shreds…I don’t care. You don’t need to buy in. Just look.
https://www.youtube.com/watch?v=8xaf5atx1Dg
Joe Blogs – Russia’s oil exports starting to collapse and why
This is really good.
Interesting interplay between history, country sovereignty, border disputes and international law, multinational corporate policy, and energy resource-
“While tensions continued to simmer, the president of ExxonMobil Guyana, Alistair Routledge, said this week that the U.S. supermajor is committed to its operations in Guyana despite the dispute with Venezuela.
“We are not going anywhere,” Routledge told reporters, adding that Exxon considers its exploration and production contracts with Guyana valid under local and international laws.
Guyana’s foreign secretary Robert Persaud told The Associated Press on Wednesday that Exxon had every right to drill for oil and gas in the Essequibo region “because it is within established Guyana waters in a fully demarcated area.”
https://oilprice.com/Energy/Crude-Oil/Exxons-Guyana-Oil-Drilling-Plans-Anger-Venezuela.html
Anonymous and Dennis,
I’d like to expand on one issue you listed above about URR, TRR of shale gas or the big difference between Boswell and Saputra.
” Resource total is the key uncertainty.”
The major difference between Boswell and Saputra Marcellus TRR papers are the EUR per lateral(EURpl).
If the EURpl is higher by 50%, then 2X more are included in the top tier resources, and so will the TRR increase 3~5X.
Boswell gives higher EURpl (avr. 10~12BCF) and Saputra gives lower EURpl (avr. 7BCF) for the core.
How the EURpl could be so different and arbitrary?
It is related to the Recovery Factor (RF) estimates, i.e. EURpl/(Gas in place per lateral, GIPpl), the two sources used, and how reaonable the two sets of RFs are depend on “Resources total is the key uncertainty”.
Saputra used 7% porosity to estimate GIPpl, and at cut off time of recovery (figure 9) the RF is 72% for Marcellus, while obviously the production in Marcellus still has not tapered off yet, like the other major shale gas basins/formations. Saputra did not discuss why there is no more room for Marcellus RF beyond t/T >10.
But, obviously anything over 70% is already quite outrageous, and if further extended to >90% one has to adjust the “Resources total” or GIPpl. In fact, Barnett has RF over 90%, and this unreasonble number has to do with the incorrect estimate of GIPpl in Barnett by Patzek, the initial porosity is only 3.7% while the true porosity probably is over 10% for Barnett.
Boswell has been fighting big time in his papers to get reasonable (should be well under 100%, e.g. 70%) Recovery Factors , by expanding the porosity (over 12% in the core) and controlled vertical depth(especially in SW PA,WV) in the core of Marcellus. This makes room for his higher EURpl.
Similar logic for the Hayneville, “Resources total is uncertain”
https://www.sciencedirect.com/science/article/pii/S187551002100247X
here, Saputra got the porosity for Haynesville closer to reality, maybe only 20~30% off, but the water saturation at 32% probably too high(15% more reasonable), resulting GIPpl still underestimated by almost 50~80%, and the RF at unreasonable 72%.
The Boswell paper is outstanding. It’s not just me liking the answer more. (Of course I do.) But his method is way more granular, looking at performance by area. I love the “TRR per section” concept. Also, I love that he actually uses complete developments as the key to understanding the resource. Not individual wells. But sections with all the laterals in. Where he can–the fringe this is impossible. But it is pretty doable in the sweet spots. He also has a very nice lit review and a very clear writing style.
Yeah, I saw his stuff on gas recovery. You actually don’t need that to follow his argument, which is performance based (for completed sections.) It’s more like you need to know where the gas is coming from (not the ether). Yeah, there could be more gas in place. There’s a lot we don’t understand about microstructure and surface area in there. It is a nano-realm…like the surface of a catalyst, measured with BET. An alternate idea I have heard from Engelder (and Boswell mentions it, sort of) is that the fracs are stealing some gas from the upper Devonian. This is sort of why you can’t really complete the M and the UD in a section. It’s not a separate strata.
Another idea for the large recovery factors I’ve heard is that there’ a lot of natural cracks in the rock (outcrops show that) versus other shales and that you just encounter more free gas. Donno…maybe someone could compare unstimulated laterals. Or the higher native fracks, help direct the stimulation to more places…I guess you could do microseismic or tracers or imaging or something. (Not arguing, brainstorming.)
Take a look at numbered page 20 (PDF page 28, exhibit 3-8). It shows completed production as already 50% higher than what USGS would predict. Not an EUR assumption, but already produced!
Now, you might say that we are picking a sweet spot. But it is from NEPA, which is sort of an overall sweet spot, although sure there will be differences within. And he didn’t pick the sweetest of sweet…look at the color is yellow, is 50, not 100 BCF/misq. 100 is about the best. And in any case, at least Boswell runs a real cell by cell analysis (as BEG did) and develops a topo map of productivity that shows how much exactly is sweet spot and how sweet.
USGS and Saputra just mush it all together and say “trust me, bro”. But it’s impossible to tell what is going on inside their black box. (And you know the peakers would complain about lack of granularity if it were giving the higher answer! Look how they flocked to the MIT/Montgomery paper.)
Saputra does have a nice cell by cell analysis of undrilled locations. But does not look at quality of rock (even performance based quality of rock) on a mile by mile basis). Boswell can tell you county by county, how sweet it is, how undrilled, etc. (Actually can go down to the section scale.)
It really seems paradoxically the opposite of the old concern the peakers had that everyone would assume the entire play was as good as the sweet spot and overestimate it. But now the peakers are doing some sort of analysis that calls the median the average (losing track of the millionaires in the data set).
P.s. Note that Boswell released his paper in mid-19. And said that he used wells from 2013 and later, that had 24 months data. So, you are likely looking at 2013-2016 wells. And wells actually improved substantially since then. 2020 wells have three times the 12 month cum of 2013 wells and two times the 12 month cum of 2016 wells. Sure, some of that is acceleration, but not all. Assume half of the improvement is acceleration/cannibalization and half true EUR improvement. And we are still looking at modern wells doing 1.5 to 2 times the wells in his data set. It’s a flaw to the upside!
Anonymous,
Cell by cell analysis is interesting, but consider that some of these areas are discovery wells with very low output. I suppose one can claim as Boswell does that if we have one well drilled in a county that output from that county could be the area of the county divided by the area of that well times the output from that single well (or development area). Such an analysis doesn’t pass the smell test. Now if we assume an infinite price for natural gas, then the TRR estimate might be accurate. In the real world it is a severe overestimate. Basically there will be very few wells drilled in these low output counties and a realistic analysis just ignores the “TRR” from these counties as it will never be economically recoverable.
You’re kind of just throwing stuff out, now, Dennis.
Look at the at his paper, e.g. the iso-production lines on numbered page 14. It is not bigger fringe carrying most of hiss big number but the core. You can see that the core has lots of completed sections in the core (“green dots”, numbered page 10), so we are looking at full development information, not parent wells, informing the big parts of the resource He even has county by county results (numbered pages 25, 26). You can see the sweet spot name counties like Susquehanna and Greene and Bradford and the like, driving the number. And see that they have a lot of drilling history from the dRR numbers.
The other thing, aside from arguing the quality of the answer is that at least he shows the detail. You can look at how much is sweet, county by county and consider it. In the USGS and Saputra work, you can’t even do that. Can’t even examine it. Since it is all smushed together into a “trust me bro” massive AU. Heck…and you KNOW if it was the granular work giving the smaller answer and the massive “trust me bro” AU giving the big one, you would be telling me why iso-lines are the way to go.
P.s. Iso-mapping is a frigging pretty normal and powerful tool in the earth sciences. Look at your weather map. Look at a topo map!
——-
Edit: That was a little harsh. I DO agree with you that parts of the fringe will probably never be worth drilling. No doubt. We can apply this to USGS also. And even the EIA fringe.
I don’t know how good the Saputra economic model is…but I applaud them for having one and for dividing their TRR into sort of an economic TRR and an uneconomic TRR. BEG followed a similar approach with their earlier work in the Haynesville actually showing how much resource could come in at each price point. And even having a “topo map” by price point! They ended up being totally wrong and the Haynesville had a resurgence at $3 gas prices…but c’est la vie for shale skeptics!
I would note though that over the decades we can also posit some things in the upside direction to overcome some of the “undrillable fringe” issue. For one, continued improvement of recovery. The improvement from 2016 to 2020 is stunning, already. And continued efficiency gains in speed and cost (the industry has a history of this.) Also, refracks, blabla. Note, the Boswell paper doesn’t even count on these…they would be
upside.
P.s. You are muddling things a bit (perhaps for a semi-valid reason) with the economic comments. We can still compare the USGS TRR (which theoretically ignores economics) with the Boswell and with the Saputra (all in) numbers. And the vast difference will remain. IOW, it is not the extra 40 BCF of Saputra uneconomic resource that is driving the 5:1 difference of asset evaluations.
Also, to his credit, Boswell does point out that there are implicit economic assumptions inside USGS…not that the wells would be economical, but that spacing would be normal industry practice. IOW, it is certainly technically possible to overdrill an asset (even uneconomically) and to increase the eventual production. Really what USGS (and Boswell I guess) do is to posit “normal” spacing patterns, regardless of rock quality. I’m not justifying this…just explaining it and saying Boswell is aware of it…this is something I have said about USGS before, years ago. (see numbered pages 23-24)
Nony (Anonymous),
Good to see you posting again.
As just one example of the prodigious nature of the Mighty Marcellus, I present the 8 well Carpenter pad from EQT in Greene county, average online history of just over 4 years.
Cumulative production is almost 32 million barrels of oil in heat energy equivalence (~185 Bcf), and still producing over 10,000 bbld oil equivalent (59MMcfd).
if one were to look at those production maps from your referenced papers, incorporate the most recent PA production (Marcellusgasdotorg has up to December 2023 complete PA unconventional history on an individual well basis), and then keep up to date by following several of the big AB operators, one should readily see just how vast is this hydrocarbon resource.
This is especially true for the minimally tapped PA Utica which is being delineated across the northern tier by Seneca.
And then there is Gregory Wrightstone’s decade-old analysis of the Upper Devonian whose currently producing wells vastly exceed even Wrightstone’s bullish estimates.
These guys are – today – producing over 6 millon barrels of oil equivalent each day (~35 Bcfd) with 40 rigs. (In basin pricing under 2 bucks per).
Should anyone do an good analysis on ‘fringe’ areas with, say, $5/mmbtu – a chintzy 5Bcf well throwing off $25 million – one might start to grasp just how much recoverable gaseous hydrocarbons exist in this region.
1. The App is massive. Takeaway is a serious issue though. You can’t grow if there’s no pipeline space. In 2023, SWPA basis averaged $.50 worse than HH. In 2022, it was $0.75 worse. I don’t know what it is now. And it’s more of a summertime issue than winter (at least local demand goes up in the winter). But those are yearly averages from EQT 10-k (unhedged, true market). It might even be wore for NEPA.
2. Utica is (roughly) another Marcellus. Figure 600-700 TCF for each. Figure, round numbers 1300 TCF in region, at 13 TCF per year (assuming the takeaway does not improve and local market does not increase much). It’s 100 years supply at current rates (from that field, not for the nation). [Yes, Dennis, I know some of the fringe is uneconomic…but that will more than be made up with continued technological improvements and discoveries.]
3. Utica is much more poorly defined than Marcellus, though. Way less drilling history, especially in the Deep Utica. So, it’s a way less certain calculation than the Marcellus. Could be less. (Could be more! I had this argument a lot a decade ago…don’t just look at downside uncertainty, look at upside risk also…and peakers didn’t want to think about it…and…it happened.)
4. Deep Utica are more costly and dangerous and not really worth going after now. But long term that is exactly the sort of problem that technology development can eventually solve (cheaper ceramic proppant, blowout protection, better mapping/geosteering of the formation, optimizing completion, etc.) It’s really not expecting someone to discover fusion. Just normal technical development that will happen naturally as people drill more wells and gain experience and try things.
5. Kind of a separate issue, but the oil aspect interests me also. Were a lot of hopes that failed 15 years ago. But EOG is nosing around in there. And they do like to make little IR deck stories (I remember them pushing some story about the Anadarko recently also.) But OH oil is starting to nudge up again…I think Ovi was surprise to see it sneak into his top 10! It’s not Permian. Not even a Uinta, yet. But bears watching. Chance it passes 100,000 bopd.
https://www.eia.gov/dnav/pet/hist/LeafHandler.ashx?n=PET&s=MCRFPOH2&f=M
Anonymous,
Not just the fringe that is economic, what the optimists fail to grasp is that the high estimates essentially take the EUR from the average well in the core areas and apply it to the entire area of the basin. If you believe those estimates are close to being accurate, I can sell you a bridge I know of in Brooklyn. For the Pennsylvannia Marcellus (which produces about 80% of all Marcellus output) 4 counties produce about 75% of that Pennsylvannia output (about 60% of all Marcellus output). The 4 large producing counties are Bradford, Greene, Susquehanna, and Washington counties, other fairly large producing counties are Butler, Lycoming, Tioga, and Wyoming. These 8 counties produce about 85% of Pennsylvannia Marcellus output.
At 24 months the cumulative output for the 8 largest producing counties was 6893 MMCF for 2020 and 2021 wells, for the rest of the Pennsylvannia counties the 24 month cumulative for 2020 and 2021 wells was 3460 MMCF which is roughly 50% of higher producing counties.
Not sure why you are throwing that out there, since I’m aware of that misconception and don’t have it. Are you next going to tell me that shale wells decline really fast as if it were some new finding? 😉
BEG and Boswell both do iso-productivity contour maps and show huge variations in the play(s) and have resolution to a very granular scale. Actually, it is the USGS and Saputra that only show the average well for vast AUs and make it impossible to tell what is going on in sweet spots. (EIA does county by county, so sort of halfway on the granular scale).
Doesn’t mean the high estimates are right. For one thing there may be other things driving the differences. But it does mean that ‘optimists who don’t understand sweet spots’ does not apply to Boswell, BEG, PGC (probably, since they are detailed geologists), or myself.
I’m not accusing Saputra, just trying to think about it. They have a very complicated “GEV” method to come up with their type curve for their AUs. (In the past they have thrown out a lot of machine learning, etc. buzzwords.) It’s not a simple weighted average. Has a bunch of parameters. More parameters than a simple average.
Saputra is a huge black box really. Neither one of us follows it. Did you work all the equations? Did you pull all their old references (some may be paywalled) to Barnett papers, justifying the method and read them in detail?
I wonder if there is some sort of signal finding (like principle components analysis the like) that is smearing out the value of the core, EVEN ON an area-weighted basis. (This is my ‘calling the median the mean” concern.) Not accusing…but I just can’t…tell. It is a black box of advanced math and references to method and results from other use of the algorithm that neither you nor I understand. Ask yourself how you would respond to all that handwavy “GEV distribution for earthquakes” justification if it were the cornucopian estimate using such opaque methods!
Also, some sort of physical scaling knob, which is more parameters. And I’m not sure why it should be inserted into production (after all production is production…look at fully completed units…if they are producing more than expected, then your physical model is not capturing something. Also ask yourself, would you be happy about the “physical knob” (extra parameter) in the methodology if it were taking some crap production and making it bigger in the TRR?
Anonymous,
The point is relatively simple. Boswell and BEG come up with estimates that are not believable. We have Pennsylvannia average productivity in the core areas of perhaps 29 BCF per square mile at peak productivity in 2020 and 2021, the other areas that have been developed have about half this rate of productivity, but it cannot be realistically extended to the entire basin. Boswell has a number of bad assumptions like 50 year well life and 6% terminal decline, well life should be no more than 25 years and terminal decline is about 10% per year. BEG paper, I have not seen, so not clear it is the detailed analysis you claim. I do follow the GEV method and have looked at it for their Permian paper, the analysis is very general and can be applied to both shale gas and tight oil.
The physical scaling is to determine EUR and well profile, production is well profile and completion rate convolved, so it is obvious to me why this is needed.
The check on the model is looking at production to date vs modelled production, the match is excellent. This is how one tests a model, look at historical production in comparison with the model, if it works on historical production and one accurately forecasts future well productivity and completion rate (this is impossible to do) then the future production would match the model.
1. You haven’t even read the BEG work, but think it must be wrong! Hmm. Hmmm! I mean, it must be wrong since it’s big, right? No need to read it, then.
[And BEG/UT is not perfect by the way. You could find things to criticize about the 2018 report. But that is a very good group that has looked at the problem for a long time…and was touted by the peak oilers 4 years prior when the numbers were lower.]
2. You’re not a technical expert, but are deciding between other experts. And picking the lower ones. Hmm…again. 😉 How has that worked out for you in the past? 😉
It’s child’s play for me to pull up old cautionary shale statements from Patzek (Saputra co-author) and show how badly they’ve done.
Here’s 2016 (easy read…click the link):
https://patzek-lifeitself.blogspot.com/2016/03/is-us-shale-oil-gas-production-peaking.html
According to this analysis, the Marcellus ought to be doing about ~10% of its 2016 peak. And the Haynesville ought to be doing ~1% (?!) of its 2012 peak. Both formations are going strong and are actually UP from previous peaks.
David Hughes doesn’t have the best record either. He’s kind of learned not to criticize near term…but if you look at stuff from 2011-2013 from him (and I’ve read him much more carefully than the average peak oiler), you’ll see that he criticized projections by EIA of 2040 shale gas performance (and we hit those production rates a couple years later, not even waiting for 2040).
And look…both Hughes and Patzek are serious guys. I don’t think they shouldn’t be allowed to have an estimate. I don’t think they shouldn’t be allowed to have new estimates after the old ones were too low. I actually think we should look at multiple opinions. It’s why I say the true uncertainty is WAY higher than you taking USGS numbers and doing slight modifications of them (since you need to also look at expert to expert differences, which are way bigger). But it ought to at least give you a little pause that Patzek is a past president of ASPO and Hughes is associated with something called “Post Carbon”. Again…I’m not denying them a right to be heard…just retain some skepticism, Dennis.
3. Obviously there has to be some reason for the differences. Intuitively it must be EUR or locations.
4. E.g. on locations, Saputra excludes urban locations and everyone else (USGS, BEG, PGC, EIA, Boswell) include them. I wish Saputra had done their analysis and showed the difference with/without this choice. If we look at Boswell county by county, you can see a big resource in Pittsburgh (I think 40 something of TRR in Alleghany County, which is ~Pittsburgh.) So this explains some of the difference, but far from enough of it. Maybe you can pull Boswell down by 10-20% by excluding urban locations…but that’s not going to explain a 5:1 difference.
5. Boswell does an alternative transition to exponential at 10% and it drove 30% lower EURs. (I have seen numbers as low as 5% in industry or other papers…so don’t assume that 6% needs to come up to 10%. Substantial, but far from explaining a 5:1 difference of USGS/Saputra versus Boswell. It would still be 3.5:1. [Note also that he had an industry expert version that had 15% higher EURs.]
6. I’m not sure how much going to shorter end of life would drive a different EUR. I mean, we know that in the Barnett, hz wells are hitting 20 years no problem. Vertical shale wells are starting get close to 30 years old. Say you change EOL to 30 years, how much does it drive a different answer? It’s not going to chop the EUR in half since so much of the production is early. I donno, 15% less, with a 30 year EOL? (I’m guessing.)
And note there’s an interaction of going to shorter life AND higher onset of exponential…you don’tactually get the additive savings, but a little less, because of this interaction. If you chop off the last 20 years, you chopped off a lot of the time when the tail was at 10% instead of 6% annual declines.
None of this is even to be sanguine about shorter lifetimes for the wells. After all, we are talking mostly gas wells on pads with several wells (so easier to maintain). I mean I’m not saying zero maintenance, can have liquids loading issues, but it’s probably a lot easier than stripper oil wells scattered on individual pads. I donno…not a technical expert…but neither are you!
7. You may “follow” GEV in the sense of having heard the buzzword, technical term. But do you really understand it? Have enough knowledge to know how it may bias an answer (down OR up)? I doubt it. I mean I don’t…and you seem like me. Have you really done enough to look at the method (including the “physical/production” interaction to understand how it gave numbers and what potential flaws would be? To me, it’s a black box with fancy words and hard math. Would you have accepted the Saputra method (with its technical difficulty) if the numbers had been way bigger?
8. Previously you made a sound bite complaint about optimists not differentiating sweet spots. But I had already showed in discussion I know the variability by area concept. I mean I’m sure there are some cheerleaders who don’t get that. But do you think I’m one of them? And when it actually turns out that USGS and Saputra are the one with ginormous AUs (making it very hard to assess their work since they confound very different performance areas). And when it’s actually the higher estimates (Boswell, BEG, probably PGC) that are extremely granular and seem more aware of the issue of the shale being vastly different from place to place. (EIA is sort of halfway between, but at least they do counties, not half-state-sized monster AUs.)
What is your name blabla?
You have the penchant of not saying much with these big notes.
I understand your call for keeping opposite ideas and not taking sides until enough evidence is in the bank, but man, take care of your blind side, or at least show us a model like Mr. Dennis so we can follow what the hell you are trying to convey.
I might stop posting. I do realize I am dominating the conversation.
I believe its name is ‘livinginthepast’ or ‘Oiltechnoking’…the only clear position is that peak oil will never occur (even though we are currently 6 years post peak). Lover of bulleted remarks, maybe an AI…who the heck knows…
If only we could make crude oil from your logorrhea…
Don’t stop posting, you have interesting things to say. But yes, try to be polite and not a boor and let other people have their say. You make an interesting counterpoint and it’s appreciated, believe it or not, but many of us have jobs etc and can’t post 20 times a day.
Please do.
US to Soften Tailpipe Rules, Slow EV Transition Through 2030
Good to see the administration is waking up to the fact that EV uptake in the US is not going as fast as expected. A big clue came a few weeks ago when GM announced they were moving away from their all BEV plan to a mix of PHEVs and BEVs. I have been pushing the PHEV strategy since day one.
WASHINGTON, Feb 18 (Reuters) – U.S. President Joe Biden’s administration is set to ease proposed yearly requirements through 2030 of its sweeping plan to aggressively cut tailpipe emissions and ramp up electric vehicle sales, two sources told Reuters on Sunday.
Automakers and the United Auto Workers had urged the Biden administration to slow the proposed ramp-up in EV sales. They say EV technology is still too costly for many mainstream U.S. consumers and that more time is needed to develop the charging infrastructure.
https://www.reuters.com/business/autos-transportation/biden-administration-relax-ev-rule-tailpipe-emissions-ny-times-2024-02-18/
Also a fan of more PHEVs, hybrids etc. the new Prius Prime looks amazing. The EV tax credits should have been built with a phaseout, it’s idiotic to have a permanent $7500 credit. If it dropped by a $1000 a year that would encourage early adoption and have an end date when EVs would have to compete against ICE vehicles on more equal terms. All this would work better with a carbon tax instead, something that used to have more bipartisan support, but now I fear nothing this intelligent will ever get passed in my lifetime.
New posts are up
https://peakoilbarrel.com/opec-update-february-2024/
and
https://peakoilbarrel.com/open-thread-non-petroleum-feb-19-2024/