By Ovi
All of the Crude plus Condensate (C + C) production data for the US state charts comes from the EIAʼs Petroleum Supply monthly PSM which provides updated information up to November 2023.
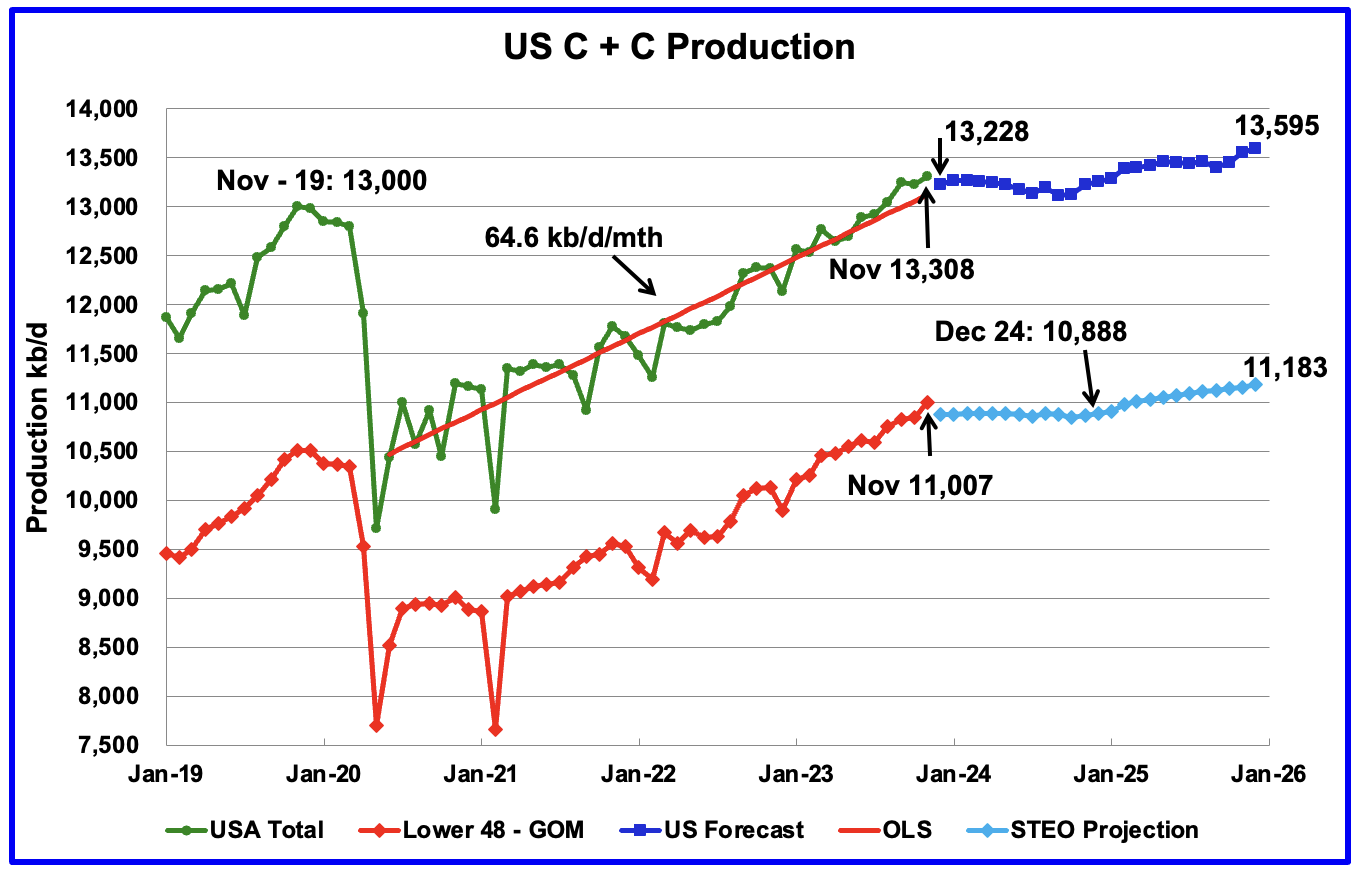
U.S. November oil production increased by 84 kb/d to 13,308 kb/d, a new record high. The increase was primarily due to increases in Texas and New Mexico offset by a decrease in the GOM. Note that October production was revised down from 13,248 kb/d to 13,224 kb/d.
The dark blue graph, taken from the January 2023 STEO, is the forecast for U.S. oil production from December 2023 to December 2025. Output for December 2025 is expected to reach 13,595 kb/d.
The red OLS line from June 2020 to October 2023 indicates a monthly production growth rate of 64.6 kb/d/mth or 775 kb/d/yr. Clearly the growth rate going forward into 2024, shown by the dark blue graph, is flat and significantly lower than seen in the previous June 2020 to November 2023 time period. From November 2023 to December 2024, production is expected to drop by 119 kb/d.
While overall US oil production increased by 84 kb/d, the Onshore L48 had a production increase of 160 kb/d to 11,007 kb/d in November.
The light blue graph is the STEO’s projection for output to December 2025 for the Onshore L48. From November 2023 to December 2025, production is expected to increase by 176 kb/d to 11,183 kb/d. Production for most of 2024 in the Onshore L48 will be essentially flat.
Oil Production Ranked by State
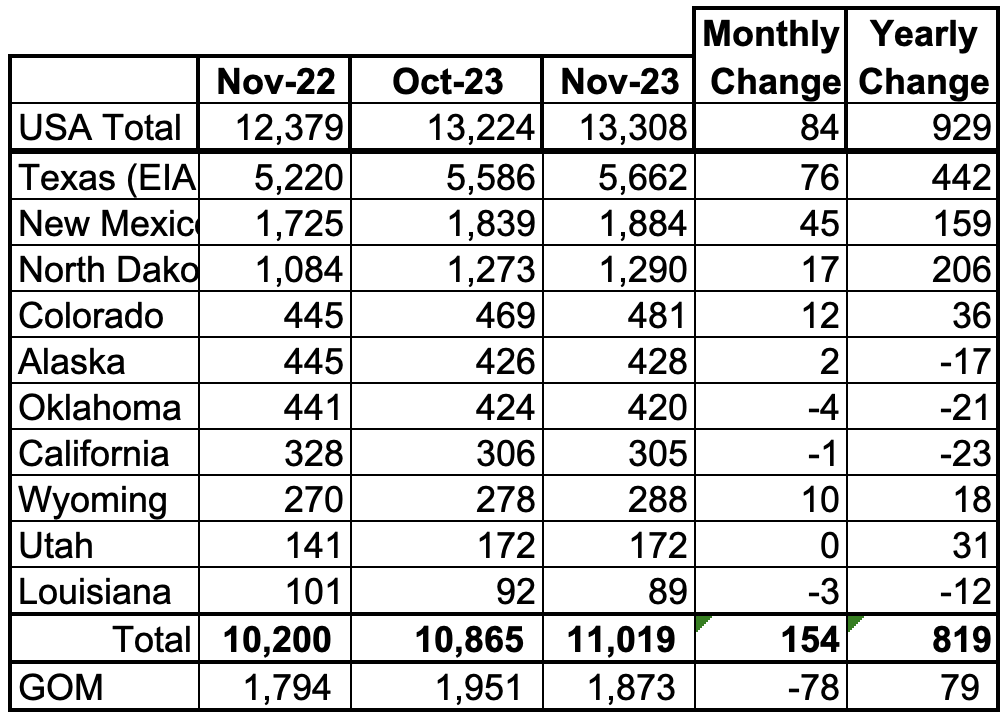
Listed above are the 10 US states with the largest oil production along with the Gulf of Mexico. These 10 states accounted for 82.8% of all U.S. oil production out of a total production of 13,308 kb/d in November 2023.
On a YoY basis, US production increased by 929 kb/d with the majority, 807 kb/d coming from Texas, New Mexico and North Dakota. GOM production dropped by 78 kb/d MoM while YOY it is up 79 kb/d.
Note that on a YOY basis, three of the smaller producing states have increased production, Colorado, Wyoming and Utah.
State Oil Production Charts
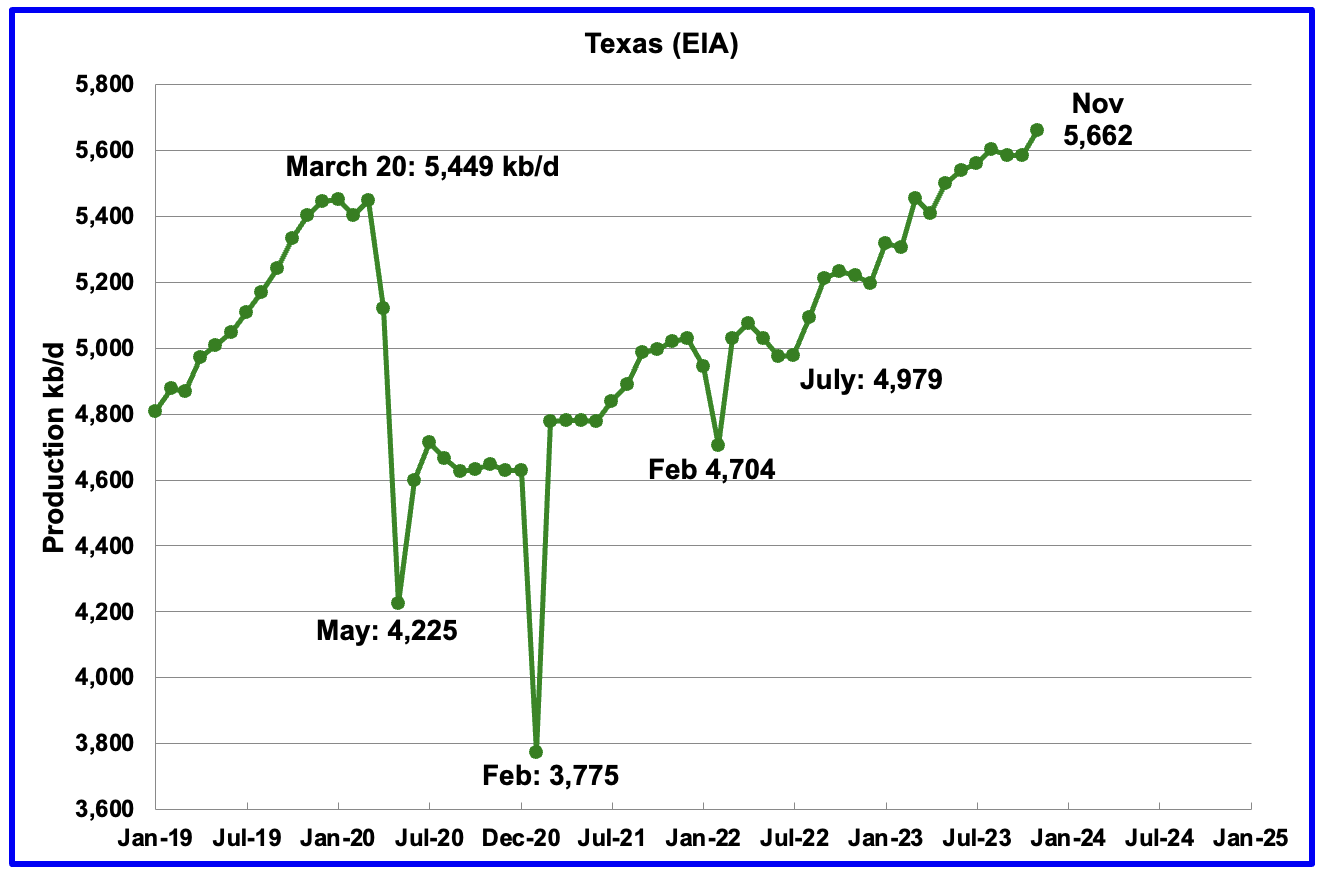
Texas production increased by 76 kb/d in November to 5,662 kb/d. However, relative to October’s production reported last month, 5,607 kb/d, November output was up by 55 kb/d.
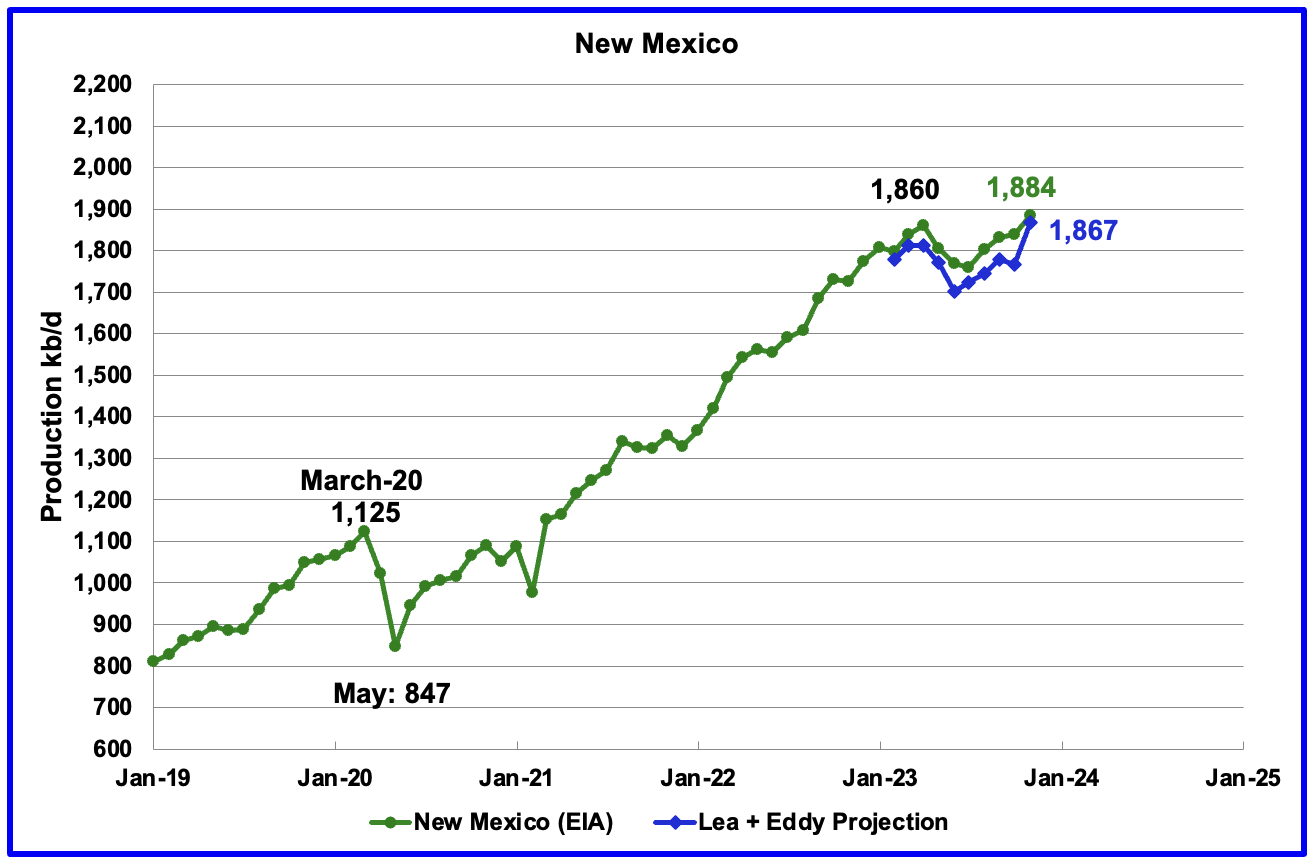
New Mexico’s November production rose by 45 kb/d to 1,884 kb/d.
The blue graph is a production projection for Lea plus Eddy counties. The projection used the difference between November and October production data provided by the New Mexico Oil Conservation Division.
The combined output from Lea and Eddy counties in November increased by 101 kb/d. It is interesting to note that the Lea + Eddy production trend is similar to the EIA’s except for October.
More production information from these two counties is reviewed in the special Permian section further down.
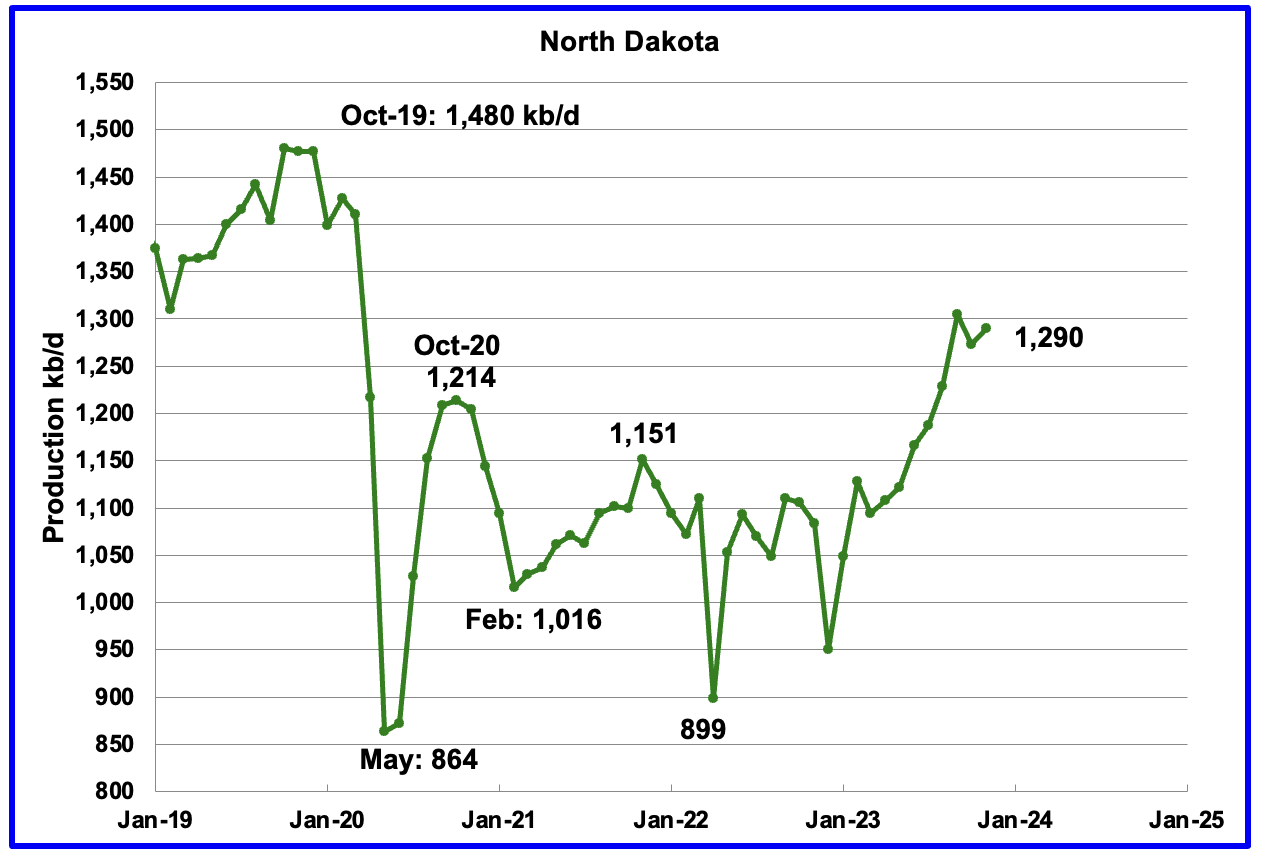
November’s output increased by 17 kb/d to 1,290 kb/d.
According to this source, production growth for October was lower due to October bad weather. The bad weather extended into November and may account for the small 17 kb/d November increase.
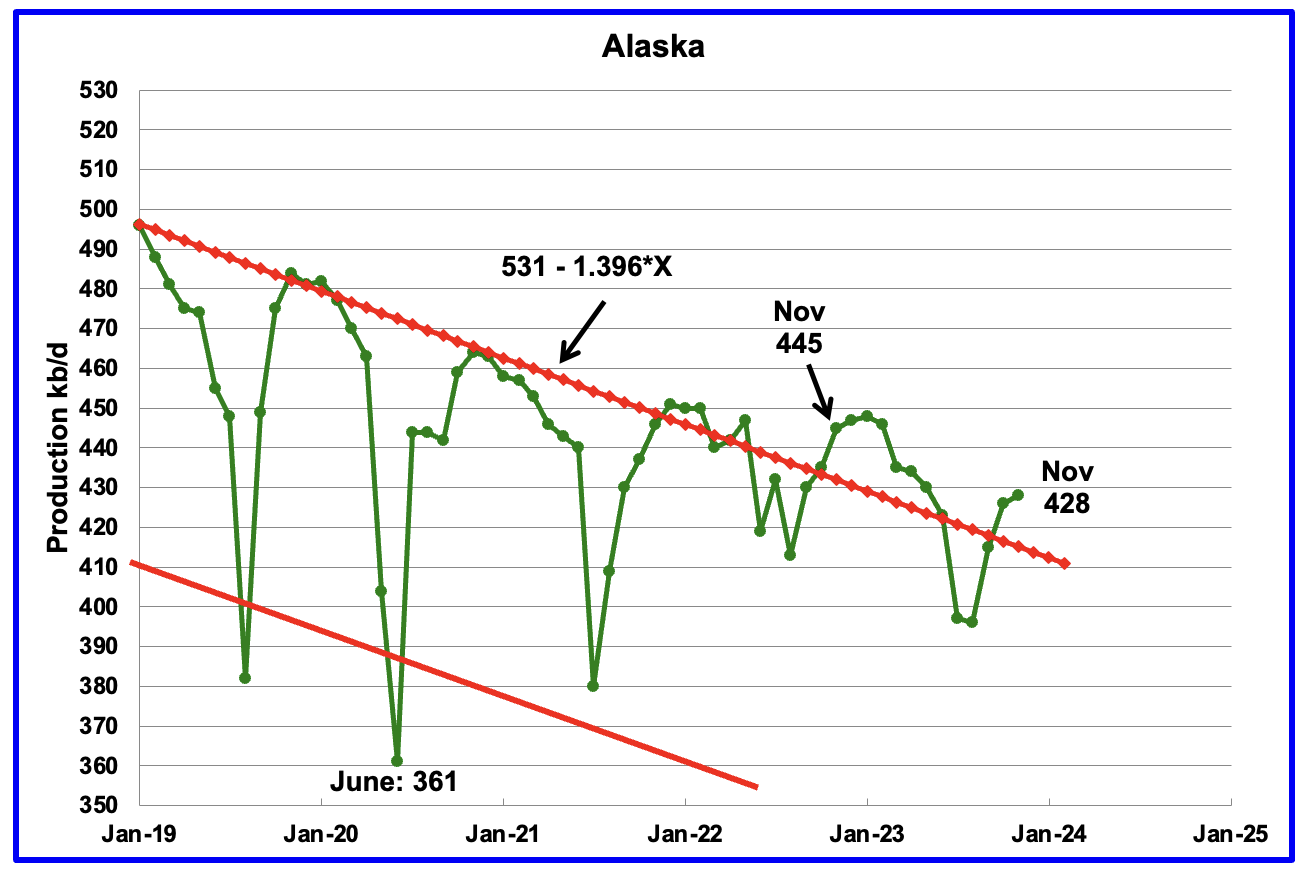
Alaskaʼs November output increased by 2 kb/d to 428 kb/d. Production YoY is down by 17 kb/d. The EIA weekly petroleum report continues to show January Alaska production is in the 425 kb/d to 435 kb/d range.
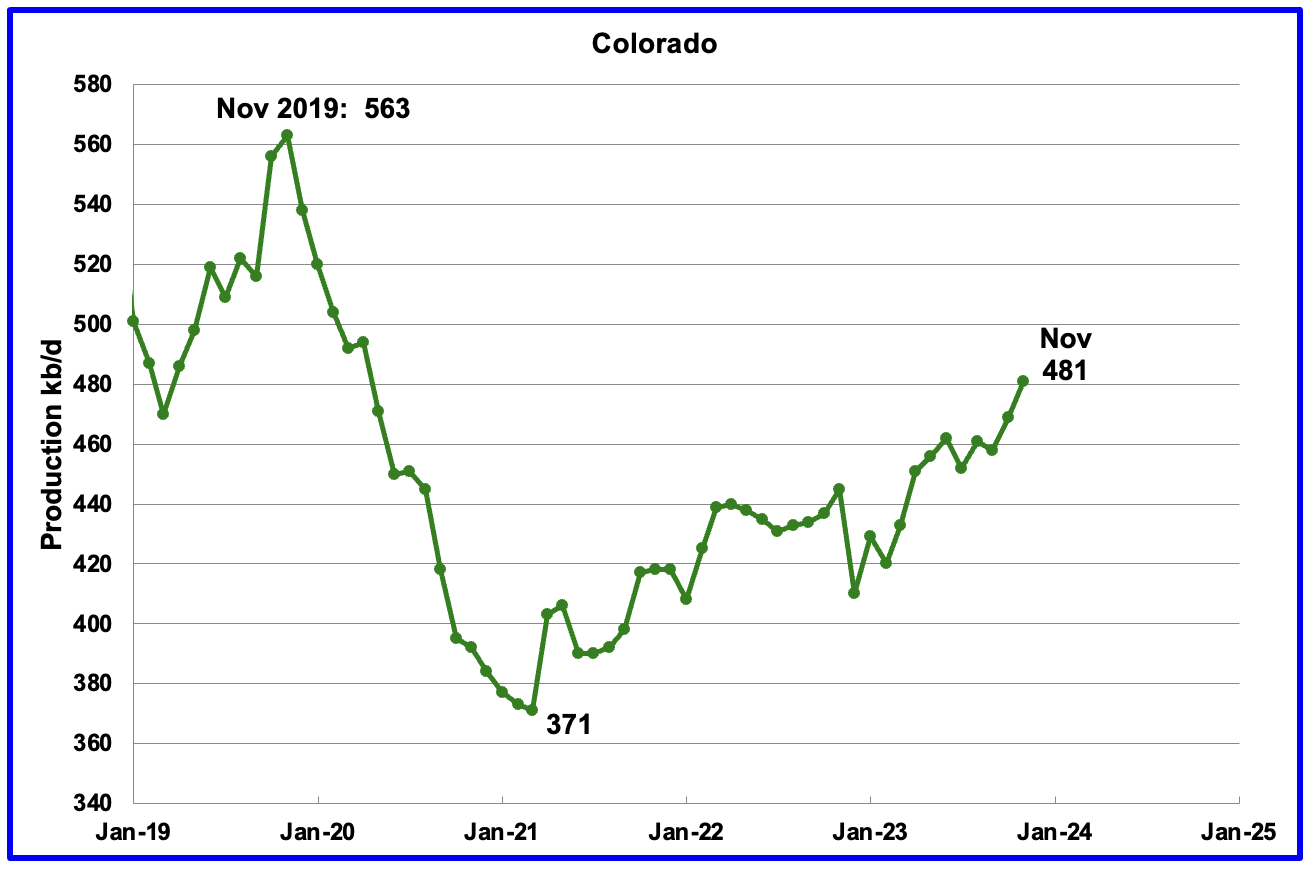
Coloradoʼs November production increased by 12 kb/d to 481 kb/d. Colorado has moved ahead of Alaska to become the 4th largest oil producing state.
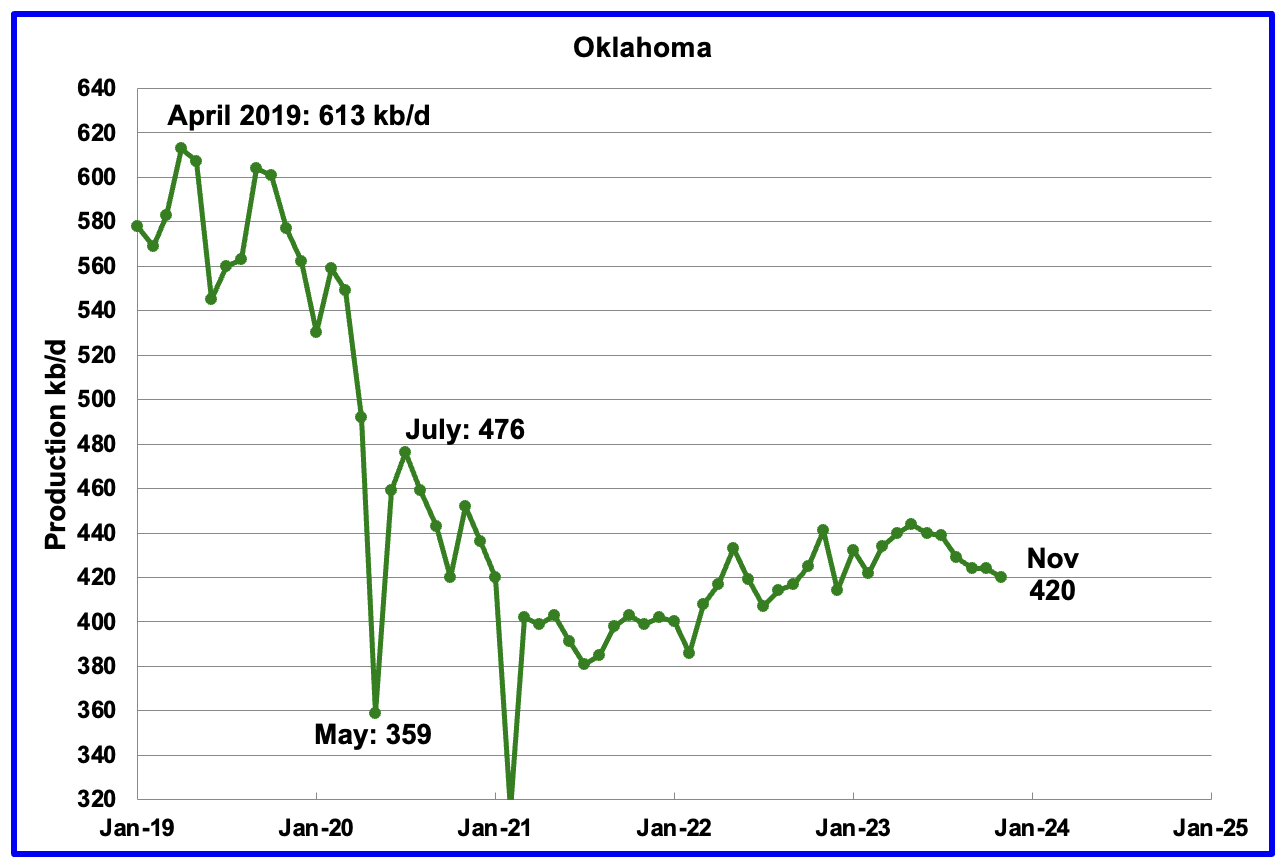
Oklahoma’s output in November decreased by 4 kb/d to 420 kb/d. Production remains 56 kb/d below the post pandemic July 2020 high of 476 kb/d. Output may have entered plateau/declining phase.
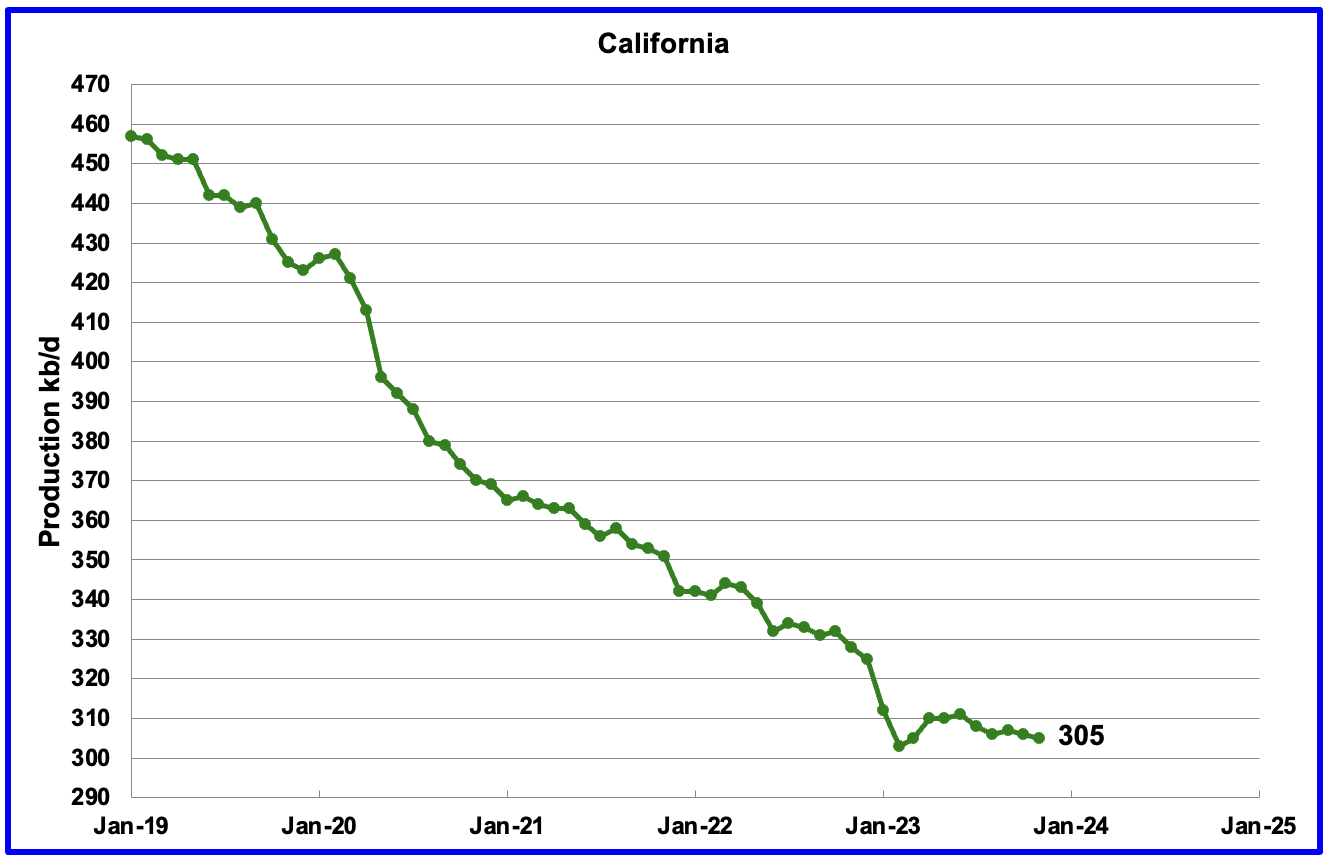
Californiaʼs November production declined 1 kb/d to 305 kb/d.
According to this Article, “The two largest U.S. oil producers, Exxon Mobil and Chevron will formally disclose a combined $5 billion write down of California assets when they report fourth-quarter results.”
“Exxon Mobil last year exited onshore production in the state, ending a 25-year-long partnership with Shell PLC when they sold their joint-venture properties.
Chevron will also take charges of about $2.5 billion tied to its California assets. It is staying but bitterly contesting state regulations on its oil producing and refining operations in the state, where it was born 145 years ago as Pacific Coast Oil Co.
California’s energy policies are “making it a difficult place to invest,” even for renewable fuels, a Chevron executive said this month. The company pumps oil from fields developed 100 years ago but has cut spending in the state by “hundreds of millions of dollars since 2022,” the executive said.”
It is not clear if this action by Exxon and Chevron will accelerate/change the production decline rate in California.
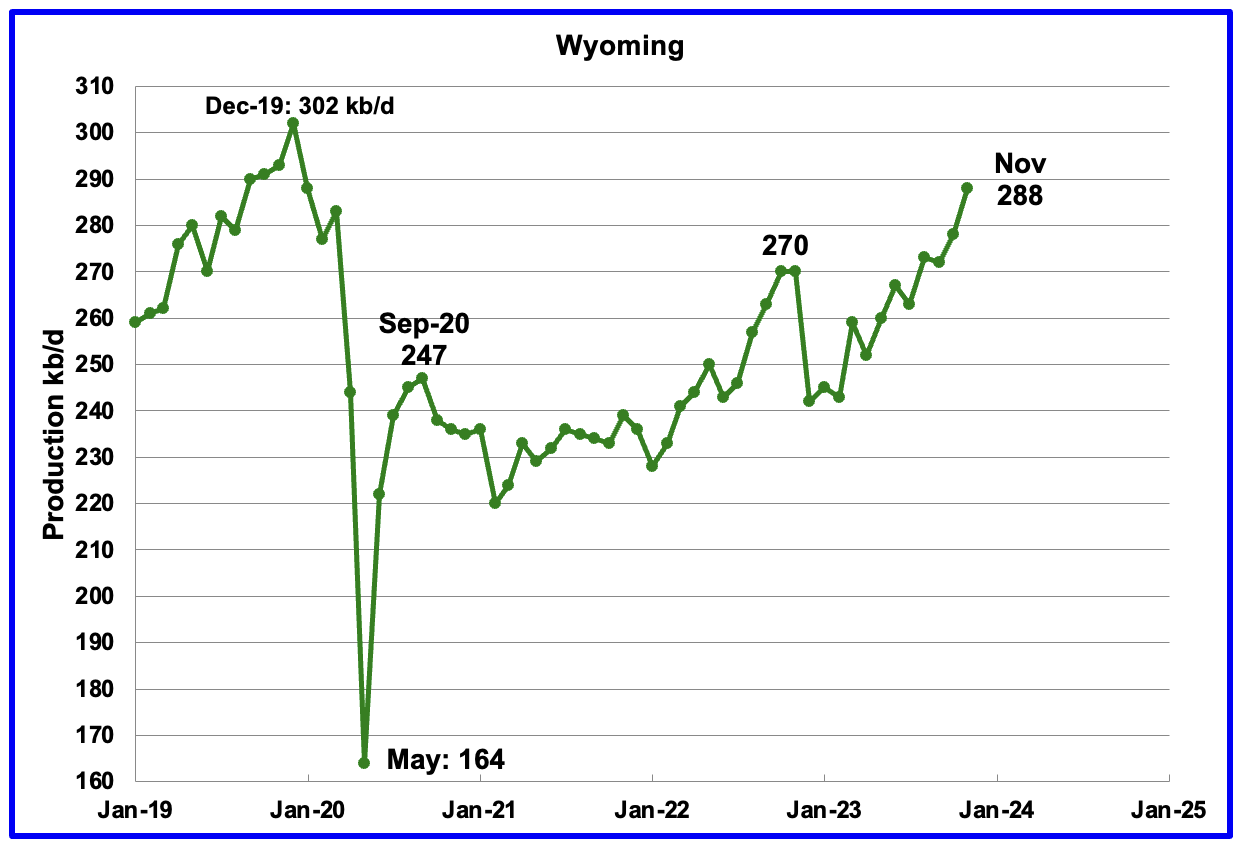
Wyoming’s oil production has been rebounding since March 2023. November’s oil production rose to 288 kb/d, a post pandemic record high.
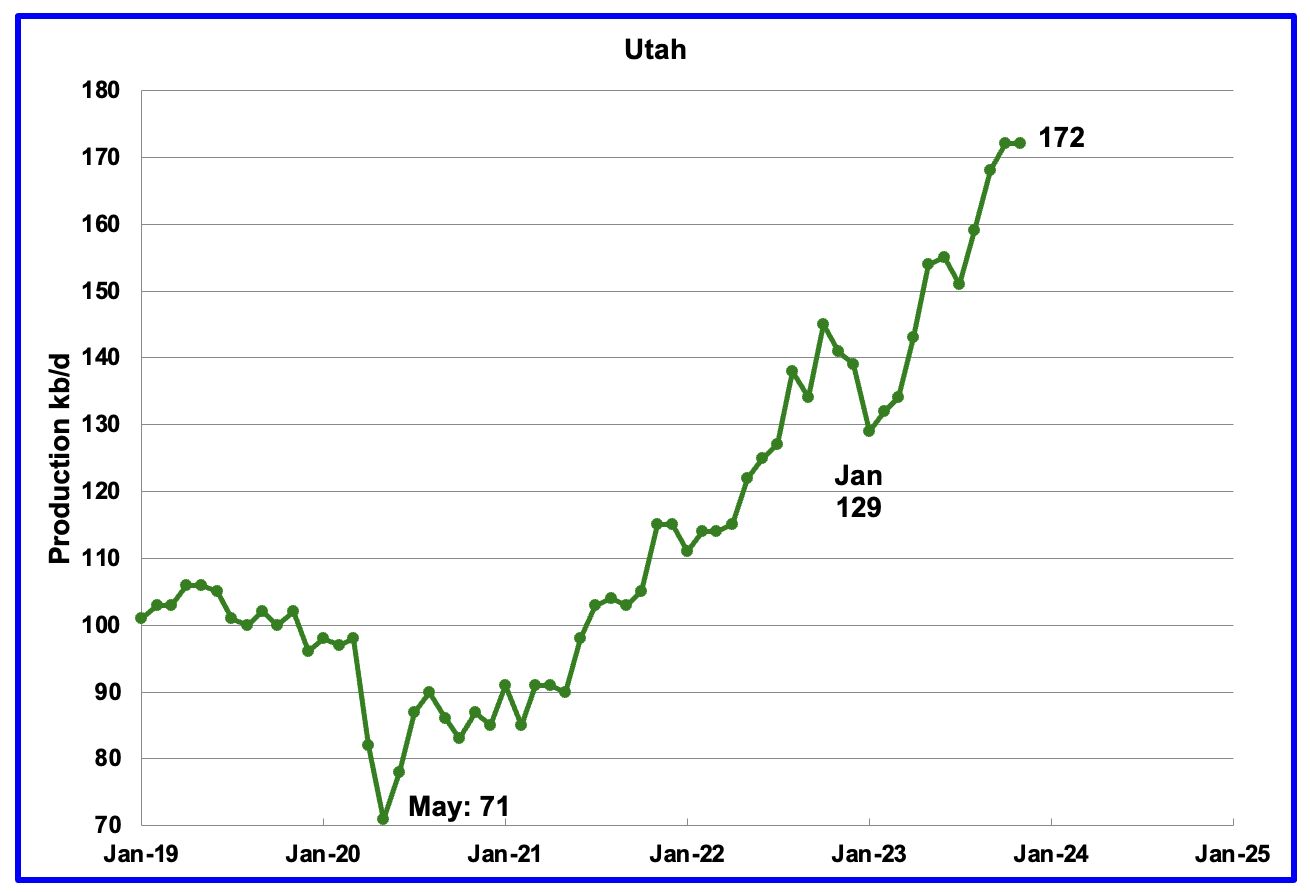
November’s production was unchanged at 172 kb/d. For the first 4 months of 2023, Utah had 7 rigs operating. Since May the number of operational rigs has bounced between 8 and 9, which may account for the increased production.
The increased production since February has come from the Uinta basin.
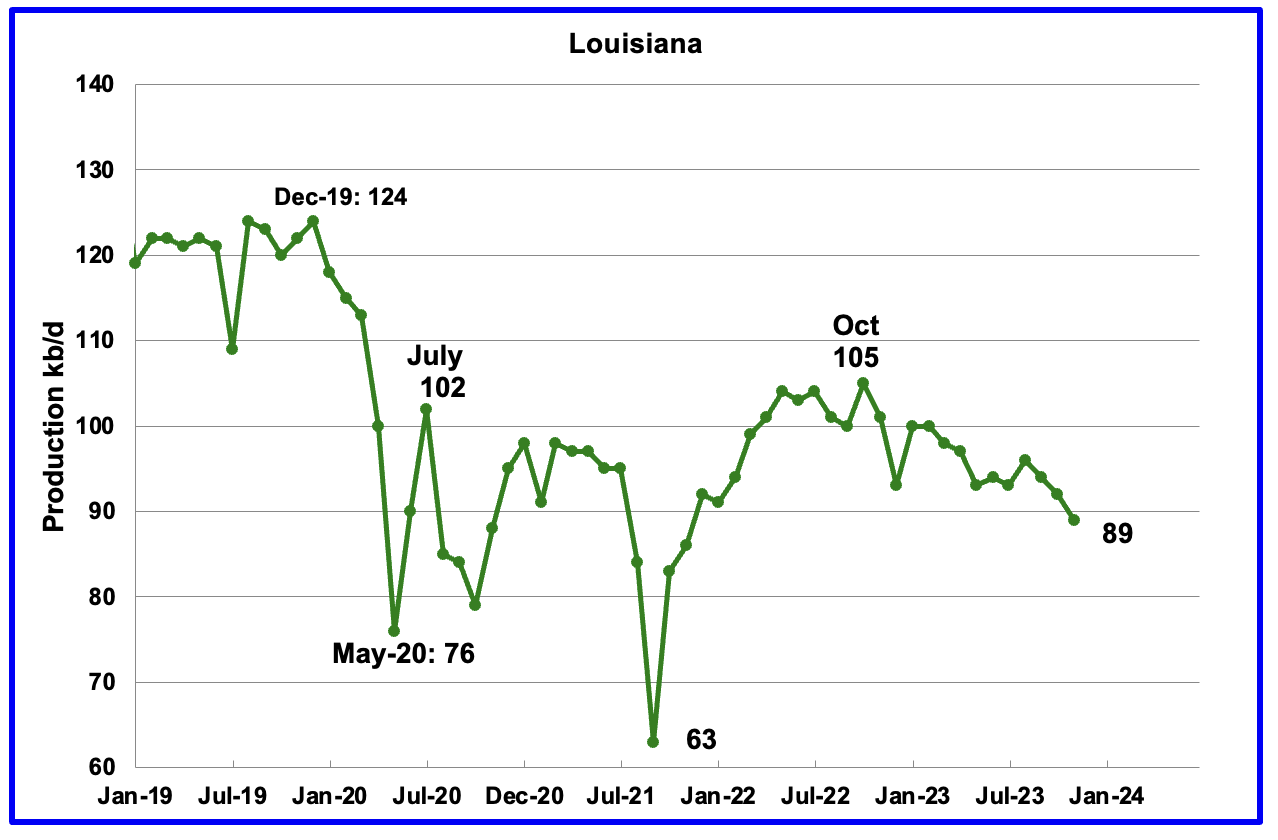
Louisiana’s output entered into a slow decline phase in October 2022. November’s production decreased by 3 kb/d to 89 kb/d and is 16 kb/d lower than the recent October 2022 high.
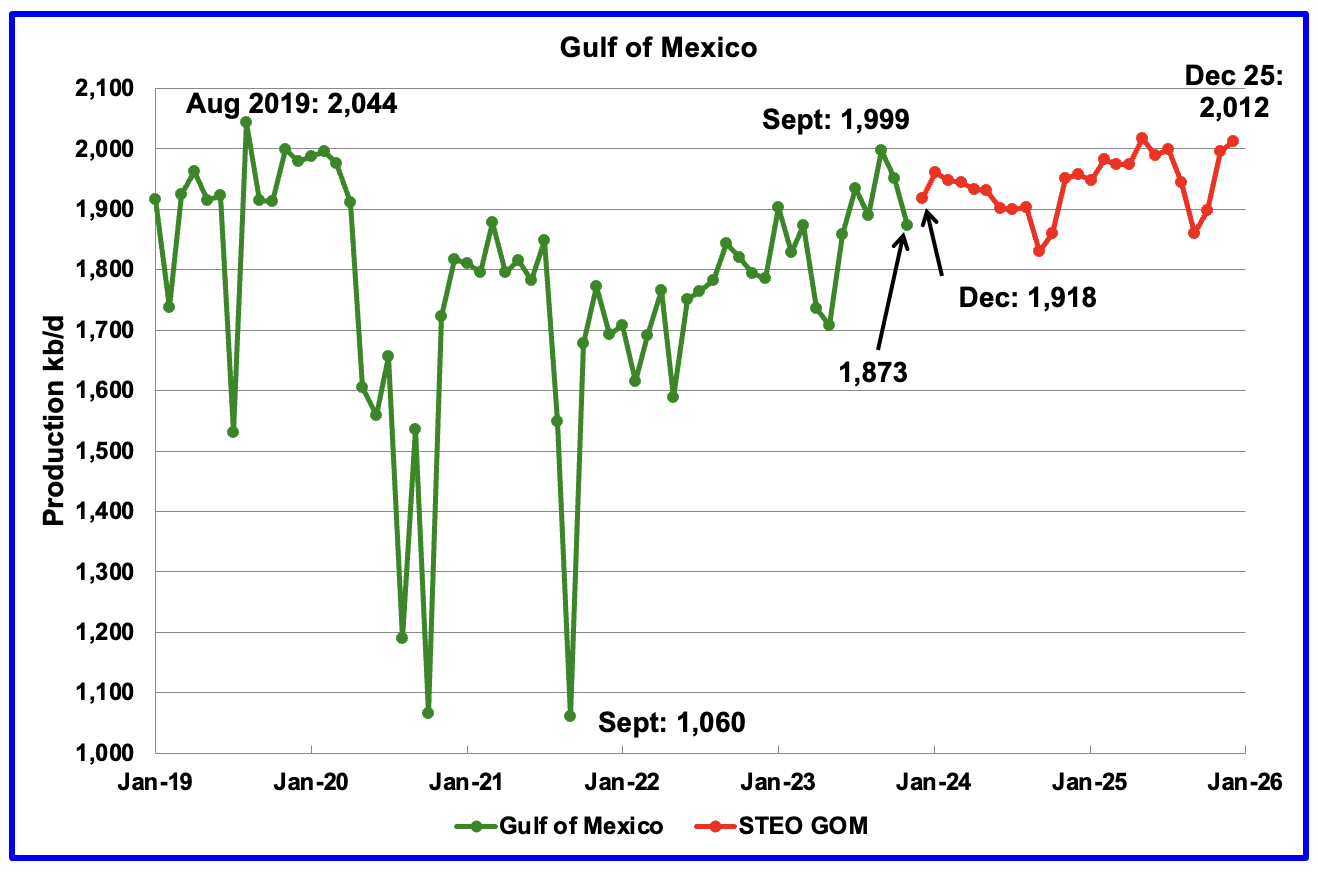
GOM production decreased by 78 kb/d in November to 1,873 kb/d but is expected to rebound in December by 45 kb/d to 1,918 kb/d.
The January 2024 STEO projection for the GOM output has been added to this chart. It projects that over the next 24 months production will increase to 2,012 kb/d in December 2025.
It is not known if the GOM decline shown after January 2024 is related to a combination of extensive maintenance and a general decline of wells. Also disappointing production from some highly touted wells could be an issue according to this source.
George Kaplan has provided the following chart and comment regarding production from GOM startups that began in 2022/23.
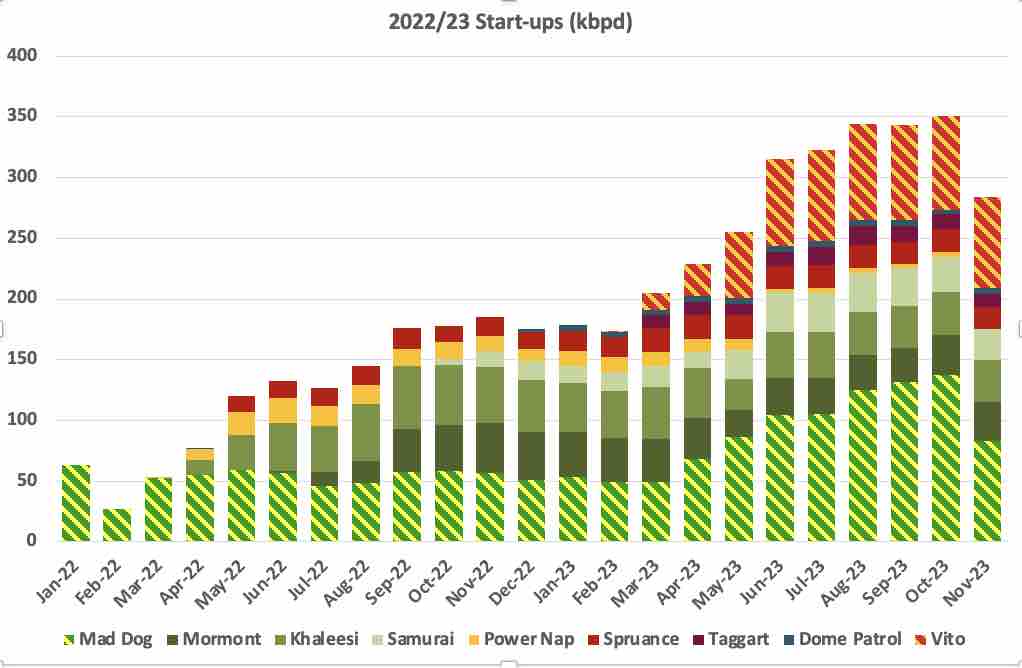
All except the two smallest of the recent leases added for GOM had lower production in November, with Mad Dog having several days of turnaround. I’m not sure if Mad Dog has the potential to increase above its previous maximum and Vito should hold a plateau for a couple of years, but all the others look to be now in decline. Water cut in Taggart is rising very quickly and it is also impacting Spruance and Khaleesi. Of the new leases expected Rydberg is some months late, no news on Whale (also now late wrt original Shell announcement at time of FID) or Shenzi North yet. The Main Pass pipeline seems to be still out, so about 70 kbpd offline.
A Different Perspective on US Oil Production
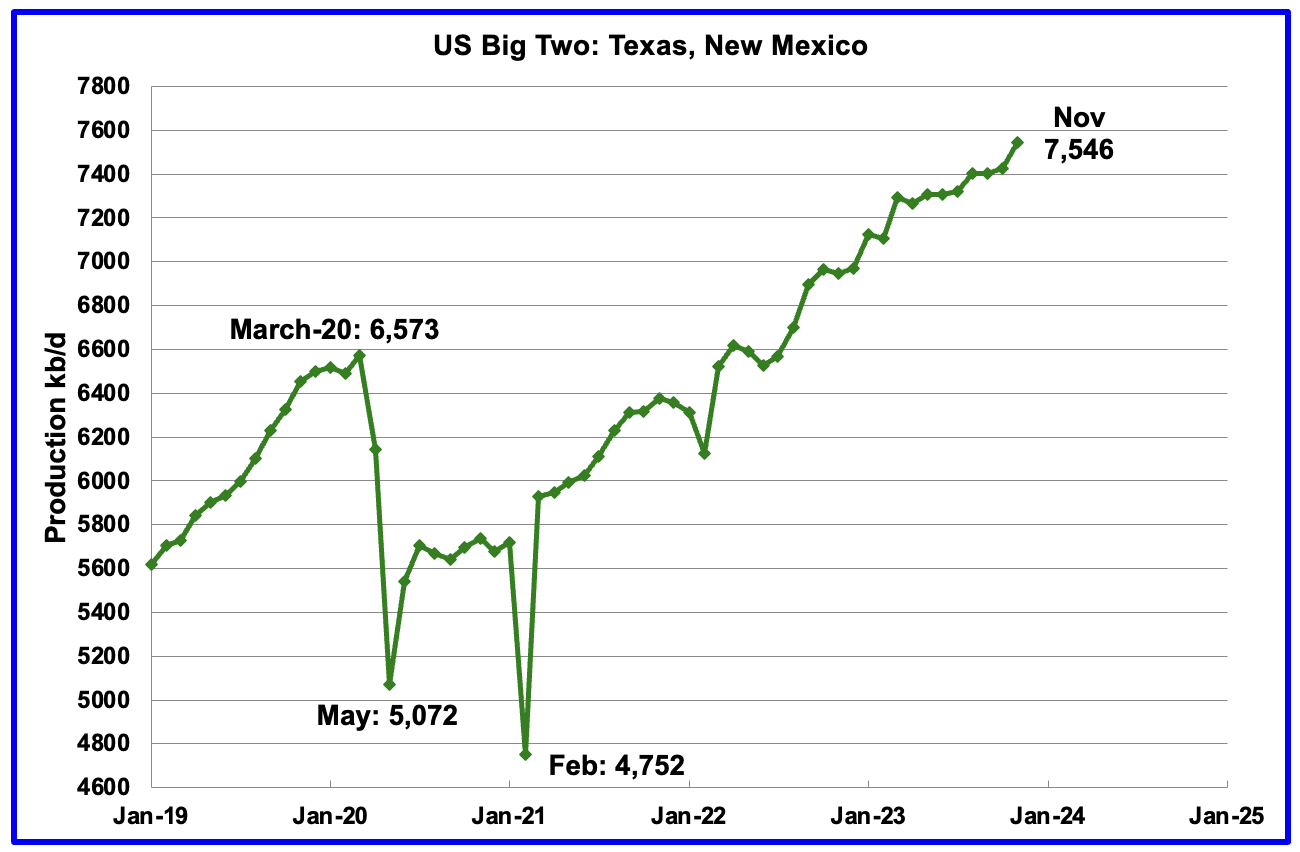
The Big Two states’ combined oil output for Texas and New Mexico.
November’s production in the Big Two states increased by a combined 121 kb/d to 7,546 kb/d with Texas adding 76 kb/d while New Mexico added 45 kb/d.
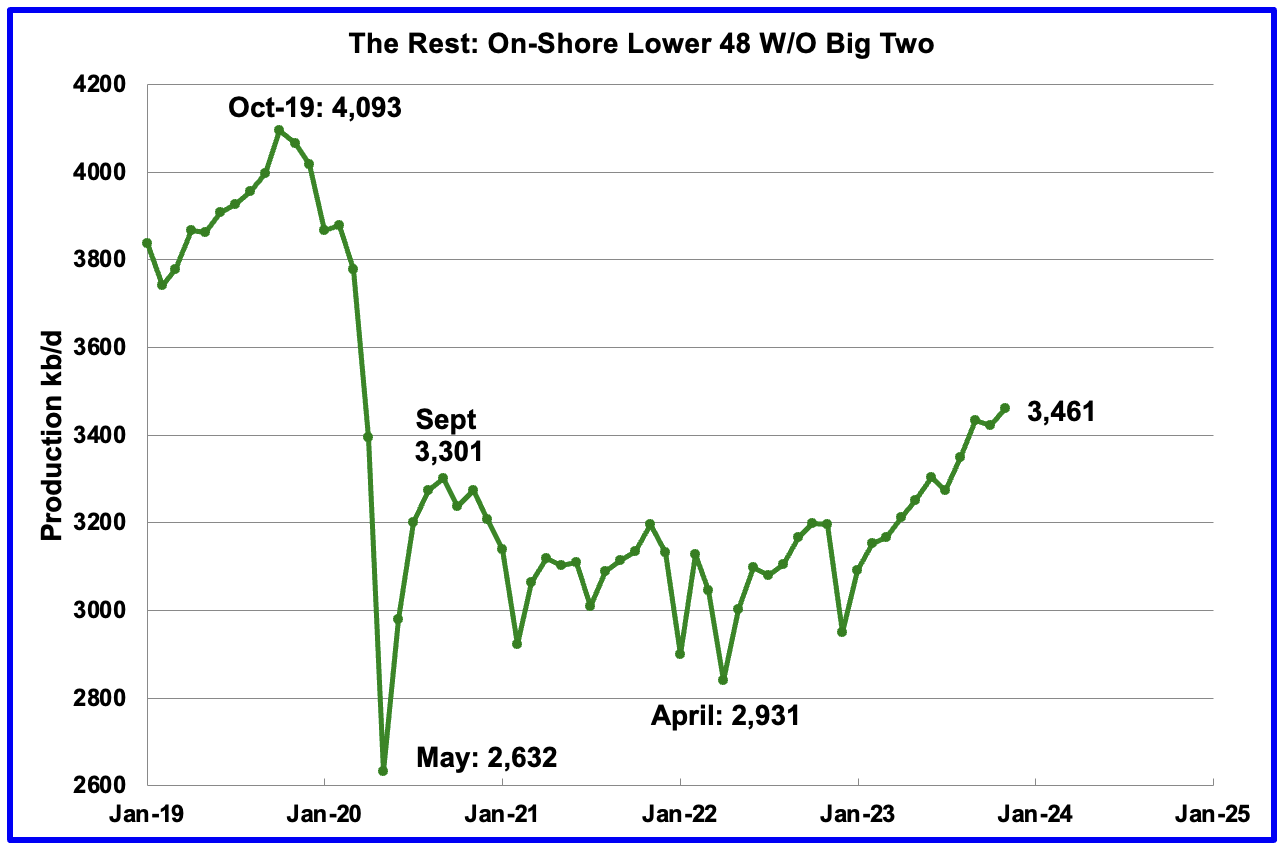
Oil production by The Rest
November’s production in The Rest increased by 39 kb/d to 3,420 kb/d. The main contributors to the increase were North Dakota 17 kb/d, Colorado 12 kb/d and Wyoming 10 kb/d.
The main takeaway from The Rest chart is that current production is 632 kb/d below the high of October 2019 and this appears to be a permanent loss that will never be recovered.
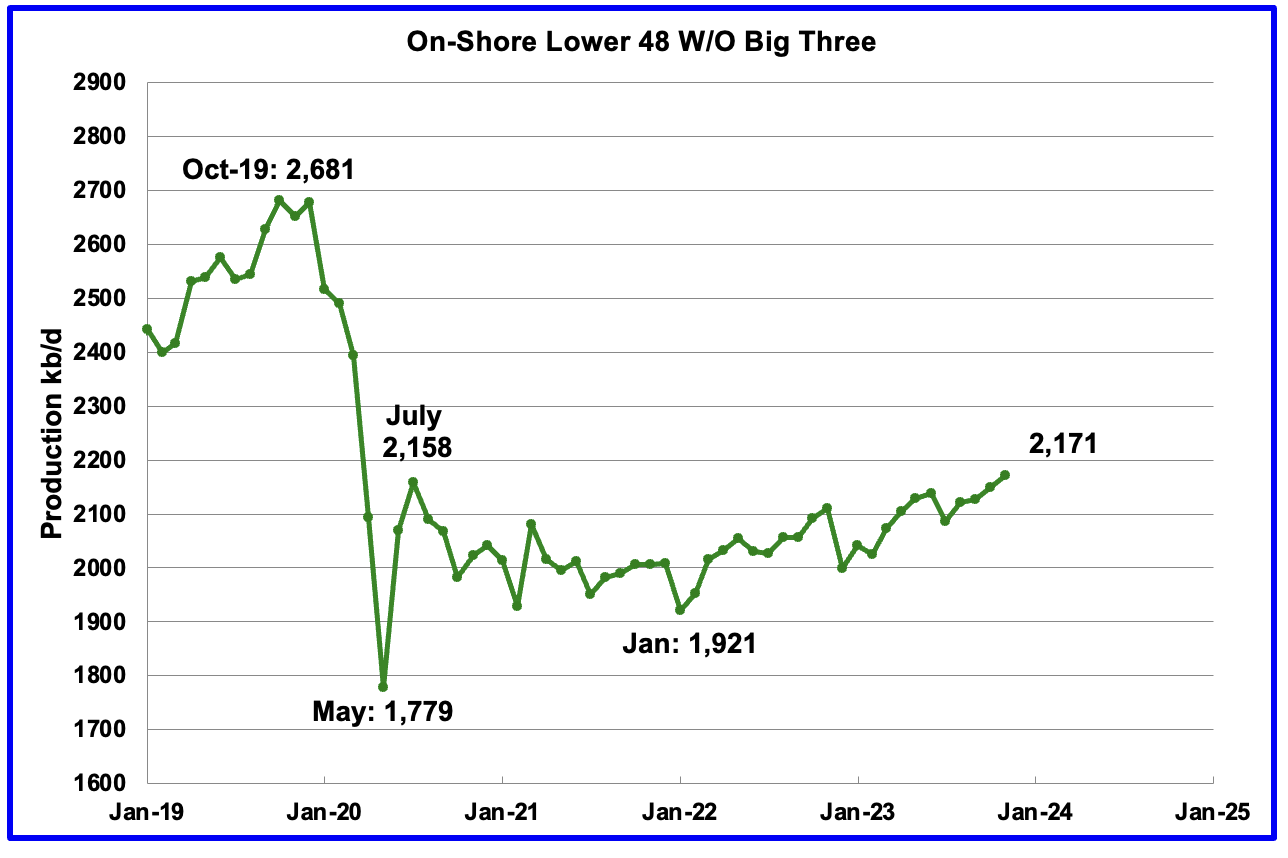
The On-Shore lower 48 W/O the big three, Texas, New Mexico and North Dakota, shows a slow rising trend from the low of January 2022. November’s production increased by 22 kb/d to 2,171 kb/d. The majority came from Colorado, 12 kb/d and Wyoming 10 kb/d. Production from these states has just exceeded the post covid production high of 2,158 kb/d in July 2020.
Rig report for week ending February 2
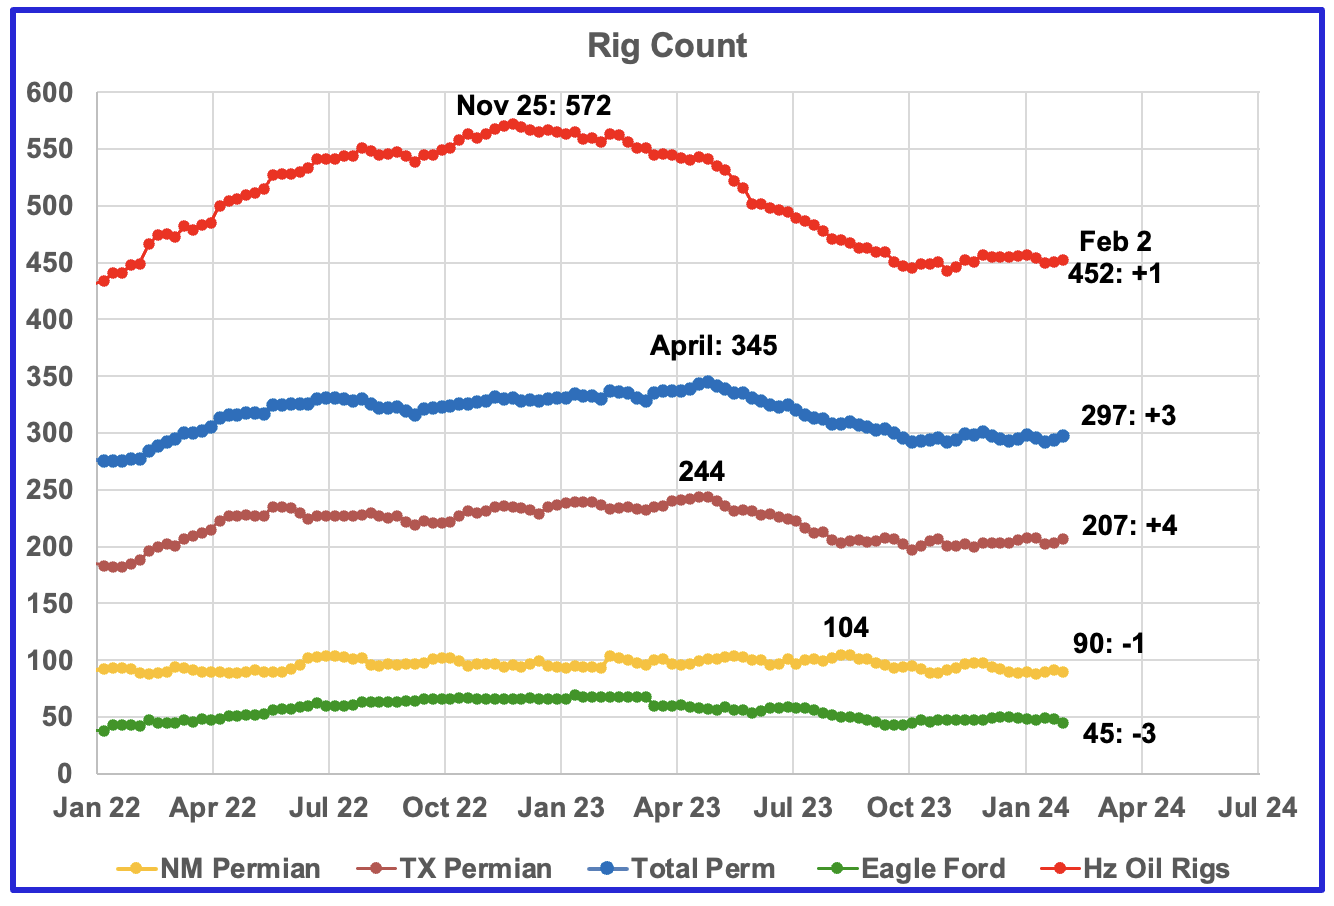
– US Hz oil rigs increased by 1 to 452. The rig count has been close to 450 since the beginning of October.
– Permian rigs were up 3 to 297. Texas Permian was up 4 to 207 while NM was down 1 to 90. In New Mexico, Lea county was down 4 to 40 while Eddy added 2 to 50.
– Eagle Ford dropped 3 to 45.
– NG Hz rigs declined by 2 to 105 (not shown)
Frac Spread Count for Week ending February 2
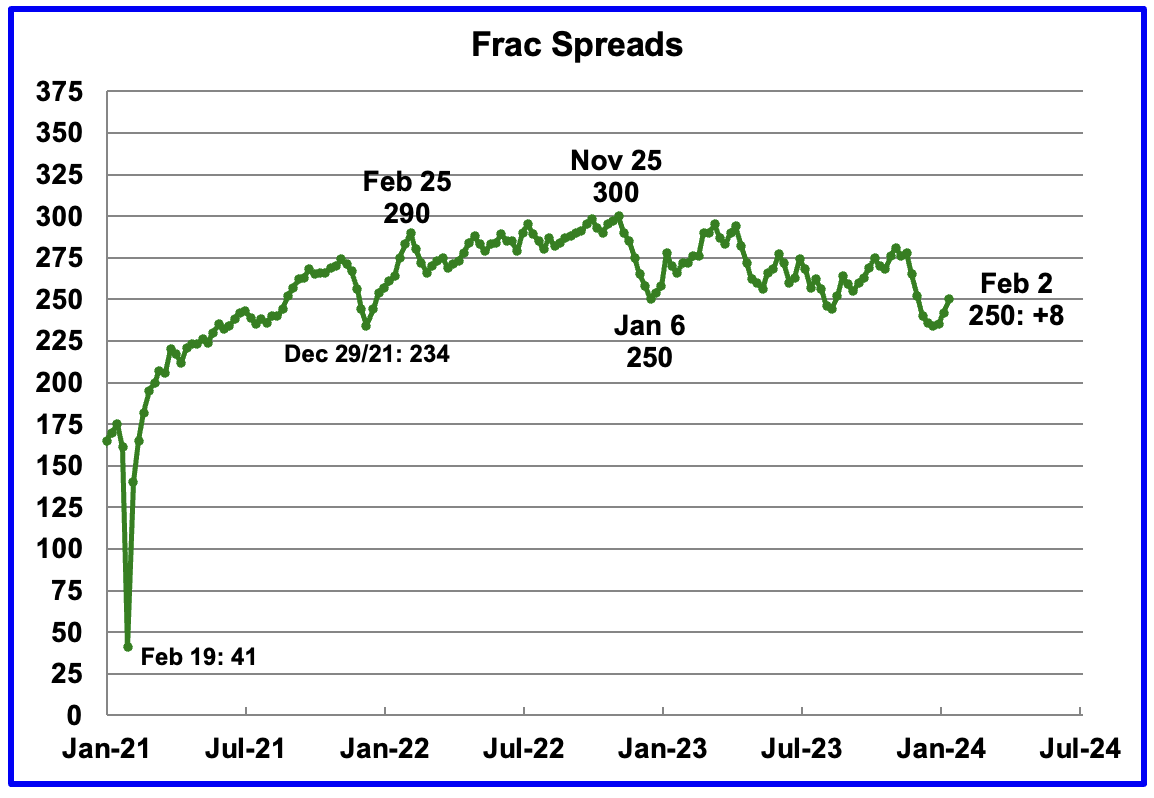
The frac spread count was up 8 to 250 and up 16 from the previous low of 234 on December 29, 2021. How high will the Frac count go in 2024?
Permian Basin Report by Main Counties and Districts
This special monthly Permian section was recently added to the US report because of a range of views on whether Permian production will continue to grow or will peak over the next year or two. The issue was brought into focus recently by the Goehring and Rozencwajg Report which indicated that a few of the biggest Permian oil producing counties were close to peaking or past peak. Also comments by posters on this site have similar beliefs from hands on experience.
This section will focus on the four largest oil producing counties in the Permian, Lea, Eddy, Midland and Martin. It will track the oil and natural gas production and the associated Gas Oil Ratio (GOR) on a monthly basis. The data is taken from the state’s government agencies for Texas and New Mexico. Typically the data for the latest two or three months is not complete and is revised upward as companies submit their updated information. Note the natural gas production shown in the charts that is used to calculate the GOR is the gas coming from both the gas and oil wells.
Of particular interest will be the charts which plot oil production vs GOR for a county to see if a particular characteristic develops that indicates the field is close to entering the bubble point phase. While the GOR metric is best suited for characterizing individual wells, counties with closely spaced horizontal wells may display a behaviour similar to individual wells due to pressure cross talking . For further information on the bubble point and GOR, there are a few good thoughts on the intricacies of the GOR in an earlier POB comment. Also check this EIA topic on GOR.
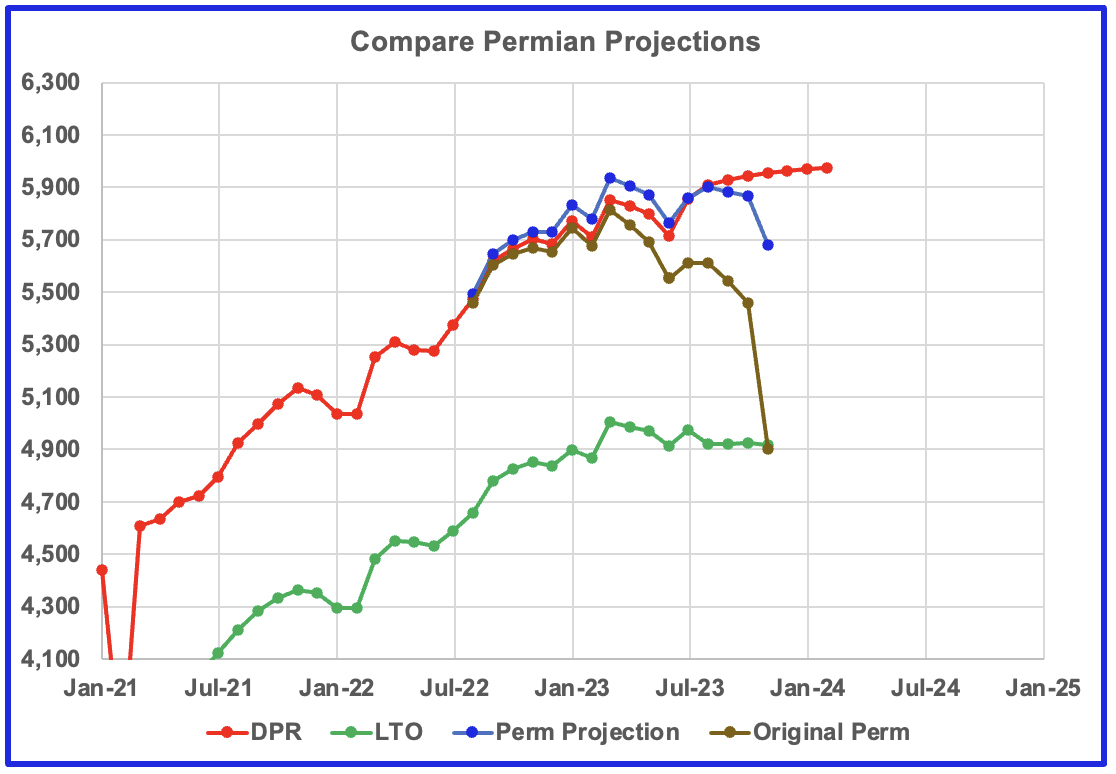
This chart shows four oil production graphs for the Permian basin updated to November and to February for the DPR. The gap between the DPR and LTO projections is there because the DPR projection includes both LTO oil along with oil from conventional wells in the basins that it covers.
The red and green graphs show oil production as published by the EIA’s DPR and the LTO offices. Comparing the two, it appears that the LTO office believes Permian LTO production is currently in a plateau phase while the DPR office continues to show a small increase in growth before plateauing. The blue marker is a projection. The brown chart is the sum of Permian production data from the Texas RRC and the New Mexico Oil Conservation Division. The big November drop is due to a larger than typical monthly production drop in the RRC data.
The blue graph only uses two months of production data from New Mexico OCD and the Texas RRC, October and November, to make its November projection. The blue graph is similar to the DPR and LTO graphs in the sense that it is also indicating that Permian production may be entering a plateau phase.
New Mexico Permian
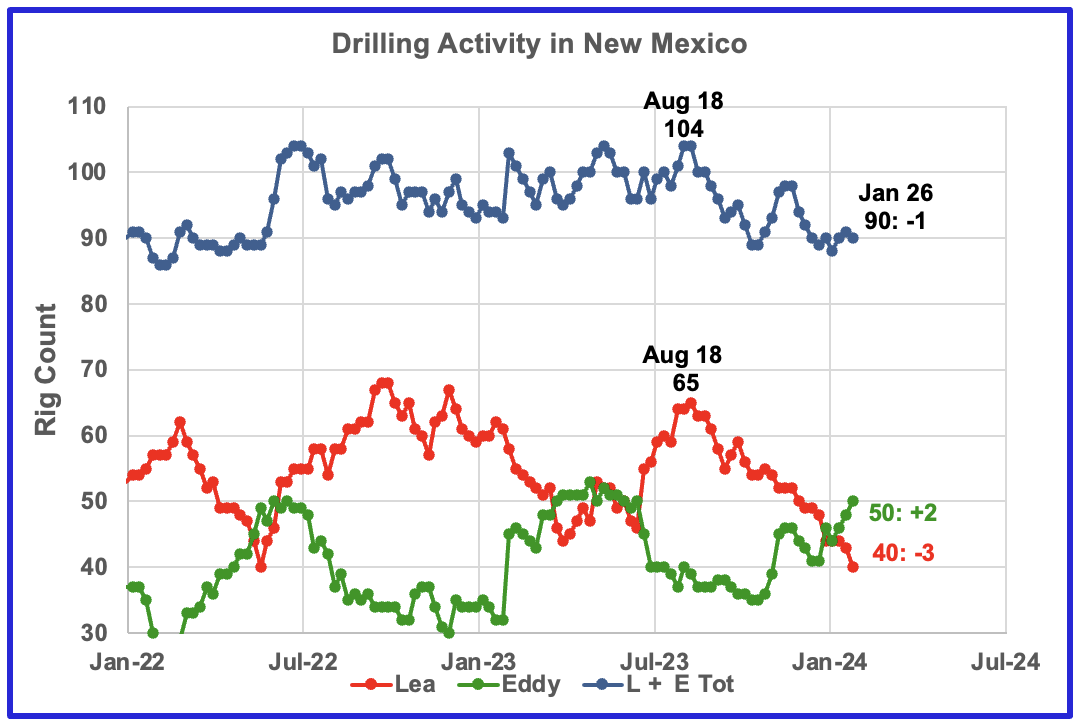
Over the past six months drilling activity in Lea county has fallen each month. For the week ending February 2, the rig count in Lea dropped by three while Eddy added two. Since the middle of August, the Lea county rig count has dropped from 65 rigs to 40 rigs in Januuary 2024. At the same time November production in Lea county increased by 59 kb/d, see next chart.
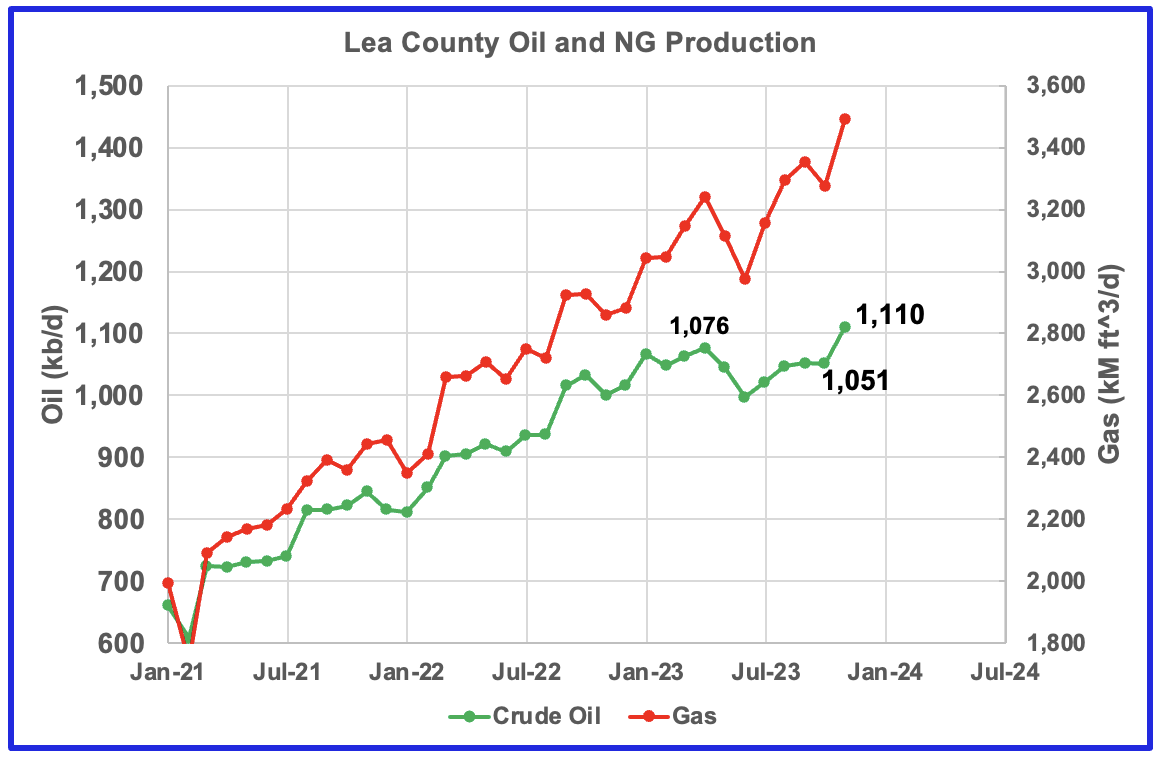
From June 2023 to September 2023 NG production rose faster than oil production in Lea county. However November saw both record NG and oil production and the GOR stayed in the same range as the past three months, see next chart.
November oil production increased by 59 kb/d to a record 1,110 kb/d even though the rig count dropped by 25 rigs since August 18. Assuming the average spud to production time is 6 months, that implies a small number of new wells could have started producing in 4 to 5 months. In other words, the November production increase must be associated with a number of June 2023 drilled wells coming online in November. That being the case, the production increase in Lea could increase for another month before starting to decline, assuming that production should follow the dropping rig count, delayed by 4 to 8 months.
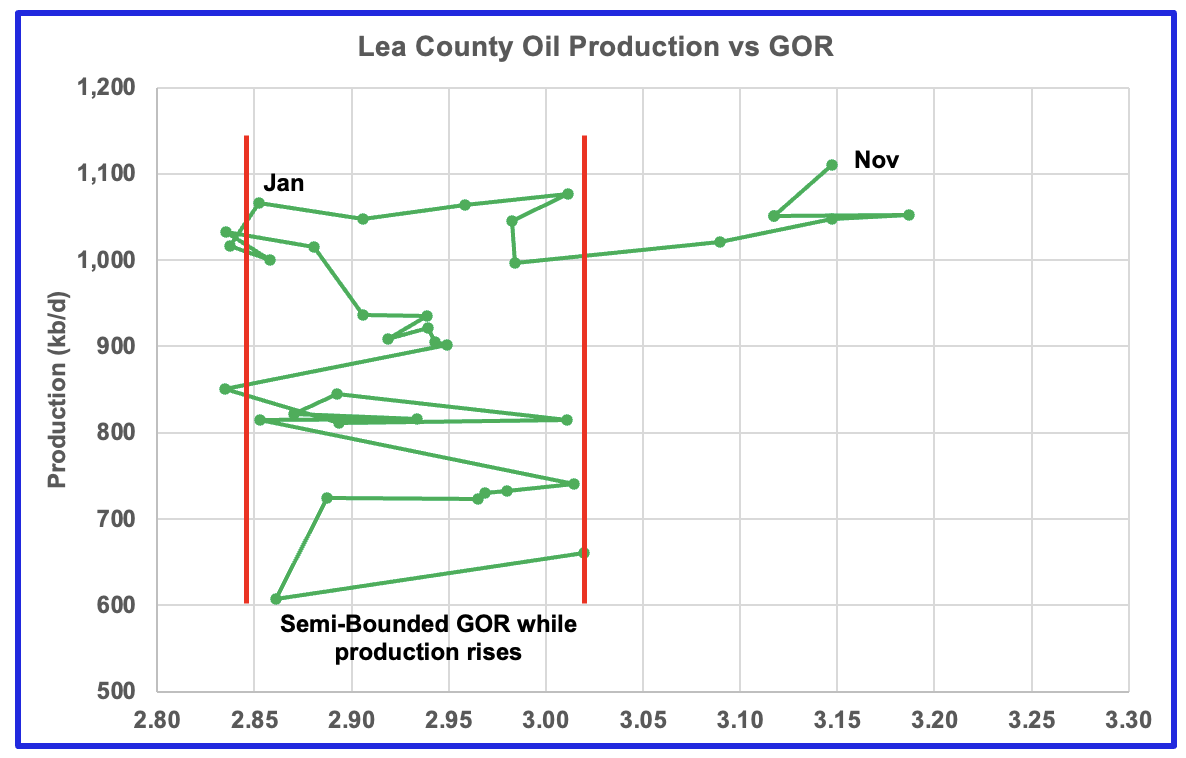
After much zigging and zagging, oil production in Lea county stabilized above 1,000 kb/d. The GOR and oil production both increased in January 2023. November oil production in Lea county hit a new high of 1,110 kb/d. The data for the last four months, August to November, is incomplete and will be updated over the next few months.
This zigging and zagging GOR pattern within a semi-bounded GOR while oil production increases to some stable level and then moves out to a higher GOR to the right has shown up in a number of counties. See an additional two cases below. While this is the fifth month in which Lea county has registered a GOR outside the semi-bounded GOR range, the November trend has changed since both production and the GOR have increased. As noted above the increase must be related to the significant increase in drilling that started in mid June.
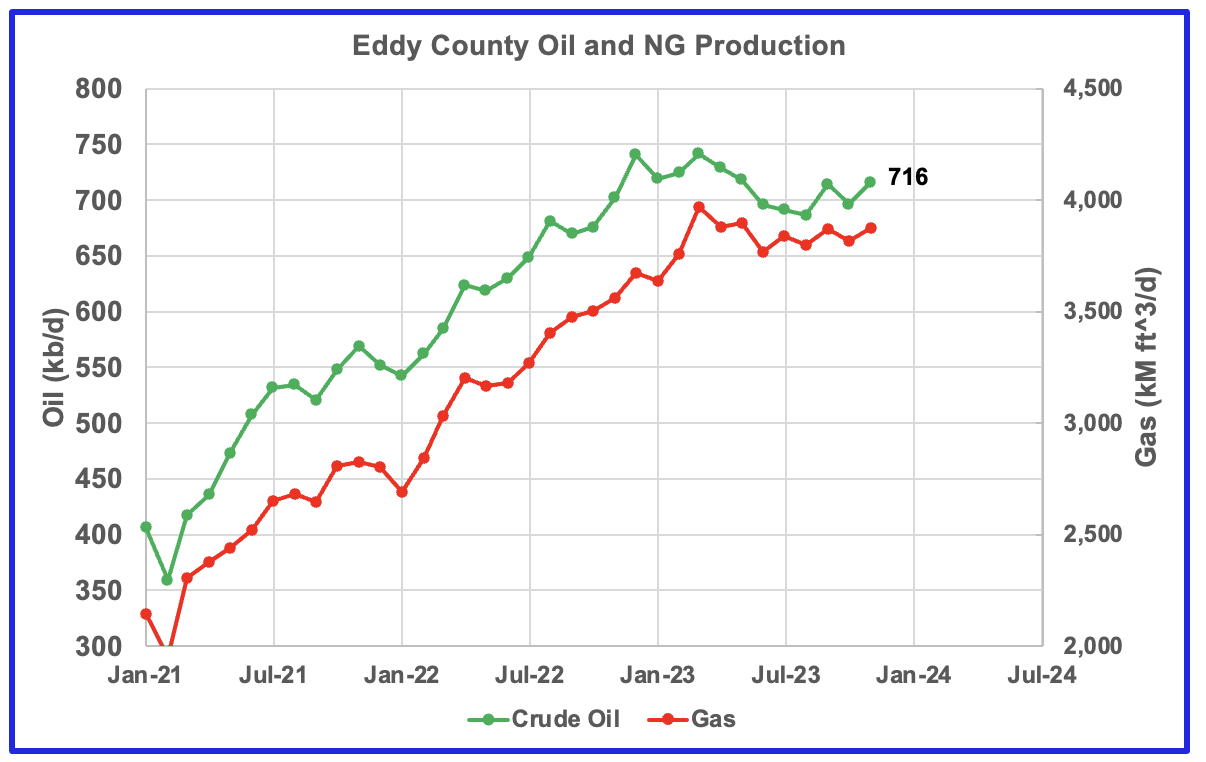
Eddy county oil production is showing early signs that it is in a plateau phase. November production was 716 kb/d.
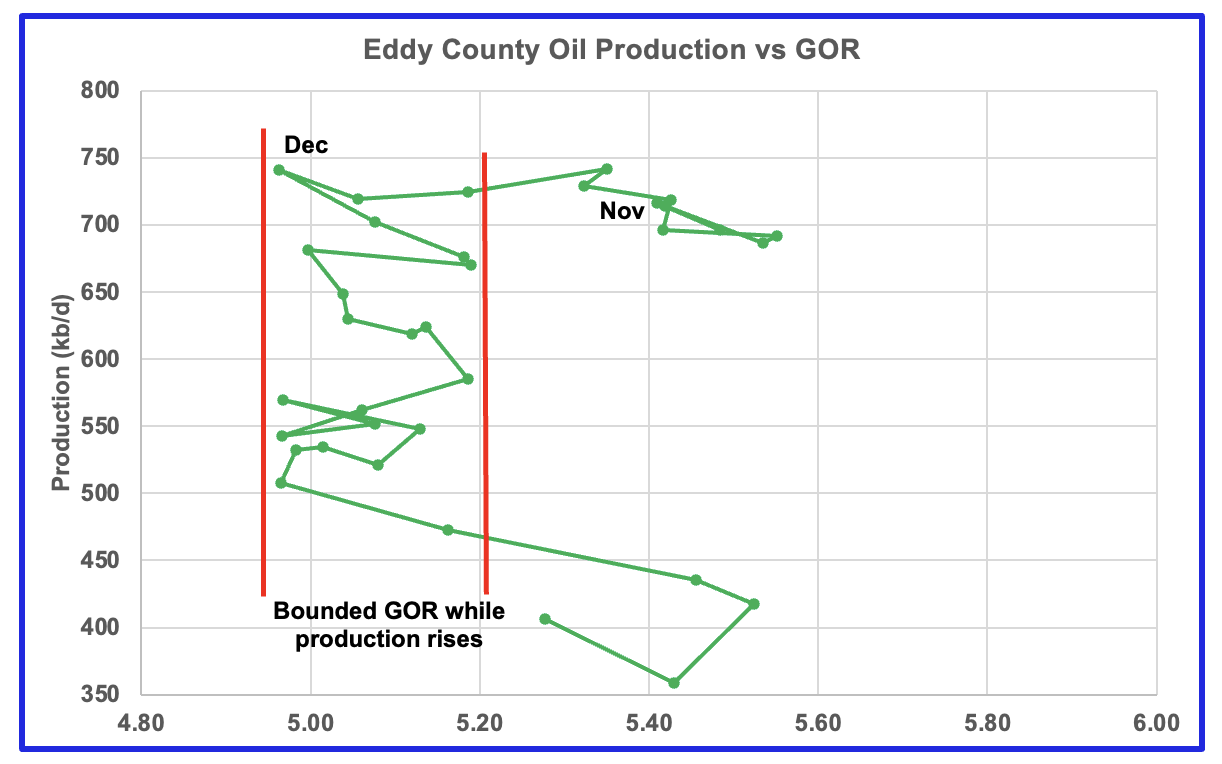
The Eddy county GOR pattern is similar to Lea county except that Eddy broke out from the semi bounded range earlier and for a longer period while oil production has been bouncing around the 700 kb/d level.
Texas Permian
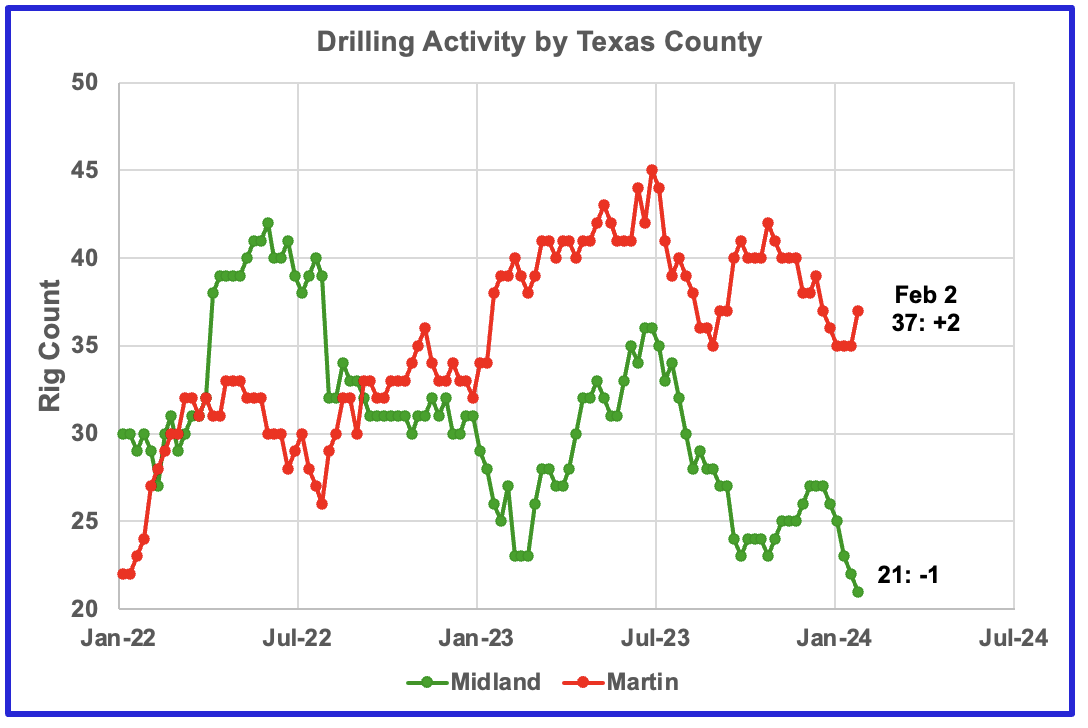
During December 2023 drilling activity started to decrease in both counties and continued into January. However the rig count increased in Martin county in early February.
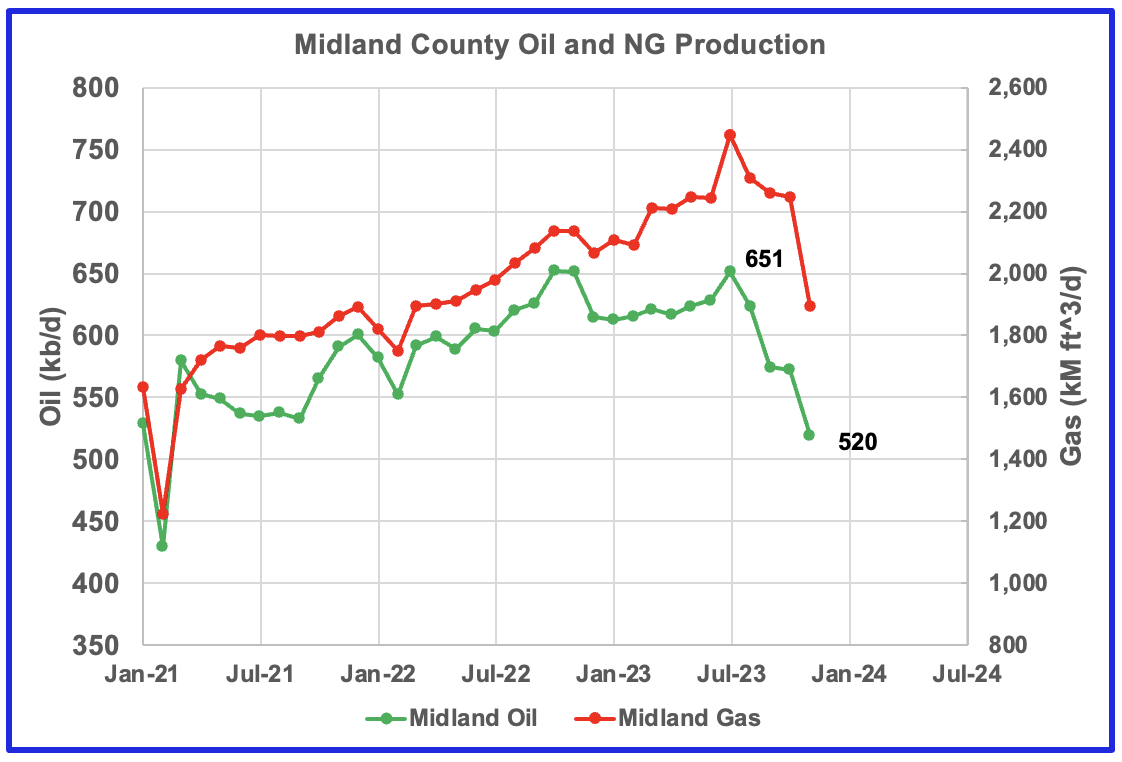
Both natural gas and oil production are dropping in Midland county. November Oil production has dropped by 131 kb/d to 520 kb/d since July 2023.
Comparing the drop in production with the rig count, one could speculate that the drilling peak in June 2022 could account for the July 2023 oil production peak. Note the sharp drop in the rig count at the end of July 2022 which could explain the rapid drop in Midland production that started in July 2023.
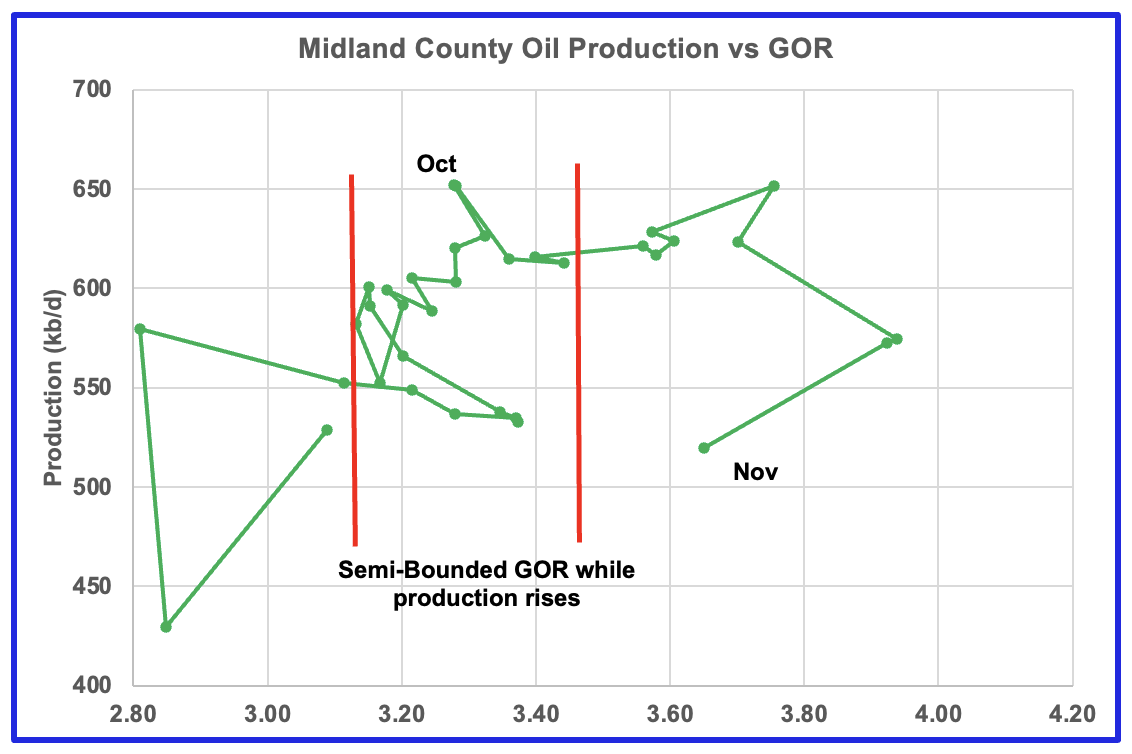
Oil production is dropping and the GOR is increasing. It appears that Midland has entered the bubble point phase?
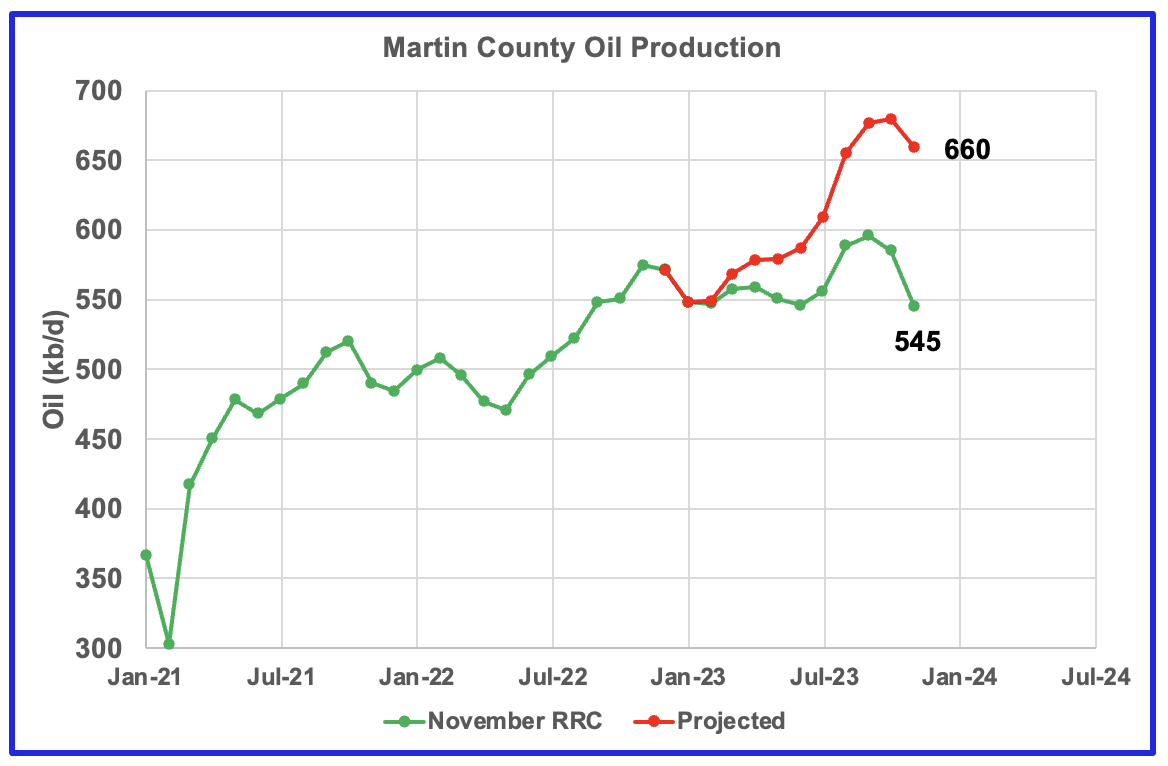
The chart shows the RRC oil production for Martin County along with how the RRC could be reporting November 2023 production about one year from now.
The red line is a production forecast which the Texas RRC will be reporting for Martin county about one year from now as drillers report additional updated production information. This projection is based on a methodology that used October and November production data and will be re-estimated next month.
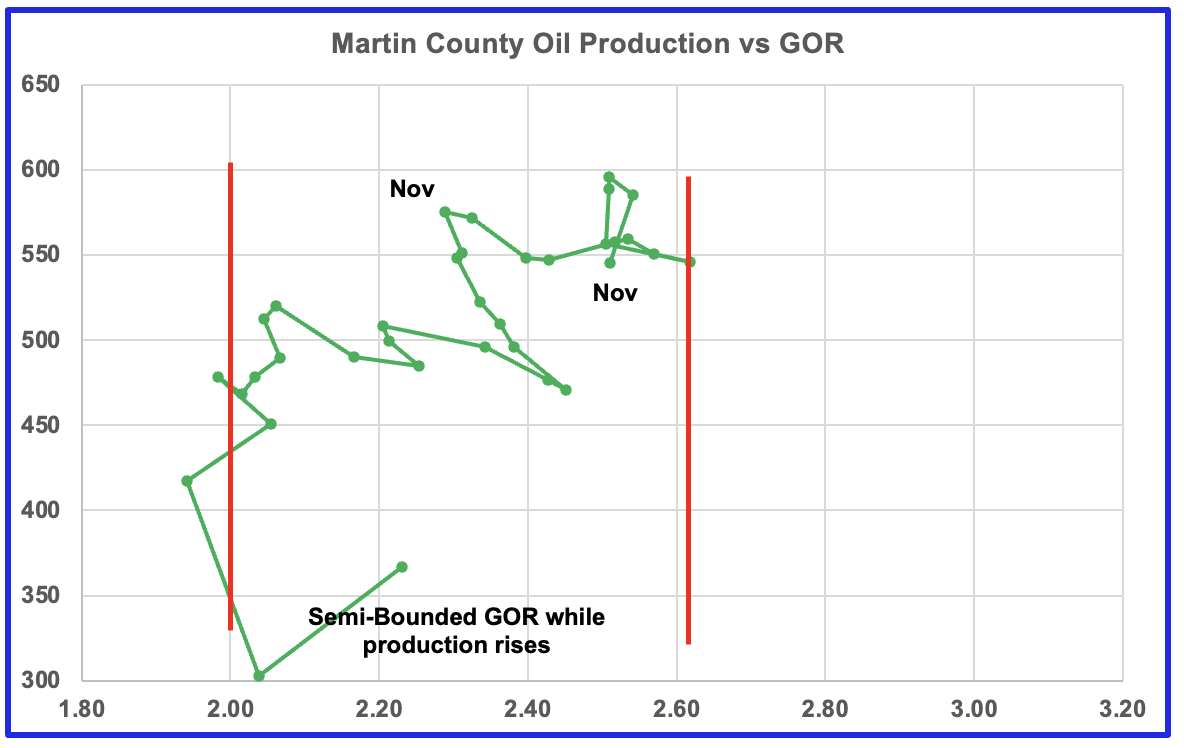
Martin county’s production and GOR continue to stay within the semi bounded range and near peak production. Martin county has the lowest GOR of these four counties at a GOR of 2.51. Martin may not be at the bubble point that results in a dropping oil production trend.
Three of the four oil production vs GOR charts above are exhibiting characteristics indicating that three of the largest oil producing counties in the Permian are in the bubble point phase and are close to or past their peak? Not clear as to what is happening in Martin County.
The production data reported by the RRC this month appears to be a little more under reported than previous months. While there are other indicators pointing to an upcoming peak in Permian oil production, such as the declining rig count, a few more months of data is required.
Eagle Ford Basin Largest County
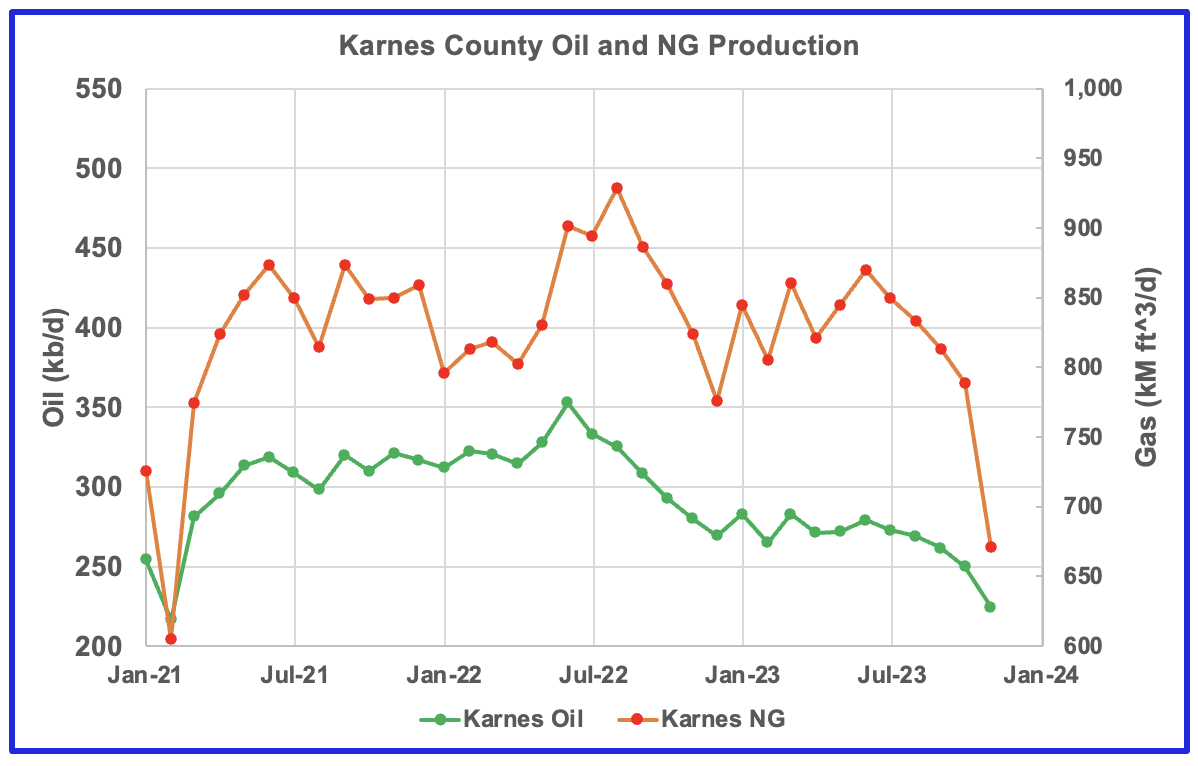
Karnes county is the biggest oil producing county in the Eagle Ford basin and is ranked as the seventh largest oil producing county in Texas. Both oil and gas production are falling in Karnes county and both are down close to 30% from the peak.
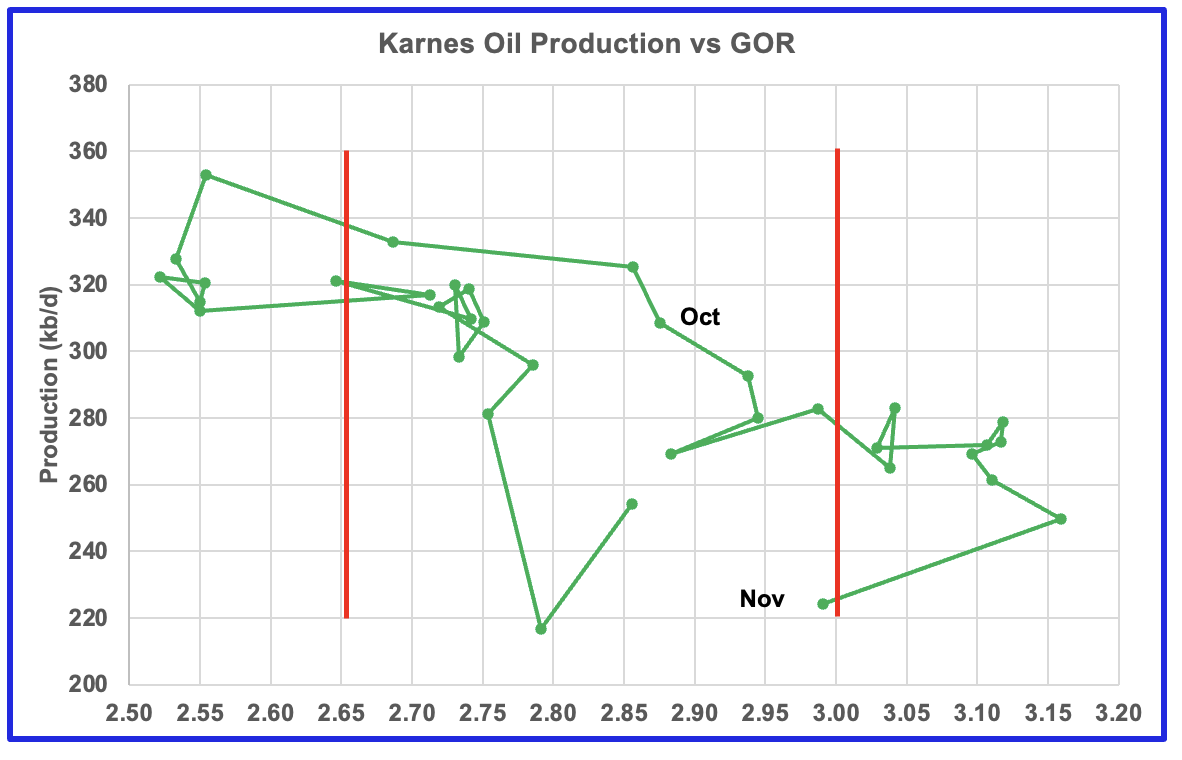
This is the GOR vs oil production chart for Karnes county but the GOR is still within its typical range while both oil production and GOR are dropping. This may indicate that Karnes county wells never entered the bubble point phase and weren’t very gassy to start with. Karnes county ranks fifteen in Texas natural gas production.
Drilling Productivity Report
The Drilling Productivity Report (DPR) uses recent data on the total number of drilling rigs in operation along with estimates of drilling productivity and estimated changes in production from existing oil wells to provide estimated changes in oil production for the principal tight oil regions. The January DPR report forecasts production to February 2024 and the following charts are updated to February 2024. The DUC charts and Drilled Wells charts are updated to December 2023.
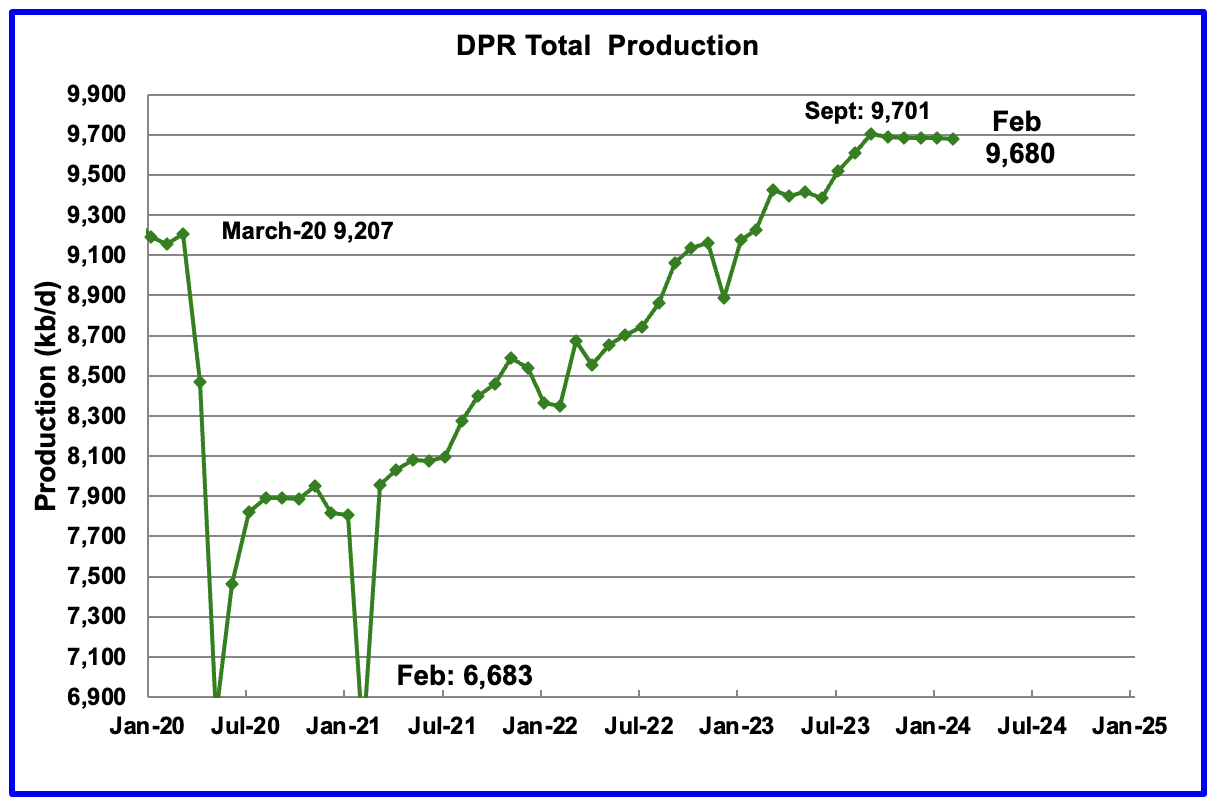
Above is the total oil production projected to February 2024 for the 7 DPR basins that the EIA tracks. Note that DPR production includes both LTO oil and oil from conventional wells.
The DPR is projecting that oil output for February 2024 will decrease by 1 kb/d to 9,680 kb/d.
While DPR production has been essentially flat since September, the February report also made a downward revision to its previous production forecast. For January, DPR production was revised down by 11 kb/d to 9,681 kb/d. Previous revisions over the past few months were upward.
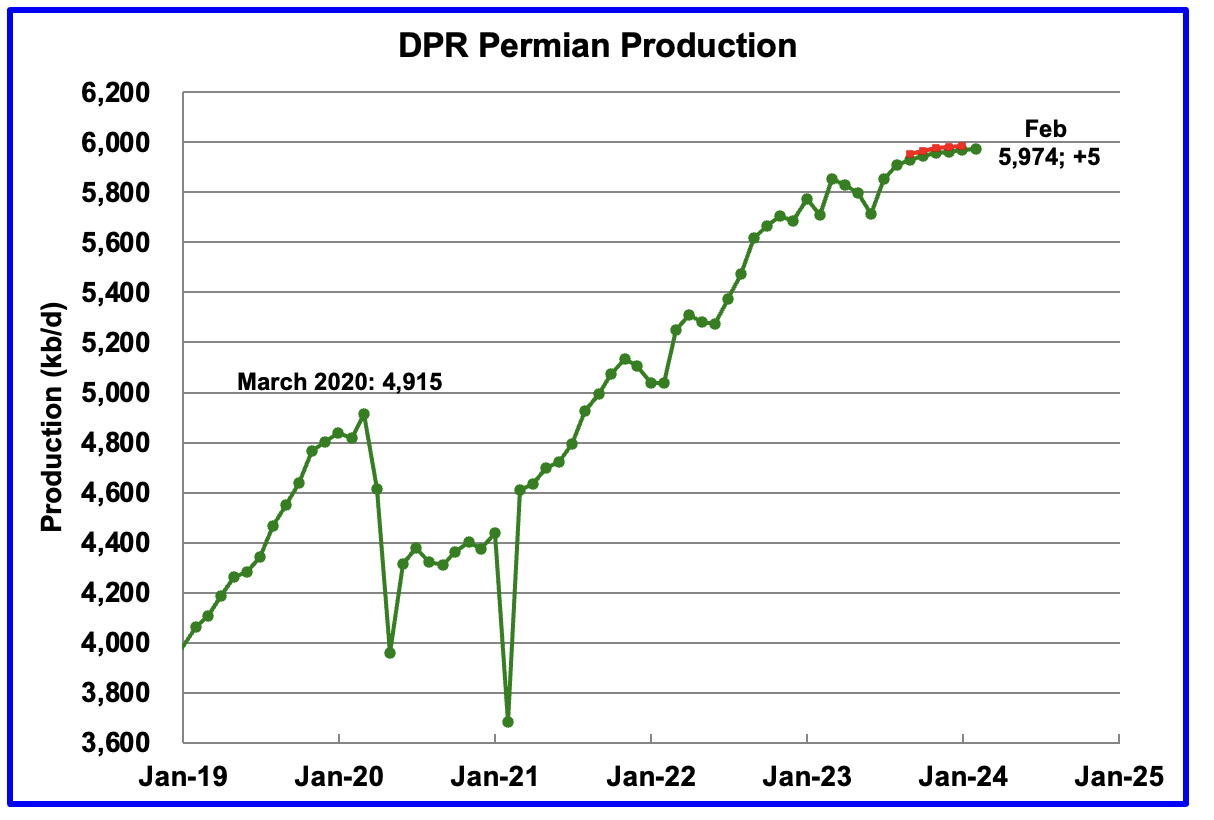
According to the EIA’s January DPR report, Permian output will continue its slow rise in February. It is expected to increase by 5 kb/d to 5,974 kb/d. The last five months of production data clearly show a dropping trend in monthly production growth.
The red markers show the DPR’s previous December forecast. For January, Permian production was lowered by 17 kb/d from 5,986 kb/d to 5,969 kb/d.

During December, 438 wells were drilled and 445 were completed in the Permian. (Note that December is the latest month for DUC information). The completed wells added 410 kb/d to December’s output for an average of 922 b/d/well. The overall decline was 403 kb/d which resulted in a net increase to Permian output in December of 6.5 kb/d. Of the 445 completed wells in December 438 were required to offset the decline. Those extra 7 completed wells producing at 922 b/d resulted in the 6.5 kb/d increase in December.
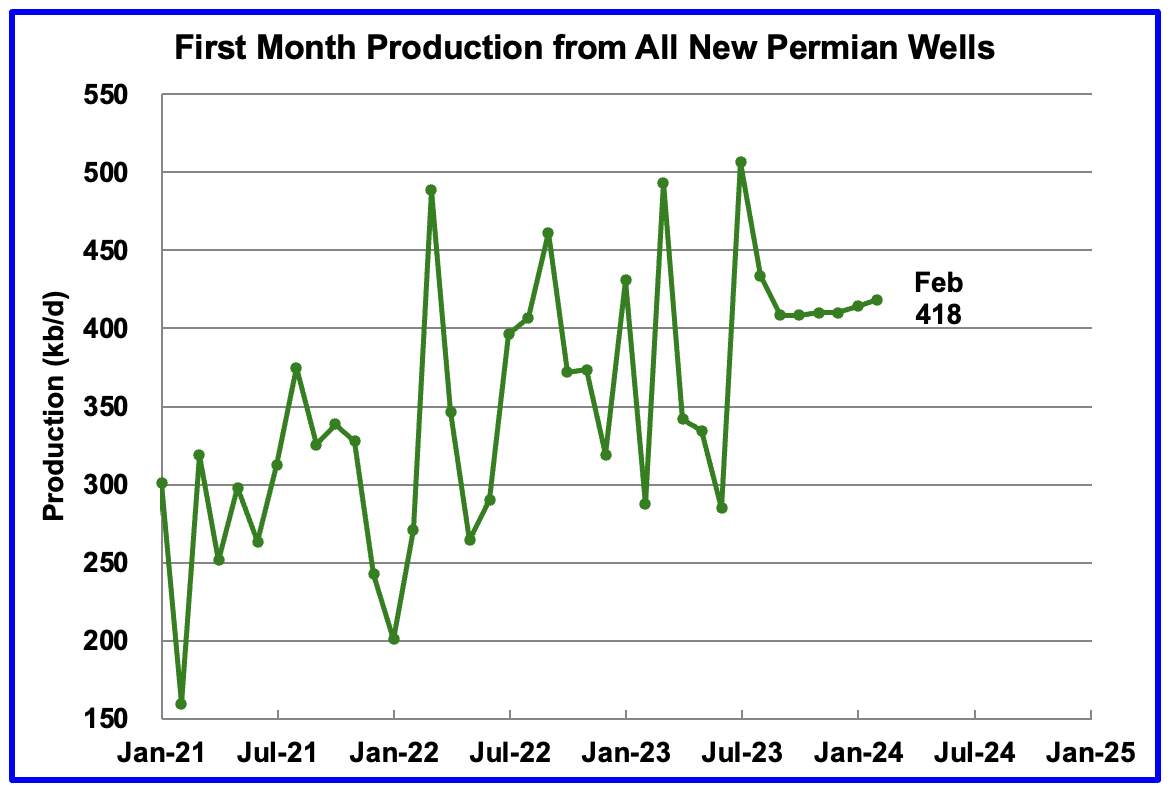
This chart shows the average first month total production from Permian wells tracked on a monthly basis. The total monthly production from the newest Permian wells in February is expected to be 418 kb/d, 4 kb/d higher than January.
Recall that this production of 418 kb/d is offset by a decline of 413 kb/d for a net overall output increase in the Permian basin of 5 kb/d, the smallest recent monthly increase. This all hints at slowing production growth in the Permian.
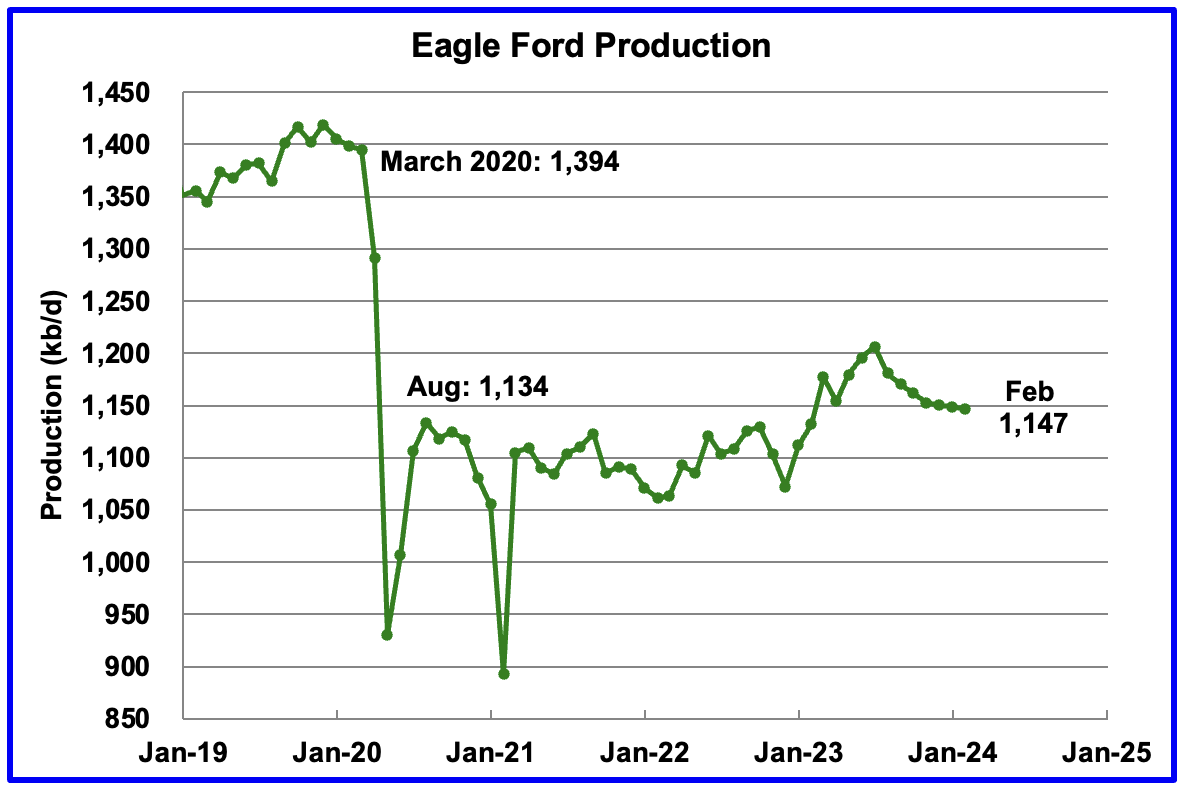
Output in the Eagle Ford basin has been in a downtrend since August. The DPR’s January’s forecast projects February output to decrease by 2 kb/d to 1,147 kb/d. The Eagle Ford’s output for January was not revised in the February report.
At the beginning of the year 2023, 68 rigs were operating in the Eagle Ford basin. The rig count began to drop in mid March 2023 to 60 and slowly dropped further to 47 in November 2023. Since late October 2023 the Eagle Ford rig count has been close to 48 ± 2 rigs.
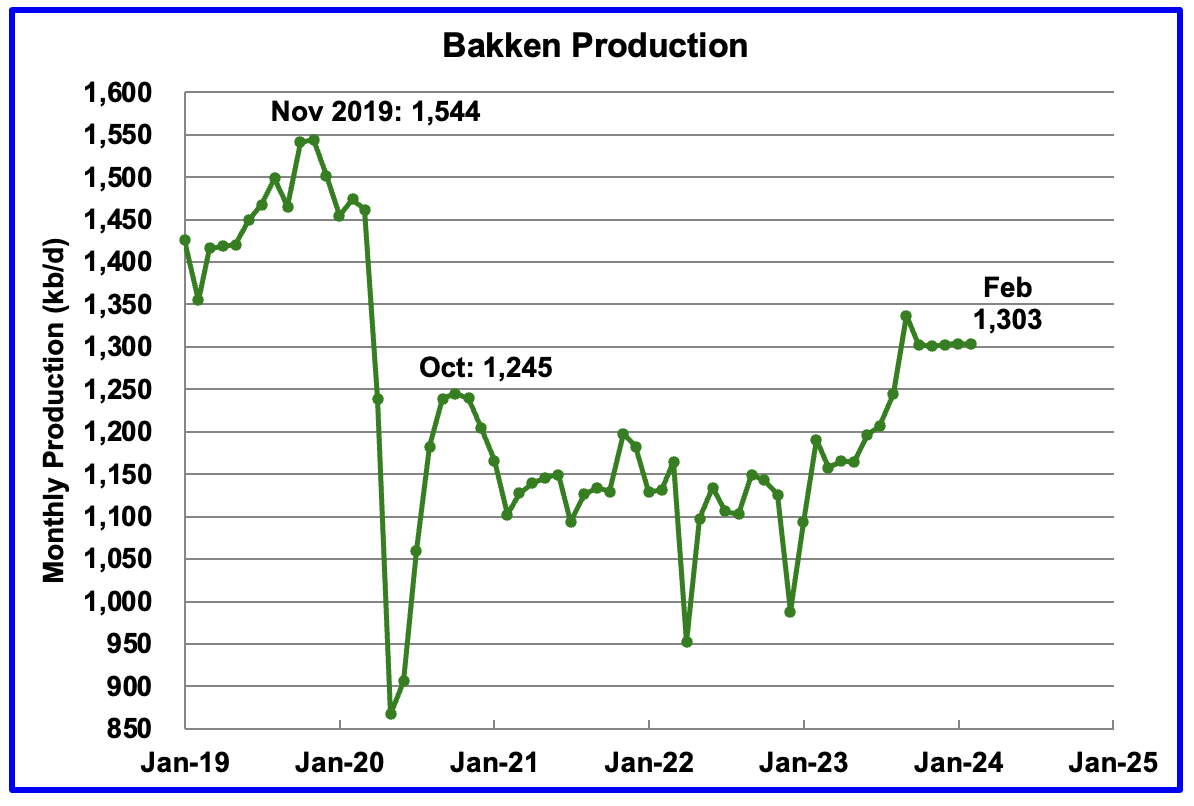
The DPR forecasts Bakken output in February will be 1,303 kb/d, 1 kb/d Lower than January. February 2024 production is now projected to be 58 kb/d higher than the post pandemic peak of 1,245 kb/d in October 2020.
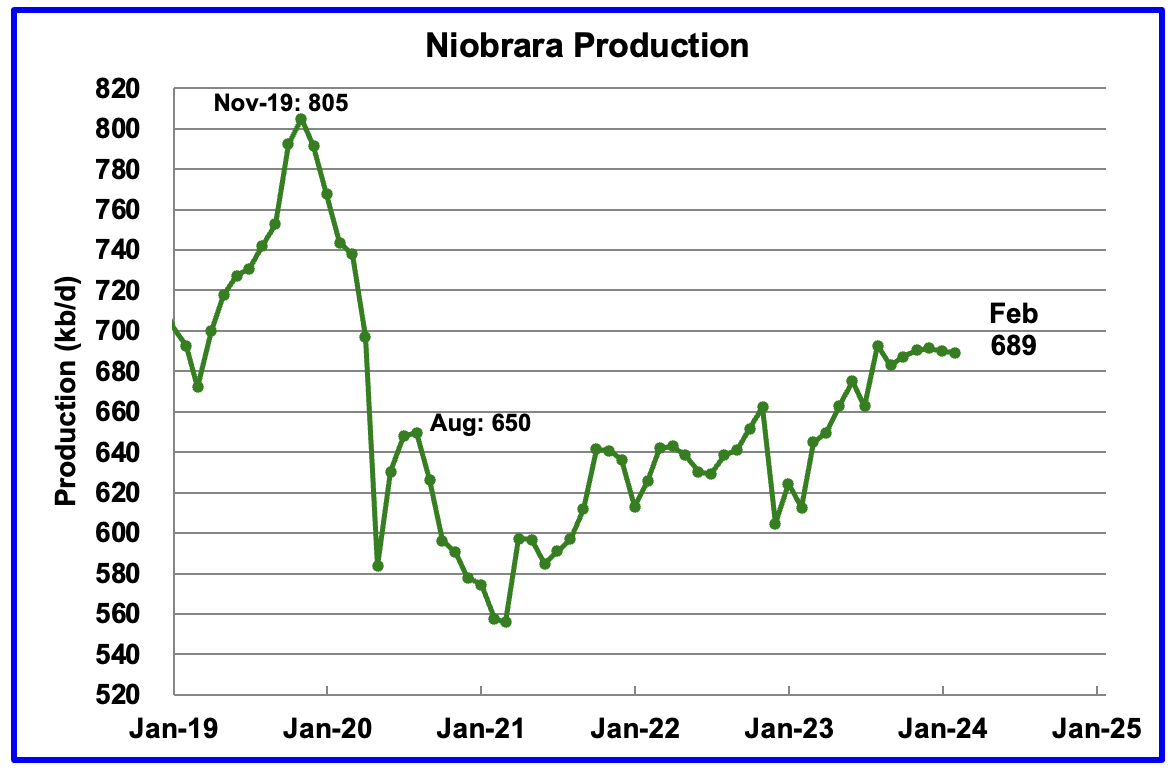
Output growth in the Niobrara continues to slow. February’s output decreased by 1 kb/d to 649 kb/d.
Production increased starting in January 2023 due to the addition of rigs into the basin but stabilized at 16 ± 1 rigs in March and April. However while from August to December, the rig count has held steady at 14, January has seen the rig count drop by 2 to 12. The drop in production has been slowed by the increased use of DUCs, 29 in December. See next section.
DUCs and Drilled Wells
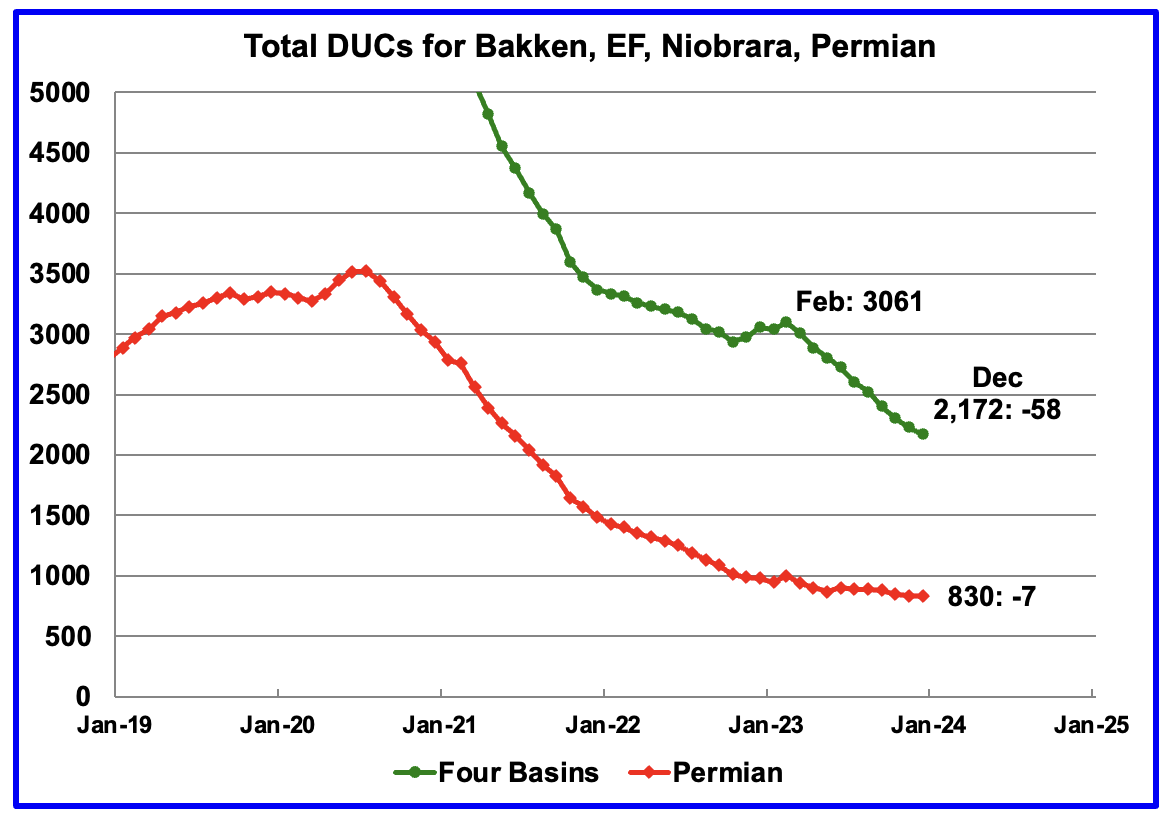
The number of DUCs available for completion in the Permian and the four major DPR oil basins has fallen every month since July 2020. December DUCs decreased by 58 to 2,172. The average DUC decline rate since March has been 89 DUCs/mth but appears to be slowing. Of the 58 DUC decrease in December, 29 came from the Niobrara. The average DUC decline rate over the past 6 months in the Niobrara has been 29 DUCs per month. Without this high completion rate, the production drop shown in the Niobrara chart would have been higher.
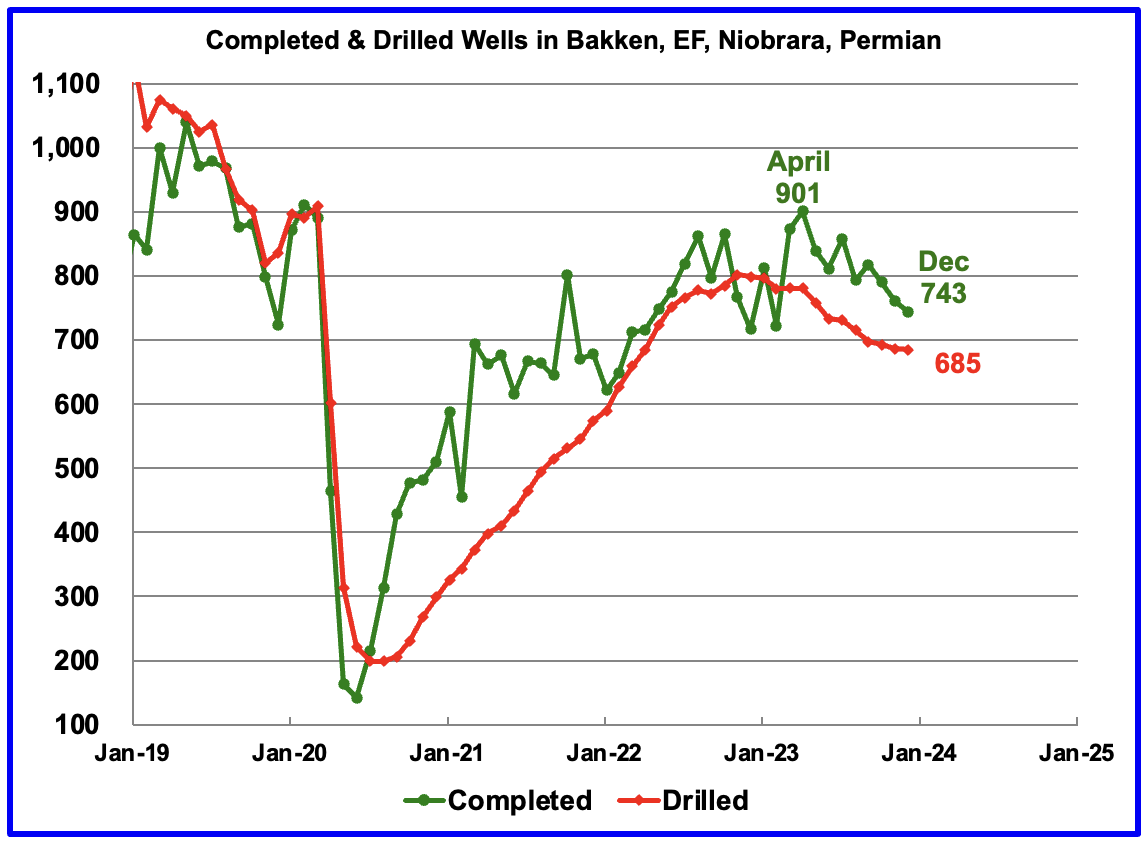
In these 4 basins, 743 wells were completed while 685 were drilled. Both drilled wells and completions are down from higher levels in early 2023.
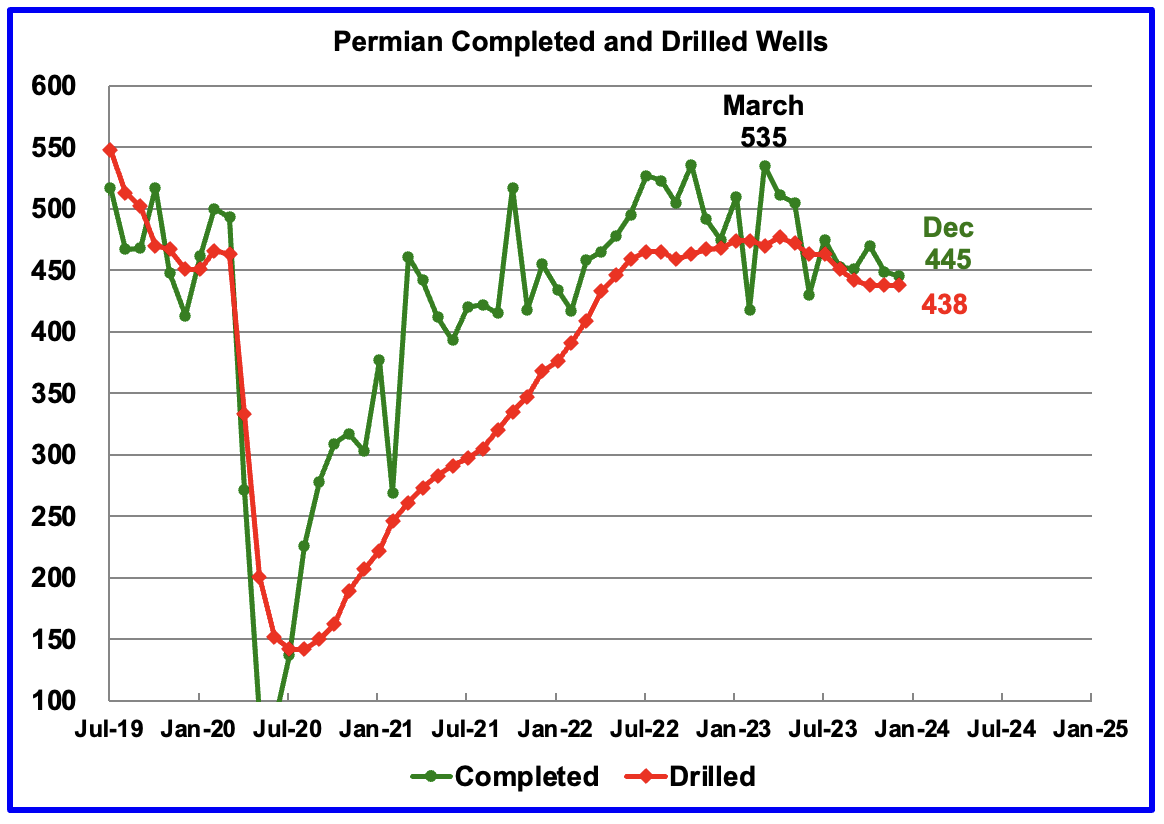
In the Permian, the monthly completion and drilling rates have been slowing since the March 2023 high of 535 rigs.
In December 2023, 445 wells were completed while 438 new wells were drilled. The gap between completed and drilled wells in the Permian is now very small compared to late 2022 and early 2023. Regardless, it is those extra completions that increase Permian production.
A discussion last month on this board overwhelmingly decided that a more realistic DUC count for the Permian would be closer to under 100. That being the case, the 830 being reported by the DPR, if correct, must include a significant number of dead DUCs that will never be completed. An indicator of true number of viable DUCs in the Permian may be gleaned from the recent monthly completion rate.
- August: 2
- September 9
- October 32
- November 11
- December 7
While October is showing 32 DUCs were used, the original post on October completions reported 11. The 32 appears to be an outlier and data revision is being used to accommodate the current data.
221 responses to “Another New High for US November Oil Production”
Good stuff, thanks Ovi.
Thanks Greenhub
Much appreciated.
I second that!
Peak Oil 20 years of wrong predictions.
http://www.energycrisis.com/campbell/
Quote “ Britain faces the prospect of closed filling stations” That was from 2006.
Obviously Campbell and many others were wrong, the knowledge they had was simply deficient. The price of oil in real terms is lower than it was in 2005, so Lynch was correct.
This year in the U.K. electric car sales is predicted to hit over 300,000 units. One new car in six will not use any petrol or diesel.
https://brokernews.co.uk/will-electric-car-sales-hit-the-22-zev-mandate-requirement-in-2024/
It is a bit sad that some people have invested so much time and emotional effort into something that may actually not matter.
Charles
Actually it does matter and has mattered. You make a good point that oil prices are lower than peaks in 2005-2008. And what happened in 2008? Have we forgotten? Then what happened in 2014? When QE ended what happened? Then 2020 COVID19 what happened? The US added two Saudi Arabia’s worth of oil and gas production in the last 15 years if the world was well supplied it would have crushed the market and tanked the price. But didn’t instead it got mopped up by the global industry and it still wasn’t enough to tame prices. So brilliant minds emptied the SPR. The biggest mistake that peak oil has made is to believe in traditional economics that scarcity will drive up prices. It simply doesn’t work that way. There is an upper boundary on energy prices that when met people disconnect. Mistaking price for supply is a fatal flaw. What you’re suggesting is demand destruction because of EVs.
Well here’s a reality check on the economics of EVs
https://www.reuters.com/business/autos-transportation/hertz-sell-about-20000-evs-us-fleet-2024-01-11/
But you’re going to get your chance to prove your theory this year as shale rolls over and people start protesting the unaffordable prices.
Sorry I forgot that’s already happening in France and Germany. I also forgot the diesel shortage in Russia last year.
What you’re discounting is the economy has tank globally that’s why demand is down not EVs . The economy has tanked because there isn’t enough surplus energy to maintain affordability. A good poster child is Germany who’s in the process of de industrialization. It’s already happened in the UK and it will start happening here.
Nailed it.
JT
The price of oil was higher for far longer in 2011,2012 and 2013 before US tight oil flooded the market and the global economy did very well.
Those who think oil price at $100 is expensive should think a lot about what you get from a barrel and how much is wasted moving around 6litre engines with one person inside.
Why do Americans use 20 barrels per year when Europeans use 8 or 9? This is just blatant wastefulness. Chinese use less than three barrels of oil a year.
Has the global economy tanked? A 2.6% growth is not tanking.
Personally I think global oil production will peak in 2028 and prices will start to rise a year or two before. How much really depends on EV sales and global oil decline rate.
https://www.ev-volumes.com/
I think peak oil will hit the poorer half of the world the hardest, but the richest quarter will not even notice.
Well summarized JT. As I often say, unless oil prices drop back to their pre-70’s oil crisis level, and stay there for years while the economy expands, then we know that ‘demand’ is being curtailed by the high (energy) cost of supply.
“some people have invested so much time and emotional effort into something that may actually not matter”
Unfortunately, it matters a hell of lot and will continue to do so indefinitely.
Its going to take a very long time for population to go into global decline mode, a long time for the global ICE light vehicle fleet to be primarily electric, a hell of a long time for cargo transport by land, sea and air to require less liquid fuel, a long time for industrial machinery in mining/construction/materials to wean off liquid fuels, etc.
In the meantime there is depletion, and if prices are low there will be large stranded fossil fuel deposits left in the ground. Add to that the significant chance of geopolitical disruptions to supply such as failed states (ex Libya), trade restrictions (ex Venezuela), and outright conflict (ex Houtis)….a fascinating book could be written on this subject, and the future updates of it will be wild.
You have all the ingredients lined up on the counter for huge petrol shortages in many parts of the world over the rest of the century, despite the new ability to replace some of the oil consumption with electrification of transport and commercial operations.
The race in on to learn to live with less liquid fuel, in fact it started decades ago and many people are still not even lined up at the starting gate.
Hickory
The more I read about aquifer depletion and overuse of rivers and land no longer able to produce food. I am sure that deaths rates will increase considerably before the decade is out.
A study done on the carrying capacity of the world determined that the 60 million people who die each year would have to double by 2030 in orders for the rest to have enough food. Like peak oil; peak water, peak soil and peak fish will mean fewer and fewer people will have enough.
Peak oil is the least of our problems.
https://www.theworldcounts.com/challenges/planet-earth/freshwater/deaths-from-dirty-water
https://siwi.org/latest/water-crisis-india-everything-need-know/
Charles
It so easy to look at the past and say “Campbell and many others were wrong, the knowledge they had was simply deficient”. No their knowledge of what happens to oil fields was not deficient.
What Campbell and other experts and no one else knew in the early 2000s was that the US was on the verge of creating an oil basin almost equivalent to Ghawar. Around 2005, US oil drillers and companies were experimenting with and transferring gas fracturing technology to oil fracturing in the shale oil fields in Texas.
In 2010, the IEA stated that peak conventional oil occurred in 2006. It is not clear if this statement was an indication that there was going to be another peak due to heavy oil from Canada and Venezuela or they had a clue that something incredible was about to change in US production.
In the attached chart, note how US decline slowed in 2007 and 2008 as US production hit its low at 5,000 kb/d in 2008 and then began to rise.
Imagine where the world would be today without those extra 7,000 kb/d to 8,000 kb/d that the US has added to world supply.
Yes there was reason to worry about Peakoil and am glad those specialists were there to warn everybody. Toyota bought into those Peakoil concerns and started working on EVs and that is why they were first with their Prius in 1997, laying the ground work for today’s EV technology and the transition to EVs.
Looking at the US chart, one must ask when will the downside of that sharp rise start, possibly two years from now? Then what.
I’d have more respect for being wrong, if they admitted it. And did retrospectives. Instead they hide from it. That shows me more of an advocate, than an analyst.
Anonymous
I am surprised that you are not aware that Campbell, Deffeyes and Simmons have all left this earth.
Have we reached peak peakers? Are they being depleted, faster than the discovery rate of new peakers? I keed, I keed. (Although not entirely–looking at the Peak Oil fad, it seems to have crested about 2010ish. TOD and ASPO shutting down c. 2013, shows something.)
But to be serious. Nothing stopped them from addressing their predictions prior to death. Except for Simmons-he died suddenly. The other two had a chance to see that they had been too peaker-ish. Yet did not write analytical post-mortems (pun not intended).
Also, of course, many other peakers are still alive. Yet instead of addressing past articles and what they got right/wrong and how they’ve changed going forward as a result…we just seem to get (a) radio silence or (b) can kicked down the road (like an apocalyptic Church that revises the date of the Rapture). A very few seem to revisit their past commentary. AND to revise their methods. I’d put Rapier and Coyne in that camp. But a lot of the rest don’t. Even a “light peaker” like James Hamilton (UCSD) never really revisited his “hundred dollars here to stay” article from 2014. Or the raft of peak oil by state analyses that he did in the early 2010s.
Anonymous, All that matters is the formulation of the depletion analysis. As with any other mature scientific discipline, the mathematical model is the starting point.
https://chat.openai.com/share/67814c20-7c42-40ec-a2e0-06ff1bf8b732
And all of them had time to learn, before their deaths, how and why they were wrong. Did they provide the rest of us with that information before their demise?
I am most interested in Colin, because he was predicting global peak in 1990 or so, and went on to do it again. And again, if memory serves. After multiple cycles of “oopsy” he must surely have mentioned somewhere along the line why he kept screwing the pooch and admitted that anything else he claimed be dismissed immediately upon publication? Rather than what actually happened, which is that the “gee aren’t you are a sucker” count of enthusiasts continued to grow.
Ovi
Most of the experts who predicted peak oil around 2005 worked in times when oil was $20 to $30 a barrel.
They badly underestimated the resources that $100 oil would release, many also believed that the global economy would be crippled by oil prices over $100. As it turns out the higher oil price did not affect the economy, this is because every barrel of oil used produces 20 times the gdp it costs to get out of the ground.
In the next few years we will see exactly what higher prices can do, including how much spare capacity OPEC has. We will also see if electric cars reduce demand globally or just in countries that use over 8 barrels per person. Will India consumption continue to increase to 5 or 6 barrels per person at that very low consumption rate India will need 20 million barrels per day.
How much oil will each of the additional 500 million people use in 2030.
I liked this graph from the other thread – it’s all about shale – and that stuff depletes like crazy.
rgds
WP
And that one is as of 2018.
What does one look like as of the end of 2023?
Alaska looks like it is close to done.
I remember reading on “The Oil Drum” they had to shut down their main pipeline if the flow rate got too low.
Whatever happened to that?
Andre The Giant
As best I can recall, I think they had to add another Heated Section along the line to prevent the oil from getting too viscous/thick as it cooled during the winter.
Laherrere data added:
Laherre has a habit of underestimating shale. Why would you believe one more “about to peak and drop massively” report from him?
Here he is in 2014, predicting ultimate recovery of 2.5B from the Bakken, with a 2014 peak.
http://aspofrance.viabloga.com/files/JL_Bakken2014.pdf
Bakken has massively outperformed Laherre’s prediction. His curves predict ND Bakken to be doing ~20,000 bopd as of NOV2023. It’s well over 1,200,000 instead! And note this was AFTER he knew about tight oil. So, he can’t claim it came out of nowhere like a meteor. This was just him being a peak oiler, using Hubbert linearization (blech!) and talking down shale.
Why should I believe Laherre now? Why has he not written an article to discuss why his method failed earlier and how he has adjusted to avoid similar mistakes. And not just resetting the “world is ending” tape by kicking the can to next year…but actually changing his method itself?
Bakken is really amazing in 2023, almost up 30% at 1.3Million BOPD!
This 30% can not be compared even by Permian! TX+NM could barely match the 300KBOPD increase!
This has to be explained by something — Drilling in the high TOC shales opened up new frontiers?
Many oil men were underestimating not the shale but the financials tricks that were produced to finance the Bonanza.
I think the curve is put there not to be believed but to provide an alternative story. Dennis Coyne’s production bulge is still a peak, and a story too.
They are both stories, I think the future will confirm and infirm which one was true in retrospective.
The Bakken is still down 13% from its all time high in late 2019. Still, a very impression gain in 2023 followed by a stall in production and a forecast that the stall continues.
the other side of this cliff will scream downward soon.
No on the tight oil cliff LTO. Too much human innovation, energy and creativity targeting some of the best petro rock on the planet in a reasonably friendly operational environment. No cliff, but more of a long, drifting wind down over 80 years… as my C-Ball predicts.
That Laherre data chart is unrealistic on the tight oil decline in my opinion.
I think even with zero new completions, that the Laherre tight cliff is unrealistic. Just taking existing production and looking at base decline. Yes, the newest generation drops the fastest. But older wells drop slower. And the new ones become old ones over time.
I suspect Laherre is in love with symmetrical Hubbert curves and doesn’t even really calculate a base decline, which is more of a long exponential/hyperbolic tail. No reason for it to mirror the build. Certainly that’s a main issue with his bad Bakken prediction.
When you see Laherre making basic errors like that, it’s one more reason to be very wary of him on world URR. It’s Dunning Kruger land. He doesn’t realize his limitations. In all likelihood, he’s making errors and in the pessimistic direction on other URR calculations. Like he’s done with tight oil.
Alternatively, it might matter. Just not in the way folks have been claiming in the modern era, beginning with Colin Campbell predicting global peak around 1990.
There are some topics that would get me kicked out of peak oil websites for just mentioning, in particular the 1979 global peak, and the idea that the world grew the economy for the following 15 years (about how long it took for the 1979 global peak to be knocked off by the next) and there was no zombie apocalypse or end times Rapture nonsense that was often speculated about back then.
And I do not view it as sad to have invested time in the topic, I could argue that knowing logically the faults and problems with the idea in real time (and while mentioning any of them got me banned from internet websites speculating on the right amount of gold, guns and ammo to collect), arguably they made my career into something substantially more than it would have been otherwise.
So no remorse on investing the time at all, and emotion has nothing to do with it. Just science that shit up and work the problem.
Unfortunately, the EIA is now doing Hedonic adjustments just like the U.S. Govt with inflation.
The U.S. didnt reach a new record in C & C production in NOV 2023, because its now adding ~700,000 bd of mostly NGLs and misc oil as a new supply called, Transfers To Crude Oil Supply.
So, unless we are now calling NGLs, oil, U.S. Crude & Condensate oil production plateaued in mid 2023
Steve
Uh, no. They are not. (Classic peak oiler cope mechanism…blame it on NGLs. Seen it so many times before. And usually from people that don’t even know the details of the EIA website.)
Steve
It is not clear to me that the EIA has changed their definition of C + C. In their weekly Petroleum report they created another box to try minimize the variation and size of their adjustment factor. They have just taken oil from one box and put it into another box. No new oil has been added.
Attached is the weekly production from September 29 to December 8. They are essentially flat and there is no 700 kb/d bump. The first weekly report that contained the new Transfer box was the November 17 report and it transferred 720 kb/d but production was constant. See second table.
A clip from the November 17/2023 Weekly Petroleum report
Ovi,
Tom Loughrey of FLOW brought the Transfers to Crude Oil Supply to my attention on Twitter. He gets the credit.
Regardless, the EIA explains the new adjustment here: https://www3.eia.gov/petroleum/supply/weekly/wpsr_notice_11132023.php
I was corresponding with Tom about this because all of a sudden in July, production started trending higher, significantly.
The EIA states in that update, that Transfers To Crude Oil Supply includes unfinishef oils and NGLs which are blended into the C&C supply.
Tom and I believe the majority of the Transfers To Crude Oil Supply are NGLs.
Again… the EIA make this quite clear. I am surprised you all here at the POB didnt know about it.
Steve
The transfers explains the crude input to refineries, shortfall. The crude production is off of the 914 and is just from 3 phase separators. Transfers doesn’t affect the production number. Just explains where the extra barrels going into refineries are from.
Mike Shellman also does a great post on the same subject matter of U.S. OIL ADJUSTMENTS.
THE UGLY TRUTH: https://www.oilystuff.com/single-post/the-ugly-truth?
steve
Steve, HFIR (the blogger that Mike reposted) is a noted permabull from Seeking Alpha. Every year he has said price would overperform and that US production would underperform. A few times, he’s been right. But overall for last decade or so, he’s been dramatically wrong.
Note also, that he heavily touted CRC, a very high leveraged, and thus high beta conventional California producer. It went bankrupt.
Everyone has bad calls and good calls. But HFIR is much more bad than good. Also, EIA has clarified how the adjustment factor works several times…and HFIR just refuses to learn.
Steve
As best as I can figure out, here it is straight from the horses mouth, the STEO. I hadn’t noticed but transfers have been added to the STEO back to 2022.
First off, let’s put things in perspective. NGPLs are typically in the 6,000 kb/d range. The current transfers are in 700 kb/d range and are about to drop into the 500 kb/d range, so expected to drop to less than 10% shortly.
In the attached chart, the data has been taken from the January STEO. Going back to April 2022, transfers were 419 kb/d and definitely increased C plus C. In November 2023, the transfers added 717 kb/d, so the increase in NG production is increasing US C plus C. However one could also argue that the EIA has just created a new box out of old data.
The breaks in the graphs start in January 2024 and reflect the STEO forecast.
I am sending the spreadsheet to Dennis to see if he can post the data somewhere in the cloud.
Ovi,
You can add any spreadsheet to peakoilbarrel.com as a media file and then post a link to the file in the comments.
Link to Ovi’s spreadsheet below
https://peakoilbarrel.com/wp-content/uploads/2024/02/Transfers.xlsx
Steve
Looks like you did not visit the OPEC post. Adjustments were discussed there and in some previous posts.
Ovi, of course EIA didn’t change their definition. This whole “must be counting NGLS” came out from the peakers in 2017 also…when US outperformed. And then it just crushed everyone in oblivion in 2018 and the NGL conspiracy theorists gave up and moved on.
I made a video about the change of API density, NGL or wet gas in the shale oil and fluid production.
https://youtu.be/2hxyNIhxmnQ
I compared Bakken with Permian as well as the Appalachian wet gas & condensate production.
Thanks for putting that up!
rgds
WP
1 of x:
Great information, and a lot of work. As always, Ovi.
Confession, I actually blank out a little after the 914 discussion. DPR and LTO reports interest me less. I do appreciate the rig/frack count, though.
Would love to have gas and API, and even NGL coverage, also. There’s stuff going on.
Anonymous
Thanks. Much appreciated. Read only what interests you.
With your extensive knowledge, could we have your thoughts on plunging rigs in Lea and Martin and rising production.
I haven’t looked, thought about it. Just haven’t zoomed in on those (arguably important!) counties. You’ve been tracking those much more than I have.
Also, I assume you were teasing me with some Scandinavian humor. In case you weren’t. I don’t have deep expertise or industry experience. I’m just another civilian riffraff commenter, consuming Internet content.
EDIT: OK, just looked at that part of the report. A few thoughts.
1. I think the overall trend is of Permian rigs dropping from the JUL to now. The difference between Midland and Martin is not significant, if you’re looking at last 6 months (not last few weeks.) Lea is also down a fair amount.
2. Eddy is the one that looks different, with rigs hanging in there, unlike the other three. Not sure why. Maybe it is more core of the core? Maybe actions of specific operator affecting things (XOM or even OXY are less price responsive than small independents. Elephants don’t dither.) I really don’t know…just brainstorming.
3. As far as the general rig reduction…wonder if that is just a WTI price response, mostly?
4. Production can still increase even while rigs drop. For one thing, there’s a 6 month or so delay to frack and put on line wells. For another thing, just because rigs dropped, doesn’t mean they dropped below maintenance level. Consider if 100 rigs are running in an area and 40 are needed to maintain. You can drop a lot of rigs before, you actually drop below maintenance. It can be pretty nonlinear, given high grading. Have seen this in the Bakken.
5. I would be a little wary of production county data trending using state data. TX (and to a lesser extent NM) are noteworthy for lags in production reports. So, you’ll tend to see spurious drops in most recent months, if you use the state’s county data.
I’m Italian.
Hmm. Ever been to Gaeta? I did a few weeks military time there. Loved it!
https://en.wikipedia.org/wiki/Gaeta
2 of x:
The US production is fascinating. But not that surprising. For anyone who has been following since 2012 (12 years ago!) Not surprised to see US up production in a $70 price regime.
It’s not going gang busters. But still. We added almost a million bopd last year. And are at a current record.
Outperformed the EIA and people that thought we’d grow. And definitely spanked those who said US would never get back to 13! (Something the “world is post peak” types should think about…)
That doesn’t mean there are not headwinds.
(1) Price is always a concern. And if SA opens the taps (and they got them…don’t kid yerself), they can crash price.
(2) Regulatory regime always gets worse. The country is moving to the left and has been since the 30s, really. Yes, there are oscillations, but that is the mega trend. Biden administratioon does not want high prices before the election. But their hearts are in crushing oil, not helping it. After 2024 victory (and I think they will win…Trump is an idiot), they will be more free to go hard core greenie. And sink their shanks into oil industry.
(3) It’s harder to grow after growth. Rystad had an excellent discussion of this. (The converse of this is ALSO TRUE…it’s easier to grow/maintain after a decline.) Basically, even with zero change in well profile or increase rate, the problem is that the amount of new production increases after growth. So your base decline hits worse.
(4) We are starting to run out of resource. Yes, I’m a cornie and saying it. Not running out as fast as the anti shale Berman types think. That’s why wrong so often over the years (they are biased). Still, looking at things that are down the middle, like Enno’s work, you see it. I DO still see growth in the Permian. But we are moving to a lower growth regime, at least.
(5) Weather. January is going to be brutal. In ND especially. But rest of US also. And the ND stuff…some goes off line and doesn’t come back until May. All that said…watch out peakers…don’t assume weather is a meta trend. You have fallen for that banana in the tail pipe several times before.
——-
All of those headwinds noted, I still think the STEO is too timid. Didn’t predict the growth to date. If prices stay constant, or even go with the strip (slight decline, not a crash), I expect us to hit 14s in 2024 (not even 2025). There’s just too much momentum in the system. Look forward to some strange 914 results with the weather a couple months from now. Then weather recovery. And 14+ by ~NOV2024 (reported end of JAN2025).
3 of X:
Ovi, Ohio was actually the tenth strongest state in the last 914. Very tentatively. And just for the last month. And very light oil. All that said, look at the latest 914. It passed LA.
No big issue and your choice on what to do. I remember you had KS at one time and cut it. Not sure if OH is sustainably in top 10. But…any way you cut it…it was top 10 last month. Look at the data!
Anonymous
Need to keep an eye on Ohio. Definitely going in the opposite direction than Louisiana.
Great chart. Thanks.
Hi Ovi,
Louisiana is green and Ohio is red maybe? I guess you could do top 11 perhaps, as they are so close.
Dennis
Easy to do. Getting tired today sorting out adjustments. Forgot to add legend. Time to quit.
Ovi thanks for all you do. I would be happy to post that spreadsheet when you have a chance to send it.
Dennis
Already sent. Forgot to include it in the first email.
Ovi,
Can you resend? I am not finding it in my email.
4 of x:
TX is massive. Bigger than Canada, Iran, Iraq, China. Well behind Russia, SA, or rest of US. But still…massive. It’s going to be fun watching them pass 6 MM bopd (price crash excluded) in 2024.
Paging Jim Hamilton! So much for ‘experts say it will never pass its old peak’. So much for ‘places tend not to pass old peaks’. (Something that was sometimes wrong even in 2012, when you said it. Look at Canada for instance.)
Go Tejas! (sauce)
5 of x:
I love NM. Another state that broke its records. (Paging UCSD professor Jim Hamilton! Time to redo your state by state paper!) It’s like UK or Norway…on its own!
Yeah…there’s headwinds. Only two counties. Democrats. Etc. Etc. Still…they keep on trucking. Still a very pretty girl in the Juarez lineup (you had to be there to understand).
Anonymous
Those dropping rigs counts in NM and Texas, will start to show up in 9 to 12 months as production peaks and declines.
The drillers must be seeing something that is making them leave Lea, Midland and Martin counties. Is it low pressure? What else can they see when they are finished drilling?
Ovi,
Perhaps they have decided to wait for higher oil and gas prices and asre simply biding their time. Also possible that they have become more efficient over time and can drill more wells with fewer rigs, I don’t think the EIA has the best data on this, Novilabs may be far better, though updates are not as frequent as they once were. Though we are lucky they provide so much information for free.
Thank you Enno Peters.
Dennis,
both are probably true.
Wells per rig per month have gone up substantially, not only because of improvements, but because they drill more wells per pad, which speeds things up. Cube development. Some pads are 15-20 wells.
Ovi,
If we assume 1.5 wells are drilled per rig we can use rig counts with a 6 month lag to estimate completion rates (the 1.5 wells per rig is based on historic spuds from Novilabs and rig counts from Baker Hughes for Permian Basin), this can be input int my Permian model for completion rate to estimate future Permian output, it assumes no change in DUC count.
Dennis
Oil price could be a factor in Texas since June 2023 was the low point for oil prices. However by mid August WTI prices were back over $80/b and NM’s rig count started to drop in mid August. See chart.
Adding in a delay time into your program is an interesting thought. However It would not answer the more pressing question of whether the Permian is close to peaking, say within a year from now as many believe, or three years from now that your model predicts.
I have asked Dr Google for his thoughts on information that is brought back from the drill bit. Interesting paper. Found this comment interesting.
“Drilling Dynamics. The aim of drilling-dynamics measurement is to make drilling the well more efficient and to minimize nonproductive time (NPT). Approximately 75% of all lost-time incidents of more than 6 hours are caused by drilling-mechanics failures.[3] Therefore, extensive effort is made to ensure that the drilling-mechanics information acquired is converted to a format usable by the driller and that usable data are provided to the rig floor.
The most frequently measured downhole drilling-mechanics parameters are downhole mud pressures (PWD), WOB (Weight on Bit), torque on bit, shock, temperature, and caliper. Formation testing while drilling (FTWD) provides key formation pressures for drilling optimization. The data provided by these measurements are intended to enable informed, timely decisions by the drilling staff and thereby improve drilling efficiency. The two main causes of NPT are hole problems (addressed by hydraulics measurement and wellbore-integrity measurement) and drillstring and tool failure (addressed by drillstring-integrity measurement).”
So there is lot of good info coming back to the drilling crew. I assume that with a lot of experience they can tell if the area being drilled is good or bad. It would be good to hear from Mike S, LTO or anyone else with drilling knowledge.
https://petrowiki.spe.org/PEH:Drilling-Data_Acquisition
Ovi,
The peak will depend on completion rates and the rate that new well productivity changes over time. Below is a guess I made in December 2018 shortly after the USGS released its Delaware Basin undiscovered TRR mean estimate of roughly 60 Gb in November 2018. I have filled in EIA data from late 2018 to 2023 that was not available when the estimate was made.
This was a case of an estimate that was too optimistic, but note that in December 2018 few knew about the upcoming Global pandemic and the disruption that would cause to the oil market.
Dennis
I think it is a damn good estimate considering that it was done in 2018.
When doing forecasts, the important thing to get right is the TREND, not the actual numbers. The trend in this chart is very good. It is climbing and starting to roll over in 2024. What could one ask for more from a 2018 projection.
Permian production at the beginning of 2024 is close to 5,900 kb/d. Your projection for beginning 2024 is 6,500 kb/d, a 10% error on the high side, many wish they could get that close.
Bottom line, this is an amazing projection.
“Bottom line, this is an amazing projection.”
Absolutely.
Ovi and Hickory,
When you create a lot of scenarios, some may be close to correct. This scenario was done just after I presented a poster at the AGU with Paul Pukite in December 2018. This was just after the USGS released its Delaware Basin assessment and I needed to re do the scenarios I presented in my poster as a result. Link below to abstract
https://agu.confex.com/agu/fm18/meetingapp.cgi/Paper/446221
e poster at link below
https://agu.confex.com/agu/fm18/mediafile/Handout/Paper446221/permian%20basin%20tight%20oil.pdf
A more recent set of scenarios below, the medium scenario is my best guess, the low scenario has falling completion rates starting in July 2024, the medium scenario has completion rate remaining about the same as the June 2024 level which is based on rig counts in December 2023 with completion rate assumed to reflect drilling rates 6 months earlier, after June 2024 it is just a guess. The high scenario assumes completioj rate gradually rises to 550 wells per month by 2028 and remains at that level until 2036 than rapidly falls. All 3 scenarios assume new well productivity falls after Dec 2022, with the annual rate of decrease at about 4% in 2023 and falling more at higher completion rates and less at lower completion rates.
The main difference seems to be the amount. That’s what interests me and wish you would discuss it more. The exact shape/time of curve seems kind of not so important, nor do I think you can predict it, really.
Also, the last two curves are very similar, not worth the third scenario.
Lastly, it’s interesting to me how you always assume worse productivity after a time…I remember you doing that 10 years ago…didn’t work out how you planned…was too negative.
Anonymous,
Yes I was wrong on productivity decreasing in 2012, I have been very transparent about that, recently new well productivity has been decreasing, over the 2021 to 2023 period in particular and especially when we normalize for lateral length. The 4% annual decline is an assumption based on well productivity decline from 2021 to 2022. I assume constant lateral length at average 2022 levels in my model. There is a given volume of prospective rock in productive formations, increased lateral length increases the volume of prospective rock used per well.
I agree predicting the exact path of the future output curve is difficult (impossible in fact)..
The difference in URR between the low and high scenarios is due to fewer wells being completed in the low scenario (101k total wells completed) vs the high scenario (133.6k total wells completed). Note that higher completion rates in the high scenario results in more well productivity decline. The low scenario assumes oil and natural gas prices fall due to lack of demand where the high scenario assumes prices are high due to robust demand for oil and natural gas. The medium scenario assumes oil and natural gas prices remain roughly where they are today until 2035 and then demand starts to fall leading to gradually falling oil and natural gas prices which leads to fewer prospective resources being profitable to develop.
Chart for normalized well productivity for Permian Basin average well 2015 to 2022.
From 2019 to 2022 the average annual rate of decrease in average Permian basin normalized well productivity was about 4%.
1. If you have an area-based model, normalizing by lateral length makes sense. Yes, you chew up more rock. At a second order, there is probably some beneficial financial impact of the longer laterals, making more marginal rock economic (thus a higher total resource). I’ve made this point with Enno, before. Again…I’m not against normalizing. Actually think it’s first order the right thing to do.
2. But regardless, doesn’t your model just have a total resource (area under the curve) which is assumed? So, your assumptions on well productivity are just going to tweak the speed of drawing down the tank (I guess extending it), not really affecting total resource.
3. If your model is just number of completions, times production, I’d think you’d want to keep it un-normalized. So maybe you really should assume they draw the tank down a little quicker.
Anonymous,
The well profile changes yearly based on the data, so for any given year output is well profile convolved with completions. The URR is based on TRR and economics,( prices, costs, etc). I start with mean TRR estimate from USGS, but if we look at the details, about 25 Gb of the resource is very low productivity rock that is unlikely to ever be developed.
So the 50 Gb estimate takes this into account. The better benches of the USGS estimate are the ones I focus on. Perhaps if oil prices are $200/bo or more in 2024$ some of the 25 Gb of low productivity rock will be viable, but I remain skeptical.
6 of X:
ND is interesting. Headwinds from weather/remoteness/takeaway. And the flaring restrictions. And the maturity of the play.
All that said, it’s a very rich are. The middle Bakken has some thin bed conventional properties. And there’s several prospective areas in the Three Forks.
Bakken has been written off several times before by Berman and the like. And they were wrong.
My take is a miserable winter…but then recovery going well into summer. And finish the year up slightly year over year. (Price caveat of course.)
they are drilling the high TOC shale, i.e. lower Bakken and even upper Bakken
Results seem to be good — this broke the previous paradigm that shale oil can not be produced from high TOC shale.
The mainstream give 3 death penalties to high TOC shale:
1. they have oil but adsorbed or dissolved in TOC kerogens, and can not be produced
2. they have zero porosity, conventional porosity reading all give close to zero readings
3. they have low maturity, using unreliable but dominating benchmark Tmax, most high TOC shale reads immature so no oil has been generated yet.
There is also a lot of re-fracking activity in the Bakken.
7 of x:
CO is interesting. Definitely headwinds with maturity and regulation environment. So fascinating to see it up slightly. Really don’t follow it that much, so not sure if a blip or what.
Do you know of any article or reports discussing this?
8 of X:
AK definitely in decline, but starting to depart from the peaker band. Would do even better if the Feds would let people drill and explore more.
9 of 9:
No comments OK and Cali.
Interesting to see WY bumping up like that.
UT also fascinating with its relatively high level lately (despite headwinds from Fed land controls and wax shipping issues).
LA is boring. (one more reason to cover OH.)
No comments FGOM.
Sheng, regarding your video:
https://youtu.be/2hxyNIhxmnQ
It’s interesting, but:
1. I don’t think there’s any reason to connect refinery run API to crude production in TX. They are pretty different industries, well separated by geography. And there’s a lot of import/export.
2. The seasonal variation in NGLs has to do with the vapor pressure at different temperatures at the surface (three phase separator). In the summer, it’s hotter, pentanes plus have a higher vapor pressure, and thus more progress into the wet gas stream (and get sorted out at the gas processing plant). In winter, less of that happens. While it is possible that’s related to what happens over time in a black oil reservoir, it seems pretty different. You’ve got a variation more of pressure than temp in the reservoir and over longer times, not seasonal. And you have a changing composition downhole. So, all in all, you really need to prove they are the same thing. Otherwise, it almost looks as if you are confusing the two different phenomena.
3. The one part of your discussion I liked most was making the point that Midland oil is close to 40. So any progressive change to lower the API will look like a lot of shift to 30s versus 40s. In Bakken, we’d see less since the starting API was 42.
4. However, I don’t see why we only saw phenomena (3) last year. We been doing shale for a long time now. Why this year?
5. Also, even if (3) is occurring, I don’t see how you can say the average API is getting lighter. It may not be shifting dramatically (was at a knife edge before), but it is going down in API.
Anonymous,
Thanks for the detailed comments and advices!
here are my comments to your points:
#1. ” refinery run API to crude production in TX” — I am also kinda puzzled by this, I am using this link here to do the 5 fluids crude production API in TX,
https://www.eia.gov/dnav/pet/pet_crd_api_adc_mbblpd_m.htm
not this here that relates to refinery input, which I used for “Average API” in TX,
https://www.eia.gov/dnav/pet/pet_pnp_crq_dcu_nus_m.htm
but, when I looked into North Dakota “Average API” in PADD2,it is indeed dominated by imports from Canada, see:
https://www.eia.gov/todayinenergy/detail.php?id=4890
my thoughts are:
the PADD2 is the major import source, and PADD3 (TX) is dominated by TX shale oil. There is 0.1API increase, which certainly can not explain if 900K BOPD lower shift 10 API or even 5API, so this is in bulk consistent with the 5-fluids’ classic API change, Black Oil API down, but Volatile and Condensate API up. My guess is that there are lots of much lighter crude exported from PADD3, so they are not shown in this refinery input API average. If counted, the average will be even more obviously lighter.
#2. Yes, you are right — I am trying to explain the annual oscillation is wellhead T driven, and the last 3-year up trend is reservoir P driven.
#3. thanks, but I also want emphasize the “900K BOPD shift in past 3 years” size, which is huge, and this small shift consistent with GOR shootup in the past 3 years.
#4. but I am confused by “I don’t see why we only saw phenomena (3) last year. We been doing shale for a long time now. Why this year?” — this year the API30 in TX is surpassing API 40 in TX, but it has been on the up trend, especially the past 3 years, which is consistent with GOR shootup in the past 3 years.
#5. I believe overall it is getting much lighter than “0.1API lighter” I shown here for TX refinery input as I explained above in #1. But the BO part is getting a little heavier, and this caused a big confusion in EIA news report making outsiders believe US shale oil is getting obviously heavier, while others like Mike believe it is a clickbait or EIA inaccurate account.
great work, OVI!
I have a question here if the trend is peak already reached, and rigs going down in Permian, why news reads that the top producers, Chevron and Exxon are both planning to increase production?
Sheng WU
Thanks.
That same question popped into my mind when I read the XOM and CVX comments. Attached is an article that provides some clues. I think most of the growth is through acquisitions. The other point to note is that they have a plan. Plans don’t always work out.
“Darren Woods, Exxon’s chairman and CEO, said the company is planning to grow Permian volumes up to about 650,000 boe/d during 2024.”
“Chevron’s Chairman and CEO Mike Wirth said the company is starting the year in the Permian with 12 rigs and three frac crews.
“Looking to the year ahead, our program is back-end loaded as we plan to continue to build our DUC inventory before adding an additional completion crew in the second half of the year,” Wirth said during Chevron’s Feb. 2 earnings call.
Chevron plans to exit 2024 with its Permian production at an average 900,000 boe/d; The company still aims to achieve Permian production of 1 MMboe/d in 2025.”
Here are four different perspectives.
– The first chart in the post (STEO) says US production will grow by close to 350 kb/d by end 2025.
– OPEC says LTO production will rise by 400 kb/d each year over the next two years. 2023: 8.3 Mb/d. 2025: 9.1 Mb/d. Most from the Permian.
– XOM and CVX are both aiming for continued production increase.
– Many of us on POB think LTO will peak in about a year from now.
Room for a lot of good discussion and entertainment.
https://finance.yahoo.com/news/exxon-chevron-tapping-permian-output-131200022.html#:~:text=Exxon aims to organically boost,Resources—another top Permian producer.&text=After closing the Pioneer deal,to about 1.3 MMboe/d.
Ovi,
Good points. One thing I would add: when they say increase in boe, we have to keep in mind that with rising GORs and rising light NGLs the boe will keep going up even if oil stays flat…
Ovi and Dennis,
Not sure if you’re familiar with the work of Dr. Dean Fantazzini: Ovi’s fellow Italian and fellow Texas RRC modeler.
https://sites.google.com/site/deanfantazzini/nowcasting-texas-rrc-oil-and-gas-data-ongoing-project?authuser=0
Dr. Fantazzini has developed a simple, but in my view robust, methodology, where he has derived correction factors for T to T-24 months, from averaging correction data.
I am lifting here from Dr. Fantozzini his latest correction model, which he just posted on Twitter.
What you can see here is that:
1. in 2022 EIA was underestimating TX production, something that Dennis also noted, and that underestimation is now pretty much fixed, as RRC data will likely not change much.
2. In the past 6 months or so, EIA is overestimating TX production, based on Fantazzini’s correction, something that Ovi’s model also showed.
Coincidentally, this switch from underestimation to overestimation coincides with the switch of the Adjustment Factor from positive to negative, giving credence to the idea that the Adjustment reflects mostly a Production error.
So we have now several angles that are suggesting that the PSM is currently slightly overestimating production, after underestimating it before. You have the, let’s call it, the Italian RRC Correction Mafia (Dr. Fantazzini and Ovi). Then you have that HFIR online personality, who has his own proprietary production estimates and claims that they track Production+Adjustment much better than Production alone. Then you have the Enverus/EIA data that got published on Friday, showing that production has been going down since September in the shale basins that they track (https://www.eia.gov/energyexplained/oil-and-petroleum-products/images/u.s.tight_oil_production.jpg)
So taken altogether, I am getting sold on the notion that the PSM numbers are a bit inflated….
Kdimitrov
Thanks for the link. When I first came up with the idea of trying to correct the monthly data from Tx and NM about five months back and shared it with Dennis, he indicated that it sounded similar to the methodology Dr. Fantozzini used.
In reading the link you provided. The basic idea is the same. Here are the a few of the small differences. I use the difference for the last three years of data. I agree those first months are small corrections. However for November the onshore Texas data for 2021 was lower than October and it had a massive impact on the results. See first chart in Permian Basin section. I think there was something wrong with the Tx data and just noted “The big November drop is due to a larger than typical monthly production drop in the RRC data.”
The other issue is whether to average the monthly increments or just use the last two months of data. I don’t have enough data at this point to make a decision. Currently I am just using the last two months of data. However I would note that it is more difficult to pick up a new trend by using longer averages. I prefer three and six month averages.
Check the NM chart. See how well it matched.
Fantazzini has been doing this for a long time. It might have had utility prior to the 914, but doesn’t have much now. If you look at EIA 914, it has a very strong match to eventual state data. Dennis has posted it several times. Dr. Fanta has nothing like that to show for his own work, to show it is better.
Also, Fanta even massively hedges his bets by using different scenarios with different lag amounts…such that very different amounts are predicted. Which doesn’t show much confidence in his own method.
The Fanta stuff used to get posted here, but eventually stopped. I guess he’s still carrying on out of inertia. But I really fail to see the point, when EIA is doing direct bottoms up surveying of 90% of production.
Also, I can remember times when he was wrong in the past and looked (unsuccessfully) for excuses. Like the massive increases of late 2017…that had skeptics looking for NGL excuses (see I said, we’ve heard that song before). And guess what…when all the final data came out, the massive growth of late 2017 was correct. And got even more massive in 2018. And eventually the “EIA must be cheating” crowd gave up and accepted what was going on.
The collateral issue at the small and mid sized banks hasn’t been fixed. With the end of the FED’s BTFP all the collateral issues come back front and center.
These small and mid sized banks do not have the collateral to borrow from primary credit or the discount window as it was once called. Nor can they afford the >4% interest rate on these loans to keep them solvent.
And if they had the collateral they would just borrow the funds to remain liquid from REPO instead of using primary credit.
I should also add that just because interest rates go back to zero doesn’t fix the commercial real estate in places like San Francisco or Atlanta where the vacancy is something like 30%. Lower interest rates aren’t going to fix this.
Banking crisis likely comes back with a vengeance in 2024.
I won’t be surprised at all to see WTI in the $50-$60 range by mid year.
https://www.msn.com/en-gb/news/world/oil-refinery-in-southern-russia-ablaze-news-agencies-quote-officials/ar-BB1he1Kb
one of Russia’s largest oil refineries hit by Ukranian drones.
Dethreading for WHUK:
As a scientist, it’s important to adjust based on results. And I’m not even saying to throw everything out, either. I understand the (sometimes correct) appeal of retaining a model, even when outliers argue against it, or a pesky test goes the wrong way. Still, one ought to at least address these contrary data points and at least consider adjusting. If you were looking at (I donno, physics of complex materials), I would say the same thing. You can’t be so wedded to a particular model, that you don’t consider revising it when results don’t follow plan. And…oil exploration and development is a WAY more complex system with way more unknowns than temp-resistivity plots of complex materials. Full of messy economics, technology development, exploration, regulation, etc.
For one thing, with Dennis, it’s easy to look at his articles from ten years ago and see how much they underperformed. Maybe he’ll cite EIA also (although I think he’s been more negative than them…basing his work on USGS bottoms up quantities and Laherre amounts). But in any case, even if “the other guy was wrong”, he still needs to address why his model failed. And at a time, when shale was very much already on the scene. Not like an asteroid landing or something.
At the end of the day, I really think the Dennis Coyne stuff is a bunch of spaghetti traces where what really matters is his reservoir amount estimate. It’s basically Hubbert style work, but with some fancy model (probably too fancy and a false analogy from physics to economics) on how that resource gets exhausted over time. But I really respect Hubbert more than Coyne, since Hubbert makes the point that what really matters is the area under the curve. That you could have many different development scenarios…shark fin or gaussian or even multiple peaks…but area under the curve is constrained. With that in mind, what really matters is not the specific spaghetti, but the resource estimate. If you used some too conservative Laherre or USGS or Hubbert number, you’ll end up with egg on face when we find more, when we figure out how to move more marginal rock to productive rock (and the mining industry has a LONG history of doing this…look at copper mining). But in any case what really matters is the resource estimate. That should be 80% of the discussion…not the spaghetti and the fancy physics words.
I have to admit to not following all the mathematics and physics justification of the shock model. I do have a slight BS-smelling concern based on hearing a bunch of fancy words from physics, being used to judge the evolution of production in what is really an economic/engineering area. I sometimes see people toss around fancy words physics stuff in technical stock analysis (which is pseudoscience). But again, it’s just a sniff…and I haven’t bothered following down the rabbit hole of pulling out my thermal physics textbooks.
https://www.physicsforums.com/threads/discover-the-top-graduate-textbook-for-thermal-physics-studies.293234/
I mean just because individual wells have some transport processes going on (and pretty complicated ones, with different rock, phases changing, shifts when putting the rod pump on, etc.) is no reason that the overall progress of development should be modeled on some fancy word transport equation. I mean baseball involves Newtonian scale kinematics…but if someone came up with predictive equations for mass phenomena (at the season performance level) in baseball, it would similarly not make sense. The ballistics don’t apply to mass statistical phenomena, they apply to predicting what path a ball takes.
P.s. “Mature scientific discipline” for oil production prediction? You really ought to look at physical scientific areas that are much more mature, for comparison. Production prediction is night and day from “mature”. Much more like economic forecasting.
Gotta admit, I never saw shale production reaching this level, and I assume it will continue to surprise.
At some point in the future, it will quit growing, and then start dropping.
But it has literally saved our bacon. I have kids, nieces and nephews and I sincerely hope shale holds up long enough to get us to the energy transition where we just don’t need as much oil.
Listened to Mike Wirth on Bloomberg this evening and he kept hitting on the term discipline when discussing upstream industry CAPEX. Music to my ears.
Awful lot of undrilled territory offshore and in Africa, etc. Is there anything there? So very hard to put an ultimate recovery number out there. Plus technology, ultimate is a long time. Now we say 3000 gigabarrels. But in 50 years, that is possibly ultimate too. 50 years and $500 per barrel. What do we find? What do we recover? I think about the peace river area. Baytex and Obsidian are recovering cold flow heavy oil…..they are getting 6% of OOIP.
IN 50 years is that remaining 94% still going to be there? Or will some form of thermal or solvent recovery get 50%? Ultimate is a verylong time.
C185
$500.00 oil isn’t possible because it’s unaffordable. Unless of course minimum wage goes to $150.00 per hour.
To illustrate dewatering coal mines in the UK in the 1800s was done with coal fired steam powered pumps. Essentially the energy was free in that it never left the mine and entered the coal market so it was not a cost on the mines balance sheet. However eventually all those Victorian mines were shut in because the coal energy required to run the steam pumps exceeded the market value of the surplus energy harvested at the mine and could no longer cover cost of labor which was essentially food for the miners even with a company store. The system was shut in. Not because there was no coal, there remains as much in the UK today’s ever harvested it just is no longer ore quality. Which means there is no way to mine for it from an energy perspective. And remember that includes feeding the miners.
Oil is no different only vastly more complex and much larger. However it will suffer the same effects of depletion as any mining industry has. Only quicker because of its function as the master energy source unlocks heavily depleted mineral mines and agricultural mines (ie farms) that will not be operational without oil powered equipment. That’s why we’re already seeing shortages protests bankruptcies migration and a host of other problems. Today’s $80.00 is the new $500.00 it doesn’t work.
So when we talk of $500.00 oil are we also accepting $30.00 milk? $30.00 eggs $500,000.00 -$1,000,000 cars? $150.00 minimum wage? Could that happen? That’s hyperinflation it has happened but does it keep the lights on?
Why?
JT. If your observation that higher priced oil will be left in the ground due to lack of affordability is indeed true, consider that this is reflection of the basic principle of population overshoot. Collectively, the population of the world has far overgrown what it can afford on a long time frame basis (sustained economic performance) in the absence of limited or one-time extraordinary inputs such as- affordable fossil, mechanization of labor, industrialization, debt based financing, globalization of supply chains, for example.
Can we downsize population and economic expectations in a deliberate gradual manner?
I see no recipe for that, no matter what the political or economic system.
50 years….50 years ago, 1973, crude oil was $3, on its way to todays $70. Is $500 in 50 years such a stretch? 50 years ago no one saw the wolfcamp as produceable. Certainly even Hubbert did not forsee shales producing oil. So in 50 years there will be nonew technology? Just project your curves.
From Anonymous. “For one thing, with Dennis, it’s easy to look at his articles from ten years ago and see how much they underperformed.”
Dennis and others are the first to say their models will be wrong. The models from this year are a lot different from ten years ago. Data changes, and I assume most people visiting this site are here to keep up with the data and how it changes. The models are interesting, but they change as the data changes. As it should be.
But if you go back ten years, you’ll see the many of the same cornucopian ideas, and many of the same catastrophist ideas. They don’t seem to change all that much. It’s kind of tedious when people repeat their own pet catastrophe forecast in 17 posts throughout the day, and seem irate that others aren’t jumping onto their bandwagon.
Anonymous
“I don’t have deep expertise or industry experience. I’m just another civilian riffraff commenter, consuming Internet content.
The seasonal variation in NGLs has to do with the vapor pressure at different temperatures at the surface (three phase separator). In the summer, it’s hotter, pentanes plus have a higher vapor pressure, and thus more progress into the wet gas stream (and get sorted out at the gas processing plant). In winter, less of that happens. While it is possible that’s related to what happens over time in a black oil reservoir, it seems pretty different. You’ve got a variation more of pressure than temp in the reservoir and over longer times, not seasonal. And you have a changing composition downhole. So, all in all, you really need to prove they are the same thing. Otherwise, it almost looks as if you are confusing the two”
Really. So basically your are another internet expert – a Dr Google.
You might like to do a little homework on the above ground equipment, especially the GOSP and the gas plant stabiliser. I do not agree that there is a significant seasonal effect based on ambient temperature; the Bakken might be a little different but it si. ore to do with the plant operation. The fluids are de-pressurised in stages which naturally cools the the well fluids due to the gas expansion, and heat is frequently supplied to ensure complete stabilisation of the crude. ( I worked on a GOSP) with hot water warming of the crude. At the gas plant there will be one or more stabiliser columns which effectively fractionate the wet gas under a modest pressure. Heat is required to run the reflux and the bottom draw off – full range condensate will be produced to a set RVP, around 9psi, which is about the RVP of gasoline, along with a Y grade NGL mic . This is to prevent excessive outgassing of the more volatile components in the produced condensate.
I think some of the variation might be down to the way condensate is marketed. It can , and is , often blended back into the crude, because the crude will have a higher value in some regions, or the logistics make it more favourable.This has a minor impact of the API of the crude. It is also possible to blend in some n-butane under certain conditions. Likewise the NGL natural gasoline can be back blended into the crude, or into the refinery pool, or sold as bitumen diluent. As ever it is all down to the best return and the last cent on the barrel.
https://library.e.abb.com/public/728e154e6d97da78c1257b1a005b1769/Oil%20and%20gas%20production%20handbook%20ed1x7a_o.pdf
1. It’s always more desirable to capture liquids at the pad, not the cryo plant.
See this source, if you want something from a supplier (but it’s basic chemical physics):
https://pacs.ou.edu/Portals/1399/Assets/Documents/Programs/LRGCC/Resources Documents/3_oil_and_gas_separation_design_manual_by_c_richard_sivalls.pdf
“Generally speaking, an increase in operating pressure or decrease in operating temperature will increase the liquid recovered in a separator.”
2. Yes, of course butane gets blended into motor gasoline in the summer (and more pentanes plus also). But that’s just disposition. Reflects the seasonality of motor gasoline. but that blending doesn’t affect the production accounting from the gas plant. That’s just disposition. Happens after it leaves the plant.
Anon
Really
“Yes, of course butane gets blended into motor gasoline in the summer (and more pentanes plus also). But that’s just disposition. Reflects the seasonality of motor gasoline”
n- butanes and (iso)pentanes are typically increased during the winter to raise the VP to aid starting, especially in winter climates.
In summer the VP is often lowered ( dependent on location) to avoid fugitive losses. i.e there is a summer and winter gasoline spec. You have it the wrong way around.
Once again you demonstrate your limited practical knowledge of the subject matter. Gas plants are where the majority of the lease condensate is produced; as ever there are exceptions. Cryo plants are not that numerous, but are growing in number to maximise ethane recovery. A lot of ethane is not recovered as the cost of deep recovery is not reflected in the sales price. That may change but currently much of the sales gas is only treated to the upper ethane spec – that is roughly 14% vol ethane.
Likewise you like to talk about black oils and volatile oils. I am not sure it this really applies to shale oils reserves due to the limited permeability. Each well is effectively its own sub-reservoir and variation in geochemistry can have a major influence on recovery. I think the EF is a very good model.
Obviously if there is communication between the lateral completions this can impact the recovery.
In the oil business there is no black and white; only shades of grey.
Carnot:
1. Yes, absolutely the extra butane content in motor gasoline (RBOB) is in the winter–I had it the wrong way round. (Increase/decrease dyslexia, I guess…think I even typed it right before editing to be terser.) For the same reason as more pentanes are in the wet gas stream in the summer than retained on site. IT has to do with the hydrocarbon dew point. I worked at a refinery that had a huge tank and would retain n-butane in the summer and blend in the winter.
2. But again, that is disposition. Doesn’t affect the EIA pentanes plus production numbers, which are about production from central cryo plants.
https://www.eia.gov/dnav/pet/pet_pnp_gp_a_EPLLNG_FPF_mbblpd_m.htm
3. Yes, ethane rejection is a function of the market (price of ethane versus cost of recovery versus max BTU allowed in the marketed natural gas stream)…but we are digressing.
4. Did you look at the reference I gave (even gave you a page number).
5. I don’t “like to talk about volatile and black oils”. I think that was another commenter. If I said anything it was in response to him. And yes, I agree there is no black and white. Oil is a complex natural product with hundreds of different hydrocarbon molecules in a hydrophobic solution.
Anonymous,
The fact that URR is area under the production curve, is a very basic idea, so basic I didn’t think anyone would need to have it stated, this is freshman (or high school) calculus. The models for tight oil use a basic well profile (see Arps hyperbolic) convolved with the rate that wells are completed, this is combined with the price of oil, average capital cost of new wells (aka CAPEX), tax rates, OPEX, and natural gas and NGL prices. Essentially this combines physics and economics in a simple model.
Why would such a model prove incorrect? It depends on assumptions about future costs, prices, completion rates, and future new well productivity, all of these are unknown so there is a huge potential number of possible scenarios (an infinite set), the probability of choosing a correct scenario from this infinite set is zero. Note also the correct URR is also unknown, so for US tight oil it might be 50 Gb or 150 Gb, my guess is somewhere in the range of 60 to 90 Gb seems reasonable with perhaps a best guess of 75 Gb if oil and natural gas prices were to remain at roughly $80/b for crude $24/b for NGL and $3.50/ MCF natural gas forever. Seems unlikely this will be the case, but even much higher prices (if demand remains robust) wont push the URR beyond 90 Gb in my opinion.
Of course there are an infinite number of different paths that output might follow for any single URR assumption, if you find that particulary revalatory, you don’t understand mathematics very well.
New topic: US became the leading exporter of LNG last year.
https://www.reuters.com/business/energy/us-was-top-lng-exporter-2023-hit-record-levels-2024-01-02/
Kind of a massive thing when you think about it. We are 20% of global LNG exports. And unlike Qatar or Australia, LNG export is actually sort of a sideline to internal gas market. LNG exports are much smaller than internal production/consumption. (Meaning they raise price but a pretty minor amount versus internal dynamics…and Henry Hub is in the low $2s right now!)
and think that 5 years from now, starships 100s of them launch 100 times a day will consume as much LNG as US exports now.
Ovi,
Karnes and DeWitt are the 2 core of the core counties in EF belt with overpressure at close to 1.8 gradient or ~0.9psi/ft and burial depth of 10K ft.
Karnes has more rocks that should be in the lower maturity more oily, lower GOR zone than Dewitt.
But, like Gonzales, some area which should have lower GOR to begin with has unusally high GOR, and its isotope reading show that these extra gases come from deeper much more mature EF further south-east.
That’s why the initial oil(green dots) and gas(red dots) map, see below, already show Karnes and Gonzales have some red gas dots scattered in the green sea. These gas dots or initial dry mature gas charge might make initial GOR high already in Karnes.
https://www.rrc.texas.gov/media/wmjna41x/ogm0164.jpg
Further west EF, you will see some counties that should be all green dots oily zone, also have some gas red dots, those are a result of PVT already happened in the shallower close to normal pressure shale reservoirs, i.e. independent gas pockets next to oil pockets.
Sheng Wu
In the attached chart the GOR started 2.86, wondered as low as 2.52 and as high as 3.16. Could you clarify your definition of high and low GOR?
According to McCain definition, the GORs should be less than 1,750 and 3,200SCF/bbl respectively for Black oil with API less than 45 and volatile oil with API over 40.
EF core (DeWitt and Karnes), or the so called Karnes Trough in geology, is known to have higher than usual initial GOR, i.e. the maturity reading of the rocks indicate that they should be black oil or volatile oil, but the produced real oil and gas numbers, i.e. GOR in the above red-bar zone 2.65~3.00MCF/bbl, show that they are volatile oil and close to condensate.
Note, that this difference should explain that the Karnes has initial GOR already in the close to Volatile/Condensate boundary, or high GOR in Volatile oil side, whereas Permian and Bakken initial average GOR is below 2,000SCF/bbl.
Note that EF core, the Karnes Trough, is a close to 100 mile long stripe going from north-east to south-west, along the county lines of Wilson & Karnes, and along the short section of the stripe going from Wilson side to Karnes or from Gonzales to DeWitt side, in less than 10 miles maturity should change from Black Oil to Volatile Oil, and another ~5 miles, change from Volatile to Condensate, and then another 10 miles, to wet gas, and it is still Karnes county, as the vertical depth goes deeper so fast, and economics is also going down with less liquid. So, even though it is still Karnes Co, there is left with a large blank in Karnes with no drilling. Drilling only concentrate in the blackoil to Volatile-condensate zone.
So, Karnes core started with drilling from Black oil, Volatile and Condensate already, and the GOR is already averaged at Volatile oil, coupled with extra dry gas charge in the Black oil zone, it is somewhat higher than expected, especially when compared to Gonzales.
The other effect is the overpressure in the Karnes Trough is so high, that it takes a long time to reach bubble point, so EF on average shows quite flat GOR with much less increase from first year to over 5 years, while Bakken and Permian both show obvious GOR increase from IP to 5 years.
Sheng, unfortunately I participated in a lot of this EF stuff and studied it like I was going to be wealthy because of it. I was wrong, in a lot of ways because you are exactly right. Less than half of the stuff I owned WI in the EF ever paid out, much less made money.
Your are spot on regarding GOR and EF GOR has absolutely nothing to do with the Permian Basin.
I was mesmerized by old GeoSouthern wells in DeWitt that ulitmately had 2MM BO EUR’s. In those days we use to map API gravity like isopach maps. Phfftttttt.
There has been a little uptick in the Karnes Trough, of the past two years, stacked laterals and all that dog dookey, an effort at creating another round of “hope;” it hasn’t held up.
Mother Nature can be an absolute bitch.
You’ll never get the truth but the first thing to always ask experts like Annonomous etal., about the EF is… oh yeah, you think you know all about it, how much money did YOU loose?
If they say they lost a bunch, they are worth listening to.
Saudi Arabia Signals a Shift in Oil Strategy
Saudi Ministry of Energy orders Aramco to maintain oil production at 12 million barrels per day, halting any expansion plans.
The move reflects Saudi Arabia’s long-term strategy to preserve oil for future generations and manage domestic consumption needs.
This policy shift has significant implications for global oil markets and the long-standing energy relationship between Saudi Arabia and the United States.
Peak oil in Saudi Arabia?
Maybe…i think so but it’s not a forecast, just my opinion. Ghawar and Abqaiq are in decline since a long time and i guess that the others super-giants have reached their plateau now…which mean that without other major project SA production will decline. I worry about a situation in which Russia and SA decline while US plateau or just growth slightly. I also just want to ask a question : what would happen for the world economy and peace if the oil production of middle-east countries decline and if they began to become failing state like venezuela, libya or syria ?
The age of oil is probably at it’s twilight…and so of our world if major changes don’t happen.
…but that’s just my opinion.
Here is (again i know) my forecast for the 12 majors SA fields (the last available data was for 2018) :
note : the cumulative production for 1900-2050 is 220 Gb so it’s a quite pessimistic forecast.
Looks very Ace from TOD -ish. Peak is always next year. Somehow, we’re almost 20 years since Twilight in the Desert though. Also, it ignores the reported reserves (checked by a US firm) that were reported in the Aramco stock listing, and showed over 260B barrels remaining as of that time.
FYI, here is the 2022 annual report for SA: https://www.aramco.com/-/media/publications/corporate-reports/annual-reports/saudi-aramco-ara-2022-english.pdf Page 125 has the most recent reserves.
The 260B Saudi oil reserves are pure fiction. The real number is unknown but is realistically around one third of the official number.
Best in class, independent, reserves accountancy. Are you seriously stacking up peak oil Internet commenters versus these guys?
https://www.demac.com/dm-confirms-independent-assessment-of-reserves-in-saudi-arabia-for-the-saudi-arabian-oil-company/
Here is the IPO. See page 52 of the document. (Page 133 of the pdf.)
https://www.aramco.com/-/media/images/investors/saudi-aramco-prospectus-en-051219.pdf
Anonymous
My recollection is that this document was created as part of Aramco’s application to list Aramco on the NYSE. The SEC asked for more detail. None was provided and Aramco had to list on the Saudi Exchange.
The independent assessment that you linked to was not independent but in fact paid for and directed by Saudi authorities. If Saudi Arabia truly had 260 billion barrels of 2P oil reserves, they would be able to produce 30 million barrels/day, which they obviously can’t.
Ovi:
There were a gazillion reasons why they didn’t list on NYSE. Not just the reserves report. The primary issue was that it is extremely unpopular to sell the resources out of The Kingdom. But in any case, that’s still a VERY good reserves auditor firm and they signed off on that number. It may not have all the detail we’d like. But it is still an order of magnitude better to use the numbers certified by a very big, well-respected firm…versus peak oilers who say “Nobody knows, but it must be small”.
Frugal: These reports are always paid for by the companies. The firms are like accountants. Sure they have incentives to keep the customers happy. But their integrity is their currency. They don’t want to end up like Anderson.
Both:
1. Look the peakers have been complaining for years that SAudi reserves were not audited. Now, we get them audited. And you’re not happy because it’s not open kimono. And because the number was bigger than you liked. Well…that is still the best number we have. One that was signed off by a top professional firm from the US. (And FWIW, people in the know think the ultimate resource is higher, given there is still extensive exploration to be done…and given the Saudis have no incentive to overproduce and crash price…they are the primary cutters to drive price up, quasi-monopolists.)
2. There is a long, long history of peak oil articles suspiciously predicting Saudi declines. For example, Stuart Staniford, at The Oil Drum:
“Saudi Arabian oil production is now in decline. The decline rate during the first year is very high (8%), akin to decline rates in other places developed with modern horizontal drilling techniques such as the North Sea. Declines are rather unlikely to be arrested, and may well accelerate.”
http://theoildrum.com/node/2325
He wrote that in early 07 concerning production from 2006, that was below 9MM bopd, by year end. Note that SA did in excess of 10 MM bopd in 2022….fifteen years later! So much for the Simmons OR the Staniford SA predictions.
You don’t get to say “shale came out of nowhere” when it comes to Saudi production. Instead you need to look at all the failed peaker predictions and how they always fail in the SAME DIRECTION. It’s like a cashier who makes mistakes with your change…but always to shortchange you, not in both directions.
Anonymous
The only reason they did this was to list on the NYSE. They did not have to do this to list on the Saudi Exchange. End of story.
Looks very Ace from TOD -ish. Peak is always next year.
Bullshit. Peak oil is 5 years and 3 months in the rearview mirror. The chart is peak Saudi oil. And I think it is pretty damn accurate.
If you think Saudi’s fictional oil reserves of over 260 billion barrels was actually checked and confirmed by a US firm, then I have a brige I would like to sell you.
Ron:
0. I posted the link to D&M. If you want to believe in Frenchfries over industry professionals…that is reaching.
1. Yeah, I know it is SA. We all know what we are talking about.
2. As far as world peak, you said it was 2015 before. And you have a long history of negative calls on Russia that were wrong. I still remember digging all those Darwinian posts out.
3. The peak oil trait is to always say that past peak is the ultimate peak (like your claims on the 2018 world peak), if we are currently down. And that any increasing trend will peak next year (Laherre with tight oil, with the Bakken, SRS with Marcellus, etc. etc. etc.)
ANON – You only need a couple brain cells to understand peak oil.
A very ‘LOW’ estimate for total recoverable crude oil might be 1,800 Gb.
Alternatively, a very ‘HIGH’ estimate might be twice that, 3,600 Gb.
If you take the midpoint of each (900 Gb and 1,800 Gb, respectively), you can calculate the time at which cumulative production reaches respective peaks.
For the smaller value (900 Gb), we would expect a peak production date of 2004, for the larger value, we would expect production to continue increasing by 1-2% annually until a peak on or near 2033. We know that neither one of these values are realistic (one too low, the other too high).
However, if we take the mean, we see that a value of 2,700 Gb would have a midpoint of 1,350 Gb. NOTE: I don’t believe a URR of 2,700 Gb to be realistic since 2P reserves are only ~500 Gb, according to Dennis, 2P reserves are the best estimate and when added to cumulative production we have a URR of ~2,000 Gb.
The conservative value of 1P reserves (250 Gb) results in a conservative URR of only 1,750 Gb. So we might guess that there is at least a 90% chance URR is at least 1,750 Gb and a 50% chance that URR is no greater than 2,000 Gb, I see no reason to suggest URR could be more than 2,100-2,200 Gb.
This cumulative production amount was in fact reached in 2019. Additionally, to date, world production has not increased since this date. Assuming a URR of 2,700 Gb could actually be produced by the year 2099, we get an annual average decline rate of ~2%.
Here’s what that looks like (mb/d):
2019- 85.0
2021- 81.6
2023- 78.4
2025-75.3
2027-72.3
2029-69.5
2035-61.5
2040-55.6
2050-45.4
2060-37
2070-30
2080-25
This same exercise for 1P and 2P URRs results in decline rates ranging from 5% (2P URR = 2,000 Gb) to 10% (1P URR = 1,750 Gb).
Kengeo,
Probably 2PC reserve estimates are accurate, the mean petroleum engineer estimate of contingent resources is likely to be accurate and this should be added to 2P reserves. Over time most of the 2C resources become 2P reserves, there is a bout a 50/50 chance that contingent resources will be either higher or lower than the 2C estimate. Noyr that 2PC resources= 2P reserves plus 2C resources.
Dennis –
Let’s be clear on what you are proposing, 1P reserves of ~250 Gb have a P90 of being produced, an additional amount of ~200 Gb (2P-1P) give the most likely 2P total of 450 Gb of possibly being produced (P50). Now you are adding the 2PC amount of 1,250 (about 800Gb plus 2P). Presumably this amount is not all producible since it is composed of contingent undiscovered/undecided/noncommercial amounts. I might be inclined to include ~200 Gb from 2PC and have a 2P+ category. This results in 1500 Gb cumulative + 650 Gb of 2P+, a URR of 2,150 Gb. Assuming a midpoint of 1,075 Gb, the date for this cumulative production is 2012. This seems like a reasonable peak date for conventional oil (plus/minus 5-6 years).
I’m not sure what would allow adding the rest of those 600 Gb 2PC reserves (maybe high prices and or new technology, but I doubt the full 600 Gb is added, but maybe a small percentage…).
There is also a 60% production rule (peak is on or before 60% production of a field or group of fields). If we apply this to the 2019 peak (1320 Gb cumulative) and assume between 50% and 60% production had occurred, respectively, the result is URRs as follows:
50%- 2,600 Gb
55%-2,400 Gb
60%-2,200 Gb
There is likely reason to believe that Estimated URR is closer to 2,200 Gb rather than >2,600 Gb. Specifiically, there is a higher liklihood that certain areas in the world have managed to exceed 55% production before peaking, this trends towards a lower number, near or approaching 2,000 Gb. Also, if we ignore unconventional oil we see that there was likely a conventional oil peak in 2015-2016. Cumulative would have been 1,200 Gb. If 50% then URR is 2,400 Gb plus unconventional, if 60% then URR is 2,000 Gb plus unconventional. I believe Dennis sees a number around 75 Gb for unconventional, so URR somewhere between 2,075 Gb and 2,475 Gb. Call if 2,300 Gb plus or minus 8% or so…
We should be able to get a better idea of this based on continued production declines, right now it looks like an average peak of 83 mb/d was reached in 2020 and in 2024 it is roughly 81 mb/d. This is an average annual drop of ~0.5 mb/d, which is about 6/10ths of a percent.
On the flipside, assuming a full 2PC URR of 2,750 Gb, 50%/60% of the URR is a past peak in 2021 and a future peak in 2029, respectively, this seems unlikely since production is no longer growing…
The Red Queen is here: “It takes all the running you can do, to keep in the same place,”
Sorry but I’m French (as my pseudo pointed out) so I don’t understand your slang. I agree with you that Matthiew Simmons was pessimistic, like many others, about Saudi Arabia. However he was right for Ghawar which reached its peak in 2004 and is declining by 125 kb/d per year. Attached is a chart from 2009 produced by Energyfiles Ltd. If you exclude the NGLs the forecasted oil production is pretty close to what happens during 2010-2019 with a plateau at roughly 10 Mb/d /- 1 Mb/d.
And finally, believing the official figures from Saudi Aramco is really not serious.
Absolutely, you should take it seriously. The figure was computed and signed off by a top notch reserves auditing firm.
“DeGolyer and MacNaughton is one of the oldest and most respected names in the oil and gas industry. Since its formation in 1936, D&M has strived to be the leader in petroleum industry consulting services. With offices around the world, D&M employs over 180 petroleum professionals, including engineers, geologists, geophysicists, petrophysicists, statisticians, and economists who speak over 30 different languages. D&M provides a wide range of petroleum consulting services to clients worldwide and is consistently at the forefront of the industry in implementing innovative technologies. During its 80-year history, D&M has established an international reputation for extensive knowledge in its field, unquestioned devotion to integrity, and a commitment to serving its clients.”
Anonymous
If D and M is such a great firm, and I sort of agree, why did the NYSE not accept the report?
How am I supposed to explain something, I’m not sure even happened!
Do you have a good reference (press article or SEC filing or the like, to show the Saudis tried to list with NYSE and the exchange rejected them, saying the reason was an inadequate reserves report?
My memory is that they never tried to list with NYSE. So, NYSE did not take any actions, make any comments, etc. Also, I believe they eschewed NYSE because of a raft of disclosures needed, various controls and issues with the corporate structure, etc. Way more the issue than keeping secrets from the peak oilers.
But if you know better…citation, please.
“preserve oil for future generations”
Waiting for USA shale to collapse and sell Saudi America $200 per barrel oil.
Yes, I am very hopeful these “future generations” mean my kids here in the US. We’re pissing all of our hydrocarbon resources away here in the US, via exports, so I am thankful that the KSA is able to think past next week. If they charge us $200 a barrel, we deserve it, but at least we’ll have something.
Since 2016 the KSA and OPEC has really bent over backwards to prop the price of US WTI up, so the US tight oil exports can grow and US tight oil can deplete itself…now that they might be willing to conserve, to be able to provide the US in the future, is a beautiful thing. Globlization is alive and well.
I know, lets send them a Christmas card this year, you know, from all of us. Its only right !
ExxonMobil (XOM), Chevron to Raise 2024 Permian Basin Oil Output
12:29 pm ET February 5, 2024 (Zacks) Print
Exxon Mobil Corporation XOM and Chevron Corporation (CVX), already major players in the Permian Basin, are gearing up for a significant increase in production in 2024.
The move indicates that U.S. oil production could surpass previous expectations, repeating the trend observed in 2023.
ExxonMobil’s Expansion through Acquisition
ExxonMobil entered an agreement to acquire Pioneer Natural Resources Company PXD for $64.5 billion, marking a significant expansion in the Permian Basin. This acquisition is set to increase XOM’s production capabilities notably.
In the fourth quarter, ExxonMobil reported an impressive production of 610,000 barrels of oil equivalent per day (boe/d), slightly exceeding its 2023 guidance by 1.6%. The company plans to escalate its Permian volumes to 650,000 boe/d in 2024, with a long-term target of 1 million boe/d by 2027.
Post the Pioneer acquisition, ExxonMobil’s Permian volumes are expected to soar to 1.3 million boe/d, eventually aiming for a staggering 2 million boe/d.
Chevron’s Record Production and Goals
CVX set a record in the fourth quarter with an average production of 867,000 boe/d. This California-based giant is not far behind in its expansion plans. Chevron has started the year with 12 rigs and three frac crews in the Permian, and intends to increase production by 75,000 boe/d this year.
The goal is to exit 2024 with an average production of 900,000 boe/d and to hit the 1 million boe/d mark in 2025.
Environmental Concerns Amid Expansion
The aggressive expansion by ExxonMobil and Chevron, however, has not been without criticism. Environmentalists and some investors have expressed concerns, highlighting the urgent need to reduce emissions to mitigate the worst effects of climate change. Despite these pressures, the companies are balancing the need to increase cash flow through boosted oil production, while avoiding an oversupply that could depress prices.
Conclusion
The plans laid out by ExxonMobil and Chevron indicate notable growth in U.S. oil production, primarily driven by increased activities in the Permian Basin. While this could benefit the companies financially, it raises questions about the balance between economic growth and environmental responsibilities, particularly in the context of global climate change challenges. As 2024 progresses, the industry will closely watch these developments, alongside the ongoing dialogue about sustainable energy practices.
Zacks Rank & Stock to Consider
Currently, ExxonMobil carries a Zack Rank #3 (Hold).
“The plans laid out by ExxonMobil and Chevron indicate notable growth in U.S. oil production, primarily driven by increased activities in the Permian Basin. ”
Is that what the plans really indicate?
boe is not oil! They only indicated growth in boe/d
33 kboe/d for CVX and 40 kboe/d for XOM – the way things have been getting gassier, those increments may very well be just gas and NGL
the bubble point happened after production actually not just increase GOR, it also brings down gas production, just it bring down oil production at a much higher rate.
sure, but the legacy wells, the ones that are getting gassier, are still a massive wedge in aggregate production. and in some places the new wells are gassier than last year, as well.
For a non oil man, that Exxon is using BOE/d strongly suggests they know they are lying and that they are banking on the ignorance of people who will buy stocks on this news.
No way Exxon and Chevron are missing the ferocious decline rates of this stuff.
I couldn’t even get a job at either one of them, and I can see it clearly.
I don’t know, but I think Exxon bought Pioneer just to book “reservves” even if they new it was not sustainable long term.
Didn’t come up with that on my own, read it somewhere.
https://surplusenergyeconomics.wordpress.com/2023/02/02/247-the-surplus-energy-economy-part-two/
“Trend ECoEs are on a relentlessly rising trajectory, and this is the primary cause of a process of deterioration which has seen growth in economic prosperity decline, stagnate and – now – go into reverse. Overall ECoEs (from all sources of energy) have risen from 2% in 1980 to 4% in 2000, and 10% now. The high-maintenance industrial economy cannot cope with double-digit ECoEs – and there’s worse to come.”
Thoughts on this?
Oil production might seem relatively robust, but what matters is the oil that goes out to acctually power peoples lives. And according to this article from Tim Morgan, that amount has considerably gone down.
Tim has done a lot of very interesting work over the years, conceptualising how different (unsustainable) factors make current growth trajectories impossible to continue in the long-term. He do not release data nor the method he uses so transparency is very low. Like so many others he has underrestimated the possibility to continue the can kicking in the short-term. He will probably be right some day but the timing of these events seems impossible to predict and due to the low transparency I can’t judge the credibility of his work.
My only critique is that those figures assume a 1% annual drop in fossil fuels over next 15 or so years.
That would mean production of almost 450 Gb of oil during that time…this seems unrealistic given 1P oil reserves are currently only 250 Gb and 2P oil reserves are about 400-500, seems an annual drop of 3-5% is more realistic…
Is there any recent analysis on EROEI? Haven’t looked at it in quite some time, would be interesting to see how current values compare to those from the 1990s…
another new high for Global coal consumption and production
this sounds irrelevant to this thread here, but it also echos that China’s coal production reached a new high
some facts:
1. Before 2000, China produces just over 1/3 of current coal volume each year. The largest coal mine then was still the open ground one invested by US; only 25% coal then are produced in mines deeper than 1,000ft/300meters.
In 2000, US oil and gas production is about just over 1/3 of today?
2. Today, China produces 80% coal deeper than 300meters, and 35% coal deeper than 500meters. China replaces 15GW outdated coal firing power plants, and adding 17~20GW new supercritical power plant and 15GW of renewable energy powered electricity.
3. Today, India just have less than 10% coal coming from mines deeper than 160meters and producing 1/6th the coal of China. In next 3 years, India will adding 5GW coal firing power plants, more than double the speed in the past 3 years.
EIA STEO is out. Says crude production will flatline. They revised natty forecast down as well (but not as negative as with crude).
https://www.eia.gov/outlooks/steo/
Crude: “U.S. crude oil production. We estimate that U.S. crude oil production reached an all-time high in December of more than 13.3 million barrels per day (b/d). However, crude oil production fell to 12.6 million b/d in January because of shut-ins related to cold weather. We forecast production will return to almost 13.3 million b/d in February but then decrease slightly through the middle of 2024 and will not exceed the December 2023 record until February 2025.”
Natty: “Because of disruptions in mid-January related to cold weather across the central United States, we estimate that U.S. dry natural gas production fell from a monthly record of 106 billion cubic feet per day (Bcf/d) in December to 102 Bcf/d in January. The January average was 3 Bcf/d lower than we had forecast in last month’s STEO. We forecast that U.S. natural gas production will increase in February and reach 105 Bcf/d by March as the weather-related disruptions subside and will stay close to that level for the rest of the year. Dry natural gas production averages 104 Bcf/d for all of 2024 in our forecast, almost 1 Bcf/d less than we forecast in last month’s STEO. We expect production will increase in 2025 to average more than 106 Bcf/d.”
It’s been extremely entertaining watching this ANON character coming out of the woodwork ranting and raving about how “peak oilers” got it all so wrong, how Saudi Arabia has tons and tons of oil, what will ANON come up with next…he’s doing god’s work….
All the while, in the real world, peak crude oil production was 85 mb/d in November 2018. Right now it’s at least 5-10% below that amount and falling steadily every year…but wait, let’s celebrate the fact that US production MIGHT be 2% higher than 2020…
Kengeo,
I fear you may be correct on your observation. Covid masked the effect for a while but the test will come over the next year or so. Will C&C grow past 85 mb/d, that is the big question? Even if it does it will be an undulating plateau for a while until,the decline sets with a vengeance unless someone can really pull the rabbit out of the hat, which I doubt.
The KSA reserves must be taken for what they are- A Saudi guess. The same applies for most of OPEC
I do however admire the way that the Saudis( and some others) have husbanded and produced their reserves, but in the end all giant fields decline. That is fact.
The EIA says OPEC has peaked, or at least for the next two years.
The below projection is from the latest EIA Short-Term Energy Outlook.
Annual deficit of $700B for the next 20 years…guess that means oil price needs to go up 30-40%?
“The global oil market will require $14 trillion in investments over the next 20 years if oil-producing nations hope to be able to fulfill global energy demands through 2045, OPEC’s Secretary General Haitham al-Ghais said on Tuesday.”
https://oilprice.com/Latest-Energy-News/World-News/Oil-Market-Needs-14-Trillion-OPEC-Secretary-General.html
Is hard to know when data is fudged. We now know that soviets will fudge a lot of data. But back in the day, even CIA could hardly tell
https://www.cia.gov/readingroom/docs/CIA-RDP90T00114R000800310001-6.pdf
Oil market will face supply shortage by end of 2025, Occidental CEO says
– The oil market will face a supply shortage by the end of 2025 because the world is not replacing crude reserves fast enough, Occidental CEO Vicki Hollub said.
– About 97% of the oil produced today was discovered in the 20th century, she told CNBC.
– The world has replaced less than 50% of the crude produced over the last decade, she said.
– “We’re in a situation now where in a couple of years’ time we’re going to be very short on supply,” Hollub said.
https://www.cnbc.com/2024/02/05/oil-market-will-face-supply-shortage-by-end-of-2025-occidental-ceo-says.html
Dennis:
I remember recommending to you, that you really ought to have a wider spread of scenarios. That you should have a high case, which was more out of the box. Looking back ten years….it seems I was right.
Even now, I think something like taking the USGS estimates and adding 50-100% makes sense, for your high case. I know it sounds crazy. But…there’s a lot we still don’t know.
It seems like you take 80% USGS most likely for your medium case (already shaving a little, instead of adding a little, for the most believed case). And 100% USGS for your high case (too constrained…USGS is not an “oil in place” absolute measurement). And then 50% USGS for your low case (fine).
I would do USGS’s most likely as your medium (no shaving up/down, just let it fall). And then 50% of that for the negative. And 200% for the optimist. If I were you.
My personal Bayesian view is we probably do something like 150% of USGS most likely. My personal 10-50-90 would be 50% of USGS most likely for the low case (need spread). Then 150% for the middle (I know it sounds crazy…but we always squeeze out more). And 225% for the high case. Yes…I realize this is way outside their own % likely bounds. But history has shown we need a higher spread of outcomes. And their spread is just versus their methods…not capturing the real Bayesian uncertainty of the future.
Whatever you do, stay away from Laherre. Look back at his past predictions. They were all super negative, symmetric Hubbert peaks etc. He’s one old guy in France. Why would you trust him to estimate US natural gas resource, rather than looking at what PGC has. Yes..their crazy high 100 years of Obama bliss number…they are industry professionals and way more involved than Laherre.
One thing we know for sure – as time goes on, the complexity of accessing the available oil increases, and the return diminishes. This is because fields are harder to access and smaller on average. This also means they deplete faster, creating a Red Queen effect that is ALWAYS increasing. Or at least, it always is until you pass the point where it just doesn’t make sense anymore to do it. And then all you have is a bunch of rapidly depleting fields with nothing to replace them. So, everything is fine until it isn’t. On some level the global hydrocarbon extraction system is probably too complex to make sensible guesses about when it will go into retreat. That doesn’t mean that it won’t happen, and that maybe already has. Fossil fuels are being depleted rapidly every day. The inflection point will happen. This is certain.
I like the pollyana, cope mecanism:
– when the market is strong money and innovation will bring resources;
– when there is economic risk and inflation the geology will provide;
make up your mind!
I see oil production from another point of view.
After the peak of November 2018, the world economy now misses about 10 Mbbl/d.
A rising population with rising needs does not get enough oil, because the oil is too expensive for it.
Berndt,
Yes, oil is somewhat expensive – currently it is above its 30 year inflation-adjusted median – which moderates demand from developing countries somewhat.
However, the main reason the trendline was broken is the global pandemics, which lasted from 2020 to 2022. There was not only precipitous drop in mobility, but also the capacity to provide mobility was impacted. Supply shortages led to sharp drops in auto production worldwide. Airlines laid off staff, pilots took early retirements, etc. etc.
It takes time for this shock to be reversed, and some mobility may be lost more permanently. For example the pandemics-driven boom in videoconferencing seems to be here to stay, which cuts down on some travel and commuting.
Berndt – I agree, applied your same analysis to Ovi’s chart below…do you have any feeling of what the average annual decline rate might be? My guess is somewhere around 2%, but likely 1% before 2…
My prediction remains unchanged. Small decline (1%-2%) until 2028, after 2028 larger with the form of a Seneca cliff.
Anonymous,
I have done a medium case with mean USGS TRR estimate then apply reasonable economic estimates to find the economically recoverable resource (ERR). Just because a resource is technically recoverable does not mean it will be profitable to do so, I make the basic economic assumption that resources are extracted by capitalists that aim to make a profit, in the US this is typically how it works. My low estimate uses the F95 USGS TRR estimate and the high estimate uses the USGS F5 estimate. The range is about 45 Gb to 100 Gb for F95 to F5 TRR for the Permian Basin with the mean TRR at about 75 Gb. My scenarios basically already do what you are suggesting, however note that oil professionals are highly skeptical of USGS TRR estimates, a more reasonable mean ERR estimate is on the order of 50 Gb as there is about 25 Gb of the mean TRR estimate with very low EUR wells that has little chance of being extracted unless we see oil at $150/bo and natural gas at about $5/MCF (and even then might not be profitable to extract).
At link below is a set of scenarios I created in December 2018 using F95, mean and F5 USGS TRR estimates and AEO 2018 reference oil price case, scroll through a few comments to find it.
https://peakoilbarrel.com/open-thread-petroleum-december-6-2018/#comment-660882
Note that this looks like a large overestimate of wells at 175k wells, but in 2017 average lateral length was about 7400 feet vs 10000 feet in 2022, so converting 2017 wells to 2022 wells this would be about 130k wells instead of 175k wells in the 2018 model (in 2018 I would have only had information on average 2017 well lateral lengths).
The December 2018 medium scenario in chart below also expected completion rates to rise to about 700 per month by 2025, for the lateral length in 2022 this is equivalent to about 515 completions per month, the old model was probably overestimating EUR for the average Permian well by about 10% and current completion rate is likely lower than the 2018 medium case scenario. Obviously the pandemic was missed.
Dennis
The affordable price of oil is dependent on how much a person needs and efficiency.
https://theicct.org/publication/fuel-efficiency-technology-in-european-heavy-duty-vehicles-baseline-and-potential-for-the-2020-2030-timeframe/
I know many people who had cars and were struggling with all the other bills. So they gave up their car and use public transportation. They have saved the cost of a car loan, petrol, mot, tax, insurance and repair costs. Saving themselves around £9,000 each year. The annual public transportation cost is around £3,000.
LNG ships and more efficient trucks will make $150 very affordable. There are always millions who struggle with costs but the world runs on what the majority can afford.
Charles,
My claim is not that $150/bo won’t be affordable, simply that oil will be more profitable to produce at a higher price (assuming costs to produce rise more slowly than the price of oil.) It is also true that demand will be lower at the higher price level.
Anonymous,
The PGC seems very optimistic, I think USGS estimates are better. I use those. The 2013 USGS Bakken assessment was pretty accurate in my view, when the economics is added my Bakken scenario matches the mean ERR estimate very well. I believe a similar methodology will work well for the Permian which results in a medium scenario in the 50 Gb URR range (maybe 45 to 55 Gb).
I don’t care if I am wrong, I give my best guess based on available information. Note that my best guess scenario assumes oil and natural gas prices remain about where they are until 2035 and then start to fall, an alternative scenario with oil prices rising to $200/bo and natural gas to $10/MCF would have a higher URR, perhaps 70 to 80 Gb for Permian basin output, in my view that scenario has a low probability (5% or less).
Anonymous,
You should ask Dennis to give a version based on operator’s EUR and TRR.
I don’t know if Dennis has done similar forecast for Bakken?
I see the version of Laherre on Bakken it is far off indeed, and I believe Dennis will give a much better version.
But, do you believe Continental’s TRR of 20Gb or 20G BOE is realistic?
By now, Bakken already produced over 4GBO and over 5GBOE and probably TRR 8GBO and 12GBOE is realistic, -30% bound range are all acceptable to me as predictions.
I just run into a Jan. 2024 Marcellus prediction by Patzek, an Art Berman type, they seem to ignor many production data facts, in Marcellus WV alone TRR is over 180TCF by work from WVGS in 2021.
http://www.wvgs.wvnet.edu/www/MUDvnnSh/MUDvnnSh.htm
https://pubs.geoscienceworld.org/aapgbull/article/108/1/15/631779/Forecast-of-economic-gas-production-in-the
here, Patzek use more profession geophyical numbers in simulation, e.g. porosity, pressure, etc.
But, there is huge problem, their porosity and pressure are way underestimated, see my youtube video
https://www.youtube.com/watch?v=1wVnCQJ7m4o&t=16s
Similar problem already happened in the revolution starting point in Barnett, where if they use conventional porosity tool, it reads only 3.7%. But with grain-apparent-density difference, it is 13.5%.
In Bakken, they again used conventional porosity tool, and Patzek along with mainstream geologist give 0.8% porosity for high TOC shale and only 5.6% for middle Bakken. Then, Patzek only had over 4GBO in 2019 estimate.
Here in Marcellus where TOC is again very high over 10%, he use only 7%, way better than the ridiculous 0.8% in Bakken, but still can not make reasonable recovery numbers for WV Marcellus.
Wow! So after 15 years and nearly 20,000 wells the Bakken has only produced 4G BO ?! Amazing.
If THAT doesn’t describe peak affordable oil production in the US, what does, exactly? The Eagle Ford? Half of those 20,000 wells never came remotely close to paying back leasehold and D&C costs.
Mike,
you are right — the cost and resources concentration per square mile is really marginal compared to the major fields in Middle East core, even though the spread is huge and resources amount is large. Similar things happen for Russian and other countries oils and gases, but at a different scale.
Similary, only the core of EF or Bakken or Permian could make money in today’s low price scenarios.
The only things comforting US shale oil and gas are: energy independence and help lower the inflation, unemployment and cost of downstream industries…
Think of this, without shale gas and oil, Ukraine war probably ended 2 years ago already.
Mr. Wu, my point might be that there are not 20,000 oil wells on the entire Arabian Pennisula, and the cumm. prod. to date there is forty fold what the Williston Basin is. That strikes me as being very peaky.
We can argue what “make money” means; I think in the oil and gas business it means to make ENOUGH money to be totally self sufficient financially. That is not the case in any of US tight oil basins; 2:1 ROI doesn’t meet the self-sufficiency defintion. You cannot wait 3 years to reach payout, then expect the other 100% of your rate of return (profit) over the NEXT 10 years and expect to be self sufficient.
The US is not energy independent, not by a country mile.
I like your science insights into all these resource beds and what makes them tick. I find it helpful. In the US, however, its about making money and the truth is the entire shale oil, shalely carbonate resource bed thing, nation wide, including leasehold and infrastructure costs, has not made money yet. There is about $300B of debt, incenerated shareholder equity, etc. etc. that wil never get paid back.
In the ten years that I have commented here on AOB there are only 3-4 people that knew jack about tight oil and tight gas economics. One of them was Rune Likvern, the other was me, because I owned WI in shale wells, and LTO Survivor, who owned lots of WI in tight oil and gas wells. Big time. Internet experts, particularly Dennis, argued with those folks, vehemently, about stupid shit, and ran them off. RI and ORRI loves tight oil and tight gas; they don’t spend money to get their free checks. Hell, when you think about it, who does in the shale biz today? Its all OPM and if its fails, who’s on the hook?
Nobody.
All that hooey about porosity, thermal conductivity is really cool but in the end, its gottt make money.
What I find strange from the view of more an industry man is the method shale oil is produced – from far away it looks like a gold rush like chaotic chaos.
With the fast declining wells it look like more as a mining operation but a classical oil operation (drill + pump for many years, maintain a bit to keep it flowing). It’s more classical mining, where you have the excavators running all the time, too.
So it should be done like mining – build a field railway for transporting all the heavy stuff, pipelines for the fluid and gassy ones, and start at one place churning through the field. Sand handling, oil handling, water handling can all be done more efficient when done in industrial style. Field railways can be build fast and cheap, and removed afterwards. These trains don’t go fast, so no need for exalted rail design.
Alone, transporting the sand with trucks producing local traffic jams. In huge brown coal mining ten thousand tons of material are transported every day either by rail, huge special vehicles or even conveyor belts (these go for up to several hundred thousand tons per day for cover removal). So these quantities of fracking sand don’t look that big compared to this.
The same with water handling – build one central refining factory and pipe it there (or use cistern cars on rail).
But this would mean one big oil company doing all these things, be it a state company like in SA or an Exxon. It needs to sink a double digit billion $ value in infrastructure before fracking the first well (beside exploration wells), but this should pay out. Other offshore operations or conventional oil sink double digit billion$ before pumping, too.
Just some thoughts
Eulen, I worked at a decent sized hard rock mine and there were trucks all over the place. Hundreds of them. Massive diesel consumption. Huge monsters also…you had to “put up the flag” (10 foot pole with flag) when you drove your pickup onto the active mine site, because those mining monster trucks can’t see the little trucks under them and are at risk of literally driving over them!
https://cdn.shopify.com/s/files/1/0757/6705/4611/files/Blog_1.jpg?v=1685618897
More broadly, there is some programmatic development of tight oil fields, in the direction you describe. XOM advocates it. CLR has done it, some. But it’s not an all or nothing. For example if the lease boundaries interfere. Or if governments or (less often) land owners prevent routing gathering pipes. Also, of course there is some optionality loss when you commit to what is essentially a megaproject in the shale.
https://www.oklahomaminerals.com/clr-launches-project-springboard
Rail spurs to the pad don’t make sense since there are so many pads scattered around (maybe at an oil sands project, donno). But there’s a lot of rail transported sand, except for the final few miles.
I really think shale is closer to conventional onshore (despite the higher costs and multiple wells) than it is to deep water. Offshore is amazing engineering, billions of dollars. That’s a scrunch factor to approve a big offshore project. Like building an LNG plant. Massive timelines, organization, etc.
Agree, Mike
The shale oil and gas, and in particular shale oil, and especially light tight oil are so called marginal resources, and need very well-thought well-planned development to make money.
similar logic, i.e. “making money”, apply to all other industries.
In renewable and green tech, lots of waste of investors money too, and most of the money is wasted due to greed, and not following logic.
Instead of focusing on URR/TRR under different price scenarios, we should do a URR/TRR under different capital desciplines, e.g. like monopoly Standard Oil/Saudi control the market.
Instead of going massive high density drilling, operators should be self-disciplined to develop the resources, and then forecast the production.
For example, Scott Lapierre had a model to optimize drilling, a model of forecast could be developed to show how much more resources could be extracted with restricted lower capital versus unrestricted high capital and get less resources.
Sheng Wu,
I have never believed the estimates by some operators such as Continental, claiming the Bakken would produce 30 Gb of oil.
My recent Bakken Scenario (from mid January 2024) has cumulative Bakken output at close to 5 Gb at the end of 2023 with a URR of about 9.7 Gb. See chart below, the scenario is certain to be incorrect. Total wells completed to the end of 2023 about 18000 for North Dakota Bakken/Three Forks, with total wells completed for the scenario at about 28500 with the last well completed in August 2037.
Dennis: so we have 5BBO produced. You predict 4.7 more. What would be produced if we had a total stop to new drilling or refracking (but assume normal maintenance, etc.)? I.e. the production we’ll get no matter what.
I just want a feel for what percent of the remaining 4.7 you have from new completions, versus what percent from existing completions.
Anonymous,
With no completions after Dec 2023 about 6 Gb of output from Bakken. So an addition of 1 Gb over what has already been produced.
The post linked below (from October 2013) considered several scenarios for Bakken output.
https://oilpeakclimate.blogspot.com/2013/10/exploring-future-bakken-decrease-in.html#more
4.7 is like 10 years of current production. (365*1.3MM gives .47 BBO). Obviously there will be a shorter plateau and then a tail. But thinking about it intuitively. Agreed…it seems hard to get to the Continental 24 BBO estimate, with production at current levels. It would mean 24 years at current rate! I do wonder if we do a bit better than you think though. Like 5 years or so at current rates, then the decline.
Sure seems to be hanging in there better than people expected. You have it over 1MM BPOD through 2030, now. When I pulled the Laherre 2014 Bakken prediction, he thought you were crazy optimistic for having JAN2026 at 500,000 bopd (he had it at 20,000). But you’ve had to revise up. And really by 2014, the Bakken was not some sort of new phenomenon. Had been in the news, etc. since 2008.
Anonymous,
It is always difficult to predict how much of the resource will be profitable to produce. At the end of 2013 about 0.8 Gb of C plus C had been produced from the North Dakota Baken/Three Forks.
Predicting the future is no easy task.
Nice plots, Dennis!
9.7Gb URR oil is quite close to the current production facts. Your 2013 plots also covered lots of scenarios and are quite comprehensive AND CLOSE TO REAL PRODUCTION/PRICE TODAY!!!
I have 2 cents to share here
I read Continental quoted URR numbers and found their 20 , 30 and 40Gb of Bakken URR oil in 2010, 2012 and 2018 respectively. These numbers are certainly way too inflated to pop up their stock price.
Lots of the shale oil and gas decline curves analysis have been very difficult 10~20 years ago with very little or too short production history. I think their 2010 and 2012 URR numbers have been inflated without real production number yet with expected improvements thru technology engineering innovation supported by then 100 forever oil prices. That’s how peak oil camp peaked then? I am again surprised by your prediction based on lower prices.
It seems that Bakken wells have sustained better in 2023 compared to he past 8 years from 2016. In 2016, they completed 735 wells and barely maintaining 1million barrel while the wells then see the largest IP12month improvements. In 2018, it took 1275 wells to get 25% increase to 1.35million. This past 2023 year with probably under 1,000 wells, they could grow almost 25% to 1.3million! Looks like it has a little better performance, and gives Anoymous and me that something might happened so this 1.3million per year might last 2-3 years longer?
Sheng Wu,
Thanks.
Perhaps there has been a productivity increase, I tend to focus on data available from NoviLabs and there free blog data is becoming less frequent. I cannot afford the subscription so I depend on data that is feely available. The last Bakken update was posted in July 2023, see link below
https://novilabs.com/blog/north-dakota-update-through-may-2023/
Look at well profiles in chart below, not much evidence of increased new well productivity through July 2023.
The chart is not normalized for lateral length, but productivity increased from 2016 to 2020 and then declined from 2020 to 2023, based on the latest free data from Novilabs.
Another really simplistic SA oil production forecast with an assumed URR of 260 Gb, a plateau at 10 Mb/d and for 3 different decline rate at peak.
Because i’m not an expert but i’m still capable of doing simple mathematics.
note : the bar line indicate 2030 (i precise in case the quality of the chart is too low).
It’s worthy to remember that before (and a short time in parallel after) the surge of conventional oil production in pennsylvania, galicia or also in apsheron peninsula during the second part of the 19th century, oil was in majority (not all) produced from coal and oil shale retorting. There was a rising demand as Europe industrialized rapidly but it was not these sources which had brought (despite significant reserves in comparison of the production in Great Britain, in germany or in France) the “oil revolution”. It was the bonanza coming from the US, from Azerbaijan or from Galicia. There was a reason for this: the productivity of retorting shale are far lower than conventional oil. However, shale fracturing was also practiced as early as the 19th century and today represents a major source of oil. It will therefore be interesting to follow developments regarding oil shale and see if they can constitute a new revolution or will be nothing more than a minor source, as they have always been until now.
Good comment, Frenchfries.
The world has massive amounts of hydrocarbon, such as bituminous coal, which can be cooked to produce oil, as you say. Mike mentioned asphalt, which is funny but true: we can crack asphalt to get liquid fuels if it ever makes sense. Cooking oil shale maybe another option, too…
What people here don’t understand is that the 2000s oil-peakers were coming from a very specific definition of “oil”: liquid hydrocarbon that has migrated into high porosity formations and is covered by caprock. That “oil” has peaked, they were right about it. All the growth has come from tight oil and tar sands.
Were the peakers overly alarmist? Perhaps. However, they were influential and shaped a narrative that raised oil prices substantially, which led to investments in the shale patch. Without the Peak Oil narrative and the high prices of 2006-2014, these investments in shale would not have happened.
So the peakers were correct, but their voice was instrumental in investing in new ways to get liquid hydrocarbons. That’s just how it goes.
Here’s a great find for those that want to look at ~20 years of peak oil:
Looking at Rystad’s most recent estimate, 2PC = 1,250 reserves + 1,500 cumulative production = 2,750 Gb, if 300 Gb of overstated reserves are removed, this number falls to ~2,450 Gb.
Best guess URR in 2006 (Skrebowski): 2,300 Gb
Kristofer Jakobsson 2012, Petroleum Production and Exploration: Approaching the End of Cheap Oil with Bottom-Up Modeling: 2,248 Gb; Peak Year = 2019; Peak Production of ~30 Gb/year
Best guess URR in 2022 (Laherrere): 2,500 Gb
Discoveries between 2006 and 2022: 190 Gb (10, 9, 8, 8, 25, 8, 16.6, 16.8, 20.3, 7.9, 12.1, 9.9, 15.8, 12.5, 4.7 , 5)
2006 Estimate plus subsequent discoveries: 2,490 Gb
Global peak for conventional oil would be 2016 if URR is ~2,500 Gb (this is what it was when unconventional oil is excluded from the analysis).
Peak would be 2024 if URR is ~3,000 Gb
Peak would be 2007 if URR is ~2,000 Gb
Regardless, the peak is centered around 2016 (2006 if URR is 2020 if URR is >2,750 Gb).
Since the peak occurred prior to 2020, we know that URR is between a range of 2,100 Gb and 2,600 Gb.
This seems reasonable if we expect discoveries of ~100 Gb over the next 20 years.
Open letter to Peter Jackson of CERA
By Chris Skrebowski, originally published by Oil Depletion Analysis Centre (ODAC)
December 22, 2006
“If we take the simplest and most straightforward reserves-based approach and use the best figures for proven and probable (2P) reserves from IHS Energy, these show that by end 2005 some 1,077 Gb had been produced and 1,251 Gb remained, giving total discovered reserves of 2,328 Gb. ”
In the forecast reviewed here, Energyfiles projects a global all-oil production peak of 95 mb/d around 2017 assuming a relatively high demand growth of 1.8%/year The conventional oil URR is estimated at 2685 Gb and the aggregate post-peak decline rate is estimated at 2.0%/year by 2022 and 3.0% by 2030.
Here’s additional analysis from Global Oil Depletion (2009):
Dennis – It’s interesting to me that you are still using URRs that have been around for more than 15 years, yet you adhere to the thought that there will be reserve growth and discoveries.
So we have the following:
1P URR of 1750 Gb (mid-point = 2003)
2P URR of 1970 Gb (mid-point = 2006)
Estimates between 2250 Gb and 2500 Gb (mid-point = 2011, 2012, 2013, 2014, 2015, 2016)
Estimates nearly 2,750 Gb (mid-point = 2020)
Do you still really believe there’s a future global peak around 2027? Based on revisions to your model, I don’t believe you find that as probable as you did 3-4 years ago, but maybe I’m missing something.
When do you think 1P reserves will start growing to meet these higher estimates of almost 3,000 Gb?
As it stands, 1P is only enough for ~8.5 years, 2P is only ~ 16 years. If by June 1P and 2P reserves haven’t increased, something seems very off by the continued shrinking 1P/2P values…
Kengeo,
Yes there might not be a new peak if future demand peaks at a level below the 2018 peak, it is unclear if the peak demand hypothesis is correct, if it is not, I still expect that if demand rises to more than the 2018 output level in the future that supply may peak in 2027 or 2028 at around 84 to 85 Mb/d. Rystad estimates 2PC resources at 1283 Gb, with 2PCX at 1624 Gb at the end of 2022, with about 1420 Gb produced through the end of 2022, thus a URR of 2700 Gb to 3040 Gb seems reasonable based on Rystad’s analysis (see link below).
https://www.rystadenergy.com/news/recoverable-oil-reserves-billion-barrels-warming-planet
Sheng Wu:
do you have any references (preferably not your LinkedIn article, but someone else), discussing the “in the shale itself” Bakken drilling?
I thought they always tried to go into the Middle Bakken (thin bed reservoir), not the upper or lower shales. Of course they also drill the TF. But that’s different. How prevalent is this new method of attack (couple wells…or everyone doing it now)?
Also, I wonder what kind of wine rack pattern they do when going after the shales themselves. Is it just like the normal wine rack (versus TF), but shifting MB to shale layers? Or hitting some MB and some shale…or what?
there is not much discussion on this drilling in “high TOC Bakken shale”, it is a forbidden area almost like “shale can not produce” before the shale revolution.Unconventional mainstream have this conventional paradigm, i.e. the high TOC shale is no good for oil, but perfect top #1 target for shale gas.
There are quite some related references with some bizzare observations though,
1. some found the production GOR in MB can not match with the nearby wells, i.e. too high, and have to invoke gas from the high TOC shale.
https://www.mines.edu/crusher/wp-content/uploads/sites/126/2018/03/Publication_Kumar_Bakken_URTEC2013.pdf
2. Some also found the recovery is too high because the MB volume is tightly defined with low porosity. This might be because the conventional way of porosity measurement (NMR, gas or Mercury) is no good, i.e. usually they gave less than 6% porosity for MB, I have a density method that measures almost twice as high, and similar wireline density method gives much higher reading in Marcellus, see the WV report on Marcellus TRR.The explanation is funny though, rather than allocate the extra production from upper or lower high TOC shale, they believe the oil comes from lower TF, and TF oil could go through the high TOC lower Bakken shale which is a barrier?https://www.linkedin.com/pulse/lower-bakken-thickness-controls-three-forks-middle-wells-gherabati/
3. Many doing production allocation using geochemical signatures of oils from each formations, and then compare with signatures from produced oil, also found the oil signatures of MB has lots of oil from TF and also a little from the high TOC upper and lower Bakken shales.
https://www.researchgate.net/publication/322351401_Time_Lapse_Geochemistry_Application_in_Unconventional_Reservoir_Development
This little contribution from high TOC probably is a result of several things:
A. the high TOC shale needs special stimulation just targeting the shale itself
B. they did not extract the oil from high TOC shale rocks properly for analysis
4. This conventional wisdom about shale or tight oil is part of the paradigm that fluid viscosity and rock permeability determine the shale production. So shale oil can only produce from lower clay content sandy or calcite rocks next to high TOC shale, because high clay shale has much lower permeability so only much lower viscosity shale gas could produce in the shale, and oil also are adsorbed by organic rich shale and can not move. Even in the MB, where the tight sandy feldspar is so tight, the mainstream believe only light oil with high GOR could produce, or medium oil with low GOR can not. The good example is lower EF, the TOC is lower at <5% shale and shale has more calcite than clay usually.
Now, in Vaca Muerta and China’s Bohai Bay and similar fields, lots of best shale oil wells are producing from the lower high TOC (~7% Vaca Mueta) and high clay content shale with medium black oil API below 30deg and GOR under 200scf/bbl. In China’s regular lacustrine Erdos basin shale field, Chang7-3, the TOC is as high as 30% and dominated by high clay shale, very little scattered sand. This C7-3 has basically 3 death penalties from conventional shale oil paradigm, i.e. close to zero porosity, adsorbed oil, and low maturity reading using Tmax. But isotope reading show it is just as mature as top C7-2 shale, where good production has been going on in the more often sandwidched sandy formations. The latest tests in the ultra high TOC C7-3 also showed the results is just as good as C7-2, if not better.
Here’s a look at 2P decline scenario, URR is ~2,000 Gb. Based on bottom-up analysis of major areas (Africa, Americas, Asia-Pac, Euro Area, and Middle East).
Decline is a steady -1.3 mb/d thru ~2035, then Euro Area production goes to zero in 2038, Americas goes to zero in 2039, removing nearly half of all production. Asia-Pac goes to zero in 2044, all others go to zero in 2045, leaving only Middle east producing around 25 mb/d for a couple more years. No production after 2050. If you believe there’s another 500 or even 1,000 Gb available, then this timeline can be pushed out around 15 to 30 years.
Dennis – I think you should revisit your 2012 work:
Kengeo,
The 2012 work assumed 2600 to 2800 Gb for World C plus C URR, and estimate that is likely too low based on current knowledge.
Dennis, your 2022 model has a new peak soon, right? I believe you had 2024 world production exceeding that of 2018/2019. Peaking in 2028/2029 or so…
Here’s what I currently have for world depletion numbers, how does it match up to your estimates?
Note, this assumes a fairly high URR of ~2,800 Gb (about 850 Gb above 2P estimates):
Africa – 55% depleted (50% in 2019)
Americas – 44% (50% in 2029)
Asia-Pac – 75% (50% in 2010)
Euro Area – 85% (50% in 2010)
Middle East – 46% (50% in 2028)
World – 53% (50% in 2020-2021)
If only 1P values are considered, World is 85% depleted and 50% mid-point was 2006…
Kengeo,
1P values are of little interest. 2PC resources are what is important and note that that does not consider reserve growth and future discovery.
Below is a shock model from November 2022, that model did have a peak in 2024, but I have since revised the model based on the fact that demand for crude has been lower than I anticipated 14 months ago.
Hybrid vehicles proving to be ‘a better alternative’ to EVs
As demand for electric vehicles slows, car buyers are shifting focus to hybrids
Is reality finally starting to settle in on the crazy idea of an all electric BEV? Saw a TV program here in Canada the other night where a reporter went to 12 EV charging stations and had problems at 7 of them. Four of the problems related to getting the phone and the charging station to communicate. They were finally fixed. At the other three they could not get a charge. I bring this up because it was this statement in the attached article that caught my eye “unreliable charging infrastructure for EVs.” Never realized there would be charging problems.
Question: Do you need a cell phone to get a charge? Can you pay directly with a Mastercard/Visa?
https://finance.yahoo.com/video/hybrid-vehicles-proving-better-alternative-174822874.html
This is a terrible problem that I have frequently experienced. I can’t understand it either. Frequently you can’t just pay with a visa/mastercard but need an app on your phone and the communication will break down between the phone and the charger. So everything works except this communication.
Starting with 2025 models EVs will all be equipped with the Tesla charger (NACS plug). This will add vital competition to the charger segment and standardize charging availability. There has also been a bizarre focus on Level 2 charging in many localities which is pointless (adds about 20 miles of charge an hour). This is what you want at home but out and about anything but a fast charger is not worth installing. All that said I’ve been driving an EV for 9 years and the infrastructure is much better and improving. Once all cars have the same charging port starting later this year I expect the situation to start improving consistently, mostly because Tesla actually does an excellent job keeping their charging system up and running and other companies will have to compete against them.
Stephen
Good to see they are moving to one common plug.
Ovi,
For tesla Superchargers, a credit card is set up in your Tesla Account and the car is automatically recognized by the charger. Not sure how this works for other brands of cars that will use the Tesla Superchargers in the future. I have occasionally had trouble with other types of non-Tesla chargers that require payment.
Dennis
That is the advantage of being in charge of the whole system.
Ovi,
Hopefully the system that is set up works as well for other brands as it does for Tesla vehicles.
I’ve read (and seen video example) of a system in EU that uses your credit card for electric car charging, if I understood correctly the system is sort of mandatory for new charging stations and for refurbishments.
Yes, that is right.
It has been an absolute mess of different charging providers requiring different software applications or payment solutions. That is an absolute turnoff for more elderly people that try to travel long distance with an EV. That will be sorted out and be more standardised in the future. Much in the way smart phones and PCs are much simpler to use now than a few decades ago (as an analogy).
Dennis – It’s in the Tesla App, ‘Charge your Non-Tesla’…seems pretty straightforward. Usually chargers can use VIN authentication…not sure if Tesla will have that functionality…
I don’t really understand why you should need an app anyway. Why can’t you drive up to any charger, tap your credit card, and if the adapter fits your car, you pay for the electricity consumed.
On Kelly Blue Book, it says:
A charging app can help an electric vehicle owner find charging stations. Phone apps also help users determine if the chargers are Level 2 or Level 3 DC fast charging stations. Some also indicate the kilowatts available and if the units are currently in use. Apps also let users monitor their vehicle’s charging status once plugged in. Users might plan routes to maximize their electric car’s available range and even reserve a spot at a charging station for a specific time and day.
Depending on the app, you can also learn the current status of nearby charging stations and know beforehand if there are any issues, like a faulty charge point or hefty fees, before planning a stop. This can save you time and money and avoid running out of charge because the station you had in mind went out of service.
That’s all fine, but it would seem best for the industry that if you see a charging station and could just pull in, tap your credit card, and go. No app needed for just charging.
Kengeo,
Interesting, I had not seen that because I don’t have a non-Tesla EV, hopefully it works well for everyone,
World October Oil Production up 302 kb/d to 81,856 kb/d
Thanks Ovi – This really highlights the fact that production should be nearly 90 mb/d if it weren’t for the 2018-2019 peak, centered peak is right at the end of 2019…
I think enough time has passed to say that the covid drop really had no impact to the lack of production growth (otherwise production would have surpassed ~85 mb/d ~12 to 18 months ago).
Kangeo
Later this afternoon, this same chart will be published with an extension to December 2025. Try your projection lines on the updated charts.
The UCCI for 3Q2023 dropped a bit (mostly because of indirect effects from outside the oil industry) but it’s still relatively high given the oil price now compared to 2013 for example. The downstream index is at a all time high and still rising and the operating index is close to a high but levelng off.
https://www.spglobal.com/commodityinsights/en/ci/research-analysis/economic-headwinds-halt-upstream-cost-inflation.html
George – That’s interesting, looking at production, my inclination is to call peak oil the 20 year period from 2008 to 2028, with the peak occurring in 2018. The upstream CCI seems to support that. There’s a ceiling at 230, hasn’t been near it since 2015. I believe this coincides with the OPEC vs. Shale drillers production standoff, it looks like both OPEC and shale are running out of steam, presumably the shale production will fall much faster than OPEC production…but who knows…
Probably a great podcast, I didn’t sign up to their list, but they confuse bottled gas with oil. 2018-2019 is still the peak. It may be surpassed but I doubt it. Those who think gas is also oil are the ones who are wrong.
[Podcast] Peak Oil is Closer Than You Think
The Permian shale oil basin is very close to peaking out. When it does, everything changes for the US and the world.
“Everyone thought 2019 was the all-time high for Energy and Oil demand and that coming back out of covid, yeah we would come back and normalize–but never at the rates we saw. 2022 set the new record. I mean you couldn’t have been wronger faster.” ~ Adam Rozencwajg.
Adam Rozencwajg, CFA, Managing Partner at Goehring & Rozencwajg (G&R), joined “Off the Cuff” Podcast with host Chris Martenson of Peak Prosperity to explore the most vital but overlooked topic of our times: Peak Oil Is Closer Than You Think.
With our models and analyses, G&R projects that the one final and last mega oil basin in the US – the Permian – is set to hit peak output in 2025. And if it does, it could set off alarm bells within the US and across the world, resulting in vastly higher oil prices. So, why do we think it is close to peak? What about the Marcellus – the monster US natural gas shale field?
We invite you to listen to this very informative interview.
I didn’t watch the video because you must join the group to watch it. I suppose they have a membership fee but I really don’t know.
Ron
The audio is available here.
https://peakprosperity.com/off-the-cuff-with-adam-rozencwajg-peak-oil-is-closer-than-you-think/?__hstc=214401352.72a2f9782ef91dfe1b6813ef32502620.1707499097338.1707499097338.1707499097338.1&__hssc=214401352.1.1707499097341&__hsfp=801461923&hsCtaTracking=3de63bbf-0e1a-4195-ae36-a1b1be5bdd47%7C83cbb7fe-47e9-4780-994d-c2cc5502363b
Listened to that podcast
But this quote from far above in the thread caught my attention:
“Oil exploration and development is a WAY more complex system with way more unknowns than temp-resistivity plots of complex materials. Full of messy economics, technology development, exploration, regulation, etc.”
Probably true. In my opinion technology development and the boundaries for its applications across more areas and nations have been moving the goal posts as of the amount of oil that is economical to exploit. So Dennis C. models have been right to adjust for a more positive outlook than what for example a bottom up analysis and a conservative approach might look like. The downside of this is that we are now married to technology to be able to exploit more oil and gas, and that a low carbon society solution is being pushed down the road. For better or for worse. It makes room for a renewable energy transition over time. Well, I think a complete transition is a wrong way to look at it. Fossil fuels enable renewables. How much renewable generation can a society running on 20% of top level fossil fuel usage facilitate? Probably a high percentage is possible depending on how you measure energy and usable energy at end point usage.
“How much renewable generation can a society running on 20% of top level fossil fuel usage facilitate?”
In some regions, much less than they currently import in the form of fossil fuels.
In other regions, much more energy than is currently currently consumed.
Other than regional differences in the resource available, the big variable is
just how hard and proactively a region works to get the job accomplished.
Of course the whole world is late to the game on this
and some place/peoples haven’t even realized that there are starting gates waiting to be entered.
I disagree, due to the coming oil scarcity we are facing, climate change is likely the tiniest of concerns in light of how short civilization will be on cheap and easy to get hydrocarbons. Even if we can stretch our imaginations and see a URR of 3,000 Gb, the 2nd 1,500 Gb is going to be much more difficult and time/energy consuming to produce than the 1st 1,500 Gb…overall amount is not the issue. Oil can only be consumed at the rate it’s produced, so there’s an upside for the climate as we have less and less oil to burn…
Kengo
You are entitled to that view, but it is still pretty hard to prove anything at all at a global level. I don’t rule out that you have some insights from where you come from. But again; I don’t see how the technology impact has not been very important and continues to be so in the future. It impacts oil, gas, coal and other mineral mining to different degrees. I have seen it where I come from at least.
I’m pretty sure those getting flooded out in California or experiencing unprecedented wildfires and heat waves in South America at the moment do not consider climate change the “tiniest of concerns”.
Kengeo,
The USGS estimated the World Conventional (non-continuous in USGS terms) Oil resource at 3000 Gb in 2000 as their best guess. So 3000 Gbfor total oil resource does not stretch the imagination at all, though a claim that the resource is as small as 2500 Gb is indeed a big stretch in my view,
OPEC+ Oil Output Books Steepest Decline Since July
Oil production by the members of the OPEC+ group fell by the most in six months in January, an S&P Global Platts survey has shown.
Cuts agreed last year and field outages in Libya contributed to a combined 340,000-bpd monthly decline in OPEC+ production, the survey revealed, with the total at 41.21 million barrels daily. Of this, OPEC output stood at 26.49 million barrels daily and its partners’ output stood at 14.72 million barrels daily.
Is this in any way true? I thought Angola was well below its quota, like Nigeria. It can only increase production with new FPSOs and the nearest one (maybe only one) in development is a couple of years away.
Here’s additional check on world peak production in November 2018. Peak occured at a near mid-point between 54% (2P+) and 66% (2P) of URR. If we assume it occurred at 60% of the URR, then the total URR is expected to be 2,200 Gb.
Peak for the world less Americas and Middle East was 2010 at ~450 Gb. Cumulative is currently ~600 Gb, about 300 Gb remaining based on mid-point. 1P = 85 Gb, 2P = 154, 2PC=303 (Rystad; 2PC matches best estimate based on mid-point)
Peak for the Middle East was 2016 at ~400 Gb. Cumulative is currently 450 Gb, about 350 Gb remaining. 1P = 107, 2P = 211, 2PC = 671 Gb (this is 321 Gb above mid-point estimate; 2PC value does not appear to be realistic).
Peak for Americas is estimated at 2017, likely to be ~370 Gb. About 300 Gb remaining. 1P = 89, 2P = 142, 2PC = 310 (Rystad; 2PC matches best estimate based on mid-point)
Total remaining estimated at 950 Gb.
For 2P, likely remaining amount is 500 Gb
URR is estimated between 2,000 and 2,450 Gb.
Based on this, a moderately conservative estimate is 2,000 Gb, an average estimate is 2,200 Gb, and a high estimate is 2,500 Gb.
Kengeo,
Note the Laherrere estimate is 3500 Gb for World C plus C URR from 2022.
https://www.sciencedirect.com/science/article/pii/S2666049022000524
Generally the estimates by Mr. Laherrere have been conservative.
Regardless of scenario above, annual decline will be 1.6 mb/d (plus/minus 0.5).
Production approaches 0 in 2045, 2055, and 2070 depending on URR.
Steeper initial decline rates may result in lower production volumes that could last longer.
Larger URRs have little effect on timeline, each 100 Gb additional URR might shift by 1-2 years only…
Whew! I’m glad that’s all settled now!
World update later this afternoon.
A new update regarding October World Oil Production has been posted.
https://peakoilbarrel.com/october-world-oil-production-continues-to-rebound/
A new Open Thread Non-Petroleum has been posted.
https://peakoilbarrel.com/open-thread-non-petroleum-feb-10-2023/