By Ovi
The EIA continues to have problems with updating its World oil production website. Consequently, this month’s report is again a shorter version of previous posts because the EIA’s International Energy Statistics update for June and July is not available. Information from other sources such as OPEC, the STEO and country specific sites such as Brazil, Norway and China are used to provide a short term outlook for future output and direction for a few of these countries and the world.
Where STEO data was used, the ratio of C + C to All Liquids was calculated. The average for the last six months up to May was used to project June and July production and in a few cases August production.
World oil production and projection charts are presented at the end of this post.
The current May International Energy Statistics has been updated to correct for the missing condensate production in the previous Russian file and is used for this report.
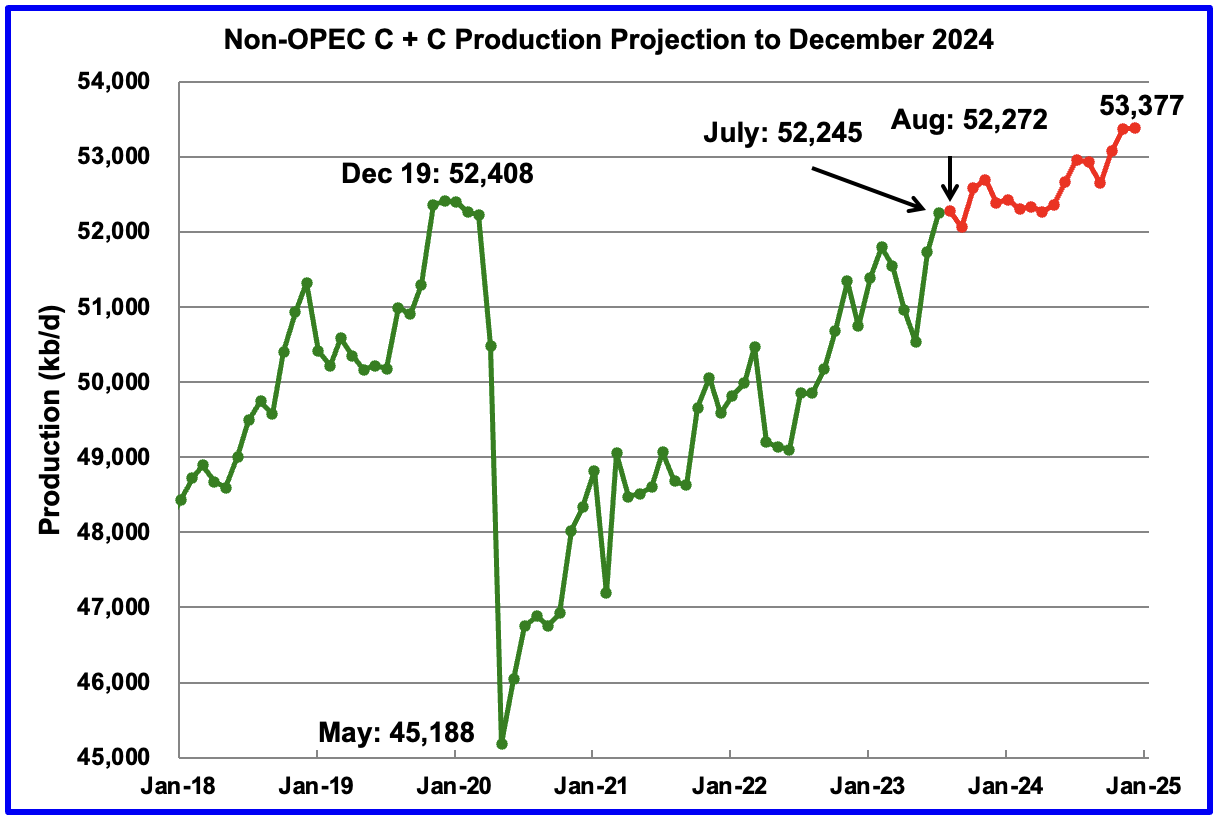
July Non-OPEC oil production increased by 520 kb/d to 52,245 kb/d and is up 1,706 kb/d from May. Close to 500 kb/d of the June increase is related to the EIA’s condensate correction for Russia in the EIA’s updated May International Energy Statistics. In the previous EIA May report, Russian condensate was not included in Russian production.
Using production data from the November 2023 STEO and the updated May EIA International Energy Statistics, a projection for Non-OPEC oil output was made for the period August 2023 to December 2024. (Red graph). Output is expected to reach 53,377 kb/d in December 2024, which is 969 kb/d higher than the December 2019 peak of 52,408 kb/d. August production is expected to increase by 27 kb/d.
From August 2023 to December 2024, oil production in Non-OPEC countries is expected to increase by 1,105. Note that production is expected to be relatively flat till May 2024.
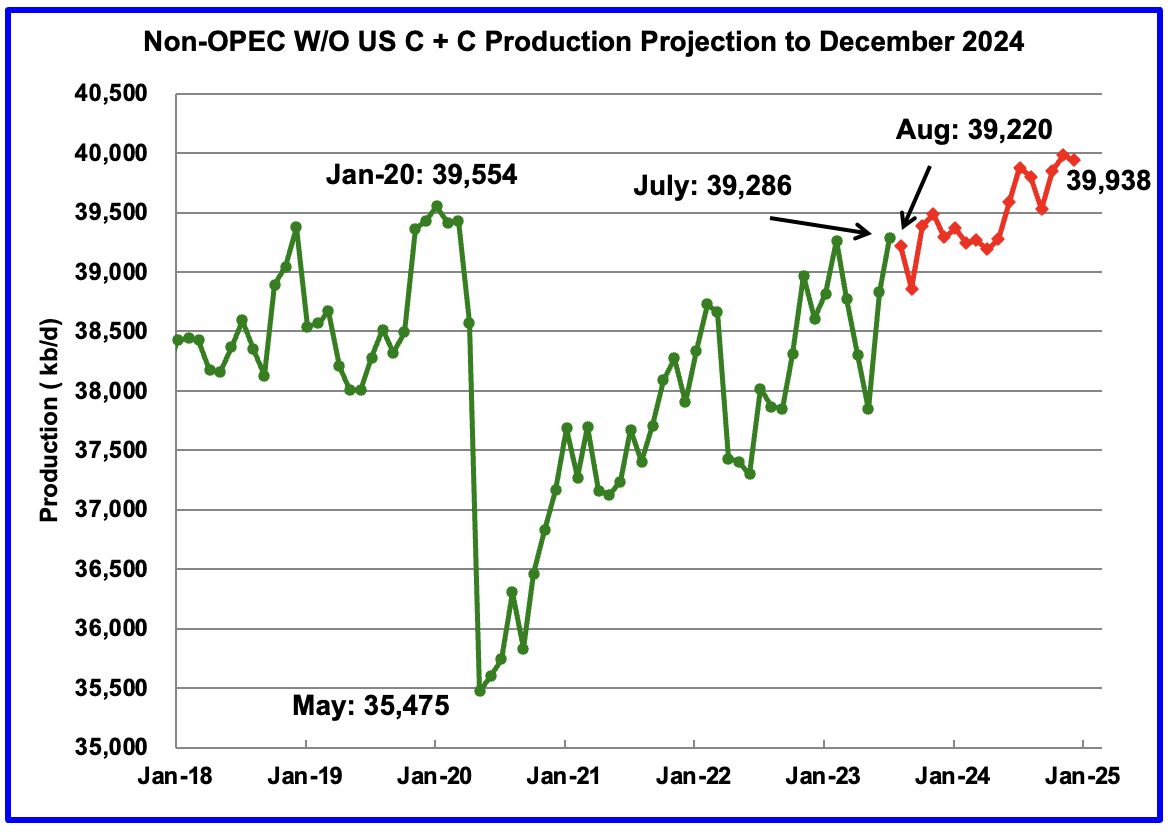
July Non-OPEC W/O US production increased by 455 kb/d to 39,286 kb/d.
August Non-OPEC W/O US production, using the same method described above, is projected to drop by 66 kb/d to 39,220 kb/d. From August 2023 to December 2024, production in Non-OPEC countries W/O the US is expected to increase by 718 kb/d.
Note that December 2024 output exceeds the pre-covid high of 39,554 kb/d in January 2020 by 384 kb/d.
Non-OPEC Oil Production Charts
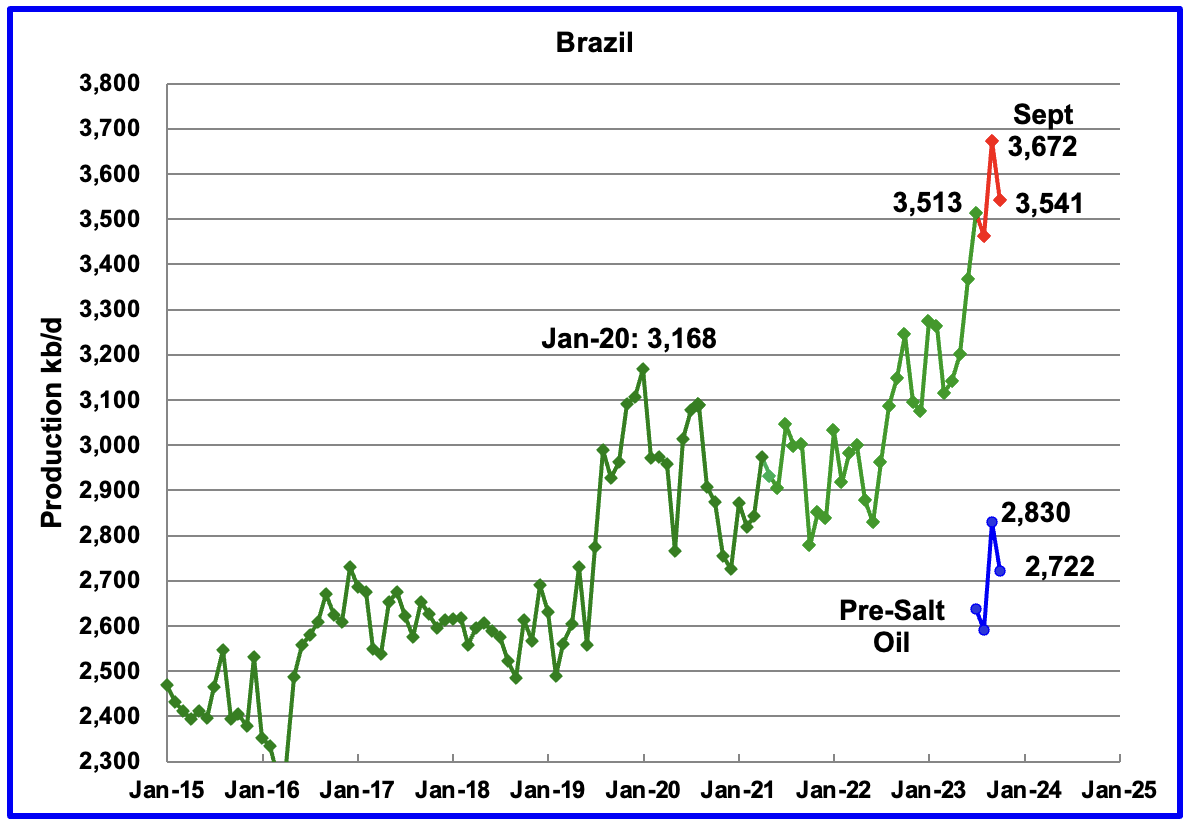
Brazil’s National Petroleum Association (BNPA) reported that output in September increased while it dropped in October. September increased by 210 kb/d to 3,672 kb/d mainly due to ramp-ups at four offshore platforms and less maintenance, red markers. October production dropped by 131 kb/d to 3,541 kb/d.
Production from the off-shore “pre-salt” region has been added to the Brazil chart, blue markers. October production dropped by 108 kb/d, which accounts for most of the 131 kb/d overall decrease in Brazil’s October output.
According to this source: “Much of Brazil’s oil comes from its ‘pre-salt’ region, where 11.5 billion barrels of proven crude deposits sit under a thick crust of sodium chloride, beneath the ocean floor. These deposits lie around 200km from Rio de Janeiro and were discovered during da Silva’s first term in office in 2006. Petrobras now plans to develop 11 more platforms in the waters by 2027. However, output from the region is expected to peak by 2029, meaning many are questioning the long-term potential for oil production in Brazil.”
According to this source, “Petrobras approved a strategic plan for 2024-2028. E&P CAPEX for the 2024-2028 period totals US$ 73 billion, with around 67% allocated to the pre-salt, which has a major economic and environmental competitive advantage, with the production of better quality oil and lower emissions of greenhouse gases. The projected production profile out to 2028 is shown below.
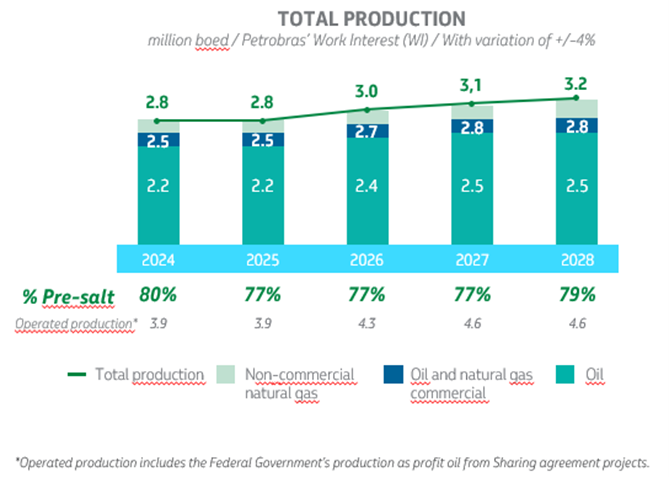
The production curve considers the entry of 14 new platforms (FPSOs) in the 2024-2028 period, 10 of which have already been contracted. A new generation of platforms is being built, more modern, more technological, more efficient and with lower emissions.
The projections for oil production, total production and commercial production of oil and natural gas for 2024 have been increased by approximately 100,000 bpd/boed compared to the previous plan, considering the good performance of the fields, the forecasts for ramp-ups and the entry of new wells.”
Comparing this chart with the current pre-salt production shown in the Brazil chart of say roughly 2,775 kb/d, production will not increase over the next two years. Starting in 2026, output will increase by 100 kb/d/yr.
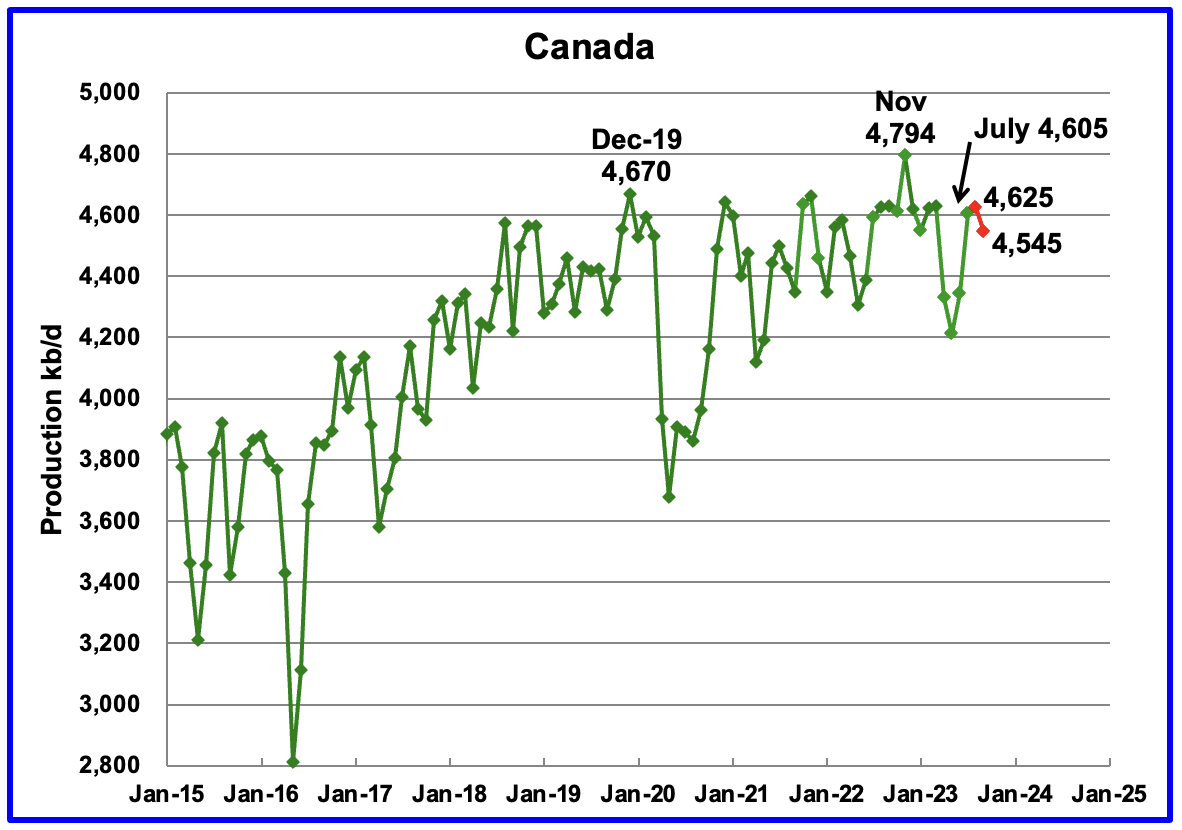
According to the EIA’s STEO, Canada’s production increased by 260 kb/d in July to 4,605 kb/d.
The STEO is forecasting that Canadian production rose slightly in August before dropping by 80 kb/d to 4,545 kb/d in September due to fires in Alberta this summer.
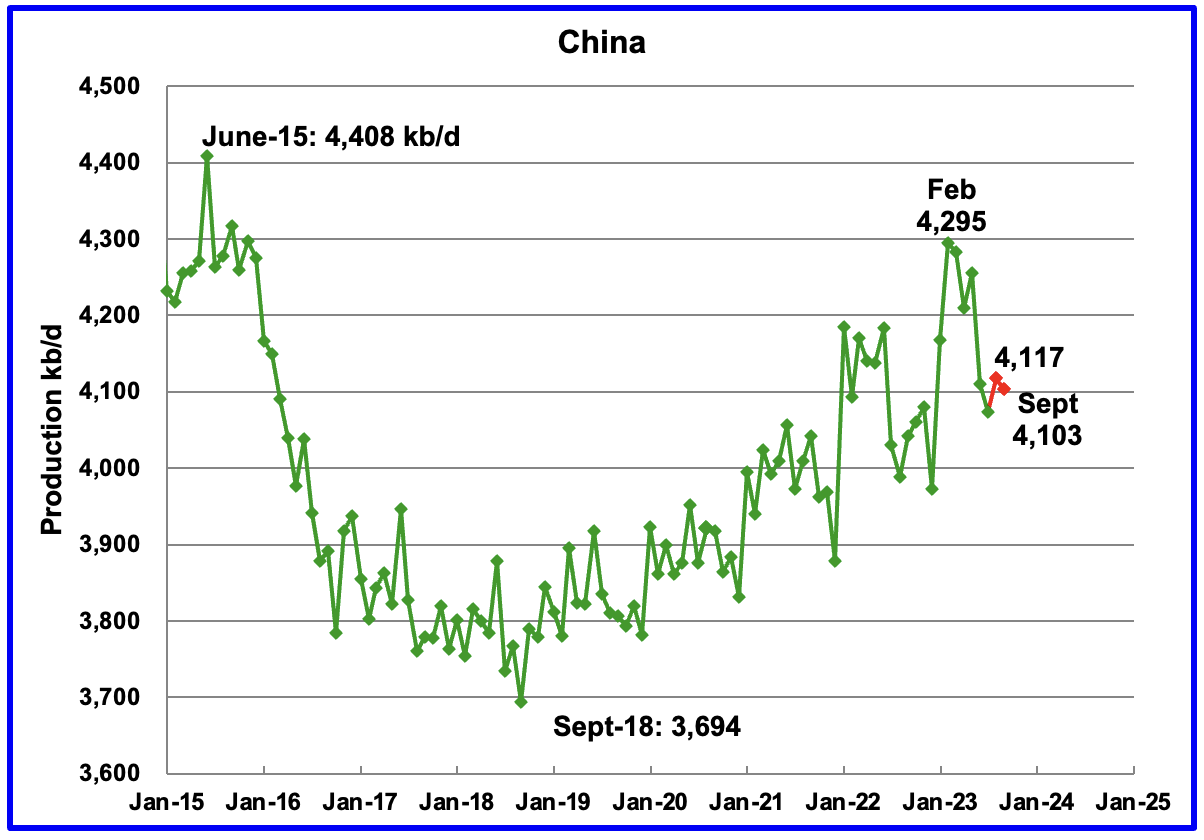
The China National Bureau of Statistics reported that production in August rose by 44 kb/d to 4,117 kb/d. Output dropped in September to 4,103 kb/d.
Every January for the last four years, China’s production has taken a massive increase. In 2022 production jumped by 322 kb/d from December 2021 to February 2022. However according to the November MOMR: For 2024, Chinese liquids production is expected to remain steady at the 2023 level of 4.6 m/d.
While China’s production growth has risen steady since 2018, it may be approaching its post pandemic high, as inferred by the November MOMR.
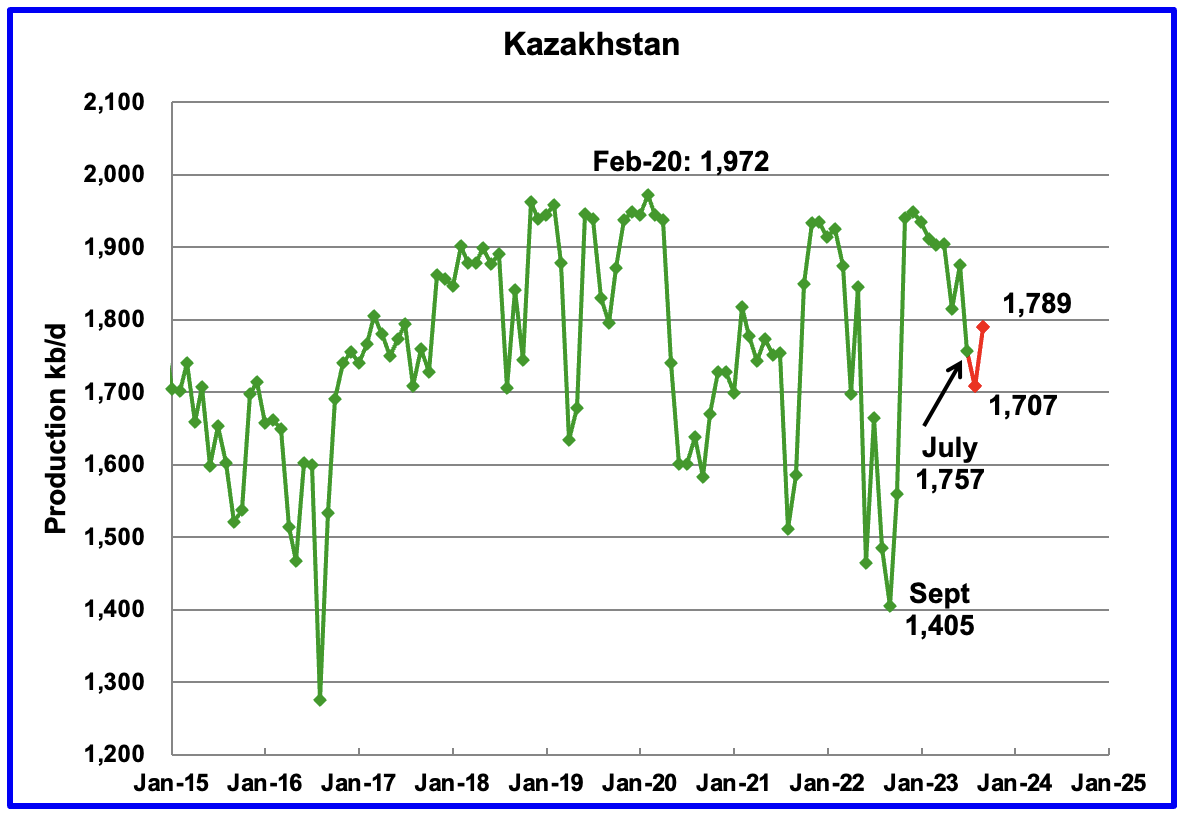
According to the STEO, Kazakhstan’s output decreased by 119 kb/d in July to 1,757 kb/d.
The STEO is forecasting a production drop in August to 1,707 kb/d and a rebound to 1,789 in September.
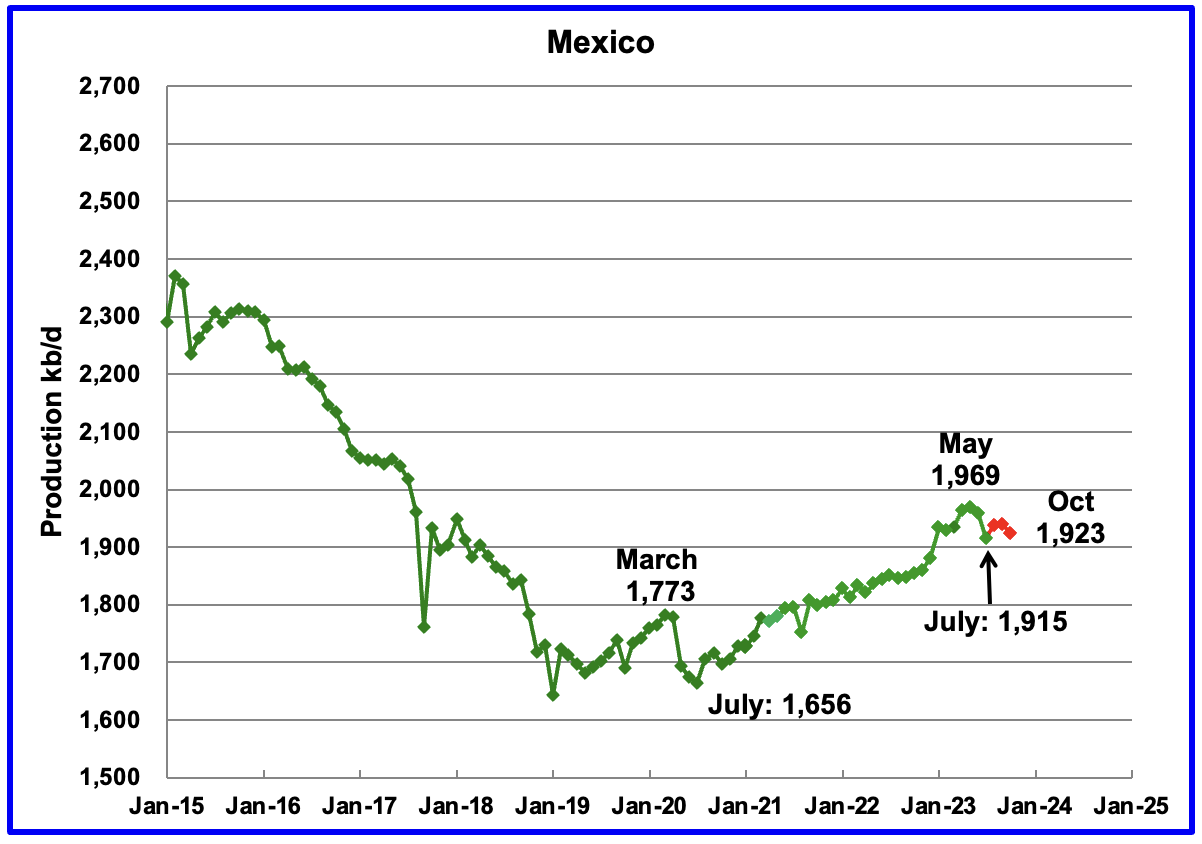
Mexico’s production in July was 1,915 kb/d a decrease of 44 kb/d from June’s 1,959 kb/d.
According to Pemex, Mexico’s oil production from August to October was relatively flat. October output was 1,923 kb/d, 8 kb/d higher than July.
Mexico has recently revised its definition of condensate. This has resulted in the EIA adding an extra 60 kb/d, on average, to the Pemex report. The red markers include the additional 60 kb/d.
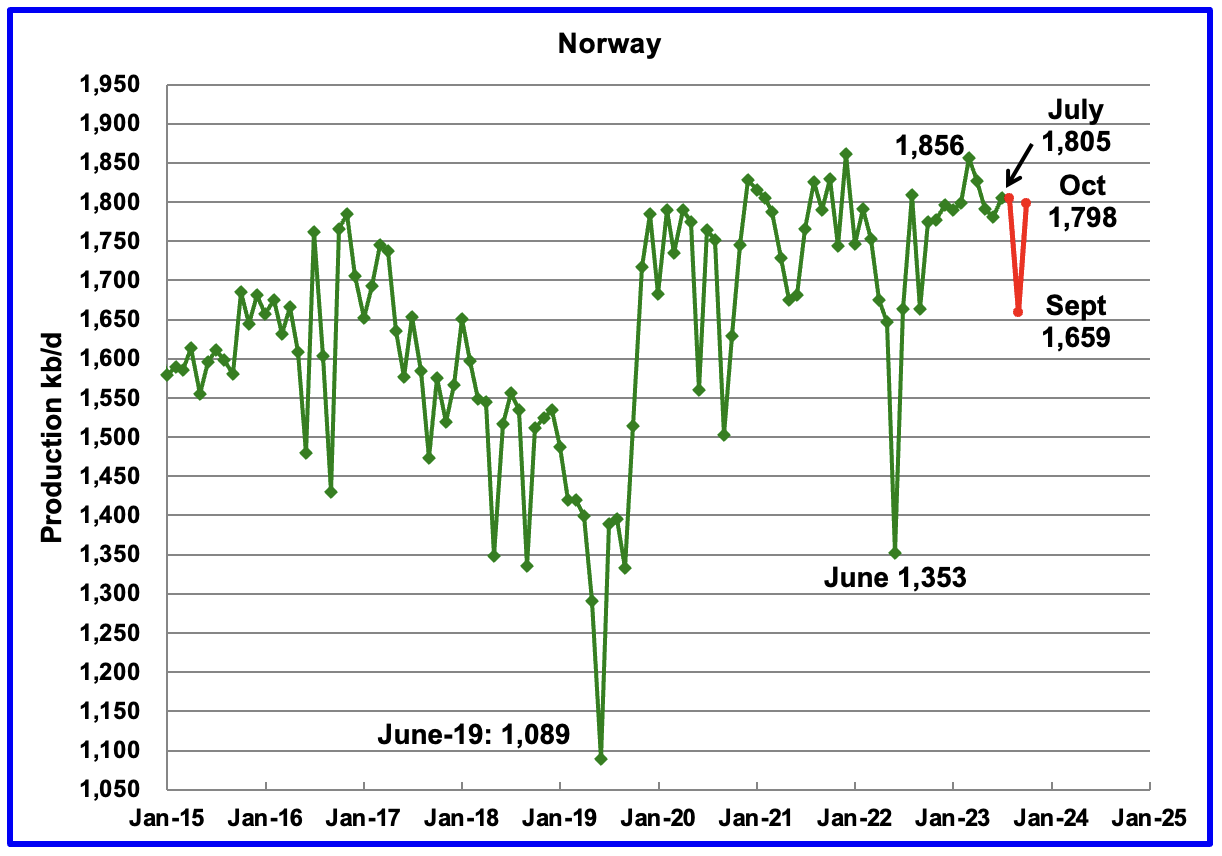
The Norway’s Petroleum Directorate (NPD) reported that August’s production was unchanged at 1,805 kb/d and then dropped to 1,659 kb/d in September. (Red markers). According to the November MOMR, production dropped due to unplanned shutdowns and equipment failure on a number of platforms. October output rebounded to 1,798 kb/d.
According to the NPD: “Oil production in October was 3.7 percent lower than the NPD’s forecast and 0.7 percent lower than the forecast so far this year.”
The recent production high of 1,856 kb/d appears to be close to Norway’s post Covid production peak.
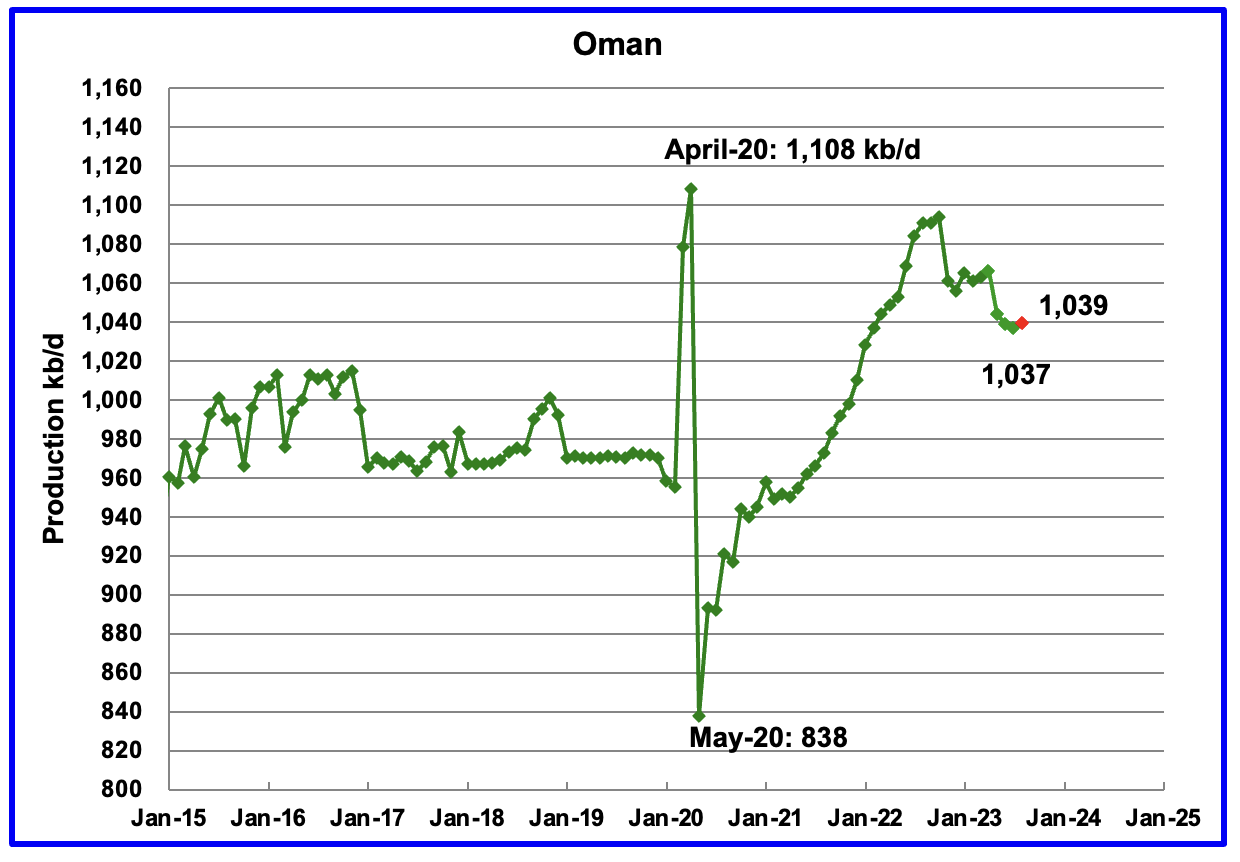
Oman’s production rose very consistently since the low of May 2020. However production began to drop in October 2022. According to the November STEO, Oman’s July’s output dropped by 2 kb/d to 1,037. The STEO projects that production will recover to 1,039 kb/d in August.
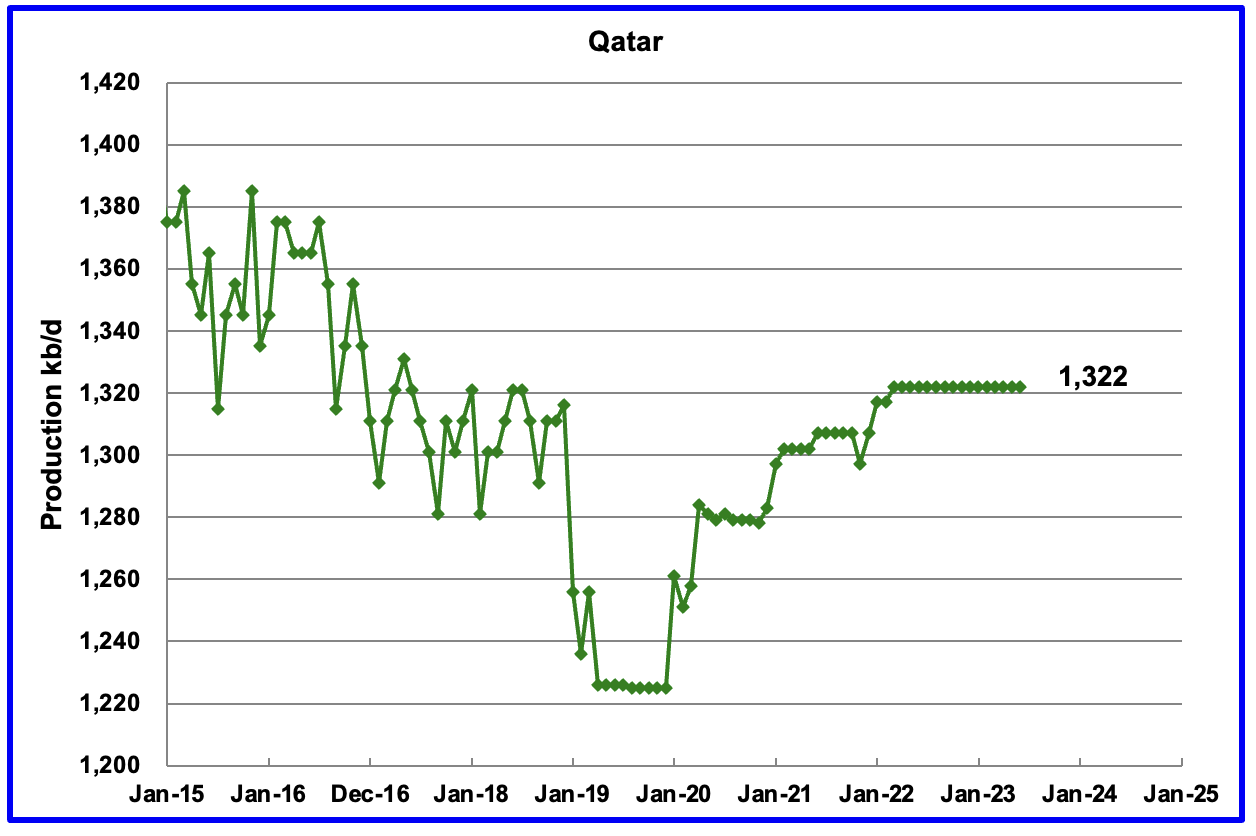
Qatar’s July’s output was unchanged at 1,322 kb/d, possibly due to lack of updated information.
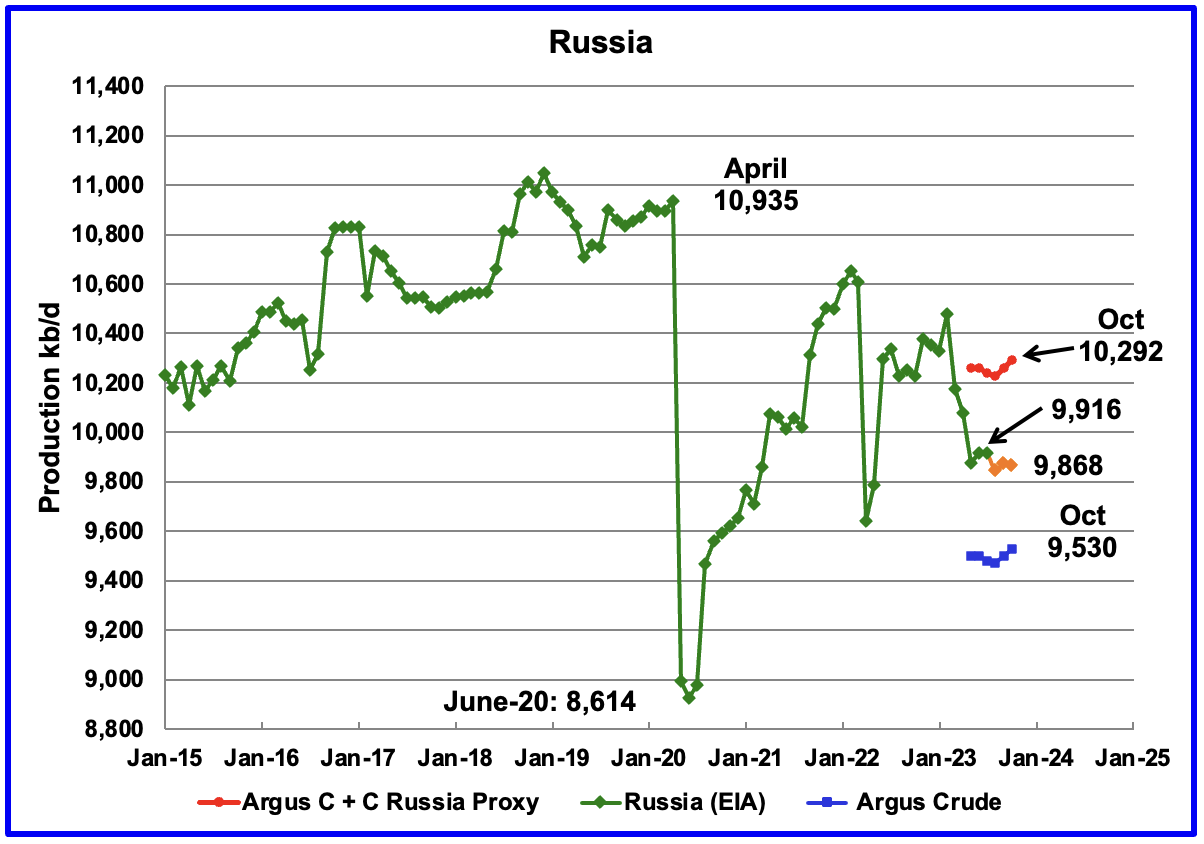
The EIA’s November STEO report was used to project Russian output from August to October by reducing the all liquids output by 0.9339 to estimate the C + C production. The 0.9339 has not varied much from the pre-war average of Russia Ministry production to the STEO all liquids production from October 2020 to September 2021. October production was 9,868 kb/d a decrease of 5 kb/d from September, orange markers.
Using data from previous Argus Media reports, Russian production is presented from May to October. For October, Argus reported that Russian crude production was 9,530 kb/d, an increase of 30 kb/d, blue markers. Adding 8% to Argus’ October crude provides a projected C + C production of 10,292 kb/d, which is a proxy for the Pre-War Russian Ministry estimate, red markers.
Comparing the Argus crude data with the latest STEO projection indicates that the STEO estimate for Russian C + C is midway between the Argus estimates for Crude and C + C. Prior to the war, the Russian Ministry estimate was alway 404 kb/d higher than the EIA estimate for C + C. The current October Russia Proxy output is 424 kb/d higher that the EIA’s STEO estimate, just 20 kb/d higher than in the past.
The November IEA OMR agrees that Russian crude production in October was close to 9,530 kb/d.
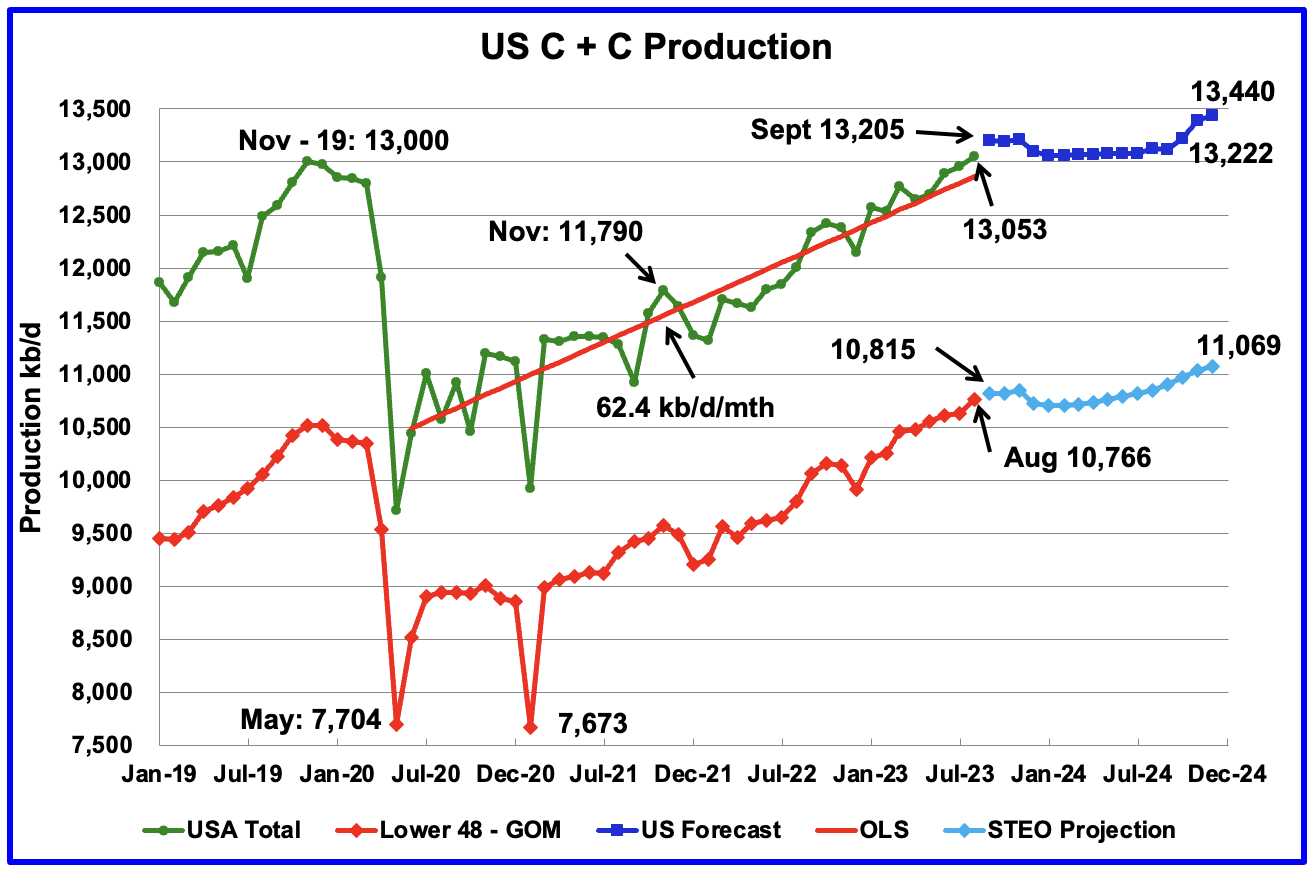
U.S. August oil production increased by 94 kb/d to 13,053kb/d, a new record high by 53 kb/d over November 2019. The increase was primarily due to increases in Texas, New Mexico and North Dakota.
The dark blue graph, taken from the November 2023 STEO, is the forecast for U.S. oil production from September 2023 to December 2024. Output for December 2024 is expected to be 13,440 kb/d which is 440 kb/d higher than the November 2019 peak of 13,000 kb/d.
The critical thing to note in this updated chart is that production is essentially flat out to October 2024 when production reaches 13,222 kb/d. Is this due to production plateauing in the Permian basin?
The light blue graph is the STEO projection for output to December 2024 for the Onshore L48.
World Oil Production Projection
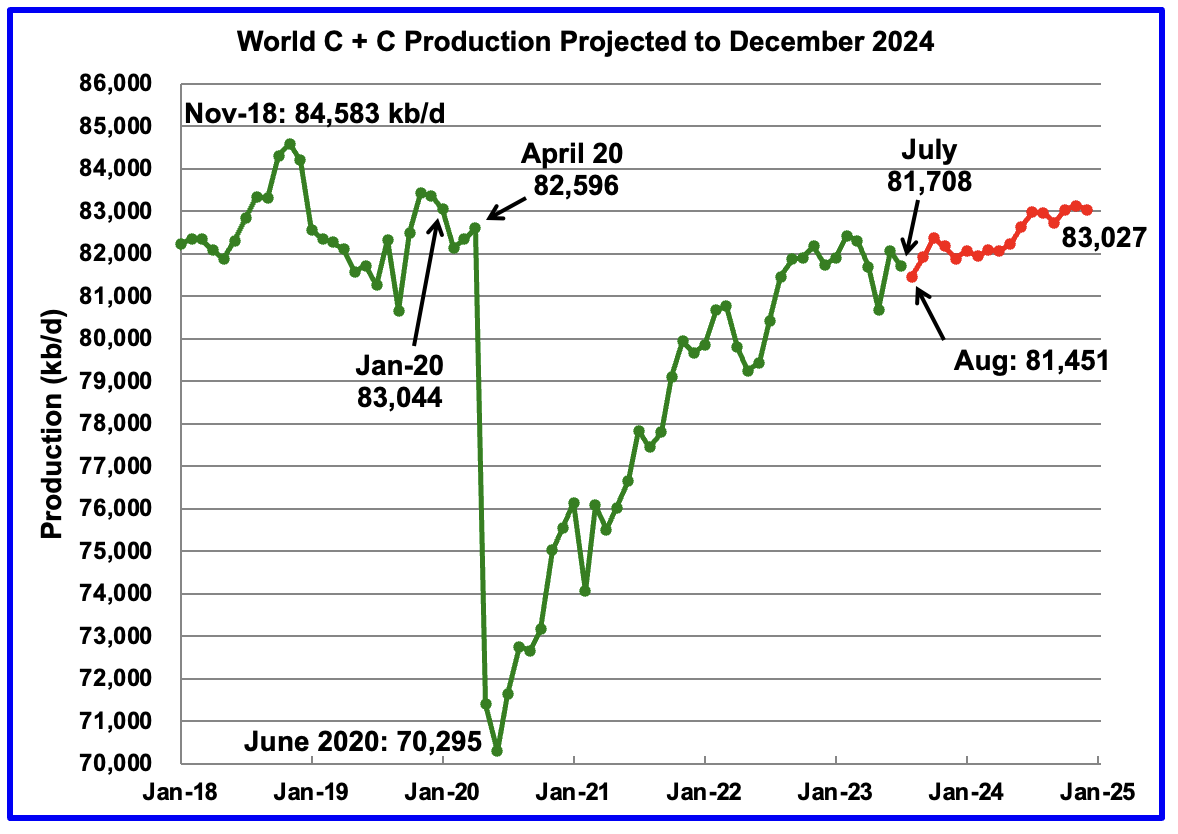
World oil production in July, according to the STEO, decreased by 207 kb/d to 81,708 kb/d.(Green graph).
This chart also projects World C + C production out to December 2024. It uses the November 2023 STEO report along with the updated May International Energy Statistics to make the projection. (Red markers).
The red graph forecasts that World crude production in December 2024 will be 83,027 kb/d and is 1,556 kb/d lower than the November 2018 peak. Note that it is not known how much of the decrease is due to OPEC + reducing their voluntary production cuts. Note that Saudi Arabia reduced its output by 1 Mb/d in July. Currently the OPEC + voluntary production cuts are in the 3,000 kb/d range.
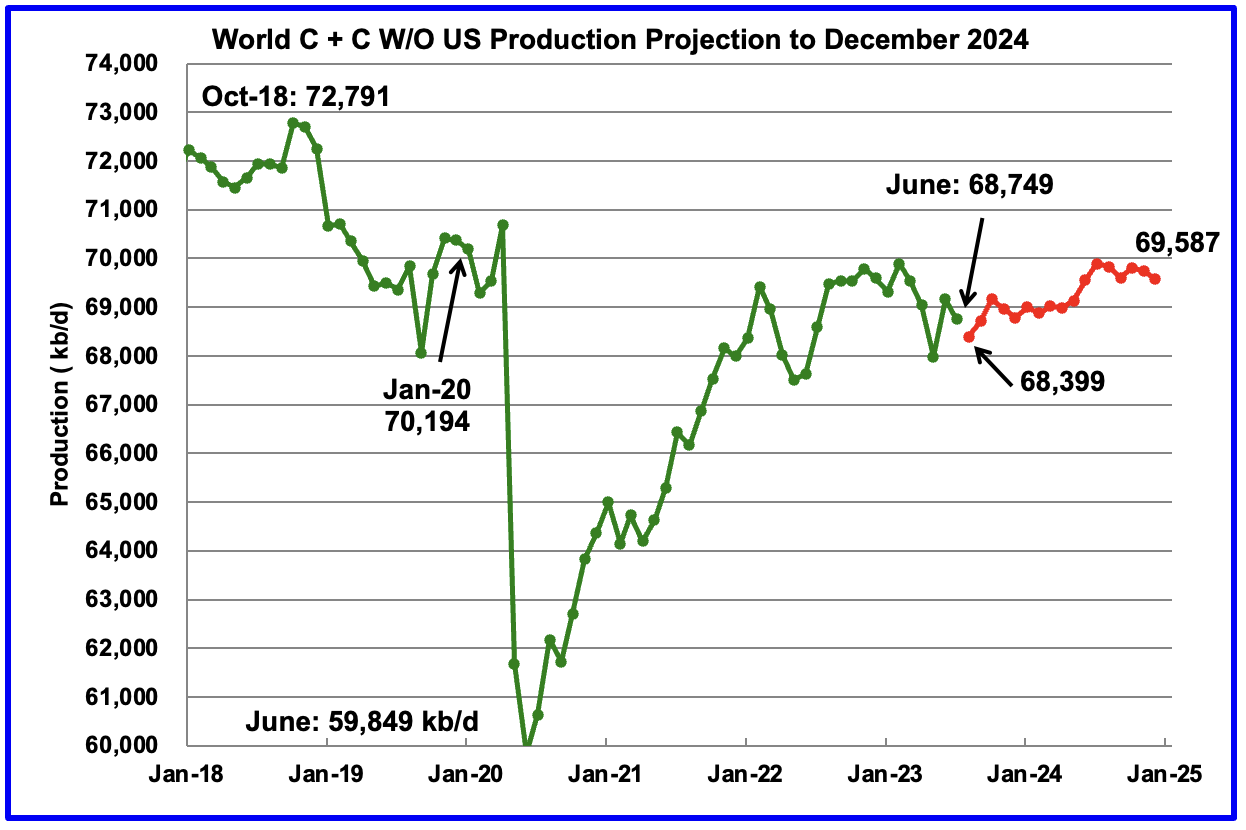
World without the US oil output in July decreased by 419 kb/d to 68,749 kb/d. August’s output is expected to drop by 350 kb/d to 68,399 kb/d. December 2024 output of 69,587 kb/d is 3,204 kb/d lower than October 2018 output of 72,791 kb/d.
169 responses to “July Non-OPEC and World Oil Production”
Very nice Ovi. Thank you. The crude gets lighter and lighter with more and more condensate. Ok for gasoline, but not so good for diesel or jet fuel.
C185 Pilot,
That may be true in the US, but for the World as a whole oil is getting heavier on average, the 8 Mb/d of tight oil produced in the US represents about 10% of World C plus C output (8 of 80 Mb/d), the other 70 Mb/d probably has an average API gravity around 33 degrees.
see
https://www.iea.org/data-and-statistics/charts/global-refined-product-barrel-vs-crude-barrel-api-gravity
or
https://www.opec.org/opec_web/en/press_room/1026.htm
also see
https://pubs.usgs.gov/of/1983/0728/report.pdf
C185 Pilot
Thanks.
In Canada our oil has gotten heavier time. Our main export is Western Canadian Select which is exported to US refineries to make gasoline and diesel. We also export a synthetic crude oil which is biased to making diesel and jet fuel.
For me, the most interesting chart above is the US chart showing a dramatic slowing in US production going forward into 2024. Is this signalling that US production is heading for a plateau in possibly 2025?
Ovi,
Looking at both current STEO and most recent AEO reference case, that sounds about right if both of these scenarios of the future are roughly correct.
Test
Things starting to look bleak long term for Russia.
Interfax
https://interfax.com/newsroom/top-stories/96704/
“The share of Russia’s oil production from hard-to-recover reserves is currently around 30% of total output, or 166 million tonnes, and the figure could rise to 70% by 2050 […] oil production from hard-to-recover reserves is unprofitable from a taxation point of view.”
Global oil production at new high. 2018 no longer peak!
Back in the Oil Drum days around 2008-2010 several people were so sure global oil production would be at least 5 million barrels a day less in 2020 than in 2010.
IEA predictions were rubbished. IEA prediction of tight oil has proved correct.
https://iea.blob.core.windows.net/assets/6ff5beb7-a9f9-489f-9d71-fd221b88c66e/Oil2023.pdf
IEA predicts gasoline demand peaking in next couple of years but total oil demand will increase until 2028 mainly driven by new technology using oil to produce chemical feedstocks.
“2018 no longer peak!”
LOL good try.
Is the problem reading comprehension?
I guess Charles is in charge
Paul
We all know your useless predictions you made over so many years.
Shall i find a few?
Horseshoes and hand grenades.
Sure, let’s take a close look at this, based on the premise that crude oil is the result of millions of years of decomposition and migration to concentrated pockets. Now here we are in the narrow span of the oil age, where in under a couple of centuries, humans can essentially erase any reserve surplus. A few years here and there in getting a prediction correct doesn’t really matter, or does it? I guess it matters to those who want to continue the charade of an oil cornucopia.
Charles,
The early estimates were low based on a low URR of about 2000 Gb initially.
Paul does very nice work. The Oil Shock Model framework I use is based on Paul’s work using updated URR assessments and a longer data set.
My initial attempt to use Paul’s work can be found at link below (from July 20, 2012).
http://oilpeakclimate.blogspot.com/2012/07/an-early-scenario-for-world-crude-oil.html
No, Paul is “spot-on” while you Charles, are still a self-lauding idiot. November 2018 is the all-time peak.
Mr Charles, a prediction is something prophets do. A projection is understood to be a work of abstraction. Dennis consistently puts in the caveat that he will be wrong as do many folks here working with variable data. Your urge to personalize and denigrate him subordinates any impression the topic matters to you as much as it provides a vehicle to cut others down.
World production seem relatively plateaued, but more and more oil goes into extracting oil due to worse eroi. So less oil available for the world to put to use, and we can see the result of this. Tougher economic times for a lot of people now, compared to 10-20 years ago. Am I correct?
Much tougher. Been drilling oil wells for 40 years. Sold oil at $15/barrel and gas at $2 in the late 80’s and survived. Made money and grew the company from 2007 to 2014 when oil averaged more than $100/barrel and gas was usually better than $5. Today it’s as tough as it’s ever been. Oil’s at $75 but gas is less than $2 when you account for basis (charges due to geography). There are three big factors: 1) Inflation. We’ve had to raise wages big time just to get people to show up…let alone work. Worse than wages are the steel products–which is everything we use. Tubular prices have doubled. Pickup truck prices are nuts. If you just look at the rate of inflation today’s $75 oil is like $60 oil three years ago…but in reality my breakeven price has climbed a lot faster than the rate of inflation. We’re holding on at $75 oil; 2) Crazy regulations. What’s coming out of the feds and state governments is designed to drive up our costs and put us out of business–its not designed to accomplish sensible environmental goals. I could write a book on that one…or you could just look at the stack of regulations…which are thicker than books; and 3) it’s damn tough to find good property worth drilling. When I started a sweet little well would give back a couple thousand barrels in the first year. Now its considered good around here if you get 1000 barrels in the first year. And to get that we’re drilling wells in tougher locations and using more sand and water. I guess that is your higher EROI, because we’re burning more diesel fuel and hauling in more stuff to make a go of it. I don’t know anyone in the industry that is out there smiling and feeling relaxed about $75 oil.
PA Oil. I hear ya. Been saying the same thing.
Shallow sand and PAOil,
Thanks for the info, sounds like $75/bo is the current limit for PA oil, but I thought Shallow Sand had said recently that he can make due with $50/b. I probably have that wrong as Shallow sand says he has said the same as PAOil, I may not be remembering correctly.
Dennis, we could maintain production and cut costs. 1) drill fewer wells and abandon growth; 2) ignore well plugging and leave it for the next generation; 3) cut benefits; 4) don’t replace trucks, rigs, bulldozers and excavators. Or we could actually make money by terminating drilling and laying off 1/2 the staff–over the next 10 years depletion would cut our production by half, but it would be a fat & happy 10 years. But neither of those options are the way a guy wants to run a business. What I’m saying is there is no joy in the patch. Our little patch only makes enough oil/gas to power the USA for 1/4 of a day–but I know everyone in the patch; ALL of us are seeing the same “end of rope” signs.
Thanks PAOil,
If I am understanding you correctly, $75/b is barely enough for reserve replacement. Is most of your patch older folks as Shallow sand has said is the case where he is? I would think at some point resource depletion will lead to an end of oil production in many places in the US eventually.
Yes Dennis, 50 years old +. Consequently, there are a lot of old folks who would like to sell. But not many buyers…including me, as I just turned down another deal last week (although I’m old too!). As far as my reserves: at $75 oil I find myself drilling exclusively in my proven areas, growing production 0 to 5% per year. Even $95 oil isn’t going to spark my interest in my unproven acreage, because most everything in the patch has been drilled and, therefore, it’s unproven for a reason (meaning it’s likely a poor area). As far as purchasing more acreage…I’m just not interested. 1) what moron would buy in this over-regulated ESG environment; 2) my business isn’t generating the cash flow to justify it; 3) mostly what’s left are unproven properties or proven parcels that are mostly drilled; and 4) during the good years I built up a nice inventory of undrilled proven acreage–enough to keep me amused anyhow. There are other risks we should be taking such as horizontal, gas and water flooding, and more complicated frac designs. But the low price and regulatory hurdles completely dampen any such enthusiasms. Interestingly, as I look at debt ratio and other data from shale producers, I think my company is equal to or better off on a per barrel basis.
Dennis.
Recall we haven’t drilled and completed a well since the fall of 2014.
We have low decline production, but after 9 years it has declined.
I don’t see us drilling another well, unless prices skyrocket over $100 sustained and someone in the next generation gets interested.
So the $50 is to just keep the current wells pumping. As of now anyway.
shallow sand,
thanks for the clarification.
Most interesting. I have a somewhat strange proposal to produce oil for a good deal less than $75/bbl that I would like to talk to you about. Trying to think of how to send you my email address.
There is a Wikipedia page about me, but I am also a Wiki editor https://en.wikipedia.org/wiki/User:Hkhenson has my email and phone number.
Keith Henson
Keith, Ever consider doing a Wiki page on the Oil Shock Model? Dennis and I can’t add it because of Wikipedia nepotism rules. Should not be hard for a neutral party to get it approved by the editors. The precedent is that the Export Land Model has its own Wikipedia page, in spite of the fact that it’s not peer-reviewed published and is not even much of a model, more of a tautological observation.
https://en.wikipedia.org/wiki/Export_Land_Model
When it comes to labor costs in the drilling industries I suspect that within 5 years its going to get much tougher. This is because of new competition for the drilling services in the soon to emerge deep geothermal sector.
I put the chance of viability of this sector as very high given the recent progress of development.
If you are unfamiliar with the goings on I offer up a link to the foremost company in the field, and an interesting 47 minute podcast interviewing Tim Latimer- Co-founder and CEO of Fervo Energy
https://www.energypolicy.columbia.edu/harnessing-the-heat-beneath-our-feet/
https://fervoenergy.com/
I suspect that baseload energy will come of this…at scale.
Conventional
Conventional peaked in 2016
Maybe if you read the report which is researched by many knowledgeable people with access to the best data you may learn something.
2018 it no longer peak
Charles,
The total liquids number includes quite a bit of natural gas liquids. The important number is crude plus condensate which peaked in 2018 and so far has not been surpassed. It used to be that we could get decent data on World C plus C output from the EIA, but lately they have been doing a very poor job with timely international data.
In my view this is less about politics and more about poor leadership at the EIA, though I suppose one could argue that the choice of Agency leaders comes down to politics.
“people with access to the best data”
… that money can buy. Which is part of the problem for an information-driven society. Readers are required to believe in sources that may be working on their own agenda.
If it gets form, it can be adjusted. That is why the rich buy paintings.
The Trump administration deliberately sabotaged many executive agencies, including the Dept of Energy. Information is power so the EIA is a threat to the Republican party, which is owned by pro-FF contributors.
Thanks Ovi,
Maybe everyone can write to the US DOE and ask nicely for some competence.
https://www.energy.gov/contact-us
or the EIA general contact website
https://www.eia.gov/about/contact/
or to a top administrator
https://www.eia.gov/about/senior_executive_bios.php
Looking at the bios the person linked below seems to have primary responsibility for the servers and other information technology systems.
https://www.eia.gov/about/michael_corriere.php
The guy at the top was appointed in May 2022, it seems that under his leadership things have fallen apart at the EIA.
Things have gotten very political at the EIA, as you are aware. They are barely worth paying attention to.
I appreciate your highlighting the importance of the pre-salt oil. To emphasize positives and negatives, the pre-salt oil has been protected for a very long time, and it is pristine–almost no toxins and just the right gravity. The field off Brazil resulted from a rift from Africa, to which accrued the smaller piece of pre-salt.
Now this. To get to the pre-salt oil you have to go through over a mile of water, then over a mile of hard rock, at least a mile of salt, and then, finally, you’re in the pre-salt oil. The biggest problem is the mile-thick layer of salt. This is not Morton’s. The crystals are soft and the composition changes. Salt creep occurs (just like the salt creep now forming on the walls of the caverns of the Strategic Petroleum Reserve).
There is an immense amount of pre-salt oil down there, but to really make it buzz the price of oil is going to have to double where it is now. Or close. I mean, we’re taking about drilling over three miles down, with the lowest level being a mile-thick layer of complex salts that turn into something akin to talcum powder. I personally think we will get to the point where we rely heavily on the pre-salt oil–it’s almost as good as Malysian Tapis. But the price is going to have to go much higher than it is now, no matter what Petrobras says.
I’ll bet George Kaplan, Mike Shellman, or Coffeeguyzz know a lot about pre-salt. I would like to learn more about it. I understand that there’s NO sulfur in it.
Gerry,
This doesnt make sense to me. If the EROI is too low or even negative, its not thermodynamically justifiable. It would mean catabolysis of some sort, using natgas or nuclear to power the equipment to pump, transport and refine it. That would create serious strain on those other energy sources. I would imagine the price doubling would mean nothing if energy scarcity induced inflation raises the cost of everything else. I think we’re fooked.
That’s the reason I was glad to see Ovi comment on the pre-salt oil. It is a bitch to get down there in the Santos Basin, where the ocean water is over a mile, the hard rock is likewise over a mile thick, and then the salt layer is even thicker. But once you’ve hit, you’ve really got something. Like all basins, there are wells that are mediocre and others that are fantastic–but even averaged out the IP is close to 30,000 b/d. One of these wells has been producing since 2009 and has produced something like 70 million barrels of oil and is still going strong. That’s clearly an exception but the point is, there’s quite a bit of pre-salt oil in the world, it is mostly of superior gravity and quality, and while the wells cost a ton to drill, it’s likely going to be the last frontier. To tell you the truth I didn’t know much about these wells until Coffeeguyzz came on and mentioned them, and then I began researching them. Back when Brazil was hooked onto Africa, there was a massive pre-salt deposit. It is my understanding that Brazil came out ahead in that rift. Listening to what these guys are saying about the old conventional fields, the futility of going after unproven acreage in this price environment, the relative watering and gassing out of some of the shale wells, the rarity of offshore Guyana, I just figure we’re going to get down to the pre-salt, and at some point it’s going to bring one heck of a premium. Every technology is going to be thrown at this. If this peak oil site has validity–and I think it does–then the end of nigh (a lot of what is being called oil isn’t). And believe me, when that occurs, there’s going to be a global panic attack. I could be overreacting, but I can attest along with these other fellows how conventional drilling costs have skyrocketed in the last three years. I committed to four new wells, and then this inflationary cycle hit and the Permian guys decided they didn’t give a damn about either oil or gas gluts, so I’m just hoping we can slow this down long enough to reach an equilibrium. But yeah, in the end, I am personally becoming convinced that pre-salt oil will be the talk of the town. And it’s real oil.
Gerry,
I just did some reading on presalt. It looks promising for Brazil’s sake. It doesnt look like a stick save for the rest of the world. The Brazilians were ambitious and stated years back they wanted to reach 5mil bbl a day in production by now but havent. Theyve been slow in their expansion, which in the long run is a good thing for them.
Shale cant and wont survive these increased costs. Imo, its more like an intuitive feeling, all of this inflation or difficulties shale drillers are facing are indicative of thermodynamic collapse. Mike has been saying the best and most prolific shale wells havent been profitable and the core areas are exhausted. Whats left cant be drilled at any cost because the physics, which is true economics, just doesnt work. When US shale begins to make some waves with dramatic declines in the next year or two (I believe in a few months) it will send a message to exporters to hold on to their oil.
I’m pesimistic about oil production. Massive synchronized worldwide declines are coming relatively soon.
The megacontinent 600 million years ago is now called Gondwana. Due to low sea levels and sedimentation a very thick (6,000 feet thick) salt layer formed. Then, at a certain point, seafloor spreading occurred (the natural way that tectonic plates behave). If you take S. America and Africa, their boundaries fit hand in glove, so it would appear that a giant rifting occurred between the American and African tectonic plates. The area near the boundary was horst and graben, and as the massive rift took place, the captive pre-salt oil went with the earthern “capsules,” resulting in giant deposits under the continental shelves of S. America and Africa near Uganda.
Salt–especially complex salt–is an excellent container for oil. This salt is 6,000 feet thick! Still, over time some of this oil seeped through to become post-salt oil–or maybe it came from source rock between the pre- and post-salt. That post-salt oil was discovered first. It wasn’t until some time later that someone got up the nerve and the money to go through the salt (those wells can cost $300 million). And because that salt forms creep, any drilling fluid would change the composition of the salt, closing the drillbore. This was a process that has only lately become somewhat refined.
I’m not turning into a nut-job for pre-salt oil, but it is little more than a guessing game to perform gravity and seismo studies to find the “whale” pre-salt collections off Brazil. And there is a similar horst/graben complex–the other half–off the continental shelf of Africa. I’m not trying to make this into something it may not be, but I seriously doubt that anyone knows for sure how much pre-salt oil there is, lurking beneath the salt.
As the global oil supply tightens up (and we are already down to not-real-oil with a gravity close to 50, as well as very sour, toxin-laden oil in places), and as competition for the highest quality oil becomes fierce, it is likely to be pre-salt oil that emerges as a collector’s item. The Guyana oil is very gassy. The pre-salt oil is pristine, from the pre-Cambrian age. It is the closest thing we have to Tapis, the very scarce Gold Standard. This is all I know about pre-salt; it the nothing more than the musings of a dreamer. If I try to go any further I will embarrass myself. I would like for a true expert to weigh in and educate us.
Rarely, on this site, a person comes in with a lifetime of knowledge and experience and writes something that is mind-blowing. That’s the guy I’m looking for: a Brazilian pre-salt hand with a Portuguese accent.
Mr. Maddoux,
“… there’s quite a bit of pre-salt in the world …”.
That is what makes this topic so intriguing.
From the Middle East (Red Sea, Eastern Mediterranean, et al), to the southwestern GOM, to – surprisingly, perhaps – Newfoundland, there are large expanses where that thick salt cover exists.
(A Newfoundland hydrocarbon booster claims to have re-created a tectonic plate drift model that shows Eastern Canada as contiguous with western Africa pre-Gonwanda breakup).
Awhile back, this site had a career oilman – Fernando Leanme – regularly comment on various topics.
As he had extensive experience off west Africa, he had knowledge of real world pre-salt development.
He indicated that the biggest hurdle for more expansive pre-salt exploration was the current state of seismic technology, i.e., the readings beneath these massive salt layers were too inconclusive/inconsistent to instill confidence to go ahead and drill.
Since that time, ever more sophisticated seismic continues to be introduced.
With the Brazilians leading the process/hardware charge, newer pre-salt entrepreneurs may be able to build upon this legacy.
At sub 80 buck oil, it ain’t likely to happen next week.
Thank you, Coffee, for your as-usual illuminating insight. You are a font of knowledge.
It has become my visceral feeling that a lot more pre-salt oil existed than has been talked about, but you’ve given it some muscle.
I mean, the salt was formed ostensibly when ocean levels all over the world were at the lowest ebb possible, so it makes sense that mile-thick salt layers would have formed during those times, and then in the 600 million years since a mile thickness of sediment would have piled up on top.
With seafloor spreading from tectonic plate separation and molten material coming up from the Moho, creating a rift, one would logically think there’d be pre-salt oil in many places around the world. After all, seafloor spreading is the way the earth changes.
Thank you for your interjection. To me, pre-salt oil has become the most fascinating topic on our board.
Mr. Maddoux,
Quote from October 2022 article – site is geoexpro dot com – titled ‘Sudan’s Red Sea Oil’ …
“The Sudanese Red Sea is one of the world’s most exciting underexplored passive margins. Here, we show how legacy 2D seismic reveals a stunning array of super-giant syn-rift plays in the pre-salt, capped by halite walls and canopies, in addition to mini-basins in a proven post-salt fairway”.
Says area spans 57,000 square klicks (35,000 sq. miles).
Egypt also has pre-salt hydrocarbons adjacent to the Sudanese.
the Santos basin pre-salt oil has some problems in compositions too, i.e.,
large amount of CO2, and in some wells, easily more than 1/3 of the total volume produced, and CO2 is acidic and need to be injected back.
One of the reason for the high productivity is that oil is real medium grade 28~30deg API, and CO2 and medium GOR at 1MCF/bbl lower the viscosity to just 1cp, while the high density keeps the PVT bubble point low and productive.
Global oil production for the entire year of 2023 will be much higher than the entire year of 2018
https://www.opec.org/opec_web/static_files_project/media/downloads/publications/MOMR%20July%202018.pdf
In 2018 most of the year production was under 98 mmbd.
For 2023 most of the year has seen production of over 100 mbd.
https://www.opec.org/opec_web/static_files_project/media/downloads/publications/OPEC_MOMR_October_2023.pdf
https://www.opec.org/opec_web/static_files_project/media/downloads/publications/OPEC_MOMR_June_2023.pdf
Percentage of NGL is slightly higher than 2018 but the figures are pretty clear.
Charles,
Total liquids does not tell us very much, C plus C is what matters.
In 2018 average annual output for the World was 83.6 Mb/d for C plus C and in 2022 it was 81.2 Mb/d (Statistical Review of World Energy 2023. It is crude plus condensate that is used to produce gasoline, diesel, jet fuel, and residual fuel, these are the products that matter for World transportation. In 2023 so far ( we only have data through May) the average World C plus C output has been 81.8 Mb/d and for the most recent 12 months (june 2022 to May 2023) average World C plus C output has been 81.5 Mb/d based on US EIA estimates.
The 2018 peak is not likely to be surpassed for World C plus C in 2023 in my opinion.
Dennis
Global GDP in 2019 was $87 trillion this year it is over $100 trillion.
https://data.worldbank.org/indicator/NY.GDP.MKTP.CD
In every timeframe where GDP has increased by that much oil C and C consumption has increased by between 2 and 4 million barrels per day. IE 2002 to 2004, or 2004 to 2007.
As you say oil is what transports goods around the world and people around the world
The idea that global GDP is $13 trillion more than 2019 and C and C production is less is rediculous.
Charles,
You need to look at real GDP
https://data.worldbank.org/indicator/NY.GDP.MKTP.KD
In inflation adjusted 2015 US dollars World GDP was 84.72 trillion in 2019 and 89.75 trillion in 2022. The fact is that C plus C output was lower in 2022 than in 2019. World real GDP increased by about 20 trillion 2015$ from 2010 to 2019 while C plus C output increased by 7.8 Mb/d, so we see about a 0.39 Mb/d increase in C plus C output for each trillion dollar increase in real GDP (2015 US$).
In 2020 World real GDP was about 82 trillion 2015$ and in 2022 it was about 90 trillion 2015$. In 2020 World C plus C output was about 76 Mb/d and in 2022 it was about 81 Mb/d, in this case we saw an increase of 0.625 Mb per trillion dollar increase in World real GDP. This was much larger due to the rebound from the pandemic. The relationship does not remain constant from 1973 to 1980 about 0.76 Mb/d of C plus C was needed to get an increase of 1 trillion in real GDP.
As to world moves from oil to electric land transport less oil will be needed and I expect the oil increase per trillion dollars of World real GDP will fall with time.
That last chart is not reliable due to the pandemic. A better chart looks at 2015 to 2019 below.
Dennis
Firstly you have to start with GDP in 2018 which is when you claim world oil production peaked.
Global GDP at the time was $82.5 trillion. This year is 2023, i have double checked. Global GDP has grown by around 2.5% in 2023. Which makes global GDP at around $92 trillion this year.
Secondly and most importantly you have to use data before the Russian invasion of Ukraine and before the Iran sanctions. Global GDP from 2010 to 2018 increased from $64.8 to $82 trillion. While global oil consumption increased by about 6 million barrels per day.
For every $1 trillion of GDP increase the global oil consumption has increased by around 0.5 mmbd.
When global GDP fell in 2008/2009 global oil consumption fell. When global GDP fell in 2020 global oil demand fell.
As I said to believe global GDP has increased by $10 trillion per year and for oil consumption to be lower than 2019 is idiotic.
Your data is wrong and I have given you clues as to why your data is wrong. Global oil consumption is actually around 2 million barrels per day higher than 2019. If is isn’t you must believe the strong correlation between GDP and oil consumption, which YOU have highlighted many many times has magically become inverted.
Shall i tell you where your data is wrong or are the clues above enough?
Charles,
Data from EIA
Charles ,
The data is not wrong, you are.
https://www.eia.gov/international/data/world
and
World Bank
https://data.worldbank.org/indicator/NY.GDP.MKTP.KD
Yes there is a strong correlation over certain periods, but I have also noted on several occasions that the relationship has changed over time.
I adjust my thinking to the data observed rather than adjusting the data to what I think should occur.
This is how science is done.
Nice charts, thanks.
What is more meaningful probably is [global refinery throughput from the same Statistical Review Source] vs [global real GDP]. Reason is that crude production does not track consumption as tightly since there are builds and draws swings from year to year. Refinery throughput is probably a better estimate for oil intensity of world GDP, since products have shorter shelf life and product inventory swings are smaller.
Thanks for the suggestion Kdimitrov.
If we consider 1983 to 2004 we get a slope of 0.699 Mb/d per trillion in 2015 $ of real GDP. For 2005 to 2019 the slope is 0.378 Mb/d per trillion in 2015$ of real GDP.
The US government reported inflation materially understates inflation and overstates GDP. Adjustments should be made accordingly:
https://www.shadowstats.com/alternate_data/inflation-charts
https://www.shadowstats.com/alternate_data/gross-domestic-product-charts
Joel,
See
https://econbrowser.com/archives/2008/09/shadowstats_deb
or
https://www.thestreet.com/economonitor/emerging-markets/deconstructing-shadowstats-why-is-it-so-loved-by-its-followers-but-scorned-by-economists
The first is more complete in my opinion.
For 1985-2014 we have the following
For 1985-2004 the slope is 0.67 Mb/d per trillion real GDP (2015$) and for 2005-2014 the slope is 0.31 Mb/d per trillion real GDP (2015$).
This is a graph I sometimes make and show to various people who are focused on the price of energy rather than the quantity and who think that the price of energy is negatively correlated to real GDP. The rebuttal tends to be is that the economy is what causes energy production and frankly, that is correct within the limitations of available energy at a price that is affordable. That is where the real battle is – something we see every time when energy costs quickly spike over some kind of level that is deemed “too high” whatever that is.
If cost were no object we would be able to produce way, way more FFs ( and let’s just ignore the environment for the moment) but the reality is that the economy is sensitive to input prices.
Perhaps Paul can come up with an iterative function that connects quantity produced, price and GDP?
rgds
Vince
Weekendpeak,
Also technology is not fixed over time so the relationship between oil use and economic output changes over time.
Below I look at World consumption of light and middle distillates plus fuel oil (mostly gasoline, jet fuel, diesel fuel and bunker fuel used for land, air and water transport) from “oil-regional consumption” tab of Statistical Review of World Energy 2023 and World bank real GDP estimates for World from 1965 to 2022. Note the change in the slope of the curve over time.
That’s an interesting graph – thanks for that. Just curious – why did you pick light+middle rather than all production / consumption?
Weekendpeak,
The total consumption includes lots of byproducts that are not critical and have substitutes. The raison d’ etre for oil production is transport fuel in the form of gasoline, diesel fuel, jet/kerosene, and bunker fuel used to power land, air and water transport.
The propane, butane, ethane, biofuel, processing gains, along with asphalt, waxes, lubricants, etc are not really very important and are mostly useful by products of oil and natural gas production which often have good substitutes. The choice of light and middle distillates was a longer data set available (from 1965 to 1979). In a later chart I found data from the OPEC Annual Statistical Bulletin (ASB) from 1960 to 2022 with gasoline, distillate, kerosene and residual fuel oil.
Another great chart!
Can I bug you to plot one without fuel oil, and compare the slope to the slope for total oil, such as e.g. refinery input? Please! As you say, the important thing is transportation fuels and fuel oil is not exactly that. The decline of fuel oil use for heating and for power generation has been offsetting the growth in transportation fuel consumption for many years, but we are getting to the end-of-the-rope on that, there is very little FO use nowadays.
I am just too lazy, but have meaning to write an article on how oil intensity of GDP has been masked by FO phase-out. As a result, transportation fuel intensity should be significantly higher than oil intensity.
There is good data on refinery complexity, it has been going up consistently over the years. We now have a refinery complex worldwide that can efficiently crack the heavier residues into lighter fuels. The question is: aren’t we at the end of this process? With oil being deep-processed now and FO being a small fraction of the barrel as ever, wouldn’t future oil intensity match transport fuel intensity? That would imply stronger oil demand growth going forward.
The problem here is that people assume that growth of oil consumpition causes growth of GDP. It’s the reverse.
Like many other resources, as economic activity grows, the use of various resources also grows: copper, iron, aluminum, oil, gas, electricity, etc., etc. Copper, for instance, has a very nice, tight correlation with GDP, but no one things that copper consumption makes the economy grow.
When lead was used for painting and gasoline, economic growth caused increased lead consumption. Now we use substitutes, and lead consumption for those things has disappeared. Similarly, electricity replaced kerosene for lighting. The same will be true of fossil fuels in general..
Charles,
Debt and wealth inequality have gone up. The middle and lower classes struggling worlwide means theyre competing against the wealthy who’ve sequestered a bigger portion of nominal GDP while energy supplies remain stagnant.
Over the last 40 years, the wealthy have sequestered a bigger portion of *real* GDP, regardless of energy consumption..
It’s the 800 pound gorilla in the corner, that no one discusses. It’s the reason for US MAGA: Republicans have simply diverted all the appropriate anger over income & wealth inequality towards scapegoats.
That is truth NickG
It’s true that income inequality has gotten worse in rich countries in recent decades. But worldwide income equality has improved significantly, mostly thanks to the huge income growth in China, which has taken hundreds of millions out of poverty.
https://ourworldindata.org/the-history-of-global-economic-inequality
2018 non global oil peak.
Since 2018 global GDP has increased from $82 trillion to $92 trillion.
In previous years increased oil production has facilitated this increase in goods and services. More cargo ships transporting goods all over the world. More trucks etc.
Using Dennis’ figures of 0.3 million barrels per day increase for every $1 trillion of increased global GDP. Global oil consumption has to be 3 million barrels per day higher than 2018.
Let’s be generous and allowing for slight increase in efficiency and the 2% of electric vehicles out of 2 billion internal combustion engines. Let’s say oil consumption has to be 2.5 million barrels a day higher than 2018.
OVI’s figures claim global oil production is 1 million barrels per day less. This is obviously wrong, it is impossible for global GDP to increase by $10 trillion and use less oil.
Where are the missing millions of barrels per day of oil which have to get onto the global market?
https://www.fdd.org/analysis/2023/08/21/irans-illicit-oil-exports-surge-in-august-amid-u-s-failure-to-enforce-sanctions/
Various organizations have investigated global illegal oil trade and the figures are staggering. Iran which borders Turkey, Iraq, Pakistan and Afghanistan has plenty of opportunity to trade it’s oil over these poorly manned borders.
When is the last time a US navy ship empunded to tanker going from Iran to China?
https://www.theguardian.com/business/2023/sep/25/the-trade-in-sanctioned-oil-is-booming-as-the-us-turns-a-blind-eye
IN Nigeria oil barrels are counted at refineries or onto ship, but how much does not get there but is stolen to be sold locally and across border?
https://www.bbc.com/news/world-africa-61216157
https://www.apirasol.com/illicit-oil-trade
Russia now has every insentive to ship oil illegally , India, China, Indonesia and others buy large amounts which gets lost in the import, refining and export systems.
https://www.cnbc.com/2023/09/26/russian-dark-ships-vessels-fake-their-locations-to-move-oil-around-the-world.html
When you have a totally corrupt government like in Venezuela sending ship loads of oil becomes much easier.
https://oilprice.com/Energy/Crude-Oil/Venezuelas-Secret-Weapon-A-Dark-Fleet-Of-Oil-Tankers.html
and few officials are willing to risk getting killed to go up against criminal organisations with connections like here.
https://apnews.com/article/venezuela-corruption-oil-maduro-e4bb5d055f16eae94c9bcec6c7a6dbf5
Is is estimated that of the 1.2 trillion of oil and gas revenues in sub Saharan Africa only 22% is remitted to government treasuries.
Libya another country where vast amounts of oil is stolen..
https://www.chathamhouse.org/2019/10/libya-rich-oil-leaking-fuel
We are looking at 4/6 million barrels per day of oil is stolen or is hidden, this oil gets into the world economy but does not get counted.
Once you add this oil to official numbers you get global oil consumption which makes sense when considering global GDP which has increased by $10 trillion in the last 5 years
Or the increase in GDP is purely inflation.
JT,
real GDP adjusts for inflation, so no the measure in in constant 2015 US $ for real GDP.
Charles,
Have you heard of telecommuting? A lot of oil gets saved when people work from home. Many different agencies arrive at similar conclusions for oil output, OPEC, EIA, etc. Chart below has World consumption of gasoline, distillates, kerosene, and residual fuel vs World real GDP from 1983 to 2019. Data from
https://asb.opec.org/data/ASB_Data.php
and
https://data.worldbank.org/indicator/NY.GDP.MKTP.KD
After 2019 consumption dropped, in 2022 consumption was 1.87 Mb/d less than in 2019 which was peak for consumption of these 4 liquid fuels (the most important group for World transportation).
JT
Good point.
Figures are real gdp which are adjusted for inflation
https://www.worldometers.info/gdp/#growthrate
Charles,
All hand waving unless we have a credible estimate, oil reporting is not perfect and never has been. I work with the historical data that exists rather than making stuff up (my estimates of the future are speculative as there is no future data available.)
As to impossible things, in 1980 World consumption of transport fuel was 49.44 Mb/d and in 1983 it was 45.64 Mb/d (3.8 Mb/d less). In 1980 World real GDP was 52.75 trillion in 2015 US$ and in 1983 World real GDP was 59.94 trillion in 2015 US$ an increase of 7.19 trillion in 2015 US$ while consuming 3.8 Mb/d less in gasoline, distillate, kerosene, and residual fuel. I guess its all the stolen oil (about 8% of transport oil consumed in 1983).
If you believe that I have a bridge to sell you in Brooklyn.
Dennis
Dennis rubbish in rubbish out.
You obviously do not want to read the links because you may have to face the fact that you and OVI inhabit an insular little world where the reality of massive criminality does not impinge.
The fact is much of the world is becoming barbarous and lawless and nice little figures compiled in offices are becoming more and more meaningless.
These reports and investigations are hard earned by people who know what they are talking about. They have not written these reports to prove you wrong they don’t even know you exist.
These reports show millions of barrels per day stolen and sold by criminal gangs and murderous governments.
Your nice little world is getting smaller
Charles,
There is no perfect data. How about you point to a single source with the proper data? I am not going to read every link you post. Eight links? Are you kidding. Give me one you think is important and worth reading, I am not on a fishing expedition.
I would say the organizations that collect the data are aware there are problems and account for them. You are naive to think otherwise.
Skimmed through your links, a combination of nations avoiding sanctions (Russia, Iran, Venezuala) and subsidized oil causing black market activity in Nigeria and Libya.
Most of this oil is accounted for in estimates by secondary sources. Note that the market estimates for the value of the goods avoiding sanctions is a bit difficult to track in these articles, but one has to be careful about whether the “oil” being discussed is unrefined crude or a refined product.
For example a barrel of diesel is about $120, but a barrel of crude is about $75 as of Nov 27 in US spot markets. Let’s say an article is claiming 50 billion of illicit oil, is it 417 million barrels of diesel or is it 667 million barrels of crude. If it is over a year it would amount to 1.1 Mb/d of diesel or 1.8 Mb/d of crude, if the prices being cited are black market prices, the prices might be much higher and the quantities would be lower.
There is nothing in your links that is very definitive, your 4 to 6 Mb/d estimate is highly suspect. Note also we would need an estimate for all years otherwise we have nothing to talk about.
You are very far from having any useful information for discussion without far more information.
Charles,
You may not understand how Ovi makes his estimate. First it is based on a forecast by the EIA in the Short term energy outlook, including estimates for World output from June 2023 to September 2023. We have estimates for OPEC output of crude oil and US output of C plus C, the historical data of both total liquids and C plus C for the World minus US and OPEC and historical ratios of OPEC crude to OPEC C plus C can be used to estimate World C plus C output. Note also that if we are going to claim the data is bad, then we need an estimate to replace that data and using C plus C and real GDP historically the claim could be made that that data is also bad so any claimed relationship between oil output and real GDP could be claimed to be wrong because the underlying data is bad. Then we would be left with no basis for discussion as all data would be considered bad and there could be no agreed on facts as a basis for discussion.
I am not interested in that rabbithole, but you can continue to argue, I will just ignore.
Dennis
For years you have argued that global oil consumption has increased in line with GDP.
Now it does not suit you, you argue the opposite.
You have no integritiy at all.
go back to your endless analizing of how many spuds there are.
Look at how many great articles there were on the Oildrum and look at what you and Ovi have reduced this to
Charles,
I have argued that over long periods this has been the case, though I have often pointed out that the slope has changed over time, one only needs to look at the data to see this.
If you don’t like what you see here go elsewhere.
Charles
Dennis and I report production from official government sources that have cross checked their data. We then state clearly how we treat the data to extrapolate it into the future, never an easy process. You may quibble with the methodology, we don’t have a problem with that.
My suggestion is for you to gather all of your data and post a few charts showing where you think world C + C production is currently.
Dennis is right.
You don’t have to stick around. Especially if you don’t contribute. Dennis is one of the most tolerant people in the digital world I know.
He is very transparent as to how he builds his models. Like it or not you can counter with your own models. Dennis often says, the predictions are normally wrong. But you have to be competent to make them in the first place.
No need to call you names, you don’t deserve it Charles.
Dan
No one is allowed to contribute.
There are many people who used to contribute to The Oil Drum who are still around, have they ever been asked to put a detailed analysis of a country or area they are knowledgeable in?
Dennis is just utterly obsessed with his models. Which he posts up week after week.
He knows nothing about most aspects of the oil industry, that is why he never post anything else. He does not know anything.
For example how about the new developments in the oil refining industry which will have a big impact on oil consumption and ensure oil demand stays high for a long time.
Some of the real oil men who used to post up things, no longer bother
says it all
Thanks Charles for your contribution.
If you don’t like what is written here, don’t read it.
Charles,
I have indeed said for many years that over specific periods (1982 to 2019 for example) that crude plus condensate output has increased with real GDP (consumption is a bit trickier and the data is not as good as we have many different grades of products possibly refinery throughput would be the best guess on consumption, but crude inputs would be best and we don’t have this number at the World level.
Over certain periods such as 1980 to 1987, World real GDP increased with output of C+C falling. The sharp rise in oil prices during the 1979 to 1981 period led to changes in behavior. During the pandemic there were also changes in behavior leading to a shift in the relationship between real GDP and C plus C output.
Paul Samuelson once quipped that “when events change, I change my mind. What do you do?”
Hi,
I offer a opinion on money. A home in 1975 costs 25K. It now costs 1.2M…. Oil as measured by gold has a different ratio. Your number above don’t reflect pre/post Covid money printing and related costs (house prior are 1/2 houses now, same with cars, same most commodities; except oil)> UAE and Saudi investments are essential worth 1/2 due to COVID so they are joining BRICs currency. Dollars are worth less but there are more of them. Salaries are 1/2 precovid is you rent…since costs to rent have gone up. Only useful item is 100 barrel oil is 50 a barrel with precovid dollars…
CC,
See https://www.aeaweb.org/articles?id=10.1257/jep.30.2.151
From paper see chart below, the US CPI can be verified using online price data.
also see
https://thebillionpricesproject.com/
shadowstats would say that current CPI is not same as 1970s CPI…it underestimates true inflation so Social Security can be paid for… Overseas (Saudi, UAE) go along with the ‘tax’ as long as Iran and Russia are issues. With Chinese politics they have decided to go with the BRICs as the tax is to much.
CC,
Shadowstats is not believable.
See
https://econbrowser.com/archives/2008/09/shadowstats_deb
also note that independent research such as the billion prices project confirm that the CPI data is fine.
Don’t believe everything you read on the internet. Also keep in mind that Williams is one guy with BA in Economics and an MBA, he does not know more than those who specialize in this area with PhD’s in Economics.
The US government has been overstating GDP per Shadowstats. China is known for lying about its GDP. Ovi may be right or partially right.
https://www.forbes.com/sites/williampesek/2022/04/29/is-china-juicing-gdp-data-economists-cant-help-but-wonder/?sh=24fa904639c7
https://www.shadowstats.com/alternate_data/gross-domestic-product-charts
Joel the data for World real GDP comes from the World bank, one could also use IMF data, they are very close. The shadowstats estimates come from a guy with an MBA, I will take the expert analysis of economists and Statisticians with PhD’s.
What, like these guys?
Consumption has to be tracked down. US consumption fell about 10% during virus impact, but the only data out there about work from home indicated it increased oil consumption. People would go to the store, or do other convenient things during the day, tethered by phone to the office. They were burning oil they did not burn when at the office.
From the Stat Report bible, Ukraine consumption, amid all tanks in the field, declined in 2022. Consumption is hard. Russia consumption rose in 2022.
Same spreadsheet says Russia production increased in 2022 amid sanctions. A new term has evolved. The PetroEuro — money spent by Europe buying India refined products, the crude for which came from, you guessed it, Russia.
US Nat Gas reserves — 12 Trillion cubic meters. US nat gas production about 1 Tcm. That’s right. 12 years left unless discoveries spike. Because of exports, it’s not all a matter of consumption. Production is the measure since we think we have so much we can send it elsewhere.
Russia Nat Gas reserves 37 Tcm. #1 in the world and they have not even started on the Kara Sea and the Bazhenov shale. #2 is Iran. #3 Qatar. Several other countries above the US in reserves. Russian nat gas consumption 400 billion cubic meters/yr. Down about 15%. The warm European winter last year reached to Moscow.
Their stuff is going to run out long after ours. They were not the right enemy to make. We tolerate Saudi cutting people’s heads off for decades, but somehow we can’t tolerate Russian governance of Ukraine? Why is that worse than cutting heads off?
https://www.eia.gov/todayinenergy/detail.php?id=30852
WTI used to be API 36. It’s over 40 now, and the Bakken gets up to 50. The threshold for crude vs condensate was once 40. That got redefined to 45 so the quotes of oil production could look better.
California production as can be seen . . . API < 30.
This is not always definitive of constituent yields, but it's a guideline. BTW Russia typical API gravity 30-31.
This was the wrong enemy to make.
Watcher,
Good to see you posting.
Hope all is well.
If your source (Stat Report bible) is the formerly-run-by-BP annual statistical review, I would more than question the accuracy of the US having a dozen years’ natgas left … unless the term ‘reserves’ denotes the SEC-required parameters which characterizes an American company’s hydrocarbon potential. (Needs to be developed within 5 years, IIRC?)
There is – without doubt – approximately a century’s worth of natgas in the USA … even if LNG/pipeline exports go from ~21 Bcfd to ~40 Bcfd.
The latest technological innovations are INCREASING the size of economical acreage … and this at 3 bucks per.
Yes, from formerly BP.
Source of Data: The estimates in this table have been compiled using a combination of primary official sources and 3rd party data from Cedigaz and the OPEC Secretariat.
Total Proved Reserves: Generally taken to be those quantities that geological and engineering information indicates with reasonable certainty can be recovered in the future from known reservoirs under existing economic and operating conditions. The data series for total proved natural gas does not necessarily meet the definitions, guidelines and practices used for determining proved reserves at the company level, for instance as published by the US SEC, nor does it necessarily represent the Efs view of proved reserves by country.
No idea what Efs is, but in general specified reserves are not constrained by SEC rules.
US 12.6 Tcm. Russia 37.4.
Russia is a barbaric nation. Some 20% of the country does not have an indoors toilet but they felt the need to invade another country? As well as poor sanitation, they are a barbaric nation. Ukrainians don’t want to be part of Russia. Neither does Latvia, Estonia, Belarus, Finland, Armenia, Poland and the rest of them. The cheapest way of stopping Russia is in Ukraine right now. Failing to stop Russia now means the cost goes up until you do.
“Russia is a barbaric nation. Some 20% of the country does not have an indoors toilet but they felt the need to invade another country?”
Well, they did steal many a toilet when they invaded, so maybe it makes sense.
US September Production Up 224 kb/d
GOM and ND provided the biggest increases. Interestingly, for the last 8 weeks the weekly production numbers have been steady at 13,200 kb/d.
Full Update December 5.
Kal’s Cartoon
Counterpoint:
We own the production plants and the battery factories…
The difference is that once you install renewable power, no one can cut off your supply of wind or sun.
We talk a lot about oil shocks to the economy, caused by supply problems. Renewables produce electricity: we’ve been dependent on electricity for 100 years, but who’s heard of an economic “electric shock”?
“…a renewable energy powered world will not see massive transfers of wealth from the majority of countries to a small clique of resource-rich countries – or its related consequences of unpredictable prices and oil wars. “Oil and gas are based on the control over, and extraction of concentrated, non-renewable natural resources,” said Overland. “Conversely, renewables are more similar to a cross between industry, high-tech innovation and farming. It’s an entirely different kind of story.”
https://www.pv-magazine.com/2019/08/22/renewables-and-geopolitics-there-wont-be-as-much-to-fight-over/
And that’s because not all the solar is built in China right?
Ah, those everlasting PV cells and turbines have been invented. About time.
Batteries are a serious threat to the oil industry not so much because they will take over the market in the short term, but because they apply price pressure on the oil market.
The primary use of oil is fueling light vehicles. Compared to electricity, liquid fuel is extremely expensive, especially when you take the inefficiency of internal combustion engines into account. But the oil industry has been protected for decades from the low prices of the electricity industry by the fact that liquid fuel is such a good way to stored energy in a moving vehicle.
Despite their weaknesses, electric vehicles offer a real alternative to oil powered vehicles. Thanks to cheap electricity, their fuel is much cheaper. This puts a cap on oil prices. Oil producers can’t ask any price they want if there is an alternative.
The so-called economic argument against peak oil is that as oil runs out, prices will go up, increasing the supply of oil that can be recovered at a profit. But this argument assumes that there is no alternative to burning oil to power light vehicles.
EVs are a serious threat to expensive oil, and less so to cheap oil. They are a threat to profit margins for the entire industry.
Where’s all this cheap electricity? I’m paying more now than I’ve ever paid since becoming a homeowner, yet I am assured there is more installed capacity in REs than ever before.
Fits nicely with the urban myths many of us grew up with. “Big oil pushed out electric transportation “ “Big oil bought up energy efficient patents preventing mass adoption “ etc etc etc. These are the true conspiracy theorists. The reality is our way of life is dependent on fossil fuels and the only way our consumption of fossil fuels will decline is changing our way of life back to preindustrial times. And hook or by crook it’s going to happen whether we like it or not.
No coal no steel or steel so brittle you can’t use it. Everyone does realize that steel requires carbon I hope.
No oil no gas liquids no fertilizer. Haber Bosch process accounts for half of all the nitrogen in our bodies. Without that input only half of us would be here. You are what you eat Greta.
And speaking of Greta she sails solo to condemn the world’s use of fossil fuel in a sailboat constructed of carbon fiber and flies back home. Huh?
Sadly the ignorance of how the system actually works is almost intolerable. But sadly it is convenient for misleading the general public.
“Oil is evil” “Green is good” “Coal is the enemy “ Headlines which unfortunately is all people actually read. The average man knows more about sports than anything else even sports that don’t exist like fantasy football.
I know one Yale graduate that has five fantasy teams he manages. ??? He actually believes Moores law is a law and that chip technology can and will get smaller and faster and cheaper. When I counter that chip technology has already reached the atomic level meaning some traces are only one atom wide he counters that we will start using subatomic particles.
I hope I don’t have to explain to people here why that can’t happen but the audience interestingly couldn’t comprehend the fundamental flaw in his argument.
Like Hiroshima
I don’t know about you but I’d rather not have a fission powered cell phone.
My point is that the belief that technology will save us is just a religious idea. It’s no different than being saved by human sacrifice that Aztecs believed in. You might as well believe that the earth is flat which would be better because it wouldn’t be finite. All you have to do is just keep traveling west young man to untapped land and resources. I’ve often wondered how many times a flatlander would have to pass the same rock before he recognized the earth is a sphere. My conclusion is an infinite number of times.
The replacements for fossil fuel are cheaper, cleaner and more reliable. That’s not religion, it’s engineering and a bit of environmental awareness.
The FF industry is being disrupted. and there are trillions of dollars in investments that are in danger of being lost. So, the industry is fighting hard, like the tobacco industry before it, with misinformation and purchased politicians.
Wyoming wants to outlaw EVs…
————–
Above is the short version, below is a longer version:
About half of the world’s fossil fuel assets will be worthless by 2036 under a net zero transition, according to research.
“Countries that are slow to decarbonise will suffer but early movers will profit; the study finds that renewables and freed-up investment will more than make up for the losses to the global economy.
It highlights the risk of producing far more oil and gas than required for future demand, which is estimated to leave $11tn-$14tn (£8.1tn-£10.3tn) in so-called stranded assets – infrastructure, property and investments where the value has fallen so steeply they must be written off.
The lead author, Jean-Francois Mercure of the University of Exeter, said the shift to clean energy would benefit the world economy overall, but it would need to be handled carefully to prevent regional pockets of misery and possible global instability.
“In a worst-case scenario, people will keep investing in fossil fuels until suddenly the demand they expected does not materialise and they realise that what they own is worthless. Then we could see a financial crisis on the scale of 2008,” he said, warning oil capitals such as Houston could suffer the same fate as Detroit after the decline of the US car industry unless the transition is carefully managed.
The challenge is evident at the ongoing Cop26 climate conference, where some of the nations most at risk of being left with stranded assets – such as the oil and gas exporters Russia and Brazil – are likely to try to slow down the transition as they have done at previous climate meetings, while those most likely to gain – such as the fuel-importing EU – are pushing for faster action.
The new paper, published in Nature Energy, illustrates how a drop in demand for oil and gas before 2036 will reshape the geopolitical landscape. Current investment flows and government commitments to reach net zero emissions by 2050 will make renewable energy more efficient, cheaper and stable, while fossil fuels will be hit by more price volatility. Many carbon assets, such as oil or coal reserves, will be left unburned, while machinery will also be stranded and no longer produce value for its owners.
The most vulnerable assets are those in remote regions or technically challenging environments. Most exposed are Canadian tar sands, US shale and the Russian Arctic followed by deep offshore wells in Brazil and elsewhere. North Sea oil is also relatively expensive to extract and likely to be hit when demand falls.
By contrast, current oil, gas and coal importers such as the EU, Japan, India and South Korea, will reap hefty economic dividends from the transition because they will be able to use the money they save on overseas fuel purchases to invest in their own countries, including money for renewables that will modernise infrastructure, create jobs and improve energy independence.
The situation for the world’s two biggest emitters – the US and China – is more complex as they have more diversified economies with both substantial fossil fuel assets and powerful renewable sectors. The UK is in a similar situation, but as a net energy importer, stands to benefit overall.”
https://www.theguardian.com/environment/ng-interactive/2021/nov/04/fossil-fuel-assets-worthless-2036-net-zero-transition
lol at the 2036 net zero transition.
That’s not happening. Look at the latest COP happening now and tell me how optimistic you are.
The recently added leases in GoM may be peaking, with the caveat that I’m not sure what the Mad Dog nameplate is supposed to be – either 140 altogether or for phase II alone. PowerNap looks like an even bigger disappointment and is declining towards zero having produced less than 5% of its original reserve estimate. Taggart and Khaleesi are cutting water quickly. Vito is above nameplate and unlikely to be able to maintain that rate.
I only know of three new leases due through 2024: Dover around 15 kbpd due soon as a tie in to Appomattox, Shenzi North at around 30 kbpd and Whale similar to Vito, which was delivered to USA last week so might be 6 to 10 months from full production. So it seems likely production will decline a bit next year before Anchor, Ballymore, Shenandoah and Salamanca come on in 2025. There will be a few minor tie backs but overall development EPIC work is tailing off at the moment. The only two major potential new builds in conceptual phases are Sparta (Shell Vito copy) and Tiber (BP, possibly including the Kaskida lease where the Deepwater Horizon blowout occurred).
Mad Dog 2 nameplate is supposed to be 140 kbopd prior to first water production. So, if it actually achieves 140, then, along with the Spar A production, which is still around 50 kbopd, total Mad Dog production could get up to 190 kbopd.
Mad Dog 2 is currently at about 70 kbopd with 5 wells online, as per August data, with total Mad Dog production at about 120.
Main outcomes from OPEC+ meeting (I’d have put the word voluntary in quotation marks).
OPEC+ announces no new group cut target for 2024
Instead members led by Saudi Arabia to make voluntary cuts
Saudi to roll over 1 million bpd cut into Q1
Russia to cut 500,000 bpd
OPEC+ invites Brazil to join
It’s possible that we have a bigger global problem than just supply & demand. The CTA’s (computerized trading advisors), basically using a form of algorithmic AI, have hijacked commodities, especially oil and gas. And man, are they taking it on a ride!
The market is fairly balanced, yet when OPEC+ made a larger production cut the price of oil went down, not up. That’s the new CTA norm: when the price goes down, the algorithm sells into it; contrarily, when the price goes up, the algorithm buys into it.
That wouldn ‘t have been such a problem a few years back when you drilled a good well and expected it to produce about level for a couple of years, then tail off slowly. But now with the shale well, when roughly 75% of production occurs in the first year and a half, bring on a dozen wells from a drilling pad and watch them sell $70 oil and dollar gas for any stretch and you’ve got a big problem.
These guys are creating synchronized chaos. The CTA segment is so big now that you can’t bet against it, nor can you allow a sliver of human emotions in. They have taken an inelastic commodity and, I kid you not, made it more or less elastic, stretching to their whims. This is going to create a disaster at some point.
CTA’s trade on momentum. If prices sell off then they will exacerbate the move down. They’ll also exacerbate moves to the upside. They don’t care about price or anything else except for momentum.
When we get shitty economic data. The kind of data that tanks bond yields. Oil prices are going lower with the bond yields. Because the data is crappy and becoming more crappy as we move forward towards 2024. Those CTA’s were long and have to lock in gains before gains turn into losses. So we have mechanical selling of oil futures on bad data. US factory activity contracted by more than was expected.
It’s the economic data that decides the price of oil. It’s the economic data that decides what bond yields are. CTA’s just make money for big banks on short term plays on momentum.
CTA’s will front run stock buybacks and add to moves but they don’t directly dictate what the price is or what direction the price is going.
My point is that they have taken an already volitile commodity market and robotically tuned it to go to much greater extremes, with no governor on the system other than the bounds of the algorithm.
I understand that it is market forces–good news or bad, undersupply or over, that initiates the direction of the futures market, but it would appear to me that these are not just designed to instantaneously follow momentum but to take it to far extremes in either direction of momentum.
Isn’t this right? This smacks of artificial intelligence in the making, manipulating the market for the obscene financial advantage of a few and the detriment of many.
CTA’s are involved in every market. I would suggest if anyone doesn’t know how they are positioned not to trade anything. They are designed to enrich a few by inflicting maximum pain on the many. I personally hate them but if you know how they are positioned you can actually take advantage of them.
They aren’t the end all of markets but you absolutely have to account for them or you’ll be burned by markets.
Gerry: The so-called free market hasn’t existed in oil in years. It is run by bankers and the government to suppress oil prices at the expense of the oil industry for the benefit of consumers and fiat money controllers who own trillions in over-priced tech stocks. More and more energy experts are seeing this blatant oil price manipulation.
The price suppression scam is becoming too obvious not to see. How do they suppress oil prices? In a variety of ways:
SPR releases
Corrupt “data” that overstates production and understates demand.
Creation of a financial derivatives market 30 times the size of the real oil market to control prices.
The following are a few examples of some energy experts pointing out the scam:
1) Martin Pelletier, blasts oil trading as blatant manipulation overriding fundamentals
https://twitter.com/MPelletierCIO/status/1730391460858810521
Martin Pelletier is a portfolio manager at one of the largest investment managers in Canada with $25 billion under management:
With nearly $25 billion in assets under administration and offices across the country, Wellington-Altus identifies with larger, independently focused investment advisors and portfolio managers and their private clients.
2) The largest Canadian energy manager calls EIA “data” DUBIOUS
https://twitter.com/ericnuttall/status/1727353819640533137
3) Mike Rothman: IEA guilty of publishing too-low-demand data and forced to restate historical figures
https://twitter.com/CornerstoneOil/status/1704114516496167419
https://twitter.com/CornerstoneOil/status/1703923597578777010
4) H Kupperman (Kuppy) calls out the US government’s oil price fixing, too
https://twitter.com/hkuppy/status/1730654714297995297/photo/1
https://twitter.com/hkuppy/status/1730244360296415273/photo/1
5) “Hey, manipulate Gasoline prices, get a lower CPI print.”
https://twitter.com/TFL1728/status/1724453917340156082
Joel,
The market cannot be manipulated indefinitely, prices will be determined by supply and demand.
Let’s do a quick thought experiment and say you are correct (you aren’t), demand is understated consistently and supply is overstated, actual oil stocks fall to zero under such a scenario because the low oil price that results causes demand to increase and supply to fall leading to a draw on oil stocks. When oil stocks reach zero what do think happens to the price of oil?
Your theory does not pass this test. It is bunk.
Dennis,
As long there is enough oil in the commercial tanks above working minimum and every order can be served these games can continue.
Tanks full – price will be 0, as demonstrated.
Tanks are empty – the highest bid will pay. Bids can be done in $ or live amunition.
Between – the financial market makes the price. And especially the derivate market.
Eulenspeigel,
As stocks fall, eventually the market will notice, the visibility of stock levels is not very good as can by seem by looking at different estimates for World Supply and Demand from different sources, the best the market can do is look at the average of the various estimates to get a rough estimate of stock levels. As available storage approaches the upper or lower limits prices will either fall or rise. The games played on derivatives markets are only tangentially related to real supply and demand.
I have some comments about deepwater oil that G.Maddoux talked about higher up in the thread.
The probability of drilling success goes way up when western oil companies are involved as mentioned. 3D seismic or reservoir mapping helps a lot. The technology can be both oil or gas, but involves having a higher hit chance and a more cost effective development. A higher EROI despite a less advantageous resource base would work a lot of places; it would have to rely on technology primarily. You get that when utilising advanced seismic and reservoir mapping tools. Deepwater is not fully expoited, because the development is relatively recent.
Reasonable expectations overall are needed anyway. I am not really an oilman, just giving my 5 cents anyway.
Rig and Frac Report for week ending December 1
Rigs Up: Fracs Down
– US Hz Rigs rose by 6 to 457
– Permian rigs were up 3 to 301. Texas Permian was up 3 while NM was unchanged at 98. There were no changes in the 4 largest producing counties, Lea, Eddy, Midland and Martin.
– Eagle Ford was unchanged at 47
– NG Hz rigs were down 1 to 101 (not shown)
Frac Report
The frac count dropped by 5 to 276. As occurred last year, the first week in December saw the beginning of the annual Thanksgiving to year end decline in the frac count. Last year from peak to trough the count dropped by 50, 300 to 250.
One year ago, 290 Fracs were operating, 14 more than this week. Last year’s first week drop was 10, 300 to 290. This year’s first week drop was 5, 1/2 of last year.
Today is the first time that i have seen a wikipedia page https://en.wikipedia.org/wiki/Entropy displaying the “Entropy balance equation for open systems”.
If you are fit in mathematics, you can use the equation to calculate the entropy generated by oil production yourself. Hints: The system with open boundary is the earth surface, oil and water from the oil reservoir enter the open system and all heat is contained within the boundaries. Entering and exiting oil and water mass flows are equal. The term on the left side dS/dt is zero, because entering and exiting masses are equal.
If you have not so much time, my solution for the problem can be found here: https://www.peakoil.ch/media/files/the_end_of_oil_covered_230920.pdf
Below are the voluntary production cuts by OPEC members
The OPEC Secretariat noted the announcement of several OPEC+ countries of additional voluntary cuts to the total of 2.2 million barrels per day, aimed at supporting the stability and balance of oil markets.
These voluntary cuts are calculated from the 2024 required production level as per the 35th OPEC Ministerial Meeting held on June 4 2023, and are in addition to the voluntary cuts previously announced in April 2023 and later extended until the end of 2024.
These additional voluntary cuts are announced by the following OPEC+ countries : Saudi Arabia (1,000 thousand b/d); Iraq (223 thousand b/d); United Arab Emirates (163 thousand b/d); Kuwait (135 thousand b/d); Kazakhstan (82 thousand b/d); Algeria (51 thousand b/d); and Oman (42 thousand b/d) starting 1st of January until the end of March 2024. Afterwards, in order to support market stability, these voluntary cuts will be returned gradually subject to market conditions.
The above will be in addition to the announced voluntary cut by the Russian Federation of 500 thousand barrels per day for the same period (starting 1st of January until the end of March 2024), which will be made from the average export levels of the months of May and June of 2023, and will consist of 300 thousand barrels a day of crude oil and 200 thousand barrels per day of refined products.
Note that Iran can continue to increase production as much as they can
Dietrich Bonhoeffer Who was executed in a concentration camp in Germany in 1944 concluded that Stupidity is more dangerous than Evil. Once cornered by facts a stupid person will lash out in character assasination or physical assasination as he experienced.
“Stupidity is a more dangerous enemy of the good than malice,” Bonhoeffer wrote, “[Evil] can be exposed and, if need be, prevented by use of force. Evil always carries within itself the germ of its own subversion in that it leaves behind in human beings at least a sense of unease. Against stupidity we are defenseless.”
According Bonhoeffer, you can’t fight stupidity with reason, facts, protests, or your fists, because, to the stupid, “Reasons fall on deaf ears; facts that contradict one’s prejudgment simply need not be believed… and when facts are irrefutable they are just pushed aside as inconsequential, as incidental. In all this the stupid person, in contrast to the malicious one, is utterly self-satisfied and, being easily irritated, becomes dangerous by going on the attack.”
That pattern can easily be seen here. Shellman, Carnot, Hideway, and others are attacked for disagreeing with the mass media’s green narrative.
Bonhoeffer identified the cause of societal stupidity like this: “Every strong upsurge of power in the public sphere, be it of a political or of a religious nature, infects a large part of humankind with stupidity. It would even seem that this is virtually a sociological-psychological law.”
So the green energy transition hysteria which we are presently experiencing is exactly what he experienced in Nazi Germany. The pattern includes group speak.
Consider this description of the typical stupid person from Bonhoeffer:
“He is not independent. In conversation with him, one virtually feels that one is dealing not at all with a person, but with slogans, catchwords and the like that have taken possession of him. He is under a spell, blinded, misused, and abused in his very being.“
Carbon capture, renewable energy. ESG, Solar Wind cheaper than coal, etc. short simple sentences repeated often in the form of eye catching headlines. Edward Bernays would be proud.
Hydro carbon resources are a once in a lifetime inheritance that should be treasured not squandered. Definitely should not be vilified it’s been a gift we never worked for. It’s irreplaceable and finite and once gone there is no replacement for it. That’s the absolute truth but with it comes another truth.
The interconnected global economic system requires infinite growth without it it must collapse because money lent into existence must be paid with interest which is derived from future money lent into existence. If the velocity declines the system topples because the stock value of money depends on the constant flow. So whether we like it or not energy consumption must increase to match the financial growth with material growth if it doesn’t (as is now the case) it’s purchasing power evaporates (aka inflation).
These are basic realities although unfamiliar to economists who will promote their decoupling theologies.
For those so inclined reality is maddening and only violence can bring things into proper order.
Sounds like you are trying rationalize a new brand of Nazism, maybe with red hats.
“only violence can bring things into proper order.”
“So the green energy transition hysteria which we are presently experiencing is exactly what he experienced in Nazi Germany”
“Stupidity is a more dangerous enemy of the good than malice,”
Enough said
I think JT is to stupid to know the difference between Nazism and the need to save the planet from the stupid among us. In addition, by you asking I’m putting yourself in the same category as JT. It’s not rocket science. Environment science is taught in 6th grade.
Sixth graders are not taught they are “Indoctrinated “.
JT,
The fact is that real GDP per unit of primary energy consumed (energy intensity of real GDP) is decreasing over time, this is a good thing as some energy resources such as fossil fuel are limited. Also the energy intensity of fossil fuel has decreased over time.
I have a BS in physics and a BA in economics.
real GDP from
https://data.worldbank.org/indicator/NY.GDP.MKTP.KD
Energy data from
https://www.energyinst.org/statistical-review/resources-and-data-downloads
Is energy intensity of real GDP understated because GDP is overstated?
https://www.shadowstats.com/alternate_data/gross-domestic-product-charts
Coolreit123,
Search “shadowstats debunked”
Short answer, no.
D Coyne: ” Also the energy intensity of fossil fuel has decreased over time.”
Mr. Coyne, what exactly do you mean by that?
Thanks.
Gerry,
The fossil fuel energy intensity of real GDP is what I should have said. It is annual World consumption of fossil fuels in exajoules divided by trillions of 2015 $ of real GDP. Data for World real GDP in trillions of 2015 US$ from World Bank and fossil fuel energy consumption from Statistical Review of World Energy 2023 linked earlier.
Obviously. Because manipulating numbers in a spreadsheet is literally infinitely profitable. Who needs to make or grow things anymore when you can just play shell games with assets you don’t own?
Look at all this GDP America has. Just ignore the precariat and inability to manufacture much of anything at scale anymore. It’s pretty funny that the richest country on Earth can make 155 mm artillery shells for $8400 each while Russia does it for just shy of $300.
You can also see the media and talking heads in force coming out to tell people to stop complaining about the economy, because actually, it’s all fine and good and them not being able to afford rent or grocery shops is just untrue. The gov’t stats say so.
Trump win in 2024 by a landslide now. Never thought I’d type that out, but I’m counting on it.
“system requires infinite growth without it it must collapse because money lent into existence”
Dennis, could you comment on the above with the use of your education. This belief seems to raise it’s head here regularly.
Thanks
Madeline,
Generally it is true that the current system requires growth to function well. Eventually we will need to find a different social system, it is impossible to predict what new system will evolve, though looking at the experience of nations whose population has peaked such as Japan and perhaps some European nations will give clues on how the current system might be adjusted to meet this new reality.
As far as I have seen these nations have seen slower economic growth (in real GDP per capita) without collapse, perhaps that changes in the future, impossible to predict in my opinion.
Yes money is lent into existence and this has been true since at least 1972 when the US left the Gold standard established in 1945 at Bretton Woods.
What many miss is that Money is best seen as a convenient medium of exchange which will adjust based on supply and demand, the important factor is goods and services produced in inflation adjusted money as a measure.
Most economists Worldwide believe the current type of price index used by the US and most other OECD nations is the best measure of the average cost of living.
A search on “shadowstats debunked” gives a number of pieces explaining why it is is best to ignore shadowstats.
There are very few economists that take shadowstats seriously.
Thanks Dennis, after Googling the definition of collapse and your opening sentence. It sounds like you disagree with the statement. Your examples are countries that are dealing with retraction in my view, not collapse. As resources become more scarce I would expect a lot of things to not work so well. Agree the future will be different. Todays a lot different than when we were kids. Not everything is better, different. Retraction is not collapse.
Read Marx or any ecology textbook.
Dennis, everyone knows about efficiency gains which have allowed for ‘better’ use of fossil fuels. However all the easy efficiency gains have been made. There are diminishing rates of return as things get more efficient. There are many known limits to the efficiency possible in different uses.
We also increase complexity with a lot of, but not all, efficiency gains, for example computer chips controlling air fuel mixture in autos.
More efficient use of a non renewable source is always a dead end. The mere fact that it’s non renewable means it can’t continue in the long term, alternatives must eventually be used.
I hope these renewable alternatives will be what humanity uses in the future, horses and wooden carts, assuming we don’t cut down all the trees and eat all the horses in the process of getting from here to there…
Hideaway,
I agree the improvements in energy intensity will eventually diminish as there are limits to efficiency for converting thermal energy to work that are well known. The earth has a large energy input from the nearby star, utilizing this resource for the next 100 million years or so is a good idea. The theoretical limit for Energy Intensity of real GDP might be around 2 EJ per trillion of real GDP (very roughly, my guess is we may the range of 1 to 3 EJ per trillion of real GDP over the next 100 years).
Dennis we need the sun to keep shining so that the trees grow to provide wood and grass grows for horses to eat..
Solar panels and wind turbines are no more renewable than coal fired or gas fired generators.
You seem to be seduced by the word renewable, without understanding that we mine, process, make and transport all the manufactured products with fossil fuels. At some point during depletion they become too energetically expensive to produce.
Hideaway,
No, I imagine a future that is different than today, solar and wind energy at point of use have higher EROEI than fossil fuel.
See
https://mdpi-res.com/d_attachment/sustainability/sustainability-14-07098/article_deploy/sustainability-14-07098-v2.pdf?version=1655449453
Dennis, Murphy et al paper is worthless claptrap..
The EROEI of the largest solar farm in Australia is 1.74. The EROEI of the lignite coal fired power station nearest to me is 5, while the EROEI of a small gas plant started up recently is 37.8.
Saudi oil wells that have been operating for decades still have an EROEI of 80+.
What these EROEI numbers mean is that the modern world would have to spend 60% of all energy, effort and human labor on gathering energy if using just the energy form of large solar farms, which would still only operate intermittently. That’s what an EROEI of a lousy 1.74 means!!
However a low EROEI means a world without much, if any complexity, meaning it would be impossible to make, because solar panels, inverters etc are highly complex pieces of equipment..
If you can get all the capital, operating and maintenance costs of any energy producing machine over it’s life, it’s fairly easy to work out the EROEI, yet somehow Murphy doesn’t bother with actual costs because it would show his work to be clearly wrong!!
JT:
I won’t insult you like some others.
Indeed, I agree with everything you said. In particular, I agree with, “So the green energy transition hysteria which we are presently experiencing is exactly what he experienced in Nazi Germany.” The historical record says you are right. I remember reading about the pre-war attitude towards the environment was extreme. Here is proof:
“Mankind’s subservience to the commands of nature provides the connecting thread between Nazism and modern-day environmentalism”
https://www.encounterbooks.com/features/nazis-embraced-environmentalism/
So I’m curious, if you don’t believe in protecting the environment, what exactly is it you are proposing?
Instead of just ad hominem attacks on others, state plainly what you believe and how it differs. Should we be working even harder than now to destroy the earth? Is that your reason for anger and disappointment?
So you’re basically looking for an excuse to call environmentalists nazis as a way to vilify the movement, that’s what this is really about.
Coolreit
Very interesting didn’t expect a reference like that.
However the intensity of some of the responses to my post adds weight to Bonhoeffer’s conclusions. The significance is important because as he was demonstrating people with best of intentions can choose an evil end. Not that renewable energy is evil in itself which wasn’t my point, but rather it is unattainable. Pursuing the coarse however will increase fossil fuel consumption which is the very thing we’re trying to avoid. Which by the way is considered evil in today’s world. Ask Greta. So as he concluded stupid is more dangerous than evil because there is nothing you can do about it.
I’m glad a few understood the post for those who thought I was trying to equate environmentalism with Nazism I’m sorry you didn’t understand the post.
Something interesting on a side point is during the Nuremberg trials many of the Nazis could not comprehend why they were being put on trial. They were only following orders. A conclusion drawn by some researchers into those events is that many people find it easier to simply go along with a movement because they want to avoid personal accountability. Rather than take the time to actually understand the situation and make a personal decision about what to do they’d rather go along with the crowd and in the end claim no personal responsibility for their actions.
To that end Noam Chomsky believes the fundamental reason for professional sports (Referring to Football Baseball Soccer) is jingoism. Which is a similar defect that Bonhoeffer defines as stupid. Bonhoeffer also felt that the people least affected tended to spend more time alone ( which might have to do with being able to hear our own thoughts) than in groups or group settings. However some are now convinced that our present situation is far worse now because of social media which creates a persistent group setting and the desire for group acceptance. Isn’t that exactly the situation with ESG?
What a mess!!
JT,
Refusing to take a position is also a position. Your refusal to spell out any alternative suggests if you want to find out who is intellectually bankrupt, you may want to look at the whiner in the mirror. Did people misunderstand you or is your writing just poor?
I assume your position is to do nothing. Keep burning fossil fuels until they’re all gone and there’s ten billion people on a destroyed world. Somehow some dude of average intelligence in wherever with an internet connection is able to make 100% accurate predictions of how the future will turn out and know that there is absolutely no way possible for renewable energy to replace a meaningful amount of fossil fuels. Sorry if I don’t buy it.
We agree that the oil market can not be manipulated without distortions like oil shortages. You say I am wrong, but are Tom Luongo, Eric Nuttall, Mike Rothman, Harris Kupperman, Dr. Mamdouh Salemeh, and Mike Rothman all wrong, too? Most of these energy experts have been energy experts their entire careers. Do you have no respect for these energy experts’ points of view?
Actual oil stocks HAVE been falling and they have been falling, despite a global SPR release of nearly 300 million barrels:
https://twitter.com/ericnuttall/status/1727353819640533137/photo/1
Traditional economics says that when you suppress the price long enough you have shortages and/or high prices.
Coolreit,
SPR is a part of oil stocks in my analysis, I don’t make an arbitrary distinction between commercial and SPR stocks.
So stocks fall by definition in my analysis when the SPR releases stocks.
I agree if prices are artificially held below a market clearing price by whatever means, we would have shortages.
So far there is little evidence of such a shortage, markets seem to be concerned about oversupply instead due to less demand for oil than anticipated.
The futures market seems to be saying they don’t believe that OPEC will make the “voluntary cuts” that have been announced as Brent has fallen $4/b since the announced cuts.
Is the West Texas price currently low enough and/or falling fast enough for LTO drillers to start cutting rigs aggressively like they did last May? There doesn’t seem to be much news around that would support rising prices with OPEC just really extending cuts rather than adding more and economic news mostly negative.
George
I wonder if the CTA’s were sending a message to the drillers at 1:00 PM on Friday when the Rig Report was released. Check the drop in the price of WTI at 1:00.
Maybe American and Canadian Car Buyer’s aren’t as keen on EVs as the rest of the world
Earlier this week, a group of U.S. car dealers warned the Biden Administration that most U.S. car buyers aren’t interested in purchasing electric vehicles, incentives or not.
In a letter addressed to U.S. President Joe Biden, the group asks the Administration to pump the brakes on federal regulations that would require two-thirds of all vehicles sold in the United States in 2032 to be electric—because it simply isn’t what car buyers want, even with the current incentives.
“The reality is that electric vehicle demand today is not keeping up with the large influx of BEVs arriving at our dealerships prompted by the current regulations. BEVs are stacking up on our lots,” the letter read in part.
https://oilprice.com/Latest-Energy-News/World-News/Consumer-Reports-EVs-Are-Less-Reliable-Than-Gasoline-Cars.html
In general, places without domestic oil production are much more eager to find ways to avoid petrol based transport capability collapse and vulnerability in this world of peaking oil and geopolitical discord.
No surprise that China and Europe are out in front on the electrification wave.
North Americans are lucky to have these other places as pioneers.
There are some rare exceptions to this generality, such as Norway. They seem to prefer electric vehicles just because of the big advantages. Same with my wife, who hasn’t been to a gas station in years and who charges up at home for cheap (equal to about $1.50/gallon gas)
Im norwegian living in the us. in norway there is a lot of ev’s because norwegians are rich ftom norways oil resources.
Hickory
“They seem to prefer electric vehicles just because of the big advantages.”
No. They prefer EVs because of the massive subsidies that Norway offer.
“Eye-popping EV subsidies” in place since the 1990s have led to 87% of the country’s new car sales being fully electric, a share that towers over the European Union’s current 13% and the United States’ 7%. EVs in Canada hit 8.4% for battery-electric models and 1.8% for hybrids in the last quarter of 2022, Electric Autonomy Canada reports, for a total of 10.2% of new car sales.
87% in Norway vs 13% in the EU?
https://www.theenergymix.com/norwegian-cities-favour-transit-walking-despite-generous-national-ev-subsidies/
Ovi,
Hickory may have been referring to the subsidy advantages that are offered to EVs in Norway, in addition to lower fuel costs, etc. In any case, I agree the large subsidies are the reason EV ownership has expanded rapidly in Norway.
Did you notice in the Consumer reports piece that plugin hybrids have the lowest reliability of all four types (ICEV, hybrid, BEV, and plugin hybrid)?
Yes I did.
Regardless, I still think it is the way to go if battery materials are going to be the next “PeakXMetal”
We in the USA are not the brightest porch lights on the block.
https://apnews.com/article/automakers-electric-vehicles-us-china-sales-d121c09a61f50e7357f5675af4b6056b
Excerpt:
Electric vehicle sales are expected to hit a record 9% of all passenger vehicles in the U.S. this year, according to Atlas Public Policy. That will be up from 7.3% of new car sales in 2022.
It will be the first time more than 1 million EVs are sold in the U.S. in one calendar year, probably reaching between 1.3 million and 1.4 million cars, the research firm predicts.
Link to consumer reports piece below, Tesla is in middle of pack for overall reliability. I have had few problems with either my 2018 M3 or newer (2022) MY. Before getting my Teslas I drove either Toyotas or Hondas for years (starting in 1984), reliability of the Teslas has been similar (about 75k on M3 and 18k on MY so far).
https://www.consumerreports.org/cars/car-reliability-owner-satisfaction/electric-vehicles-are-less-reliable-than-conventional-cars-a1047214174/
EV sales in the US are up over 50% yoy. This is greater growth than almost anyone anticipated during a year where gas prices have been consistently falling. Over 1 million sold so far in 2023.
https://electrek.co/2023/12/05/us-ev-sales-pass-1-million-2023/
I have owned three EVs and still have one, a Bolt EUV, which my son drives. I switched to a PHEV (Kia Niro) and would not go back to a pure EV any time soon. PHEVs just make so much sense. Most days I never exceed the limited (33 mile) range of my car in a single trip and if I do I get approx 50mpg. But I also have the convenience of fueling at a gas station if I take a long trip. Having attempted long trips in an EV, a PHEV is clearly superior in terms of convenience. EVs and the EV infrastructure are still in development. They may make sense sometime in the future, but for now PHEVs make a lot more sense.
EV Driver,
Which EVs have you owned besides the Bolt?
First generation Nissan Leaf and second generation Nissan Leaf. The Bolt EUV has been a great car and a terrific value, but still suffers from limited and unreliable charging facilities in New York State. Before buying the Kia Niro I considered all the other EV options but they all suffer from the same issue of inconvenient charging facilities. Teslas are, of course, superior for charging but charging stations are few and far between in my part of the country. If I still lived in California, it would be a different story, at least to some extent.
It made me wonder why more emphasis isn’t placed on PHEVs compared to EVs as a way of reducing fossil fuel use. They are a great bridge technology.
EV Driver,
In Maine there is enough charging for Tesla’s, most of my charging is at home, and when I take long trips it is usually along interstate highways where there are plenty of Tesla Chargers in New England, New York, New Jersey and Pennsylvannia, I have not ventured beyond those 9 states, but I imagine along interstates in the US the coverage is pretty good. Glad you are enjoying your plugin hybrid, it is a good bridge technology.
Dennis.
When you take a long trip, how long does it take you to recharge your car?
A relative who lives on the East Coast bought a Ford Lighting this year and he has nothing but good to say about it. However, when he recently came to visit, he didn’t drive it, but instead rented an ICE truck.
He said he was concerned about charging here. We did find that a local hotel has a compatible charger, but it is the only one in our town.
I also wondered if the issue was range and lack of charging for Ford EV’s along his route, which is almost all interstate? My better half thought maybe he didn’t want to drive that nice vehicle on gravel/dirt roads nor put a dead whitetail deer in the bed.
He mentioned that technology was improving to where 700+ mile range would be the norm?
Sorry posting this in the oil thread, but I’m just curious about this after his visit.
I live in an area with few charging stations. I have a neighbor who is an early Tesla owner (2012). He’s still on his second Model S.
There still aren’t many Tesla’s here. The closest dealer is over 2 hours away.
However, there are many plug in hybrids here. I have a co-worker who has a mini van. No complaints.
https://www.reuters.com/world/americas/venezuelans-vote-referendum-disputed-territory-with-guyana-2023-12-03/
Voters in Venezuela rejected the International Court of Justice’s (ICJ) jurisdiction over the country’s territorial dispute with Guyana and backed the creation of a new state in the potential oil-rich Esequibo region in a Sunday referendum.
Count me among those that think Venezuela is a big player in our peak oil future.
It’s called the Monroe Doctrine and Trump threatened to invade to take their oil.
Big fish eats smaller big fish who eats smaller big fish.
https://on.ft.com/46SoNf2
This is exactly what Peter Zeihan has been talking about for a long time.
Ironically its been against jewish and American ships. Not against Russian ships, which he’s been gleefully waiting for.
True – but if this is not dealt with swiftly ( no pun intended) it very well may spread. It’s all about ( lack of) confidence that you can ship stuff a zillion miles and it actually gets to its destination.
A new updated thread on US September Oil Production has been posted.
https://peakoilbarrel.com/us-september-oil-production-new-record-high/
A new open thread Non-Petroleum has been posted.
https://peakoilbarrel.com/open-thread-non-petroleum-december-6-2023/