By Ovi
All of the Crude plus Condensate (C + C) production data for the US state charts comes from the EIAʼs Petroleum Supply monthly PSM which provides updated information up to September 2023.
U.S. September oil production increased by 224 kb/d to 13,236kb/d, a new record high by 236 kb/d over November 2019. The increase was primarily due to increases in the GOM and North Dakota. Note that August production was revised down from 13,053 kb/d to 13,012 kb/d, which accounts for 41 kb/d of the 224 kb/d September increase.
The dark blue graph, taken from the November 2023 STEO, is the forecast for U.S. oil production from October 2023 to December 2024. Output for December 2024 is expected to reach 13,440 kb/d which is 43 kb/d higher than forecast last month. While September production came in at 13,236 kb/d, the EIA weekly production report has been reporting constant production of 13,200 kb/d from the week ending October 6 to November 24 and is consistent with the STEO’s estimate for October and November.
The red OLS line from June 2020 to September 2023 indicates a monthly production growth rate of 63.3 kb/d/mth or 760 kb/d/yr. Clearly the growth rate going forward into the rest of 2023 and 2024, shown by the dark blue graph, is lower than seen in the previous June 2020 to September 2023 time period. From October 2023 to December 2024, production is expected to grow by 245 kb/d. Production is expected to fall from December 2023 to July 2024 before beginning to rise.
While overall US oil production increased by 224 kb/d, the Onshore L48 had a production increase of 91 kb/d to 10,815 kb/d in September. Most of the 91 kb/d came from North Dakota, 79 kb/d.
The light blue graph is the STEO’s projection for output to December 2024 for the Onshore L48. From October 2023, to December 2024, production is expected to increase by 249 kb/d to 11,069 kb/d.
Oil Production Ranked by State
Listed above are the 10 states with the largest US oil production along with the Gulf of Mexico. These 10 states accounted for 81.9% of all U.S. oil production out of a total production of 13,236 kb/d in September 2023.
On a YoY basis, US production increased by 899 kb/d with the majority, 688 kb/d coming from Texas, New Mexico and North Dakota. GOM was up 108 kb/d MoM and up 156 kb/d YoY.
State Oil Production Charts
Texas production decreased by 6 kb/d in September to 5,573 kb/d. However, relative to August’s production reported last month, 5,631 kb/d, September output is down by 58 kb/d. In the EIA’s September report, August was revised down by 62 kb/d to 5,579 kb/d.
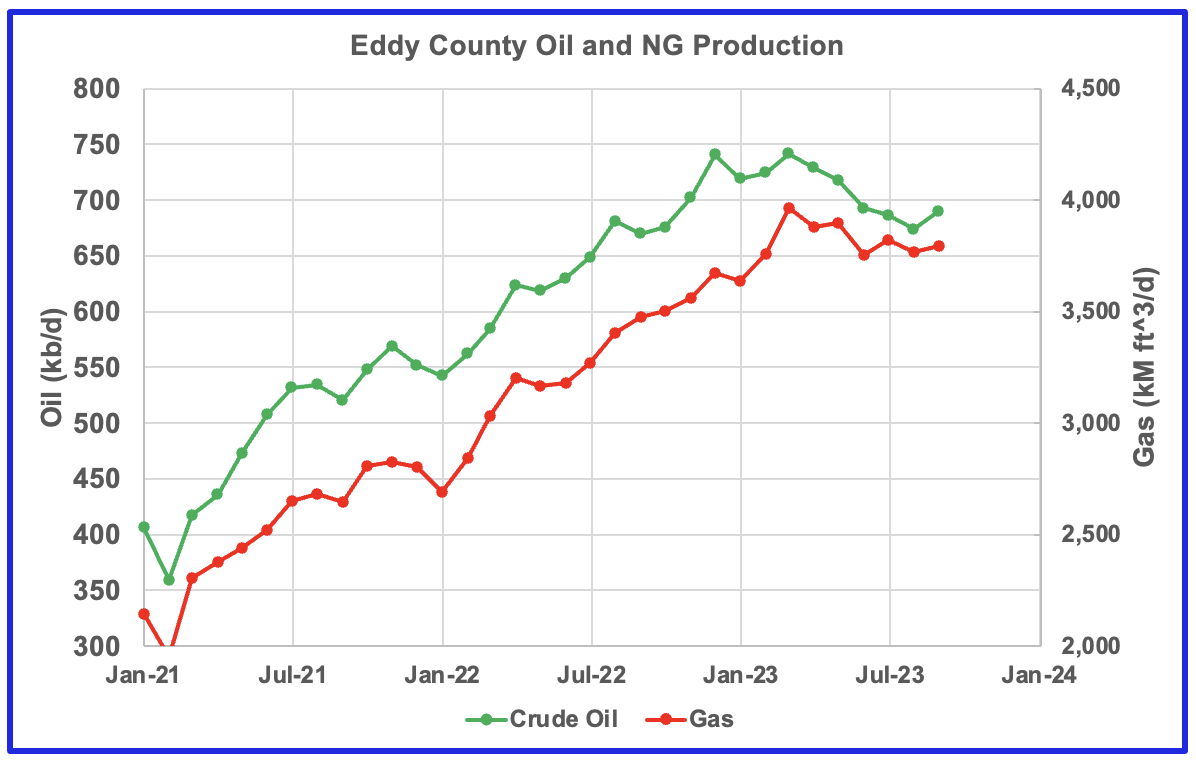
New Mexico’s September production rose by 20 kb/d to 1,818 kb/d. The combined output from Lea and Eddy counties rose by 13 kb/d. It is interesting to see that the Lea + Eddy production trend is similar to the EIA’s for the last two months. The current gap between the NM production report and the EIA’s is 79 kb/d and the majority of that gap will be closed over the next six months as the producers update their information.
Of the EIA’s 1,818 kb/d output from New Mexico, 1,739 kb/d (95.7%) came from the Lea and Eddy counties. The Lea and Eddy county production data for September is not complete and will be updated over the next three months.
More production information from these two counties is reviewed in the special Permian section further down.
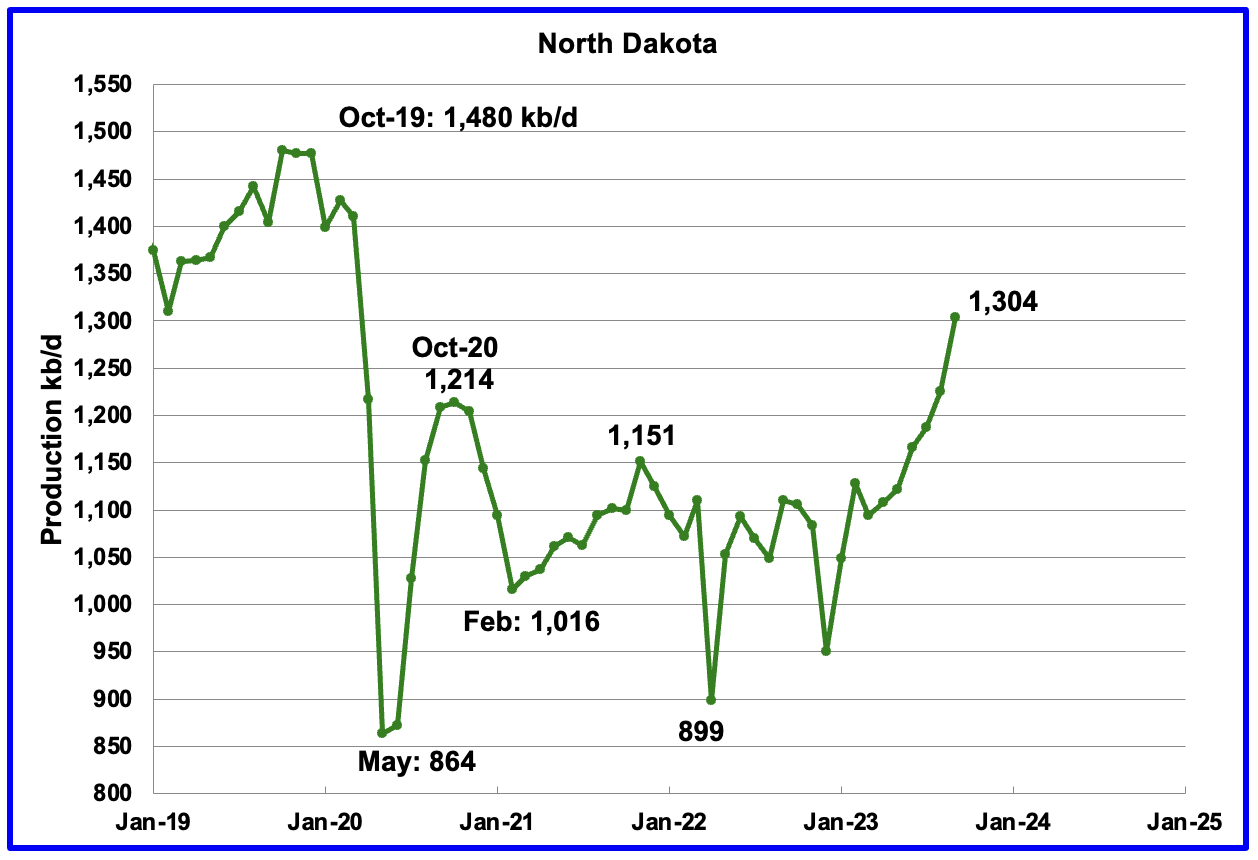
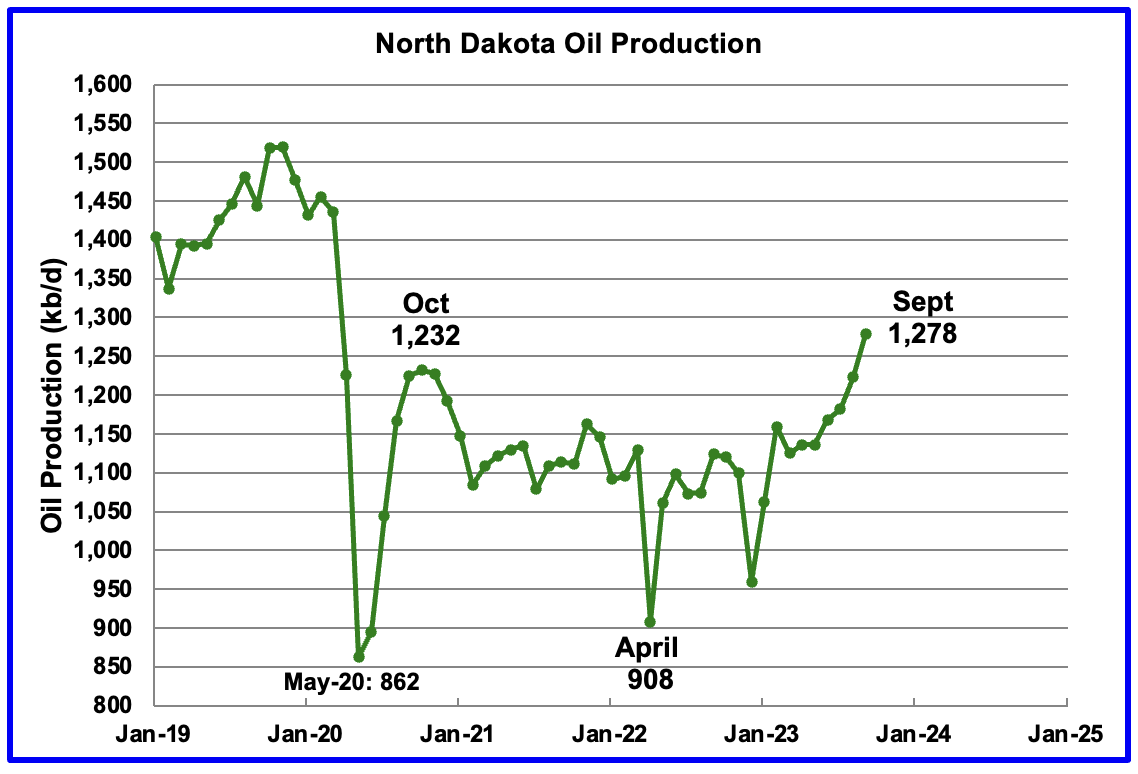
September’s output increased by 79 kb/d to 1,304 kb/d. This is the second post pandemic month in which North Dakota’s output exceeded October’s 2020 rebound production of 1,214 kb/d.
According to this source, production growth for October could be flat or a bit lower due to October snow storms.
“The state’s drilling rig count as of Tuesday was 35, up from an average of 33 in October. The rig count statewide is expected to gradually rise to the mid-forties over the next two years, according to the state Department of Mineral Resources.
Another rig moved out of the Fort Berthold Reservation, highlighting a trend of companies moving beyond the core area of oil production, Mineral Resources Director Lynn Helms said.
Well completion, which is the process needed to prepare a well for production, was at 96 in September, down from 129 in September.”
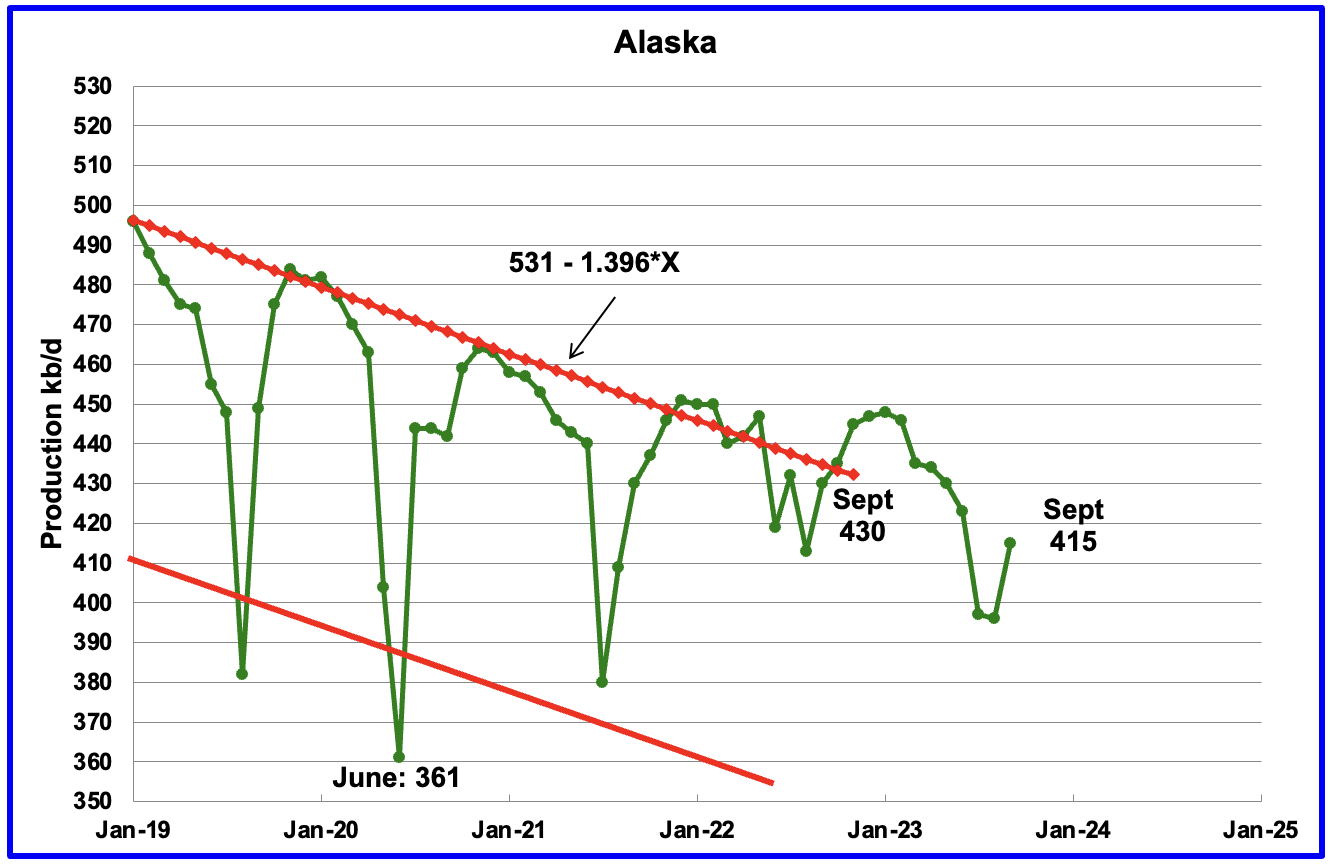
Alaskaʼs September output increased by 19 kb/d to 415 kb/d. Production YoY and two years ago is down by 15 kb/d.
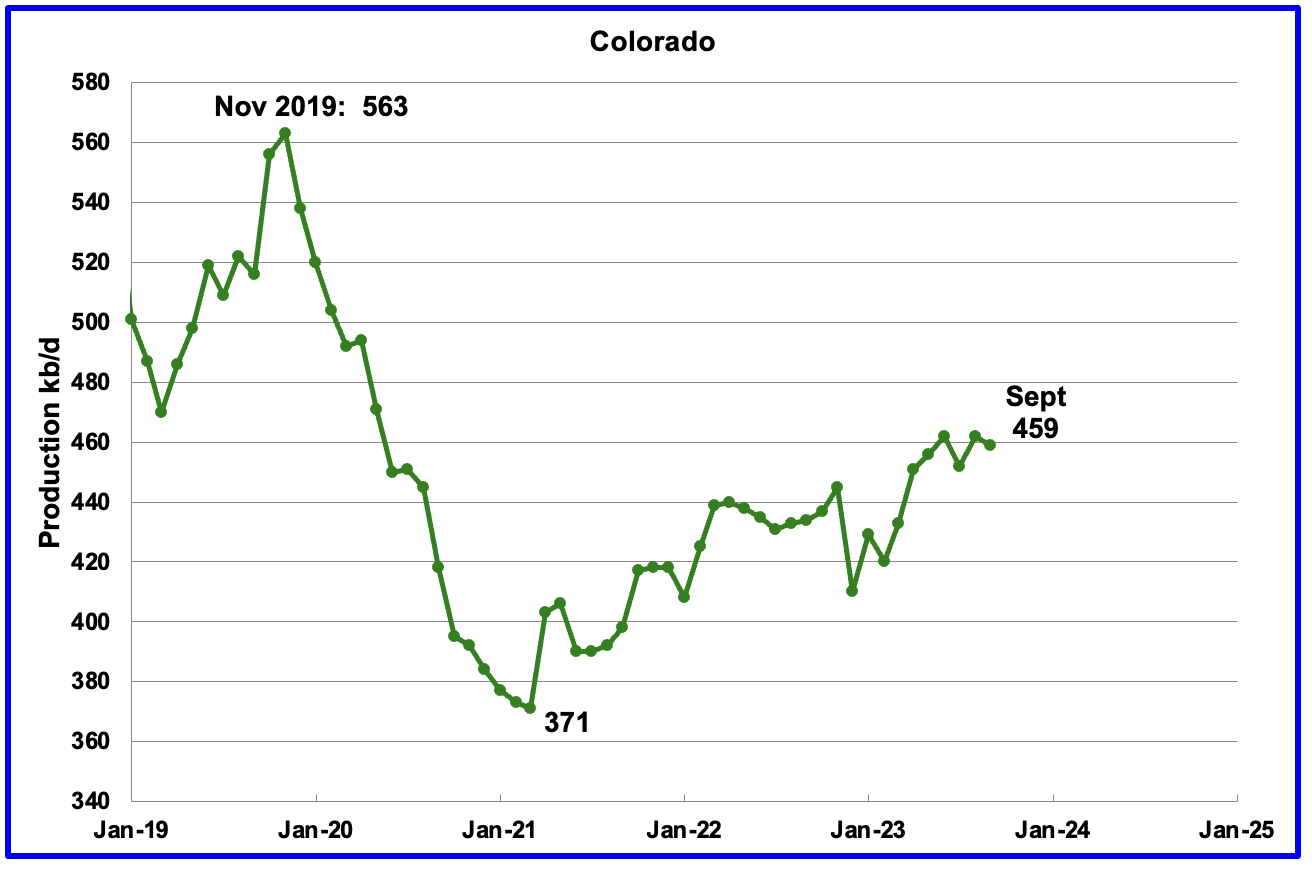
Coloradoʼs September production decreased by 3 kb/d to 459 kb/d.
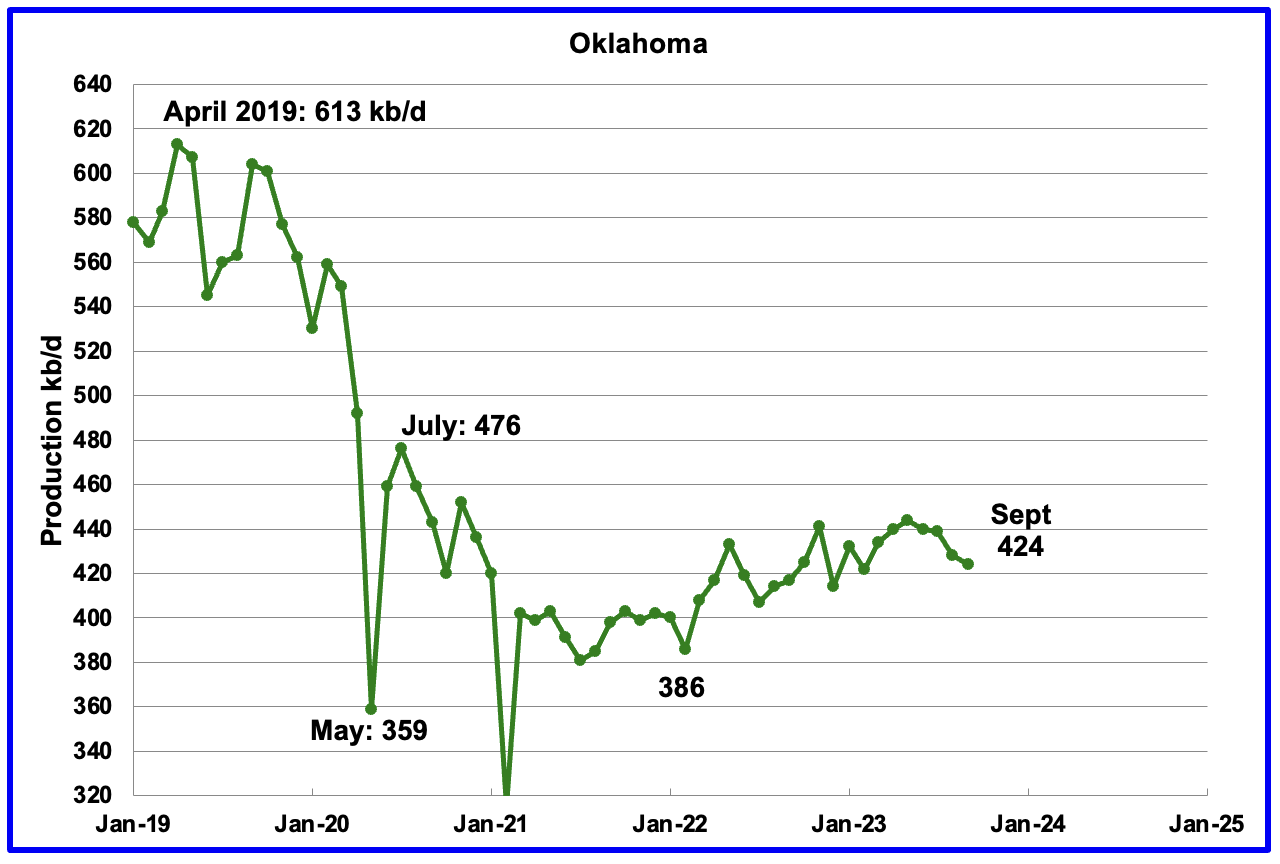
Oklahoma’s output in September decreased by 4 kb/d to 424 kb/d. Production remains 52 kb/d below the post pandemic July 2020 high of 476 kb/d. Output may be in a plateau/declining phase.
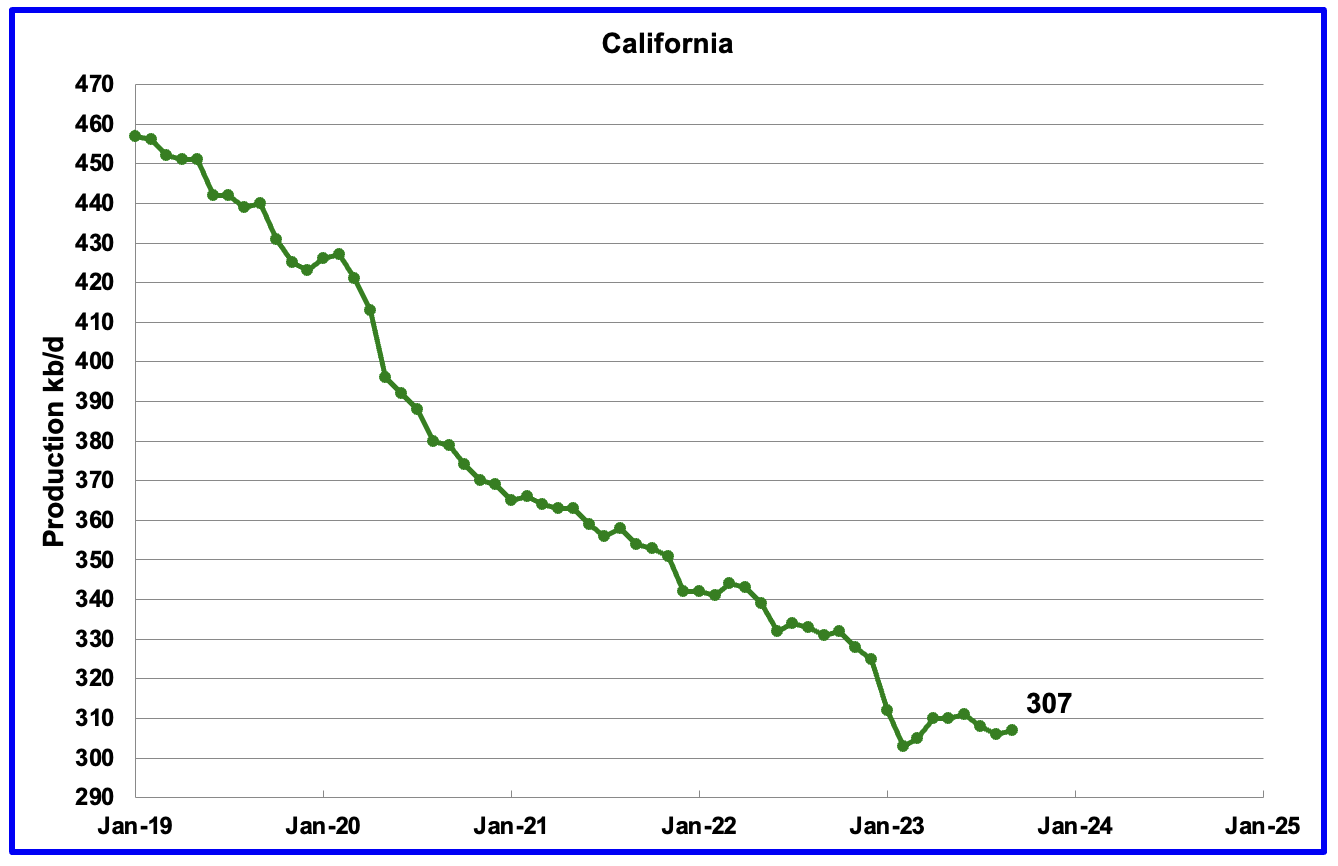
Californiaʼs September production rose by 1 kb/d to 307 kb/d.
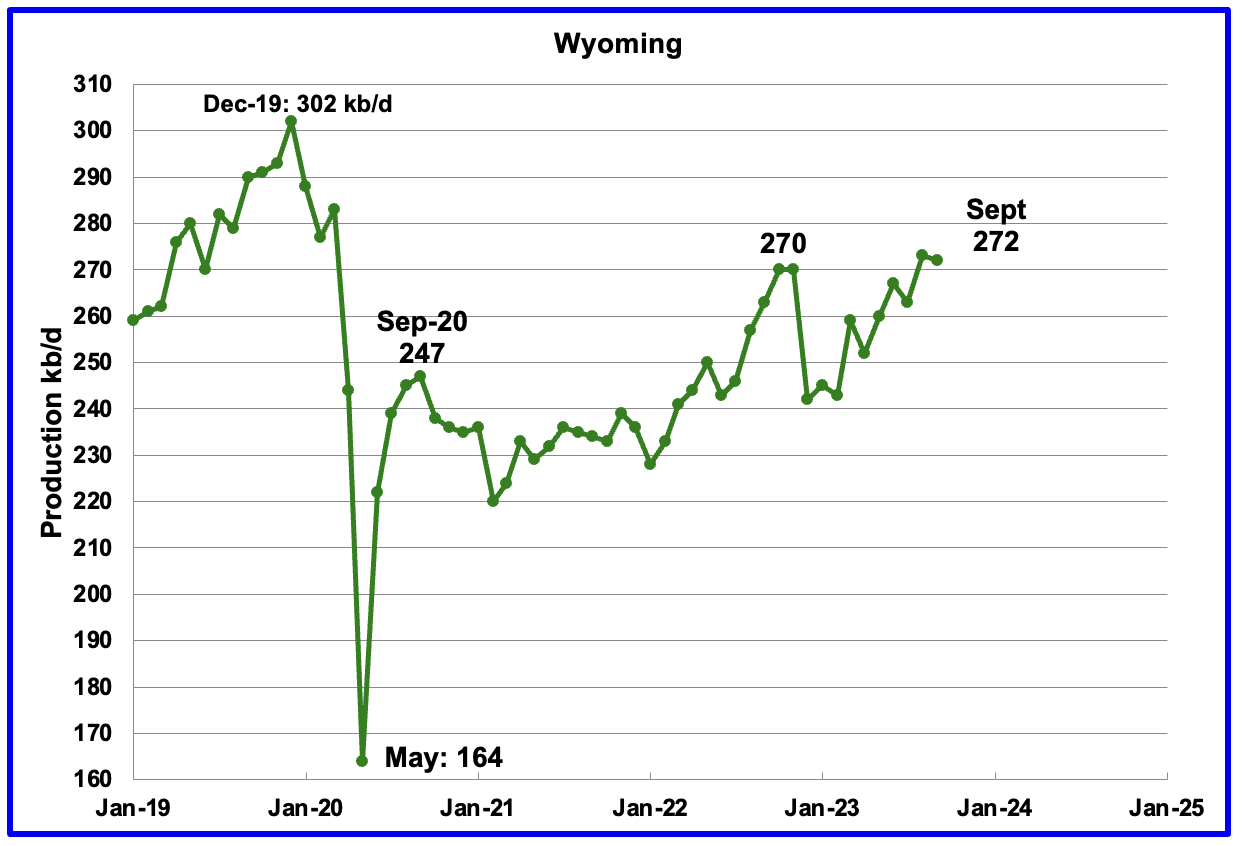
Wyoming’s oil production in October and November 2022 reached a post pandemic high of 270 kb/d and then dropped. Its production has been rebounding since February 2023 and August’s and September’s oil production rose to 273 kb/d and 272 kb/d respectively, exceeding November 2022.
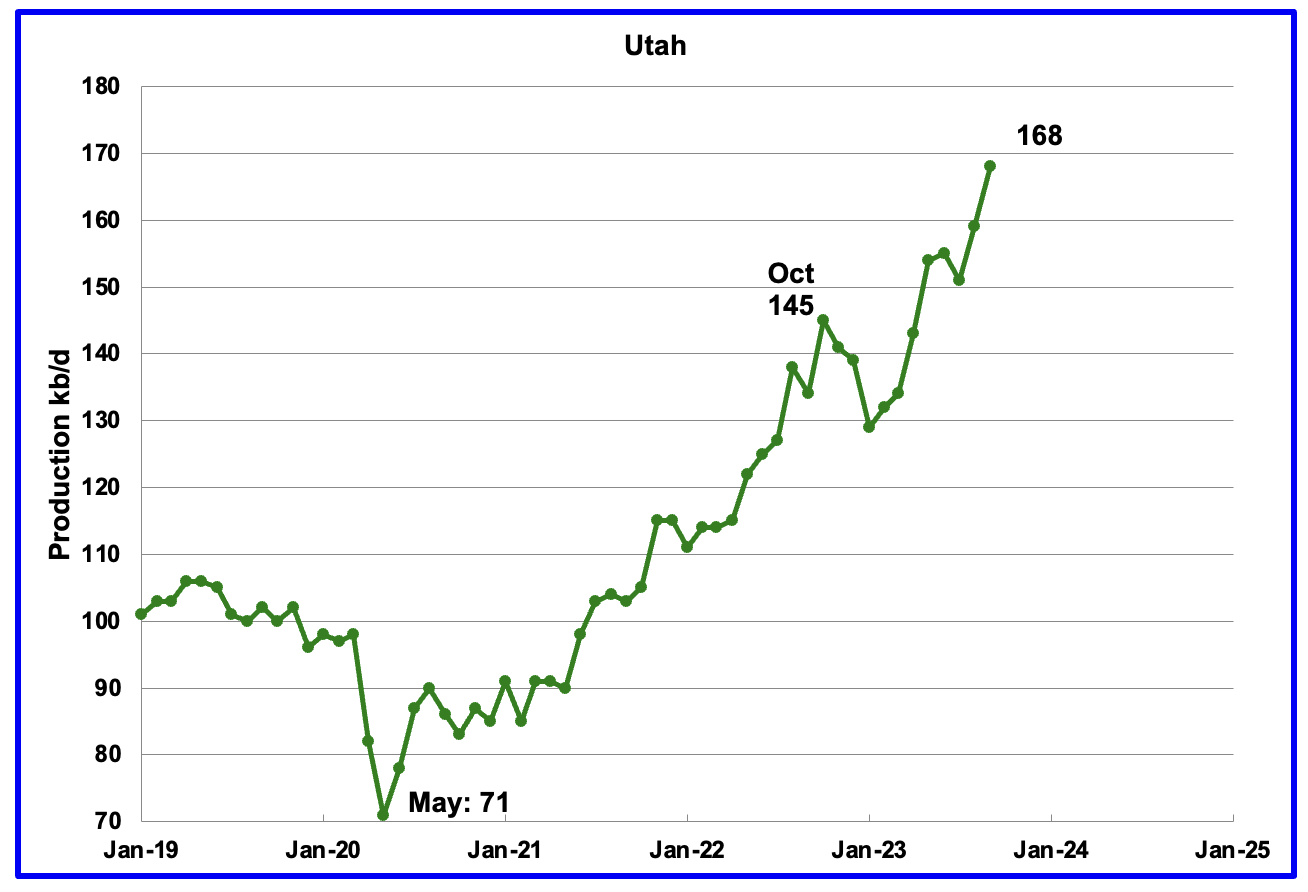
September’s production increased by 9 kb/d to 168 kb/d to another record high. For the first 4 months of 2023, Utah had 7 rigs operating. Since May the number of operational rigs has bounced between 8 and 9, which may account for the increased production.
The increased production since February has come from the Uinta basin.
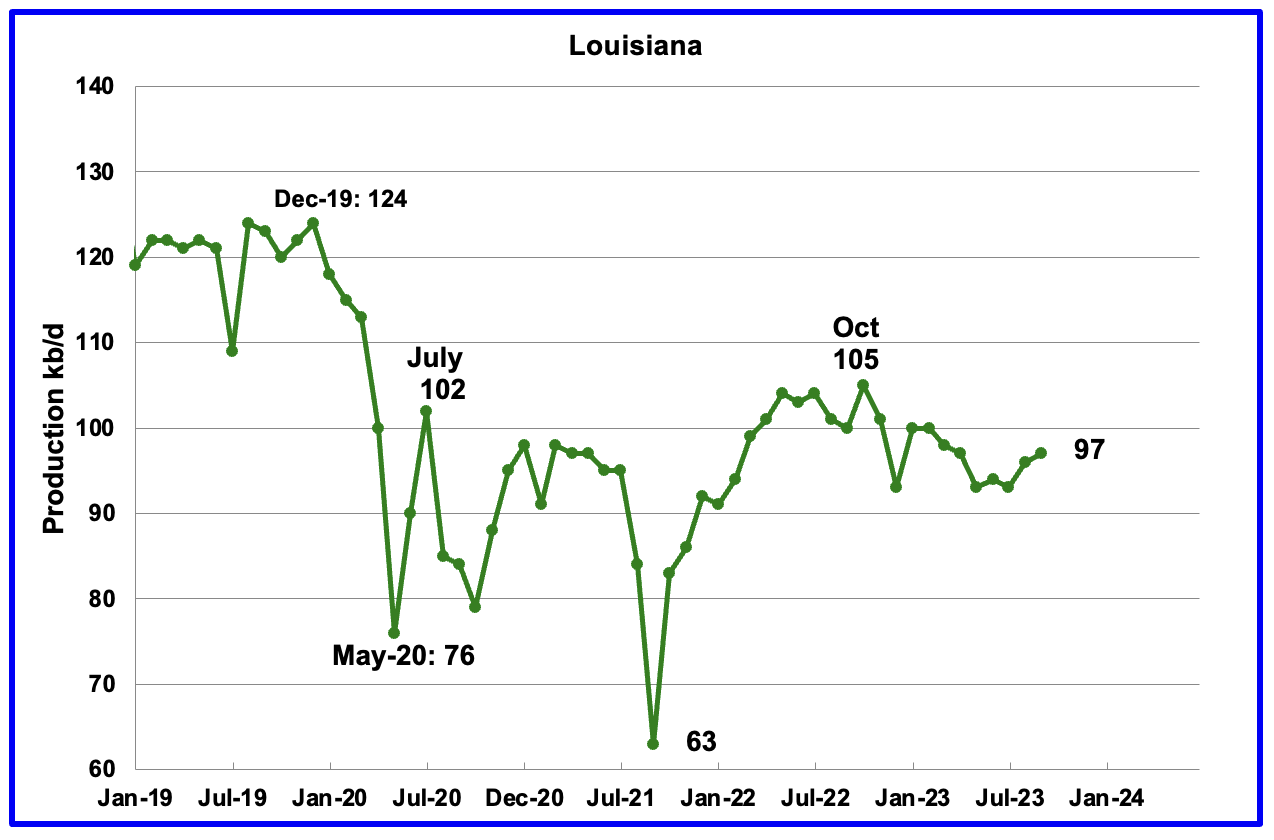
Louisiana’s output entered into a slow decline phase in October 2022. September’s production increased by 1 kb/d to 97 kb/d and is 8 kb/d lower than October 2022.
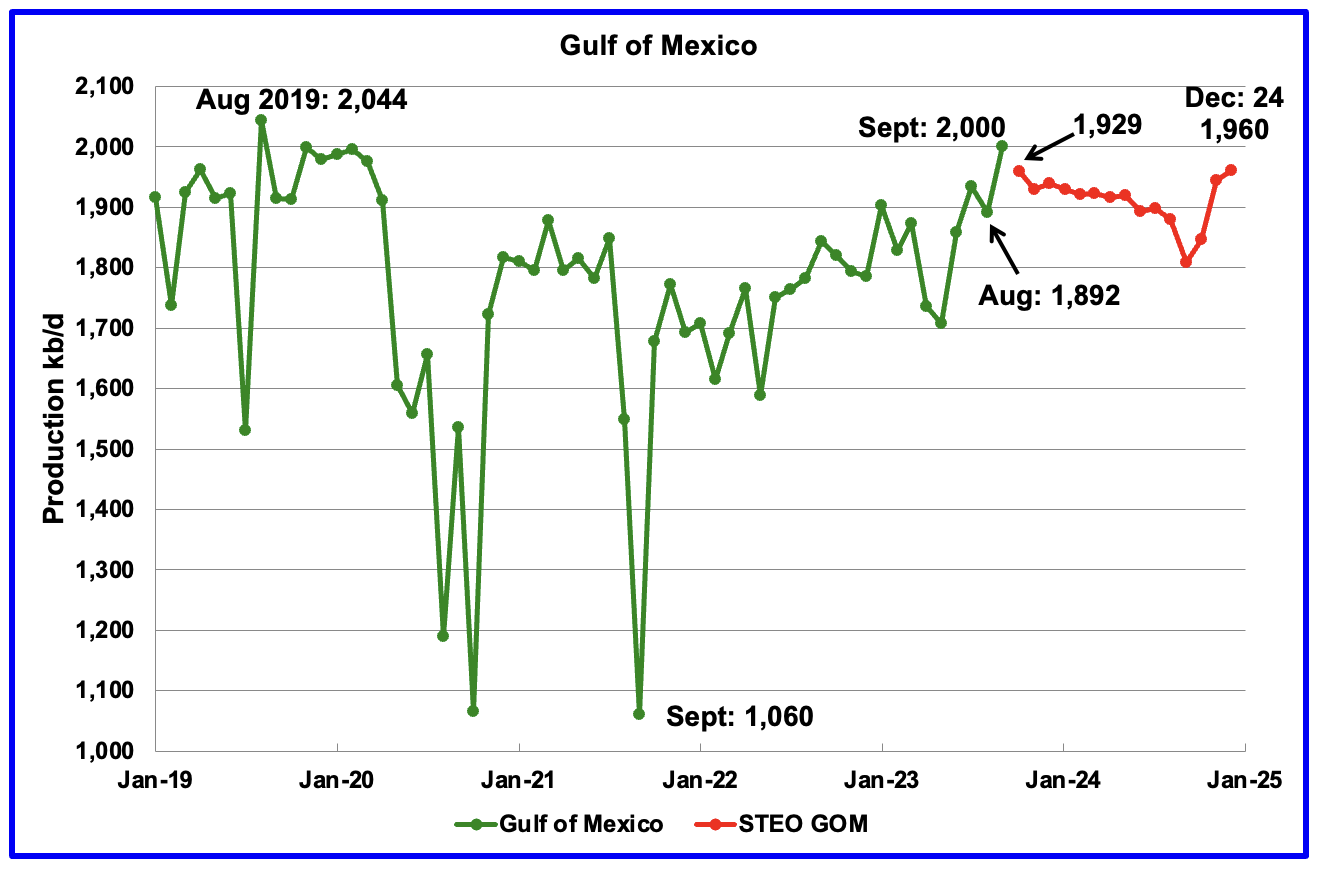
GOM production increased by 108 kb/d in September to 2,000 kb/d, a post pandemic high. From May to September, GOM output grew by 292 kb/d to 2,000 kb/d and is 44 kb/d lower than August 2019.
The November 2023 STEO projection for the GOM output has been added to this chart. It projects that over the next twelve months production will fall close to 1,800 kb/d before rebounding to 1,960 kb/d in December 2024.
It is not known if the GOM decline shown after September 2023 is related to a combination of extensive maintenance and general decline of wells. Also disappointing production from some highly touted wells could be an issue according to this source.
“PowerNap looks like an even bigger disappointment and is declining towards zero having produced less than 5% of its original reserve estimate.”
A Different Perspective on US Oil Production
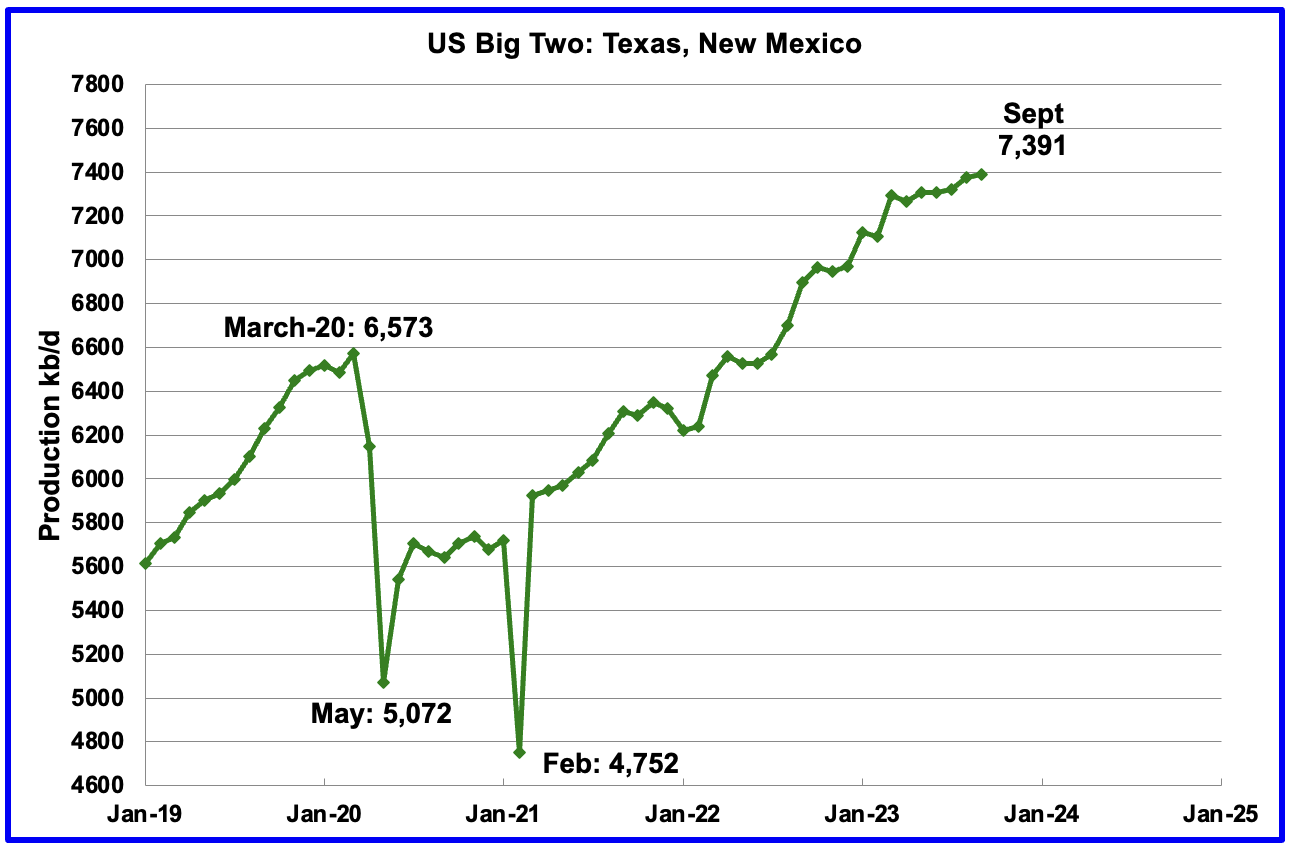
The Big Two states’ combined oil output for Texas and New Mexico.
September’s production in the Big Two states increased by a combined 14 kb/d to 7,391 kb/d with Texas dropping 6 kb/d while New Mexico added 20 kb/d. September production of 7,391 kb/d is 37 kb/d lower than reported last month for August, 7,428 kb/d.
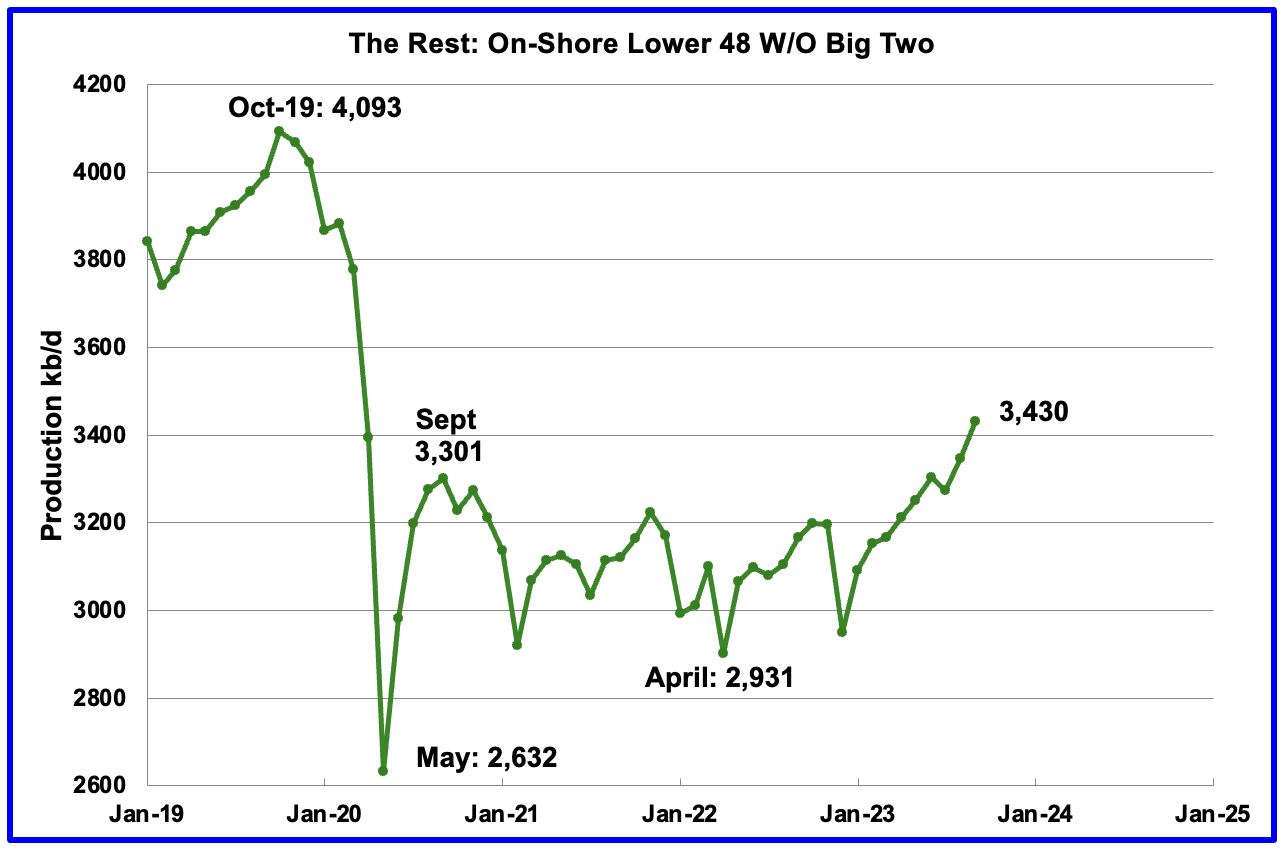
Oil production by The Rest
September’s production in The Rest increased by 93 kb/d to 3,430 kb/d. This is a new high relative to the September 2020 high of 3,301 kb/d. The majority of the 93 kb/d increase came from North Dakota, 79 kb/d. A chart which shows On-Shore lower 48 W/O the big three shows a different trend, next chart.
The main takeaway from The Rest chart is that current production is 663 kb/d below the high of October 2019 and this appears to be a permanent loss that will never be recovered.
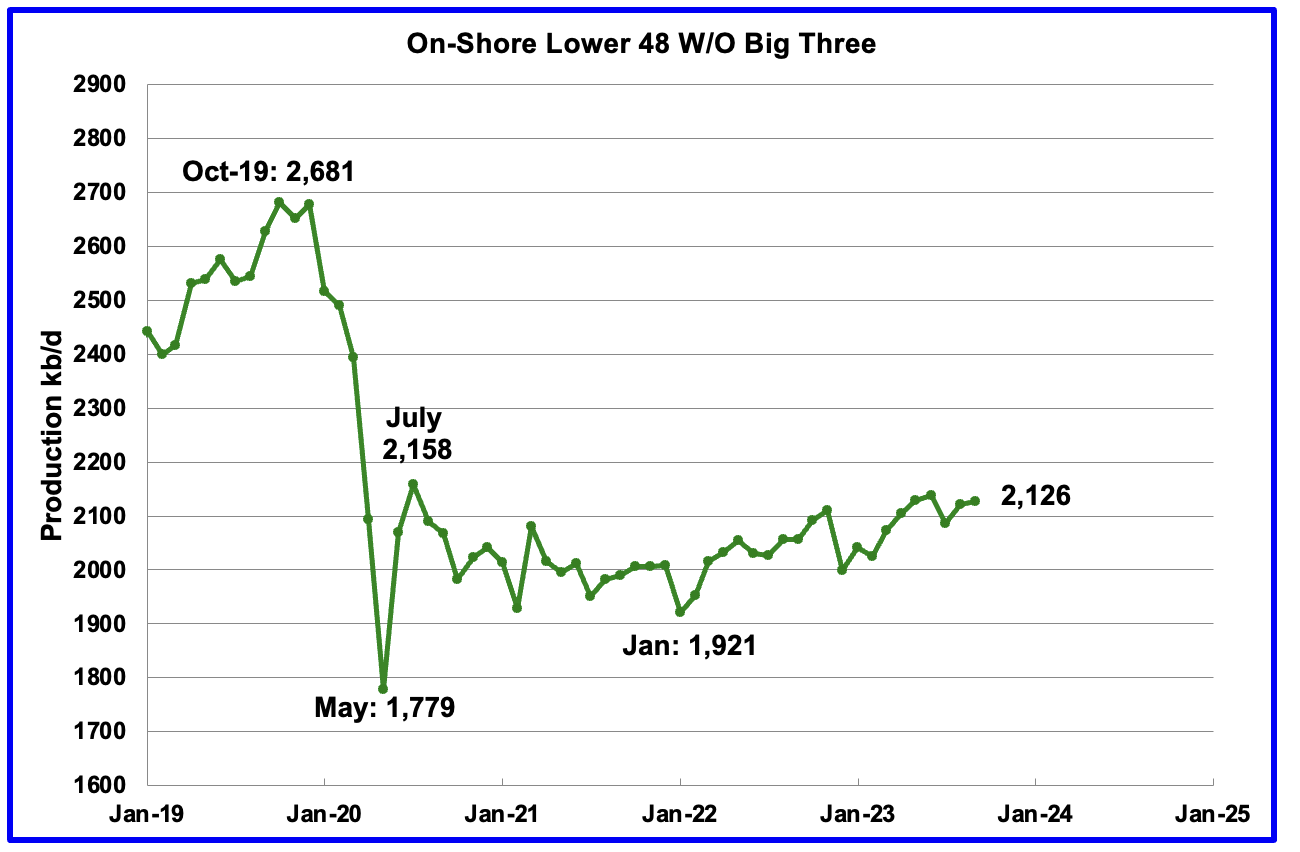
The On-Shore lower 48 W/O the big three shows a slow rising trend from the low of January 2022. It is still 32 kb/d lower than the post covid rebound to 2,158 in July 2020.
Permian Basin Report by Main Counties and Districts
This monthly Permian section has being added to the US report because of a range of views on whether Permian production will continue to grow or will peak over the next year or two. The issue was brought into focus recently by the Goehring and Rozencwajg Report which indicated that a few of the biggest Permian oil producing counties were close to peaking or past peak. Also comments by posters on this site have similar beliefs from hands on experience.
This section will focus on the four largest oil producing counties in the Permian, Lea, Eddy, Midland and Martin. It will track the oil and natural gas production and the associated Gas Oil Ratio (GOR) on a monthly basis. The data is taken from the state’s government agencies for Texas and New Mexico. Typically the data for the latest two or three months is not complete and is revised upward as companies submit their updated information. Note that the natural gas production shown in the charts that is used to calculate the GOR is the gas coming from both the gas and oil wells.
Of particular interest will be the charts which plot oil production vs GOR for a county to see if a particular characteristic develops that indicates the field is close to entering the bubble point phase. While the GOR metric is best suited for characterizing individual wells, counties with closely spaced horizontal wells may display a behaviour similar to individual wells due to pressure cross talking . For further information on the bubble point and GOR, there are a few good thoughts on the intricacies of the GOR in an earlier POB comment. Also check this EIA topic on GOR.
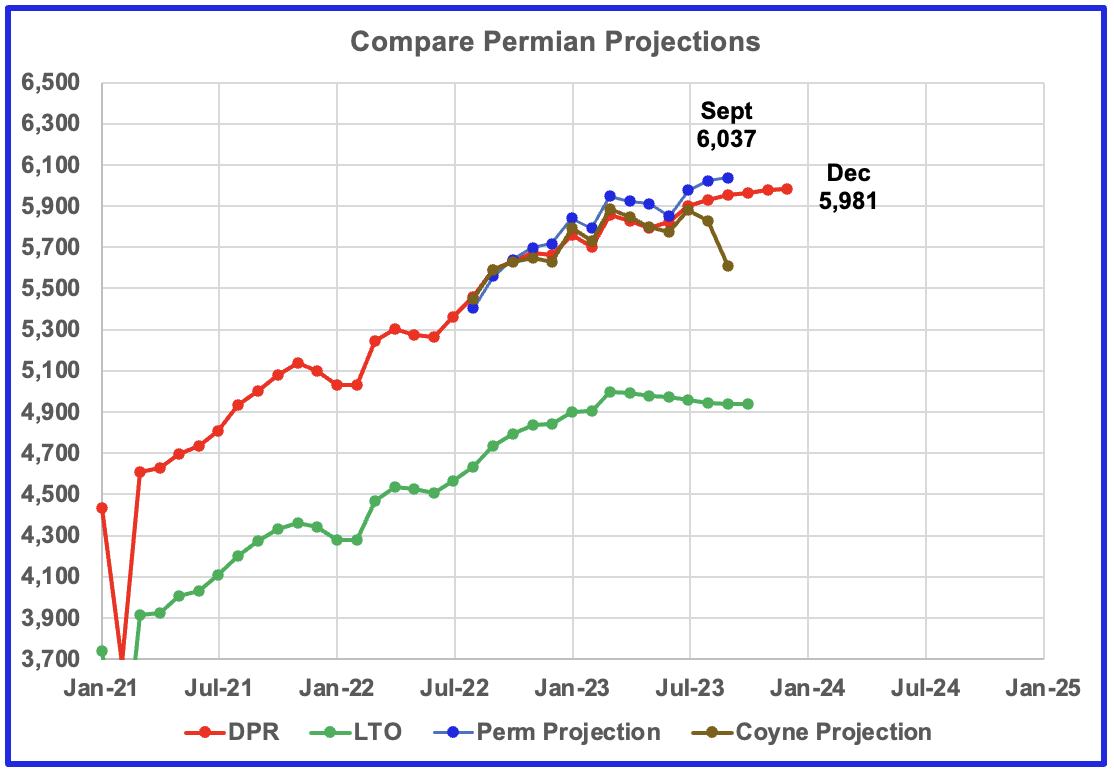
This chart shows four oil production projections for the Permian basin. The gap between the DPR and LTO projections is there because the DPR projection includes both LTO oil along with oil from conventional wells in the basins that it covers.
The red and green graphs show production as published by the EIA’s DPR and the LTO offices. Comparing the two, it appears that the LTO office believes Permian LTO production is declining while the DPR office is showing a bit more growth before plateauing. The brown and blue markers are projections by D Coyne and yours truly respectively based on different methodologies.b
The blue chart only uses two months of production data to make its first projection. A few more months of data is required to refine and modify the methodology.
New Mexico Permian
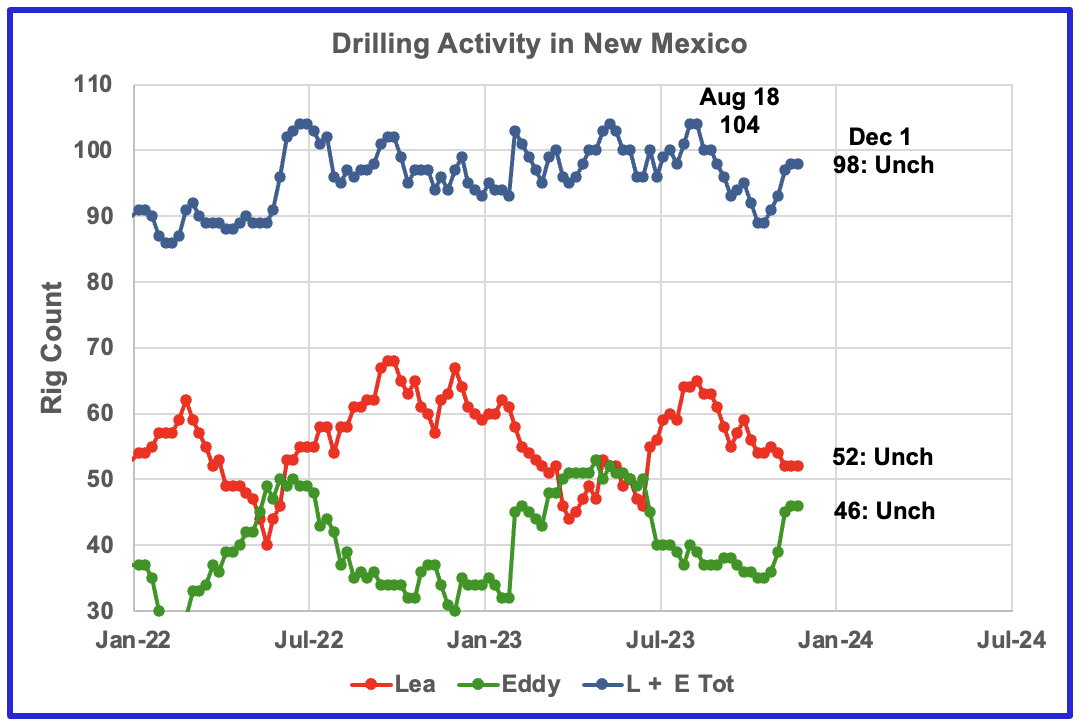
Over the past 5 weeks drilling activity in Lea has been dropping while it has increased in Eddy county. For the week ending December 1, the rig count in both counties did not change. The total NM rig count is down by 6 from a high of 104 in August.
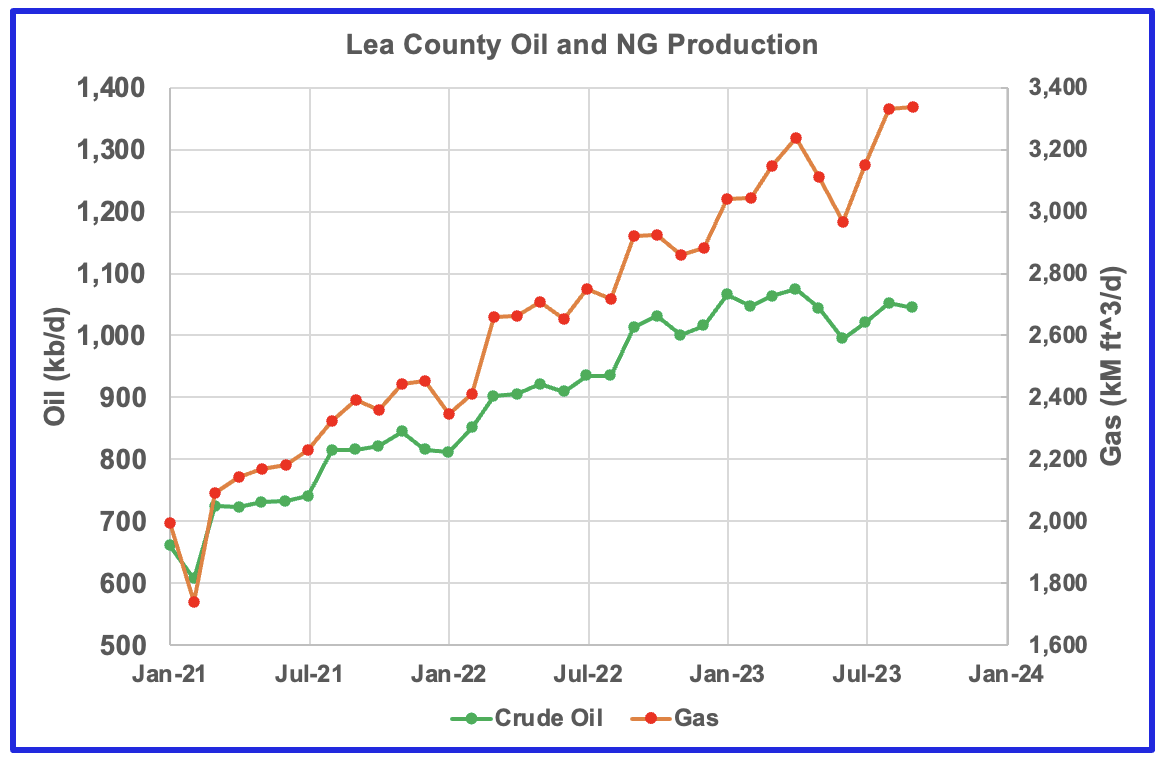
Over the last three months gas production has risen faster than oil production in Lea county. September oil production saw a decrease of 8 kb/d to 1,044 kb/d.
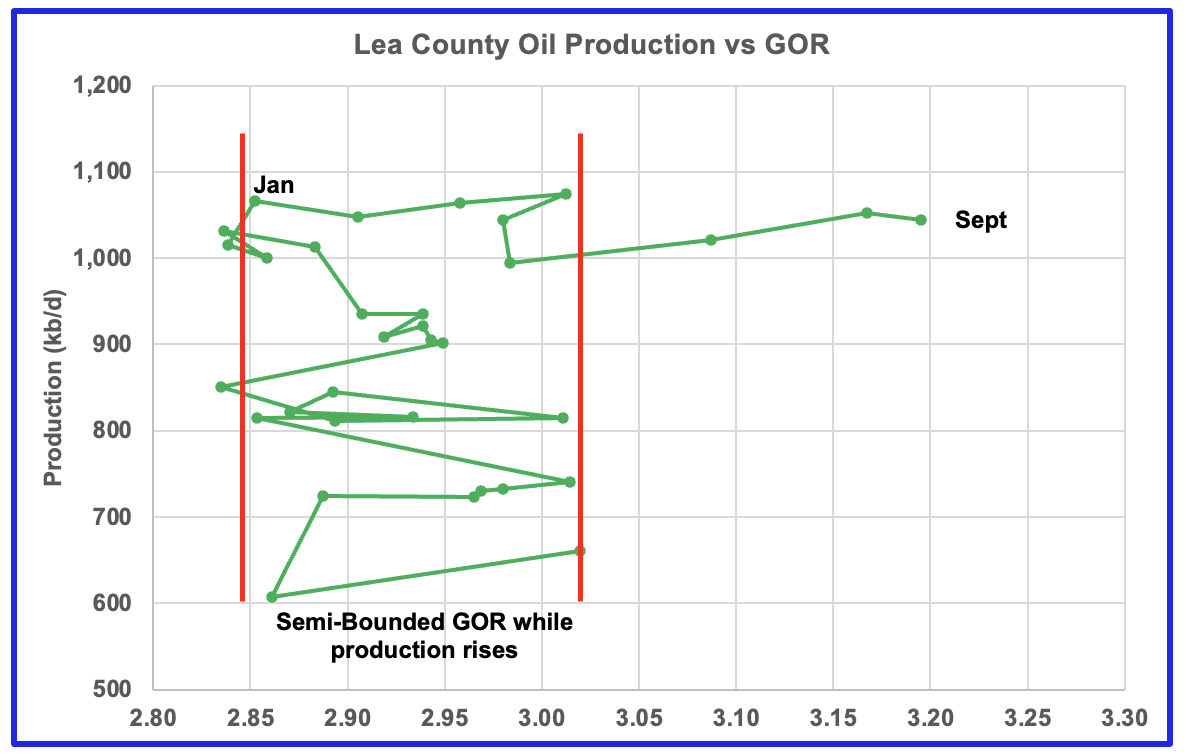
After much zigging and zagging, oil production in Lea county stabilized above 1,000 kb/d while the GOR started to increase in February and exceeded the semi-bounded GOR in July while production remained relatively flat. The data for the last three months, July to September, is incomplete.
This pattern of a zigging and zagging GOR within a semi-bounded GOR while oil production increases to some stable level and then moves out to a higher GOR to the right has shown up in a number of counties. See an additional three cases below. This is the third month in which Lea county has registered a GOR outside the semi-bounded GOR range.
Eddy county oil production is showing early signs that is has peaked.
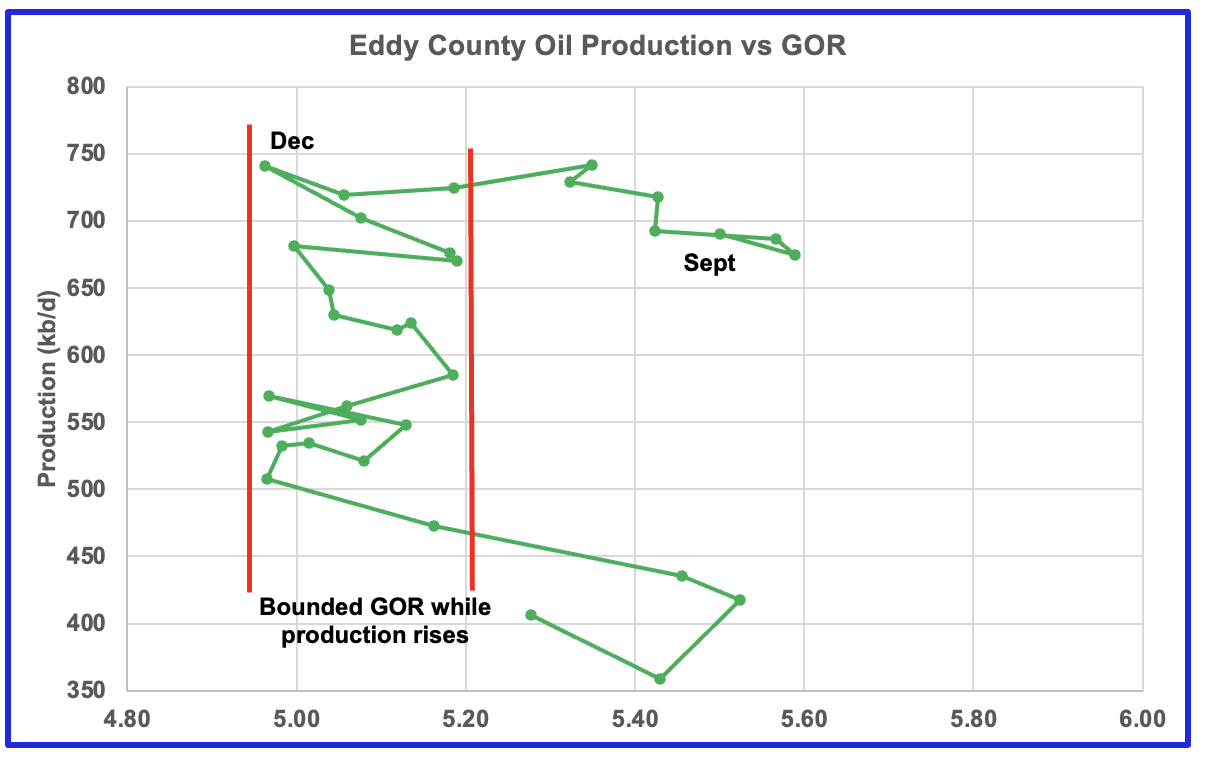
The Eddy county GOR pattern is similar to Lea county except that Eddy has broken out from the semi bounded range for a longer period while oil production has been dropping. Does the September reversal in the GOR indicate that most of the wells in this county are in the bubble point phase and most of the gas has been released?
Texas Permian
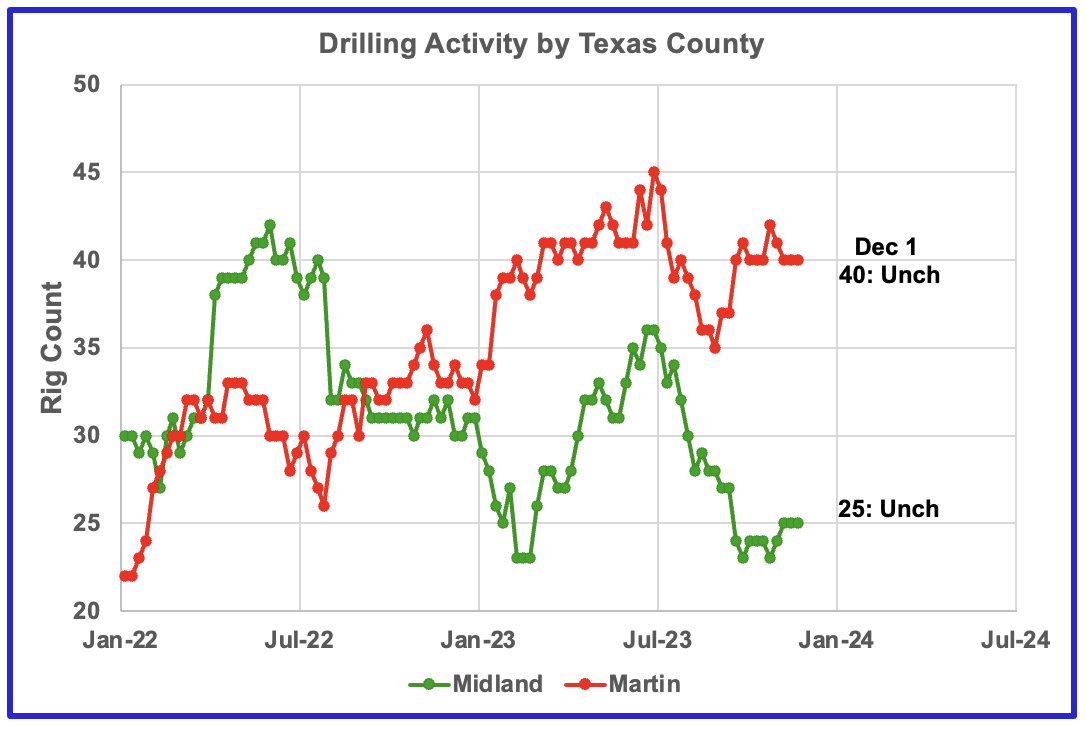
During November drilling activity increased in Midland county while it dropped in Martin county. Since these two counties are adjacent, could these rigs just be moving between counties?
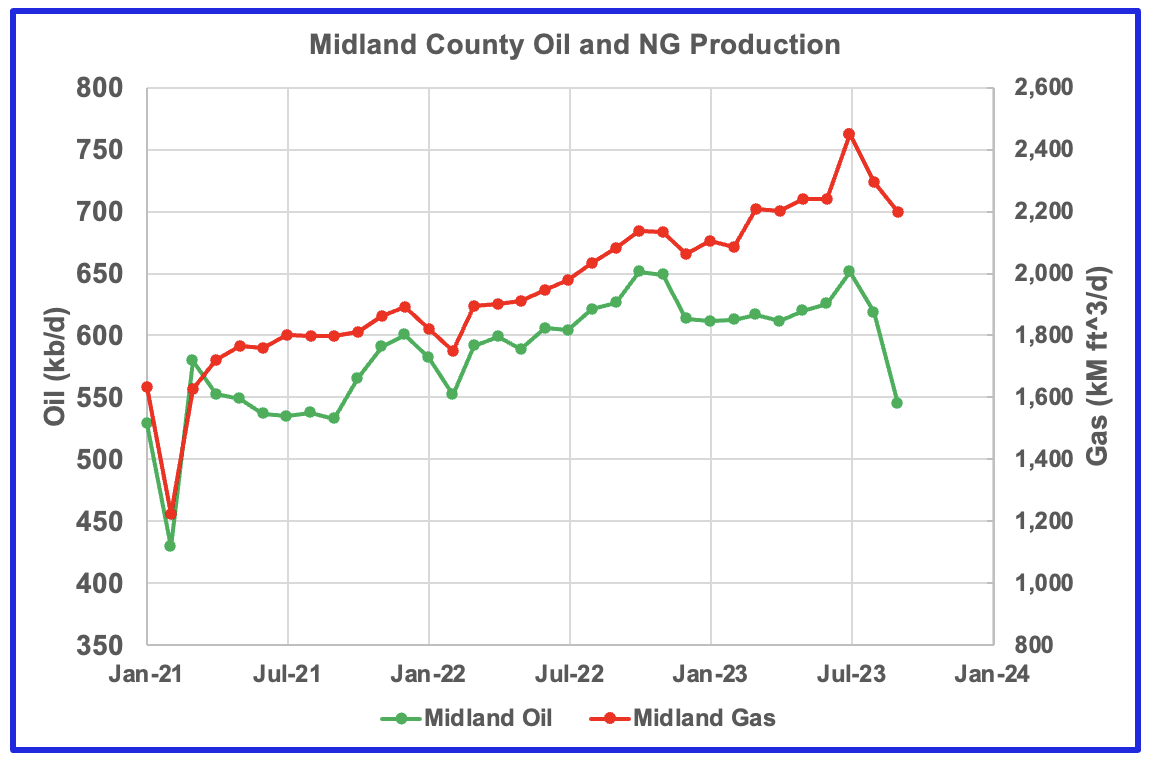
Both natural gas and oil production are dropping in Midland county. Cannot find any explanation for the July spike in oil and gas production.
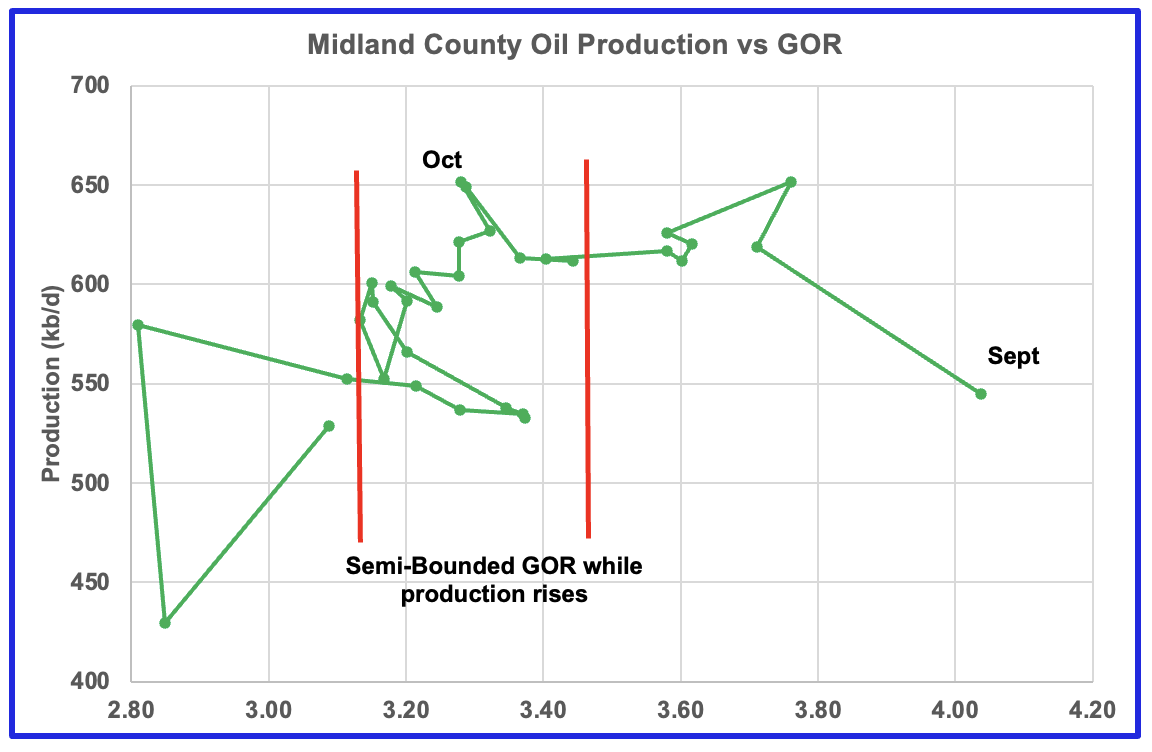
Oil production is dropping and the GOR is increasing . It appears that Midland has entered the bubble phase?
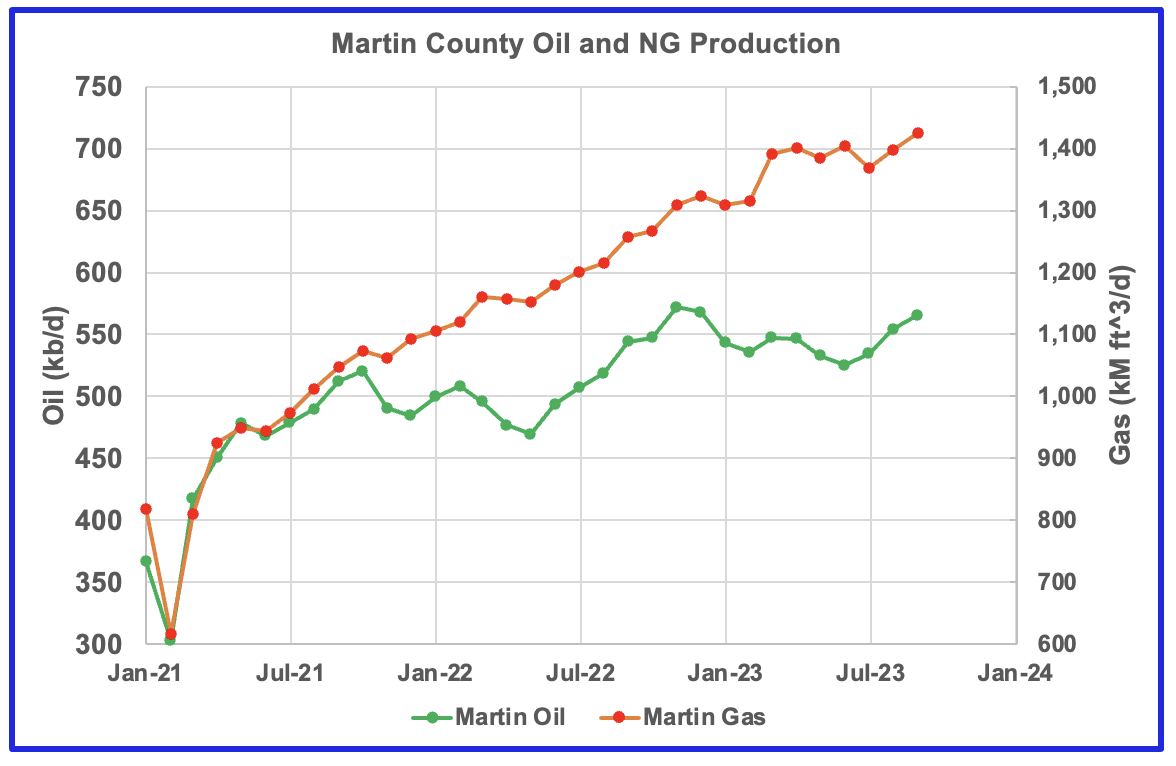
Both natural gas and oil production are increasing in Martin county.
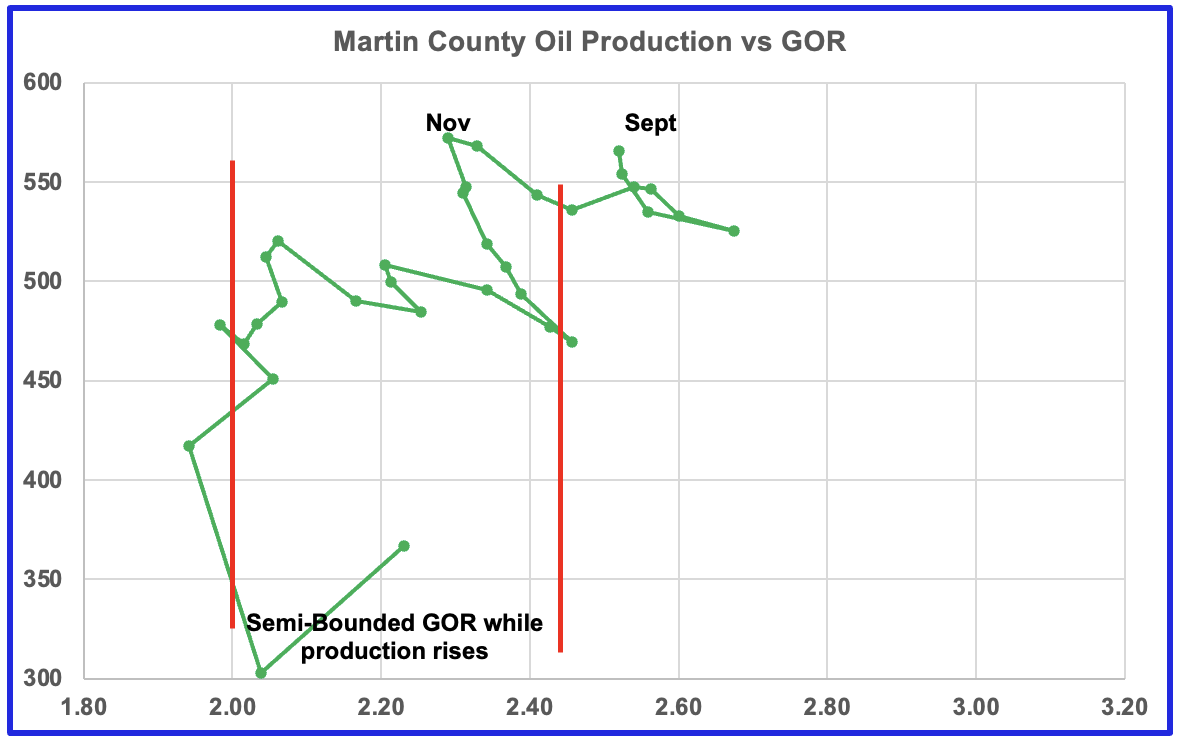
Martin county is displaying a new trend of increasing oil production and a decreasing GOR.
Three of the four oil production vs GOR charts above are exhibiting characteristics indicating that three of the largest oil producing counties in the Permian are in the bubble point phase and are close to or past their peak? Not clear as to what is happening in Martin County.
Eagle Ford’s Biggest Oil producing County
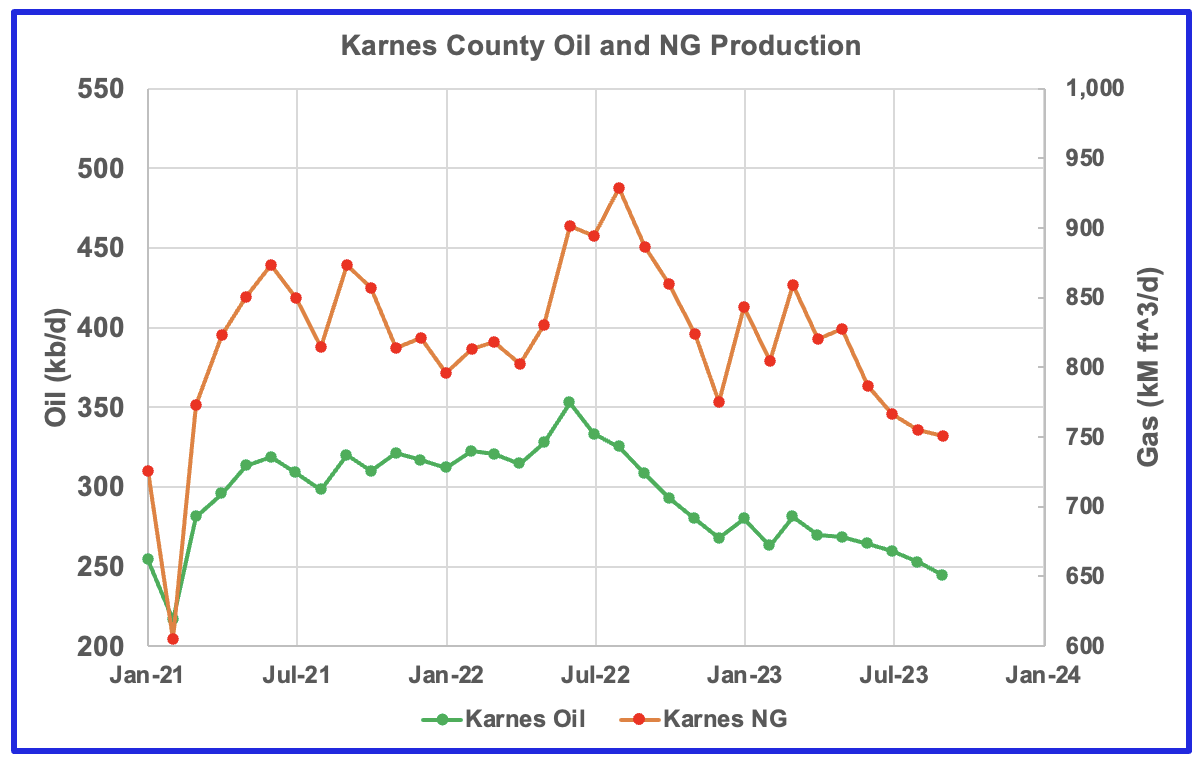
Both oil and gas production are falling in Karnes county and both are down close to 30% from the peak.
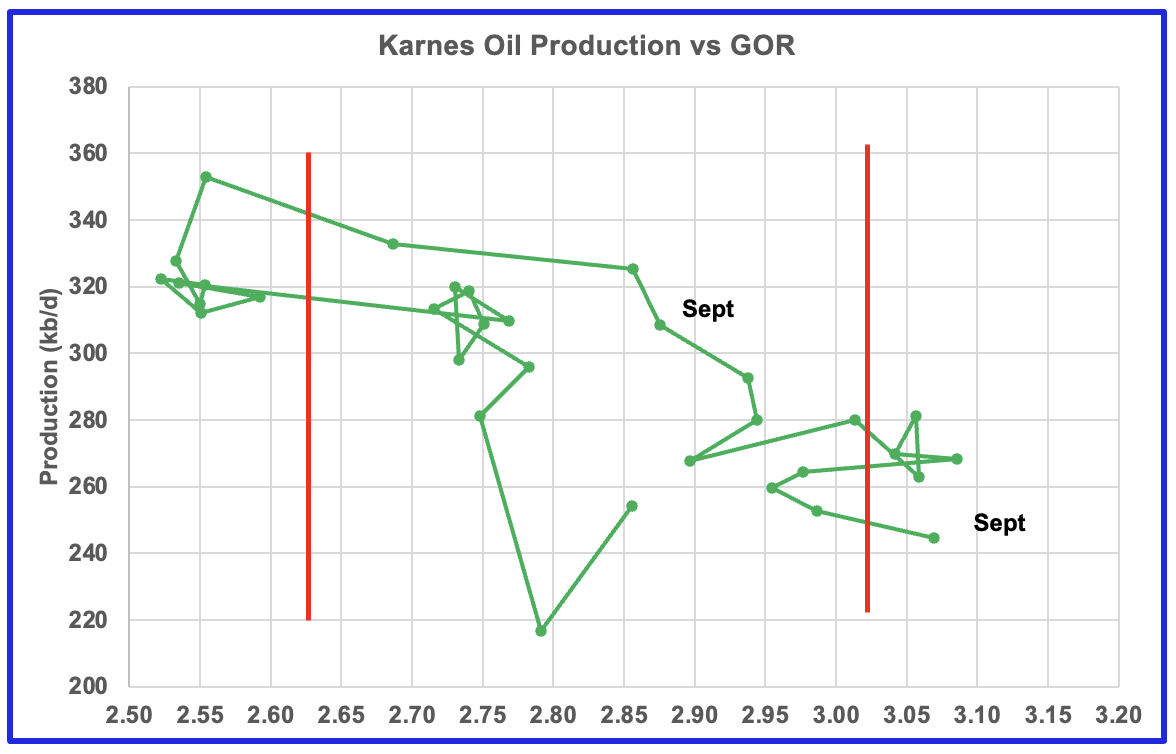
This is the GOR vs oil production for Karnes county but the GOR is still within its typical range while production is dropping. This may indicate that Karnes county wells have not entered the bubble point phase or weren’t very gassy to start with.
Drilling Productivity Report
The Drilling Productivity Report (DPR) uses recent data on the total number of drilling rigs in operation along with estimates of drilling productivity and estimated changes in production from existing oil wells to provide estimated changes in oil production for the principal tight oil regions. The November DPR report forecasts production to December 2023 and the following charts are updated to December 2023. The DUC charts and Drilled Wells charts are updated to October 2023.
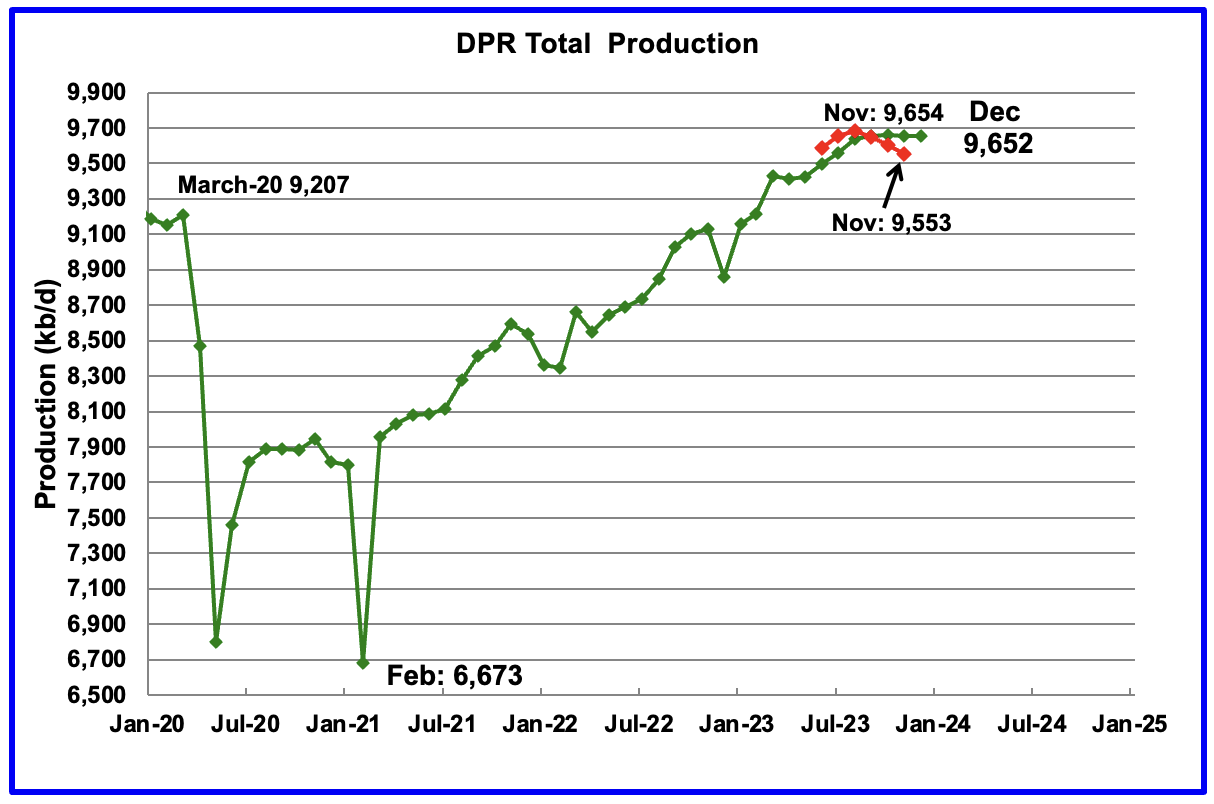
Above is the total oil production projected to December 2023 for the 7 DPR basins that the EIA tracks. Note that DPR production includes both LTO oil and oil from conventional wells.
The DPR is projecting that oil output for December 2023 will decrease by 2 kb/d to 9,652 kb/d.
While the green graph shows DPR production being essentially flat since September, it also had a significant upward revision to its production since the last report, red graph. For November, total DPR production has been revised up by 101 kb/d, from 9,553 kb/d to 9,654 kb/d with the biggest increase occurring in the Permian basin.
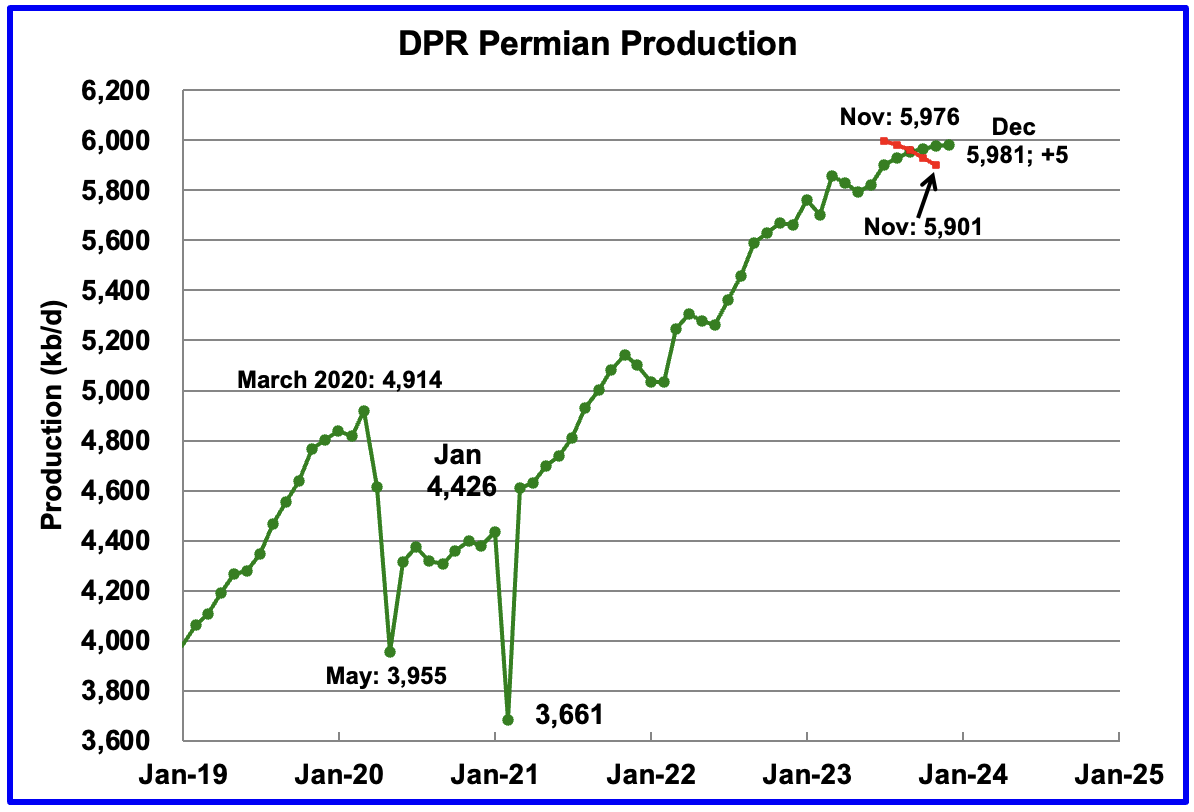
According to the EIA’s DPR report, Permian output growth continued its slow rise in December. It is expected to increase by 5 kb/d to 5,981 kb/d. The last four months of production data clearly shows a dropping trend in monthly production growth.
In addition to the small production increase in December, Permian production was revised up. November production in the previous report, red markers, has been revised up from 5,901 kb/d to 5,976 kb/d, an increase of 75 kb/d.
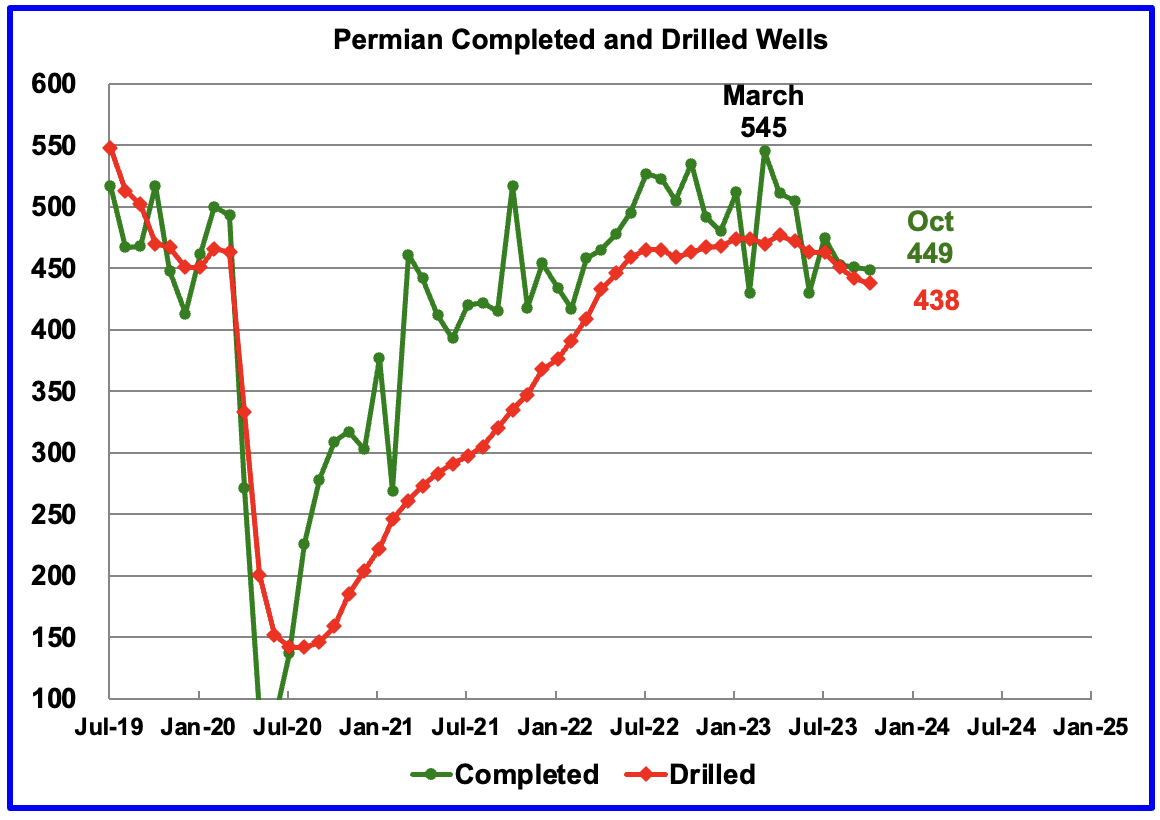
During October, 438 wells were drilled and 449 were completed in the Permian. (Note that October is the latest month for DUC information). The completed wells added 408 kb/d to October’s output for an average of 909 b/d/well. The overall decline was 395 kb/d which resulted in a net increase for Permian output in October of 13 kb/d. Of the 449 completed wells in October 434 were required to offset the decline.
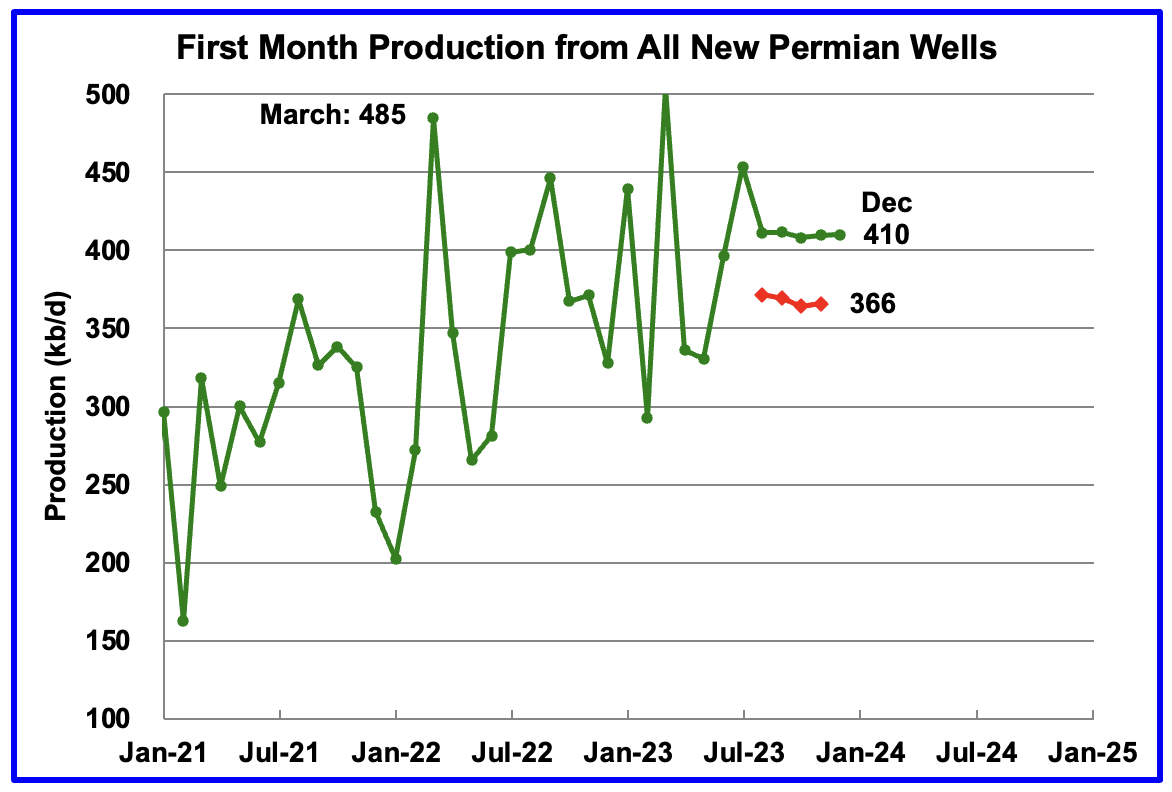
This chart shows the average first month total production from Permian wells tracked on a monthly basis. The total monthly production from the newest Permian wells in December is expected to be 410 kb/d. This is an 11% production increase over the rate reported last month, red markers.
Recall that this production of 410 kb/d is offset by a decline of 405 kb/d for a net overall output increase in the Permian basin of 5 kb/d.
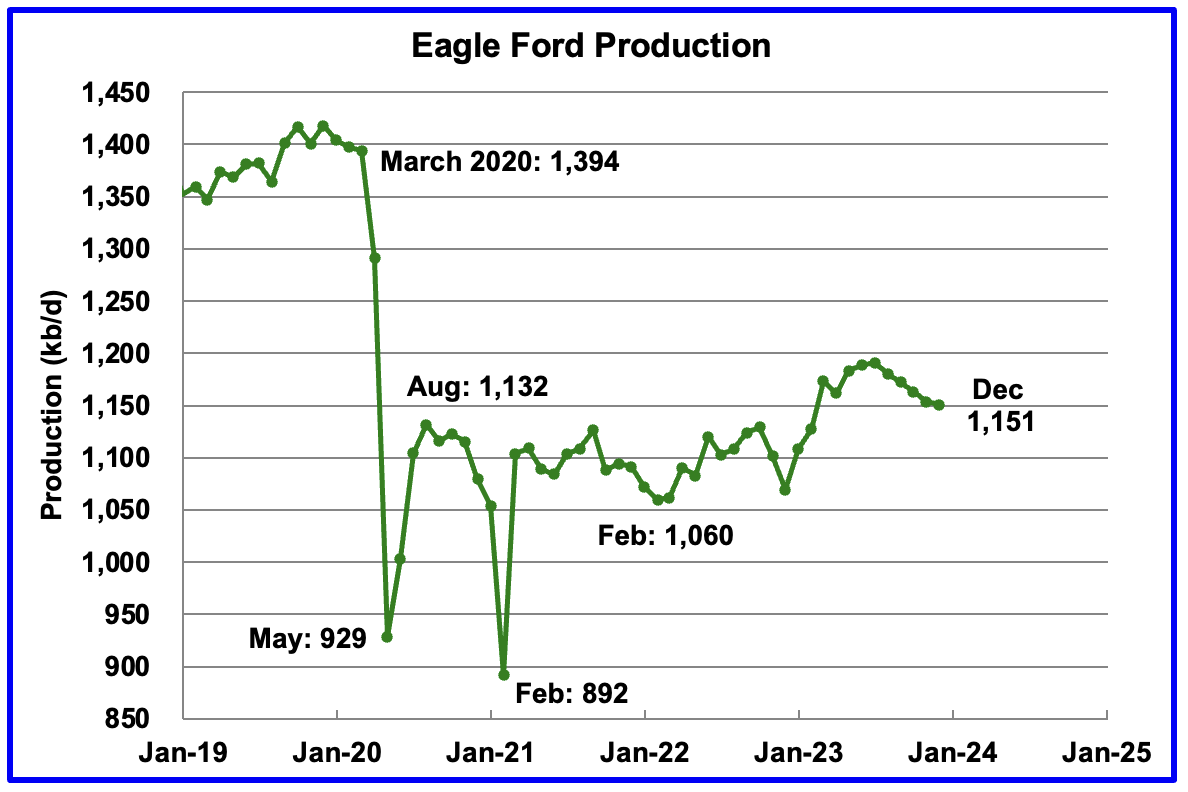
Output in the Eagle Ford basin has been in a downtrend since August. December’s forecast projects output to decrease by 3 kb/d to 1,151 kb/d. The Eagle Ford’s output for November was also revised up by 35 kb/d from the previous report.
At the beginning of the year 2023, 68 rigs were operating in the Eagle Ford basin. The rig count began to drop in mid March to 60 and slowly dropped further to 47 in November.
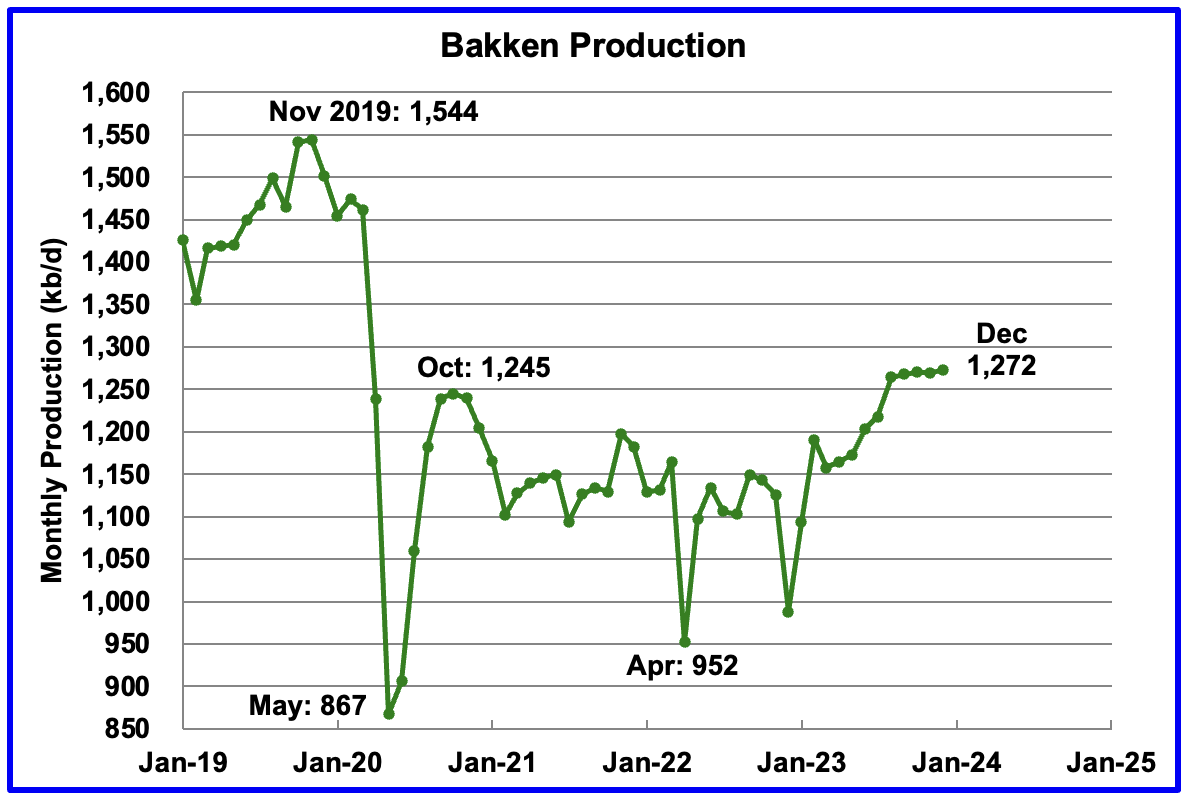
The DPR forecasts Bakken output in December will be 1,272 kb/d, 2 kb/d higher than November. December production is now projected to be 27 kb/d higher than the post pandemic peak of 1,245 kb/d in October 2020.
The North Dakota government reported that September production increased by 54 kb/d to 1,278 kb/d. Note that in the Bakken chart above, August production shows a similar spike in production, 46 kb/d.
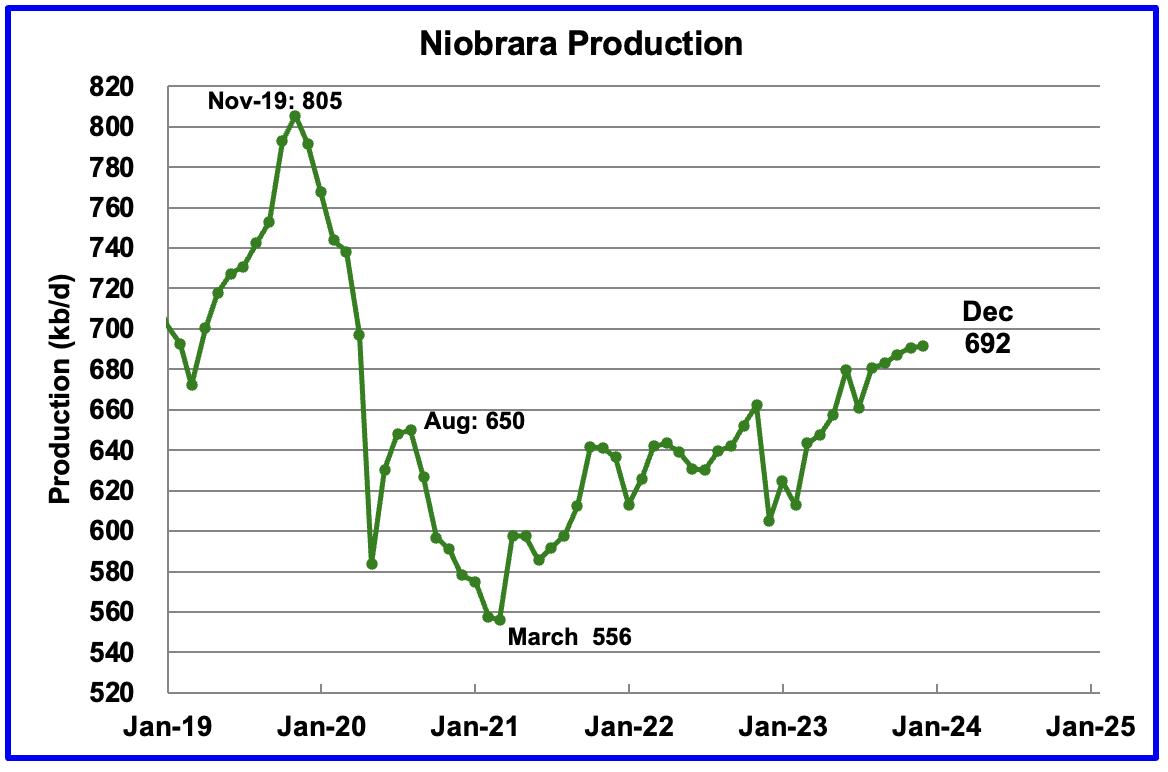
Output in the Niobrara continues to increase slowly. December’s output increased by 1 kb/d to 692 kb/d.
Production increased due to the addition of rigs into the basin but stabilized at 16 ± 1 rigs in March and April. However from August to November, the rig count has dropped to 14.
DUCs and Drilled Wells
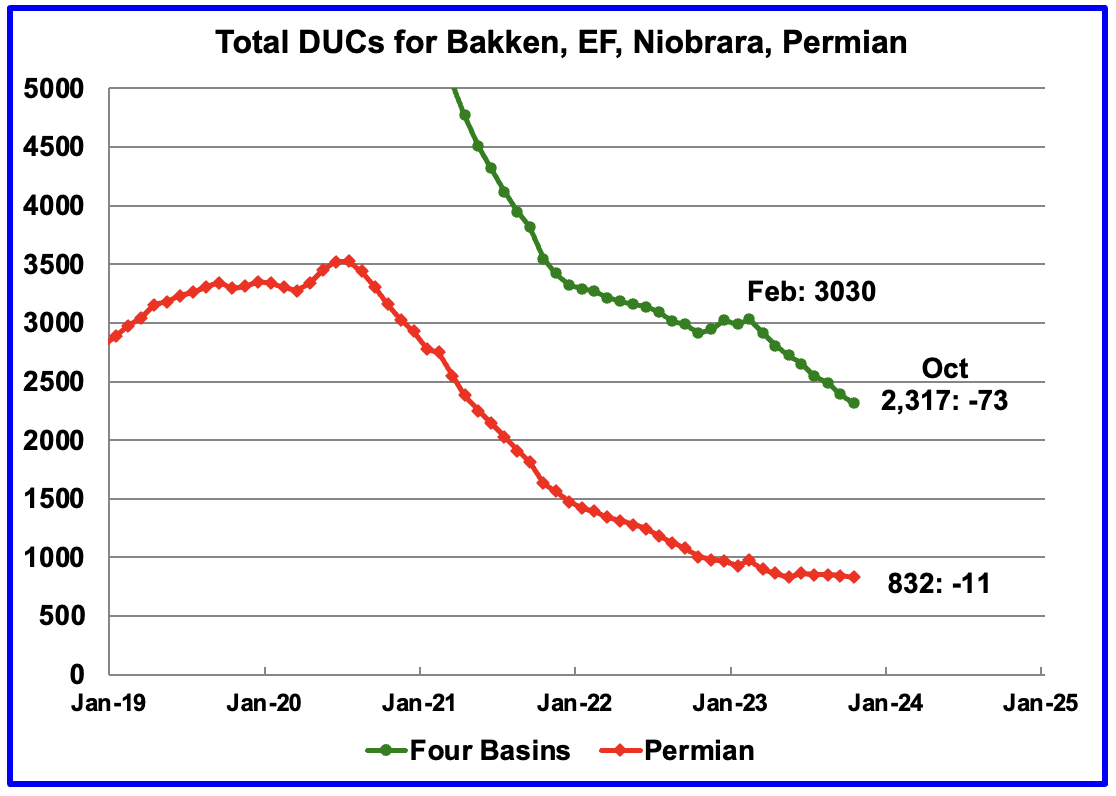
The number of DUCs available for completion in the Permian and the four major DPR oil basins has fallen every month since July 2020. October DUCs decreased by 73 to 2,317. The average DUC decline rate since March has been 89 DUCs/mth. Of the 73 DUCs decrease, 27 came from the Niobrara followed by 18 and 17 from the Bakken and Eagle Ford respectively.
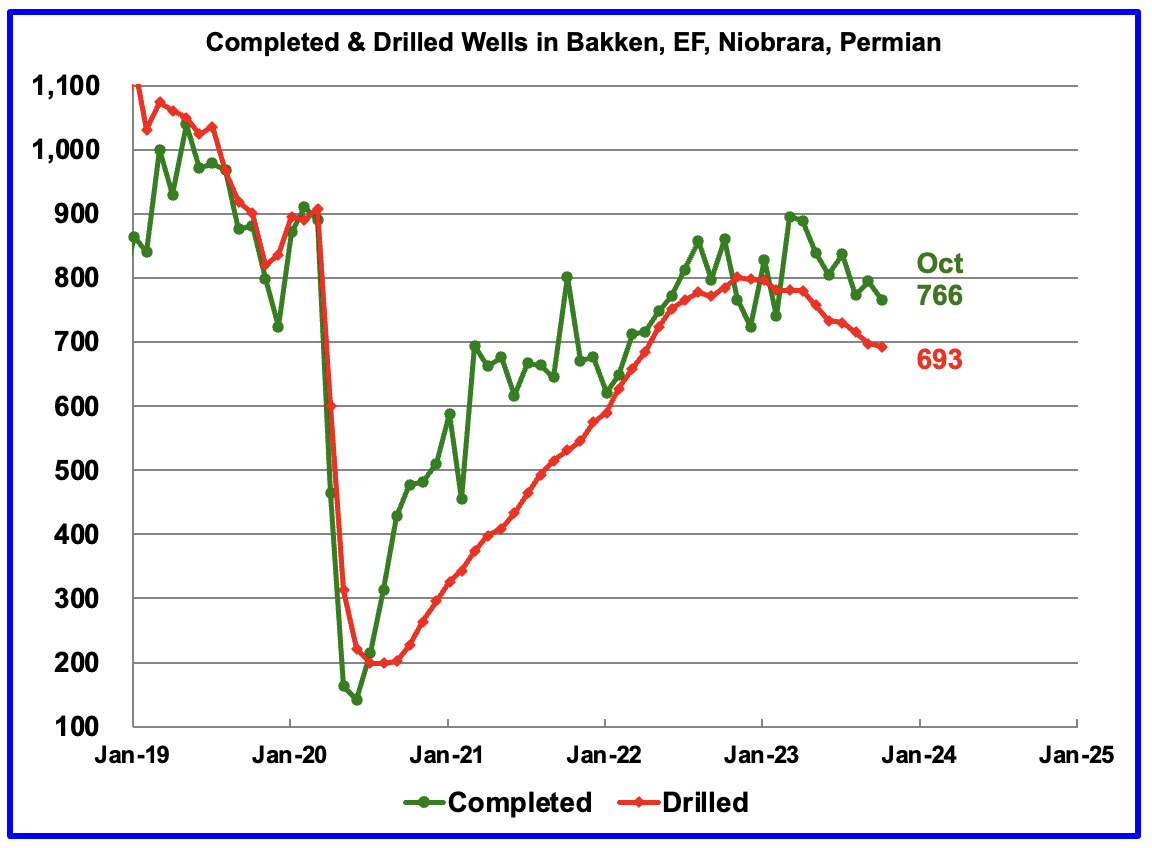
In these 4 basins, 766 wells were completed while 693 were drilled. Both drilled wells and completions are down from higher levels in early 2023.
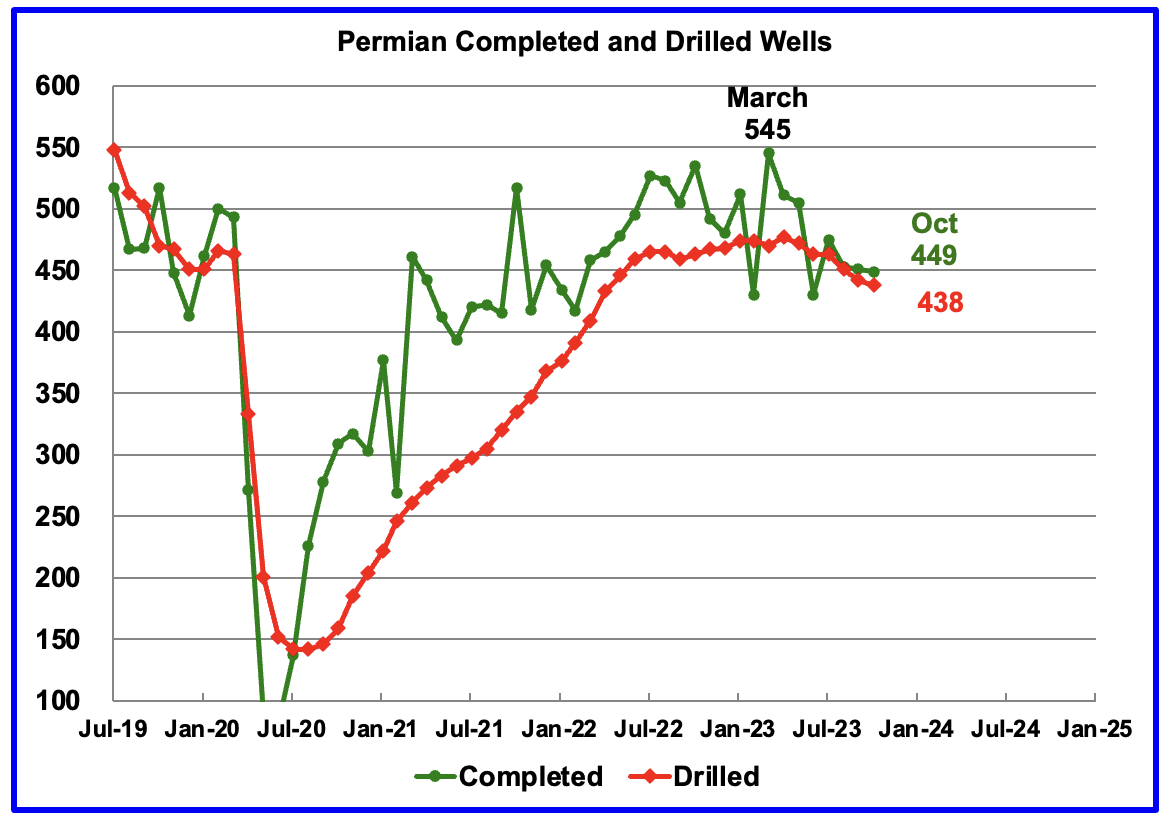
In the Permian, the monthly completion and drilling rates have been slowing since the March 2023 high of 545.
In October 2023, 449 wells were completed while 438 new wells were drilled. The gap between completed and drilled wells in the Permian is now very small compared to late 2022 and early 2023.
The Permian, as of October, had 832 DUCs remaining and the completion rate was 449 wells/mth. This means the current cycle time between drilling and completions is 1.85 months or 56 days
166 responses to “US September Oil Production New Record High”
Great article, thank you!
One thing about PSM is that the last four months are not directly comparable with the ones from before. EIA has had discrepancies with their balances, so they did an investigation and made changes, starting with the June PSM.
The two main findings were that: (1) some “natural gasoline” NGLs were getting blended into crude, mostly for export (Canada and others), and (2) some production was underreported. Correction (1) only affects the disposition side of the balances and not production, however, (2) affects the production numbers. They have been reporting the corrected numbers since June, but haven’t gone backwards to correct the historical reports.
The discrepancies in these prior PSMs resided in the Adjustment category, which included what has now become Correction (1) and (2) and other smaller discrepancies.
For your purpose to track C+C it may be useful to plot C+C*, where C* is total condensate, including natural gasoline that is blended for exports. Natural gasoline is in essence lighter condensate, which drops a bit further midstream from the gas feed. In other countries this fraction, which is mostly C5, is always included in the condensate statistics.
So if you decide to make this C+C* plot it should be:
For months prior to June 2023: Reported Production + Adjustment
From June 2023 onward: Reported Production + Adjustment + Correction (1). (Correction (1) is given as “natural gasoline transfers to crude oil” in the PSM)
If you do that, maybe the proper Title of the plot should be C+C*+E, where E is the error that is undetermined, apart from Correction (1) and (2). This is probably a very small error, given what EIA told us about their investigation.
The adjustment number relates to weekly production estimates. Not the 914 survey numbers.
KDIMITROV
Thanks for your information.
I have been tracking the transfers to crude supply in the weekly data since they started. However, I thought this addition was supposed to reduce the variability in the adjustment factor. It typically is still above 1 M/d. See attached for this week.
As far as I am aware, the quantities that you are referring to are not available in the PSM.
At this time my preference is to keep things simple and present the data as published by the EIA. My preference is that our information be consistent with what is widely reported in the press.
Ovi,
Sure, sure. PSM is a much better resource than WPSR and the monthly adjustments are smaller.
Regarding the WSPR it has improved greatly with production corrected and with the crude transfers, however, it is not visible because the Export/Import data is extremely noisy from week-to-week. EIA gets that data from Customs, however, private sources who track tanker movements say that if you use tanker tracking, which is more real-time than Customs, the Adjustment factor has gone to almost zero.
The other point I was making was about natural gasoline, which should be included in condensate totals for all intends and purposes, yet EIA tracks it separately. Volumes have gone substantially in recent years to 800 Kbpd
https://www.eia.gov/dnav/pet/hist/LeafHandler.ashx?n=PET&s=M_EPLLNG_FPF_NUS_MBBLD&f=M
Interestingly, there is strong seasonality to it, as you can see. My only explanation for the seasonality is that in colder weather more of it drops out earlier in the process and is counted in the Crude category, while in the summer it carries with the gas further midstream and is counted as NGL.
27 Nov 2023
Middle East oil supply situation as Gaza war brings world into unknown territory (part2)
https://crudeoilpeak.info/me-oil-supply-situation-as-gaza-war-brings-world-into-unknown-territory-part-2
Part 1 is here:
25 Oct 2023
Middle East oil supply situation as Gaza war brings world into unknown territory (part1)
http://crudeoilpeak.info/me-oil-supply-situation-as-gaza-war-brings-world-into-unknown-territory
So, the CTAs managed to bring oil under the next support.
So another -5 or -10$ the next weeks can happen. In the financial press this movements is ratiolized – they speed of production cuts are bearish, and US production will grow big next year (as everyone still “knows” they have costs of 30$ / barrel).
This seems a big battle between US money and OPEC oil production. OPEC removes real oil from the market, US money sells hundreds of millions of paper barrels. As long as tanks are full enough the paper barrel will win – until they not.
Perhaps this is even a cheap way to curb inflation (and earn on big positions here). Less inflation will induce more big stock rallys and bond selloffs.
Times stay interesting…
Economic data is shitty. The global recession that the yield curves have been screaming about for over a year nears.
Stocks tend to sell off in a recession because lenders don’t lend. Bonds will be bid because safety and liquidity will be in high demand. Oil is going to $25
China is facing something similar to the Great Depression.
Unless the FED buys from non bank entities within the economy there is no increase in the money supply. And by law the FED isn’t allowed to buy from non bank entities.
To HHH above:
So you’re saying we’re headed for a deflationary cycle that might last for a very long time, if I’m reading you correctly. At $25 oil, every rig will shut down in the U.S. shale basins. Chaos will ensue. The Central Banks would have to drop rates to near zero again. China cannot face a depression without a revolution. Thermal attenuation will still be necessary and the global grids are ill-prepared for the generation of electricity without the use of natural gas. In the scenario you are describing the use of coal–mostly of mediocre quality–would soar. I’m not about to debate the markets, because I’m pretty ignorant of them, but I am acutely aware of where we stand with regard to oil reserves, and the cost of bringing them up. In my humble opinion, these current oil prices are being driven by algorithms that are teetering on the brink of reality. The Permian kingpins have demonstrated that they can dramatically increase IP90 by longer laterals and fine-tuned “technical” features, but I have serious doubts that individual well productivity–EUR–will increase at all. Russia is not increasing production, nor is KSA or any other OPEC members to any meaningful extent. Someone mentioned Venezuela. That oil from the entire Orinoco belt is API 8, and its transport is akin to moving roofing tar. In my view we’re getting ourselves in a pickle. I always enjoy reading your slant on things, because it’s a worse pickle than even I can imagine. But I also have to believe that MbS has his own algorithm jockeys, and Putin is going along with him. To tell you the truth I’m more concerned with how much “oil on water” is out there–especially from Iran. I suspect it’s a lot. I see something very akin to the black day in 2020 coming down the pike. And then I trust the world will dust itself off and we’ll rebalance. But alas, I fear that we are throwing the babies out with the bathwater.
First let’s address the central bank’s. There is zero demand by commercial banks for bank reserves. Let me repeat that. There is zero demand for bank reserves by commercial banks.
Commercial banks that create 98% of all the money in the economy don’t need bank reserves to make loans. Even when the dollar was tied to gold. You didn’t have to have gold in your vault in order to make loans. The money supply was never determined by how much gold you have on hand.
It’s doesn’t matter one iota how many bank reserves a central bank creates. They never leave the banking system or balance sheet.
Commercial banks control the money supply via lending. Even in 2008-2009 we still had 10% growth in the money supply, yoy that is.
Money supply growth is currently deeply negative. We are actually heading into a depression. It’s not clear that zero percent interest rates or negative interest rates will make banks want to extend loans.
I’m in total agreement with you on oil needing higher prices in order to keep supply flowing. I just think that we aren’t going to get those higher prices and the oil flow will be reduced by lot.
China has built enough condominiums and apartments for every Chinese citizen to have two. Hundreds of millions of units that will never be lived in. It’s going to go down as the largest bubble in history to pop. It a $65 trillion bubble. It’s doesn’t have to even fall that far to create huge hole in the balance sheets of their banks.
And a lot of the loans are dollar denominated. A lot of offshore banks are extremely exposed here. What happens in China won’t stay in China.
I checked copper and steel price – the metals that will be hit even more than oil with a chinese recession. They haven’t been hit so far, these traders do business as usual – steel is even recovering a bit.
Banks need reserves to pay out the loans they make – if they don’t have enough. There is a minimum reserve rate for making loans, another tool to regulate credit and money creation.
But QE was not about reserve creation(banks can lend them from other banks, too, if they need them), it was about bringing interest rates down to make loans cheaper and induce a boom. Did work only good on state finances so politicans could throw out heaps of money for their favorite projects (Conservatives lowering taxes, socialists dishing out social help).
China can now go from building empty houses to building things that shoot. When I interpret the war mongering about Taiwan right.
HHH,
When do you expect this Global recession to begin (maybe a 12 month window)? You have been predicting oil at $25/b for some time, eventually we may get there, my expectation is in 10 years or so maybe some time between Dec 2033 and Dec 2034.
Many people have been feeling a recession for a long time. Things can be generally bad for a good chunk of society without there being the economist definition of two quarters negative growth. I have not, for example, known of this much worrying about paying bills in my circle since 2008. And I do not work with people who are particularly badly paid, but everything is being intensified on the precarity side of things.
I noticed a fun couple of articles this week about immigrants to Canada deciding to up and leave again because of how terrible living there was with cost of living. These were people from Hong Kong and Ukraine properly disillusioned with the way the West is run.
Kleiber,
Often a recession is associated with high unemployment, in the US employment has been pretty good.
https://fred.stlouisfed.org/series/UNRATE#
Business have been holding onto workers hoping for the so-called soft landing to occur. As they’ll be needing those employees under such a scenario.
Bond markets are right though and have been calling it for over a year. The interest rate hikes aren’t necessarily the problem. More the inverted yield curve is the problem.
Interest rates are going to have to go lower much lower in order to spur the credit growth needed to pull the economy forward.
What is going to happen is the market will set interest rates back to zero via a credit crunch and central banks will respond by cutting interest rates.
When you see the Fed cutting it’s just them acknowledging we are in trouble. By that time joblessness will be up significantly and oil prices down significantly.
Oil prices and bond yields tanking are a major sign of economic weakness.
As the FED and other central banks start to cut rates. Oil prices and bond yields will accelerate lower.
HHH,
Bond yields have decreased, “crash” overstates things imho.
https://fred.stlouisfed.org/series/DAAA#
The US economy is doing fine.
See https://fred.stlouisfed.org/series/GDPC1
You’re not hearing what I’m saying. It’s the inversion that is a problem. If we were going to get a Goldilocks scenario the yield curve would steepen out with the long end going higher in yields.
We are getting the exact opposite of best case scenario. The bond and oil markets don’t agree with the best case scenario. And it’s China and Europe that will be leading us the way down.
The deflation coming out of China will hit all shores. And Europe has a wall of debt that will have to be rolled over at higher interest rates throughout 2024.
Not to mention the money supply. Actual money in real economy not the interbank tokens known as banks reserves has shrank by $2.8 trillion.
HHH,
You said :
Oil prices and bond yields tanking are a major sign of economic weakness.
What do you mean when you say “bond yields tanking”?
30 year bonds have gone from 2.99% in Dec 2021 to 5.8% in Nov 2023.
The yield curve remains inverted as it has been since Oct 2022, the spread between 10 year and 3 month treasuries has taken a dive lately, so it may be the change in the yield spread that you are referring to.
3H, your running out of time and the American economy is only getting stronger.
“The yield on two-year Treasuries climbed above that for 10-year government bonds in July 2022, causing a closely watched “two-ten inversion.” The reversal is the longest-lasting since 1980, and the spread between the two yields widened the most since 1981 in July. Investors interpret these signs as bad omens because they reflect fears that near-term economic risks exceed the dangers of holding longer-dated debt.
At first sight, they are right: Yield curve inversions have been a consistent predictor of future downturns. Every modern U.S. recession has been preceded by an inversion. The yield curve has only shown one false positive, in 1960, and only because the following slowdown wasn’t dramatic enough to constitute a recession”
https://www.reuters.com/breakingviews/new-economic-rules-shatter-us-bonds-crystal-ball-2023-09-19/#:~:text=The yield on two-year U.S. Treasury notes has been,that on longer-term bonds.
How long does it take from yield curve inversion to recession?
According to Dow Jones Market Data, inversions of the 2-year and 10-year yields—the most commonly cited pair—have preceded recessions by as little as seven months or as much as two years. In early July, the 2-year yield exceeded the 10-year yield by nearly 1.1 percentage points.
https://www.investopedia.com/articles/basics/06/invertedyieldcurve.asp#:~:text=1 Under normal circumstances, the,riskier than the long term.
Biden Economics
If your waiting for $25 oil. You will miss the next energy rally. It’s that time to start shopping and fill your cart over the next month or two with oil equities.
You snooze, you lose
Dennis, The bond market is pricing in a crash not a soft landing. Hundred basis points of inversion. We are right at the 18 months lag.
Historically it’s 18 to 24 months before recession shows up. Do you really believe somehow this time is different and we will escape recession?
The recent turn lower in bond yields and oil prices are loudly telling us growth and inflation are done.
Yield curve is going to un-invert with the Fed and the rest of the central banks being forced by the market to cut interest rates back to zero or negative.
HB, if the American economy was getting better oil prices would go up and bond yields would steepen out above the FED’s overnight rate. That’s not happening. The exact opposite is happening.
HB, you live in la la land and while I could be talking about California I’m not.
And I wouldn’t bet on QE being able to save the day. There are a lot of entities that are holding government bonds yielding 5% now that just aren’t going to sell at any price.
Which leaves mainly just the bonds on commercial banks balance sheets. When a central bank buys from a bank there is no increase in M2.
Commercial banks don’t need those bank reserves to make loans either.
Government will have to step in and deficit spend. Now how big is the hole that they are going to have to attempt to fill?
Helicopter money that puts deposits on balance sheets in real economy will cause temporary inflation. As we’ve seen.
Temporary can mean 2 years. While governments need to inflate debt away, can they really go big and risk a repeat of the price swings we’ve seen over last couple of years?
When wages don’t keep up with price increases. Prices eventually fall. That is exactly where we are currently at. Hint, home prices have never been as expensive as they are today compared to the average wage. 4.5 times the average yearly wage. We are in a bigger bubble now than 2008.
To the average American there is nothing affordable in the economy currently.
THE EMPLOYMENT SITUATION — NOVEMBER 2023
Total nonfarm payroll employment increased by 199,000 in November, and the unemployment rate edged down to 3.7 percent, the U.S. Bureau of Labor Statistics reported today. Job gains occurred in health care and government. Employment also increased in manufacturing, reflecting the return of workers from a strike. Employment in retail trade declined.
This news release presents statistics from two monthly surveys. The household survey measures labor force status, including unemployment, by demographic characteristics. The establishment survey measures nonfarm employment, hours, and earnings by industry. For more information about the concepts and statistical methodology used in these two surveys, see the Technical Note.
Household Survey Data
The unemployment rate edged down to 3.7 percent in November, and the number of unemployed
persons showed little change at 6.3 million. (See table A-1.)
Household Survey Data
The unemployment rate edged down to 3.7 percent in November, and the number of unemployed persons showed little change at 6.3 million.
The number of persons employed part time for economic reasons decreased by 295,000 to 4.0 million in November. These individuals, who would have preferred full-time employment, were working part time because their hours had been reduced or they were unable to find full-time jobs.
In November, average hourly earnings for all employees on private nonfarm payrolls rose by 12 cents, or 0.4 percent, to $34.10. Over the past 12 months, average hourly earnings have increased by 4.0
percent. In November, average hourly earnings of private-sector production and nonsupervisory employees rose by 12 cents, or 0.4 percent, to $29.30.
https://www.bls.gov/news.release/pdf/empsit.pdf
The consumer price index, a closely watched inflation gauge, increased 0.1% in November, and was up 3.1% from a year ago.
Excluding volatile food and energy prices, the core CPI increased 0.3% on the month and 4% from a year ago.
A 2.3% decrease in energy prices helped keep inflation in check, as gasoline fell 6% and fuel oil was off 2.7%. Food prices increased 0.2%.
https://www.cnbc.com/2023/12/12/cpi-inflation-report-november-2023.htm
EULENSPIEGEL
According to the first chart, if we believe the STEO, there will be no growth in US production next until July and when growth starts, 2024 will only add 245 kb/d to supply in the last quarter.
As for $30/b for the cost of US oil, that sounds low to me. The sense I get is that the drillers want $70/b to make a decent return. I think the experts should way in on what the drillers need before they drill.
The other issue here besides reducing inflation is the desire of the US to reduce Russian revenues from their oil. Could they be working with the CTAs, as you mention, to keep selling paper barrels?
What has happened to WTI over the last week does not make any sense if we are to believe the OPEC and IEA reports. The MOMR claims that demand exceeds supply by over 2 Mb/d in Q4-23. If true, market forces would be raising the price of oil. So something is wrong in the data. Either supply is greater than the MOMR is reporting or Demand is a lot weaker.
According to the IEA: “Chinese oil demand rose to another record high of 17.1 mb/d in September, underpinning global growth. China is set to account for 1.8 mb/d of the total 2.4 mb/d increase that lifts demand to 102 mb/d in 2023. Overall growth is expected to slow to 930 kb/d in 2024.”
The IEA says China demand is strong but this morning I see news about possible weak China demand.
To make matters worse, the US reported a 4.6 M barrel drop in their stock/inventory this morning. Typically this would cause a rally in the price of oil. In addition, production in the week ending December 1 dropped by 100 kb/d. Another two bullish factors that are out the window this morning as WTI is currently down $3/b and under $70/b.
Bottom line Nobody knows Nothing.
When we run out of oil in the tank, we’ll just pay more and oil will be provided. Geez, it’s really not that hard.
Economy’s great!
I citated stuff from the financial sites – they where bullshited with enough investor presentations to believe the 30$ stuff.
I’m long enough trading stocks – the price often makes the story. Good for CTAs when they move stuff around.
Ovi:
Thank you for the detailed and thorough update on US production!
I have a question for the oil men and energy experts here, please.
The oil men have been saying they can’t make a go of it (ie. make $$$) at $75 oil in a recent post. I know Mike Shellman and others have been pointing out this important fact and why for some time. So, given the collapsed shale DUc count, Permian completions have been declining since early 2023, Ted Cross at Novi says Permian productivity has been falling for 2 years, the fact that oil producers dropped rigs starting early August 2023 WHEN WTI WAS ~$80, Karnes County (EFs biggest producer) has been in decline for months now, Midland County oil production recently went in to decline (after a year of rig count declines) and Martin County oil production is flat, how can US shale production not fall at $69 oil?
Yes, I know that the Bakken is doing better, but overall, indicators almost all point to falling US shale oil production.
Joel & Ovi:
I am increasingly thinking that what is happening is a manifestation of commodity trading algorithms that feed on momentum until an absolute breaking point is reached.
Prices are out of synch with what is happening in world geopolitics, a diminished SPR, and an emergency meeting of Putin with MbS on Saudi turf.
The OPEC cut last month was a wet fart on the markets. If that didn’t raise havoc, not sure what. Maybe the Houthis knocking out a Saudi oil field? Who knows?
Israel and Hamas duking it out didn’t do much to the price, so either the markets know something we don’t, or they know nothing at all and also are brainless algos.
I can’t say I’m particularly optimistic about this.
Putin likely is flying to Riyadh to beg MbS not to open the taps in an attempt to drown out US shale. A 2014 replay could be at hand.
Joel,
If we use 6 month cumulative production to evaluate well productivity for the Permian we get the following from
https://novilabs.com/blog/permian-update-through-july-2023/
From 2021 to 2022 the average cumulative output at 6 months fell by about 3.66%, but note that 6 month cumulative output rose from 89.6 Kb in 2018 to 106.8 kb in 2020, and in 2022 6 month cumulative was 111.1 kb. It is too early to have complete data for 6 month cumulative for 2023 wells, but 2021 was indeed a high point at 115.3 kb for 6 month cumualtive output.
I don’t think it’s that prominent in the Permian, but in other basins, you’ve seen high/low grading having a huge effect on average well productivity. So when prices are low and production is falling, only the best wells are completed. And vice versa.
People routinely try to make inferences from trends in well quality but omit the impact of price driven high grading. If you see well quality going up, while price is going up, than you can say for sure wells are getting better. Conversely if wells are getting worse, when prices are dropping, than you really do see ‘running out of acreage”. When things are mixed (as is the norm), you can’t say for sure. Need to do more complicated multiple regressions or other analyses that disentangle the confounding effect of high grading.
I have seen $12-14 million in the cost range to drill, complete and equip a horizontal well in the Delaware Basin.
Assuming that is correct, figure what price of oil, NGL’s and natural gas it takes to pay off a well in 3-5 years. It seems there is excellent data as to what an “average” well will produce in the Delaware Basin. There should also be a lot of LOE data from public company 10k and 10q, same for G&A expense. Same for ad valorem taxes. Also, seems like most of the leases provide for a 1/4 royalty, so deduct that from the gross income.
To simplify, just take 3/4 of the products produced over 3 years times current product prices, less $20 per BO for LOE, G&A and ad valorem taxes. It’s very back of napkin, but might be helpful? I’m open to criticism from those more in the know.
So, if the product prices aren’t able to payout the well in 3-5 years, it is likely the companies will defer drilling.
Also, keep in mind the public shale companies now cater to dividend investors, not growth investors. The shale companies paid some big special dividends since 2021. So, that extra burden is a big deal. I suspect the shares of shale companies will drop like a rock without those dividends. I only own COP regarding shale, but therefore I follow it. I’m not sure why it’s still worth $110 a share if it was worth $65 a share at the same oil price in 2018? If anything, costs have went up a lot since 2018. Those that think oil will stay here/go lower should trade the shales, as they haven’t sold off like they should under that price scenario. Again, just IMO.
I haven’t done any calculations in awhile, but I suspect there is no way $30-40 WTI supports Permian Basin wells.
As for the other basins, not sure they matter a whole lot individually, but collectively they have been growing production. I would be surprised if any could withstand $30-$40 WTI.
This oil price volatility is bonkers, but it isn’t new. It’s been around pretty much since the US invaded Iraq. I’ve lived it for 20 years.
Shallow sand,
For a well with a 13 million capital cost and a well profile similar to the average 2020 Permian well (note that Delaware basin wells are on average more productive than Midland Basin wells) the well pays out in 47 months at $73/b at wellhead assuming NG at $3/MCF and NGL at 30% of the crude price per barrel ($21.90/b for NGL for this case). On average the 2022 Permian basin wells have a similar profile to the 2020 wells, it is too early to make a good estimate for 2023 wells in my opinion, I don’t have access to enough data.
Dennis. As Mike points out, we aren’t including land, seismic, interest and other costs in these calculations.
Some shale proponents also think we should leave out the cost of drilling the hole once drilled, as it has become a “sunk cost” like some of the other expenses I mentioned above.
It will be interesting to see what kind of dividends the pure shale public companies pay if wellhead oil prices stay $70 or below.
It is also my understanding that natural gas prices in the major shale basins remain depressed, below $3.
Shallow sand,
Yes some producers may pay the WAHA price which is depressed, but if you look at 10Q or 10K reports the larger producers receive higher prices for their natural gas (Pioneer reported $2.48/MCF in third quarter 2023). The 13 Million price probably would include land cost, I don’t think interest should be part of a well payback excercise. Over the 143 month life of this well at the prices assumed the net revenue from the well (ignoring interest) would be 17.2 million, so if we assume a 10 year corporate bond is issued at 6% that raises the payback over 10 years to 13 plus 7.8 million in interest paid over 10 years or 20.8 million. That would raise the wellhead price needed to payback principal plus interest over 10 years to $86 at wellhead. I would think the higher current interest rates are leading to less borrowing and more drilling being financed from cash flow. Also the 13 million estimate for all in costs may be too high, average well costs may be lower than this, not every well drilled and completed is a 15 thousand foot lateral well, on average the wells are in the 10k range on average (with some shorter and some longer). For the 9 months ending Sept 30, 2023 Pioneer reported 3.6 billion on net earning, capital spend was 1.1 billion with 95 wells completed in third quarter which suggests about 11.58 million in capital spending per well completed. Interest expense during the first 9 months of 2023 was about 114 million which is about 3 % of net income attributable to common shareholders. From link below
https://investors.pxd.com/investors/news-releases/news-details/2023/Pioneer-Natural-Resources-Reports-Third-Quarter-2023-Financial-and-Operating-Results/
I agree at todays prices things do not look good.
Joel
The first chart shows flat US production to July/August 2024. So while you say “but overall, indicators almost all point to falling US shale oil production.”, plateauing production over the near term may be a better description. If oil holds here at $70/b, that small increase seen in Q4-24, may not appear.
Joel, you can google me.
There is NO evidence whatsoever that suggests US tight oil will plateau from the Permian for the next 6-8 months in 2024, as the Energy Inaccuracy Agency implies, other that “statistical trendology.” Wells in the Permian, the only basin to care about, are getting worse (down 4% across the basin the past 2 years and in heavily drilled sweet spots like Lea County, New Mexico, the largest producing county in the Permain Basin, down 16% the past two years [Enverus, Novi, TRRC]), well economics are getting worse by the day, rig counts are falling and remaining T1/2 locations are now so scarce that in 2023, mergers and acquistions in the Permian lent themselves to paying $1MM to $3MM per location…over and above $13MM well costs. WTI Midland is now down to $63 at the WH, after deducts and severance taxes, Waha gas is a little north of a dollar.
Mr. Ovi himself can be quoted here: ” …of the 449 completed wells in October 434 were required to offset the decline.” That implies but for 15 lousy wells in Ocotober the Permian would have had NO growth.
Highgrading cores areas mean much less productive wells than 4% and DUC’s have been all but deducted from the big picture. A few less rigs, drilling fewer wells in T 3/4 areas, taking a few days longer per well, with higher inflationary costs in 2024 to drill and complete, and the Permian is going down, which I suggested 6 months ago, and we appear to be on track to see manningful decline by 2Q24. You are right to be concerned.
Thanks Mike,
If oil and natural gas prices continue to fall and completion rate decreases in the Permian basin then we will see Permian basin output fall. We generally see about 1.45 spuds per horizontal oil rig in the Permian Basin in the past 12 months. Recently the horizontal oil rig count in the Permian basin was about 301. That suggests about 436 wells could be drilled at current rig count levels in the Permian.
If we assume 436 wells per month were completed from Nov 2023 to September 2030 and then decreased by 10 wells per month to zero completions after May 2033, we would have a scenario with about 33 Gb of Permian basin tight oil output from Jan 2010 to June 2041 with 88740 total horizontal tight oil wells completed from Jan 2010 to May 2033 (currently about 45500 horizontal tight oil wells have been completed in the Permian.) Output would decline in this scenario (see chart below). The scenario assumes new well EUR decreases at an annual rate of 3.65% per year starting Jan 2023 for this scenario, the average 2020 well profile is used for Jan 2020 to Dec 2022.
The scenario is likely to be wrong as I cannot predict future well profiles or completion rates, this scenario seems pretty conservative to me as the USGS F95 TRR is about 45 Gb for the Permian basin and the mean TRR is 75 Gb.
Is the EIA production data not overstating US oil production?
Art Berman’s THEY’RE NOT MAKING OIL LIKE THEY USED TO: STEALTH PEAK OIL says no:
https://www.artberman.com/2023/01/18/theyre-not-making-oil-like-they-used-to-stealth-peak-oil/
A large portion of what EIA says is oil production are ngl’s and ethanol. So, is the market pricing WTI on EIA’s inflated oil production?
Joel,
The EIA reports C plus C out put at link below, this is crude plus condensate, no NGL, or ethanol is included.
https://www.eia.gov/dnav/pet/pet_crd_crpdn_adc_mbblpd_m.htm
So no, the US C plus C output is not being overreported, we don’t pay a lot of attention to the output level for NGL and Ethanol at peak oil barrel, the focus is on crude plus condensate.
https://www.dailymail.co.uk/news/article-12830451/venezuela-invade-guyana-change-maps-esequiba-maduro.html
Venezuela preparing to invade oil rich Guyana.
The perfect excuse for the USA to invade Venezuela.
Seems like attempts at redrawing of country borders is becoming a bit of a trend.
Co-incidence that Russia and Iran are the primary sponsors of Maduro?
https://www.msn.com/en-us/news/world/us-to-conduct-guyana-flights-as-tensions-mount-over-venezuela-dispute/ar-AA1lacCx
“The United States has said it will conduct joint flight drills with Guyana amid growing border tensions between Guyana and Venezuela.”
“Venezuelan President Nicolas Maduro has issued arrest warrants for opposition politicians who are challenging a move to annex oil-rich Essequibo in a last-minute ploy to ensure his chances of maintaining the presidency against wildly falling popularity.
Maduro has officially placed the disputed territory of oil-rich Essequibo under military jurisdiction, putting oil exploration and production operations of Exxon and Chevron at risk. ”
https://oilprice.com/Latest-Energy-News/World-News/Maduro-Arrests-Opposition-Figures-as-Oil-Rich-Guyana-Readies-for-Invasion.html
https://oilprice.com/Energy/Crude-Oil/Guyana-To-Become-The-11th-Country-To-Produce-Over-1-Million-Barrels-Of-Oil-Per-D.html
Guyana the hottest oil prospect in South America
Big Surprise. EIA Updated World Production
World production was 80,700 kb/d in August, down 1,838 kb/d from February. The Saudi Lollipop cut accounts for 1,000 kb/d of the 1,838 kb/d. Note that December 2024 is lower than February 2023, assuming the projection is correct and the updated EIA numbers are correct. I note that the EIA updated a lot of the earlier production data.
It’s looking increasingly as if economists like Shinzy who think peak oil will mostly be a low price phenomena have the right idea.
If peak oil does play out as a low-price phenomena, this implies generalized and long term economic stagnation with declining demand, and a generalized lack of purchasing power for oil products and all that oil products enable.
The ramifications of this growth stagnation or outright contraction scenario are of course huge.
One these ramifications is the implied growth in the disparity of economic prospects as some peoples and regions will fair much worse than others, and this is a recipe for a dramatic escalation of geopolitical instability.
A second ramifications is much lower overall oil production, with less money available to fund higher cost projects. This leaves a big chunk of low EROEI oil in the ground.
Some might say that electrification of transport and industry would have a significant causative role in a proposed low-price peak oil scenario, since less oil /unit of GDP will be needed. I’m sure that is true to an extent, but it remains an open question just to what degree this offsetting factor will be an effective force. Much of this uncertainty involves timing, and policy choices within the major economies.
“As We Exhaust Our Oil, It Will Get Cheaper But Less Affordable” is the name of this very very good article from Blair Fix (2020) and you can find it here:
https://economicsfromthetopdown.com/2020/12/03/as-we-exhaust-our-oil-it-will-get-cheaper-but-less-affordable/
Thank you for the above article. It makes sense of the title.
Thanks Required.
A point is made in this article that lower EROEI oil is less affordable (since it takes higher input cost to yield the same product).
And- “What’s interesting is that even if oil purchasing power does decline as I’ve predicted, this says nothing about prices. Oil prices could explode (as many peak-oil theorists expect). But oil prices could also collapse. It all depends on what income does.”
‘We don’t think about this alternative [“that a resource could get less affordable because your income goes down’] because it involves something that few living people have experienced: the continuous contraction of income.” (globally)
Its an interesting discussion of the balance of price and affordability.
Required
Thanks it’s a good read. Affordability is key.
Ron has talked about this in the past and he makes a lot of sense. When looking at the typical price cycle, high production tends to lower prices, hence the old saw, “the cure for high prices is high prices”. So it makes sense that the peak of production will be at a point of overproduction, a glut, which results in low prices near and just after the peak of production. Eventually production slows, prices rise and production follows the price back up. We’ll know when the peak has been reached when very high prices can’t stimulate enough production to cause another glut in supply exceeding the previous glut. Such has been the case recently, so it’s looking more and more like 2018 was indeed the peak.
Of course this price cycle phenomenon assumes that the non-oil sectors of the economy are functioning normally. A financial crisis, a pandemic or a war can affect oil production more in the short term than long-term depletion. But eventually depletion wins.
Permian scenario assuming productivity (new well EUR) decrease of 3.65% per year (this is the productivity decrease from 2021 to 2022 in Permian basin) starting in Jan 2023. New wells added match the Novi estimate up to March 2023 and uses the DPR estimate for completions in DUC spreadsheet from April to October 2023. After October 2023 I assume the completion rate remains at 449 wells per month (October 2023 rate) until September 2030 and then decreases at 13 wells per month until falling to zero completions in August 2023. URR is 34 Gb, total wells completed are 90,255 wells from Jan 2010 to August 2033.
Peak in Dec 2025 at 5564 kb/d. Note that my estimate for Permian output in Sept 2023 is 5521 kb/d (only 43 kb/d below peak output for the scenario in the chart below). If this scenario were correct and my estimate for Permian output were also correct (neither is likely to be true) we would currently be very close to peak output in the Permian basin, basically on a plateau from October 2023 (5500 kb/d) to Nov 2027 (5500 kb/d) with a 64 kb/d increase and then decrease over the period from Oct 2023 to Dec 2025 (for increase) and Dec 2025 to Nov 2027 (for decreasing period).
[…] US September Oil Production New Record High – peakoilbarrel.com […]
A new paper by Jean Laherrere: The evolution of oil production forecasts for the World and the US by different reporting agencies: a visual summary, Jean Laherrère, 3 décembre 2023
https://aspofrance.org/2023/12/04/the-evolution-of-oil-production-forecasts-for-the-world-and-the-usby-different-reporting-agencies-a-visual-summary-jean-laherrere-3-decembre-2023/
(Easier to read if you download the pdf.)
Thanks George.
Laherrere asks how accurate the EIA 914 estimate is. Over the Jan 2015 to Sept 2022 period (when we have relatively accurate state level data), the sum of the EIA 914 estimate for all months compared to the sum of the EIA Final estimate (which is revised to the level reported by individual state agencies) is about 0.998%. If we look at the mean of the absolute relative error over all of these months it is 0.47%. Chart below shows the data comparison. The 914 estimate is pretty good.
Global oil production is 4 to 5 million barrels per day higher Ovi data.
https://www.apirasol.com/illicit-oil-trade
Stolen and illegally traded oil does not figure on EIA data, you have to go looking for other sources of information.
Charles,
The output is gathered from secondary sources for production. Oil that is stolen or “illegally traded” to avoid sanctions is oil being exported or imported, it does not affect production numbers.
Can you point us to a source for “correct information” for oil output?
The source you point to talks about illicit trade. Let’s say a company produces 100 computers and 20 of them get stolen. The reported production of 100 computers has still occurred and there will still be 100 computers out in the World, with 80 purchased legally and the other 20 purchased online from dealers in stolen merchandise. It is no different for oil. The output numbers from the EIA are the oil produced, whether the oil is later stolen or otherwise traded in a way that avoids sanctions is beside the point.
Dennis
I have already posted various studies conducted by different agencies. Oil production in many less developed countries is only counted when it gets to a refinery or put on a ship. So calculating how much goes missing before then takes a great deal of analysis.
Russia is illegally transporting oil on at least 500 tankers. They are obviously not going to these lengths to hide that oil and then tell the EIA exactly how much oil they produce. They hide it.
Monitoring dark tankers provides a good idea of the quantity of oil hidden from production data. These tankers serve Iran, Venezuela, Libya and many other countries.
https://www.aspistrategist.org.au/russia-using-shadow-fleet-to-keep-oil-revenues-flowing/
OPEC has put consumption at 103.2 million barrels per day.
The percentage of ngl is only tiny bit higher than 2018.
Global gdp is over 9 trillion higher than 2018.
Everything points to production at least 2 million barrels of c and c higher than 2018
Charles,
The EIA gets its data from secondary sources. Last I checked oil tankers are pretty difficult to hide, there are companies that specifically track tankers. How do you think estimates are made of oil stolen?
x barrels go into the pipe and Y barrels come out the other end, oil stolen is x minus y. This isn’t rocket science. Oil produced is X, they know how much they send down the pipeline and they know how much gets stolen. The production is X, that is what gets counted as output. There are different estimates of consumption, the EIA estimates 101.4 Mb/d for 2023 about 1.3 Mb/d more than 2018. In the most recent 12 months the average total liquids production that was not C plus C was about 1.5 Mb/d higher than at the peak of World C plus C output in Nov 2018. The amount of C plus C consumed per trillion 2015$ of real GDP produced changes over time, it has been decreasing most years since 1972.
Dennis
You dismiss any evidence that does not suit your ingrained views. No point discussion with person with such a closed mind like yours.
The tankers go dark to hide that they exchange cargo and destination.
You really think Iran, Russia and Venezuela tell everyone what they are doing this is too painful
Oil consumption to gdp has been reducing over the years but it has never been negative in the last 30 years. Only when a third of oil was being burned in power stations in the 1970s was there a few years where this consumption was changed to coal and gas. This allowed growth with less consumption for a few years.
Charles,
Just because I don’t agree with you, does not mean I am close minded. Ad hominem shows you don’t have any answers to my critique. Production does not have to be reported. There are many firms that track shipments independently of governments and they publish their data for a price. These secondary sources are what are used by the EIA, OPEC, and the IEA to estimate World output. You can choose not to believe the numbers and make up your own, just don’t expect many will believe that theu are correct.
There are a few things that would be nice to know to have an overlook about oil production, and this gets complicated:
How is the historical chart of oil smuggling?
We have Iran/Iraq embargoes going on since long time, and chaos in Africa,too. Smuggling has a long tradition.
I think Russia is reporting half way right – they have their Opec+ Numbers not that much below the values before the war – the oil just gets produced and then magically disappears before leaving Russia. Their smuggling to China is even almost official.
In the triangle around Iraq – Iran, Turkey, Syria, there have been reports about oil smuggling the last 10 years. Everything about Iraq numbers smells fishy. Kurdish oil tends to disappearing, and the Iran/Iraq boarder has holes, too.
I could think some Iran oil doesn’t go per shadow tanker but is official Iraq production…
Can anyone explain Canada’s strange oil production chart? What happens when their production suddenly jumps or falls? The data is January 2013 through August, 2023
The spring break-up is seasonal, every year around march-april, possibly may. Then there are probably some shut-ins due to the pipeline problems and wildfires every now and then.
Ron,
Canada has different data see
https://www.cer-rec.gc.ca/en/data-analysis/energy-commodities/crude-oil-petroleum-products/statistics/estimated-production-canadian-crude-oil-equivalent.html
Data is relatively complete only through May 2023.
It seems the EIA still does not have its act together, so World oil data remains suspect, the disfunction in the US government is working down to the Federal Agencies it seems which is unfortunate. The EIA was once pretty good at least for data, not clear this is still the case.
Thank you for pointing this out, it makes the EIA’s entire World dataset suspect.
As a quick check I looked at EIA data vs Statistical Review of World Energy for Crude plus Condensate, the EIA data is messed up.
Dennis/Ron
I will send note to EIA. They have left out condensate.
Ovi,
Seems like it may be more than that for Canada, looking at the World Data it is mostly changes to the Canadian and Russian data, the Russian data is more difficult to evaluate since the Russian Ministry of Energy stopped reporting data. From Jan 1973 to Dec 2016 the EIA data is unchanged, beginning with Jan 2017 there are problems with Canadian and perhaps Russian data. Both data sets are from the EIA, with current being most recent set and previous being data from just before the most recent update.
Russian EIA data current and previous data sets.
Most of the difference between the current and previous EIA data is explained by the changes in the Russian and Canadian data. I have looked back at old data from Russian Energy Ministry up to Jan 2022 (last data I have available) and the previous EIA data is more consistent with the Russian data through Jan 2022, after that we need to rely on OPEC reports and IEA estimates which include NGL and make it more difficult to assess.
Dennis
Attached is a chart that compares the May 2020 EIA world report (green graph) with the latest EIA August report (blue graph). The blue graph has 50 kb/d added to it to separate it from the EIA May data. Also included are some of the first captures of Russia Ministry data, red graph, 404 kb/d higher than the EIA data.
I see a small discrepancy in 2017, see picture. I don’t see the big gap shown in the chart above.
I have sent you an email.
Ovi,
Yes they have corrected the Russian data, it all looks pretty good now.
I have a download saved of previous World data from just before the update, the chart below compares current data with this previous data. A portion of this comes from the Canadian data, but I will need to dig deeper to find other nations which may have suspect data.
Dennis/Ron
The EIA has left out the oil from conventional wells from Jan 21 to Dec 2022.
I have sent of an email with this picture to the EIA
Thanks Ovi,
Did they do the same in 2017?
Dennis
I have just heard back and they are looking into it. I have told then to also check 2017.
Fixed
Thanks Ovi,
They seem to respond to your requests, maybe you should ask them to look into Russian output from 2017 to 2021.
Dennis
I will look at my old data, obtained from the Russian ministry and see what I have. Recall that the Russian Ministry data used to be 404 kb/d higher than the EIA’s. Maybe they have reevaluated their position.
Ovi,
Perhaps, but it is inconsistent compared to Russian ministry data. If you look at the Russia chart I posted comparing previous EIA data (just before most recent update) and current EIA data, it will be clear there is a problem.
Note that I haven’t checked since they made the update to Canadian output, they may have already found the Russia data problem.
Now I have checked, the problem with Russian data has also been corrected. The World Data now looks pretty good.
Russia data from EIA Now, (after corrections suggested by Ovi) Previous 1 (recent revision before Ovi brought problems to EIA’s attention) and Previous 2 (before the most recent update where data only was up to May 2023 (currently the estimate goes to August 2023).
Thanks Ovi, you are awesome!
Oil price volatility
Seems to me current low oil price is primarily related to volatility (not market or fundamentals).
In US, theme is overproduction, so maybe they can refill some of the SPR. But so far, after reaching a minimum level of 346,758,000 barrels in July, it’s only gone up to ~352 million barrels (+1.5%)…so not looking too promising..
Dennis
Do you have a projection for Guyana production in the event of an invasion by Venezuela?
Lightsout
I don’t have any idea on what happens if a war were to break out. Currently I get the sense that XOM is not pleased with how the Guyanese govt is treating them and It seems to be holding production pretty flat since last July.
” XOM is not pleased with how the Guyanese govt is treating them”
What is your basis for that line of thinking, rather than the other explanation that it takes time to bring on new production (and why rush it when the prices are stagnant)?
‘I get the sense that XOM is not pleased with how the Guyanese govt is treating them’
What is the basis for your line of thought,
as opposed to the other explanation that it takes time to bring on new production facilities (and why rush it when the prices are stagnant)?
Exxon boosts Guyana oil output, undecided on future auction bid
This is not surprising. XOM could have come up dry with their drilling program and so the contract is very slanted towards XOM. The big surprise is how large the field is and how much oil it can produce. Not surprising that Guyana wants more.
“While Guyana is looking to dilute Exxon’s power over production and wants more favorable contract terms, Vice President Bharrat Jagdeo said earlier this year it may consider allowing Exxon and its partners into new acreage if they accelerated investment plans.
Guyana has been deciding whether to hold an auction for unassigned exploration areas, or to recruit a national oil company for a partnership that could produce oil from the new properties, Jagdeo said.”
https://www.reuters.com/business/energy/exclusive-exxon-boosts-guyana-oil-output-undecided-future-auction-bid-source-2022-09-20/
https://www.theguardian.com/world/2021/aug/18/guyana-to-seek-better-royalties-terms-for-future-oil-contracts-exxonmobil
Ovi,
I think output depends on capacity of existing FSPOs, basically output capacity may be limited to about 400 kb/d until more FSPOs are brought online.
Lightsout,
No, my rough guess would be less output than before such an invasion. I would also expect the US would step in so such an invasion is not likely to succeed in that case.
OPEC Oil monthly reviews
Non OPEC’s production in highest quarter of 2018 was 58.7mb/d
https://www.opec.org/opec_web/static_files_project/media/downloads/publications/MOMR%20December%202018.pdf
Non opec production in third quarter of this year is 65.6 mb/d.
https://momr.opec.org/pdf-download/res/pdf_delivery_momr.php?secToken2=accept
OPEC production is 5 million barrels per day less.
The percentage of NGL has hardly charged since 2019, how on earth can anyone think oil production is 2 million barrels per day less than 2018?
IEA and OPEC do not think so. They both say oil production at highest level ever.
EIA can’t even run a website let alone compile international oil production data
Charles,
I agree the EIA has not done very good work of late.
OPEC reports total liquids, as does the IEA. In OPEC’s Annual Statistical Bulletin (ASB) they report World Crude output.
See https://asb.opec.org/data/ASB_Data.php
In 2018 average annual World Crude output was 75297 kb/d according to OPEC and in 2022 it was 72801 kb/d.
I would venture to say that the Biden appointed leaders of the EIA are there for only one job. To promote, the World is in danger and if you just give us more control of your lives, we will save you from carbon dioxide. Providing reliable information really isn’t that important.
Thats such a dumb & gay take. Everyone knows its (((them)) that r f*ing things up.
Dennis
Thanks for that link. Jowever i am looking at this year
OPEC oil monthly report says all liquids production is 103 mb/d in October 2023
This is higher than the highest month on 2018 by 2 million barrels per day.
If they are correct, and they are normally very close than C&C is at it’s highest production ever.
Your refusal to read any of the indepth studies conducted by highly qualified organizations investigating the theft of oil which by the nature of theft is uncounted is baffling to say the least.
Their estimates put uncounted oil entering the global market is in the region of 3 to 5 million barrels per day.
Charles,
If someone has an estimate of theft, there is a count. There are x units produced and y units sold legally z=x minus y are the units stolen or lost.
We know what x is and it is likely that x gets consumed, some of it sold on black market.
I focus on 12 month averages, OPEC has very different consumption estimates than EIA, they might be wrong.
Charles from November 2023 MOMR, page 50
Preliminary data indicates that global liquids production in October increased by 0.3 mb/d to average 101.6 mb/d compared with the previous month.
From IEA
https://www.iea.org/reports/oil-market-report-november-2023
World oil output increased by 320 kb/d in October to 102 mb/d.
The EIA estimates World output in October 2023 at 102.3 Mb/d from STEO.
https://www.eia.gov/outlooks/steo/data/browser/#/?v=6&f=M&s=0&maptype=0&ctype=linechart
Average of three estimates for October 2023 is 102 Mb/d for October 2023. In Nov 2018 World liquids output was about 102.2 Mb/d. Note that total liquids minus C plus C output has increased over the intervening 5 years.
Dennis
This is truely a magical time.
We have had an increase of Global GDP of £8 trillion in the last 5 years with oil production falling by 3 million per day.
Over the next 10 years I expect global gdp to increase by another £14 trillion and oil production to be down to 50 million barrels per day😂
Charles,
Just going by the data rather than adjusting it to what I think should occur. Facts matter.
Energy use has increased, but the World is using less oil per unit of GDP. In the next 10 years I think oil output will be fairly flat, real GDP is likely to increase.
For the most recent 12 months World C plus C average output was about 1230 kb/d less than at the 12 month average peak in 2018. Also the most recent 12 month average was about 8077 kb/d above the low point for 12 month average output in November 2020 (centered 12 month average). There was a big change in the oil use by society due to more work from home that came about in response to the pandemic. This reduced World oil demand.
Interesting perspective on deepwater oil production:
https://www.youtube.com/watch?v=i0Py2vo8sVA
There’s part of it that are sort of folksy, not data intensive. Yet, I recommend hearing it out. Key aspects:
1. Increase in production over the decades.
2. Skeptics versus believers.
3. Technology advancement.
4. Oil major attitude (presenter was a VP at Shell).
5. Role of oil price and comparison of projects by type (e.g. shale versus offshore).
6. How is deepwater different/same versus onshore oil. I think it’s interesting how radical the ocean engineering is for offshore oil. Many massive developments in ocean engineering owe themselves to oil production (e.g. ROVs). But then there are also strange times when offshore is not that different than onshore.
7. Role of service companies, especially in the US.
Ovi,
Great work, as usual. Much appreciation for your time and efforts.
Although Utah’s numbers are somewhat small, the upward trend indicates improved operational processes as the Uinta Basin companies struggle for increased takeaway. (The proposed new 85 mile rail line has been stymied by court decisions.)
This dovetails with Ohio’s near 40% yoy oil production increase to 84 kbd output. (By this time next year, Ohio is likely to surpass Looeezeeana and take 10th spot on your charts.)
As an Encino executive just stated at the DUG conference, his company (biggest Ohio natgas producer) continues to improve operations which enables them to economically recover oil in the mostly-neglected northern Utica oil window. They are aggressively expanding their acreage position.
Same goes for EOG.
My point in posting this … these (Utah/Ohio) are concrete examples of what was derided as ‘Cornucopian’ fantasies by the pearl clutchers for so many years.
While many folks – including many (most?) – on this site embrace an outlook of hydrocarbon scarcity, ongoing, unfolding events actually point to a picture of hydrocarbon (over)abundance far off into the future.
My 5 cents worth, anyway.
Thanks, Coffee, I always learn from you. But in case you haven’t noticed, the world has declared war on hydrocarbons. COP28 says 2030 will mark the end.
For a very long time I have been in thrall to the waxy yellow oil of the Uinta basin. It is free of sulfur and most toxins and is of low enough API gravity that it is the ideal heavy oil to mix with LTO at the refineries. There’s also a lot of it in the interior of Utah, a friendly state in which to do business.
But therein lies the rub. In order to wind its way to the Gulf Coast it has to first wind through the mountain passes of Colorado, riding the same rails as the old “Ski Train” from Denver to Winter Park. Ain’t gonna happen. Ever.
It is called waxy for a reason. At room temperature it turns into a waxy solid. Warm it a few degrees and it turns liquid. It is so low in methane gas that even if it were to derail off the Ski Train track it wouldn’t explode, nor would it spill because it’s, well, a wax. But it’s up there, and the refineries are down there.
I sincerely believe that the world has plenty of natural gas for its forever needs–though some of it is dirty and could sure use a wash job in the LNG train. But oil? Well, we’ve got it, but a lot of it’s going nowhere fast.
Thanks Gerry. Interesting. Not clear if there is as much Natural Gas as some believe. At $2.50/MCF it will be much less, but with higher LNG exports the price may increase, that could hit demand in the US.
CoffeeGuyzz
Thanks
The Biden Administration unveiled new methane rules which take effect in two years.
It appears flaring will not be permitted except at stripper oil wells that meet certain criteria.
Not sure if and when this will affect shale oil. Would seem it may slow development?
Shallow sand,
If the rules are written well, it might slow development a bit, but would reduce the wasteful flaring of natural gas. From my perspective that would be a good thing, but I don’t know enough to evaluate the rules, you and others would give a more accurate assessment. Have you had a chance to look at them? Perhaps a post on the subject?
1,690 pages. Not easy to read. Still trying to figure it out.
Shallow sands,
Thanks, I should have known a government regulation would be difficult (or perhaps impossible) to figure out.
It will be hard for the Greenfolk in the Administration to sign onto military policies designed to help hated Exxon.
It’s a very clever maneuver by Maduro, and with CNOOC involved, they could evolve to be the arbiter of arguments.
I doubt many from either party will see fit to sit around with their hands in the pockets while Maduro takes action to grab a big chunk of a neighboring country.
Watcher,
The intervention could be done in the name of national security, a lot of the oil from Guyana may flow to the US.
In 2022 it was about 77 kb/d imported to US of 291 kb/d produced (about 26% of Guyana’s output). In August 2023 104 kb/d of Guyana’s oil was imported to the US out of 395 kb/d of oil produced (also 26%).
Rig and Frac Report for week ending December 8
Rigs Down: Fracs Up
– US Hz Rigs dropped by 2 to 455
– Permian rigs were down 4 to 297. Texas Permian was unchanged while NM was down 4 to 94. Both Lea and Eddy were down 2.
– Eagle Ford added 2 to at 49
– NG Hz rigs were up 2 to 103 (not shown)
Frac Report
The frac count increased by 2 to 278 this week. This broke the trend of the past few years when Fracs just dropped after Thanksgiving.
One year ago, 285 Fracs were operating, 7 more than this week.
Drilling in Lea and Eddy Counties
Both Lea and Eddy counties dropped two rigs each this past week.
Relating to the last thread’s discussion on ‘dark’ (unreported) global oil production …
a million barrel tanker just went aground off Singapore supposedly carrying sanctioned Venezuelan oil.
The locational transponder spoofing supposedly showed it off Africa when it was actually loading in Venezuela.
This is the second ‘dark’ ship mishap in a year in that region, and with several hundred ‘dark’/unregulated ships currently roaming the seas, more accidents are to be expected.
Food for thought for all the data crunchers.
Coffeeguyz,
This could lead to lower World consumption I suppose if oil is spilled and cannot be recovered. In the grand scheme it is likely a rounding error from the perspective of average daily consumption for the World over 12 months.
Dennis,
Gotta hand it to ya guy, you never cease to crack me up with so much of your outlook.
Always sincere, but frequently … somewhat off the mark.
My comment was simply a semi validation of Charles’ posts about how unreported oil sales/production is occurring.
The fact that a couple of mishaps by ‘dark’ ships within a year’s time points out that, yes, possibly significant amounts of hydrocarbon production is/has been taking place and the data you all use is not accurate.
The story of this ship’s accident stated that there are several hundred of these ships regularly plying their trade around the globe.
Several hundred Aframax and Suezmax oil laden ships adds up to heckuva lot of earl.
Way more than a rounding error.
Coffeeguyzz,
So you think the reported production data is wrong, I disagree. The important thing is not the number of tankers that try to avoid tracking (note that they fail or this would not be reported), it is the number that run aground and how much oil is lost. I will note that when a ship runs aground the oil is moved to another tanker and very little oil is spilled or lost in most cases. In short this is a nothing burger in terms of reported data.
If we don’t believe the data there is no basis for discussion, just a lot of hand waving. Not really interested is opinions, more interested in facts.
And could you point us to some “accurate” data?
We have some claiming output is over reported and others that claim it is under reported. I will take the average of those points of view and think it is roughly correct, over time it gets corrected as data is never complete until 12 to 24 months after the fact.
Dennis
I agree there is something wrong with the IEA and MOMR supply/demand estimates. They both imply the current oil market is short by 2 Mb/d. How is this possible with the price oil dropping almost $10 this past week. Either the supply numbers are wrong or the demand side is overinflated.
Ovi,
My guess is the demand may be overstated and supply may be either correct or understated. Difficult to know, but the market seems to think there is an oversupply of oil.
As I mentioned often, the oil price is done by option traders. Only in extreme situation it’s done by supply/demand.
And when option trade goes in one direction, so the stories do, too. Not the other way around. It’s the same with the stock market – one example:
One company reports earnings up, sales slightly down.
When the stock falls, all papers write: Disappointing sales.
When the stock is up: Good earnings, improved margin.
The trades at the wallstreet see as much data as we, or even less if they are computer traders doing the charts or even KI. But they sell and buy 300-500 millions of paper barrels of oil each day alone in the January future. That overlays normal trade.
D Coyne: “And could you point us to some “accurate” data?”
Probably the best, in my opinion, is not the IMO (which should have the data), or even the IEA (which probably doesn’t want the data), but Lloyd’s List.
Like probably a lot of you, I’ve been sort of keeping an eye on the so-called dark fleet since the sanctions went in. At first there was this area where ship-to-ship crude oil transfers took place, then certain rogue vessels (little tubs) turned off their transponders. This has now gotten pretty sophisticated. You can purchase a gizmo on the black market to jam the interaction between the ship’s GPS transponder and the satellite navigational system, using fake news GPS transponders to spoof the system.
The large carriers are insured. Lloyd’s List currently claims that up to 10% of all seaborne crude is, at any one time, on one of more than 400 ghost ships of the dark fleet, mostly headed through the Strait of Malacca.
I think it’s safe to say that there is a pretty damn big volume of crude oil out there on the high seas, produced in Venezuela, Iran or Russia, headed for China. How much? No way to know.
Gerry,
Do we have access to that data? Seems a subscription is needed.
Exxon Mobil forecasts increases in project spending, oil output
“Exxon announced plans to buy Pioneer in October for nearly $60 billion in an all-stock deal, saying it plans to more than triple its production in the top U.S. shale field to 2 million barrels per day (bpd) by 2027. Denbury was a $4.9 billion acquisition to buttress its carbon business.
Exxon’s estimated production growth for next year excludes more than 700,000 bpd it would gain from the Pioneer acquisition. That deal would double Exxon’s Permian shale oil and gas output to about 1.3 million bpd, the company has”
Could someone with knowledge of XOM explain these production estimates for the Permian, I presume. Triple production in shale field to 2 Mb/d. Implies current output is 700 kb/d. Add in 700 from Pioneer gets to 1.4 Mb/d. How do they get to 2 Mb/d.
https://www.reuters.com/markets/commodities/exxon-mobil-forecasts-higher-production-2024-2023-12-06/
Ovi,
Perhaps they increase their completion rate? An increase of about 80 new wells per month (gradually, and increase of 2 per month in completion rate over 40 months with a assumed decrease in average new well productivity of 3.65% per year over the 2023 to 2028 period would enable an increase in output of about 500 to 600 kbd. Seems optimistic to me, especially if oil prices remain depressed.
Ovi,
Also my model only considers tight oil, often these news blurbs are talking about barrels of oil equivalent so NGL and natural gas output is included, I ignore those in my scenarios except in looking at economics, the output in my charts is always tight oil only.
Exxon is awash with money and infused with brio.
The new premium on choice Permian drilling sites is on average about $2M, which puts the cost of a Hz well at closer to $15M than $10M, which means that at these prices many of them (coming in with high NG cuts) won’t pencil out.
The average wage in the Permian oilfield is now $44/hour. The rising GOR from thousands of wells per month hitting the bubble point is going to keep the NG market absolutely flooded. CTA’s are doing the rest, so we could easily see $1 NG–putting casinghead gas deeply negative.
The by-product methane gas will become a huge problem in 2024.
Gerry,
For Pioneer and Exxon wouldn’t they already have leases in place for the core areas? I would not think they would be paying these 2M fees for premium drilling sites as they would have these leases locked down already. In the most recent quarterly report for Pioneer average capital cost for wells completed was about 12 million per well.
If you take de-risked drilling sites and divvy out, Exxon paid between $1-$3M premium for those leases.
So add that to the Pioneer cost per well.
Most of those new Exxon wells are going to tally out at about $13-15M.
And a pretty good portion are in the area with a high gas cut in the IP90.
I think the price of NG is going to the floor. Even if the Saudis support $75 Brent, we should expect a fairly drastic slowdown from Exxon Permian in 2024. They’re not going to be drilling hard at $70 WTI and fifty-cent casinghead gas. Permian gas is selling for well less than two bucks right now.
Occidental’s CEO Is Rolling the Dice With CrownRock Deal — Barrons.com
12:00 pm ET December 11, 2023 (Dow Jones) Print
Andrew Bary
Occidental Petroleum CEO Vicki Hollub likes to play aggressively.
While industry leaders Exxon Mobil and Chevron are conservatively using all equity for their big proposed energy acquisitions, Occidental Petroleum is issuing debt to finance the bulk of its $12 billion deal for Crownrock, unveiled early Monday.
Occidental already has the most leveraged balance sheet among its peers, a legacy of its $55 billion purchase of Anadarko Petroleum in 2019. Its debt will initially rise to about $28 billion after the deal is due to close in early 2024. This could make the company vulnerable to a sharp drop in oil prices, but means shareholders stand to gain significantly if prices rise.
Occidental’s largely debt-financed deal for Anadarko deal almost sunk the company, whose stock fell to about $10 in 2020 from $60 in the spring of 2019 as oil prices plunged during the pandemic. Occidental has spent much of the past three years cutting its debt, but now its leverage is set to rise again.
“This shows the optimism that Vicki and the folks at Occidental exude right now about the future of the oil and gas business,” said Cole Smead, co-manager of the Smead Value fund, which holds the stock.
*****
Occidental to Buy Permian Basin Oil Producer CrownRock for $12 Billion — Barrons.com
7:37 am ET December 11, 2023 (Dow Jones) Print
By Angela Palumbo
Occidental Petroleum stock was declining Monday after the oil company announced it will acquire energy producer CrownRock in a deal valued at $12 billion.
Occidental said Monday that the acquisition will help increase the company’s position in the Midland Basin, and will add 170,000 barrels of oil per day to the company’s production. The Midland Basin is part of the oil-rich Permian Basin in west Texas and southeastern New Mexico.
“We believe the acquisition of CrownRock’s assets adds to the strongest and most differentiated portfolio that Occidental has ever had,” Chief Executive Vicki Hollub said in the release. “We found CrownRock to be a strategic fit, giving us the opportunity to build scale in the Midland Basin and positioning us to drive value creation for our shareholders with immediate free cash flow accretion.”
Occidental said it plans to pay for the $12 billion acquisition through the purchase of $9.1 billion of new debt, and the issuance of about $1.7 billion of common equity. It also will assume CrownRock’s $1.2 billion of existing debt.
The deal is expected to close in the first quarter of 2024.
*****
Additional Highlights
1,700 undeveloped locations, including 1,250 development-ready at sub-$60 WTI breakeven
750 locations are sub-$40 WTI breakeven, increasing Occidental’s U.S. Onshore sub-$40 breakeven inventory by 25%
Greater basin diversification at top end of portfolio advances corporate returns and optionality
Well-understood and rich subsurface is adjacent to some of the most prolific wells in the basin
Majority of inventory is located in largely clean and undeveloped sections, providing ample opportunity for Occidental customization and upside
Substantive surface acreage of nearly 10,000 acres, along with hundreds of miles of gathering and water infrastructure, provides material operational efficiency
Acquisition expected to advance Occidental’s water recycling capability with assets that include four recycling plants
Nearly 100% operated position with high average working interest of 93% amplifies Occidental’s capabilities
Added position enables Occidental to build upon its deep horizon Barnett well performance leadership, in which new well production was 34% better than basin average
Dennis, Lloyd’s List is a subscription service having to do with maritime commerce, and is actually one of the oldest newspapers in the world. Because it has so much to do with insurance a lot of people assume it’s tied in with Lloyd’s of London (It’s not). I don’t subscribe, but I have occasional access to its information.
It’s questionable how you would use the data, because even if you know the exact vol of oil-on-water, and believe LL that 10% of it is being transported illegally, there’s no way to know when it lands. If LL is to be believed–and they were around long before there was an International Maritime Organization–then this has become a very large business handling sanctioned crude oil. My guess? 3-5 mbopd from Venezuela, Iran, Russia, mostly going to China and N. Korea.
Gerry,
Interesting thanks. I agree there is likely significant quantities of oil that try to avoid sanctions, by turning of transponders and possibly by moving oil from ship to ship offshore, much of this oil may go to China and India, my contention is that the 3 to 5 Mb/d is already accounted for in the output numbers and the consumption numbers, the shipping is not straightforward so that sanctions are avoided. Venezuela is a mess so not a lot of extra output coming from there (over what is reported by OPEC), the Iranian output is also likely correct and lots of different agencies watch Russian output very carefully, it is doubtful that much more is being produced than is being reported by OPEC, IEA, Argus, and Rystad due to western sanctions. That is how I see it, but hey maybe the numbers are off. Note that these three nations reportedly produce about 14.5 Mb/d collectively, so if they were producing 3 Mb/d more than this, it would be an increase of 17% and would match the highest output these nations have collectively produced since Jan 2014 (in December 2016).
Dennis
Please stop trying to pretend you are an expert in every field of the oil industry, we all know you have not worked in this complex industry.
Experts who have been tasked with trying to assess how much crude oil gets onto the global market without being counted as struggling with this issue.
The illegality takes all forms. Corrupt officials who work at the production sites falsify figures and sell oil by the tanker load in Libya.
Russia exports oil on ghost ships and I assure you they don’t let IEA officials witness that cargo leaving.
Nigeria losing millions of barrels per month from pipelines that do not have proper monitoring.
Corruption in Angola, Sudan Iraq, Iran sanctions busting, and on and on.
If you can’t be bothered to read the reports available you really have nothing to say.
Those who have risked themselves to uncover aspects of the hidden oil trade estimate 3/5 million barrels per day does not appear on official data. They know more about it than you do.
I guess the question is are the hidden barrels new since the 2018 peak? Or were they also there then and thus irrelevant. Because if this number is constant then it doesn’t really matter. And if it’s not constant how the hell do you find out how much it is accurately?
Stephen,
You just trust the “experts” that know more than we do. Also you choose to ignore the experts at Rystad, Argus, EIA. IEA, and OPEC who know all about what those other experts are saying and use that data to make their best estimate of World Supply and Demand.
Good point on the history, we would need to know how this “uncounted oil has changed over time. As I pointed out earlier if we focus on the sanctioned nations of Iran, Venezuela, and Russia, their peak output since Jan 2014 is about 3 Mb/d more than reported output in August 2023 for C plus C, I guess the other 2 Mb/d is coming from Nigeria, Libya, and Iraq.
Nobody is claiming that this oil is “reported” to the IEA, OPEC, or the EIA, they all use secondary sources that track this, including the sites that focus on the dark fleet of tankers. Claims that an oil tanker can be hidden from view are specious.
Charles,
I will continue to express my point of view, I have never pretended to be an expert. You can express your point of view as well, if you want to, just don’t expect everyone will agree with you.
I looked through the stuff you posted, most of it was just news articles, some was behind a pay wall, I did not find it convincing.
New option games in the oil market today.
Oil down hard – but it isn’t anything related with China. Copper is flat – and in copper China is the main consumer, even more than in the oil market.
Even target practicing of the Huthi on oil tankers can’t keep it at least flat.
Shadow Fleet
https://www.bloomberg.com/news/videos/2023-12-05/russia-s-shadow-fleet-video
In the 30 years up to 2019, global oil consumption has increased by around 0.4 barrels per $1,000 increase in GDP. In round numbers that is 1mb/d increase for increase in GDP of $2 trillion per year.
https://www.energypolicy.columbia.edu/publications/oil-intensity-curiously-steady-decline-oil-gdp/
Since 2019 according to EIA global oil consumption has fallen by 1/2 million barrels per day. Yet GDP has increased by $10 trillion. How can this be possible. In short it can’t.
Since 2019 new sanctions have been placed on Iran and Russia, together they have developed in fleet of shadow tankers that disappear and reappear all over the world. They take light crude to Venezuela and than ship illegal Venezuelan oil to China and others. Hidden they load up with Russian or Iranian crude mainly to India and China, but many other countries take the oil once it has transferred to other tankers.
Estimates of this hidden trade and all the other forms of corrupt sales and theft are in the region of 3/5 million barrels per day.
That fits in very well with the increase in global GDP of $10 trillion. Just like in the time of prohibition, the supply of alcohol in the US created a massive illegal market and made criminals very rich. This is happening today with the transport of oil.
I am pretty sure Al Capone did not tell the government how many bottles of Whiskey he sold.
I think that number would be detectable when they would have counted the sale of empty glass bottles…
A few years ago some researcher guessed the number of amateur athletes doping with EPO.
He took the whole import and production of EPO (that’s a complete legal number in this case), deducted all medical use, and assumed ALL profi athletes would take it.
Then round about 500.000 year-doses where left….
So when you know the number of tankers, the official documented trips, the median trip time and their load capacity you can guess an upper boundary for smuggling…
And I guess if you take official chinese fuel sale and official chinese oil import you’ll get a big gap ;). At least there is a chinese oil consumption number. And a lot of smoke.
Most things leave traces somewhere.
Charles,
The Iranian sanctions have been in place since May 2018, the sanctions on Venezuela since at least 2017 and the Russian sanctions started in 2022. Just because something is not reported to a government or by a government does not mean it is not tracked by someone. How is it that we have the 3 to 5 million barrel per day estimate? Someone is paying attention. Do you believe that the people that estimate World Supply and Demand do not have access to that information? Also how has this changed over time?
Consider the reset caused by the pandemic and associated social changes such as a higher percentage of people working from home. In 2020 World real GDP fell by 2.6 trillion 2015 US$ and World liquids consumption fell by 9.32 Mb/d so we saw a 3.58 Mb/d drop in consumption for each 1 trillion 2015$ less real GDP. Since that pandemic reset World real GDP increased by 7.63 trillion 2015$ from 2020 to 2022 and World liquids consumption increased by 7.58 Mb/d. In this case the increase in liquids consumption was 0.994 Mb/d for each trillion 2015$ increase in World real GDP.
The change in world liquids consumption in barrels for each thousand 2015$ increase in World GDP does not remain constant over time. It has been decreasing since 1985 as shown in chart below.
The second link you posted says this, in 2019 0.43 barrels of oil per $1000 of real GDP was consumed which is about half the level of 1980. From that paper:
The time trend also reflects a gradual regime change from a supply- to a demand-constrained global oil market. In percentage terms, oil intensity first declines at rates lower than global GDP growth, allowing global oil demand to rise. Over time, given its linear functional form, the rate of intensity decline will accelerate to outpace the rate of global GDP growth, in which case global oil demand would peak and start to decline.
You misinterpret what the authors were saying, read a little more carefully, the point of the paper was that oil intensity is decreasing over time, not as you imply that it has remained constant.
Also if we assume the trend in the oil intensity data from 1985 to 2022 continues in the future and that World real GDP grows at 2.5% per year after reaching 93 trillion 2015$ in 2023 we see flat and then declining oil consumption due to reduced oil intensity,
Chart with World Liquids consumption assuming World real GDP grows at 2,5% per year after reaching 93 T 2015$ in 2023 and the linear decrease in World Oil intensity established from 1985 to 2022 continues through 2040.
Dennis
It is obvious what the author is saying.
The global economy is becoming a tiny bit more efficient in producing gdp with each barrel of oil. each $1000 of increase in needs 0.01 barrels less with each passing year.
Your figures would have us believe that this efficiency has Increased so much that we need 0.7 barrels less. This negative figure is simply absurd.
The shadow fleet has increased from a couple of hundred to over a thousand in the last 6 years.
What the hell do you think they are doing.
It is obvious you don’t want to believe anything other than your government data cos if you did you and Ovi have been wasting your time with all your graphics.
I however have no vested interest and am far more open to convincing sources of new data.
Charles,
You said:
In the 30 years up to 2019, global oil consumption has increased by around 0.4 barrels per $1,000 increase in GDP.
This is not what the author said, you misinterpreted. What the author said is that 34 years ago (in 1989) the World needed about 0.69 barrels of oil per 1000 2015$ of World real GDP and in 2019 only 0.43 barrels were needed. Further the autor points to the fact that if the trend from 1989 to 2019 were to continue that demand for oil would peak and decline. According to the analysis the peak in World Oil consumption would be 2019 with a secondary peak of 100.86 Mb/d in 2029.
A similar analysis that focuses on World consumption of gasoline, diesel, jet fuel, Kerosene, and Residual Fuel Oil (collectively I call these “transport fuel”) from 1993 to 2019 finds the following (see chart below) World demand for these fuels assuming World Real GDP in 2023 is 93 Trillion 2015 US$ and that future World real GDP growth is 2.5% per year on average from 2023 to 2040. The scenario also assumes that the trend in barrels of transport fuel consumption per thousand 2015$ of World Real GDP from 1993 to 2019 continues from 2022 to 2040.
Dennis
In reply to your comment above that XOM may be reporting BOE’s, seems to be a good guess. Attached is XOM production from NoviLabs. As of May, they were producing 334 kb/d of LTO. Their production looks pretty flat starting in March 2022. First light blue peak
Ovi,
Thanks. If we look at XOM and Pioneer their combined Permian output from Novilabs is 812 kb/d in July 2021 and 846 kb/d in July 2023, so yes only a 4% increase over 2 years, and no increase from July 2021 to Jan 2023. Quite flat especially the first 19 months. Natural Gas was about 540 kboe/d in Jan 2023, total liquids approximately 1350 kboe/d (assuming 6 MCF=1 boe).
As we get ready to close out 2023, let me summarize past 25 years of production and also look ~25 years ahead.
After reaching a peak in early 2023, global oil production is down at least 2% from that level.
50 % of world production comes from 4 countries: US, Saudi Arabia, Russia, and Canada.
We are at a pivotal point, wearing the most rosey pair of glasses, you might believe estimates for reserves of 2PC (~1,260 Gb), since total world production to date stands somewhere around 1,500 billion barrels that means that a production peak would have been reached about 4 years ago (2019).
I believe we are approaching another milestone as well, it will be 5 years since the 2018 peak, I’m not sure there’s ever been 5 years where a new peak was not reached…blaming COVID might have worked a couple years ago, but now it’s been 2 years and all rebounding has occurred.
Here’s a look at trends from those 4 countries over the past 25 years:
While there’s no doubt of a debate about how much oil remains, it seems like the debate is over for the peak (2018). It looks like we can squeek out another 10 years of BAU (finish off those 1P reserves). Then we might see a 5 year transition into a much lower energy environment (hopefully we can bring alternates fast enough to reduce the shock). This timeframe alligns well with the top companies (Exxon, BP, Total Energies, Chevron, Shell, etc.) who have proven reserves to last 15-20 years.
Kengeo,
The peak in 1980 for average annual World C plus C output was 59.6 Mb/d, that peak was surpassed 9 years later in 1989 when average annual World C C output was 59.8 Mb/d. If supply was short oil prices would be over $90/b. When we see WTI prices at the average level of 2011 when the average annual WTI price in 2023 US$ was $128.54/bo, then we can talk about a shortage of oil. Crude oil output is down because crude oil demand is down.
It may be that the peak in World demand for C plus C has already passed, in which case we may see output decrease due to low oil prices, we might not see $100/bo in the future due to lack of demand.
Dennis and Ovi you high find this information from Raymond James useful.
Midland Basin Deep Dive: Well Productivity & Remaining Core Inventory
https://raymondjames.bluematrix.com/links2/doc/html/fea2b024-3e42-48e4-b347-7e1ebdb7f4a5?id=Umljay5NaWNoYWVsc0ByYXltb25kamFtZXMuY2E6NDo=
just a drive by for me. I had to stop reading and posting as the degree of uninformed ignorance by many here was just just to much for the tiny bits of information that I could find useful.
Thanks Texastea, excellent information. Roughly 7 years of core inventory for Midland Basin at $50/bo and 2.50/MCF according to this research (from June 2023).
Thank you for this compilation.
There are all things in that was talked and guessed about here – especially productivity is rolling over hard. They softened it a bit in the conclusion – but there is nothing nice at productivity per foot of the well falling by 13% year over year, negating the gains of more than the last 4 years.
It was softened a bit by the ever growing well length per well, but this also increases costs + land usage even more.
And it gives additional numbers behind the warnings of Mike here: There’s a problem.
Eulenspiegel,
Note that they claim that the falling productivity is due to a different mix of completed wells with a greater percentage of completed wells in less productive formations. Note that Pioneer claims that the IRR is higher on the longer lateral wells due to lower completion costs per foot of lateral (about a 35% reduction in costs per foot for a 15k lateral compared to a 10k lateral). They are willing to trade a 10 or 15% decrease in productivity per foot as the profits per foot may be higher. That is what Pioneer claims. Note also that the number of locations where 15 laterals are possible is quite limited especially in core areas that are very crowded, as these locations become more scarce over time we may see a decrease in average lateral length and average productivity per foot might stop decreasing as rapidly as it is doing currently.
Drilling the less efficient rock is a sign of a problem – nobody does this on purpose.
And laterals got 5% longer, but 13% less efficient – in overall not a good deal and a sign of a problem. A 5% longer lateral that delivers 6% less oil looks like still more expensive for less.
Pioneer probably has hoarded the better acres, at least they have the money for it.
All in all, the best quality time looks to be over – production still could be increased by brute force. We’ll see. The smaller producers that now drill these bad wells that pull down the statistics will have to give up first when this is their best remaining land.
TexasTeaTwo
Thanks. Will see what I can lift from this report.
Thank you for sharing that nice analysis with us. I could be wrong but I continue to think that many of these “deep dives” are missing a key issue: Excess NG. I have been involved in this long enough to realize that shale oil is almost entirely a solution gas driven process. The interplay between far-away fractures allowing egress of hydrocarbons and the pressure imposed by natural gas is one of the most important elements. In the shale oil wells, it is fairly easy to plot the bubble point.
Okay, I’m not going to harp on the bubble point in terms of well productivity, but rather underscore the fact that there are so damn many wells about to hit the bubble point in a gas-glutted market. This is germane because the premise of profitability (in the analysis) was based on $60 WTI and NG @ $2.50, which is beginning to look wildly optimistic.
To put this into more practical terms, if because of productivity of shale oil, the price of NG goes to fifty cents, or zero, that changes the calculus. Exxon has the power to exercise restraint. Carrying a debt burden of $28B, Occidental isn’t going to have much option but to drill as hard as they can. The same is true for most private outfits. There is an existential war being waged globally against natural gas, at the same time that Qatar, Saudi Arabia and many other places are gearing up to produce much more. The price in the field is already well below the $2.50 mark listed by Raymond James. The tier 2 spots that are being moved into come–usually–with a higher gas cut, not less or flat.
I think there is a good bit of room for the production of much more than adequate LTO, but it’s going to come with the burden of a glut of NG at (possibly) giveaway prices. To me the massive methane burden is much more of a limiting factor than LTO productivity per horizontal foot.
Gerry
I think the plan is to export much of the Gas, perhaps drilling rates will need to be reduced or more pipeline built.
If prices drop, fewer wells will be completed and heavily indebted companies will be bankrupt.
“I’ve seen gluts not followed by shortages, but I’ve never seen a shortage not followed by a glut.” – Nassim Taleb
Of course the “plan” is to export the gas, Dennis, but that is everyone’s plan. The whole purpose of my post was that Occidental is about to place themselves in $28 B of debt, and that they are assuming a breakeven of $60 WTI and $2.50 NG just to stay alive–not even to pay down the debt. NG is already selling for $1.50 in the Permian basin, and going down. There is a GLUT of NG, and it’s about to get worse. In fact, it is about to become the glut that ate Texas. Hundreds of these aging Permian shale oil wells are reaching the bubble point on a daily basis. And the new drilling sites are not exactly those with a low gas cut. Occidental is their own keeper, but before they go bankrupt, I can assure you they’re going to poke more holes into the ground than any other company has done in such a short time–that is their MO–and that is going to exacerbate the problem. That’s about as plain as the nose on your face. Due to a race by each company to become bigger, the Permian basin is going to drive the price of a BTU of NG to the floor. As it happens, NG is the little bolt-on tool that makes the difference between a profit and a loss on lots of shale wells. None of this makes one whit of difference if the price of NG goes to fifty cents.
Gerry,
Occidental may increase or maintain its completion rate and other companies such as Exxon may decide to reduce their rate of completion in response to low natural gas prices. The GOR is increasing in the Permian and natural gas production has increased from 14 BCF/d to about 21 BCF/d from Jan 2021 to March 2023, so roughly a 7 BCF/d increase. LNG exports only increased by about 2 BCF/d over that 26 month period. Total exports of natural gas increased by about 3 BCF/d for Jan 2021 to Mar 2023 while imports of natural gas over this period decreased by about 1.1 BCF/d, so net exports increased by 4.1 BCF/d. Over this period total dry natural gas output in the US increased by 10.3 BCF/d. The EIA reports a 10 BCF/d increase in Permian dry natural gas output from Jan 2021 to March 2023 which is 97% of the increase in US dry natural gas output over this period. According to EIA data, the Permian shale gas output has only increase by 0.14 BCF/d from March 2023 to October 2023, this data may not be accurate judging by the tight oil data which seems to under report output for the Permian ( the same may be true of shale gas). For example in March 2023 for the Permian basin, Novi reports about 21 BCF/d while the EIA reports about 16.7 BCF/d.
after Bubble point, gas production is not necessarily much higher than before, just oil production drops much faster. According to conventional production experience, just the gas wetness or NGL will go higher.
You could find some of the EF condensate/wet gas fields south of COP and Devon and their oil is nose diving but gas production did not go up after bubble point. Similar things happen in condensate wet gas wells in Marcellus/Utica, but especially Marcellus wells they really produced lots of gas and oils before oil really decline, and gas still little monsters, somehow. Many new wetgas wells in Marcellus, WV, could produce over 250 K BO and over 10BCF EUR, while similar wetgas EF wells ony has EUR under 200KBO and just 3BCF of gas. In WV-OH-PA tristate corridor, such NGL production is so high that might contribute to the derailed car in East Palestine, OH.
NGL is good for lots of chemicals including Ethylene and Propylene, it is possible that US could build more plastic capacity to outnumber SABIC or China and many countries using NGL from naphtha in oil refineries.
For God’s sake, I get it–it’s not that an old well begins to pump out scads of methane, it’s just that production of oil drops dramatically and gas production continues for quite a few years, and because a lot of people have absolutely no restraint they produce more new wells to export LTO, and because most of those places they’re now drilling have a high gas cut, the overall gas situation is turning into a disastrous glut! Two days ago, NG was being sold for a little over a buck fifty. That’s not economical. And because I sell quite a bit of NG, and these idiots don’t give a rip about anyone else or the preservation of a natural resource, it pisses me off.
I’m trying to figure out whether I am losing my communicative skills, or that you people think I don’t understand the process, or you’re being coy. I’ve been dealing with this shale well crap for a very long time, using my own money, and despite what I suppose is an inarticulate manner of speaking, I do understand how it works. But what is about to become very clear is that the whole damn Permian Basin is turning into a NG glut of previously unseen proportions. Adios, amigos, I’ll wander off to the assisted living facility now. Gee, I hope I can find it.
Gerry,
I think Sheng Wu may be trying to educate people like me that don’t know as much as you do.
Thanks for the information, I agree natural gas will be a problem unless either more pipeline capacity is built to service increasing LNG export capacity or the drilling rate slows down.
I understand your frustration, Gerry!
like Scott Lapierre, he spelled truth, but the operators do not want hear the truth.
Now, the US LTO probably over drilled 50% more wells, and getting 30~50% less, just for the greed of short term valuation.
Gerry…if its frustrating, and it is, you must remember that nobody, I repeat nobody has much invested in their opinions. I liken it to asking the OSU football team how it would remove a tumor from your brain.
In gas depletion, oil expansion unconventional SRV’s, associated gas can hang in there awhile before it enters Stage 4 of the depletion process and IT declines. I think you are right to be worried. The entire Permian will gas out soon enough. Personally I believe Exxon will become the largest gas producer in the US, from its tight oil wells in Eddy County and in the Midland Basin…the PXD buy will go down in history, No. 2 behind the Oxy/Anadarko thing. The Oxy/Crowquest thing makes the top 10. Its cool to be in the top 10, twice.
APP Basin gas is dwindling from bad economics and dropping well productivity, EQT is dumping shit as fast as it can to raise money and the mighty Haynesville doesn’t make lunch money below $3.85.
Associated gas from tight oil wells is THE most expensive gas every produced in history. So, you got that going for you. And LNG exports will speed the entire unconventional disaster to warp speed; the sooner its all over the sooner the world gets back to normal. You just gotta out live the dumb bastards.
World Update will be posted tonight.
From Art Berman
https://www.dropbox.com/scl/fi/tcnapwxsrjiwfedvi8fhm/artbemandec.-2023.jpg?rlkey=fedpkjpjau28f256ol0xyvyyb&dl=0
Here is his latest interview with Nate Hagens
https://www.youtube.com/watch?v=qqTh2nBEcCs
Annual production decline rate appears to be ~1% since 2018, but more recently as high as 2.5%.
Between now and 2050, production decline rates will likely be somewhere between 2 – 5%.
URR thru 2080 is likely 2,300 Gb plus or minus 500 Gb (low end ~1,800 Gb looking at only 1P reserves, high end ~2,800 Gb looking at 2PC reserves).
Visualization:
Also important to note:
Current production is at least 5 times higher than the average amount of new reserves added.
Since reaching a max of ~1,700 Gb in 2011, Proven reserves have failed to grow by 5% over more than a decade.
Prior to that, reserves grew by almost 3% each year for more than 20 years.
Additionally, 1P reserves have been declining by around 10% annually, indicating that reserve replacement is not occurring. If 1P reserves do not get replaced, decline rate will steepen gradually and then accelerate to around 5-7%, or possibly more.
An update to World and Non-OPEC Oil production has been posted.
https://peakoilbarrel.com/august-non-opec-and-world-oil-production/
A new Open Thread Non-Petroleum has been posted.
https://peakoilbarrel.com/open-thread-non-petroleum-december-13-2023/