By Ovi
The EIA International Energy Statistics had a reporting hiatus from its May 2023 report to July 2023. They have restarted their reports with the August update. This report updates the POB reports and charts posted for May, June and July.
Below are a number of Crude plus Condensate (C + C) production charts, usually shortened to “oil”, for Non-OPEC countries. The charts are created from data provided by the EIA’s International Energy Statistics and are updated to August 2023. This is the latest and most detailed world oil production information available. Information from other sources such as OPEC, the STEO and country specific sites such as Russia, Brazil, Norway and China is used to provide a short term outlook for future output and direction for a few of these countries and the world.
World oil production and projection charts are presented at the end of this post.
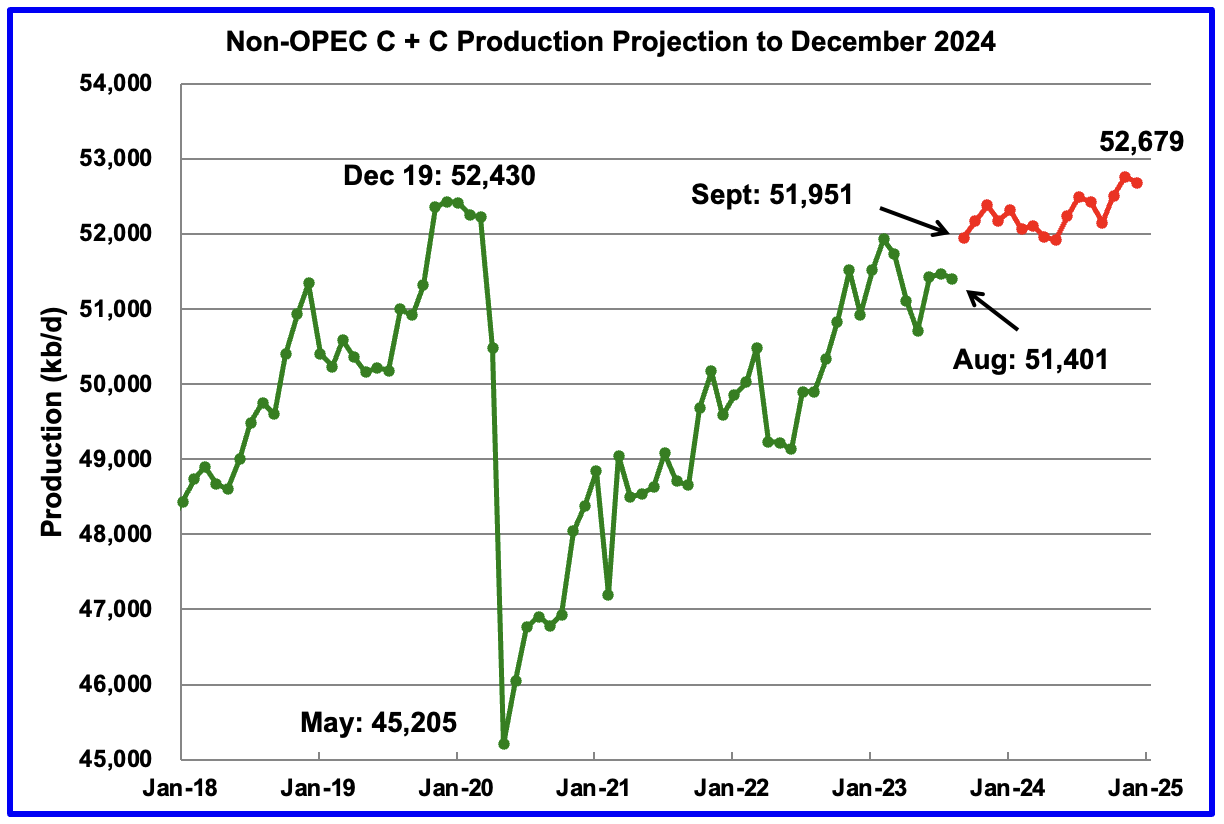
August Non-OPEC oil production dropped by 71 kb/d to 51,401 kb/d. The largest decreases came from Kazakhstan, Brazil and Russia.
Using data from the December 2023 STEO, a projection for Non-OPEC oil output was made for the period September 2023 to December 2024. (Red graph). Output is expected to reach 52,679 kb/d in December 2024, which is 249 kb/d higher than the December 2019 peak of 52,430 kb/d. The current December 2024 output of 52,679 kb/d was revised lower by 407 kb/d than forecast in the November 2023 STEO.
From September 2023 to December 2024, oil production in Non-OPEC countries is expected to increase by 728 kb/d. According to the STEO, the major contributors to the increase are expected to be the Russia, Norway and Canada.
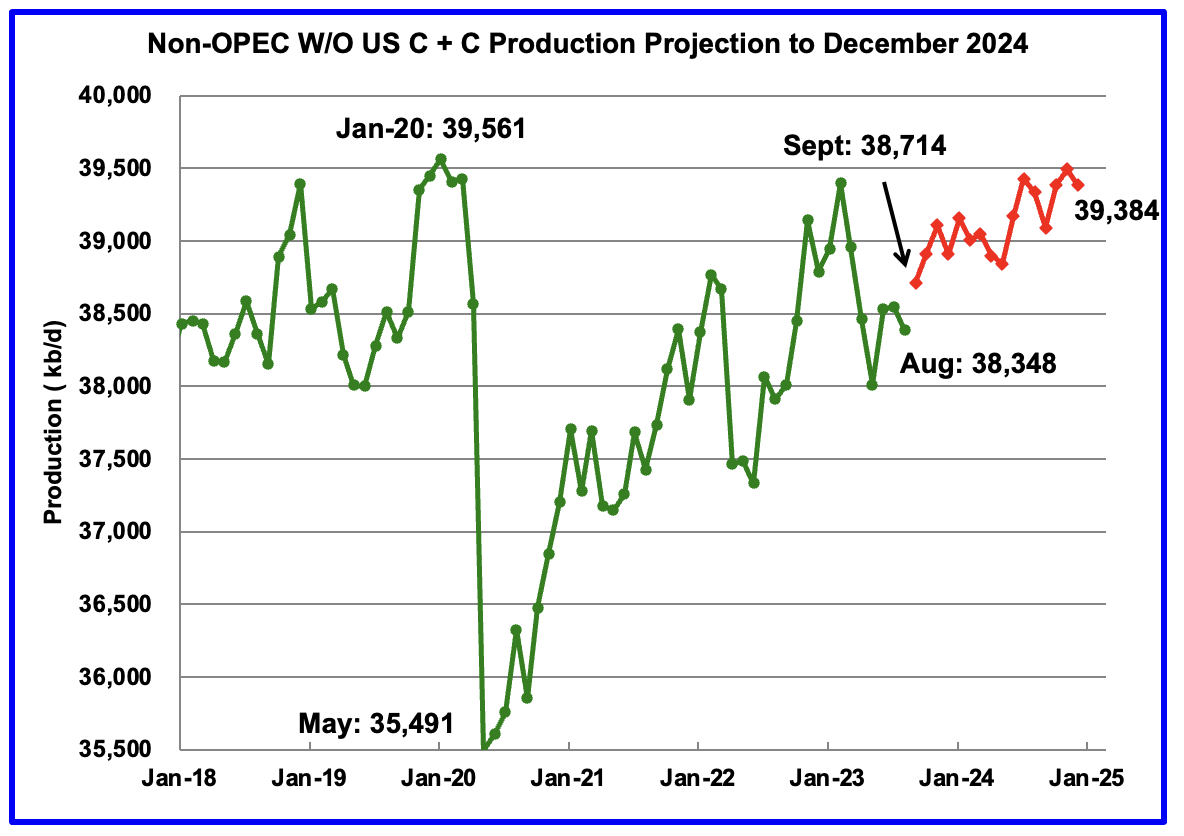
August Non-OPEC W/O US production dropped by 165 kb/d to 38,348 kb/d. September production is projected to increase by 366 kb/d.
From September 2023 to December 2024, production in Non-OPEC countries W/O the US is expected to increase by 670 kb/d.
Note that December 2024 output is lower than the 39,561 kb/d high in January 2020 by 177 kb/d.
Non-OPEC Oil Production Ranked by Country
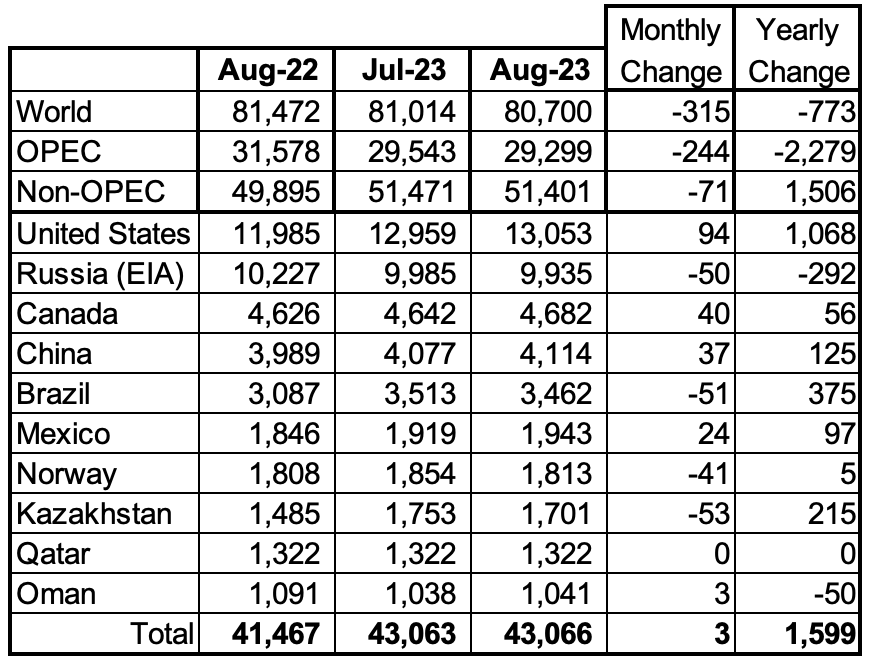
Listed above are the World’s 10 largest Non-OPEC producers. The criteria for inclusion in the table is that all of the countries produce more than 1,000 kb/d.
August’s production increase for these ten Non-OPEC countries was 3 kb/d while as a whole the Non-OPEC countries saw a production decrease of 71 kb/d.
In August 2023, these 10 countries produced 83.8% of all Non-OPEC oil production.
OPEC’s C + C production decreased by 244 kb/d in August while YoY it decreased by 2,279 kb/d. World MoM production decreased by 315 kb/d while YoY output decreased by 773 kb/d.
Non-OPEC Oil Production Charts
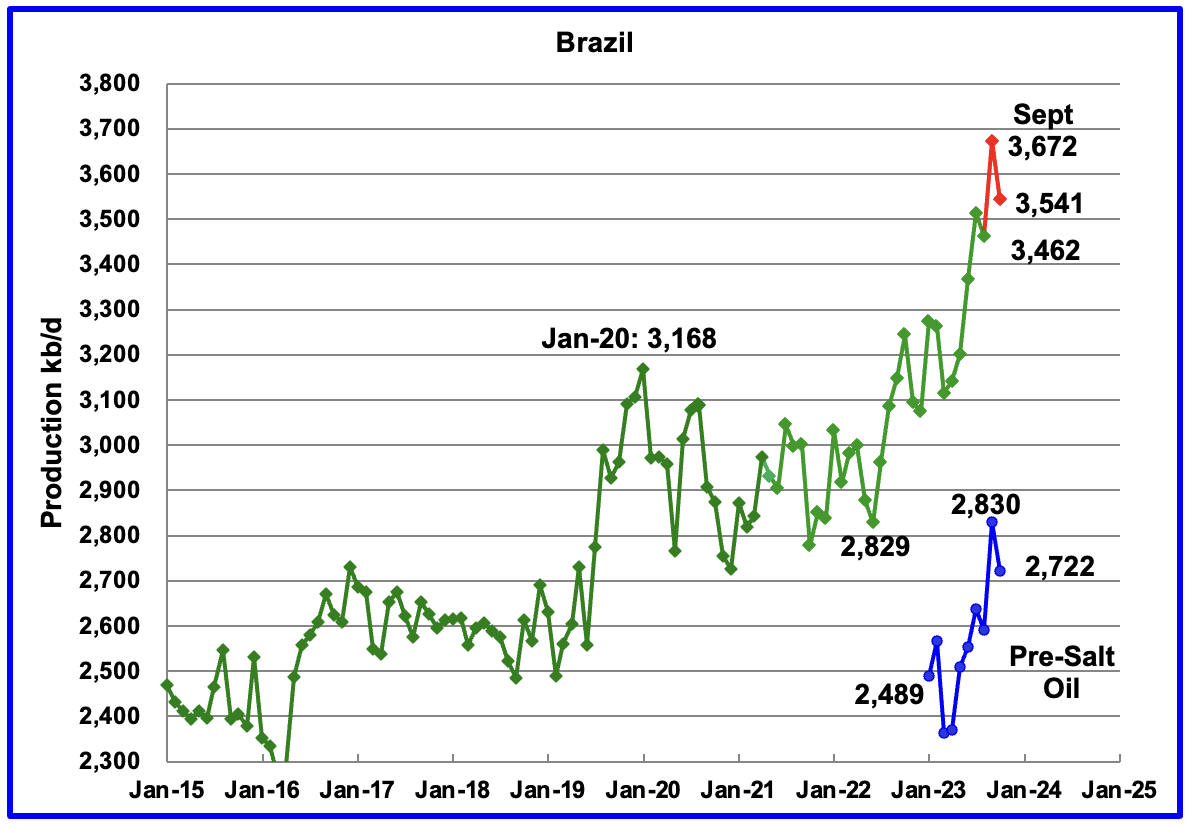
The EIA reported that Brazil’s production decreased by 51 kb/d in August to 3,462 kb/d.
Brazil’s National Petroleum Association (BNPA) reported that output in September increase by 210 kb/d to 3,672 kb/d followed by a 131 kb/d drop in October. According to the November MOMR, September output increased mainly due to ramp-ups at four offshore platforms and less maintenance.
The December MOMR report does not provide any explanation for the October drop. However for 2024, the MOMR states: “Crude oil output is expected to increase through production ramp-ups in the Buzios (Franco), Mero (Libra NW), Tupi (Lula), Peregrino and Itapu (Florim) fields. Oil project start-ups are expected at the Atlanta, Pampo-Enchova Cluster and Vida sites.”
Production from the off-shore “pre-salt” region has been added to the Brazil chart, blue markers. October production dropped by 108 kb/d to 2,722 kb/d, which accounts for most of the 131 kb/d overall decrease in Brazil’s October output.
Much of Brazil’s upcoming 2023 production growth will come from the highly productive pre-salt fields. From March 2023 to September 2023, production from the pre-salt fields increased by 467 kb/d.
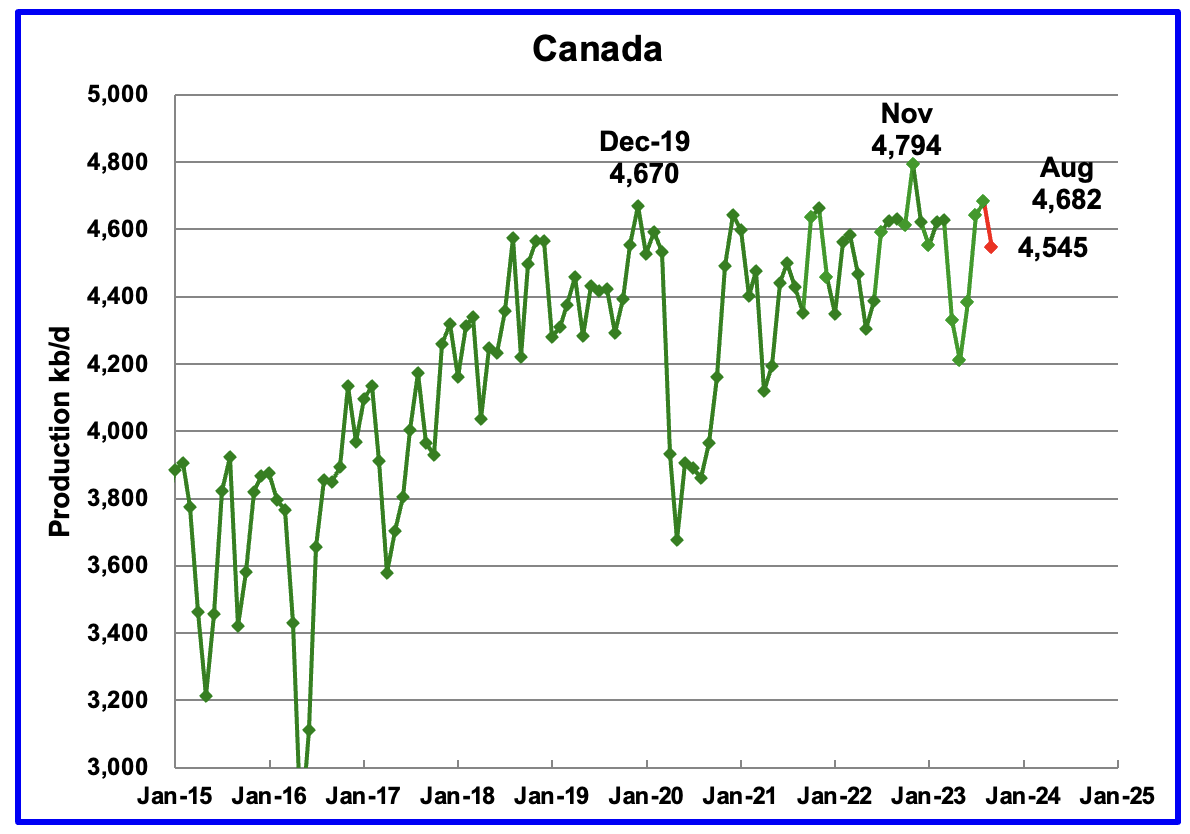
According to the EIA, Canada’s production increased by 40 kb/d in August to 4,682 kb/d.
The STEO is forecasting that Canadian production will drop by 127 kb/d in September due to fires in Alberta this past summer.
The Terra Nova Floating Production Storage and Offloading unit (FPSO) restarted production in November according to this source and will add 27 kb/d to Canada’s oil output.
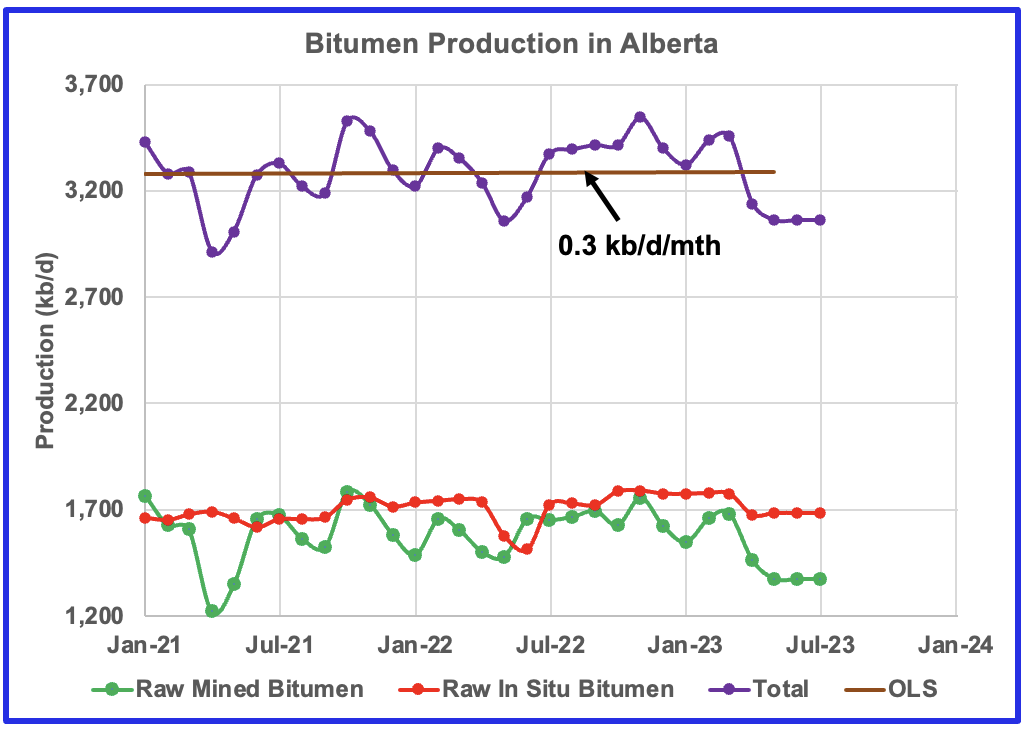
This chart shows the post pandemic trend in bitumen production in Alberta according to data provided by the Canada Energy Regulator. Production from April 2023 to July 2023 was affected by severe weather and plant maintenance.
According to the December OPEC MOMR report: Crude bitumen production output rose in October by 56 tb/d, m-o-m, while synthetic crude increased by 45 tb/d, m-o-m. Taken together, crude bitumen and synthetic crude production rose by 101 tb/d to 3.3 mb/d.
The TMX pipeline continues to be plagued by problems. It has encountered “very challenging” construction conditions due to the hardness of the rock in a mountainous area between Hope and Chilliwack. The Canada Energy Regulator has not approved a variance request to use a smaller diameter pipe in that part of the route. Denying the variance request would likely add an extra 55 to 60 days to the construction schedule.
The delay could push the startup date to late Q2-23 or early Q3-23.
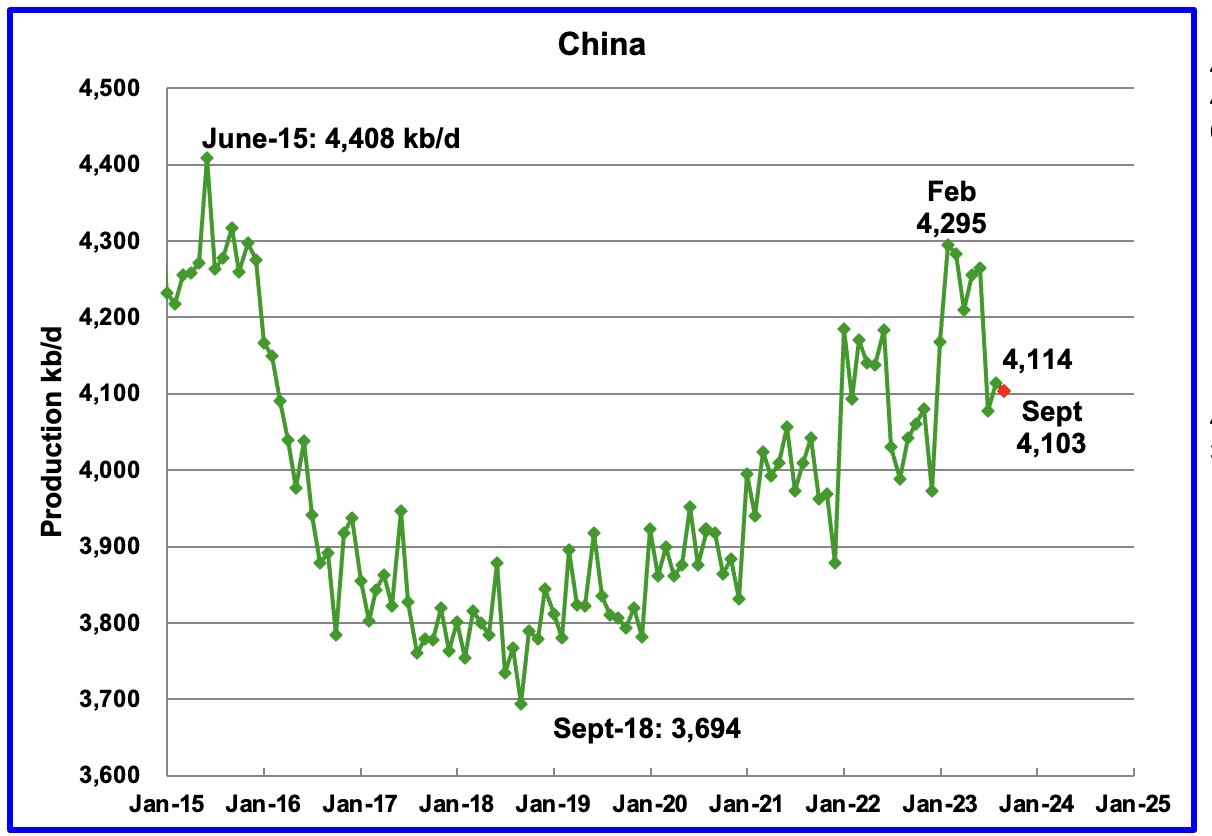
The EIA reported China’s oil output in August rose by 37 kb/d to 4,114 kb/d.
The China National Bureau of Statistics reported that output dropped in September to 4,103 kb/d.
Every January for the last four years, China’s production has taken a massive increase. In 2022 production jumped by 322 kb/d from December 2021 to February 2022. However according to the November/December MOMR: For 2024, Chinese liquids production is expected to remain steady at the 2023 level of 4.6 m/d.
While China’s production growth has risen steadily since 2018, it may be approaching its post pandemic high as inferred by the November MOMR.
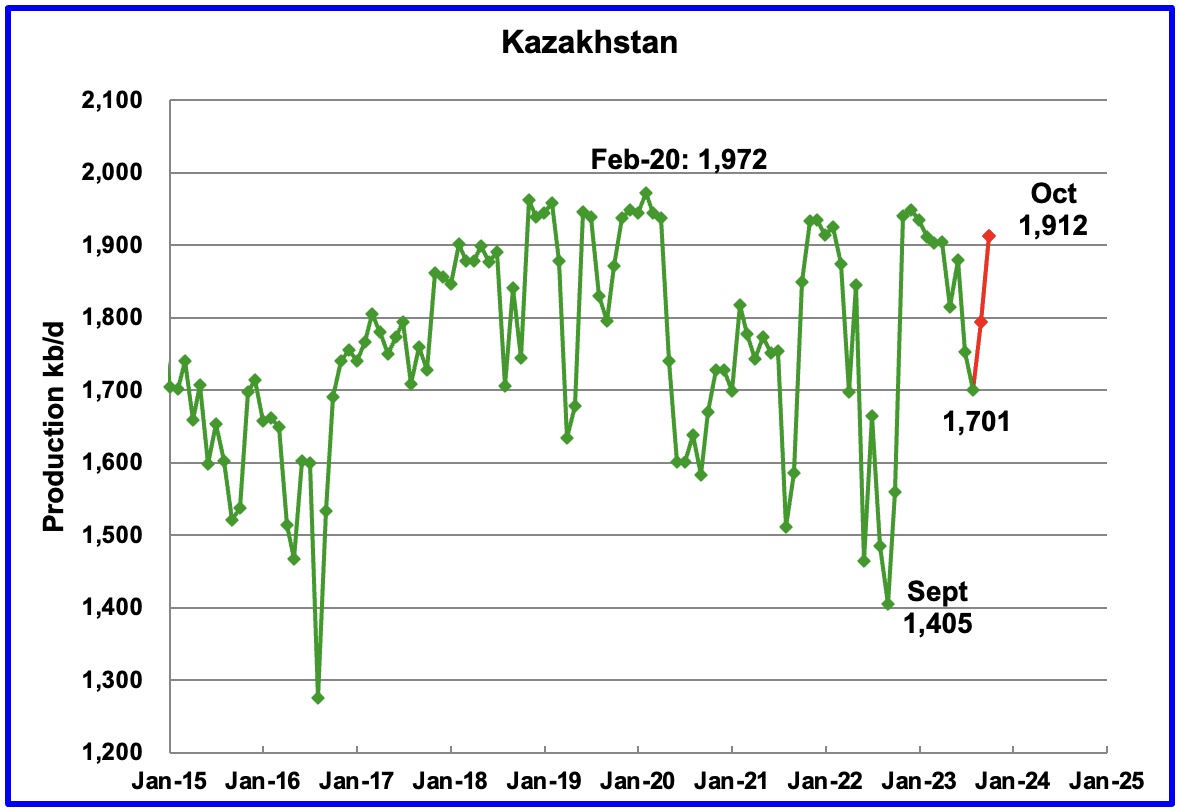
According to the EIA, Kazakhstan’s output decreased by 53 kb/d in August to 1,701 kb/d.
The STEO is forecasting that production will rebound in October to 1,912 kb/d.
The December MOMR is reporting that “Crude production was up by 37 tb/d, m-o-m, to average 1.6 mb/d. NGL and condensate output rose by 17 tb/d, m-o-m, to average 0.3 mb/d.”
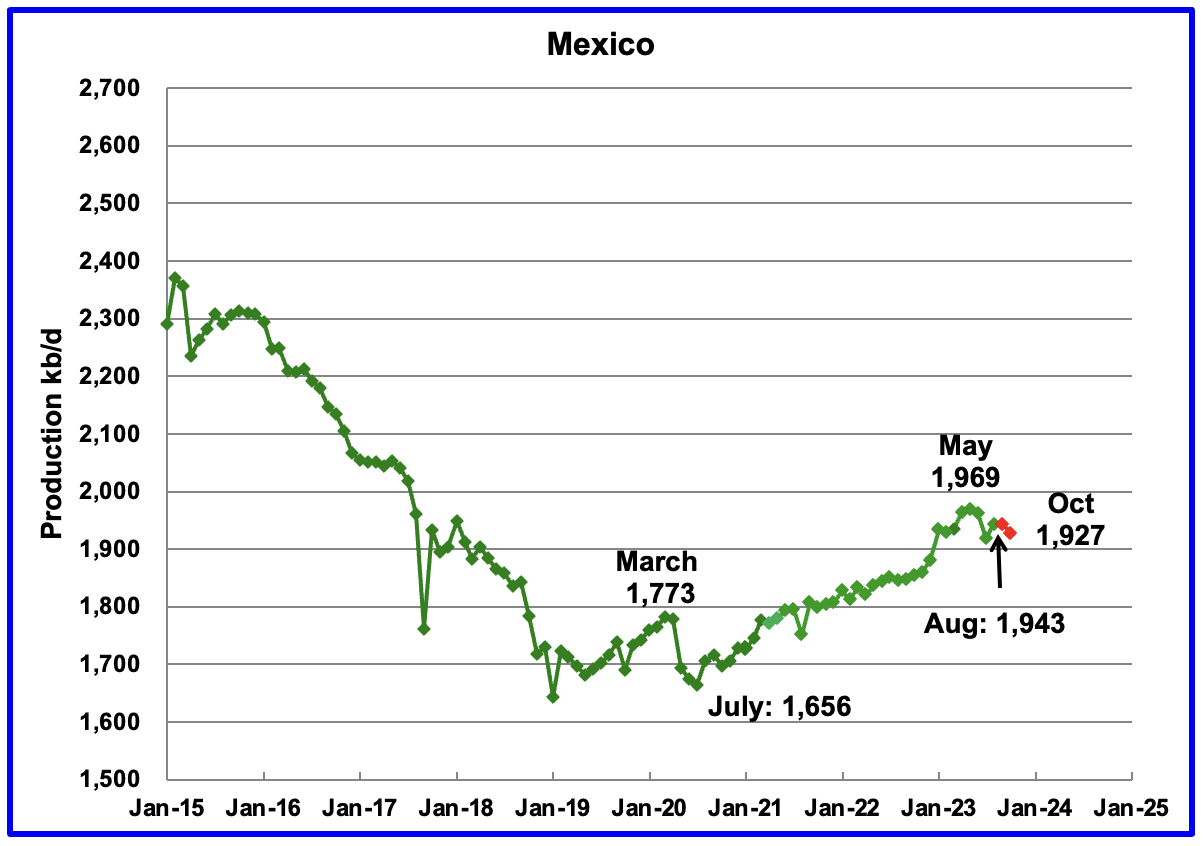
Mexico’s production in August and September was 1,943 kb/d an increase of 24 kb/d from July’s 1,919 kb/d.
According to Pemex, Mexico’s oil production from August to October was relatively flat. October output was 1,927 kb/d, 8 kb/d higher than July.
Mexico has recently revised its definition of condensate. This has resulted in the EIA adding an extra 64 kb/d, on average, to the Pemex report. The red markers include the additional 64 kb/d.
According to the December MOMR for 2024: “Pemex’s total crude production decline in mature areas like Ku-Maloob-Zaap and Integral Yaxche-Xanab is forecast to outweigh production ramp-ups in Area-1 and El Golpe-Puerto Ceiba, and from a few start-ups, namely TM-01, Paki and AE-0150-Uchukil.
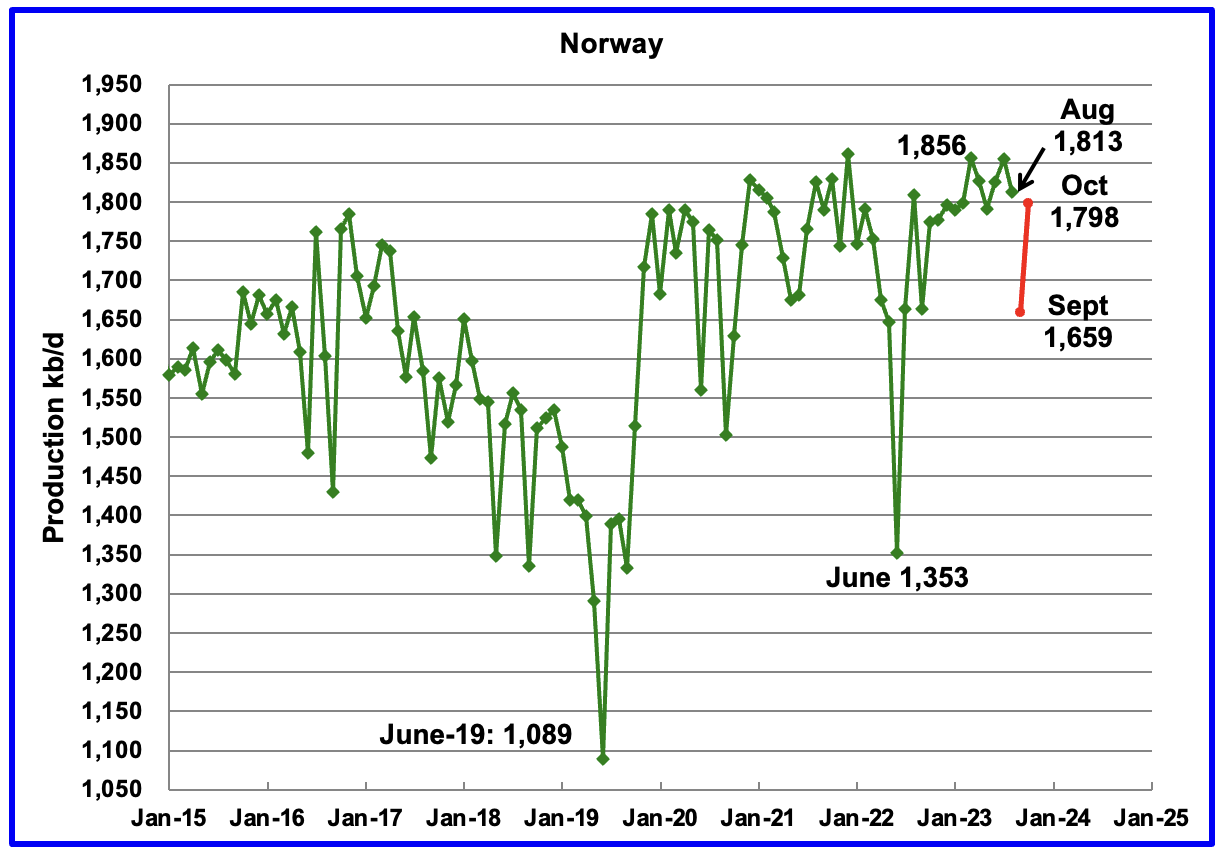
The EIA reported Norway’s August production dropped to 1,813 kb/d.
Separately, the Norway Petroleum Directorate (NPD) reported that September’s production dropped to 1,659 kb/d and then rebounded to 1,798 kb/d in October. (Red markers). The September drop was due to unplanned shut down and equipment failure on a number of platforms.
According to the NPD : “Oil production in October was 3.7 percent lower than the NPD’s forecast and 0.7 percent lower than the forecast so far this year.”
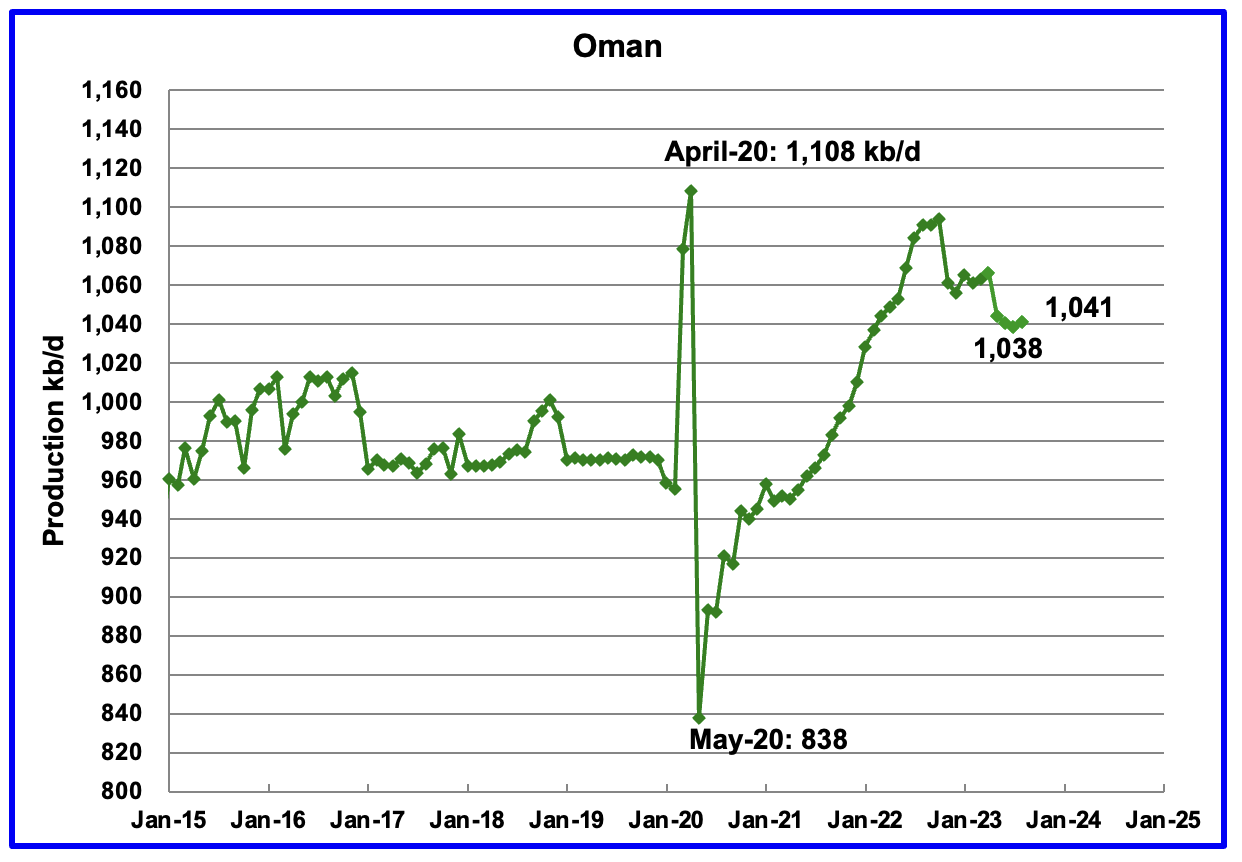
Oman’s production rose very consistently since the low of May 2020. However production began to drop in November 2022. According to the EIA, August’s output rose by 3 kb/d to 1,041 kb/d.
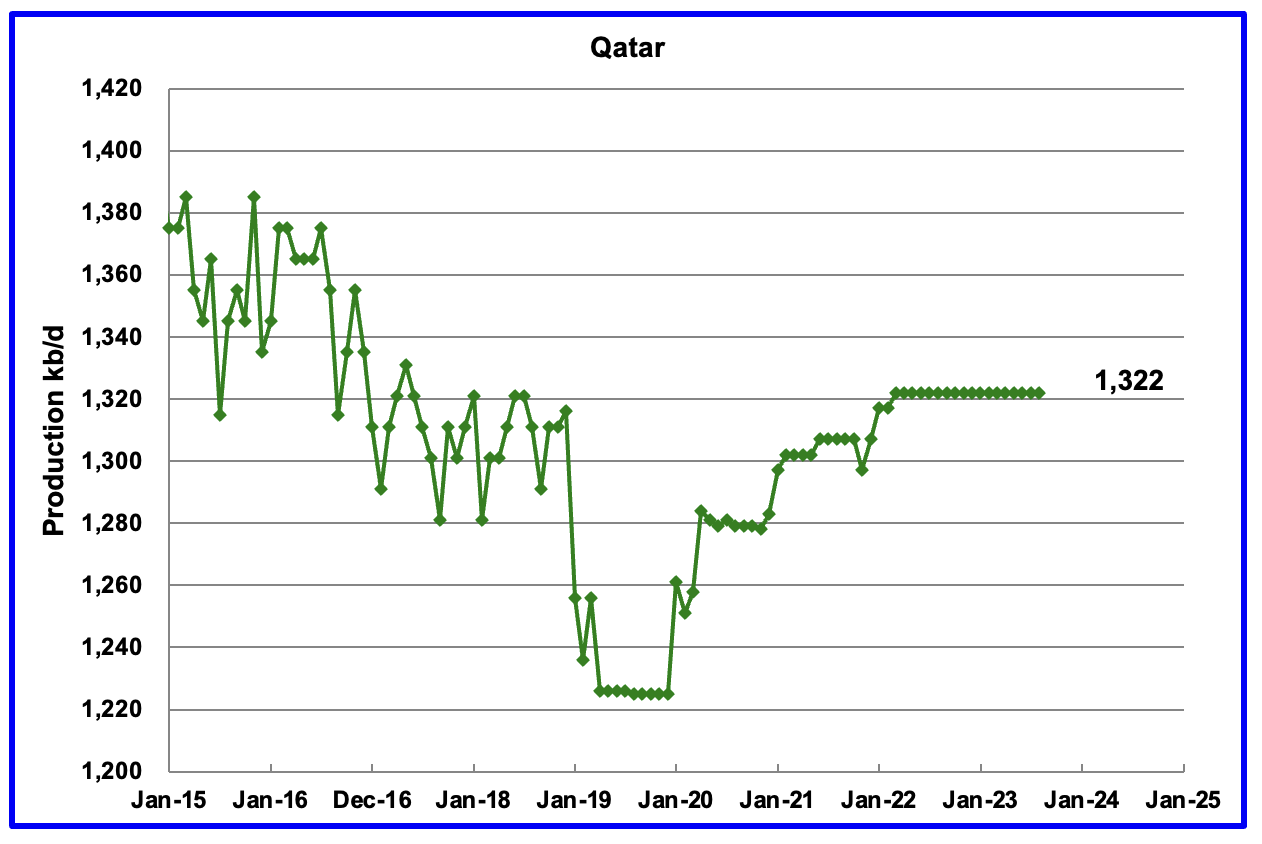
Qatar’s August’s output was unchanged at 1,322 kb/d, possibly due to lack of updated information.
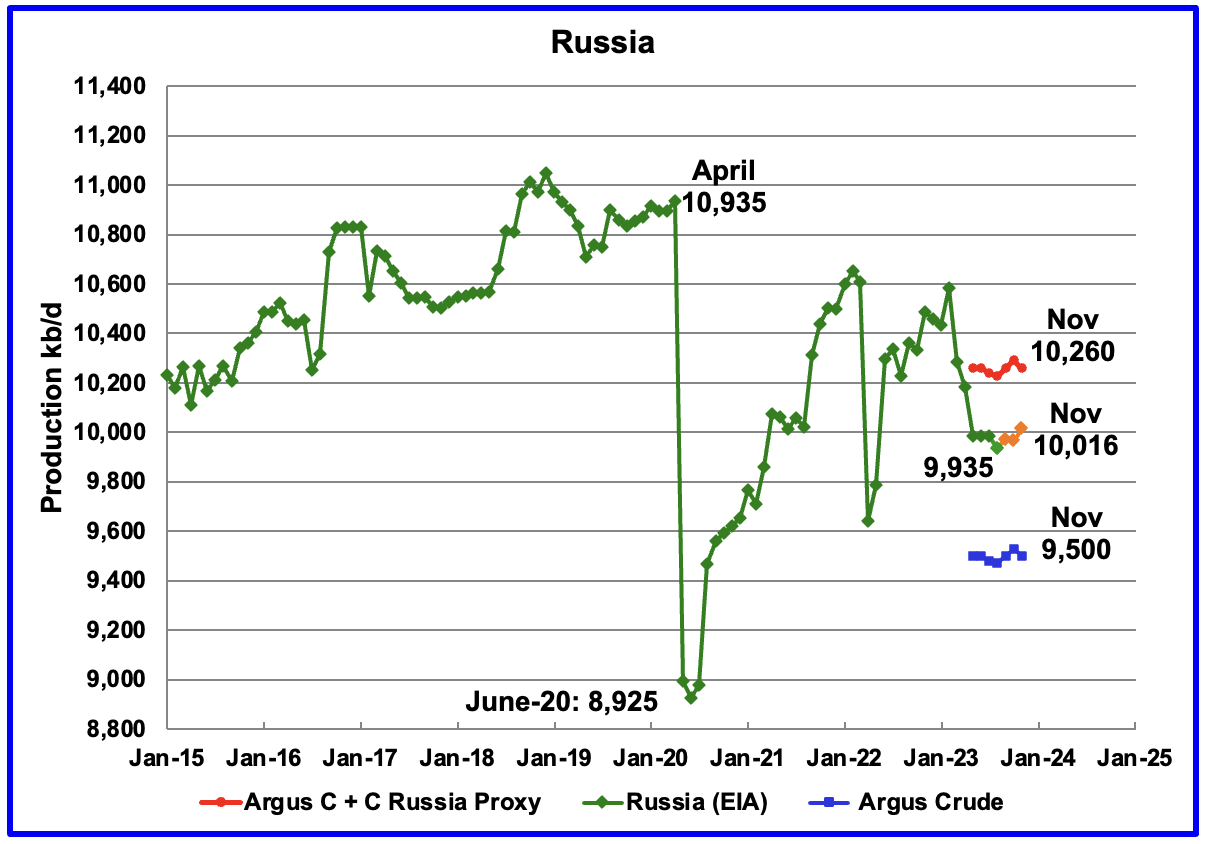
The EIA reported Russia’s August C + C production was 9,935 kb/d. Using data from the November STEO report, Russian output is expected to increase to 10,016 kb/d in November, orange markers. There is no sign that Western sanctions are affecting Russian oil production.
Using data from previous Argus Media reports, Russian crude production is shown from May 2023 to November 2023. For November, Argus reported that Russian crude production was 9,500 kb/d, a decrease of 30 kb/d from October, blue markers. Adding 8% to Argus’ November crude production provides a C + C production estimate of 10,292 kb/d, which is a proxy for the Pre-War Russian Ministry estimate, red markers.
Comparing the Argus crude data with the latest STEO projection indicates that the EIA estimate for Russian C + C is between the Argus estimates for Crude and C + C. Prior to the war, the Russian Ministry estimate was alway 404 kb/d higher than the EIA estimate for C + C. The current November Russia Proxy output is 244 kb/d higher that the EIA’s estimate.
The November IEA OMR agrees with Argus that Russian crude production in October was 9,530 kb/d.
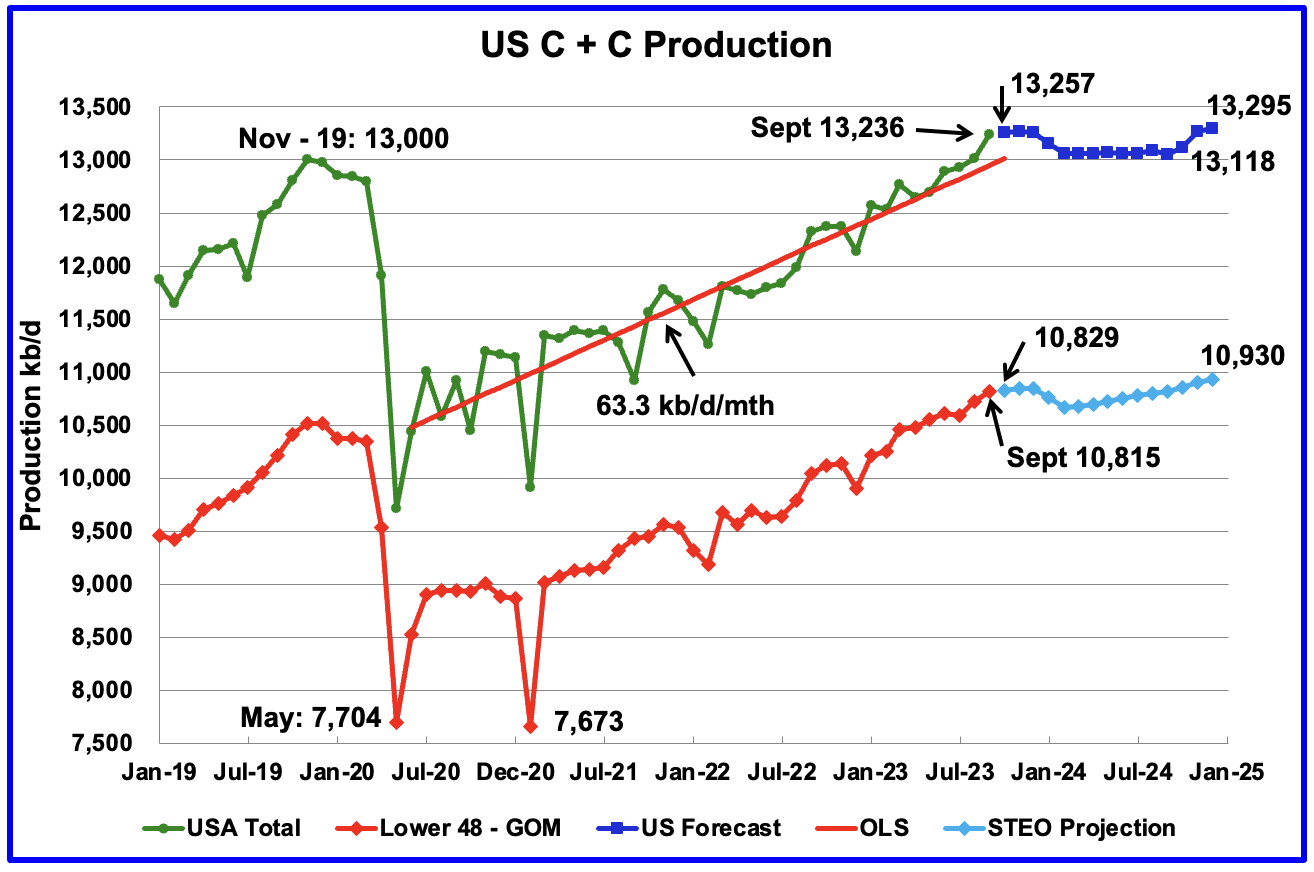
U.S. September oil production increased by 224 kb/d to 13,236kb/d as reported in the previous post. However the 2024 production projections reported in the previous post have been updated in this post.
The dark blue graph, taken from the December 2023 STEO, is the forecast for U.S. oil production from October 2023 to December 2024. Output for December 2024 is expected to reach 13,295 kb/d which is 145 kb/d lower than forecast last month and marginally higher than September 2023.
While overall US oil production increased by 224 kb/d, the Onshore L48 had a production increase of 91 kb/d to 10,815 kb/d in September. Most of the 91 kb/d came from North Dakota, 79 kb/d.
The light blue graph is the STEO’s projection for output to December 2024 for the Onshore L48. From October 2023 to December 2024, production is expected to increase by 101 kb/d to 10,930 kb/d.
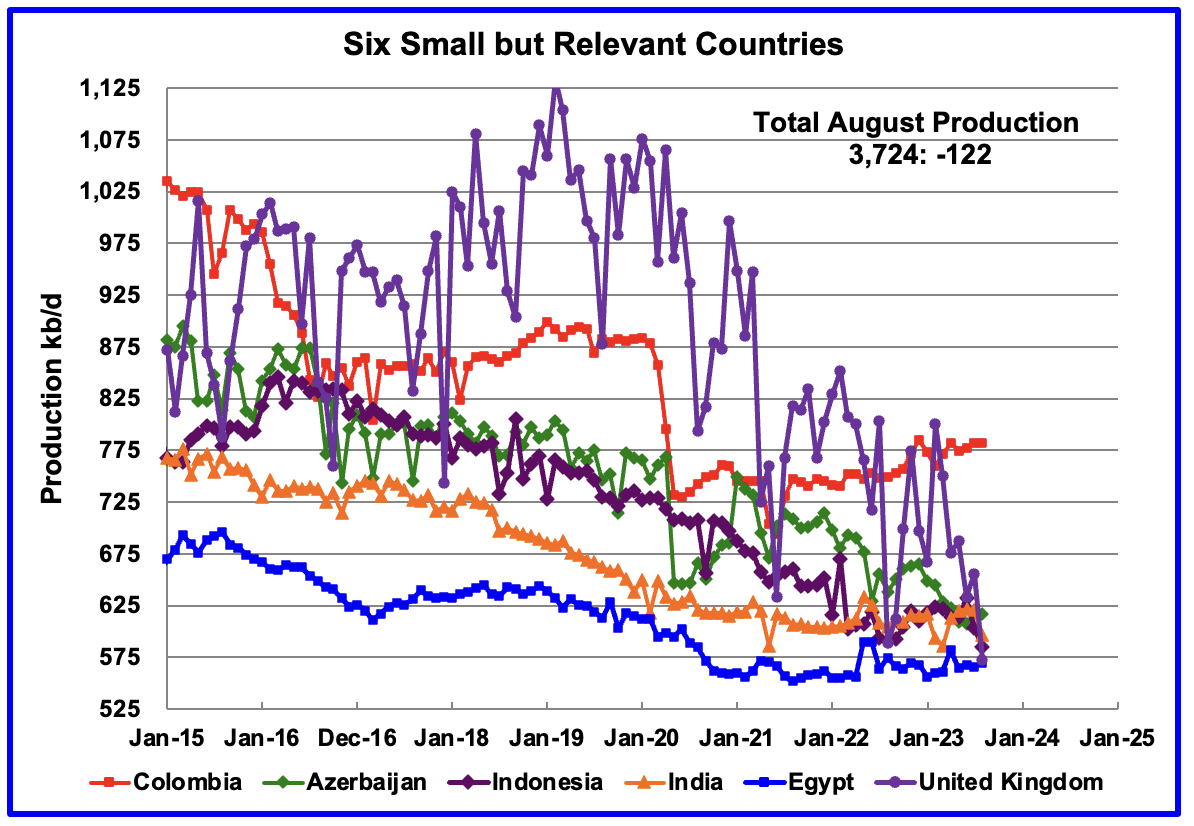
These six countries complete the list of Non-OPEC countries with annual production between 500 kb/d and 1,000 kb/d. Note that the UK has been added to this list since its production has been below 1,000 kb/d since 2020 and fell to a new low of 573 kb/d in August.
Their combined August production was 3,724 kb/d, down 122 kb/d from July.
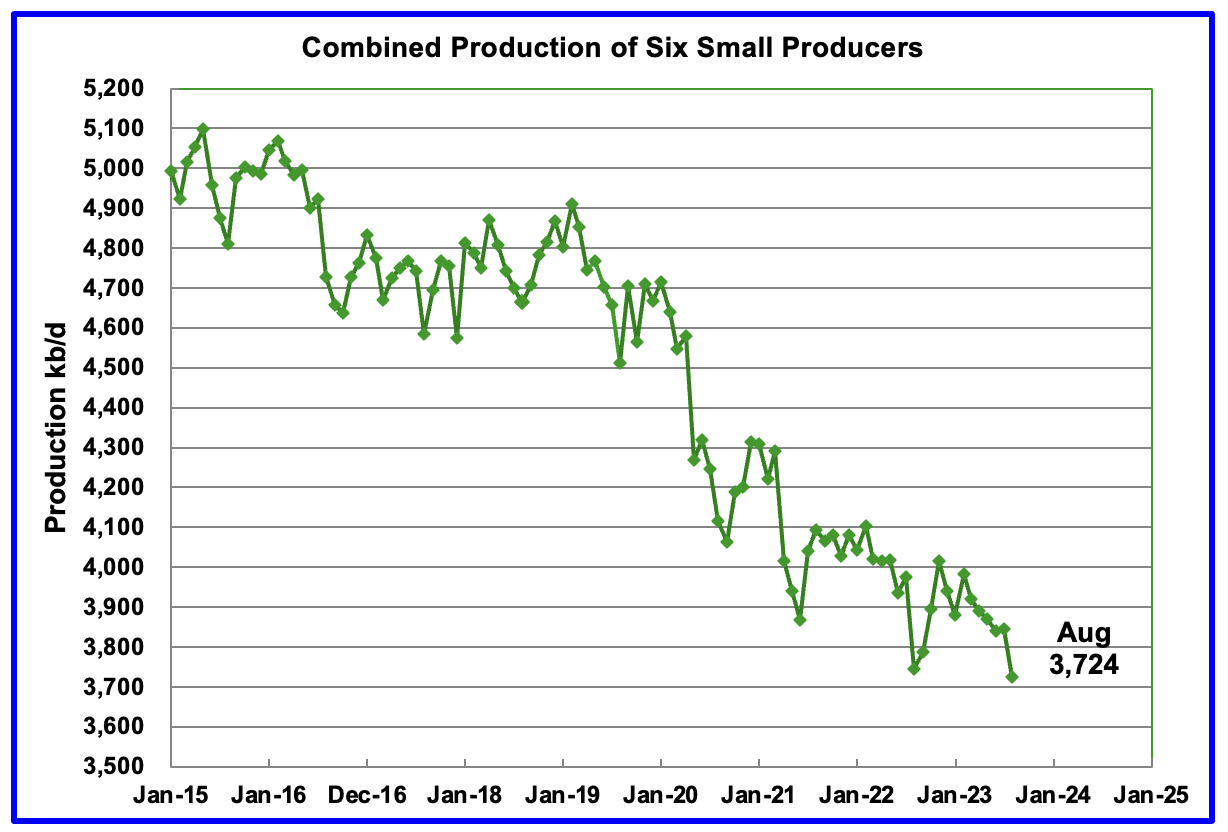
The overall output from the above six countries has been in a slow steady decline since 2014 and appears to have accelerated after 2019.
A Different Approach to World Oil Production
Instead of dividing the World oil producing countries into OPEC and Non-OPEC, this section divides the countries into two groups on the basis of their production capacity. The division will be The Big Three, US, Saudi Arabia and Russia, and the Rest, i.e. the World oil producers W/O the Big 3. The top producer in the Rest, currently Canada, produces less than half of the lowest producer in the Big Three.
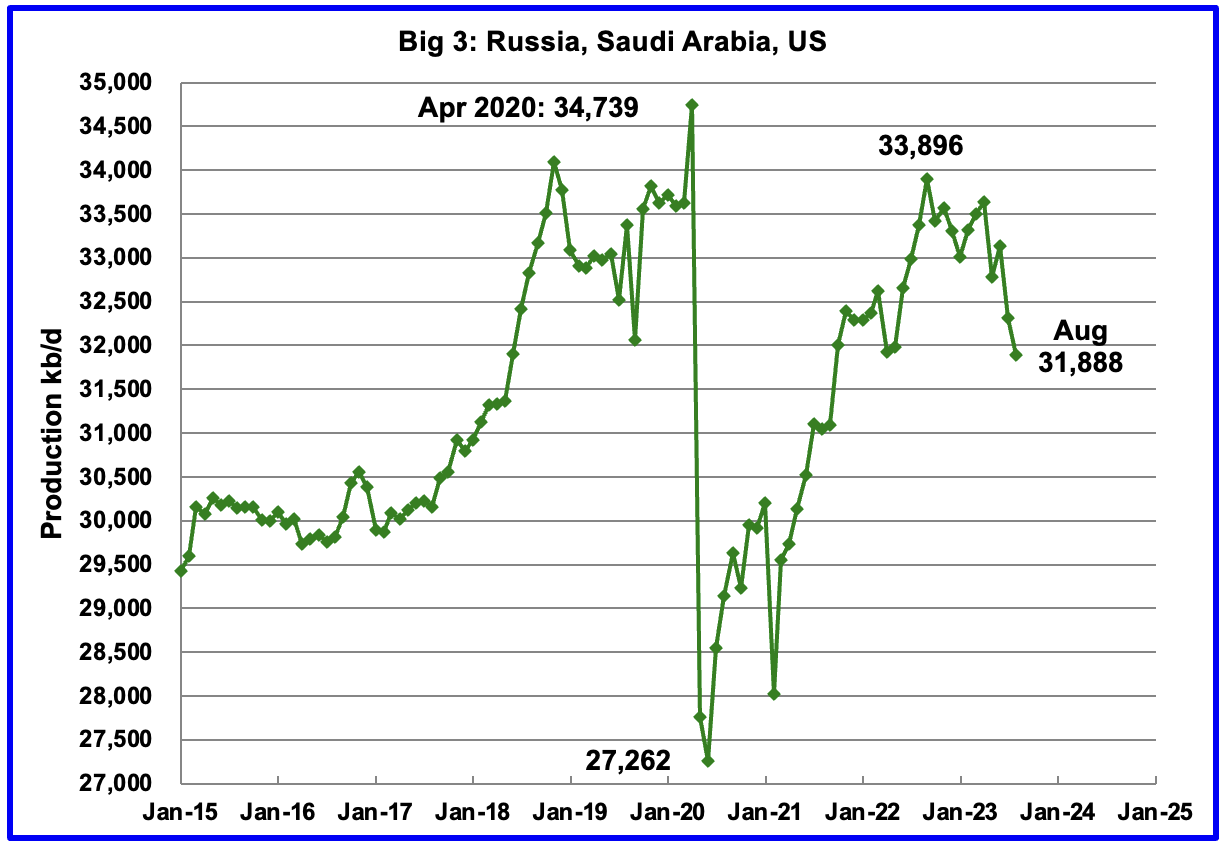
Peak production in the Big 3 occurred in April 2020 at 34,739 kb/d. The peak was associated with a large production increase from Saudi Arabia. Post covid, production peaked at 33,896 kb/d in September 2022. The production drop since then is due to cutbacks within the OPEC + countries.
August production from the Big 3 was down 426 kb/d to 31,888 kb/d and down by 2,000 kb/d from September 2022.
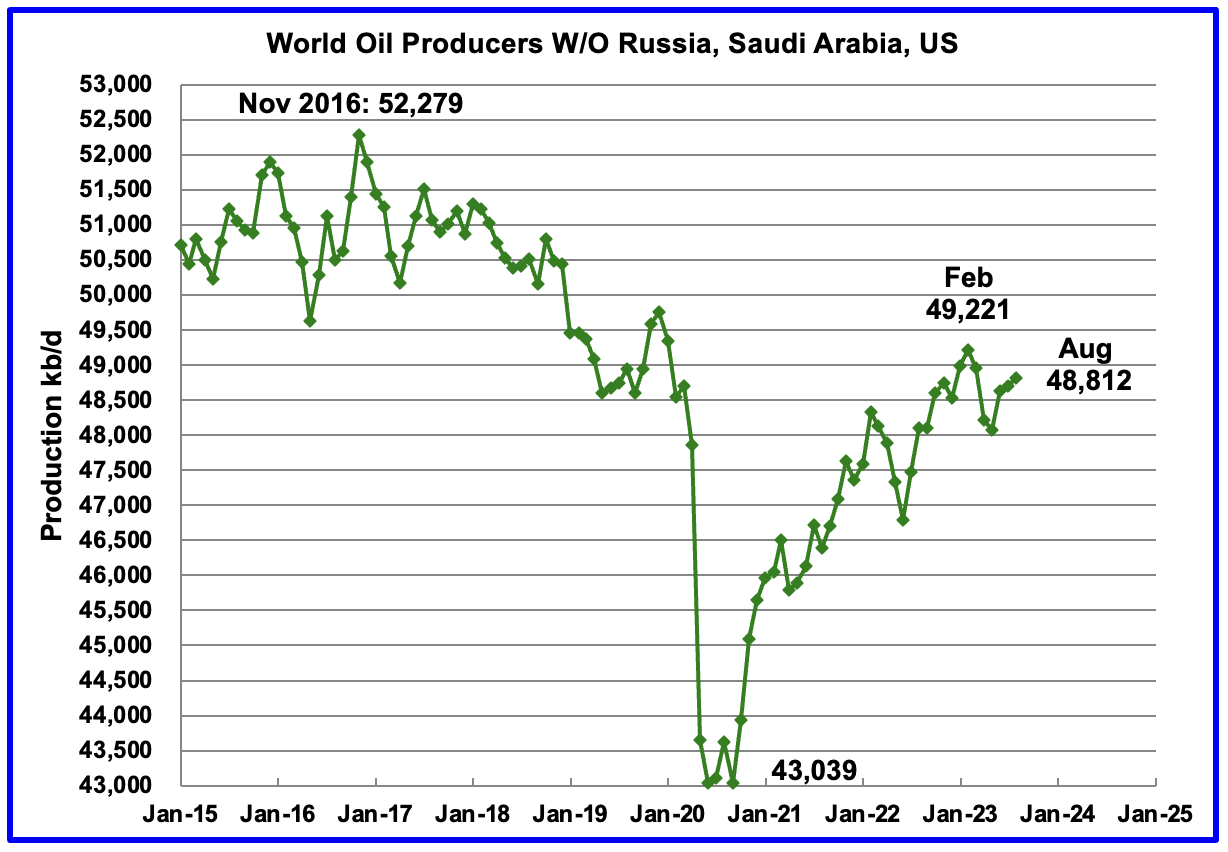
Production in the Rest has been slowly increasing since the low of September 2020, 43,039 kb/d. In February 2023 production rose to a post covid high 49,221 kb/d. Output in August 2023 was 48,812 kb/d.
World Oil Production Ranked by Country
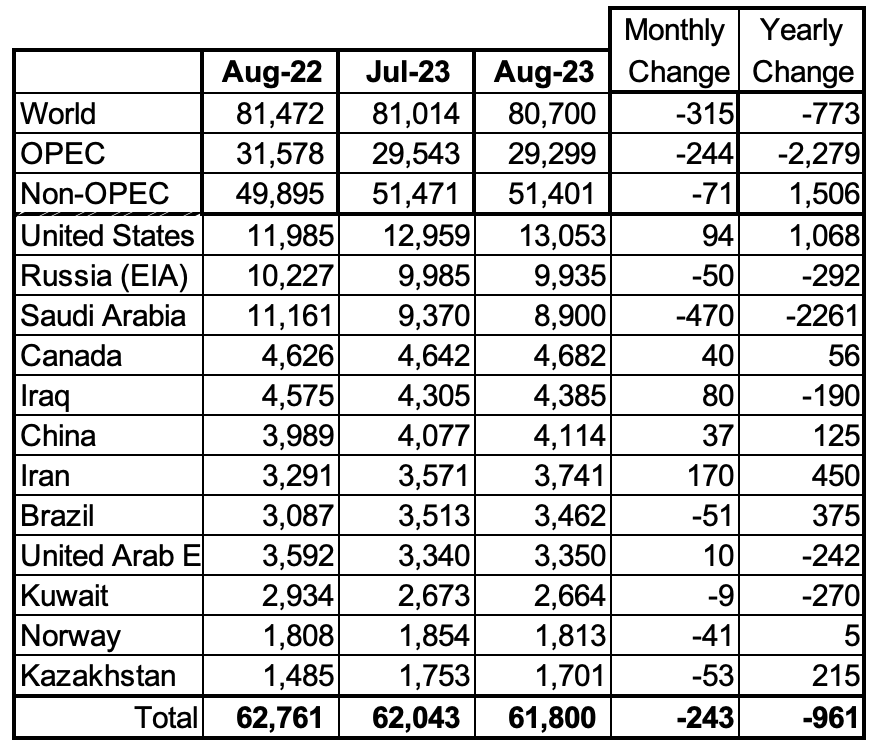
Above are listed the World’s 12th largest oil producers. In August 2023, these 12 countries produced 76.6% of the world’s oil. World oil production dropped by 773 kb/d on a YoY basis. On a MoM basis, OPEC’s production decreased by 244 kb/d while on a YoY basis its production decreased by 2,279 kb/d.
World Oil Production Projection
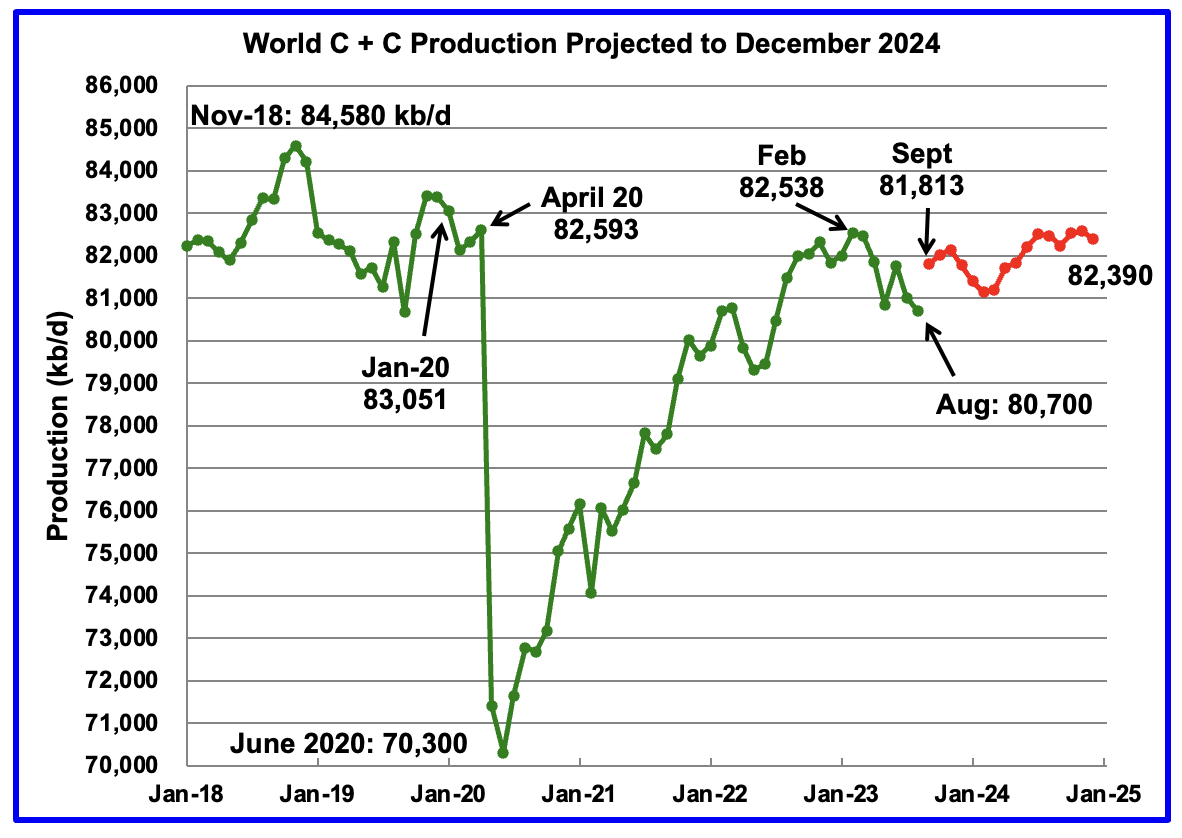
World oil production decreased by 315 kb/d in August, green graph. The largest decrease came from Saudi Arabia 470 kb/d while Iran added 170 kb/d.
This chart also projects World C + C production out to December 2024. It uses the December 2023 STEO report along with the International Energy Statistics to make the projection. (Red markers). Note that December 2024 production is lower than February 2023.
The red graph forecasts that World crude production in December 2024 will be 82,390 kb/d and is 2,190 kb/d lower than the November 2018 peak. Note the large production increase in the first half of 2024 could be the EIA’s expectation that OPEC + would be restoring some of their production cuts. However this is contrary to OPEC’s promised production cuts made on November 30, 2023.
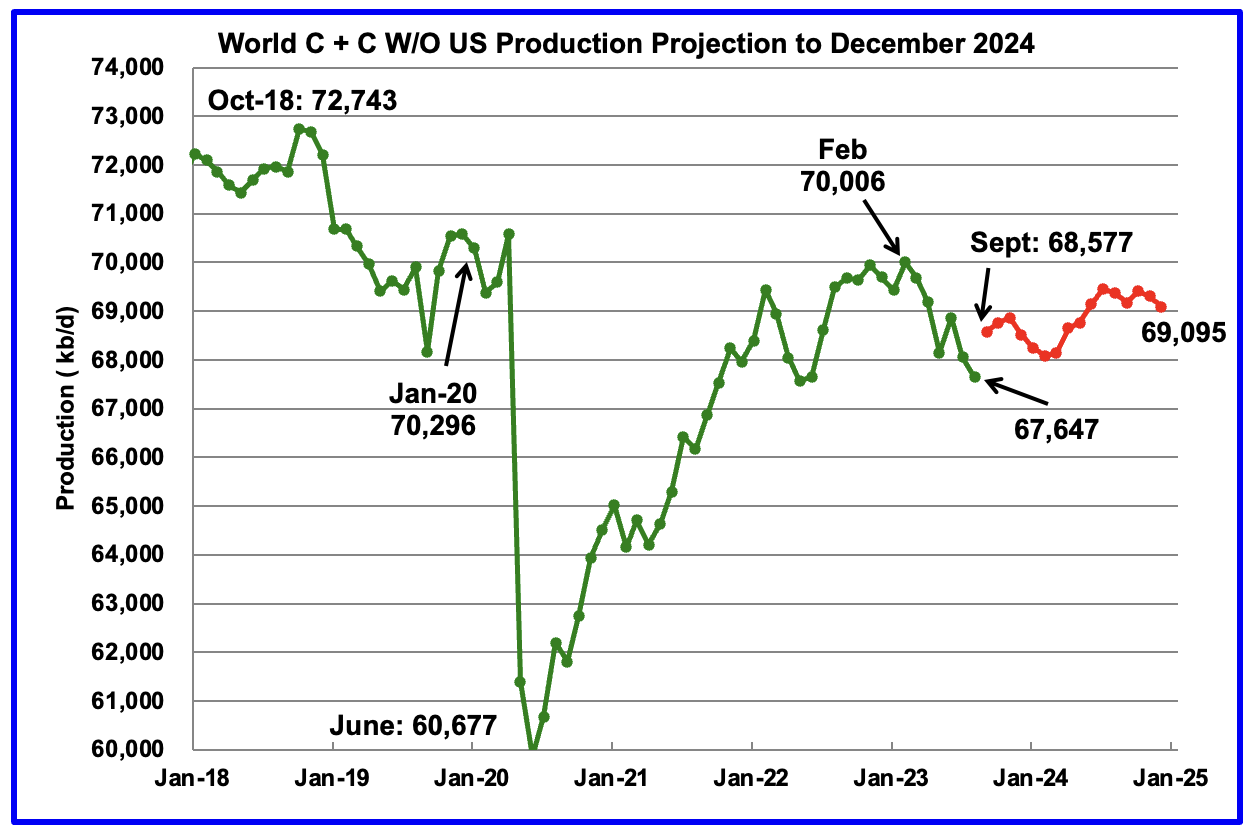
World without the US oil output in August decreased by 409 kb/d to 67,647 kb/d. A rebound in production is expected in September. Note that December 2024 output of 69,095 kb/d is 3,648 kb/d lower than October 2018 output of 72,743 kb/d and lower than February 2023.
World oil production W/O the U.S. from September 2023 to December 2024 is forecast to increase by a total of 518 kb/d.
Decline Rates
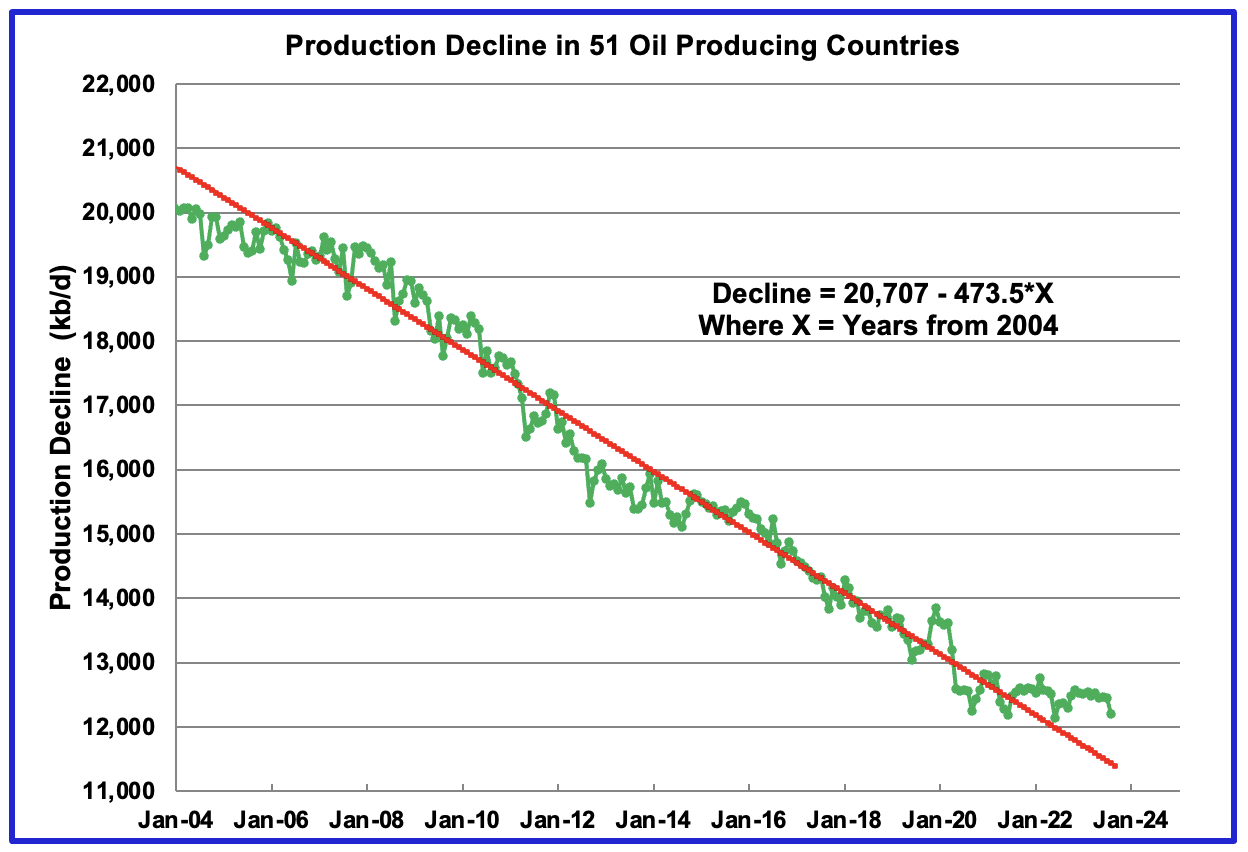
This chart shows the overall decline rate of 51 Small oil producing countries. It used to track 52 countries. However Nigeria has been growing production recently and it has been removed. These countries were chosen primarily because they were small to medium size producers that did not reinvest much of their cashflow to keep increasing production and had a longish history of being in a slow decline.
The OLS line is based on production from January 2006 to August 2022. It has not been updated since August 2022 to see if the production from these countries would break away from the calculated line. It appears that it has broken away since a number of them have had small increases, <10 kb/d, over the last year, August 2022 to August 2023. Also Argentina and Gabon have been increasing production over the past year.
As a percentage of the starting production rate of 19,500 kb/d in January 2006, the 475 kb/d/yr decline rate is 2.4%. If an average yearly decline rate of 2% occurs in all fields, this implies that a yearly decline rate of 1,650 kb/d across all World fields has to be made up by infill drilling. Saudi Arabia says their decline rate is 8% and infill drilling reduces it to 2%.
“Without “maintain potential” drilling to make up for production, Saudi oil fields would have a natural decline rate of a hypothetical 8%.”
197 responses to “August Non-OPEC and World Oil Production”
Thanks Ovi! Great post as always.
Question, my quick look at OPEC report published today, I get an annual decline of only about 1 mb/d…
This lines up well with the longer term OPEC decline rate, I see you have a yearly change of about -2.3 mb/d.
Maybe this is just a result of comparing individual months (or not).
Based on the last part, it sounds like a 2% annual decline is the minimum to expect, and 8% is the max.
Can we split the difference and say that long term annual decline will be 4-5%?
If so, that’s pretty much where I land when looking at URRs of ~2,100 Gb plus/minus 10%…
Anecdotally, Exxon states their intention is to produce 2% less annually on average, of course that might be wishful thinking (up or down)…
Kangeo
Thanks
Trying to discuss the decline rate of OPEC is a non-starter because of the cutbacks they have initiated. The one year OPEC production drop shown in the two tables is solely due to their cutbacks. A one YoY timeframe is too short a period to assess decline rates.
The whole question of decline rates is too complex an issue and what you and I would agree on is meaningless in the real world. One of the main factors in decline rates is the size of the field. Large field decline at a different rate than small fields. You can pick a range of numbers from the attached picture.
Perhaps it would be best if you checked out the two papers below that look at decline rates. Note that the rates are high and only report on fields that are post peak.
What is critical is that these high rates means that more new wells have to be drilled to offset the decline and to slow the decline.
As an aside, where did you read: “Exxon states their intention is to produce 2% less annually on average”. In the previous post I referenced a piece where Exxon said they were going to increase their production.
https://www.diva-portal.org/smash/get/diva2:225443/FULLTEXT01.pdf
https://grandemotte.wordpress.com/oil-and-gas-5-production-decline-rates/
Ovi,
Anyone who has a functioning BRAINSTEM will look at the IEA Decline Rates by Decade chart and realize this is the RED QUEEN SYNDROME.
Any other conclusion… then we have to get a BRAIN CAT SCAN.
steve
Steve – 100% agree, this might have been debatable in 2019-2020 (barely), but now the data is in, future production growth is out…decline rates TBD…
The IEA doesn’t know any more about decline rates than any other gang of economists that declared peak oil in 2006. Waiting until 2010 to make the announcement…just to be sure. I wonder who that was? Oh yeah! The guy running the IEA now.
The only folks sillier than that was one of those PM pitching websites that used Bedford Hill and the Hill Group as an expert reference declaring the end of US shale production. Like a decade ago?
There are suckers born every minute when it comes to this here url and gas stuff.
The all time peak is still November 2018. Or are you stupidly trying to refute that?
Ovi,
I think your last chart in the main post gives a rough idea of what World decline may look like in the future. If we take 473.5/16000 we get about a 3% decline rate. So for World output of say 81.5 Mb/d that would be about 2445 kb/d per year, if it started right away. My guess the decline rate will gradually increase from 0 to 3% over an 18 year period as a rough guess. For the demand scenario assuming oil intensity decreases linearly, World demand decreases at an annual rate of 3% in 2041 and accelerates after that (though the very simplistic scenario is not likely to be accurate).
Dennis – I think we know better, we have conventional decline of x and tight oil decline of y, x is longer term, and y is very much shorter…Further complicated by offshore vs onshore (a point emphased in Art Berman video above that Seppo posted)…When it happens, the 6-7 mb/d from tightoil will decline prob. by 10-15% depending on well replacement rate (we know individual efficiency is already on steep decline…)…lot to consider…
Kengeo,
Perhaps OPEC increases output as tight oil declines, 15% of 7 Mb/d is roughly 1 Mb/d, which is about 1.25% of World C plus C output. World demand for oil may fall in any case and likely faster than World Supply falls so oil prices will fall so that supply is in balance with demand for oil.
1.03^18 = 1.702. So in 18 years, a 70% decline for all volumes of crude condensate. And this is probably the good news.
Wouldn’t the math calculation be:
.97^18 = .578. So in 18 years, a 42% decline?
I’m not commenting on the scenario, just the math.
Great post Ovi, thanks. This blog could not possibly do without you.
Peak oil was November 2018, five years ago last month. That will forever remain the peak. It’s all over but the crying.
Ron
Thanks.
Dennis is the work horse on this site. Without his wide ranging knowledge and his willingness and ability to answer so many wide ranging questions, POB would be very boring.
Maybe I make prettier charts. 🤣🤣🤣🤣🤣🤣🤣
Also thanks to you for having the foresight to create POB after TOD shut down.
Ovi,
You do great work, and Ron is correct that the blog would be only 25% as good without your contribution.
From Art Berman
https://www.dropbox.com/scl/fi/tcnapwxsrjiwfedvi8fhm/artbemandec.-2023.jpg?rlkey=fedpkjpjau28f256ol0xyvyyb&dl=0
Here is his latest interview with Nate Hagens
https://www.youtube.com/watch?v=qqTh2nBEcCs
Absolutely riveting interview.
Particularly took note of the closing remarks. What is the solution to replace oil?….. The solution is to use less energy.
According to OPEC Oil monthly report global demand at 2018 high was 99.3 mb/d.
https://www.opec.org/opec_web/static_files_project/media/downloads/publications/MOMR%20April%202019.pdf
The latest Monthly report puts demand at 103.2mb/d
https://momr.opec.org/pdf-download/res/pdf_delivery_momr.php?secToken2=accept
Obviously all the people who produce the data for OPEC are making efforts to assess how much illegal oil gets onto the market which is not counted by any official government departments.
The 4 million barrels per day consumption over and above 2019 does fit in very well with the increase in gdp since 2019.
Global oil reaching the global economy, either legally or not is nearly 4 million barrels per day higher than 2019
Charles,
If we look at the December OPEC MOMR estimate for Nov 2023 World liquids output it is 101.7 Mb/d. If we look at the OPEC annual statistical bulletin, World liquids output in 2019 was 100.2 Mb/d, for all of 2023 OPEC forecasts about 101.16 Mb/d of World liquids supply. The increase is due to increased NGL output. Also the World real GDP per barrel of crude produced changes over time.
Data from
https://www.eia.gov/international/data/world/petroleum-and-other-liquids/monthly-petroleum-and-other-liquids-production?pd=5&p=00000000000000000000000000000000002&u=0&f=A&v=mapbubble&a=-&i=none&vo=value&&t=C&g=none&l=249–249&s=94694400000&e=1640995200000
and
https://data.worldbank.org/indicator/NY.GDP.MKTP.KD
Dennis
I looked at a more meaningful quarter year production
I don’t cherry pick data to suit my own viewpoint
Charles,
If we look at quarter year output it is similar to the November estimate, the OPEC demand estimates are different from other agencies and don’t match up with their production cuts or with prices. I also gave the full year OPEC estimate for output. EIA has World 2023Q4 production at 102.24 Mb/d and consumption at 101.62 Mb/d. The IEA expects Global demand in 2023 to be 101.7 Mb/d, EIA expects about 101 Mb/d for demand for all of 2023 and supply to be 101.6 Mb/d for the full year of 2023. You seem to choose the highest estimate you can find.
We may be beyond peak demand for crude plus condensate.
Dennis
Demand is 4 million barrels higher than 2018.
Charles,
Peak in World Demand was 2019 at about 99.8 Mb/d and OPEC forecasts 102 Mb/d for 2023 for World Demand. That is about 2 Mb/d difference, their output forecast for 2023 is about 101 Mb/d, but note that 2023Q4 output is forecast at about 100.1 Mb/d, output in 2018 and 2019 were similar at about 99.8 Mb/d, about 300 kb/d less than the OPEC 2023Q4 forecast.
So far, world monthly oil production peaked in November 2018 at 84,580,000 barrels per day. That is crude + condensate, not total liquids. Total liquids include bottled gas, biofuels, coal to liquids, refinery process gain, and anything else they might turn into oil. Counting all that stuff as oil is how they keep total liquids increasing.
People should not confuse total liquids production with actual oil production. Oil production in August 2023 was 80,700,000 barrels per day. That was 3,880,000 barrels per day below peak production in November 2018.
Here are the total production numbers for Nov 2018 vs, Aug 2023.
All data is in thousand barrels per day.
Thanks Ron.
Ron
I have been looking at various studies of the illegal oil trade, which has been growing dramatically in the last few years.
Different sources estimate that oil which gets into the world market but is not recorded by any official government agency is it the region of 3 to 5 million barrels per day.
This oil is stolen from pipelines where metering does not exist such as in Nigeria or where managers are threatened with death or family kidnapping to falsify data so criminal gangs can take oil to sell on.
That sounds pretty reasonable to me (3-6%), but it also sounds like a constant, so not a major game changer one way or another…
Kengeo
Not a game changer in the grand scheme of things.
However it is not a constant, research has found the number of dark tankers has increased from around 200 to around 800 to 1,000. In just 4 years.
Hidden oil is transported all over the world. Russia previously never needed to do this, now they are a major player.
Oil production is not officially counted out on dark vessels, cargo transferred at sea or taken to countries that are highly corrupt.
The corruption is getting worse
Oil has always been stolen, it does not change the peak. It is well past midnight Charles, go to sleep…..
Central banks are collaborating to attempt to get the value of the dollar down. FED announced expectations of 3-4 rate cuts in 2024 while the ECB and BOE are steadfast that they aren’t raising interest rates anytime soon.
Reality is Europe is much closer to recession and deflation than the US is and should be cutting interest rates well before the US does.
Central banks absolutely see there is a problem with dollar funding. The fact they are making moves in an attempt to address it is more proof the global economy isn’t doing well.
Central banks however don’t control the amount of dollars or currency units in the economy. Commercial bank have that privilege. So at the margins we will see some dollar weakness as we close out 2023.
The fact the central banks are having to taking action is a big negative for actual economic activity and while oil prices bounce on the news. The reality is slowing growth and inflation expectations. And prices trade on expectations.
The number 1 industry metall copper is up since October.
So no recession fear on the industrial front. It will crater when China goes down.
Steel is up, too.
From what I understand the CCP is asking the mega banks to provide loans that aren’t backed by collateral in an attempt to bailout the housing sector in China.
The lengths central planners are going to tell you how bad things are. They getting desperate to hold everything together.
That in itself should tell you something about central banking. Even in China the central bank is unable to directly bailout the property market. Because bank reserves are no substitute for actual loans made.
It’s China.
The megabanks lend without collateral, and when things go bad you hear a soft tingling of money behind the walls and things will be adjusted in silence.
Reserves are money, and so is cash (cash is reserve money you can carry around). It’s only dangerous money, because it is the highest tear collateral and can be multiplied with commercial banks – that’s why in old times it needed stronger restriction. Restricting reserves curbed lending, and the other way round. QE disturbed this cycle, and this experiment is still open. Too many low interest credits allowed zombie companies and stuff like drilling lot’s of LTO wells while oil prices where too low to finance them.
Generally speaking, too low interest rates transform a capitalistic system in a socialistic like where lot’s of silly investing happens.
Low interest rates aren’t stimulus. Not if if they are extended over a long period of time. If you have say 7 years of zero or in some cases negative interest rates.
There is very little interest paid. When the payment is mainly principal instead of interest the money supply contracts when the principal of loans are paid off.
Millions of low interest loans equals a contraction of the money supply if you do it over a long enough period of time. Particularly when it coincides with banks unwilling to make new loans due to an inverted yield curve.
Fewer new loans and more destruction of money via repayment are a recipe for deflation.
Bank reserves are a form of interbank money that just aren’t very useful in the real economy. They aren’t interchangeable with real deposits. If banks reserves were money no bank would ever go bust. All losses would and could be erased. That is clearly not happening anywhere because there are plenty of losses.
Banks don’t and never have needed bank reserves in order to make loans. Just look at the money supply over time. It was expanding rapidly during times where there were very little bank reserves in the system. Look at the 1970’s. There aren’t trillions of banks reserves in the 70’s
During the 80’s and 90’s were there trillions of bank reserves needed for banks to make loans. No there wasn’t is the answer. And yet the money supply expanded.
Banks don’t need bank reserves to create new money. The amount of bank reserves on the balance sheets of central banks doesn’t matter.
As long as there is adequate energy to be used the money supply which 98% of is loans made by commercial banks will continue to grow. But without adequate energy the money supply will contract as loans by commercial banks just aren’t made. While the old loans are continuing being paid down with existing money therefore destroying the money supply.
We have set ourselves up for a violent contraction in the money supply via low interest loans.
$25 oil is coming btw
I admit that an inversion without a recession seems unlikely and I expected one also. But damn I can’t see it anywhere. It could be that the uniqueness of this Covid-inspired financial mayhem just won’t play out in a normal way because of extra funds, pent-up demand or whatever.
https://wolfstreet.com/2023/12/14/our-drunken-sailors-go-splurging-online-at-auto-dealers-and-massively-at-bars-restaurants-yolo/
To expand on what TripH said regarding where money is created and how that has changed over the years:
https://papers.ssrn.com/sol3/papers.cfm?abstract_id=4637150
https://corporate.exxonmobil.com/what-we-do/energy-supply/global-outlook/energy-supply#Liquids
“The natural decline rate of existing oil production is approximately 7% per year. Significant investment is needed to offset this decline and meet the projected demand growth.”
I think it was Shell not Exxon:
“Shell also has targeted some limited production decline over the next decade at 1-2% per year, rather than expansive production targets.”
2-5% average decline rate is what will likely occur…
https://carbontracker.org/exxonmobil-shell-and-systemic-risk-prisoners-of-their-assets/
Here’s a look at actual vs projected world oil production.
If I were Dennis, I might rethink my stance/model (maybe revise it to the 2012 version, which happens to be tracking perfectly…)
I expect a loss of between 2 to 4 mb/d annually, really hope I’m wrong…
Kengeo,
A paper linked by Charles pointed me to an interesting theory on future demand. The oil intensity of World real GDP (where I am defining oil as crude plus condensate) has been decreasing linearly from 1990 to 2022. If we assume that linear relationship continues through 2040 and World real GDP grows at about 2.5% per year from 2023 to 2040 we get the chart below for World C plus C demand. If this is correct, supply would be lower than I have proposed in the past due to lack of demand.
Dennis
How you manage to misunderstand the most simple facts.
Global oil requirement per $1000 of additional GDP in 2019 was 0.4 barrels having fallen over 35 years from 0.7 barrels. A consistent fall of 0.01 barrels each year.
It is not a minus figure as you fanciful graph shows
Charles,
I use crude plus condensate production and World real GDP. Just do the math. The idea came from the paper you referenced, link below
https://www.energypolicy.columbia.edu/publications/oil-intensity-curiously-steady-decline-oil-gdp/
That paper used total liquids, this uses crude plus condensate which is a better measure.
Link to spreadsheet with data below
https://docs.google.com/spreadsheets/d/1uxbo6hhJ3w8e9xlAJ36Mp0ZsHUu1_ztM/edit?usp=drive_link&ouid=105320434049434900507&rtpof=true&sd=true
Dennis
According to the link I found, oil intensity in 2019 was 0.43 ADDITIONAL barrels for each additional $1.000 of GDP growth. After 5 years from 2019 oil intensity will be around 0.38 additional barrels for each $1.000 increase in GDP.
Your graph has demand falling with gdp increasing.
Demand for oil has not fallen with increasing GDP for the last 35 years
Charles,
The oil demand increase for each increment of real GDP increase has been decreasing over time. Eventually it reaches a point where real GDP increases without any need for an increase in oil consumption. Look at the spreadsheet, the numbers are plain to see. In table below World C plus C is in millions of barrels per day, real GDP is for the World in trillions of 2015 US$ and oil intensity is World C plus C divided by World real GDP. After 2022 the numbers are estimates, I assumed 2023 World C plus C would be about 81 Mb/d, real GDP grows at 2.5% per year and oil intensity decreases by 0.025 units per year based on the trend from 1985 to 2019.
From 2018 to 2021 World real GDP increased by about 4.5 trillion 2015$, but World C plus C output fell from 83 Mb/d to 77.2 Mb/d, that is an example of real GDP increasing while World C plus C output fell over a three year period during the last 35 years.
Agreed, I have a very difficult time imagining how less oil ($$$) = more GDP.
Less oil means less income, goods, services, jobs, transportation, food, energy/heat, government services, individual and corporate tax revenue, and on and on.
Oil growth = GDP/economic growth
Oil decline = GDP/economic shrinkage
Kengeo,
Take a look at the speadsheet, if the assumption that linear decline in oil intensity of real GDP continues until 2030( at the rate of decline from 1985 to 2019), and World real GDP grows at 2.5% per year from 2023 to 2030, then demand for oil falls as shown in the table presented.
Less oil means less income, goods, services, jobs, transportation…
The US used about 10 Mbpd for passenger transportation in the 1970’s, when the average MPG was about 12. Now it uses a bit less oil for passenger transportation, and the average MPG is about 23. Twice as many miles are driven now, with about the same amount of oil.
Oil is primarily burned for transportation. Oil consumption for ground transportation is relatively easy to reduce with greater efficiency, and then to replace entirely via electrification.
———————-
The possibilities for efficiency are often greatly underestimated. You can transport one person using about 7.5 MPG with a large SUV in urban traffic, double that with a small SUV, double it again with a medium sedan, double again with a hybrid sedan, then double it again by carrying two people, then again with four. You’ve reduced oil consumption by a factor of 32, or 97%. Then you can double efficiency again and eliminate oil entirely with a pure electric drive train.
Once you eliminate friction braking (with regenerative braking) there’s not much of a limit to efficiency improvements. Here’s an example of pursuing the limits:
“UNSW (University of New South Wales) students on the Sunswift team built the solar-powered electric car with the goal of breaking the previous 5.5 kWh/100 km record.
They ended up blowing well past their goal, using just 3.25 kWh/100 km. That’s around 25 times more efficient than an average car in the US (at 25 MPGe) and nearly 5 times more efficient than a Tesla Model 3 (at 170 MPG).
The solar-powered car, affectionately named ‘Violet’ by the team, traveled the 4,100 km (2,550 miles) in 6 days, averaging around 600 km (370 mi) and 20-24 kWh per day. Not too shabby considering the on-board storage battery is only rated for 10-20 kWh and the team charged solely by solar power.
To put that in perspective, I’ve paid more for a single tank of gas than the cost of electricity used by this car to cross an entire continent.”
https://electrek.co/2018/12/17/solar-powered-car-breaks-record/
Dennis – That’s interesting, since demand will be crushed by high prices as oil production declines, we know it (demand) in fact has to go down in order to balance supply/price (exactly how and why that happens is anyone’s guess).
Future high inflation rate will likely play a role also, I think the current inflation is simply a sign of what’s to come.
Your projection and mine are nearly the same, your’s starts 8 years later for some reason. I think soon enough (now) we can declare that long term production decline is here. Or at the very least, we can say future production will be the same or lower than current levels.
Kengeo.
The assumptions of that demand scenario may not hold true in the future. At present we have relatively low prices and supply that needs to decrease to balance with demand, not clear if demand will decline in the near term. I adjust my thinking to the facts at hand.
100% agree, can’t ignore the facts…
Peak was 2018 and dropping since, not looking like a bumpy plateau, but maybe early to rule it out…
My confidence in GDP numbers took a serious hit when Governments started adding in ‘services’ like prostitution to their calculations.
Government debt spending is included in GDP.
That is like me including credit card purchases that I can’t afford as part of my income.
Andre,
GDP is the total of goods and services. When you buy something it is income for someone, it matters not whether you paid with wages, savings, or by borrowing. The income earned by the person from whom you purchase a good or service is the same regardless.
See https://en.wikipedia.org/wiki/Gross_domestic_product
Old Chemist,
Said to be the World’s oldest profession.
GDP is a horrible indicator of economic activity.
Example- a raw property is sold for $1 million. Absolutely nothing happened. A name was transferred on a piece of paper and paper assets were transferred. Not a single potato was grown or tree planted. Did I mention stock options, advertisements, political campaign spending, cloud data storage.
So much of it is just meaningless to reality.
a raw property is sold for $1 million.
Most of the time that won’t add much if anything to GDP. It all depends on the cost basis for the seller of the property. If they bought it for $1 million, or inherited it at an appraised value of $1M, there’s no capital gain and no addition to GDP.
Hickory,
Read the Wikipedia piece, land is not a part of GDP unless their are things added (such as a home or other building, or taken away as in a mining operation. Cloud data storage is pretty useful so I would disagree there, advertisements are pretty useful for the workers whose livelihood depends on the sale of the products advertised.
The measure is indeed imperfect, but is what we have. Hey we could create a different number we like better. Then we would have an alternate reality or several realities where we all don’t agree about basic facts. Seems less useful.
“Hey we could create a different number we like better.”
Please do!!!…we need a real world GDP
or else more and more we will just be adding up the value of mouse clicks.
Hickory,
Farmers used think that what they do is the only really valuable thing. Manufacturers often think that services have no value.
You seem to be someone who is a knowledge worker. Do you really think that what you do for a living isn’t valuable?
Hickory,
The point is that this has already been done (see World Bank data), let’s say we all create our personally favored real GDP number, what does this accomplish? We are left with an argument about what is “real GDP”? I am not qualified to create such a number, I think the econometrics experts have a good handle on the problem.
Dennis
‘Oldest Profession’ – maybe, but it and many of the other items being thrown into the GDP calculation pay no taxes and contribute nothing to a countries ability to support its debt load. It does improve the cosmetics of the debt to GDP ratio, however.
A quick search indicates that this is an EU thing. The US doesn’t include the “shadow economy”. Who knows, maybe they should. It doesn’t pay taxes, but it’s real work, for real money.
Old Chemist,
Likewise the very wealthy in the US pay a very small proportion of their income in taxes, with favored rates for dividends and capital gains they often pay 20% rates on much of their investment income. In addition, there are lots of people that are paid “under the table” and don’t report their income, not just prostitutes. This has always been a problem, the GDP numbers will always be imperfect. In addition lots of economic activity, meals prepared at home, childcare by a parent in a single income family, and yardwork and home and auto repair done by homeowners is not considered a part of GDP, but if these jobs are done by those outside of the family for a fee, then it is included in GDP. This activity is difficult to measure.
Dennis,
Your first sentence begins to explain why people feel that things have gotten worse, even though objectively they are much better.
It’s income and wealth inequality. Objective measures like income, posessions, education and health are obviously important, but inequality is almost as important.
If you feel poor, it doesn’t matter what you have, it’s what you don’t have that matters. If everyone else has a smartphone, it doesn’t matter that a “feature-phone” from 2003 is an incredible marvel of technology and enormously useful and convenient: you feel left out. You feel poor. You feel mistreated.
It’s genetic: chimpanzees feel the same way.
And Republicans, of course, do everything they can to accelerate inequality, while blaming everyone but the culprits: the very wealthy. They scapegoat women, blacks, immigrants, city dwellers, government employees, and people watch Fox News and listen to talk radio and they believe it…
Kengeo,
If demand falls as quickly as supply, oil prices will not be very high. If the demand scenario is correct, my expectation is that oil prices will be low rather than high.
Hey maybe we will see the $25/b oil that HHH predicted for March 2023, my guess remains more like June 2030 to June 2035 for oil prices to reach that level in 2023 US$.
https://www.theglobeandmail.com/investing/markets/stocks/EEGUF/pressreleases/14832698/
Empire Energy says Australia’s Betaloo Basin is achieving economic flow rates including vertical wells.
The irony can’t be lost that COVID-19 lines up perfectly with a hypothetical Worlrd Production peak if the data is adjusted…2022 production was equal to mean of 2018/2019; call it 2022 + 2018.5 = 2022.25 (4040.5/2) [MARCH 2022]
March 2022 Cumulative world production was approx. ~1,400 Gb, works out to URR of 2,800 Gb (I believe this is essentially what Dennis uses, although he likes to tease that it COULD be higher). Obviously, if you back out the tightoil effect, you might land on a number closer to 2,250 Gb…
Either way there’s only between 750 – 1500 Gb left, 25 to 50 years left depending on decline rates…
I really hate conspiracy theories but shoot, that’s a wild correlation…
Kengeo,
Tight oil output will likely be between 50 and 100 Gb, so if we back that out it would be 2700 Gb, my estimate for extra heavy oil URR is 150 to 200 Gb, which would “conventional” URR to perhaps 2500 Gb. Yes output could be higher as my scenarios assume demand for oil falls after 2035 so that a lot of technically recoverable resources are never recovered due to low oil prices.
It is possible that future oil demand will be lower than I have expected in the past.
Question for all – Can anyone point me to summary/article/video which discusses the role of AI in O&G Industry?
I asked the Chat AIs and they weren’t super helpful…
Thx!
Rig and Frac Report for week ending December 15
Rigs Flat. Fracs Down. Confusing Numbers
– US Hz oil rigs were unchanged at 455. However, there were sharp drops in the Permian, Texas and Eagle Ford followed by a sharp increase in “Other”, 77. My only guess for the large drop at this time is that there may be an “idle” or “inactive” category, i.e. the rig is in place but has been shut down for the holidays. Another better explanation would be appreciated.
– Permian rigs were down 33 to 264. Texas Permian was down 25 while NM was down 8 to 86. Both Lea and Eddy were down 6 and 2 respectively.
– Eagle Ford was down 22 to 27
– NG Hz rigs were up 1 to 104 (not shown)
Ovi,
This looks like a mistake in reporting. What is the % increase in the “other” category, this would seem to hint at a data flaw.
The Baker Hughes rig count data has been revised.
Permian down 2 rigs, Eagle Ford up 1. Texas Permian no change in rig count and NM Permian down 2. Eddy county down 1 rig and Lea county also down one rig. In all cases I am referring to horizontal oil rigs. For all of the US the horizontal oil rig count was down 2 from 297 to 295. Data from pivot table spreadsheet at link below.
https://rigcount.bakerhughes.com/na-rig-count/
Dennis
Thanks
Updated charts below.
Frac Count for December 15 Gets into Holiday Mode/Mood
The frac count decreased by 13 to 265 this week. The Frac count may have entered the trend of the past few years when Fracs start to drop after Thanksgiving.
One year ago, 275 Fracs were operating, 10 more than this week.
Drilling in Lea and Eddy Counties
Lea county dropped 6 rigs while Eddy dropped 2 rigs. Did they really leave or just were declared inactive?
Ovi, try this: https://www.oilystuff.com/forumstuff/forum-stuff/rig-count
Whatever you think is happening, is not happening. Rig counts collapsed last week for a host of reasons, mostly because economics of Permian tight oil wells currently suck. Badly. Associated gas prices is killing them because 50% of the production stream in all over-drilled, pressure depleted sweet spots, in sweet counties, is now gas releated. You are on the right track with bubble point metrics; don’t be dissuaded from that with dumb hypotheticals. Stay the course. Use your instincts.
People IN the oil and gas business do things for a reason, be those reasons imposed, or self-inflicted. Past results are not, never have been, indicative of future performance. Top down statistical anlysis based on past trends is short-sighted, lazy, may be fun from a “hobby” standpoint, but they are worthless on anything but a very short term basis.
Mike
Looks like a reporting error. Updated charts below.
Yes, I see that. Thanks.
Mike – I’m getting a “Page not Found” message…
Dennis
Your your table above of oil consumption and GDP is fantasy. These are your figures that you made up and are totally at odds with the study that you yourself were quoting.
How do you get oil consumption falling when it takes an addition 0.38 barrels to produce an addition $1,000 of GDP. Which is what the study says.
Even by the EIA figures which are wrong, oil consumption has risen over the last 3 years. You think all of a sudden a trend that has held for 35 years suddenly inverts itself?
Any way the OPEC consumption data is far better and fits everything we know about GDP growth and oil consumption.
OPEC says oil production is at least 2 million barrels higher
Charles,
Data is World C plus C production from EIA at link below
https://www.eia.gov/international/data/world/petroleum-and-other-liquids/annual-petroleum-and-other-liquids-production?pd=5&p=00000000000000000000000000000000002&u=0&f=A&v=mapbubble&a=-&i=none&vo=value&t=C&g=none&l=249–249&s=94694400000&e=1672531200000&
real GDP data from World Bank link below
https://data.worldbank.org/indicator/NY.GDP.MKTP.KD
We could also use crude oil output data from OPEC at link below
https://asb.opec.org/data/ASB_Data.php
that leads to the chart below for World crude output, with projection after 2022 (left vertical axis), World real GDP for scenario on right vertical axis.
Here is a quote from the paper
The time trend also reflects a gradual regime change from a supply- to a demand-constrained global oil market. In percentage terms, oil intensity first declines at rates lower than global GDP growth, allowing global oil demand to rise. Over time, given its linear functional form, the rate of intensity decline will accelerate to outpace the rate of global GDP growth, in which case global oil demand would peak and start to decline.
https://www.energypolicy.columbia.edu/publications/oil-intensity-curiously-steady-decline-oil-gdp/
Thanks for pointing me to this paper, you should probably read it.
My chart below assumes global real GDP grows at 2.5% per year from 2023 to 2040 and that the linear decrease in crude oil intensity continues from 2023 to 2040 with each year’s crude oil intensity falling by 0.009559 barrels per one thousand 2015$ of World real GDP over that 18 year period.
Charles,
Using the equation from the paper and assuming World real GDP grows at 2.5% per year, this is what World liquids demand looks like. Note the proportion of crude in total liquids has been decreasing over time so crude or crude plus condensate demand would peak earlier.
Global Hidden oil consumption.
Very recently, organisations are starting to give much more attention to the illegal oil trade. The more they look the more evidence they find of illegal trade at every single point on the oil production route.
Officials re bribed or threatened to change production data and sell the difference. Russia sells tankers of oil in it’s ghost fleet and orginisation say for every tanker they may find out about 5 they don’t.
This is a good introduction to the scale of the problem
https://www.youtube.com/watch?v=lXdszIPw8ww
“Illegal” is a relative term.
Charles,
Oil output is counted at the wellhead and oil consumption is measured at the refinery, the hidden ships (they use tiny boats that are invisible) don’t really change much on the oil production or oil consumption estimates.
Dennis
It may be counted at the wellhead in countries like the United States and Canada
Have you ever been to a well head in Nigeria? The people who know about the illegal oil trade say it is not counted there. Try doing a bit of reading.
Ever been to the oil fields in Venezuela, the production figures are fiddled and the uncounted oil is sold to all sorts of buyers.
Do you know how the drug cartels operate stealing oil in Mexico?
How about the massive oil theft in Libya? Been there have you?
Charles,
Have you been there? How is the amount of theft determined? If it is known, production would simply be oil stolen plus oil not stolen, it is simple math. The secondary sources add it all up to determine supply and demand.
Dennis
No I have not, that is why I have great respect for people who are risking their safety trying to uncover the scale of corruption and theft around the world.
Trying to get you to respect people who know more about this very dangerous criminal activity is a waste of time
Yes, indeed, how about those illegal double-secret refineries that are camouflaged from view and producing quality petroleum products?
What am I missing here?
Paul,
Not sure, maybe there are secret refineries hidden in the jungle.
https://peakoilbarrel.com/wp-content/uploads/2023/12/767279-1.gif
Comparing GDP with barrels of oil consumed is meaningless. It ignores the fact that debt creation is spent like real money inflating prices and increasing GDP. Maybe the better way to understand the chart is realizing how worthless your money is becoming compared to real economic activity. The only growth industries are financial or tech they’re only numbers on spread sheets. And the decline in the Oil to GDP ratio is not coming from efficiency gains. There is a limit to efficiency and we’ve reached it. To say it’s limitless ignores the basic laws of physics and thermodynamics. Heat engines efficiency is derived from the differential of the high temperature to low temperature transfer. To reach a theoretical 100% efficiency you have to be at absolute zero on the Kelvin scale with no friction losses. Our 30-50% is the best we can ever achieve.
What we are actually witnessing is the collapse of the industrial economy that makes this way of life possible. I suppose some will only understand when the only Industry left are banks. At that point GDP to Oil will be .000000000000000000000000000000000—-
“There’s a limit to the efficiency gains and we’ve reached it.”
A 3000 lb vehicle moving a 150 lb person is only about 5% efficient maximum because the payload is only 5%. You can increase the efficiency almost infinitely by putting that person on a bicycle.
In an ICE car or anywhere else a combustion engine is used, only about 30% of the energy can be used. Switching to an electric motor will at least triple your efficiency.
So until we all ride in EVs or on bikes, huge efficiency gains are easily possible. No maximum in sight.
Stephen
Are you putting into your calculation the energy required to collect the chemicals for the electric car?
The diggers and trucks working all day long in thousands of location around the world.
How far is it from Congo to South Africa?
https://www.youtube.com/watch?v=daMiqjqGmNc
Have you included the coal fired power stations that are 40% efficient? How many coal fired power station has China built in the last 3 years?
https://energyandcleanair.org/publication/chinas-new-coal-power-spree-continues-as-more-provinces-jump-on-the-bandwagon/
JT,
try this https://en.wikipedia.org/wiki/Real_gross_domestic_product
real GDP adjusts for inflation, so inflation is not part of the story.
It is not about efficiency only, the energy provided by oil will be replaced with other forms of energy and less thermal energy can be used so that laws of thermodynamics will have less relevance to energy use.
The fact is that there has been a linear decrease in oil intensity from 1985 to 2019, it certainly won’t continue indefinitely, but demand for oil could fall in the near future, if the linear decrease continues for another 10 to 20 years.
There was a time when very little petroleum was used (prior to 1860), claims that oil is essential seem to forget much of human history.
This idea of oil intensity is clever. It’s trivial for anyone to take the Real GDP data and the Global C&C and show how the impact of oil as a factor in Total GDP is decreasing with time.
If I do the same thing with World Electricity production, the Electric Intensity is climbing, which is what everyone would expect.
Another neat concept for me was the paper linked here on the difference between price and affordability, and for oil, how that has changed.
This is why I visit the site. Very interesting!
Dennis… “real GDP adjusts for inflation, so inflation is not part of the story”.
Sorry Dennis that’s garbage and you know it. The way inflation is measured changes over time and is now vastly different to 1980, which is the method John Williams uses on his shadow stats site.
Today we have hedonic adjustments theoretically making stuff with more tech cheaper in the inflation data, but in the real world a fridge with bells and whistles costs more than one without, only a consumer cannot buy a plain old fridge. However what’s not taken into account with official inflation numbers is how a fridge from 45 years ago can still work (we have one ourselves) but modern fridges last only a fraction of the time, so the consumer has to buy more over a period of decades instead of only one.
Politicians love low inflation numbers everywhere, as they can show ‘real growth’ with low inflation numbers, so approve every change in CPI adjustments that lower official CPI numbers.
You know all this, but somehow treat world GDP adjusted by dodgy inflation numbers as ‘real’. The data using this dodgy inflation rates shows that the average person in the developed world is better off than 5 decades ago, yet the median person of about 35 years old, 5 decades ago, could afford a 3 bedroom house, with a garden, an at home wife, and several children, plus have an annual holiday away, often with the owned boat or caravan in tow.
Today the person on the median income of around 35 is struggling, usually can’t afford kids and mostly cannot afford their own home. Yet somehow these ‘real’ GDP numbers show people better off!!
Then when we get to oil intensity, using mining as an example, efficiency gains have helped greatly. In the ’60’s 40 tonne mining trucks were used, today 400 tonne dump trucks are used, however we have used up the efficiency gains, and wont be building 4,000 tonne trucks in a few decades, as we are reaching metal fatigue limits. In fact in mining between 2003 and 2013 a 30% increase in copper production came with a 46% increase in energy use (Calvo and Mudd 2016).
The lower ore grades, now and in the future, means that energy intensity will increase in this area, offsetting any potential gains elsewhere. Notably the amount of materials needed to go all renewable is a magnitude higher than for fossil fuels, meaning more oil use to gain lower grade, deeper and harder grind index ores. I’ve explained many times why it simply wont happen so will not go into that here.
We have used efficiency gains, along with some fudged numbers (CPI) to show how people are better off when most are worse off. Sure if you are one of the elite that has benefitted from outsized asset price gains over the last few decades, everything looks rosy, provided you don’t touch reality for most people, and that’s just in the developed countries. Using ‘real GDP’ according to the World Bank is just an excuse to show some nice numbers (oil intensity going down in this case), when reality is somewhat different..
Dennis, what’s the oil intensity of oil production?? My suspicion is it is going up, for exactly the same reason as in mining, lower grades and harder to obtain.. We know EROEI is falling so oil intensity in oil production is most probably rising as well..
Hideaway,
I bought a refrigerator in 2000 which works fine today, bought the same model for a second home in 2006, which is also working fine. The shadowstats data has been debunked. See https://www.bls.gov/opub/mlr/2008/08/art1full.pdf
Also see https://bfi.uchicago.edu/wp-content/uploads/Cavallo-1.pdf
Note that a modern fridge tend to be much more efficient and not every model has lots of bells and whistles (mine does not) so it costs less to run than a fridge from 40 years ago, it is a better product.
Dennis if the inflation number is accurate, then how do you account for the median person being much worse off today than 5 decades ago?
A direction to a paper is not a debunking of anything…
Dennis, were you a politician in your life?
The median income person is way worse off than 5 decades ago throughout the developed world. It is explained by the inflation figures being deliberately fudged.
The shadow stats site is just a clear example where reporting of inflation has changed. Another area of where the official cpi is incorrect is not taking into account of capital gains in things like housing, as if it didn’t exist. Yet when a person sells a house they end up with real cash in their pockets.
Likewise for investments in stock markets. Saving and investing for the future is effectively buying a retirement. The cost of this today is much higher than 40 years ago, because of inflation of asset prices.
The median person became much better off in the couple of decades after the second world war, when oil intensity increased, then went backwards since the ’70’s, as oil intensity decreased, yet this doesn’t show up in the ‘real’ GDP numbers.
I agree that taxation is skewed to favour the wealthy, but this only explains part of reality. Deliberately not taking into account full inflation, of everything, clearly explains the rest.
When I bought this property it cost about a years worth of median wages, now without any development as it was back then decades ago, it would cost about 6-8 years worth of median wages (before taxation!!). That increase in cost is not counted in official CPI numbers, yet it is very real to the young without assets.
As oil intensity has decreased a bit, nowhere near the ‘real’ number portrayed by official stats, it was from efficiency gains, but these are increasingly being counteracted by lower ore grades in the mining sector, which has to use more energy, mostly diesel, to do the mining modern civilization needs. We get diminishing returns with efficiency gains, while accelerating energy use in lower ore grades, deeper ore bodies and harder ore indexes, exacerbated by the need to increase metal production for ‘growth’!!
The situation is always way more complicated than a simple look at an overall number, like official ‘real’ GDP compared to oil use. I agree that we can only use the numbers we have, but shouldn’t take them as the be all and end all, of any discussion.
Hideaway,
If we look at online prices, CPI measure is accurate, also if we look at what economists and statistics experts say about this, rather than Williams who has an MBA and undergraduate degree in economics. The paper I cited gives many counterarguments to the claims at shadowstats. The CPI measure was changed to improve the inflation measure.
As to median income, that is a distribution of income problem that is separate from inflation. In many places income distribution has become worse (such as the US). That is a political problem and one that I have always voted to change, but my voice is one of 335 million. In 1976 in the US the top income tax bracket had a marginal tax rate of 70%, In 1989 the top marginal tax rate had been reduced to 28%, these changes led to a much wider wealth disparity in the US. In 1980 the Gini index in the US was 34.7 and by 1993 it had risen to 40.4, much of this was due to tax policy and some due to Union busting policies of the Reagan/Bush administrations from 1981 to 1992. In 1981 the Gini index in Canada was about 33 and in 1993 it was 31.7. Unfortunately, the wealthy have an advantage and wealth disparity is a difficult problem to address, high estate taxes could also help with this problem.
Hideaway,
The median person is worse off today than 5 decades ago? In 1974 in the US median personal income was 26990 in 2022 US$ and in 2022 the median personal income was 40480 in 2022 US$. So perhaps higher income makes one worse off in your nation?
https://fred.stlouisfed.org/series/MEPAINUSA672N
Hideaway,
Yes land price can increase, as not a lot is being produced. The cost of renting a home is included in inflation statistics and when land cost increases, property taxes increase and rental cost goes up. Read the paper I linked earlier in response to shadowstats supposedly getting inflation right, it doesn’t it is in the paper, read and learn.
If we included land cost in GDP (it is already included in cost of living states through imputed rental costs) as you seem to think makes sense, GDP would be higher as land cost tends to increase over time, this would make the oil intensity of real GDP even lower, but not the “P” in gross domestic product which are goods and services “produced” by humans, nature produces land, it is not a human product so not a part of GDP. Only “improvements” to land are counted such as planting a garden or lawn, or building a home or other building on the land.
Hideaway
Thank you for bringing sanity into the forum.
Can you guys explain why you don’t believe the Billion Prices Project Data?
https://dataverse.harvard.edu/dataset.xhtml?persistentId=doi%3A10.7910%2FDVN%2F6RQCRS
This is peer reviewed research, rather than some guy posting stuff on a blog.
Dennis, pointing to long papers all over the place does not go close to explaining the situation. I’ll ask again in a slightly different way…
Can the median income person (male), in 2023 afford to own, not rent, and pay all the taxes and expenses on, a free standing home in the suburbs, an at home wife and several children, plus annual holidays (not overly flash, say camping 100 miles away from home) with own caravan and/or boat?? All while having decent education, health, and dental costs met??
The answer in this country, being Australia, is a very clear NO!! To my knowledge Australia is one country where the median person has kept up with the USA.
Are you claiming the median wage/salary person about mid 30’s years old, in the USA can afford this in 2023??
You don’t need a lot of professor’s papers to answer this question, they are there to obfuscate the reality. Also pointing to a median wage using the same type of ‘real’ price adjusted numbers that I’m claiming are incorrect, is not the way to score points. Perhaps you are just proving they are incorrect for me…
Hideaway,
GDP takes into account quality. If your median male was willing to live in a 1950’s house (half the square feet of current average homes with no AC, poor insulation, etc), with a 1950’s car (10 MPG, no AC, seat belt or air bags, manual transmission, 0-60 in 20 seconds, AM radio, etc., etc) and 1950’s phone (land line), TV (13” screen with 3 channels over the air), and health care (no MRI’s, CT, fancy new vaccines or antibiotics, etc), they certainly could afford it.
On the other hand…
The majority of income and wealth increases over the last 50 years have gone to the .1%. Inequality has increased sharply, and that’s what people sense when they feel that their lives have stagnated or gotten worse.
Nick G,
Some of those 1950s houses are still in the same condition in Australia and now worth millions. Land values have increased exponentially while wages have not.
Hideaway don’t bother arguing with these people, they are so out of touch. The world could be burning all around them but if the GDP print is positive they will argue everything is swell.
Here we go:
US median value, about $410k
Square feet:
1950: 983
1960: 1,289
1970: 1,500
1980: 1,740
1990: 2,080
2000: 2,266
2010: 2,392
2014: 2,657
https://www.newser.com/story/225645/average-size-of-us-homes-decade-by-decade.html
Nick G,
Perhaps you missed where i wrote AUSTRALIA. Majority of people now live in apartments here, because land is so expensive and is not readily released, we also have an immigration ponzi going to keep the housing prices ever increasing. God forbid the ultra-wealthy boomers lose some of their capital gains. Then you have the audacity to talk about wealth inequality when it is right in front of your face.
Also you conveniently left out the land values you quoted. I am sure the same size plot of land in the 1950s was much cheaper than 2014. Are you sure you aren’t a real estate agent or a used car salesmen ? You are very good at spouting propaganda.
Hideaway,
I believe the data is correct for inflation, I do not find shadowstats convincing.
Try https://econbrowser.com/archives/2008/09/shadowstats_deb
for something short by James Hamilton on why shadowstats is unconvincing.
We do not agree on real median income and inflation, so we will leave it there.
I agree that median income has lagged the overall economy due to wealth inequality becoming worse in the US, I don’t know the situation in Australia.
Actually the Gini index is better in Australia at 34.3 in 2018 vs 41.4 in US, lower numbers mean income distribution is more equal.
For the US, the real GDP per capita has grown at about 1.56% per year from 1984 to 2022 while real median personal income has increased at an annual rate of only 0.98% per year from 1984 to 2022. That has to do with wealth inequality and changes in tax policy favoring the wealthy in the US since 1980, also Unions have far less power in the US today than before 1980, that has also hurt lower income people.
Median income in the US was about 40500 in 2022 in 2022$, if median income in 1984 ha grown at the rate of GDP per capita from 1984 to 2022 median income would have been 47600, about 17.5% higher, so in this sense yes the median person is worse off compared to mean income and I agree this is not a good thing.
When Consumer price indexes are calculated the cost to rent an equivalent home is calculated for homeowners and included in the index. In economics we call this opportunity cost, you can buy a home and live in it and then you forego the opportunity to rent the house to someone else, the amount you could have collected for rent for a home you own is included in the price index as shelter cost.
Dennis, here are the questions again, no mention of shadow stats way of measuring inflation..
“Can the median income person (male), in 2023 afford to own, not rent, and pay all the taxes and expenses on, a free standing home in the suburbs, an at home wife and several children, plus annual holidays (not overly flash, say camping 100 miles away from home) with own caravan and/or boat?? All while having decent education, health, and dental costs met??”
Why not just say I don’t want to answer that??
Why go on with all the paper references of how good things are via dodgy statistics, and they are dodgy, when it’s obvious the median person in 2023 is much worse off than the median person in 1973?
It is the job of statistics to match what’s happening in the real world, not the other way around. If the statistics don’t match what’s happening, then the way of recording those statistics is incorrect and needs to change to reflect reality, unless there is another agenda for those producing the statistics.
The median person is in the middle statistically, how they are going ‘economically’ is the median for how the country is going ‘economically’. As they are worse off than 5 decades ago, then it is clear that the lower oil intensity has reduced overall standards of living, and it is the stats that are not recording reality..
I know that reality and the truth hurts the propaganda that everything is rosy, but it is what it is. Fairytales are nice to believe in, they have a happy ending, reality a lot less so..
Middle and lower income people feel that things have gotten worse, even though objectively they are somewhat better.
It’s income and wealth inequality. Objective measures like income, possessions, education and health are obviously important, but inequality is almost as important.
If you feel poor, it doesn’t matter what you have, it’s what you don’t have that matters. If everyone else has a smartphone, it doesn’t matter that a “feature-phone” from 2003 is an incredible marvel of technology and enormously useful and convenient: you feel left out. You feel poor. You feel mistreated.
It’s a universal human feeling. Heck, even chimpanzees feel the same way.
And Republicans, of course, do everything they can to accelerate inequality, while blaming everyone but the culprits: the very wealthy. They scapegoat women, blacks, immigrants, city dwellers, government employees, and people watch Fox News and listen to talk radio and they believe it…
“when it’s obvious the median person in 2023 is much worse off than the median person in 1973?”
Here’s your problem Nick
For some reason you have come to the idea, that you can lead a horse to water and he will drink. Buddy, you don’t even have horse here. It’s the back end of a mule and the MS is coming at you.
Merry Christmas Nick
Hideaway,
The answer to your question cannot be answered with anecdotes, only with statistics.
The statistics are correct in my opinion. In the US, income inequality has become worse, I don’t have good statistics for Australia so cannot comment on conditions there except according to Gini index statistics wealth is distributed more evenly in Australia than in the US.
Real GDP per person for the World has increased at about 1.56% per year from 1973 to 2022 (50 years). We do not have median income data for the World, but that probably has not grown as fast as income districution tends to become more unequal over time (though some nations do much better than others in this regard due to different tax and safety net policies between nations). Oil (C plus C) use has only grown at about 1% per year on average over the past 50 years (1973-2022).
The median income in the US has not kept up with average income, but I cannot find such a statistic at the World level.
There are Gini index estimates for the World.
https://openknowledge.worldbank.org/server/api/core/bitstreams/bebd3e0f-05ed-5c5f-9031-4764534449ae/content
From page 81 of the paper there is the chart below.
World inequality is getting a bit better, but there is a long way to go between the poorest and the richest.
Dennis,
My understanding is that inequality is getting worse lately within most countries including China, but that strong growth in China overall (starting from a low level) has decreased world inequality.
Bit of a paradox.
Huntington Beach,
Thanks! Merry Christmas to you!!
Updated Rig charts from revised BH data
US Rigs. Small changes.
NM Rigs
Down 2.
D COYNE: “There was a time when very little petroleum was used (prior to 1860), claims that oil is essential seem to forget much of human history.”
And the average life span prior to that time was . . . 47 years.
Gerry,
There has been some progress since 1860, there are other forms of energy besides oil and we are capable of using energy more efficiently now than in 1860. In the future there may be many changes, one of those may be much less use of fossil fuel for energy.
Dennis
I wonder if there is GDP data back far enough to see how the growth in GDP and oil production took off at the same time. The amount of energy in that small gallon of gasoline and diesel is what has led to today’s lifestyle. That is what most people don’t get about oil.
Growth during the Industrial Revolution was greatly accelerated by coal. The US grew quickly on wood and coal from 1800-1850; growth slowed on coal from 1850-1900; it slowed further as oil grew, from 1900-1950; and it’s been even slower since WWII!
Oil has never been essential to our economy, just convenient.
Nick G …. “Oil has never been essential to our economy, just convenient.”
LOL,
What an unbelievable, stupid, naive statement, which can be backed up with zero evidence.
How do you think the US would have gone in WW2 without oil?? Would there even be a USA now if not for oil??
Oil has been essential for the economy for over 120 years. Without it the US would most likely be owned and governed by others who would use all the resources. It’s the maximum power principal in action that would guarantee the oil had to be used.
When the US goes into fast oil production decline at the end of the shale oil period, the lack of energy will be a lot more than inconvenient…
How do you think the US would have gone in WW2 without oil??
Oil did support military applications: oil-fueled ships could travel about 20% faster, which wasn’t essential for freight delivery, but was an irresistible edge in a war. But, If there were no petroleum in the world, then it would have been a contest using coal, of which the US has more than any other country in the world (250 B tons, about 25% of world reserves).
Oil has been essential for the economy for over 120 years.
Oil was convenient for indoor illumination until roughly 1890, when electricity replaced it.
120 years ago the US had an extensive rail system, which supported higher economic growth rates than we have now. Electric passenger and truck vehicles can provide last-mile connections quite nicely (GM produced electric trucks until 1918).
Manufacturing really doesn’t use oil, except for transportation, which as noted above would have continued to run on coal.
I wonder where the idea came from that oil is essential. Sure, if aliens stole all our oil overnight we’d have a disaster on our hand, but if petroleum had never been available we wouldn’t have missed it. We’d have relied on rail, and for niches like aviation we would have produced liquid fuels from CTL and biofuels. Eventually, of course, we’d have recognized how incredibly dirty coal is and moved to renewables.
You may not have noticed, but China is producing petrochemicals from coal. Talk to your friendly neighborhood chemical engineer, who will disabuse you of the notion that petroleum is the only fossil fuel in the world, or that fossil fuels are the only source of hydrocarbons.
Nick G … “You may not have noticed, but China is producing petrochemicals from coal”.
Considering I brought it to the forum’s attention a couple of months ago along with Botswana looking to do likewise, yes I’m well aware.
How much copper mining do you think would be happening at places like Escondida without oil?? Of course include all the other equally isolated mines for a range of minerals. The answer is none to save you time.
Without the metal inputs from mining, manufacturing wouldn’t be able to make consumer products with metals nor the machinery made from metals. You take one part of the entire system and make stupid claims about it, without considering everything is interconnected. you can’t just separate one bit out!! Manufacturing is just as dependent upon oil as everything else.
It’s interesting how you always want to change the parameters of the discussion as soon as you are called out. Your initial claim was and I quote ….”Oil has never been essential to our economy”.
Change parameters and of course the answer is different, but your original off the cuff mention is just plain dumb isn’t it? The one about manufacturing not needing oil is just as stupid.
Hideaway,
Before tight oil was produced in significant quantities. US oil output had been declining from 1970 to 1977, rose with Alaska output to 1985 then fell up to 2008, then rose to a new peak with tight oil output. The ups and downs have helped and hurt oil producing regions, but for the US as a whole there has been little effect on the economy.
Dennis, it’s not your discussion, it’s about Nick’s statement….
“Oil has never been essential to our economy, just convenient.”
He didn’t express an opinion of if he meant production or consumption, but it sounds like consumption or use, especially coming after talk of coal and wood use.
Your graph of USA oil production is irrelevant to this discussion so why refer to it?
Oil has clearly been essential to the US economy and is clearly important for manufacturing, in the world we live in, it’s laughable to think otherwise.
Hideaway,
You said:
When the US goes into fast oil production decline at the end of the shale oil period, the lack of energy will be a lot more than inconvenient…
The US has seen output decline in the past, not an issue, US tight oil output is about 1% of World output, it is not really going to be of great importance in the grand scheme.
The chart shows US utput has declined in the past, also note that about 40% of US tight oil output is exported. As output of tight oil falls, the US will import oil like much of the rest of the World.
How much copper mining do you think would be happening at places like Escondida without oil?
The same amount. Mining works very well with electricity – better in fact. Nobody wants a diesel motor doing underground mining, and open pit mining involves relatively short distances which work very well with electricity.
“Mining major BHP is working towards the full electrification of its Escondida and Spence copper operations in Chile.”
https://www.miningweekly.com/print-version/electric-future-planned-for-escondida-2023-06-21
——————————-
“Oil has never been essential to our economy, just convenient.”
Yes, it’s true. Have you spent much time around manufacturing? If so, did you notice all of the electrical equipment, and the lack of diesel motors indoors?
Sure, there are petrochemicals, plastics and process heat, but they don’t need oil. Oil is indeed a convenient source of petrochemicals – heck, a lot of refineries are moving in that direction because they don’t have to create GHG emissions (not actual burning of oil), but…petrochemical hydrocarbons can come from a lot of sources, and in an alternative history without oil that would have been the story.
——————————
The Model-T is a classic symbol of US manufacturing success. But, manufacturing it didn’t use oil. Heck, the license plate was made from soy, and it was designed to run on ethanol.
Dennis …. “US tight oil output is about 1% of World output,”
Dennis you go to great lengths pointing out how the tight oil output from the permian can be maintained up to 2028-9 and with all other tight oil is about 9Mbbls/d. Are you now trying to claim this is 1% of world output of 82-4Mbbls/d. I think you need to redo your maths..
Hideaway …. “How much copper mining do you think would be happening at places like Escondida without oil?
Nick G ….. “The same amount. Mining works very well with electricity – better in fact.”
LOL, you are not a systems thinker are you. It would have never been discovered without oil. The drill rig that drilled the discovery hole was diesel powered driven to location by diesel truck!! The first discovery hole was 240 metres deep. We didn’t have the technical ability to drill that deep prior to diesel based machinery.
The diesel-electric trucks that BHP have just purchased use around 100 litres of fuel per hour. The fuel tank holds over 4900 litres, and can operate for up to 40 hours before the truck needs refueling.
If they go ahead with the overhead trolley system, that is only part of the trip. The Escondida mine, while connected to the Chilean Grid (which still gets over 50% of it’s power from fossil fuels), has plans, but currently uses massive amounts of diesel.
The plan, not currently happening, is for the mine to sign a contract to use renewable power from the grid. The grid plans to go greater renewable percentage, but is being hampered by the long term drought that is affecting the hydro-electric dams.
I’m sure the piece of paper being signed will say they are 100% renewable in 2030 or whenever, but in reality, when the sun doesn’t shine in Northern Chile they will be using coal or gas fired electricity. BHP wont care as the piece of paper will say 100% renewable.
Hideaway,
Yes my mistake, I had earlier estimated that a 15% decline in tight oil output would be about 1250 kb/d and that is about 1.5% of World C plus C output.
You are absolutely correct that US tight oil output is not 1% of World C plus C output, it is about 10% of World output. Thanks for the correction.
The drill rig that drilled the discovery hole was diesel powered driven to location by diesel truck!! The first discovery hole was 240 metres deep. We didn’t have the technical ability to drill that deep prior to diesel based machinery.
Well, just use a tiny bit of imagination: there are a lot of ways to skin a cat. Steam engines, electric motors, synthetic diesel. If oil had never been found we certainly would still be drilling, even in remote locations.
ICEs and electric transportation developed at about the same time, but EVs had an early lead. Then the first gas-electric hybrid was developed in the form of starter motors and onboard electric generators (aka alternators). At that point ICEs were somewhat more convenient, so they won the competition. But rail and electric vehicles would have continued to work very well. And alternative liquid fuels and better batteries would have developed much faster.
On the other hand, maybe greater reliance on rail would have reduced urban sprawl a little…
Nick G, still trying to change parameters..
Let me be clear. Oil was always essential to the USA economy, and your statement that is wasn’t is just rubbish.
You can imagine all want, but what happened in the world is history, it can’t be changed, so trying to make up an imaginative past is just dreaming.
The world operates on an energy surplus ratio of somewhere between 10-15 to 1, meaning that somewhere between ~6-10% is the ‘cost’ of gaining all energy for the economy. Oil has supplied a very high surplus energy ratio, but is declining. Renewables and nuclear do not come close to matching what oil has given us, so modern civilization cannot go on as it currently is, without oil. The median standard of living will continue to fall..
Oil was always essential to the USA economy,:
How odd the Industrial Revolution happened without it:
“The Industrial Revolution, also known as the First Industrial Revolution, was a period of global transition of human economy towards more widespread, efficient and stable manufacturing processes that succeeded the Agricultural Revolution, starting from Great Britain, continental Europe, and the United States during the period from around 1760 to about 1820–1840. This transition included going from hand production methods to machines; new chemical manufacturing and iron production processes; the increasing use of water power and steam power; the development of machine tools; and the rise of the mechanized factory system. Output greatly increased, and the result was an unprecedented rise in population and the rate of population growth. The textile industry was the first to use modern production methods,[2]: 40 and textiles became the dominant industry in terms of employment, value of output, and capital invested.” https://en.wikipedia.org/wiki/Industrial_Revolution
Oil drilling didn’t start until 1859, and oil-fired transportation didn’t start until roughly 1905.
Renewables and nuclear do not come close to matching what oil has given us,
Even now oil is only 1/3 of the energy we use. It’s EROEI is rather lower than renewables and nuclear. We can argue about the boundaries of EROEI analysis until the cows come home, but as long as the boundaries are the same, renewables and nuclear do better. And renewables are much cheaper, which ought to interest a pragmatic, hardheaded person like yourself.
Nick G … “We can argue about the boundaries of EROEI analysis until the cows come home, but as long as the boundaries are the same, renewables and nuclear do better.”
Boundaries for EROEI analysis?? Why not include a simple all energy used in the construction, operating and maintenance of each type of energy generating unit??
Here is something to consider, the EROEI of the largest solar farm in Australia, still under construction will be around 1.74, the EROEI of a wind farm nearby of 132Mw capacity is around 1.53, while a newly discovered, connected and now operating gas field has an EROEI of 37.8. Old Saudi oil wells in Ghawar, or the old East Texas gushers that lasted decades, using today’s dollars for costs (yes the ones that are not as real as they should be), often over 100.
It’s actually very easy to see what has the great EROEI, the energy producers that are wildly profitable. The Saudi oil wells have been staggeringly profitable for decades, so obviously have a very high energy return on investment. Likewise the small gas plant in the Perth Basin, selling 33Tj per day at a price of (currently) $A8-10/Gj and a cost of only something like 19c/Gj IIRC. The capital being paid back in a few months.
Here is the difference, over 4.5 years this Gas project will cost a total Capital, operating and maintenance over it’s life of $A40,260,000 and produce 14,958,000Mwh of energy.
Meanwhile the large wind farm near me cost $A270M in capital and a projected $135M O&M over it’s life of 25 years
For a total of $A405,000,000 it will produce 6,937,920Mwh of energy.
Ten times the cost and less than half the total energy returned, yet you think solar, wind and nuclear have better returns..
Every cent spent on any of these energy producers, is the energy input, so looking at total energy input, including all embedded energy within the system is the only realistic way to look at EROEI, unless you want to delude yourself..
Nuclear as in how Vogtle and Hinckley are built have an EROEI of slightly less than 1.
Do the math Nick and wake up…
the EROEI of the largest solar farm in Australia, still under construction will be around 1.74, the EROEI of a wind farm nearby of 132Mw capacity is around 1.53,
Those numbers don’t remotely line up with anything in the mainstream literature. Where did they come from?
Nick, I worked out the numbers myself based on the average energy price of oil for the year in which the energy system was built. It’s not a perfect number but nothing is. However oil being the main supplier of energy, it’s average price over the year does tend to affect everything else.
Solar and wind, has increased their EROEI greatly over the last 20 years, but it’s only gone from very negative to slightly positive, nowhere near what a modern civilization needs.
Basically both solar and wind need to get to a quarter of their current capital cost and likewise for their operating and maintenance costs, and last 100 years plus to be near some of the EROEI numbers often claimed.
Here is the real easy way of looking at it… In 2022 the average price of oil from the IEA was $US100.98/bbl. This works out at roughly $US60/Mwh of oil (there being ~1.7Mwh of energy in a barrel of oil).
The largest solar farm in Australia is costing (still building stage 2), $A1.3B. Expected life of 25 years. According to IRENA solar farm O&M costs range from 1% of capital to 3-4% of capital cost after year10. This is is effectively 50% of capital cost over lifetime of solar farm.
Including all these costs = $A1.95B. At current exchange rates ~ $US1.306B.
How many Mwh of oil could be bought for that price?
Roughly 21,775,000Mwh
How much energy will the solar farm return? 720Mw X 5.5hrs/d (from their web page!!)
X 365d/yr X 25 years = 36,135,000Mwh
= ratio of 36,135,000/21,775,000 = 1.66 (I rounded before, plus exchange rate changes, so had higher number when I worked out a couple of months ago)
Using exactly the same methodology, I get EROEI of 37.8 from the Walyering gas project owned by junior gas development company Strike Energy. Please look it up and do the sums yourself!!
Every, and I mean EVERY EROEI study you read, has put in lots of boundaries that limit the actual energy spend on renewables (and nuclear). All claim it is too hard to include everything, when there is an easy method to do so.
We can only try and move forward when people stop deluding themselves!!
Hey OVI,
Agree with what earl has brought us, and find it odd when discussing this fact and all it’s ramifications with the unaware, eyes just glass over. Like some have said, looks like the party’s over, we’re at least in the “last call for alcohol” phase…our predicament sucks, and have yet to be convinced about the “renewable’s” solution viability, so far it all seems to be nothing more than a pipe dream.
Ovi,
We don’t have very good data at the World level prior to 1960. Oil intensity of real GDP increased from 1960 to 1973 and has been declining since 1980 with linear decline from 1984 to 2019.
Dennis
Thanks. Partially answers the question. I was thinking it would be a hockey stick looking graph, a slow increase in productivity with time and then a transition to a higher slope as more and more oil was used.
Not quite what the productivity measure would be before oil was used. Output per hrs of work?
Ovi,
Dennis said that good GDP numbers aren’t available for the world before 1960, but that’s not the case for the US. US gdp growth was lower after oil became a significant contributor to the US’ energy inputs.
In other words, the US grew more slowly after oil arrived.
Ovi,
General energy intensity could be used where coal and wood/biofuel would be the main energy inputs prior to oil and natural gas. We do not have very good estimates of economic output at the World level before 1960 and even for the US estimates before 1929 are not very good.
Dennis,
even for the US estimates before 1929 are not very good.
First, could you point me to a discussion of that?
2nd…the estimates we do have say that GDP growth was much higher in the 1800-1900 period in the US, and that growth from 1900-1950 was faster than 1950 onwards. Does that not seem like a useful starting point for discussion?
Nick,
I actually couldn’t find real GDP estimates for before 1929 for the US. So I can’t really say they aren’t good, but they are hard to find.
I don’t have that data for US growth.
Found data from Maddison. Growth was higher in 1800s because population was growing more rapidly. If we compare real GDP per capita data the annual growth rate from 1865 to 1929 was about 1.5% per year and from 1945 to 1976 the annual rate of growth was about 2.1%. If we ignore the changes in population growth, the annual growth in real GDP was 3.46% from 1865 to 1929 and 3.6% from 1945 to 1976. I leave out the Great Depression and WW2 because they were anomalous.
Maddison data at
https://www.rug.nl/ggdc/historicaldevelopment/maddison/releases/maddison-project-database-2020?lang=en
Using more recent data from World Bank, US real GDP grew at an annual rate of about 2.7% from 1977 to 2022. Over the 1977-2022 period real GDP per capita grew at 1.7% per year.
Growth was higher in 1800s because population was growing more rapidly.
So population growth increased, and that caused GDP to increase faster? That’s a bit problematic. It makes more sense to say that faster economic growth reduced death rates, which in turn increased population growth. Now, you could argue that there was a virtuous cycle, in which more population growth also supported economic growth, and I think that would be reasonable.
But…the basic point here is that coal supported a higher GDP growth rate. Coal provided enough energy to allow GDP to grow as fast as other factors could make it grow. And, later, when oil arrived, GDP growth was slower. Why? Well, that’s complex, and it certainly includes population growth. But…
There’s absolutely no evidence here that oil accelerated economic growth in a way that was unique, or better than coal. In other words, there’s no hockey stick of economic growth caused by oil.
Nick G,
We are looking at US specifically. You may forget your history, but there was a lot of immigration to the US from 1820 to 1920. Yes higher rates of population growth lead to higher GDP, more workers results in more output ceteris paribus, so GDP per capita is generally a better measure.
Nick,
I think we can say that GDP per capita growth was faster in the US from 1945 to 1976 than it was from 1865 to 1929. If we look per capita real GDP growth from 1820 to 1869 and compare with 1870 to 1929, we find 1.2%/year in earlier period and 1.5% per year in later period. This assumes oil output started around 1870. From 1947 to 1984 real GDP per capita grew at about 2.3% per year and from 1985 to 2022 growth in GDP per capita was about 1.5% per year. Again I leave out 1930 to 1946 due to Great Depression and WW2 leading to anomalous growth (negative and then strongly positive).
If we include the 1930 to 1946 period and split the 1930 to 2022 period in two halves we get 2.9% per capita real GDP growth from 1930 to 1975 and 1.7% per year real GDP per capita from 1976 to 2022.
Ovi,
The chart below looks at real GDP for the US (natural log so slope of curve indicates growth rate) and oil consumption where “oil” is the main liquid fuels (gasoline, diesel/distillate, jet/kerosene fuel, and residual/bunker fuel) consumed in the US. From 1947 to 1978 the growth rates were similar (3.5% and 3.8% per year), from 1979 to 2019 there was a break where the growth rate of real GDP(2.73%/year) was considerably higher than the growth rate for consumption of liquid fuels(0.67% per year).
Hi Dennis, it is an interesting discussion of oil intensity of GDP and how meaningful GDP is. I recommend keeping the chart from your post in your mind, and then visiting the website: “wft happened in 1971”
There you will see charts showing that when the yellow line turned down, a number of other lines turned in a bad direction at the same time, including, wage growth, inequality, government debt, # of two income households, inflation, house prices, energy use, incarceration, and many others.
But GDP just continued on upwards on its merry way, unaffected by the negative shift in so many more tangible metrics.
The conclusion I’ve come to in trying to make sense of this pattern is that GDP is a goal-seeked number. If the GDP is too low, we print money until it goes back to where we think it should be.
Consider the following exchange as a simplified version of what happens when govt sets out to boost GDP without causing inflation:
1) Govt says, hmm, GDP isn’t growing at 2%, let’s print some money
2) Gov’t prints 1bn dollars, and says, wow, facebook is so awesome, here you go Mark Z, here is a billion dollars
3) Mark Z says, yes, I am awesome, but I already have everything I need, including a secret Hawaiian bunker with 11 treehouses, so I’m just going to deposit this billion in the bank.
So what has happened, GDP goes up and its back on track. And no oil was required. Decoupling! But wages haven’t gone up, and inequality and government debt / Fed balance sheet have gone up also and we haven’t really produced any new value, it is just accounting trickery.
Of course, it is possible that there can, theoretically, be decoupling. In an extreme case, people could live in a matrix-like state, getting enough calories to live but otherwise in a VR world, never driving anywhere, not needing a house or a vehicle or more than 1 set of clothes, etc. and the matrix simulation is so good, they prefer that to a life where they have any actual physical stuff and go physical places, and we see a certain amount of that happening with the proliferation of screen zombies throughout the land, but I am not really convinced that we have reached a point where people don’t want more, bigger vehicles, more, bigger houses, farther, fancier, longer vacations, etc.
And it makes me suspicious when the GDP line keeps going up as if nothing changed for GDP when oil consumption (trend) turned down, but so many other things just (coincidentally?) seem to have changed at the same time, in the exact same way that oil changed, and not at all in the way that GDP changed.
If you want a more academic run-down, you can try, “The Rise and Fall of American Growth” by Robert Gordon. It is a good book, in that he very thoroughly documents how economic growth has slowed down since 1970 (even though GDP doesn’t really show it). But it is aggravating that he seems to have devoted his life to figuring out why growth slowed down after the early 1970’s, and his book hardly mentions oil/energy availability as a possible reason for the slowdown at all!
For example, in one place he says, “the great transformation of America to a motorized society was essentially over by 1970, another metric by which the early 1970’s mark a dividing line between rapid and slower progress”
But he doesn’t seem to wonder if the end of the transformation to a motorized society (or any other slowdowns in growth/progress) as having been caused by the end of easy oil.
Gov’t prints 1bn dollars…here you go Mark Z, here is a billion dollars
Mark Z says… I’m just going to deposit this billion in the bank.
GDP goes up and its back on track.
It doesn’t work that way. You’re talking about cutting taxes. If Mark Z doesn’t spend the $1B he saved with lower taxes, GDP does not go up. He gets wealthier, and the rest of the US’ taxpayers are poorer, but GDP does not go up. It’s just redistribution of income & wealth to the wealthy, which Republicans are good at.
Dennis
Doesn’t the break in the graph imply improving energy intensity?
Ovi,
It implies that yes, in the sense that lower oil use per unit of real GDP is an improvement.
Here is US oil intensity where “oil” is consumption of gasoline, diesel/distillate, jet/kerosene fuel, and residual/bunker fuel. Prior to 1945 this is an estimate based on ratio of C plus C production to “oil” consumption from 1945 to 1950 and assuming that ratio is constant from 1900 to 1944 (we only have crude output data over that period).
Dennis
That is a remarkable drop from 1940 to 2020
Ovi,
Yes, also notice the big drop during WW2 when oil was saved for Wartime use and gasoline may have been rationed for personal use, output was focused on the war effort so fewer cars and other consumer goods were produced and the economy was operating full out producing munitions for the Allies (no doubt the same occurred elsewhere such as Canada and Australia). The big sustained decline occurred from 1979 to 2022 (data is also a bit unreliable from 1900 to 1945 as we don’t have great consumption data and from 1900 to 1929 the real GDP data may not be reliable.
In short I have the most confidence in the chart from 1945 to 2022.
What are some of the big factors that have enabled a much lower US oil intensity as depicted in the chart posted by Dennis since 1978
1. Improved gas mileage of transportation fleet …about 60% improvement depending on vehicle class. Excellent breakdown here- https://wolfstreet.com/2022/12/12/car-truck-trends-faster-more-powerful-bigger-heavier-and-more-fuel-efficient/
2. Large sectors of GDP growth that depend primarily on non-oil electricity production for the energy supply. Massive growth in these sectors has occurred-
– the computer, software, data industries
– the health care, pharma, biotech industries
– the finance, tax, transaction industries
– the fluff industries including advertising, political campaign, entertainment, sports, gambling, fashion, digital gaming
Many of you will think that some of these sectors are not too relevant of a measure of economic health and stability. I am one of those, but GDP includes all kinds of thing. We seem to be stuck with a very faulty measure of economic status.
And world population was 1.2 billion.
World population has more than tripled in my lifetime.
Hey Ovi,
As a Canadian, you may especially appreciate the info in the 33 page report ‘Beyond Bitumen Combustion’ (November, 2023 white paper) from an outfit called Alberta Innovates.
In a nutshell, these guys are touting the use of Albertan bitumen for non combustible (aka transportation) uses … particularly for the manufacturing of ultra cheap carbon fiber.
Carbon fiber is twice as strong as steel and five times lighter. Global growth rate of this incredible material is running about 20% per year.
They claim the current 30/50 cent per kilogram value of combustible bitumen can increase to $10/$20 per kg when used for carbon fiber, and leaving ~80% of the lighter ends for other applications.
At a million barrel per day rate, gross revenue could go from $18 billion to $42 annually.
It is definitely a booster type presentation, but very intriguing info nonetheless.
CoffeeGuyzz
Thanks. Interesting idea. Here is a critical paragraph:
“Those are staggering values to extract from a barrel of bitumen. As a whole, the BBC white paper estimates the following benefits. If one million barrels per day of bitumen is sold to refineries at $50/barrel after diluent removal, the revenue is $18 billion per year. If the same volume was used to create BBC products, the potential revenue is calculated at $42 billion. This number includes the value of BBC products ($28 billion) plus the value of the light ends remaining from the bitumen ($14 billion).”
This leaves the question, what volume of oil sands would making carbon fibre utilize, 1,000 kb/d, 10,000 kb/d? Probably very small compare do transport demand.
If it would be a money making idea, some US chemical company might build a carbon fibre plant in Alberta. Maybe they could even claim some carbon credits for sequestering carbon.
Recently Dow announced it is building a petrochemical plant in Alberta.
https://www.bnnbloomberg.ca/first-of-its-kind-dow-invests-9-billion-on-alberta-net-zero-petrochemical-project-1.2005141#:~:text=Dow Chemical has announced plans,ethylene cracker and derivatives site.
Hi, i have a question to the experts.
What is done with the water coming out of the oil wells ? A lot of oil wells have water cuts of 50 percent or even much more. Is this water reinjected into the earth to get rid of it and to replace the oil produced ? Or is it stored ? Or is it cleaned and used for some purpose ? Or is most of it put into rivers ?
This is a aspect which i do not have considered up to now in my thermodynamical calculations. Thank you for answers.
Most is either injected back into the oil producing zones to assist in the production of oil, or disposed of in non-producing zones, usually below the producing zones.
Some is disposed of on the surface, but in the USA this is by far the exception, as most produced water contains too many minerals that are harmful to the surface.
As I have posted here many times before, we produce around 100 barrels of water for every barrel of oil. This remains economic due to extremely shallow vertical wells (850’-1,050’) very low decline rates, almost no produced gas, low injection/disposal pressures and relatively benign produced water.
From what I have read and what has been posted here, particularly by Mike, shale produces huge volumes of water. This water is disposed of at high pressures into deep, many times basement formations. This is why TX and OK are experiencing seismic activity.
@Shallow Sands, thank you for the answer.
Can you please supply me with some numbers ? I’m interested in the daily flow rate of the oil/water mixture of a typical well, and the oil temperature at the bottom and the top of the well?
And i search these four numbers (Water cut, flow rate, bottom and top temperatures) for some deeper wells, with a depth of 3000-5000 feet.
O&GJ World Wide report for those interested. I am putting them to dropbox, as the size might not fit here.
https://www.dropbox.com/scl/fi/sk3ljm03goae5vj0hk6a4/WorldWide-Report_-2023_1.JPG?rlkey=5wcvst8az51ht2418i7e7o2b6&dl=0
https://www.dropbox.com/scl/fi/eqc270syc9zbti4xg4wcf/WorldWideReport-2023_2.JPG?rlkey=d79k48xx4gsss864c6lm3hc26&dl=0
As the US just set a record (15+ Bcfd) for LNG feedgas, thought I would post a quick, illustrative example of the Mighty Marcellus’ real world potential inclusive of Pennsylvania’s just-released October production …
The 8 well Carpenter pad (EQT, Greene county) has produced over 31 million barrels energy equivalent of oil (181 Bcf natgas) in less than 4 years’ total production time, currently producing 9,500 Boed (55 MMcfd).
Averaging almost 8 million boe/year (45 Bcf), this single pad – costing under $100 million to develop – could provide the annual residential natgas needs for Pittsburgh, Cincinnati, Cleveland, St. Louis, Newark, Dayton and Akron COMBINED!
While this is an exceptionally productive pad, it is still not the highest producer in the Commonwealth.
If one were to pore over both West Virginia’s and Ohio’s production records (not gonna do it at the moment), it is likely to be shown that the Appalachian Basin has over 200 wells with individual energy output exceeding 3 million barrels of earl, primarily in the form of nagas, liquids included.
As has been noted by a poster on this site – referencing a different region – there are vast swaths of the AB not being developed (although the northern Utica is currently seeing aggressive land acquisition.
Hmmmm).
With daily output of well over 6 million boe (36 Bcfd) and only 40 rigs working, the unfathomable potential of the App Basin has barely been scratched.
Coffeeguyzz,
We will see, the best areas get developed first. About 81 TCF have been produced from the Marcellus (dry gas only) and about 19 TCF of dry gas from the Utica since Jan 2000. In 2011 the USGS had a mean TRR assessment for Marcellus undiscovered shale gas resources of 83 TCF with about 13 TCF of proved reserves at the end of 2010 this adds up to 97 TCF, since Dec 2010 about 80 TCF of dry natural gas has been produced. leaving about 17 TCF to be produced.
In 2019 there was an updated assessment with mean undiscovered TRR of 96.5 TCF in Marcellus there were 135 TCF of proved reserves in the Marcellus at the end of 2018, so a total of about 232 TCF, if the mean TRR estimate is correct. Since December 2018 about 43 TCF have been produced from the Marcellus.
The total URR might be 312 TCF (37.5 plus 43 plus 232 TCF). If peak is at roughly 50% of URR that would be 156 TCF cumulative output which would be about 75 TCF more output to reach peak output. In the past 12 months about 11 TCF of natural gas has been produced from the Marcellus, if output remains flat we would peak in under 7 years, if output increases it will occur sooner. Note that a more realistic estimate would take perhaps 75% of the mean TRR as being a likely mean ERR target, in that case peak is reached in under 6 years assuming flat output for the next 6 years.
So pretty fathomable.
Dennis,
In one of the rare times that we may agree, sort of, I suspect ‘peak’ production out of the AB may already have been reached … with the qualifier that an additional 2 to 4 Bcfd increase might occur if pipelines such as the Mountain Valley come online.
Where we strongly differ, perhaps, is the longevity of this massive resource.
Your reference to/reliance upon the USGS’ assessments could be an eye opening experience if you simply chose to spend several minutes comparing the USGS’ Marcellus production parameters for the 2 (of 6) zones (both ‘Interior Marcellus’, IIRC).
Not gonna re-check again now, but the actual production numbers for wells from here (not too many as they are lower-tier, by Marcellus standards) are much higher than the USGS’ total, lifelong estimates. The the USGS assumes a 20 year life, whereas these existing wells are only a few years into their EUR. (Aaannd, they are mostly older ones with archaic completion practices having been used.)
Little acknowledged is that the Deep Utica is still virtually untouched in SWPA (Southwest Pennsylvania).
There is, however, ongoing, very successful step out Utica production spanning the northwest/northern ‘crescent’, primarily by Seneca Resources, which continues to enlarge the Utica’s productive footprint.
AB production will last for many, many decades at current output levels.
Coffeeguyzz,
From Novilabs
https://novilabs.com/blog/pennsylvania-update-through-march-2023/
The chart below has cumulative well profiles for average 2018, 2019, 2020, 2021, and 2022 wells (2022 is light blue). We seem to have a productivity drop in 2022, may be of concern for those that believe the resource is nearly unlimited.
Note that output will depend in part on natural gas prices, if they rise you may be right, if not perhaps not. At current output levels, perhaps 5 decades of output if USGS mean TRR estimates are roughly correct and proved reserve estimates are added to mean undiscovered TRR (total of about 359 TCF and current output of about 7.4 TCF per year is 48 years). If we assume only 80% of TRR is economic the gas is used up in 43 years at current output level.
We agree the resource is large, but it is not unlimited.
Dennis
That is exactly one way the oil is stolen out of pipelines that do not have any proper monitors
https://www.bbc.com/news/world-africa-61216157
https://www.rferl.org/a/russia-oil-pipeline-theft-transneft/31163179.html
You can’t even be bothered to find out about something you know nothing about.
Charles for the Nigeria story, the $3B/year would amont to about 110 kb/d assuming $75/bo. For the Russian story they give a 2013 estimate of about $3 billion, in 2013 the average Brent oil price was about $108 per barrel so that would be 3000 million divided by 108 or 28 million barrels per year or about 76 kb/d, if these had happened in the same year it would add up to 200 kb/d. You will have to find a lot more stories to get to 4 Mb/d and note that although this oil is reported as stolen does not mean it is not being reported as produced. The oil that is put into the pipeline is the oil produced.
Dennis
As I said you know nothing about this.
What was your job again remind us?
Charles I know what I read on the internet, what is your job?
You seem to think what you believe is correct, I just see things differently and reserve the right to express my opinion.
I read the pieces you linked, can you point to where I have misinterpreted those pieces as far as total oil stolen?
Dennis
Right from the very first post I made you said NO, without reading any of the articles. That is the mark of a closed minded person.
Now your ego won’t allow you to admit you were wrong.
OPEC data shows oil consumption 5/6 million barrels per day higher than EIA which obviously makes no attempt in assessing illegal oil consumption. I will go with their data as they are the people who actually produce much of the oil and gas.
https://www.opec.org/opec_web/static_files_project/media/downloads/publications/OPEC_MOMR_Apr_2020.pdf
file:///C:/Users/jzoly/Downloads/OPEC_MOMR_December_2023-2.pdf
Charles,
As I have pointed out before, ad hominum is unconvincing.
Having a different point of view is different from being closed minded. There are different estimates of World Demand, we won’t really know 2023 demand for another 6 months or so.
I have read the pieces you have posted, not a lot there in my view, to substantiate higher consumption arguments.
Here is Annual consumption of gasoline, distillite/diesel, jet fuel/kerosene, and residual/bunker fuel according to OPEC’s Annual Statistical Bulletin (ASB). Click on World Demand by product and then click on “other” on chart to see liquid fuel demand for gasoline, distillate, kerosene and residual fuels, the other category is NGLs and by products that are not the main reason for oil production.
https://asb.opec.org/ASB_Charts.html?chapter=1531
Is this what the Peak Permian looks like? Sure seems like it…
Kengeo,
At current prices for Oil and Natural Gas we may be near the peak for the Permian, though it might be a plateau that lasts for a few years if oil prices and natural gas prices are high enough ($80/bo and $3/MCF might be high enough).
Dennis, with all due consideration, I’m not sure you’re aware of the potential of the Appalachian Basin. Most of that has to do with a massive rift, creating a complicated, splintered graben due to multiple fault lines, allowing a large horizontal section of the crust to depress downward, with an almost unheard of amount of hydrocarbon dense rock lying in laminated, normally fractured sheets like drywall plaster. What this means is that Devonian shale in the right circumstances might serve as both source rocks and oil and gas traps (seals) for a very long time.
This thing that I’ve just described has been named the Rome Trough, and it’s not just any old valley. Grabens tend to be places where great minerals, rare earth elements, and porous hydrocarbon rocks are found. In this case, wells on the edge of the Rome Trough may become legendary and the AB could become the granddaddy of them all. It comes with a plus, in that a relatively high percentage of NG in that area is ethane, from which polyethelene is made, and as it turns out most of the polyethelene in the United States is manufactured nearby.
I don’t own one piece of the AB, which is my fault, so I can say without any bias that this is most definitely not by-product gas like has become such a headache in the Permian. This gas is just trapped everywhere in these shattered laminates. Geologically, it is a wonder unlike any else that I’m aware of, and my personal sense is that it will be producing full force long after the other gas basins have been put to bed.
Everyone on this board is used to thinking NG in solution and in the rock, and when the reservoir pressure falls below a certain level, the bubble point is reached and gas comes out of the rock and that’s about all she wrote. Well, the AB doesn’t adhere to those dynamics, because free NG is lurking in these laminates. Additionally, about the best thing a person can hope for is a water-drive system, whereby a deep aquifer lifts hydrocarbons to the surface, and if the aquifer is recharged continuously, it just keeps raising them. If more hydrocarbons are simultaneously diffusing into anticlines and laminates, the continuously-rising aquifer will bring up oil and gas for a very long time–until everything in the vicinity is depleted. The Rome Trough has such a system.
I believe the Appalachian Basin in its entire length could serve NG to our country for as long as we need it. In the USA, it is unique and magnificent. It has been lost in the mechanics of the other shale basins. There are other grabens in the USA (Lake Tahoe sits in one–that’s what ushered in the Gold Rush), but nothing quite like this one. I would imagine that Coffeeguyzz can jump in here and enlarge on this a great deal. As grids begin to go black, the AB is going to become a savior–in my opinion. And while I love the USGS, I don’t think they have an idea of the extent of this giant basin.
Hi Gerry,
Interesting, thanks. So in this case you expect the USGS does not understand the geology and geophysics of the Appalachian basin and is underestimating the resource, whereas in other basins their lack of understanding leads them to overestimate the resource? Not clear why that would be, I am not a geologist, geophysicist, nor a petroleum engineer. I am simply basing my thinking on the studies the USGS has done.
Note that the USGS has its mean well at 147 acres with an EUR of about 3 BCF, if the average Marcellus well has a 15k lateral and is spaced at 1320 feet (4 wells per section width), that is about 454 acres per well, about 3 times as many acres so perhaps 9 BCF EUR.
There were about 5.2 million net acres in the best 3 assessment units for the 2019 USGS Marcellus Devonian study, with perhaps 7.2 BCF EUR average for 15 k lateral wells spaced at 1320 acres, that is space for about 11500 wells in high productivity areas or roughly 83 TCF of resource. This does not include the Utica. Utica adds another 109 TCF for mean TRR estimate for Pleasant Point. So about 200 TCF total based on 2019 assessments of Marcellus and Utica. Output in May 2023 was about 20 BCF/d according to Novilabs for Pennsylvannia Appalachian Basin or about 7.3 TCF per year, at steady output that would be about 27 years.
In my view it would be better not to rush to export as much as we can, Mike’s advice to conserve the resource for use by North Americans seems wise.
Do you have an estimate for the URR?
Deep hydrocarbon deposits are related to Cambrian river deltas, namely the Cambrian “Kerbel Delta” and other mirror delta systems underneath the Kerbel that have not been mapped yet. High ground at Eastern kentucky due to a pre cambrian rift meant that Eastern Kentucky Rome Trough is lean of deltaic deposits throughout the Cambrian period, where failed modern Rogersville shale testing occured. The eastern kentucky high ground directed Cambrian delta systems SW centered at Cabell County, WV. Some producible rock in Wayne Lincoln Putnam and Jackson Counties, a small part of Mason County, WV. Its about 400,000 acres in size, but will be very very significant for the companies who develop it. All the conditions come together right there at Cabell south of I64. Find the Cambrian deltas that deposited into the Rome Trough, find the BIG oil and gas!
Hello Gerry,
Deep hydrocarbon deposits are related to Cambrian river deltas, namely the Cambrian “Kerbel Delta” and other mirror Cambrian delta systems underneath the Kerbel that have not been mapped yet. High ground at Eastern kentucky due to a pre cambrian rift meant that Eastern Kentucky Rome Trough is lean of deltaic deposits throughout the Cambrian period, where failed modern Rogersville shale testing occured. The eastern kentucky high ground (mid continent balsaltic rift) directed Cambrian delta systems SW to Cabell County, WV. Some producible rock in Wayne Lincoln Putnam and Jackson Counties, a small part of Mason County, WV. Its about 400,000 acres in size, but will be very very significant for the companies who develop it. All the conditions come together right there at Cabell south of I64. Find the Cambrian deltas that deposited into the Rome Trough, find the BIG oil and gas!
U.S. shale drillers ramp up oil production, calling OPEC strategy into question
This is a fascinating article.
“Operators are squeezing crude out of new wells more efficiently because of innovations in everything from electric-pump technology to new strategies for deploying workers while fracking wells to minimize downtime. A key example has been the replacement of the iconic, decades-old pumpjack with high-tech underground gear as tall as a three-story building that sits inside a well to push more crude to the surface.
On a recent windswept morning in the Permian basin of West Texas, Diamondback Energy Inc. drilling chief Yong Cho stood in a control room part-way up a 180-foot (55-meter) rig as a crew went to work on a fresh well. The company has reduced the time it takes to drill an average well by about 40% over the last three years, thanks in part to boring slightly smaller holes, adjusting the solution that’s pumped down shafts to power drills, and subtle refinements in the steel-and-polycrystalline-diamond-tipped bits.
“In 2019, the average well took me 19.5 days,” Cho said during an interview afterward. “Now it takes me 11.5 days.”
But a shale well isn’t finished when the drilling is done. A separate array of workers and gear is called upon to frack it so that crude can begin to flow. It’s the last and most-expensive part of oil production, and frackers have achieved similar efficiency gains, shortening the process by three days to little more than a week per well, according to Kimberlite International Oilfield Research.
“Every year we’re seeing more efficiency,” Chevron Corp. Chief Executive Officer Mike Wirth said during a recent talk at the Council on Foreign Relations. “And you’re seeing, through a number of acquisitions and consolidations, companies that have the scale to bring these capabilities to bear in a way that just drives further efficiency and industrial kind of progress there.””
Can someone explain “high-tech underground gear as tall as a three-story building that sits inside a well to push more crude to the surface.” Is this a fancy name for a very thin electric submersible pump?
https://worldoil.com/news/2023/12/18/u-s-shale-drillers-ramp-up-oil-production-calling-opec-strategy-into-question/
Sounds like it. They don’t like gas I thought and have quite varying lifetimes. Can we expect an uptick in workovers now??? Cannot be economical I assume.
Ovi,
Micro (time constrained) response …
Look up ‘gas solid separator artifical lift’. Add ‘downhole’ or ‘whaleshshark’ (one company’s product) for more info.
Essentially these are 20 to 30 foot long (sitting vertically) pieces of equipment that assist in the separation of non liquids (gas and/or solids such as sand) with electric submersible pumps at the top.
This setup greatly reduces contaminants and gas locks from inhibiting longer lived pump operation/uninterrupted oil production.
CoffeeGuyzz
Thanks. This sounds like an amazing piece of machinery.
And with all that technology the output per hole is sinking – per foot and absolute (to a smaller margin).
We had these numbers a few weeks ago. The good acres are gone.
https://mishtalk.com/economics/shippers-avoid-the-suez-canal-us-sends-warships-costly-disruptions/
Shippers avoid the Suez Canal. US forms military coalition. Oil up 7%.
Ovi, this is the first I’ve seen of the vehicle you (and I) have been hoping for.
2025 Ram 1500 Ramcharger Avoids the Range Anxiety of EV Trucks-
“Along with a 663-hp AWD powertrain, Ram’s plug-in-hybrid pickup has a 14,000-pound tow rating and targets 145 miles of electric range. With a full battery and fuel tank, Ram is targeting up to 690 miles of combined driving range”
https://www.caranddriver.com/news/a45734742/2025-ram-1500-ramcharger-revealed/
“Unlike the majority of plug-in hybrids, the Ramcharger’s gasoline engine is only used to make electricity rather than directly power the wheels. The Pentastar 3.6-liter V-6 under the hood powers a generator that can be used to power the truck or recharge the 70.8-kWh battery”
Hickory
I agree. 145 miles is amazing.
Yesterday the Cdn govt recognized that Canada has longer distances, colder winters and a poor charging infrastructure. As a result it will allow hybrids to be classified as BEVs. The target is 20% EVs by 2026, 60% by 2030 and 100% by 2035.
Not clear on how the US rules compare.
The one advantage of a serial drive powertrain like the RAM is that the engine will be limited to run in a very small RPM range, say around 2000 RPM where it will operate very close to the engine’s lowest BSFC.
I hope that this setup can be applied to some mid-size vehicles as well.
Good 10 minute video discussion comparing this vehicle to the electric F-150, pros and cons.
https://www.youtube.com/watch?v=fYZ8ncLxQ64
I was listening to Art Berman latest talk on Nate Hagens podcast, which was mentioned above, during which he claimed that the EUR of recent wells in the Permian had declined by about 50% compared to the 2018 wells, but i cannot reconcile this to what i see on Novilabs latest Permian update: the 2023 vintage seems to still belong to the higher range.
See the ‘well quality – Cumulative production profiles’ section on the embedded Tableau extract here: https://novilabs.com/blog/permian-update-through-july-2023/
What am i missing?
Skeboo,
Sometimes Art overstates things. I don’t think you are missing much. Productivity is down since 2021, but still higher than 2018.
Skeeboo
I listened to Art also and I played that segment back many times because it didn’t make sense to me. Eventually I decided that he said “have” not “half”. Try listening again, I think it was around the 25 to 30 minutes.
I also need hearing aids and find it difficult to discriminate some words.
Thanks for the comments everyone…
@Ovi I don’t think so, see the notes Nate posted along with the video (https://static1.squarespace.com/static/61d5bc2bb737636144dc55d0/t/6578aa2ce57fa31bcd5f5e8b/1702406702668/TGS+SLIDES+NOV+2023.pptx.pdf). They summarize Art’s main findings and it does show a graph (page 8) with a 50% decline (from 305kb to 154kb) of the EUR between the 2018 and 2023 vintage. I would have liked to be able to post the screenshot in my original message but for some reason i couldn’t…
if it is indeed 50% decline between 2018 and 23, then the well drilled and completed can not make it up the new highs in 2023.
Art also overstated the cost of the wells and basically put all wells underwater even with 300Kb EUR.
Art sometimes makes statements that aren’t strictly in his lane of expertise,
with inaccurate simplifications.
I suppose we all do that.
Nate had him on a few months ago, and his simplifications about oil refining were disappointing.
He had nothing to offer about refining flexibility capabilities.
New posts are up
https://peakoilbarrel.com/opec-update-december-2023/
and
https://peakoilbarrel.com/open-thread-non-petroleum-december-20-2023/
[…] World crude + condensate (that is: real) oil production in 2023. Green line: confirmed data (till August). Red line: prediction by EIA. Source […]