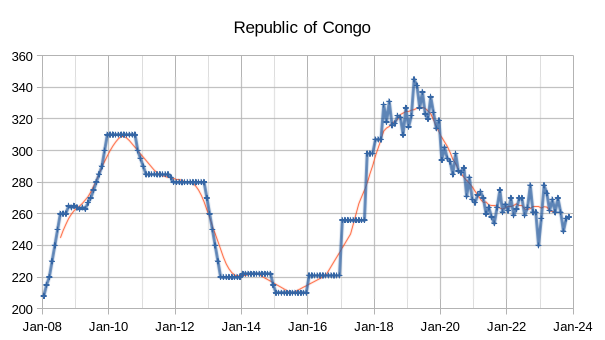
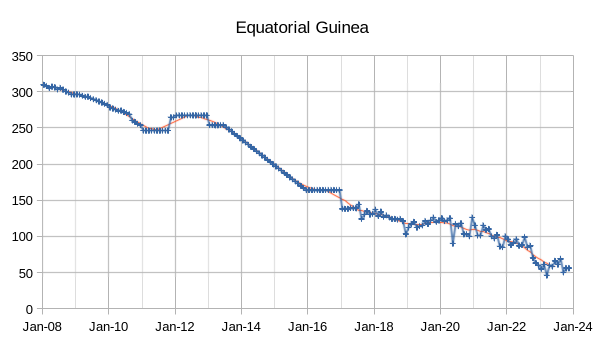
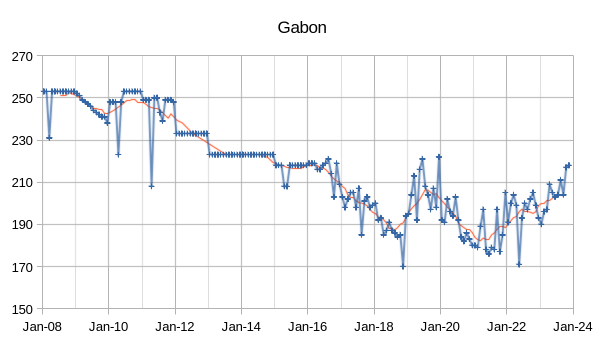
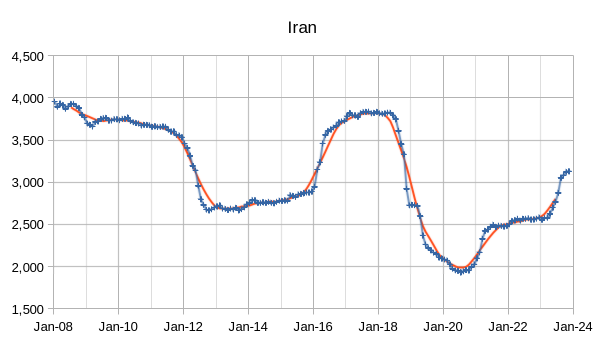
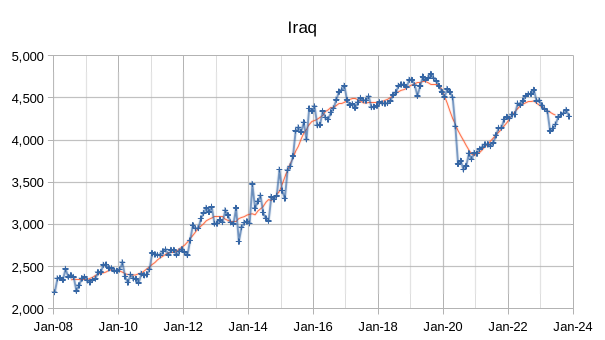
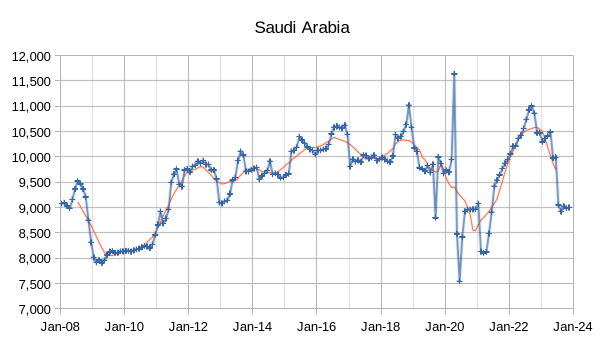
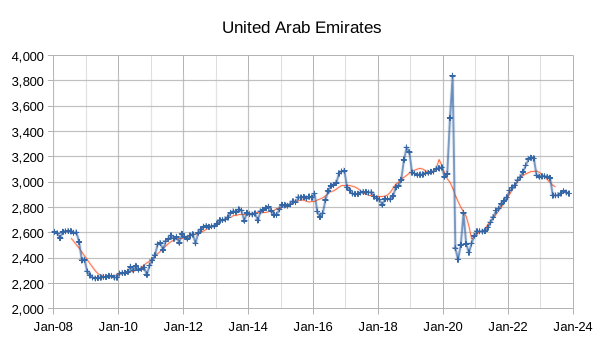
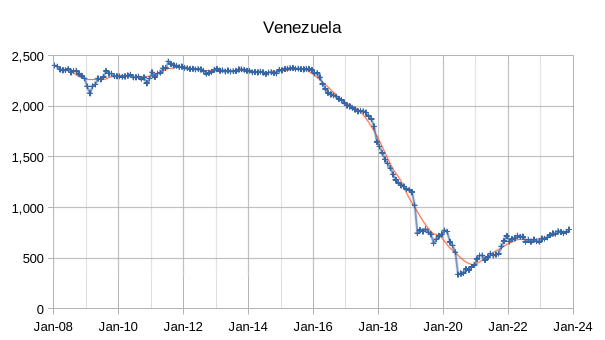
The OPEC Monthly Oil Market Report (MOMR) for December 2023 was published recently. The last month reported in most of the OPEC charts that follow is November 2023 and output reported for OPEC nations is crude oil output in thousands of barrels per day (kb/d). In many of the OPEC charts that follow the blue line with markers is monthly output and the thin red line is the centered twelve month average (CTMA) output.
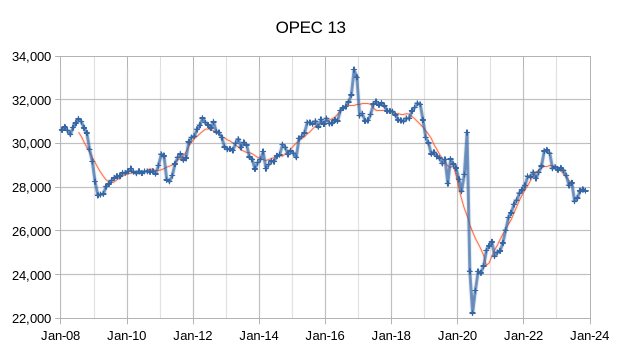
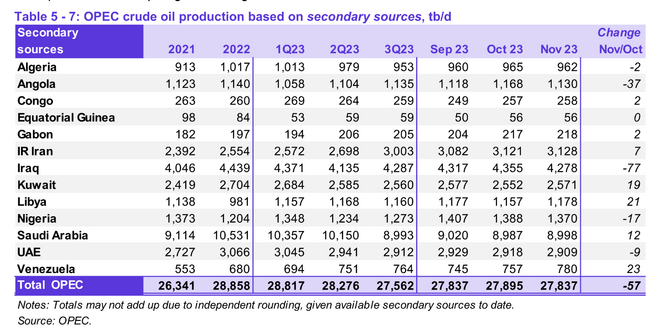
OPEC crude output was 27837 kb/d in November, output for October 2023 was revised lower by 5 kb/d compared to last month’s report and September 2023 OPEC crude output was revised higher by 17 kb/d. There were also revisions in quarterly and and annual data from secondary sources compared to last month’s report. When the World was at its CTMA peak for C+C output in 2018, OPEC crude output was about 31300 kb/d and by November 2023 OPEC crude output had fallen to 3463 kb/d below the OPEC output at the World C+C CTMA peak in 2018.
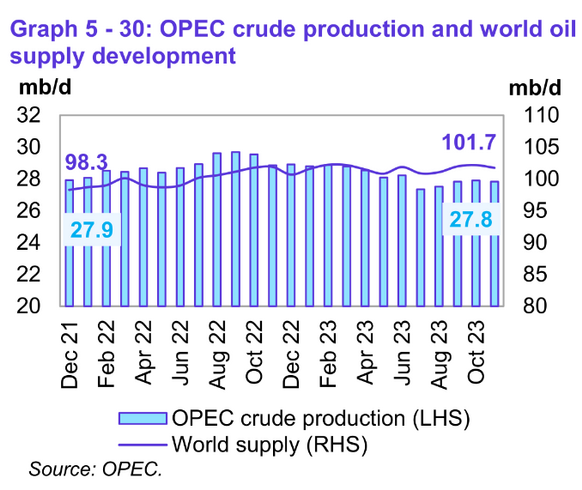
Preliminary data indicates that global liquids production in November decreased by 0.4 mb/d to average 101.7 mb/d compared with the previous month. Liquids supply was 3.4 Mb/d higher than 23 months earlier and OPEC crude output was 0.1 Mb/d less than 23 months earlier.
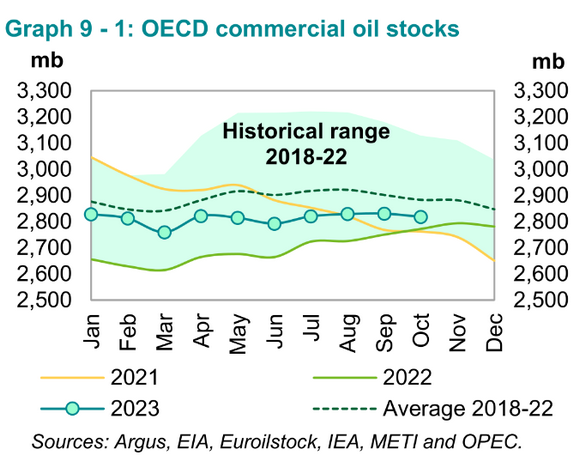
Preliminary October 2023 data show total OECD commercial oil stocks down by 12.8 mb, m-o-m.
At 2,818 mb, they were 45 mb higher than the same time one year ago, but 66 mb lower than the latest five-year average and 128 mb below the 2015–2019 average. OECD commercial stocks remain near the bottom of the 5 year range.
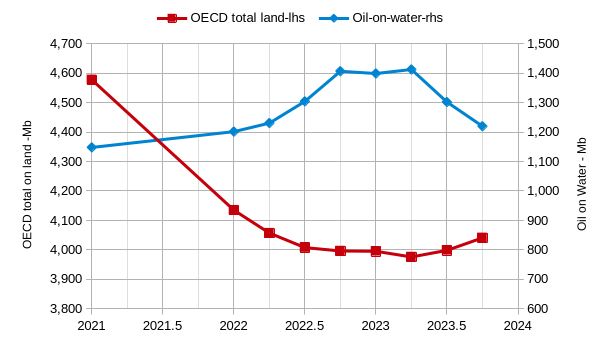
OECD stocks appear quite low at about 88 days of forward supply, but note that the dark tanker fleet might result in more oil on water than reported here, though it is possible that tracking company data is used to fill in the oil on water estimated to exist in the dark fleet. There are also a lot of oil stocks in non-OECD nations (3700 to 4200 million barrels) that we do not have a clear picture on.
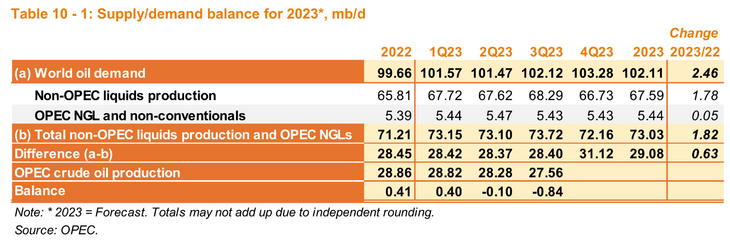
If OPEC estimates for World oil demand and non-OPEC output are correct and OPEC cuts output by as much as stated in the “voluntary” cuts recently announced, then there will be a strong draw in oil stocks over the next few quarters. So far in Quarter 3 of 2023 oil prices have been fairly subdued so the market does not seem to think the OPEC demand estimates are correct, or the market believes that supply is higher than estimated by OPEC, the EIA and the IEA.
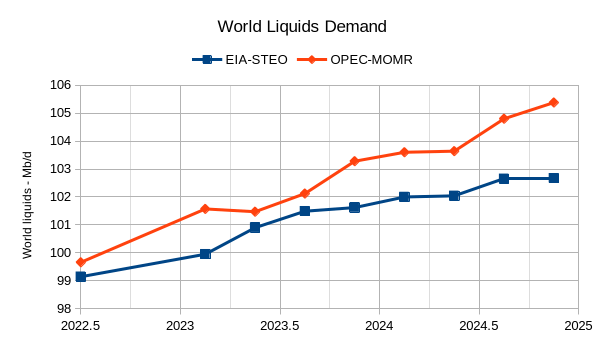
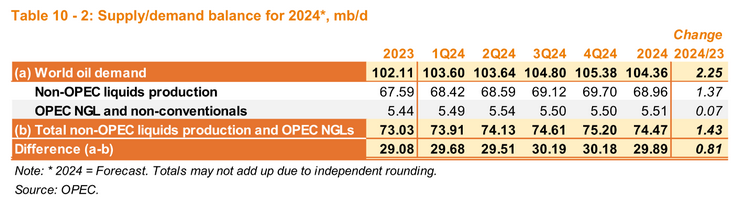
The chart above compares the World demand for liquids from the EIA’s Short Term Energy Outlook and the OPEC MOMR, there is a 1.5 to 2.5 Mb/d difference over most of the period from 2023Q3 to 2024Q4 with OPEC demand estimates higher. Based on announced cuts by OPEC it seems they do not believe their demand forecast or they think non-OPEC output is higher than they estimate.
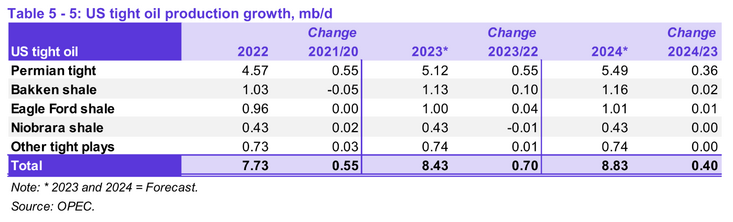
OPEC has revised its US tight oil forecast a bit higher than last month by 30 kb/d in both 2023 and 2024.
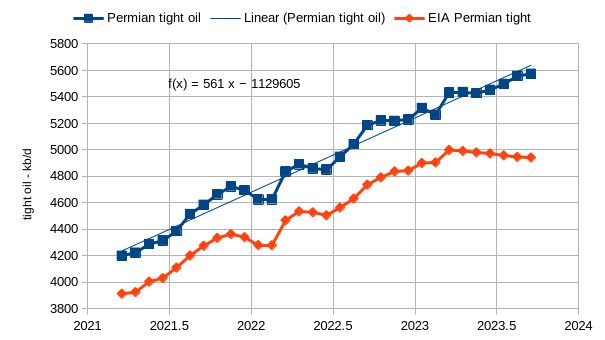
The Permian tight oil estimate above uses Novi labs data, Texas RRC data, New Mexico OCD data, and EIA 914 data to arrive at the Permian tight oil estimate. The Official EIA tight oil estimate for the Wolfcamp, Spraberry, and BoneSpring formations of the Permian basin is presented for comparison. There are a number of formations missing from the EIA “official estimate” that are included at Novi labs.
Only some of the difference between the estimates is explained by the missing formations in the EIA data set, about 200 kb/d of a 400 kb/d difference in March 2023. In September 2023 there is a 600 kb/d difference between my estimate and that of the EIA, some of this difference may be due to higher output from these other formations since March 2023, but I have no further information since the last post at Novi Labs on November 8, 2023. Often the final few months of data at Novilabs is incomplete, so I do not use the data beyond March 2023 from the most recent (November) post at Novi Labs.
193 responses to “OPEC Update, December 2023”
Charles/Ron/Dennis
Here is some information to clarify the discussion on world oil production. Data is from the OPEC MOMR and STEO.
December 2018 MOMR: Q4-18
All Liquids production: 100.6 Mb/d
US all Liquids: 17.2 Mb/d
World All Liquids W/O US: 83.4 Mb/d
December 2023 MOMR: Q4-23
All Liquids production: 101.7 Mb/d
US all Liquids: 20.3 Mb/d
World All Liquids W/O US: 81.4 Mb/d (2 Mb/d less than in 2018)
Attached is a chart of US NGPLs obtained from STEO by subtracting C C from US All Liquids. As can be seen, US All Liquids continues to climb and has added 2 Mb/d from November 2018 to August 2023.
While World liquids from Q4-18 to Q4-23 is up by 1.1 Mb/d, World Liquids W/O US is down by 2 M/d. It is the continuing large increase in US NGPLs that is causing the confusion. So if US NGPLs had not grown by 2 Mb/d over that period, World All liquids would be down by 2 Mb/d.
Not sure how this post got here. It has been reposted at the bottom, where it belongs.
A very short description of the billion prices project
https://news.mit.edu/2011/billion-prices-inflation-0114
now pricestats does the same
https://www.pricestats.com/inflation-series?chart=1837
The shadowstats stuff you will not find in peer reviewed journals, and the reason is that it is not good data.
Dennis,
What do you think of PCE vs CPI? Do you think CPI-U overstates inflation?
Nick G,
The best measure depends on the question one is trying to answer. I like PCE as that’s what the Fed focuses on. CPI-U is probably ok if you look at most recent 6 months and then annualized. For the most recent 6 months of CPI-U data this worls out to about 2% inflation. The reason for 6 months rather than 12 months is due to lags in the data, particularly for housing costs. See recent Krugman opinion piece
https://dnyuz.com/2023/12/19/how-lags-in-statistics-skew-the-inflation-picture/
Original piece for NYT subscribers (which has diagrams missing from free piece linked above) at link below
https://www.nytimes.com/2023/12/19/opinion/inflation-statistics-economy.html
FED is focused on the banks that are about to be obliterated. That’s how they go from higher for longer on Dec 1st to 3 rate cuts in 2024 just 2 weeks later.
None of the banks that are in the FED’s current bailout program are able to pay it back. And the total amount just keeps going up. The banks can’t write the CRE loans down without going bust. So they are facing having to fire sale properties into a market with not enough buyers.
Yield curves got this right. They just don’t say to the exact day the bottom falls out.
The banks are insolvent. Because the collateral isn’t worth its face value anymore.
HHH, Have you seen the book The Great Taking.
https://thegreattaking.com/
He his hammering the same thesis as you.
Never heard of him. But I want to be clear. I don’t think central banks have the powers that everyone believes they have.
Central banks can buy assets from commercial banks but that doesn’t increase the money supply. In fact the opposite. Those MBS securities once moved onto a central bank’s sheet can’t be used as collateral anymore.
Collateral to make new loans. Treasury bills are a different story as commercial banks can park cash at the FED’s RRP or reserve repo facility to borrow collateral. Which is part of the process that allows the same collateral to be used for 15-25 different loans.
Furthermore just because central banks buy assets during a crisis doesn’t necessarily mean the commercial banks will have the ability or balance sheet capacity to loan new money into the economy to get it moving again.
What happens to big tech stocks if they can’t get loans to do more stock buybacks? Same thing that will happen to oil producers that can’t get loans.
Unfortunately central banks aren’t liquidity providers of last resort. Bank reserves created by central banks just don’t matter. They never leave the central bank’s balance sheet and make it into real economy.
Commercial bank lending is what matters. And commercial banks don’t need bank reserves that the FED and other central banks create out of thin air to make loans into the economy.
It just doesn’t matter how large a central banks balance sheet gets because it just a interbank tokens that never leave the banking system.
Just look at 30 decades of Japanese QE. The shit doesn’t work. Because it’s not actually money printing.
It took a global pandemic and massive supply chain disruptions just to get inflation to 3% in Japan.
There is no increase in the money supply when a central bank buys an asset from a commercial bank.
Now if the central bank bought an asset from an entity within the economy that isn’t a commercial bank that would be money printing as it would create new deposits on the balance sheets of non bank entities within the economy.
Central bank reserves are collateral, as good as a suitcase full of cash.
Banks need reserves to do lending as the lenders want to spend the money and not admire it only in the bank. Interbank payment is done with reserves.
But yes, they need only an amount corresponding to their lending. And they get them mostly by money inflow, not central bank lending. When the economy is slow and nobody is solvent enough to take out a credit, banks don’t need additional reserves and so re
creating more doesn’t help lending.
In the past lowering rates meant more people can take a credit. But when everyone is already full with credits (at least companies), interrest needs to be lower and lower to put new credits on top of the old ones.
We see here in Germany this at the moment – the construction industry is coming to a full stop because of too expensive credits. It’s not full developed yet since there are still projects done that are financed before the credit problems.
So the Japan scenario: the low interest rates aren’t for expanding the economy – they are to avoid a full scale collapse and money reset. Kicking the can down the road. Perhaps at some time there isn’t enough road left.
I’d rather have the suitcase of cash. Last time I checked bank reserves are kind of like Gold in a way.
Go to your local grocery store and offer them bank reserves, gold or cash and see which one
Is acceptable as payment.
Treasury bills are a superior form of collateral. Used to borrow money in the actual economy. Bank reserves are an inferior form of collateral that aren’t used in REPO markets as collateral to borrow and create new money.
There simply is no demand for bank reserves in the real economy. Zero demand.
Heck at least you can borrow against gold in real economy. That can’t be said for bank reserves.
Banks don’t need bank reserves and never have needed them in the history of banking. Commercial banks have been creating money for a long time without there being any bank reserves involved.
HHH,
The Fed influences lending rates when it sets the Fed funds rate. Since the Fed started raising the Fed funds rate, the Prime rate, 30 year mortgage rates, auto loan rates etc have all risen. If you think this has no effect on the economy you are mistaken. The reduction in demand that results from thise interest rate increases will tend to reduce economic growth rates and reduce inflation. It is not only about banks willingness to lend, it is that demand for credit is reduced when the cost of borrowing increases.
Dennis, I don’t recall saying anything about interest rates. But since you commented I’ll comment back.
Fed has some influence on the short end of the yield curve. Long end however is controlled by growth and inflation expectations.
You see the 10 year hit 5% then abruptly go back below 4%. That’s the market telling you that neither growth or inflation are expected to be strong.
When the 2 year turns and goes much lower due to lack of growth and inflation expectations. That’s when the FED starts cutting interest rates. Growth and inflation ultimately determine what the interest rates are. FED has influence over the 2 year but not control.
No growth, the interest rates head down to spur lending. Here is the problem though. Europe is facing an enormous wall of debt that will have to be refinanced at higher rates in 2024.
When that doesn’t happen. Business go bust leading to layoffs. In the UK in particular because of the way they use short term financing to buy a house. A lot of these home loans coming due will have to be refinanced a multiples of the interest rates they currently have.
Europe will be back at zero interest rates in 2024 because the market will force the issue. Not because the central bank knows what the heck is going on and has the tools and foresight to fix anything. Last thing the ECB and BOE said was higher for longer. They either don’t have a clue or are intentionally misleading everyone. Take your pick. It doesn’t matter.
The interest rate hikes were just a political move that shouldn’t have been made. But central banks got to look like they are relevant.
Now that the FED is expecting to cut rates in 2024 there is nothing in the way of interest rates going where the would naturally want to go which is lower much lower.
Safety and liquidity will be in high demand so regardless of how many treasuries the treasury issues rates go down not up.
The commercial banks are well aware of the state of the economy as they loan all the actual money into the economy. Commercial banks will be buying treasury debt instead of making loans.
Low interest rates aren’t stimulus though. They are a sign of low growth and inflation. Rates have to be low in order for any growth and inflation to occur.
But like I’ve said many of times before on here. Globally the problem is dollars liquidity. Eurodollar banks which are large commercial banks aren’t very enthusiastic about lending dollars in the current financial climate. And since there is something like $100 trillion dollars of dollar denominated debt that exists outside the US that is involved in global trade and global finance that is a problem.
The demand for dollars is huge. While supply of dollars is being constricted. Need high velocity or expansion of credit to service the debt. I’m not sure interest rates can go low enough to spur enough velocity or growth to service the debt.
That’s why is see deflation when almost everyone else only sees inflation.
We live in a global economy where banks in the US are exposed to what happens outside the US. While banks in the US don’t have lot of direct exposure to say China. Bank in the US do have a lot of exposure to Japan which Japan has an enormous exposure to China as Japanese banks loan heavily into China.
A crisis anywhere leads to a crisis everywhere.
If the water ways of the world are allowed to be disrupted maybe we see some temporary price hikes.
But that also would lead to less demand and lower prices as banks would become even more risk adverse.
Here is graph from this book. Velocity of money has been decreasing since 2000, as was from 1900 to 1930. Deflation coming.
HHH,
Yes you did not talk about interest rates, but they are important and the Central Banks do control short term rates and these tend to influence longer term rates along with the state of the economy which both is affected by interest rates and in turn influences those rates, a two way street as it were. The macroeconomy is complex, there is more to it than just money supply.
Seppo,
Updated money velocity at link below we are nearly back to 2019 levels for US economy.
https://fred.stlouisfed.org/series/M2V
Dennis, the money supply is in an actual contraction. It expanded 10% yoy during the 2008-2009 time frame. Ditto for 2009-2010.
Only other time the money supply has contracted like it is doing now was during the Great Depression.
It’s only a matter of time before all the interest rates are back at zero and in some cases negative. Likely happens in 2024 calendar year. Again the over 100 basis points of inversion all across the yield curve have been ringing the alarm for over a year now.
Nobody can say that they weren’t warned. Some just refused to listen or pay attention. This time definitely isn’t different.
Dennis, the velocity of money did not decrease monotonically in the early part of last century. I wonder if you have read the pamphlet of Irving Fisher on the Debt-Deflation theory of the Great Depressions (not the plural). It shows the cascading nature of how the world sinks into a depression.
Remember the savings in loan crisis back in the late 80’s early 90’s? Over 3,000 banks went bust.
Most people don’t remember it because during that time bank credit, Eurodollar credit was expanding massively. That’s why it really wasn’t a big deal that 3,000 banks went bust.
Totally different ballgame today.
I met David Webb a few times many moons ago. Even back then he thought the sky was falling.
He doesn’t seem to grasp that the whole point of central clearing is to reduce systematic risk, ESPECIALLY when it comes to derivates. The sim of all derivatives is zero – for every long there is short. By centralizing clearing, and requiring both parties to put up collateral for the privilege of being on the exchange, the system as a whole is over collateralized. When there are drastic moves the level of excess collateralization is increased, not decreased. The idea that these central clearing houses are going to take all the collateral and then run the world is just conspiracy BS.
Regarding dollar shortages – dollar deposits are created through lending so any shortage ( how does a dollar shortage manifest itself anyway?) can be alleviated through increasing lending.
• There is no doubt that banks are looking at taking hits on the CRE books but looking at the numbers it seems to be painful but manageable: Federal Reserve Board, H.8 Release, “Assets and Liabilities of Commercial Banks in the United States”
• Date: October 27, 2023
• Table: Commercial Real Estate Loans, All Commercial Banks
• Value: $3.82 trillion
• Percentage of total bank loans: 10.6%
https://www.federalreserve.gov/releases/h8/current/default.htm
So even if those loans lose half their value ( which seems a really bad scenario) it would amount to around 5% of their capital. Tier 1 stands at 12.4% which is in excess of the 8% requirement.
So the world may not be ending, especially if there is time for banks to take reserves over the next couple of years.
Rgds
WP
Thanks for your comments WEEKENDPEAK. I have been aware of the derivative complex having a large notional value and the cancelling effect. I also had the feeling that David Webb appears to have a stance of a paranoid. But, he does recount what has happened over the last twenty years, namely ownership rights have been weakened and this has been harmonized with US and EU. Having stated that, I have not yet investigated whether his claims in this regard are true or not.
We will begin to hear stuff like monetary conditions are easing because yields and or interest rates are going lower.
FED has conditioned the market to equate lower interest rates with easing and higher interest rates with tightening. Which is completely false.
Lower interest rates equals nothing good and tighter credit and lending conditions. While higher interest rates equals easier money and more growth and inflation. Reality is in fact the exact opposite of what we are told.
So for the moment markets are trading on what they are told to believe. Dollar is going lower because people are acting accordingly to what they have been told.
But in the real economy as rates go lower. Credit becomes harder to get not easier. And the economy slows. Which ultimately leads to there not being enough dollars. Because money continues being destroyed every month as payments are made on old debts while new debts aren’t being made at a rapid enough pace to keep the money supply expanding.
We are heading straight into a depression. Debt levels are way higher than they were say 5 years ago. Unplayable debts will start piling up creating a cascade of unplayable debts.
That’s what a dollar shortage looks like. And globally it’s not just a dollar shortage. There will be shortages in different currencies for the same reasons. It’s just the amount of dollar denominated debt is huge compared to everything else.
Some small country. Can’t remember exactly who off the top of my head at the moment recently defaulted on their Euro bonds. Meaning debt that was denominated in Euros. So unless the commercial banks start expanding credit everywhere we are going to see debt defaults everywhere.
Why exactly are commercial banks going to be willing to extend credit? Answer is they’re not which is why the money supply is shrinking.
When the old loans you have issued are getting defaulted on it’s hard to make new loans. Banks start going into survival mode and not lend. They start loading up of safe and liquid US treasury debt instead of making loans.
Something else I think we will see is while for now currencies namely the Swiss franc are getting so called safe haven flows.
That will reverse when people have no choice but to liquidate their banks holdings to meet margin calls and debt obligations. Meaning they are unable to borrow more to meet debt obligations. So banking centers of the world get drained of deposits. When we get to that point there will be no doubt shit is hitting the fan.
HHH,
For the US things are not looking too bad as far as delinquency rates
https://fred.stlouisfed.org/series/DRALACBN
For US real money supply, also not a problem
https://fred.stlouisfed.org/series/M2REAL
For the World money supply we have
https://data.worldbank.org/indicator/FM.LBL.BMNY.GD.ZS
“Money supply” is a bit of a misnomer. It implies that there some kind entity out there which is an independent economic actor and that has the power to just create deposits, in other words, that deposits are exogenous, like it was in the days of gold certificates etc. In reality deposits are created endogenously, through lending, so the quantity of deposits is the same as the quantity of loans that are outstanding. Therefore, the quantity of deposits reflects the desire of people to pledge and liquefy assets.
https://papers.ssrn.com/sol3/papers.cfm?abstract_id=4637150
And more always is required to payback because the interest expense that was never loaned into existence in the first place.
We need high velocity or increasing debt in order to service existing debts. Money has to circulate otherwise existing debts are in fact unplayable.
An example of tight money is when say collateral like CRE mortgage backed securities are rejected for loans due to falling values.
Or when banks are upside down on treasuries they bought because interest rates went up. Banks inevitably have a lower balance sheet capacity to make new loans. They are in fact balance sheet constrained due to collateral.
Over a decade of low interest loans are a big part of the problem. A much smaller amount of interest is left over after debt is retired. Which means a lot more loans need to be made in order to keep money supply growing and out of contraction territory.
Weekendpeak,
Of course, but the claim is the money supply is shrinking, for the US at least that is kind of true, but it is falling from a very high level after rising rapidly during the pandemic, basically back to trend. My understanding is that the Fed can affect the supply of money to some degree by buying and selling treasury bills and notes. It also affects the price of short term debt by setting the Federal funds rate which will affect demand and supply for loans as will expected future economic conditions.
Dennis –
When the Fed buys treasuries through their open market operations, they increase the reserves that banks have at the Fed. As HHH always correctly points out reserves are never lent out to the public so that act of purchasing treasuries by itself does not increase the quantity of deposits in existence. However, where do the banks get the treasuries from that they sell to the Fed? In reality, most of those treasuries are purchased by the banks from the general public. The way the mechanism works is that when the Fed puts out a tender offer to buy X billion of a particular CUSIP, or range of CUSIPS, they very often offer to buy at VWAP plus 1/32. WVAP stands for Volume Weighted Average Price – the weighted average price at which those CUSIPs traded during the day. So at around 4PM EST the VWAP is known and all the trades settle. The trades where the banks will settle at WVAP and the trades that the banks have with the Fed will settle at WVAP plus 1/32, so it really represents an almost risk free trade for the banks, paid for by the tax payers. The consequence of this transaction is that the first order sellers of said treasuries now have a deposit as an asset rather than a treasury, so they are extremely likely to use those deposits to purchase other either treasuries or other interest bearing instruments. This tends to put downward pressure on yields. So indirectly the Fed can potentially increase the deposit base but the relationship is somewhat squishy and they certainly can’t directly increase the deposit base.
So taking all the stuff above into account it makes sense that when the Fed allows their balance sheet to run off the quantity of deposits decreases, but it is not a 1:1 relationship.
When you look at M2 from 07-2022 (21.7T) to 11-2023 (20.7T it declined by 936bn (4.3%). The Fed’s balance sheet over that same time period decreased from 8.9T to 7.7T (1.1T or 13%) so although the two dataseries move in the same direction the magnitude is quite a bit different – because deposits are created through lending, not just Fed open market operations.
https://fred.stlouisfed.org/series/WALCL
https://fred.stlouisfed.org/series/M2SL
HTH
Weekendpeak,
Yes the relationship is not one to one the effect tends to be multiplied.
I’m going to also point out a problem that the Central Banks are going to run into. A lot people/entities within the economy have locked up debt yielding 4-5% returns. That aren’t necessarily going to sell their treasuries at any price. Think insurance companies and retirement funds.
Most of what the FED will be buying will be directly from primary dealer banks.
And the biggest problem I see will be the available debt will be mainly short dated treasuries and T-bills. Which is a problem because when the central bank buys the short end of maturities it leads to shortages of collateral available for commercial banks to create new money.
I’m gonna call it: US shale starts declining in 2024.
I’m not a pro like you guys but look at the forecast – it’s anemic at best. No more opm, increased capex and interest rates, and a demand destroying recession on the horizon. This thing is f*cked.
Put a pin in it
Production in the Permian is going to decrease in 2024, but it’s going to do that because there is going to be more restraint. If you were in the board room at Exxon, would you vote to drill as hard as you can and flood the market with natural gas selling for $1.50 in the field, and $60 oil, or would you vote to slow down, let the global market equilibrate, and sell $3 natty and $90 oil? The Saudis have sucked it up about all they’re willing to do, and Exxon knows that.
Exxon doesn’t have much if any debt; they can exercise restraint. Occidental, on the other hand, will be servicing a $28 Billion debt burden. That puts them in a little different camp, but they’ve got Warren Buffett and his crew to help them do the math.
Frankly, this consolidation is the best thing that has happened to the Permian. In my view both companies paid top dollar, but that’s where we are these days.
Thanks Gerry,
How much do you expect that output will decrease? If it does, my guess is perhaps 1 to 2%, but my guess is flat output (-1% to 1% change in Permian output).
5%
That’s the percentage needed to give OPEC some breathing room and account for a modest reduction in economic activity.
The more control Exxon has, the more OPECish the place will run.
And something has to be done with this glut of NG.
Thanks.
Did you see this?
https://www.eia.gov/naturalgas/weekly/
From that link:
West Texas was among the few markets in North America where prices increased this report week. The price at the Waha Hub, which is located near Permian Basin production activities, rose $1.23 this report week, from $0.64/MMBtu last Wednesday to $1.87/MMBtu yesterday. The Waha Hub traded 46 cents below the Henry Hub price yesterday, compared with last Wednesday when it traded $2.09 below the Henry Hub price. Natural gas production in the Permian region decreased 1% (0.1 Bcf/d) this week and flows of natural gas westbound out of the Permian region increased 4% (0.1 Bcf/d), according to data from S&P Global Commodity Insights. Various maintenance events on the El Paso Natural Gas system concluded this week, resulting in increased pipeline capacity for natural gas flowing out of the region. In addition, since September, intrastate pipeline takeaway capacity in West Texas has increased by 1.1 Bcf/d with the completion of the Permian Highway Pipeline expansion (0.6 Bcf/d) and the Whistler Pipeline expansion (0.5 Bcf/d).
It may be that the glut of natural gas in the Permian Basin may have eased a bit lately, if the information above is accurate.
Also on XOM there is
https://www.reuters.com/markets/commodities/exxon-mobil-forecasts-higher-production-2024-2023-12-06/
where the claim is that XOM plans to increase Permian output to 2 Mb/d by 2027. In April 2023, output was about 1400 kboe/d for XOM and Pioneer combined in the Permian basin, so this suggests about a 9% average annual increase in output of oil and natural gas combined over the next 4 years.
Exxon might do that. Depends about 99% on what OPEC+ does.
Exxon is not known to be suicidal.
Gerry,
The 9% per year seems high to me, but then a 5 % decrease in output seems low, maybe split the difference and a 2 per cent increase may be reasonable, I still like -1% to 1% over the next few years, followed by decline (that is closer to your estimate than the split the difference estimate). Oil and natural gas prices will have a big influence on future output, I am assuming about $80/b and $2.50/MCF for NG.
“the production, transport and processing of oil and gas accounted for just under 15% of total energy-related greenhouse gas emissions in 2022.”
Rough indication for EROEI?
I don’t think this means an EROI of 6 (or 7 with renewables) because a lot is burnt before the fuel becomes available to society and should really be counted as reserve shrinkage. However it fits in with an EROI of 10 to 15 and that is too low to support developed countries societies as they are currently structured. Most worrying is how fast this is falling, the lowest energy cost to the world was in the nineties and I think it has doubled relatively since then. Hence societal structures are simplifying, and that means less “stuff” for almost everyone, whether we like it or not. I doubt if there can be much long term planning in such circumstances, everything becomes triage even without counting climate change and environmental degradation impacts.
Does this definition include the end-use energy loss?
When oil is burnt in an an ICEngine only roughly 20-30% of the energy content is successfully utilized.
When Nat Gas is burnt in a power plant the energy loss is in the range of 40-60%, depending if the plant is combined cycle or not. I don’t know what percent of the world natural gas power plants are the more efficient ones.
EROI estimations should include the losses at the end use step, in order to be realistic for comparison purposes.
And another thing is the scale factor at harvesting the energy.
Let’s say an old woman picking up wood sticks in the forest in the median age and a driver of a giant coal excavator have both an EROI of round about 10 – but in the latter case you get much more energy per people involved when doing things in industrial scale.
The pure EROI number doesn’t count this.
I agree, less stuff, involuntary simplification. If you have the resources focus on anything that will make you more resilient while we still have a little wiggle room. The long decent is underway.
Another shortcoming with fossil fuel eroi estimates is the failure to take into account the fact that these fuels often much be transported to the site of their end use…be it a power plant or a vehicle somewhere in the world.
Something like 40% of the cargo tanker volume on the worlds oceans is in the transport of oil, gas, and coal.
Of course, whether it is coal or solar or gas,etc. the electricity transmission to the point of end use is also a part of system eroi of that particular energy source.
My recollection is that EROI estimates do take into account transportation costs. As Charlie Hall has often said, where the boundaries are drawn is important. But the thermodynamic losses are not taken into account. This, as was mentioned in the previous post, is the slack in the system that is taken up as people move from cars to bicycles, i.e simplification.
OPEC Production and Comsumption difference is due to OPEC Oil monthly report including research into how much oil they believe actually gets to the market but does not get officially recorded due to corruption and poor infrastructure. Nigeria as just one example has a barely functioning metering syste.
Anyone who is not sure that is the case can go there and find out.
This goes on in many corrupt countries
https://www.asisonline.org/security-management-magazine/articles/2023/06/fuel-theft-and-cartels/seeking-revenue-cartel-fuel-thefts/
Experts estimate that around 5% of oil products used globally have never been logged due to corruption and poor infrastucture.
It takes people actually on the ground seeing these things for themselves to grasp these facts
There is a black market and fudged numbers everywhere in this market. It’s not only oil stolen, but products, too.
There are a lot of informal tea pot refineries – not strong alone but in sum. And I can’t think every reporting of bigger ones (or the Chinese teapots) buying black oil is exact, too.
As an owner of a refinery I won’t report “Bought 5kB oil, sold 8Kb gas and 6 kB Diesel” when I snatched a juicy Russian tanker.
China reports what China wants anyway.
Pretty sure that the oil produced is accounted for, the refineries cannot produce crude oil products without a crude oil input. So we track crude oil output as a best measure. In the long run consumption will be pretty close to output ( a bit less due to refinery losses, consumption will be about 84% of C+C output for main fuels such as gasoline, diesel, jet fuel and residual fuel at the World level.)
Note that if we assume ( I do not) that consumption numbers are under reported by 5%, then consumption would be 88% of World C plus C output.
We could also look at crude only output as reported by OPEC in their Annual Statistical Bulletin, the main liquid fuels account for about 90% of crude output and about 95%, if we assume there is 5% of underreporting of consumption of liquid fuels.
Statistics are never perfect, but my guess is that the statistics include as much of this missing oil as can be guessed, they might under or overestimate this, impossible to say with any confidence.
“Experts estimate that around 5% of oil products used globally have never been logged due to corruption and poor infrastucture.”
If 5% is correct, why is this even an issue? If it’s always been around 5%, it’s a meaningless concern. And if it jumped from 0 to 5% recently it may generate some curiosity, but not panic.
Paul
I am not panicked, but if you read various investigations from all over the world you get a good idea of the scale and cost.
Russian oil is stolen and falsely accounted from production to final user. China is buying whole tanker loads from tankers hiding their locations. China and others buying illegal tankers and obviously not trumpeting this fact. This is new Russia did not need to do this before Ukraine.
The 5/6 million barrels per day explains how global economy can be $9 trillion higher than 2018 with oil prices as low as they are.
OPEC demand data is probably very close.
Charles,
So you believe that Russia is producing 15.66 Mb/d in 2023Q4? Not very realistic. You seem to like OPEC’s quarterly estimates, in the December 2023 MOMR they estimate Russian output at 9.66 Mb/d and World output at about 100 Mb/d for 2023Q4. There is also the fact that OPEC is producing about 3 Mb/d less than their demand estimate and plans to continue producing at that low level. It seems they do not believe their demand estimate and neither does the World oil market. You seem to be the only one that believes the OPEC World liquids demand estimate for 2023 and 2024.
Some fine print points:
1. There is no such thing as refinery losses, there are actually refinery gains. Maybe you count refinery gases as losses?
2. In addition to the four main fuels, you also have: light naphtas for petchem feedstock, asphalt, lubricants, and petcoke as products.
3. OPEC measure of gasoline, I strongly suspect, includes added oxygenates like ethanol, and also butane, which is significant in the winter blends.
4. Some Residual Oil is sold to be cracked, so this complicates accounting of it as final product.
These are some of the things to consider when doing accounting for refinery input/output.
Kdimitrov,
Yes there are refinery gains in volume, but probably not in mass or energy. I was not really using the term properly. The point is that the primary products which are gasoline, diesel/distillate fuel, jet/kerosene fuel, and residual/bunker fuel are less in volume than World C+C output or World Crude production. Much of the “other products” category are by products that can be put to some use, but are not the main point of crude oil production. Liquid transport fuels are the main point and the volumes are approximately what I have stated based on data from the Statistical Review of World Energy, US EIA, and OPEC ASB.
True Dennis- volume gains at the refinery,
but very large net energy costs in the refining process.
“Refining petroleum accounts for about 4% of the total energy
consumed in the United States and about 15% of all industrial consumption.”
Another research paper I had seen puts net energy cost of refining at roughly 12% of total energy input.
Interesting piece Charles, but mostly descriptive, very little information on the amount of oil being stolen, I read every word. One estimate of costs to Pemex, but that estimate would have included damage to infrastructure so it is not possible to estimate oil or natural gas amounts. The article also lists number of taps, but not information of the volume lost to those taps per year or whether what was tapped was crude oil, natural gas, or a petroleum product.
Article with pics of Syrian illegal refineries.
https://syriadirect.org/how-syrias-makeshift-refineries-poison-people-and-the-land-that-sustains-them-photos/
Terrible
Unfortunately many people in the west know nothing of the desperation and wholesale corruption and criminality in countries like Libya, Iran, Iraq, Syria, Nigeria etc.
They cannot imagine that drilling managers are corrupt or have their lives threatened. That government officials are involved in massive disappearance of oil.
All North Dakota C+C production
North Dakota C+C production was down by 35,000 barrels per day in October.
Ron
With ND down for October, NM running flat and Texas down using September and October RRC data to project October production, I think US October onshore L48 will be down.
Oil prices slip as Angola decides to exit OPEC
NEW YORK, Dec 21 (Reuters) – Oil prices settled lower on Thursday after Angola said it would exit the Organization of the Petroleum Exporting Countries (OPEC), raising questions about the producer group’s efforts to support prices by limiting global supplies.
Brent crude futures settled down 31 cents at $79.39 a barrel. U.S. West Texas Intermediate crude futures fell 33 cents to $73.89 a barrel.
Earlier in the session, both benchmarks were down by more than $1 after Angola said it was planning to leave the group.
Angolan oil minister Diamantino Azevedo said the country’s membership in OPEC was not serving its interests. The Saudi-led producer group in recent months has been rallying support to deepen output cuts and boost oil prices.
“It seems like OPEC is losing the battle to keep prices higher,” said Matt Smith of shipping tracking firm Kpler, noting that non-OPEC producers like the U.S. have stepped up to fill the supply gap.
I had no idea Angola was leaving OPEC. I guess it will soon be the OPEC 12.
Dennis
You comment above “Based on announced cuts by OPEC it seems they do not believe their demand forecast or they think non-OPEC output is higher than they estimate.”
I agree there is something wrong in both the OPEC and IEA projections. To me, it seems the EIA has a better idea of the supply demand balance.
They were showing a large oversupply in October 2023 and that is when WTI started to drop. The EIA is showing a shortage for December a surplus of 750 kb/d in January and then a huge undersupply for February. Maybe that is when world stocks come into balance.
Supply demand looks well balanced after February 2024.
While the EIA supply demand numbers refer to All Liquids, the OPEC supply demand scenario, I presume, is Crude. Not sure how that affects projections.
Ovi,
OPEC also uses all liquids for their supply demand balance. For OPEC plus only they focus on crude, but for most everyone else they only have total liquids numbers and for the World that is the demand and supply number they have in the MOMR.
I agree the EIA STEO estimates look more reasonable than OPEC MOMR estimates for liquids demand.
Dennis
My bad again. Sort of obvious when you look at the numbers.
Could you put up a chart of OPEC – Angola, just to see if it is noticeable or plot both on one chart.
Ovi,
I don’t think Angola leaving OPEC will make much difference, they are likely producing all that they can, so have not really been part of OPEC cuts.
Chart below compares OPEC-13 with OPEC-12(OPEC less Angola). Recent months Angola has been at about 1100 kb/d.
Good Bloomberg article on China:
https://www.bloomberg.com/graphics/2023-china-ev-roadtrip-oil-turning-point/?accessToken=eyJhbGciOiJIUzI1NiIsInR5cCI6IkpXVCJ9.eyJzb3VyY2UiOiJTdWJzY3JpYmVyR2lmdGVkQXJ0aWNsZSIsImlhdCI6MTcwMzI1NDUyMCwiZXhwIjoxNzAzODU5MzIwLCJhcnRpY2xlSWQiOiJTNjFLMEJUMEcxS1gwMCIsImJjb25uZWN0SWQiOiJFQjMzQUE3MEVBN0Q0QjdFOUJEMjRENjc4OTY3NjRDQyJ9.mYE8eZgaw0yz7DTsuD-9tQGf6eadxjmcWbhg_mFHT4w
China has about 35 years of coal reserves left at current consumption. Yet they are rapidly ramping up coal fired power plants.
Will coal imports be able to feed what will be needed? And for how long? Everybody betting on China’s being the manufacturer of everything out pass 10 to 15 years from now to build out renewable energy is in for a rude awakening.
In order to buildout renewable something somewhere will not have the resources to continue on producing. Walmart will need only half the space they currently occupy because there just won’t be enough products to fill all those shelves.
Chinese coal consumption, log scale to show % change. Data from Statistical Review of World Energy
https://www.energyinst.org/statistical-review/energy-charting-tool/energy-charting-tool
From 2014 to 2022 China’s coal consumption grew by a total of 7.69% over an 8 year period, an annual growth rate of 0.93% per year.
In contrast, China’s consumption of renewable power increasd by 443% from 2014 to 2022, an average annual rate of growth of 20.4% per year. If that rate of growth is sustained for another 11 years, renewable energy consumption in China would surpass the 2022 level of coal consumption in China by 2033.
Those numbers sound very impressive Dennis, but growth rates do not always tell the whole story.
Same basic statistics, using the actual increase instead of percentage growth, In China, Solar has grown from not much to 427 Twh between 2014 and 2022.
Coal production has grown by 320 million tonnes from 2021 to 2022, allowing for only 5Mwh/t (closer to mostly lignite than black coal) approximately 1,600 Twh.
Solar total in 2022 is 427.3 Twh while coal increase over 2021 is 1,600 Twh..
Dennis, what is the change in rate of solar growth from 2014 to 2022? Something like a 5 year moving average from say 2009? Is there any basis to think solar would or could continue to grow at 20.4%/yr?
Here in Australia new large renewable projects have all but dried up in the future planning stage as the prices on the wholesale market do not show a positive return when the sun is shining and the wind blowing. Already large renewable producers are turning off their plants, greatly reducing planned for capacity factors, because of negative wholesale prices.
I would expect the same to happen elsewhere when countries with large grids catch up to the percentage of renewables that Australia has.
Batteries are not replacing closed coal power stations to anywhere near the required levels. For example a 2,000Mw power station Lidell, now closed is being replaced with a 1,000Mwh battery
at 500Mw power rate.
The potential output of Lidell of 24,000Mwh overnight capacity, when the wind isn’t blowing, is being replaced with 1,000Mwh battery. What could possibly go wrong??
Hideaway,
I used renewables consumption from Statistical Review of World Energy 2023 rather than only solar. This would include biofuel, geothermal, wind, and solar, absolute change from 2014 to 2022 was 10.88 EJ for China. For coal consumption in China from 2014 to 2022 the absolute increase was 6.31 EJ from 2014 to 2022.
Average 5 year growth rates (trailing 5 year average) for renewable consumption in China in exajoules. Future growth rate is unknown.
Thanks for the graph Dennis, it clearly shows growth rates falling as we would expect. It’s much easier to go from 100mw to 150Mw of solar than to go from 100Gw to 150Gw, both being 50% rises. The former could happen without much increase in inputs in the way of new mines etc, while the latter could involve lots of new building of mines and processing plants.. Of course to go from 1Tw to 1.5Tw will be much harder again and take much longer.
There is no reason to think spectacular growth rates of renewables will continue as the industry matures. As I’ve indicated elsewhere, the growth rate of grid scale renewables is falling off a cliff here in Australia, as there is just no money for new solar farms in particular, as the wholesale price of electricity is negative during the peak sun hours, especially when it’s windy.
Looking at the whole world…. this, from the statistical review is to be expected and ongoing….
“Renewable power (excluding hydro) rose 14% in 2022 to reach 40.9
EJ. This was slightly below the previous year’s growth rate of 16%.”
I would expect this trend of falling growth rates to happen world wide when the price of wholesale electricity starts going negative because of too much solar and wind on grids, while huge amounts of back-up are needed. Investments happen with expected returns, not losses and governments cannot subsidise everything to make renewables look profitable.
Watching the Australian AEMO grid over the next few years will be very interesting, as no-one is planning new generators of any type. They are ALL losing money despite retail prices rising rapidly over the last few years, well above inflation. We have had 2 years of consecutive 25-30% rises, blamed on higher gas prices (gas provided only 5% of electricity production in the last 12 months, and only 1% of the state I’m in.)
Hideaway,
I agree growth rates are likely to fall, but we don’t know in advance to what level. Oil and natural gas output grew at about 7% per year for 30 years and was constrained by the level of demand for more energy output. The demand for energy already exists the constraint is how fast the World can ramp up output of wind and solar and integrate it into the grid. As things scale up we may get better at integrating renewables into the existing energy network and costs for renewables may continue to fall, both of these factors would tend to accelerate the transition, but eventually we will hit a demand limit as we approach 80 to 90% renewable power. In any case I don’t think we can predict what the future growth rate will be, but would certainly agree that 20% is likely to be an upper limit and the scenario I gave was indeed too simple.
Dennis ….. Why not just project the current reduction in growth rate into the future, it’s more realistic than just assuming a set growth rate that is clearly inconsistent with the last dozen years..
There is also the evidence from the Australian AEMO grid where the growth rate of new grid scale renewable projects has fallen off a cliff because there is no profit for new entrants. The penetration of renewables is already so high that the wholesale price of electricity is negative when the sun is shining and wind blowing.
Large scale new projects in Australia have FALLEN by 75% between 2018 and 2023, while lots of headlines about rooftop breaking records among the minor detail of 2023 installations being around 3Gw and below 2020 installations of 3.2Gw.
Australia has the highest penetration of solar and wind renewables per capita in the world, so makes a pretty good model for where the roll out of solar and wind are heading.
Given the problems of large scale wind cancellations, stock price crashes among solar and wind manufacturers, the direction of renewables seems pretty clear after they reach a certain percentage of the grid.
There is zero basis for trying to show a 20% growth rate in the future when the current trend is falling growth rates, much more likely the current trend of falling growth rates to continue, with Australia showing the decline in growth rate accelerating.
Hideaway,
A good idea, I was doing a very quick back of envelope type of scenario. If we do what you suggest for China, all coal consumption in 2022 (88 EJ) can be replaced with renewable power consumption by 2034 (remewable power consumption at 96 EJ).
Dennis, now you are being very illogical. China is clearly building more coal fired power stations which are never going to be replaced with renewables by 2034.
The graph for renewables growth here in Australia is declining rapidly, as renewables get to 35-40% of total grid consumption, and much higher capacity when the sun shines and wind blows, meaning no room for more, unless they want to lose money with the negative prices..
Why would you expect China or anywhere else to be different??
The problem being they can’t turn the coal plants off, as the shutoff and restart times are much longer than 24 hours, because of damage done if the metals contract or expand too quickly, so coal plants need to stay on so they can provide power every night and on the days when it’s cloudy and there is no wind..
If you are looking at one aspect only about growth could be xx%, so A will replace B over time, than you really don’t have any understanding of the system as a whole.
If you do have an understanding of the system as a whole, then you would clearly understand that growth in renewables must crash on economic grounds and you are just being facetious with comments about renewables replacing coal in China by 2034.
Which is it??
Hideaway,
They can stop when they deem best, it could replace some coal and some natural gas, it will depend on prices and whether thay can use a combination of hydro, pumped hydro, solar, wind, and nuclear power in combination that is lower than the cost of coal power.
You claim it cannot be done, but you may be ignoring the price of damage from climate change in your calculations.
Perhaps you are not thinking through the entire picture.
I have read.or heard somewhere that we might just about be on course to provide 10% of energy globally by wind and solar in 25 years (i.e. in time for it all to need replacing). I can’t remember the reference and don’t know the assumptions behind it (I think it assumed some expected growth rate and no issues with raw material supply).
If you only count proven reserves, China has 35 year left at current consumption, although their demand is going to peak soon.
And they import less than 10% of consumption.
Lack of coal won’t be limiting their manufacturing anytime soon.
Top three sources of coal imports- Indonesia, Russia, Mongolia
So if Indonesia the world’s largest exporter of coal And use to be oil exporter is no longer able to get the same amount of oil imports. Then what?
Will the same amount of coal exports continue coming out of Indonesia or will Indonesia use the available oil to do other things besides mine and export coal?
As oil exports trend towards zero the other energy resources will contract in supply.
China is using a shit loads of diesel to transport coal from Mongolia.
So shit loads of diesel just to keep the lights and heat on in China. You know the sun intensity over in China isn’t really all that great when it comes to using solar to produce power.
Solar power in China is like solar power in Germany. It sucks.
Coal to liquids in China would be a dumb idea. 35 years could be cut into 17 years in a hurry.
Lack of coal has already been a problem a problem that will grow in magnitude as available oil exports start their decline.
Diesel to transport coal will become a very limiting factor for coal production.
The only growing supply of oil doesn’t make a lot of diesel.
HHH … “Coal to liquids in China would be a dumb idea.”
They already do some CTG and CTL in China and don’t always call it coal to liquids. The Yitai plant is a 1.2Mt/a ‘coal to fine chemicals’ plant (liquids).. There are several, but it has not taken off in a big way… yet..
Plus of course those like Shenhua CTL.
Like I said- “Lack of coal won’t be limiting their manufacturing anytime soon.”
Indonesia proven coal reserves is about 2% of the world total, yet are enough to give them over 50 years.
The world will be melted before then…by that I mean that climate disruption and economic woes from other causes (like fossil fuel depletion) will already be resulting in a global decline in population. In fact, China population is at or close to peak right now.
HHH
Solar power in China is like solar power in Germany. It sucks.
This is simply a lie. The closer you are to the equator, the better solar tends to be. The far South of Germany is 47 degrees north. near the northern border of China. Only parts of Helongjiang (Amur) Province, on the Siberian border, is that far north.
China stretches down to 18 degrees north. Anyone who claims insolation is similar in the two regions is simply making things up.
But don’t take my word for it, look for yourself: https://www.researchgate.net/figure/Solar-Insolation-Map-of-the-World_fig6_322134423
If you look at the much more detailed interactive Global Solar Atlas ( warning- an addictive experience for those who love geography and associated tools. They have a sister Global Wind Atlas as well) you can get a much better sense of it.
https://globalsolaratlas.info/map
https://globalwindatlas.info/en
The SE section of China (for example Sichuan Provence) has relatively poor solar input considering the latitude, because of heavy cloud cover during much of the year. Similar to Dublin or Oslo in amount of annual insolation.
But the big majority of China has great solar reserve.
Bonus point- the Chinese are bright. They concentrate their PV deployment where the annual insolation is very high.
Non-OPEC will look a little different when Angola is added. The data is C+C through August 2023.
Rig and Frac Report for week ending December 22
Rigs Flat. Fracs Down.
– US Hz oil rigs were unchanged at 455. There has been no change in the rig count over the past three weeks.
– Permian rigs were down 2 to 293. Texas Permian was unchanged at 203 while NM was down 2 to 90. In New Mexico, Lea county was unchanged while Eddy dropped 2. After the rig count rose during November, December has turned in a month of steady weekly drops.
– Eagle Ford was steady at 50.
– NG Hz rigs were up 3 to 107 (not shown)
Frac Count for December 22 Gets into the Holiday Slump
The frac count decreased by 13 to 252 this week. The Frac count may have entered the trend of the past few years when Fracs start to drop after Thanksgiving.
One year ago, 265 Fracs were operating, 13 more than this week.
Drilling in Lea and Eddy Counties
Lea county Rig count was unchanged while Eddy dropped 2 rigs to 41.
Merry Christmas to All, wishing you the best and Hoping for Peace.
🍾🍾🍾🍾🍾🍾🍾
Ovi
Dennis
No I do not believe that Russia is producing 15 million barrels per day.
How pathetic that you have to misrepresent what someone says in order to try and win an argument.
How desperate you Must feel that you must be right.
I have said several times, the total global amount of hidden oil sold Globally is believed to be around 5/6 mb/d.
I have mentioned the studies done of the situation in Nigeria, Mexico, Venezuela, Iraq, Iran, Libya.
OPEC oil monthly is probably stop on and you are not. We are at new highs
Charles, sure some oil is being stolen. But it is likely even more oil was being stolen in 2018 and 2019 than is being stolen today. Those Middle East and African countries have been trying for years to crack down on stolen oil. I have to think they are having some success.
No, we are not at new highs. In August we were almost 4 million barrels per day below our high in November 2018. How desperate you must feel that you must be right. But a person has to be down in the dirt stupid to think there are 4 million more barrels per day stolen today than was stolen in 2018.
One more thing. It is impossible to hide a tanker. Just how would one hide a tanker at sea? Disguise them as a cargo ship? And if you want to hide 4 million barrels per day, that’s about 7 average tankers that must be hidden every day! Gad. Did you just fall off a turnip truck?
Charles said:
We could so easily pull the wool by manipulating the data, but don’t. It’s actually quite the reverse — trying to disentangle what “all liquids” means, explaining what “net exporter” means in the context of domestic refining, keeping track of “reserve growth” updates, inferring missing data, etc. The issue is TPTB and what they want to obscure, and the historical legacy of trade being a con game, ever since the first Arab sold an over-priced rug.
Dennis for years has given details of exactly how increase in gdp has gone hand in hand with increasing oil consumption.
Now he so desperately wants to prove me wrong that he is turning his old mantra on its head.
OPEC oil monthly demand makes sense of the $9 trillion increase in gdp since 2018.
The eieio will catch up just takes incompetent government agency a year or two
Ron
According to several independent investigations in the countries highlighted oil theft is as bad as ever.
Secondly the dark fleet size has tripled since the invasion of Ukraine. Russia, Iran and Venezuela are acting together to load ships and send them to various countries without telling the EIA.
Regarding hiding tankers the experts say it is impossible to track many of these dark tankers as they use very sophisticated methods to hide.
https://www.euronews.com/business/2023/11/16/how-a-dark-fleet-of-ships-is-helping-russia-evade-oil-sanctions
https://windward.ai/knowledge-base/illuminating-russias-shadow-fleet/
If you think It is so easy to find these dark tankers in 139 million square miles of oceans you should contact Windward.
OPEC oil monthly report puts 2023 oil production higher than 2018.
Charles wrote: OPEC oil monthly report puts 2023 oil production higher than 2018.
Now I know for sure that you are full of shit and have no idea what you are talking about. Don’t you know that I have been tracking and recording OPEC production in an excel spreadsheet since 2005? OPEC peaked in 2016. Below is a chart of OPEC yearly average production since 2001.
2016… 31,567,000 bpd… Peak Year
2018… 31,336,000 bpd
2023… 28,153,000 bpd… Average first 11 mths, Jan. through Nov.
Don’t try to snow me about OPEC production. I can tell you what every OPEC producer produced every year since 2005. And I got the information from the OPEC MOMR. So according to the OPEC MOMR, you have no idea what the hell you are talking about.
Ron,
He means World liquids output as reported by MOMR. For 2023 OPEC estimates World Liquids output at about 101.15 Mb/d, about 1 Mb/d higher than 2019 (previous peak for World liquids output).
Like you, I don’t believe World liquids output is as useful as World C plus C output.
If he thinks corn ethanol is oil, then he is even stupidier than I thought. Ditto for propane, butain, ethane, coal to liquids and refinery process gain. These things are not oil, they are either gas or synthetic oil. They have not one damn thing to do with peak oil.
If someone is so goddamn dumb as not to know the difference between oil and bio fuels, bottled gas and other synthetic fuels then their comments should be ignored until they can tell the difference.
Ron
That is just OPEC doh
Biofuels has hardly increased in 5 years
https://ethanolrfa.org/markets-and-statistics/annual-ethanol-production
You ignorant man
What about NGLs, that is what people call bottled gas. They are calling that oil. It most definitely is not oil.
Anyway, oil, that is crude + condensate, monthly production has declined by 3,880,000 bpd per day since November 2018 and world 12 month average has decclined by 1,230,000 barrels per day since January 2019. The 12 month average turned negative in October.
84,580 83,008 Nov.2018 to Aug. 2023
80,700 81,778 Jan.2019 to Aug. 2023
-3,880 -1,230 Barrels per day decline
Charles,
OPEC Annual Statistical Bulletin (ASB) has World non-crude liquids as in chart below, from 2018 to 2022 (last data point) World non-crude liquids increased by 2627 kb/d.
Charles,
You see your quote:
Secondly the dark fleet size has tripled since the invasion of Ukraine. Russia, Iran and Venezuela are acting together to load ships and send them to various countries without telling the EIA.
and
Russian oil is stolen and falsely accounted from production to final user. China is buying whole tanker loads from tankers hiding their locations. China and others buying illegal tankers and obviously not trumpeting this fact. This is new Russia did not need to do this before Ukraine.
The 5/6 million barrels per day explains how global economy can be $9 trillion higher than 2018 with oil prices as low as they are.
You seem to imply that the dark fleet tripilng in size was to accomodate Russian oil, do you believe Russian oil output has increased? How much has it increased?
None of this affects oil produced and oil cannot be consumed unless it is first produced, refined, and then transported. All of this theft or dark fleet shipping occurs in the transport stage either from field to refinery or from refinery to customer. The EIA can get the reports from companies that track the dark fleet, the ships have to load and unload the oil eventually at ports around the World, there are only so many that can handle these large ships and it is easy to tell how full the ship is by how high or low it rides in the water.
Dennis
You obviously do not understand how corrupt countries like China, India etc are.
China government for instance murders it’s own citizens to keep power.
Do you think they think twice about hiding imports of Russian oil?
I think you cannot cope with how chaotic the world actually is, that the data you so desperately believe to be correct is way off the mark.
Things are falling apart.
Charles,
No I just think that it is difficult to hide 2 billion barrels of oil per year, yes government officials are corrupt in many places, including the UK and US (some would say especially in those cases), but I think people have an incentive to track this “hidden” oil and we only know about this dark fleet due to their efforts. Whatever is known is incorporated into output estimates, to think otherwise is to not understand the sophistication of the statisticians involved in making these estimates.
It is quite simple, anything you can find on the internet (that is well documented and fact checked), the statistiticians making the estimates can also find.
Now there is also crap on the internet like the shadowstats.com website that doesn’t pass peer review, that kind of information is rightly ignored.
Charles,
You imply that the main change is the Dark Russian fleet since sanctions on Russia following the invasion of Ukraine, Iran and Venezuela have had sanctions since 2018 and 2017 respectively and it is doubtful that either Iran or Venezuela are producing more than reported by OPEC secondary sources.
Can you tell me who is producing the extra 5 or 6 Mb/d that you claim?
I have mostly focused on the correlation between real GDP and oil output. I adjust my thinking based on data.
The paper you presented earlier would have the following for oil output based on a regression on World C plus C output from 1984 to 2019 and World real GDP growth of 2.5% per year from 2023 to 2050. Uses EIA data for World C plus C output and World Bank data for real GDP.
From 1984 to 2019 the average rate of decrease in oil intensity was 0.00927 barrels per thousand 2015$ of real GDP, I assume from 2023 that the oil intensity decreases by 0.0085 barrels per thousand 2015$ of real GDP.
Dennis
How much oil did study say was needed to produce a thousand dollars of GDP in 2018?
Dennis
Here is the link again
https://www.hks.harvard.edu/sites/default/files/centers/mrcbg/files/Final_AWP_164.pdf
According to the Harvard study in 2019 the world produced an extra $1,000 of gdp with 0.43 barrels of EXTRA oil. This intensity has been falling by 0.01 barrels per year over the last 35 years.
So how much additional oil is needed to increase global GDP by $9 trillion?
What is your calculation in additional barrels per day?
Charles,
I use facts when I have them instead of models. In this case we have data for 2018 to 2022, I will use that below. I tend to use facts to guide my thinking, rather than adjusting facts to fit my model, I adjust my model to facts on the ground. That is how good science tends to be done.
It is not framed as extra oil (the study uses liquids rather than oil), it is 0.43 barrels of oil were consumed for each $1000 of real GDP (2015$) produced. Also note that we do not have a good estimate of World real GDP for 2023, from 2019 to 2022 World real GDP increased by 5 trillion.
The relationship changed due to the pandemic, here is liquids per thousand 2015$ of real GDP 2018 to 2022, using OPEC and World Bank data.
0.4317
0.4187
0.4005
0.4068
So if in 2023 World Real GDP increases by 2.5%, that’s about 2 trillion, so about 0.8 Gb more liquids output would be needed in 2023, which would be about 102 Mb/d, this is more than predicted by OPEC for 2023 liquids output (about 101 Mb/d). As oil intensity continues to fall less and less oil is needed. In this case I am calling liquids “oil”, in fact increases in liquids are mostly due to increases in NGL output in the past 5 years.
I don’t consider NGL to be “oil” most of it is gas at standard temperature an pressure, essentially bottled gas.
Dennis
I have used the facts from the OPEC data. They have total liquids consumption in third quarter of this year at 4 million barrels per day higher than the peak 2018.
Taking away natural gas plant liquids increase and oil is over 2 million barrels per day higher.
OPEC facts fall much better into the historical relationship between oil consumption and GDP.
EIA data cannot be right.
It will be interesting to see what happens when global oil production starts to fall due to geological and other constraints.
You think gdp can suddenly grow by 5 trillion with oil consumption falling by 2 million barrels per day. We will see
Charles,
I am using OPEC estimates for World liquids output in 2023, about 101 Mb/d. Note that there are no facts for 2023 output as we only have forecasts at this point. Consumption estimates always lag far behind output estimates (versus forecasts.) There are no facts for 2023. Also note that peak consumption was 2019 not 2018. OPEC has World demand for liquids at 100.3 Mb/d in 2019. The forecast for 2023 World Demand by OPEC is 102.3 Mb/d, that is 2 Mb/d higher than 2019, non-crude liquids output was 1.9 Mb/d higher in 2022 than in 2019, and in 2022 non-crude liquids output grew by 1000 kb/d, if we assume the same occurred in 2023 non-crude liquids would be 2.9 Mb/d higher than in 2019 and crude demand might be 0.9 Mb/d lower than 2019. We will have to wait for the next edition of the OPEC ASB for better estimates (rather than forecasts).
Also crude or crude plus condensate output or demand is what is important rather than total liquids.
Charles wrote: Taking away natural gas plant liquids increase and oil is over 2 million barrels per day higher….
EIA data cannot be right.
Bullshit! You just pulled that data right out of your ass. Take away total liquids and the Monthly data is 3,889,000 bpe lower than the peak and 12 mth avg is 1,230,000 bpd lower than the peak.
World 12 mth average total liquids is up 897,000 BPD since December 2018.
World 12 mth average C+C is down 1,204,000 BPD since December 2018.
I get my data from the EIA. Where do you get yours? I know, right out of your ass.
The below chart is World Total Liquids less C+C.
Charles,
World demand for transport fuels was 69.4 Mb/d in 2019 according to OPEC and World real GDP was 84.7 trillion 2015$ in 2019. In 2022 OPEC estimates that World demand for transport fuel was 67.5 Mb/d and World real GDP was 89.7 trillion 2015$ in 2022. Real GDP 5 trillion higher and transport fuel demand 1.9 Mb/d lower from 2019 to 2022 based on data from OPEC’s Annual Statistical Bulletin and World Bank real GDP data. Transport fuel is the sum of gasoline, distillate, kerosene, and residual fuel demand as reported by OPEC in the Annual Statistical Bulletin.
https://asb.opec.org/
The pandemic resulted in more people working from home and perhaps more people shopping online, both of which have reduced demand for transport fuel Worldwide.
Charles,
The IEA estimates World demand for liquids at 101.7 Mb/d in 2023 and in 2019 at previous peak for World Demand it was 100 Mb/d. The US EIA estimates 100.9 Mb/d for World liquids demand in 2019 and 101 Mb/d for 2023. The average for both agencies is 100.45 Mb/d in 2019 and 100.95 Mb/d for 2023.
OPEC forecasts 102.1 Mb/d for 2023, 1.15 Mb/d higher than the other two major agencies, for 2019 OPEC estimates World demand at 100.275 Mb/d, slightly lower than the EIA/IEA average demand estimate for 2019 at 100.45 Mb/d. It is possible OPEC has it right, we will know when the new edition of the OPEC ASB 2024 is published in July 2024.
I would note that OPEC’s supply estimate for 2023 is very close to the EIA/IEA average demand estimate of 101 Mb/d. The EIA forecasts World supply in 2023 at 101.62 Mb/d, the IEA forecasts output at 101.9 Mb/d in 2023, and OPEC forecasts World liquids supply at 101.16 Mb/d, a bit lower than either the EIA or IEA. Also both the EIA and IEA have demand slightly less than supply for 2023 which fits better with the subdued oil prices for most of the year and the OPEC cuts that have occurred and been announced. By contrast OPEC has demand at roughly 1 Mb/d higher than World supply for 2023 and is the odd man out in this regard and does not seem to fit the reality of low oil prices and OPEC cuts in output.
Just some facts to chew on.
Charles,
Perhaps for total liquids we are at new highs, but for crude or crude plus condensate, probably not.
Charles.
Here is data from OPEC’s Annual Statistical Bulletin for World liquid transport fuel (gasoline, kerosene/jet, distillate/diesel fuel, and residual/bunker fuel).
Other liquids do matter to some degree when it comes to oil demand in transportation.
Global ethanol production over the past 5 years has been around 25,000 M gallons/yr
https://www.iea.org/reports/renewables-2021/biofuels?mode=transport®ion=World&publication=2021&flow=Consumption&product=Ethanol
Maybe someone wants to calculate how much oil demand that offsets.
Personally, I think that industrial scale biofuel production is an ecological raw deal for living things (recall that we are one those), but that is a different discussion.
Hickory,
I think most of the ethanol is mixed with gasoline and that might be included in the gasoline consumption numbers already, though I am not certain of this.
I did a quick check of EIA international data for gasoline and compared it with the US monthly data for gasoline supplied and the number is the same (exactly) so I would conclude that most ethanol output is reported in the gasoline data (as most of it is mixed with gasoline).
I agree the liquids biofuels output matters and is probably not good for the environment, but most of this may be reported under either distillate or gasoline sales.
Correction biodiesel and renewable diesel are reported separately from distillate/diesel, but of 14742 kb/d of liquid transport fuel supplied in 2022 the biodiesel and renewable diesel amounted to 169 kb/d which is about 1.1% of the total, it helps but the amount is small.
The ethanol is much bigger than than the biodiesel.
I’m guessing it displaces a few percent of global petrol demand…much more in some countries like US and Brazil.
It would be interesting to know how much diesel is used in the farm tractors and the trucks used to transport foodstuffs to ethanol factories which would also be a reasonable number.
I see ethanol production for fuel as a swap of diesel to produce gasoline, in a world where diesel is in short supply and there is plenty of gasoline due to the light oil from the Permian and lots of natural gas condensates being turned into a slight oversupply.
Turning foodstuffs into ethanol, by using lots of diesel, while something like 800M people on the planet go undernourished seems like a poor idea to me. It would be a far better idea on a planetary scale to provide food for the undernourished provided they also took contraceptives of some type to stop population growing in the poor areas, and hopefully decline population over time..
On net energy terms, once the fertilizers, herbicides, pesticides and depreciation of tractors, trucks, ethanol plants, roads, bridges etc are taken into account, ethanol production is probably a net energy loser.
It might explain why ethanol production has tax breaks, loans, loan guarantees and grants, because it can’t stand on it’s own feet economically or energetically which are probably one and the same thing.
And those are some of the reasons why the net energy yield of corn ethanol/acre is very low.
I’ve been following the growing dissension above re’ the dark fleet. Like a lot of people who foolishly invest in the oil business, I have kept an eye on this for over a decade.
My interest began a dozen years ago, when I learned that most large ships used bunker fuel with a sulfur content up to 3.5%, and that this was a mixed bag because SO2 had reflective properties that counterbalanced warming effects of the greenhouse gases but also resulted in an increased number of coastal deaths in high docking areas. Particulate matter named P2.5 was identified; it sticks in the alveoli of the lungs. The IMO got nervous and came up with a plan. They gave ships a lot of leeway to prepare for “IMO2020.”
In 2018, President Trump removed the U.S. from the Iran nuclear deal. In 2019, sanctions were imposed on Venezuelan oil. IMO2020 finally arrived, and it mandated that fuel used on the high seas had to be less than 0.5% in sulfur content, which dramatically dropped the SO2 level but likely also resulted in a rise in sea temperatures. Hanky-panky on the high seas increased in volume. A lot of old tankers were “retired.” Or so they said.
Truth: there is no way in hell for the IMO to monitor this: there are approx. 105,000 ships and 12,000 oil tankers plying the seas of the world. I imagine it would be eye-opening to learn how many tankers didn’t actually install the sulfur scrubbers–just “retired from service.” Things got dicier yet when Russian sanctions went on. According to old wive’s tales, ship-to-ship transfers became almost commonplace, as did the sale of old tankers. I don’t have the exact numbers but I recall that roughly 40 VLCCs, 90 Suezmaxes and 40 Aframaxes older than 20 years of age changed hands, were name-changed and re-flagged in don’t-give-a-shit countries–just in 2022 alone. That’s a lot of large tanker junk on the market! Probably just melted down.
There is absolutely no way of knowing how big this commerce has grown–for a multiplicity of reasons. Most of the data has been traditionally collected by basement computer groups, sold to maritime newsletters, which in turn cater mostly to the marine insurance carriers and to the agencies. The IMO can’t monitor this and the IEA won’t. Some of these little groups have grown into businesses: a full subscription to TankerTracker.com now costs $50,000/year. The best collation of this has been Lloyd’s List, which is a maritime newspaper that is 400 years old, operating out of London. I have read their stuff whenever I could get ahold of it. It has become a dramatic thing, this uninsured junk out there.
I probably was riding on that same turnip truck with Charles, because I believe this clandestine crude oil transport to be much, much larger than what most of you seem to believe. Lloyd’s List thinks it is 10% of all the oil on the water at any given time. In 2018, rogue ships (mostly old uninsured tubs) just turned off their AIS transponders. About 2021, somebody came up with a jamming apparatus that would interfere with communication between a ship’s AIS transponder and the Global Satellite Navigation Network. After Putin invaded Ukraine, somebody came up with “GPS spoofing” whereby a number of scattered GPS transponders would talk to the Global Navigation Satellite Network to plot out a perfectly sensible–but horribly unreliable–nautical course. Lloyd’s List says there are over 500 of these rogue bastards out there: oil tankers not exactly filling out the forms according to Hoyle, going here and there, transshipping and such. That seems like a lot, but out of 12,000 tankers?–not so many.
If you’re an old “retired” VLCC or an Aframax and you haven’t installed scrubbers and use high-sulfur bunker fuel on the high seas, you might perform a transshipment of crude to small tankers so you can enter Chinese docks (which are very strict). Iran, Venezuela and Russia together produce a lot of oil, and they are all under sanction by the U.S. Treasury Dept, of all things. Yet you don’t hear of a lot of ships being grabbed by the U.S. Treasury Dept (there was that one last year from Iran–all I can recall).
It is also amusing that last year at one point, China was “purchasing” over a million barrels of Malaysian oil per day, yet only a little over 500,000 barrels were listed on the Malaysian production figures. In fact, Lloyd’s List says that the bulk of this dark fleet stuff traverses the Spratley islands that were recently fortified in the shipping lanes of the Straits of Malacca. Probably just a coincidence, but it makes you wonder.
I don’t have any credentials for this sort of stuff, but neither does anyone else, because it’s too big. The very best is TankerTracker.com, which does exactly as Dennis says. They measure how low tankers are riding in the water, monitor AIS, watch for wonky GPS transponder signals, and then sell their (very good) data to anybody who ponies up $50,000/year. That’s Lloyd’s List and a number of insurance carriers. With 12,000 tankers to surveil, there’s really no reason to waste their time and resources on old uninsured vessels that have recently changed hands and are flagged in a 3rd world country. As I noted, there were almost 200 of those sales just last year–and that’s only counting the Big Boys.
Rethink it. I believe this dark fleet concept has been underestimated, not over. This is not a confrontational piece to stir up a hornet’s nest, but merely a compilation of early-morning musings about recollections that I’ve stored inside my head. It’s an interesting concept to me, that there is (possibly) a fairly large under-the-radar international commerce in oil. I haven’t listed a single article to back up anything, because I didn’t want to further obfuscate an already-grey statistical zone. You know what they say: torture the numbers enough and they’ll admit to anything. What could it be? A million or two barrels a day? Nobody knows, and furthermore nobody in power seems to really give a damn.
Gerry,
Do you seriously think the EIA cannot afford a $ 50,000 subscription to tanker traker or whatever the subscription price is for Llyod’s list?
The information is simply incorporated into World estimates, it would be extremely naive to think otherwise imho.
Of course, the EIA, or the IEA, can afford TankerTracker.com, or Lloyd’s List.
What would they do with the data?
Unless you own tankers and are worried about yours, any data concerning rogue behavior is absolutely useless.
How in the world do you conceive of the EIA incorporating the data into “World estimates?”
That’s the gist of my “extremely naive” piece: to point out that no one knows how much oil is handled by these outliers, but that to any casual observer it’s quite a bit.
Gerry,
Pretty sure if you have an estimate of total oil on water and oil extracted and oil input to refineries you can get a good handle on World supply and demand.
The claim is that the EIA and IEA are ignorant of this dark fleet trade, that seems specious at best.
At most this simply results in incorrect numbers on the oil trade and who is exporting and where imports are coming from. Bottom line the oil produced may be accounted for correctly, if not there is not much to discuss, we are flying blind.
It seems to me this is much ado about nothing. You may be right, probably nobody knows the exact amount, my guess is the difference between actual World output of C plus C and the amount estimated by Statistical Review of World Energy, OPEC, and the EIA is not large.
How would they incorporate the data? Add up “legal” plus “illegal trade” and proceed with the usual analysis. Perhaps more complicated as I don’t focus on this type of analysis.
Basically though if we think about nation X and their demand for crude it would be crude produced plus imported crude minus exported crude. The Lloyd’s list data might give a more accurate count of imports and exports than “legal trade” alone. Do this excercise for all nations in the World, add them up and we have World demand for crude.
Dennis another report you will ignore
https://www.vanguardngr.com/2017/05/nigeria-lost-n2-trillion-poor-metering-oil-wells-two-years/
The new metering contract has only just been awarded
Charles,
If you do the math this amounts to about 1.8 kb/d over this 2 year period from 2015 to 2017. Not really a big deal. So yes, I ignore it because it is not significant.
Later in the article they claim $4.3 B in losses in 2014 where average Brent price was $99/b in that year, in this case the number is higher at 119 kb/d of oil stolen. Liquids output in 2014 for the World was about 94000 kb/d, so that would be about 0.12% of World liquids output that year.
Dennis
These are all small parts of a global picture some parts may be small, but together estimates are in the region of $120 billion of oil that gets stolen.
You think all of it is counted. I can tell you a corrupt official that works in a bank does not tell the authorities how much he is stealing. These criminal organisations like in Russia or Mexico are ver clever. Corrupt government have vast facilities to hide illegal trade.
It is naive to think otherwise
Charles,
We have the $120 billion estimate, there are clever people that track this, that’s where the estimate comes from. Can you point us to a reliable resource (NYT or Reuters for example) for the 120 billion estimate? Also note products are more expensive than crude, so if we are talking about gasoline theft rather than crude theft the number of barrels would be lower for the $120 billion estimate.
From paper linked below
https://www.atlanticcouncil.org/wp-content/uploads/2018/04/Oil_on_Water_WEB.pdf
we have this quote:
While exact figures are impossible to calculate, reasonable estimates place the global value of illicit oil and fuel activity in the tens, if not hundreds, of billions of dollars.
So a pretty wide range of estimates from 50 to 500 billion dollars, but no figure in barrels of crude or products for the World that I can find.
The chart below is World Natural Dry Gas Production in billion cubic feet.
The data is only through 2021. The 2020 dip is due to covid and the 2009 dip is due to the recession.
Production has continued to grow. This is why NGLs have also grown at about the same rate.
Charles/Ron/Dennis
Here is some information to clarify the discussion on world oil production. Data is from the OPEC MOMR and STEO.
December 2018 MOMR: Q4-18
All Liquids production: 100.6 Mb/d
US all Liquids: 17.2 Mb/d
World All Liquids W/O US: 83.4 Mb/d
December 2023 MOMR: Q4-23
All Liquids production: 101.7 Mb/d
US all Liquids: 20.3 Mb/d
World All Liquids W/O US: 81.4 Mb/d (2 Mb/d less than in 2018)
Attached is a chart of US NGPLs obtained from STEO by subtracting C plus C from US All Liquids. As can be seen, US All Liquids continues to climb and has added 2 Mb/d from November 2018 to August 2023.
While World liquids from Q4-18 to Q4-23 is up by 1.1 Mb/d, World Liquids W/O US is down by 2 M/d. It is the continuing large increase in US NGPLs that is causing the confusion. So if US NGPLs had not grown by 2 Mb/d over that period, World All liquids would be down by 2 Mb/d.
Bottom line Ovi, is that US dry natural gas as well as UN NGPLs are growing by leaps and bounds. Ditto for world dry gas and NFLs. But C+C peaked 5 years ago, dipped for covid, then sprang back but is still about 2 million barrels below its 2018 and 2019 peaks and appears to be stalling at the current level.
Notice in the chart below that the 12 month average turned negative in August.
I chopped off the left axis but the lines are seperated by 1 million barrels per day. The November 2018 peak is 84,580 Kbpd and the current August 2023 production is 80,700 Kbpd.
Ron,
Charles does not believe the EIA data, he seems to think OPEC data is good. That’s why I did the non-crude liquids chart earlier. From OPEC Annual Statistical Bulletin (ASB), World crude output (condensate not included). In 2022 crude output was about 2500 kb/d less than 2018.
Ron, could you please point me to the EIA website page where you found this data series? I used to rely on this one below (but it sadly has not been updated since May 2023 whereas the EIA used to be 3-4 months behind max normally):
https://www.eia.gov/opendata/browser/international?frequency=monthly&data=value;&facets=activityId;productId;countryRegionId;unit;&activityId=1;&productId=57;&countryRegionId=WORL;&unit=TBPD;&sortColumn=period;&sortDirection=desc;
Here is the link to their international page:
https://www.eia.gov/international/overview/world?src=
From there you must click on “DATA” then “Petroleum and Other Liquids” then “Monthly petroleum and other liquids production”. Then under “Activities” you must make sure only “Crude oil including lease condensate” is checked. Then click “View Data” and you have it.
Or the below link will take you directly there:
https://www.eia.gov/international/data/world/petroleum-and-other-liquids/monthly-petroleum-and-other-liquids-production?pd=5&p=00000000000000000000000000000000002&u=0&f=M&v=mapbubble&a=-&i=none&vo=value&&t=C&g=00000000000000000000000000000000000000000000000001&l=249-ruvvvvvfvtvnvv1vrvvvvfvvvvvvfvvvou20evvvvvvvvvvnvvvs0008&s=725846400000&e=1690848000000
Or try this one: http://tinyurl.com/yptfstcr
I made it for free so it may only work for me. I think they charge for making a tiny URL that works for everyone. But try it anyway.
Good luck
Thanks! It did work. Your direct link took me to the right place, however, since i usually retrieve the data via an API call, when i click on the API link on your page (the little key icon), it takes me right back to the page i pasted first above, which only has data until May 2023. I wonder why that is…
I clicked on it too and I got this:
Notice: The APIv1 query browser has been retired.
API Dashboard
I think that could be the reason.
Ovi
Thanks for graph. My point is there is growing evidence of illegal oil being produced and sold around the world. Put at over $100 billion. OPEC oil monthly report has higher consumption figure than production which is too large to be drawdowns. They obviously try and account for this illegal oil which ends up getting used all over the world. It also fits with GDP growth and oil consumption analysis.
Dennis obviously wants signed confessions from all the parties involved in this illegal and hidden trade.
OPEC oil demand last quarter is 103mb/d
Charles,
That is the OPEC forecast for World Demand for 2023Q4. Their Supply forecast is about 101 Mb/d. This implies a large stock draw down of 180 million barrels for 2023Q4 if both the OPEC Supply and Demand estimates are correct. Meanwhile OPEC nations are announcing output cuts and oil prices are going down.
Most rational people would expect the opposite (increases in OPEC output and rising oil prices) if the OPEC 2023Q4 demand estimate was correct. The EIA and IEA both have lower demand estimates than OPEC, those estimates seem more in line with the facts on the ground.
Can you define “illegally produced oil”? Not clear what that is. Are these rogue oil wells that governments are not aware of? If such wells exist, their total output is probably not very large. Oil gets stolen, of course, just like any other good. Their are estimates of what the amounts are (that’s where your $100 billion number cpmes from). It is not hard for OPEC, the EIA, the IEA and others to take the sum of oil not stolen plus oil stolen to find total World output. You seem to think you have found something that is new and only you are aware of. The problem is not new, and the information is available for anyone with the money to pay for it.
It is a non-issue.
OPEC oil demand last quarter is 103mb/d
No, as Dennis pointed out, that was their forecast for fourth quarter 2024. However, you keep talking about oil plus all that other shit they call oil. No that is not oil, that is oover 20% bottled gas. Peak oil has nothing to do with gas, it is oil only, OIL Only! Why in heavens name do you find that so hard to understand? Why can you not get that through your head? Oil only, not one whiff of gas whatsoever!
Ron it is Fourth quarter of 2023, 2024Q4 has a forecast of 105 Mb/d for total liquids by OPEC.
Well, if actual production comes anywhere near that forecast then someone is going to have to produce a lot of NGLs because I expect 2024 C+C 2024 production average to be below that of 2023.
Current August production of 80,700 Kbpd is already 1,143 Kbpd below the July 12 month average high of 81,843 Kbpd. The 12 month average turned negative in August at 81,778 Kbpd. That means August 2023 production of 0f 80,700 Kbpd dropped below the August 2022 production of 81,472 Kbpd.
Ron,
I think output may be flat as demand seems to be waning, but perhaps output will be down. The following estimate assumes the linear decrease in transport fuel intensity from 1984 to 2022 continues through 2050 and that World real GDP grows at an average annual rate of 2.5% per year from 2023 to 2050. The scenario is certain to be incorrect.
If we continue to see relatively subdued oil prices over time (under $80/b) it may be an indication that demand is either flat or falling.
Dennis, I am a little shocked by your chart. I had no idea that demand was expected to be down that much. If I am reading the chart right the big drop is this year, 2023. So the drop in demand has already happened.
Is that your data, if not where did you get it.
Ron,
No it is not data for 2023, basically it is a guess based on transport fuel intensity of real GDP which has decreased linearly since 1984. I assume that linear decline continues at the average rate of the past 38 years. transport fuel intensity is World transport fuel demand divided by World real GDP. For the scenario I assume World real GDP increases at an average rate of 2.5% per year from 2023 to 2050. This is a very simple model which is certain to be wrong. A slightly modified scenario below with slower decrease in transport fuel intensity. We only have data through 2022 from OPEC ASB, all points after 2022 are just model guesses. In 2023 for this scenario transport fuel demand falls by 200 kb/d.
Looks good. I can accpet that reality will be pretty close to your estimate.
Thanks Dennis
Thanks Ron,
I am not optimistic that this simple model will be correct, but it does give one theory of why oil demand might decrease in the near future, oil prices will give us a hint about this, if prices remain relatively low with decreasing oil supply and demand it is an indication that it is a lack of demand that might be causing the decrease with supply simply following demand, high oil prices would indicate that supply is short at the lower price level and that higher oil prices are needed to destroy some demand. It will be interesting to see how it plays out.
Ron
Why are you so obsessed with oil only?
Back Years ago on The Oildrum you stated, you were quite sure we were at peak oil, oil was essential and there were no alternatives. People now can buy electric cars that will travel 250/300 miles on a full charge.
Ten million cars sold this year do not run on oil, in 2027, 30 million electric cars will be sold.
https://www.ev-volumes.com/
Electric vehicles today have the ability of replacing every single electric car, small van, motorcycle.
In ten years time most short haul hgvs will be replaced with electric equivalent.
That’s 60% of all consumption gone. 😁
Today natural gas plant liquid has the same position as oil had 15 years ago there is no replacement, from it refrigerants, plastics and rubber are made. Aramco are so worried they will have too much oil they are building an oil to chemical plant.
So I will continue to talk about total liquids because oil is not as critical as it once was.
Charles,
Do you expect non crude liquids will increase as fast as demand for crude falls? Note that your scenario for EVs replacing ICEVs (which may simply be sarcasm) would allow GDP to grow as oil output falls. Past trends do not always foretell the future, as trends can change.
Note that a plot of barrels of transport fuel demand vs natural log of real GDP reveals a linear correlation from 1984 to 2019. Also consider that real GDP using purchasing power parity (PPP) constant dollars may be a better measure than market exchange rates, this accounts better for cost of living differences between nations that are often not reflected in market currency exchange rates.
Dennis
I think crude and condensate production will peak 2027/28 at around 3/4 million barrels per day higher than 2018. Prices will be consistantly over $100 from 2025, which will incentivize more US tight oil and OPEC to produce at their maximum.
The production of electric cars will moderate the price of oil and the price of oil will not go over $150 for any length of time other than a war event. Which unfortunately is becoming more likely.
At the moment the number of electric cars globally is having only a small effect on oil consumption. This is because 99% of vehicles on the road are ICE vehicles and also the number of HGV vehicles has been increasing and 1 HGV vehicles uses as much fuel as 30 cars.
Even more so in China and India
https://www.smmt.co.uk/2022/05/commercial-vehicles-reach-record-share-of-vehicles-on-road/
The ongoing development of crude to chemical plants is another element of uncertainty in the global oil demand. It could be consuming 4 million barrels per day in 2030. These are just a tiny number of developments
https://www.aramco.com/en/news-media/news/2023/aramco-assesses-possible-investment-in-shandong-yulong-petrochemical
https://www.shell.com/business-customers/catalysts-technologies/licensed-technologies/refinery-technology/crude-oil-to-chemicals.html
Over $300 billion is being invested in reconfiguring oil refineries
https://www.digitalrefining.com/article/1002467/oil-to-chemicals-new-approaches
Charles,
I had much the same forecast in the past, but demand for crude seems to be growing more slowly than in the past, based on official numbers (OPEC, IEA, and EIA). Also oil prices have been subdued even with a couple of wars going on, perhaps this will change. I agree EVs have had a minor effect so far, unless 2 and 3 wheel vehicles are more important than I realize for total consumption, I don’t have good data on these.
Why are you so obsessed with oil only?
I am not obsessed with oil at all. I am only stating that gas is not oil. Hell, a ten year old can figure that out. Physics tell us there are three types of matter. They are solids, liquids, and gas. If you cannot tell the difference between any two of the three, then you have some very serious problems.
Aramco are so worried they will have too much oil they are building an oil to chemical plant.
Good God, are you ever confused. Saudi is not currently building a chemical plant. They have already built two chemical plants. One in Jubail that uses oil and gas to manufactures epoxy, epichlorohydrin, caustic soda, chlorine, hydrochloric acid, sodium hypochlorite, and several other products. Most of these products are made from oil.
The other plant is in Riyadh. It is called the Agaseem Chemical Factory. It processes gas into plastics and plastic products.
They are not turning oil into gas to make anything. Some chemical products are made from oil and some chemical products are made from gas.
So I will continue to talk about total liquids because oil is not as critical as it once was.
Hey, talk about whatever your little heart wants to talk about. That will not change the fact that peak oil is peak oil, not peak oil and gas.
Wrong
https://www.meed.com/saudi-chemicals-project-contract-awarded-to-fluor
https://www.nsenergybusiness.com/news/sabic-aramco-to-build-crude-to-petrochemicals-project-ras-al-khair/
Okay, so they are building a third chemical plant or a second chemical plant that uses oil instead of gas. Such plants are found all over the world. Big discovery you made.
And it is well known that Saudi has plenty of oil but little natural gas. They actually buy gas piped in from Qatar.
You have a serious problem with bullshit Charles. Why don’t you take your business somewhere else.
Ron
Actually there are not many plants at the moment around the world but they are building more than one and so are many other countries and companies
https://www.icis.com/asian-chemical-connections/2023/11/details-of-how-saudi-aramco-cotc-and-other-advantaged-feedstock-projects-could-redraw-the-petrochemicals-map/
Charles, you totally miss the point. The point is there is, currently, no shortage of natural gas. But gas is much harder to transport than oil. So countries that do not produce any gas have a serious problem.
No country is turning oil into gas. Refineries do have cracking towers where long polymers are cracked into shorter polymers like gasoline. It is done by heating the longer polymers so hot that they crack into shorter ones. But when you crack one polymer into two, you must one hydrogen atom to each new polymer. So they must add raw hydrogen to the mix. And guess where they get that hydrogen? From natural gas. But no one is cracking oil into gas because they are short of natural gas.
I have no idea what you are trying to prove by pointing out that chemical plants are being built to make products out of oil. Of course they are. They have been doing that for years and will continue to do so. There are just some products that can only be made from oil and not gas. Automobile tires is just one example.
I have no idea why you keep harping about natural gas and NGLs. However make no mistake, I founded this sit in 2013 as a peak oil site! It has not one goddamn thing to do with peak gas. End of story,
Thanks Ovi and Ron,
Yes Natural Gas output increases will result in higher World NGL output and the US has seen a very large increase in NGL output.
Facts are nice.
Thanks to all concerned for this websites quality articles and comments. It’s a treasure. Have a Merry Christmas.
Thanks Survivalist.
Happy Holidays to everyone of all faiths and non-faiths.
To ron, charles and dennis…the problem is in the real gdp. Much political incebtive to systemically understate inflation, and thus to overstate real gdp. If real gdp is acually lower, that makes a lot of thing fit.
The inflation estimates are not bad, and real GDP estimates are also ok, though perhaps using PPP inflation estimates would be more accurate. Comparisons between nations is tricky.
Dark and grey fleet
Tracking the 2 thousand or so vessels is a very difficult task when they are constantly changing identities and turning off the tracking device.
The grey and dark fleet has increased considerably since Russia invaded Ukraine.
https://windward.ai/glossary/what-is-the-dark-fleet/
Anyone who thinks it easy to track a dark ship probably knows nothing about this subject.
Try and explain to us here how it is done?
A full vessel may be seen in a port but there is no data of where it came from because the corrupt dictatorship in Russia or Iran or Venezuela just happened to forget to tell the EIA so that Dennis can do his nice and simple little graph.
The world is not simply it is highly complex and their is much hidden and distorted.
Companies like Windward are just getting a vague picture of the scale of the hidden trade in oil.
Charles,
I agree the picture is quite vague, in fact I challenge you to find publicly available information that sums it all up to give a reliable figure. Anything else is hand waving.
I agree the world is complex and data is never perfect, we do not live in a world that is either perfect or simple. I work with the data that exists and adjust my models accordingly rather than adjusting facts to fit my narrative, you should try it. I cannot model anecdotes. You are welcome to produce any model you wish to, I will do the same.
https://aspofrance.files.wordpress.com/2023/12/oil-production-forecast-evolution.pdf
Thanks for the link, fantastic stuff. Jean Laherrere does great work.
Dennis,
Check page 32 Jean sees total liquid fuels URR ~ 3900Gb. Based on that I am getting his C C URR of just under 3000Gb. He agrees with Rons peak of late 2018 (though he labels it 2019), with a sharp decline rate.
My own model has C C URR ~ 2500 Gb. But Jean is much more knowledgeable in this area than me.
Iron Mike,
JL does great work, perhaps 2018 will remain the peak. Demand has not been as strong as I assumed it would be. Difficult to know what the future will be, if demand rises I think we could see a new peak from 2025 to 2028, if it starts to decrease or remains flat, then the peak will remain 2018.
The EIA Monthly Energy Review is out. They have USA C+C down 36 Kbpd in October and down 23 Kbpd in November. I think that will be pretty close.
Ron,
I would point out that the MER is usually not very close, typically the STEO is better. See chart below up to Nov 2023, from Nov 2023 to March 2024 the recent STEO expects US output to fall by 210 kb/d, then remain roughly flat until September 2024 with an increase of 240 kb/d for the last 3 months of 2024, the net increase in US
C plus C output over the Nov 2023 to December 2024 period is 20 kb/d, essentially flat output.
Dennis/Ron
With ND down for October, NM running flat and Texas down using September and October RRC data to project October production, I think US October onshore L48 will be down. Unclear on GOM. If it is flat, US October should be down.
Ovi,
Perhaps, in the past the STEO has been pretty good in the short term, about 2 to three months forward and certainly better than the MER in most cases. We will know in a few days what the EIA estimate for October is.
Dennis
I agree the STEO has been pretty good at estimating production few months out.
Ovi,
But you may be right with ND down, New Mexico flat lately and with Texas either flat or down, output overall may be down, unless increased output from GOM and Alaska make up the difference. I am a little unsure about the Texas projection, Dean Fantazzini used a similar method for many months and it did not give consistent results as I remember.
Forecasts that are accurate are difficult, I know I only get it right by shear luck when it (rarely) happens.
Petroleum Products Supplied
Definition: Petroleum Demand (consumption/petroleum products supplied): For each. product (gasoline, distillate, etc.), the amount supplied is calculated by summing production, imports, and net withdrawals from primary stocks and subtracting exports.
Below is a fifty-year chart of Petroleum Products Supplied taken from the EIA’s Monthly Energy Review. We are consuming almost a million barrels per day than we were in 2005, eighteen years ago.
The data is through November 2023
Making do with less? If it’s a million barrels less per day since 2005 it could mean many things. The trend is clearly a declining plateau since then.
I saw a graph that showed workers’ productivity more than doubling since the 70s but wages have gone up something like 15% since then. Workers haven’t been able to partake in the fruits of their labor. (F*ck capitalism.) It implies the working class has cut down their consumption (Gail Tverberg says we’re using less energy per capita worldwide).
When I come across videos of average everyday people, I notice how bare some of their homes are. People just have less stuff. People probably have also been driving less or carpooling more or something. Average home sizes peaked in 2016 and have been declining since and housing is the biggest form of consumption in an economy.
Since the financial system is incapable of degrowth, it’s squeezing people. People in the system aren’t enjoying life but instead exist to service this fake and gay numbers game called the financial system, which means its all just a prolonged ponzi with diminishing margins. All of this wealth creation is fictional. The financial system is lagging behind physical systems. All the unencumbered wealth of these billionaires and millionaires could never be actualized in the form of energy, meaning if all of the superwealthy wanted to cash out right now just to buy and use energy just for the sake of wasting it, it wouldnt happen simply because our physical energy systems are running on thin margins. Theres really nothing to spare. There’s a closing window of opportunity for the wealthy to reorient their investments so they could maintain their wealth and relative status. When the energy declines start everyone will be in a very difficult postion.
/rant
https://www.dallasnews.com/business/real-estate/2020/01/27/new-homes-in-d-fw-and-us-are-shrinking-as-builders-try-to-contain-costs/
Ron,
Better to look at only gasoline, diesel, jet fuel and residual fuel imo because a lot of that “product supplied” is bottled gas. Chart below has trailing 12 month average for US consumption of gasoline, diesel fuel, jet fuel, and residual fuel from Dec 1973 to Sept 2023. The peak was Dec 2005 at 15873 kb/d, Sept 2023 was 14760 kb/d (trailing 12 month averages in both cases) about 1114 kb/d below the 1973-2023 peak.
Ovi who is coming in closest for the average oil price predictions from a year ago?
Stephen,
Must be Ovi.
Just kidding, no idea, but average weekly WTI spot price from Jan 6 2023 to Dec 15 2023 is $77.71/b, based on EIA data. I think my guess was $90/b or something, so it isn’t me, I don’t remember actually.
Link to post with price guesses see comments
https://peakoilbarrel.com/us-october-oil-production-pushed-higher-by-new-mexico/#more-40729
Kengeo guessed $80/b which looks closest, had a couple guesses at $60, a couple at $90/b and a few higher and lower than this, the average was about $97/b roughly.
This was Frugal’s game, he may have kept track better than me.
Stephen/Dennis
Sorry being so slow but still recovering from the holiday celebrations and my BD yesterday. We have a long drawn out affair at my place for the holidays. Double celebrations. Great.
Attached is the chart. Closest to today’s price is Kengeo at $80/b. As a group we stink. Our average is $87.90. The average price from Jan 3 to yesterday is $77.66/b. Either way you look at it KenGeo wins on both counts.
My guess was pretty bad. That is the result of believing the OPEC and IEA reports which showed more demand than supply in Q4-23. Maybe there is some merit in the dark oil theory.
Ovi,
The dark oil theory posits that supply is higher than is reported, if this were the case, oil prices would tend to be lower rather than higher, what we are seeing is poor demand estimates with expected future demand being forecast as being much higher than reality. When I see a believable report on dark oil with actual estimates of the World volume of crude and/or products that is “missing” from World estimates, only then will my thinking change.
The estimates that exist likely already account for illicit oil shipments and theft as well as can be determined. This is basically an accounting excercise, how much comes out of the wells, how much is input into refineries, those are the important numbers. Tracking every tanker location in the world does not change either of these numbers.
There’s a lot of collective oil knowledge in that group. Fat load of good it did LOL
Stephen,
More guesses are needed perhaps. Maybe 100 or so. Mike Shellman and Shallow sand know, they just aren’t telling.
Ovi..all of the guesses were not for the end year price, rather for the yearlong average,
with Westtexasfanclub and Dennis coming in the closest.
From the original query- Frugal 1/123 “My prediction for 2023 is $100/barrel average closing price for WTI. Is anyone else willing to make a prediction?”
Hickory,
My guess was $90/b, the average price was around $78/b, Kengeo guessed $80/b so assuming that the year long average is pretty close to the current YTD average price for WTI, Kengeo is the winner which I think is what Ovi stated.
I think the confusion stems from the average closing price, this means the daily closing price for WTI for each day that a spot price is posted during the year (or that’s my interpretation) I don’t think it means the closing price for the last day of the year that a spot price is posted. The wording is a bit tricky and perhaps not very clear.
The other thing that may be causing confusion is the average posted on Ovi’s chart, that is the average of all 11 guesses (I get $87.72/b, with a median guess of $90/b.) The average WTI price year to date is about $78/b. Hopefully that makes things less muddy rather than moreso.
Hickory
Looks like I wasn’t clear enough. The 87.90 was the average of our guesses, not the year end average. That is why I said: “As a group we stink. Our average is $87.90. The average price from Jan 3 to yesterday is $77.66/b. Either way you look at it KenGeo wins on both counts.”
Ovi,
Perhaps it was showing the Dec 27 price on the chart that caused confusion. I often don’t read things carefully enough before commenting, others may do the same.
Dennis
I think should have labelled it “Average of Guesses” to be more clear.
Ovi,
The chart was fine. I think it was showing the Dec 27 price that might have confused.
Though it may be me that is confused.
Oh, I get it now. Thanks guys.
Mine was a lucky guess, picked primarily because I saw a gap in the 60-100 range of guesses, and 80 happened to be in the middle…
Here’s my guess for 2024, not very exciting though…$90…
Take home is that we pretty much all guessed too high (and 3 too low)…US production will continue to be the wildcard, oil prices are most likely to creep upward as US growth stalls, guess 20-30% price increase from current level, so a peak in June of ~$100 then back down to low 80s 12 months from now, any number of things could send prices much higher…don’t see too many factors to send it lower but who knows…
Kengeo,
Interesting thx.
My guess for average WTI 2024 nominal oil price (average of daily closing spot prices for the year) is $75/bo. My guess is that lack of demand growth will continue to be a problem in 2024.
Here’s the WTI average spot price by month:
January = $78.12
February = $76.83
March = $73.28
April = $79.45
May = $71.58
June = $70.25
July = $76.07
August = $81.39
September = $89.43
October = $85.64
November = $77.69
December = $71.75
2023 average = $77.62
KenGeo was the closest by far — congratulations!
OK Guys, Put on Your thinking Caps. I will initiate a WTI guess for next year next week.
Guess #1: Average price for 2024.
Guess #2: Year End closing price on Dec 31, 2024.
Two U.S. senators call for Tesla recalls after Reuters investigation
Dec 27 (Reuters) – Two U.S. senators have written to Elon Musk, Tesla’s top executive, calling on him to “swiftly” recall any steering and suspension parts that pose a safety risk.
The letter cites “an alarming” Reuters investigation published on December 20 that exposed how Tesla has blamed drivers for frequent failures of components it has long known were defective.
This is the interesting paragraph: “The Reuters report found that Tesla told NHTSA and customers that the frequent failures of defective parts in its electric vehicles were caused by driver “abuse,” such as hitting a curb. In 2020, Tesla gave that explanation in a letter to the safety agency explaining why it would not recall a suspension part called the aft link in the United States, despite having just recalled it in China.”
I guess in China when they tell Musk to recall a car, he knows they mean it. In the US, he knows he can ignore the government by lying. Musk may be a very powerful individual, but not in China.
https://www.reuters.com/business/autos-transportation/two-us-senators-call-tesla-recalls-after-reuters-investigation-2023-12-27/
Interesting EIA Inventory Report this morning
Commercial crude was down 6.9 M barrels as opposed to the 1 M barrel build reported by API. Overall stocks, excluding the SPR were down 17.3 M barrel. Product supplied was back up over 21 Mb/d with gasoline over 9 Mb/d.
WTI reaction was down over $1 to $73/b. Surprising since that drop would typically cause a rise in WTI. Weekly production was tagged at 13,300 Mb/d. Maybe that was the damper on oil price. I think it just reflected the STEO outlook that production should stay close to 13.25 M/d for the next few months.
New posts are up.
https://peakoilbarrel.com/eia-short-term-energy-outlook-and-tight-oil-update-december-2023/
and
https://peakoilbarrel.com/open-thread-non-petroleum-december-28-2023/