A guest post by Ovi
All of the Crude plus Condensate (C + C) production data for the US state charts comes from the EIAʼs December Petroleum Supply monthly PSM which provides updated information up to October 2022.
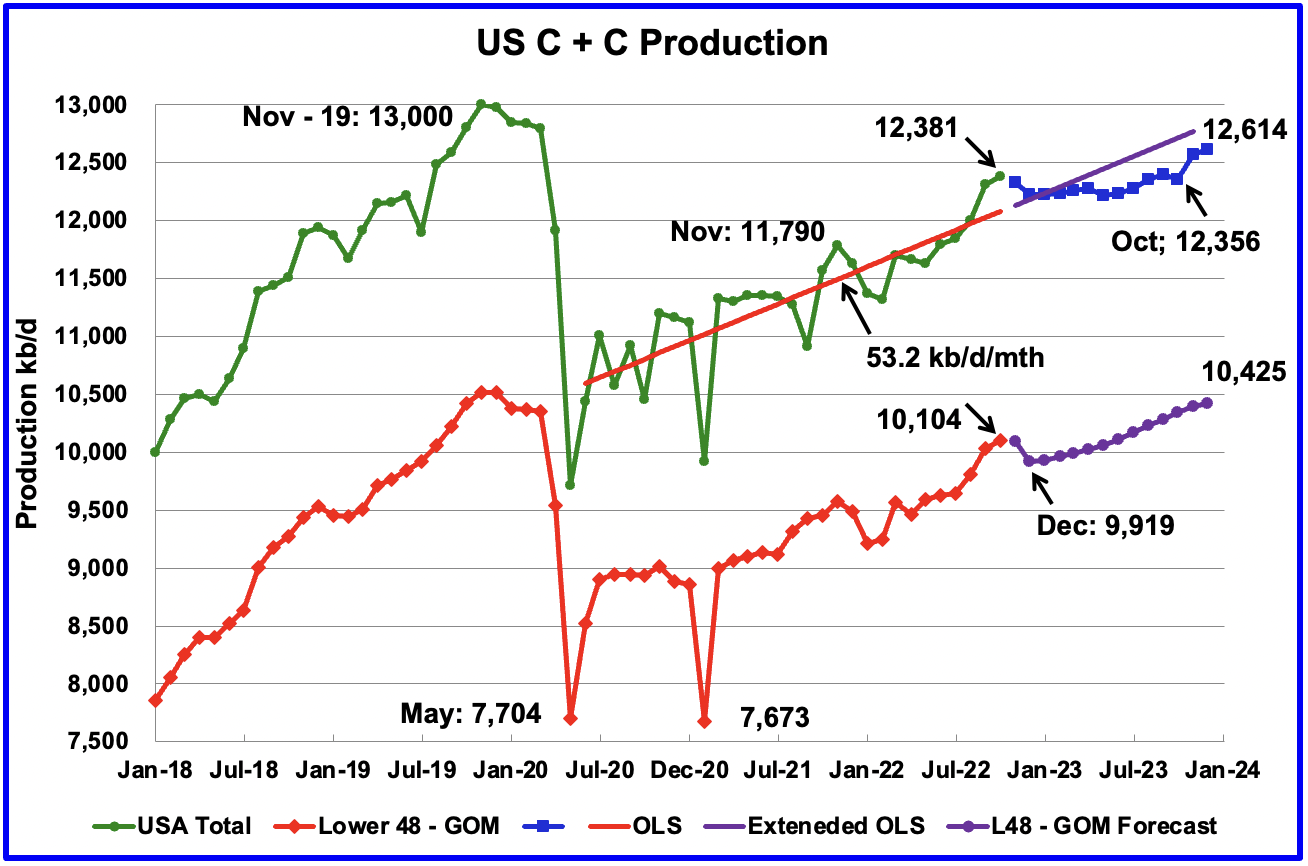
U.S. October production increased by 69 kb/d to 12,381 kb/d to a New post pandemic high. It should be noted that September’s oil production increase of 289 kb/d to 12,268 kb/d which was reported last month and was considered high, was revised further up by 44 kb/d to 12,312 kb/d in the current October report. For September, the state with the largest increase was New Mexico 41 kb/d, along with a number of small increases from the smaller producing states.
While overall US oil production increased, a clearer indication of the health of US production can be gleaned by looking more closely at the Onshore L48 states. In the Onshore L48, October production increased by 69 kb/d to 10,104 kb/d. This means that 100% of the increase in US production came from the Onshore L48.
The blue graph, taken from the December 2022 STEO, is the production forecast for the U.S. from November 2022 to December 2023. Output for December 2023 is expected to be 12,614 kb/d, 34 kb/d higher than reported last month.
Note that production in October 2023 is forecast to be lower than in October 2022. The flatness in overall US output up to October 2023 is because the production increase in the Onshore L48 of 506 kb/d from December 2022 to December 2023 is offset by declining production in the GOM. See GOM chart further down.
The red OLS line from June 2020 to October 2022 indicates a monthly production increase of 53.2 kb/d/mth over that period. The first portion of red line stops at October because that is the range covered by the OLS analysis. The second portion is the same OLS line extended to see how well it fits the STEO forecast.
Oil Production Ranked by State
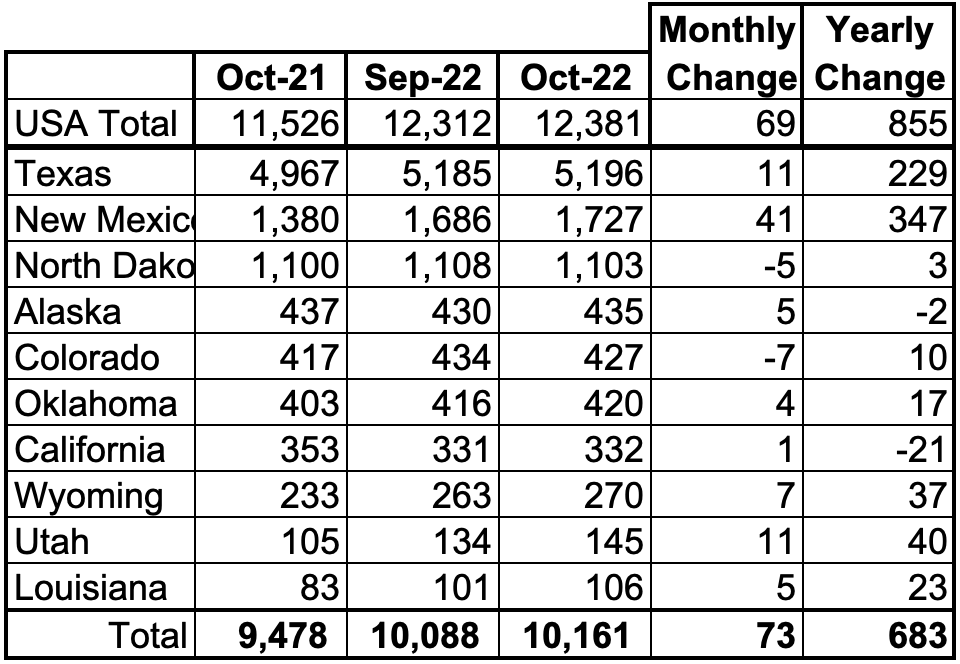
Listed above are the 10 states with the largest US production. These 10 accounted for 82.1% of all U.S. oil production out of a total production of 12,381 kb/d in October 2022.
On a YoY basis, US production increased by 855 kb/d with the majority having come from Texas and New Mexico. Note that only California and Alaska are producing less crude this year than a year ago.
State Oil Production Charts
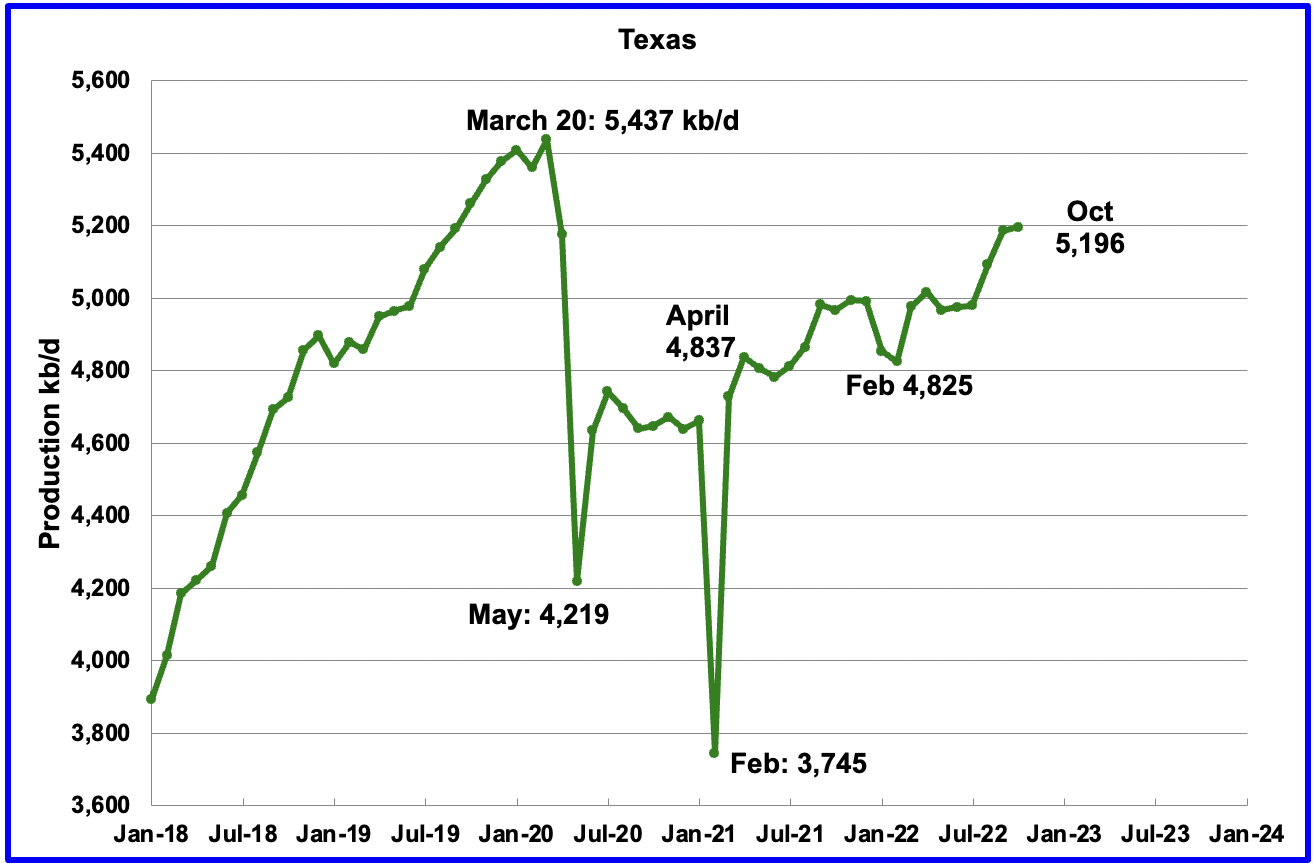
Texas production increased by 11 kb/d in October to 5,196 kb/d, a post pandemic high. The Texas small monthly increase is because September was revised up by 44 kb/d from 5,145 kb/d to 5,185 kb/d.
In October 2021 there were 215 Hz oil rigs operating in Texas. By October 2022, 313 Hz oil rigs were operational, an increase of 98 rigs.
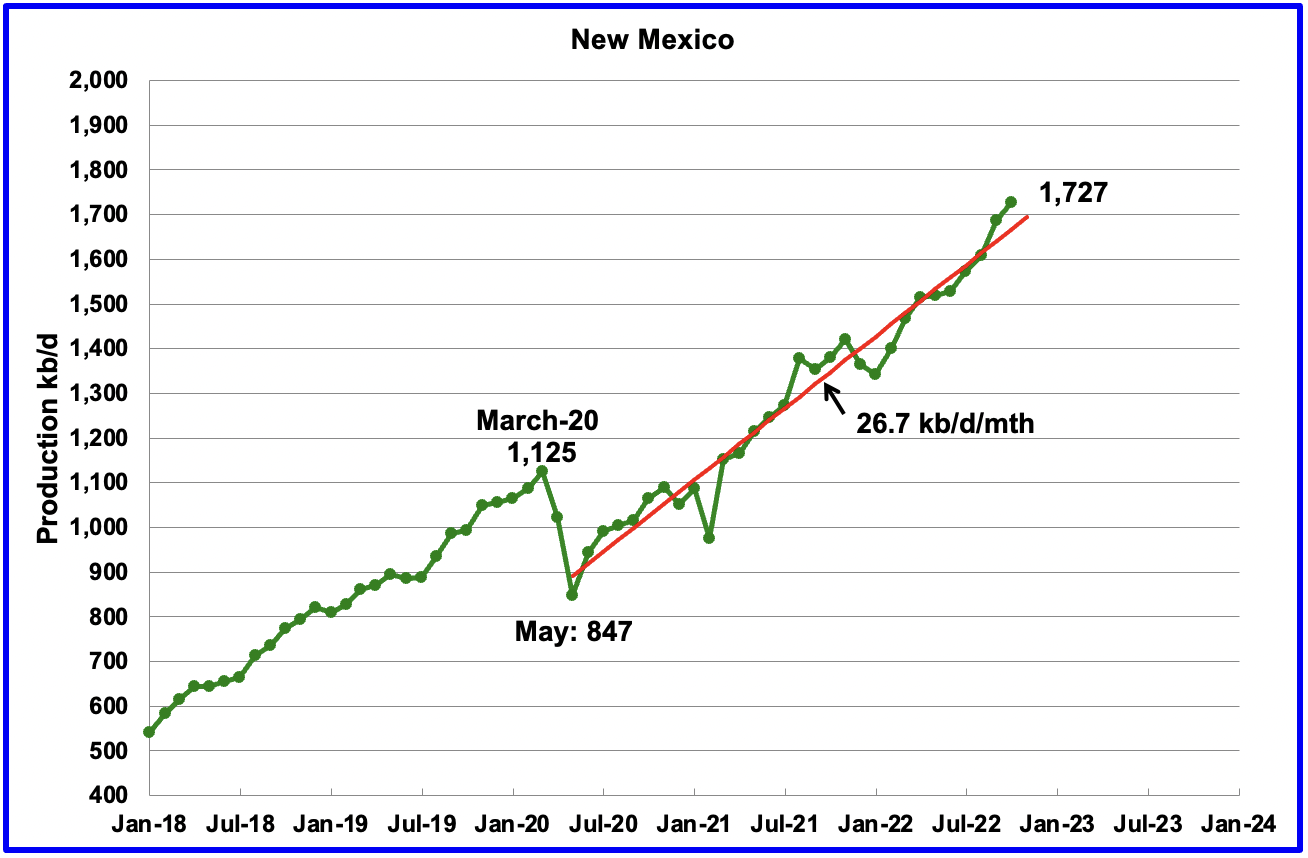
October’s New Mexico production increased by 41 kb/d to 1,727 kb/d to a new record high. The red OLS line from May 2020 to October 2022 indicates a production growth rate of 26.7 kb/d/mth and shows no sign of rolling over. Since August, the rig count has been steady in the mid to high 90s.
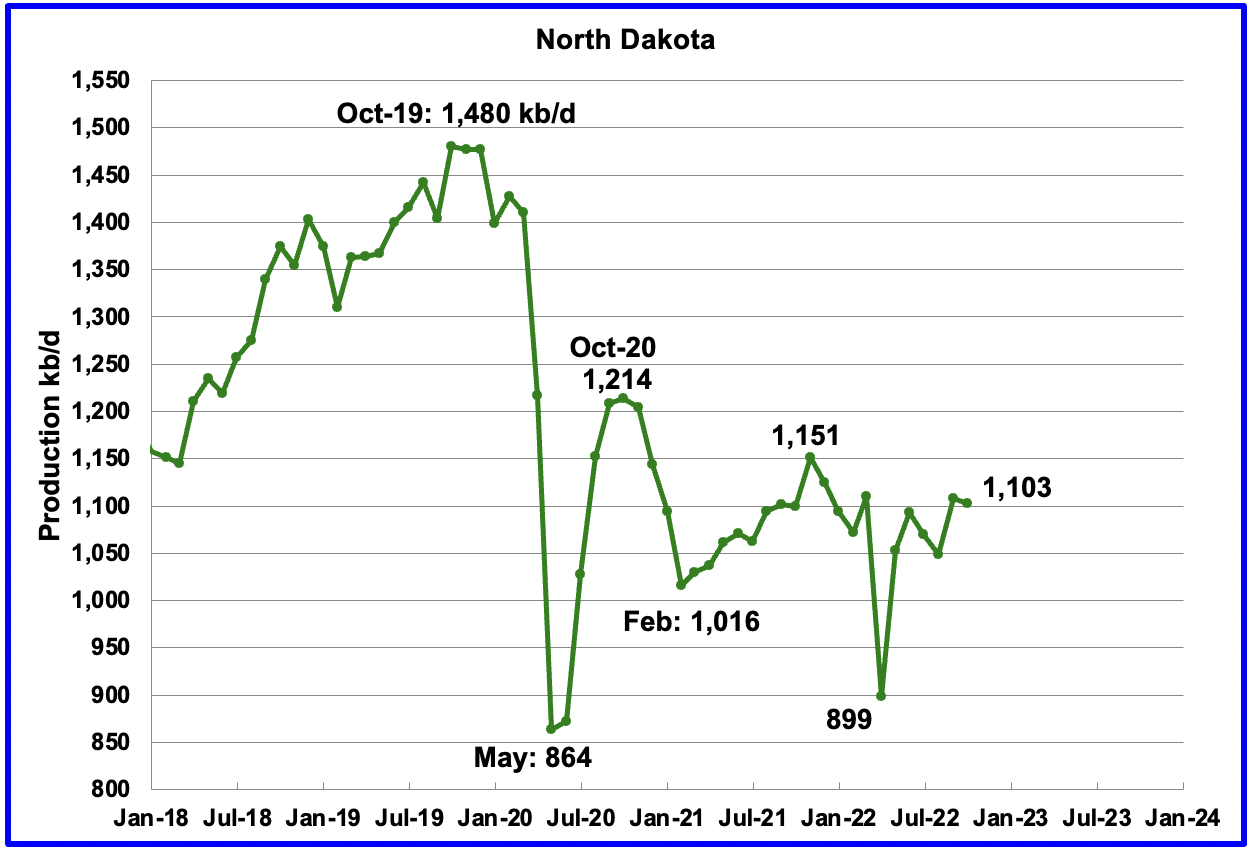
North Dakota’s October output decreased to 1,103 kb/d, a decrease of 5 kb/d from September.
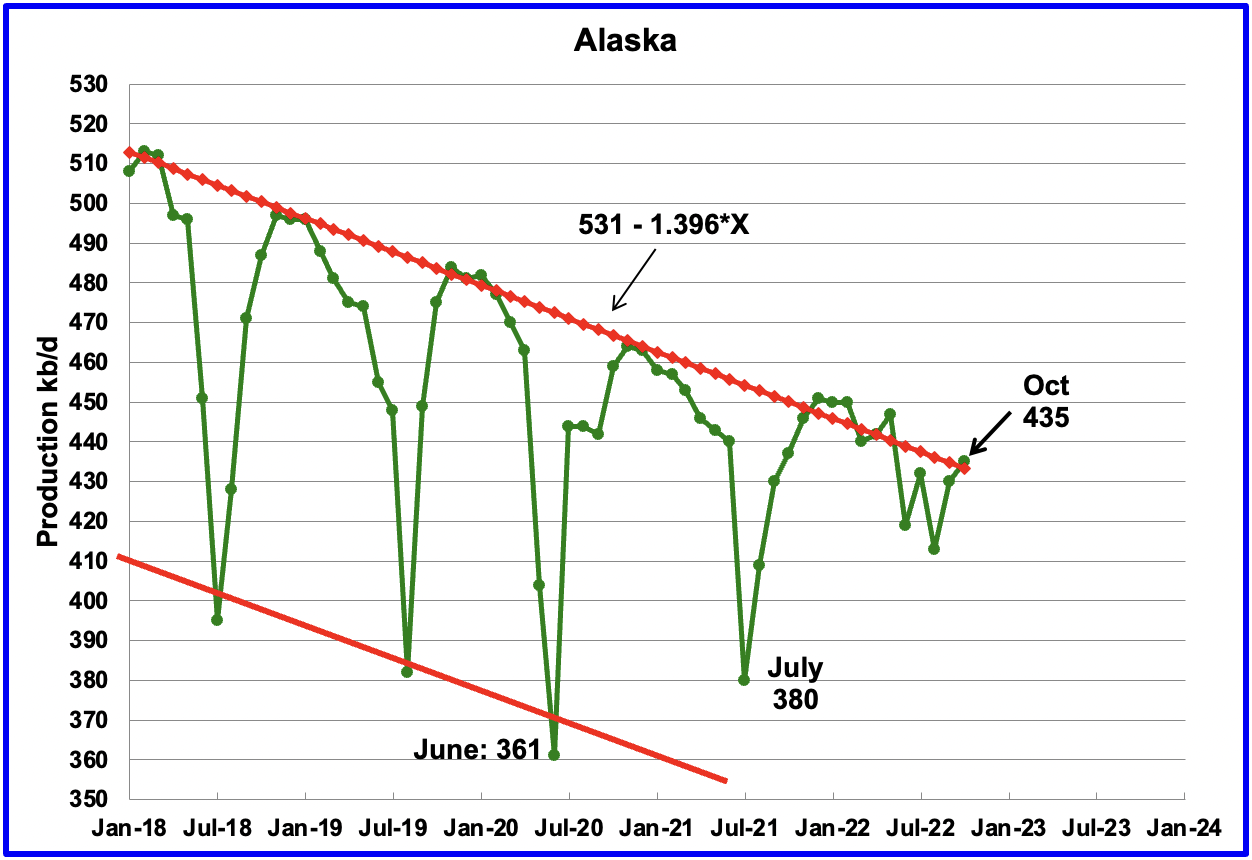
Alaskaʼs October output increased by 5 kb/d to 435 kb/d and was 2 kb/d lower last October.
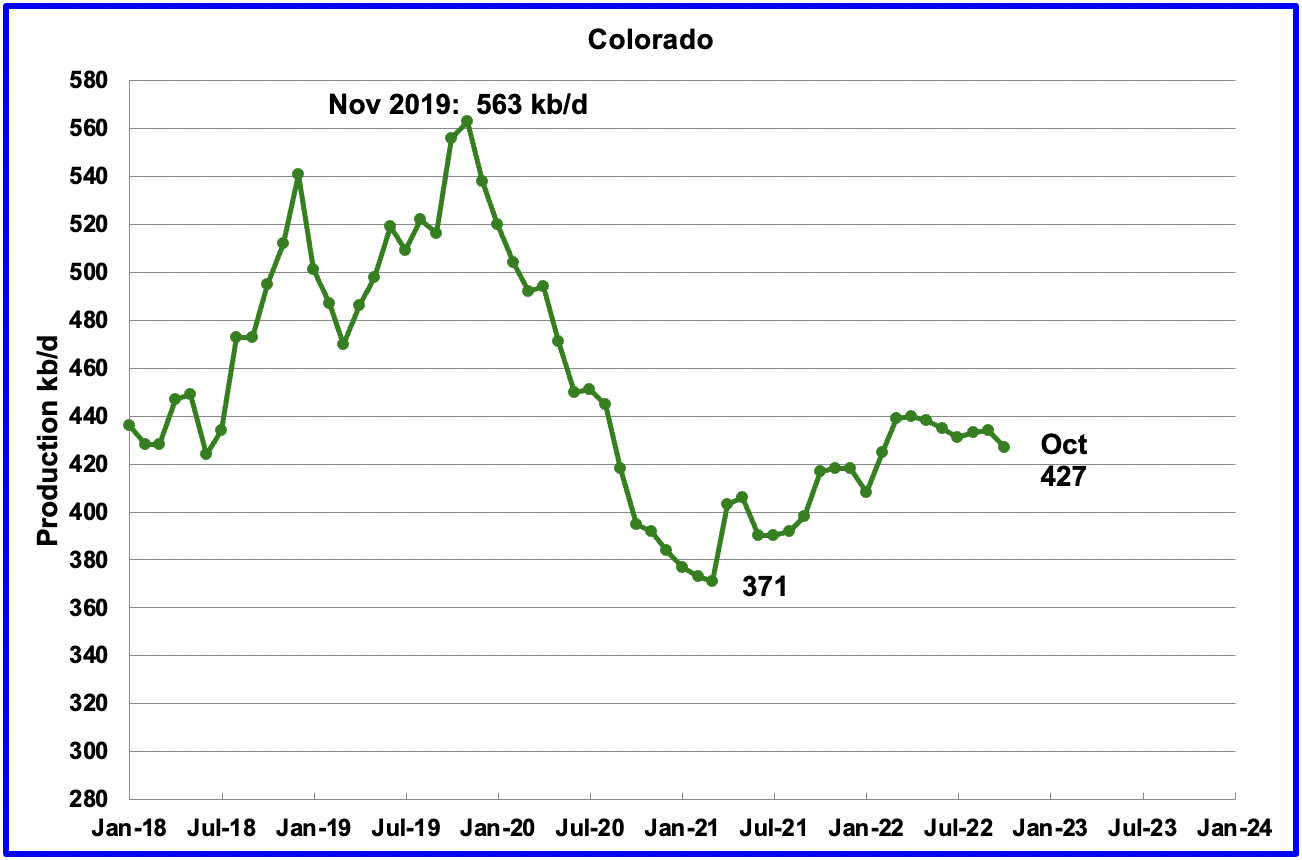
Coloradoʼs October production decreased by 7 kb/d to 427 kb/d. A recent Colorado report forecasts little oil growth is likely in Colorado for 2022.
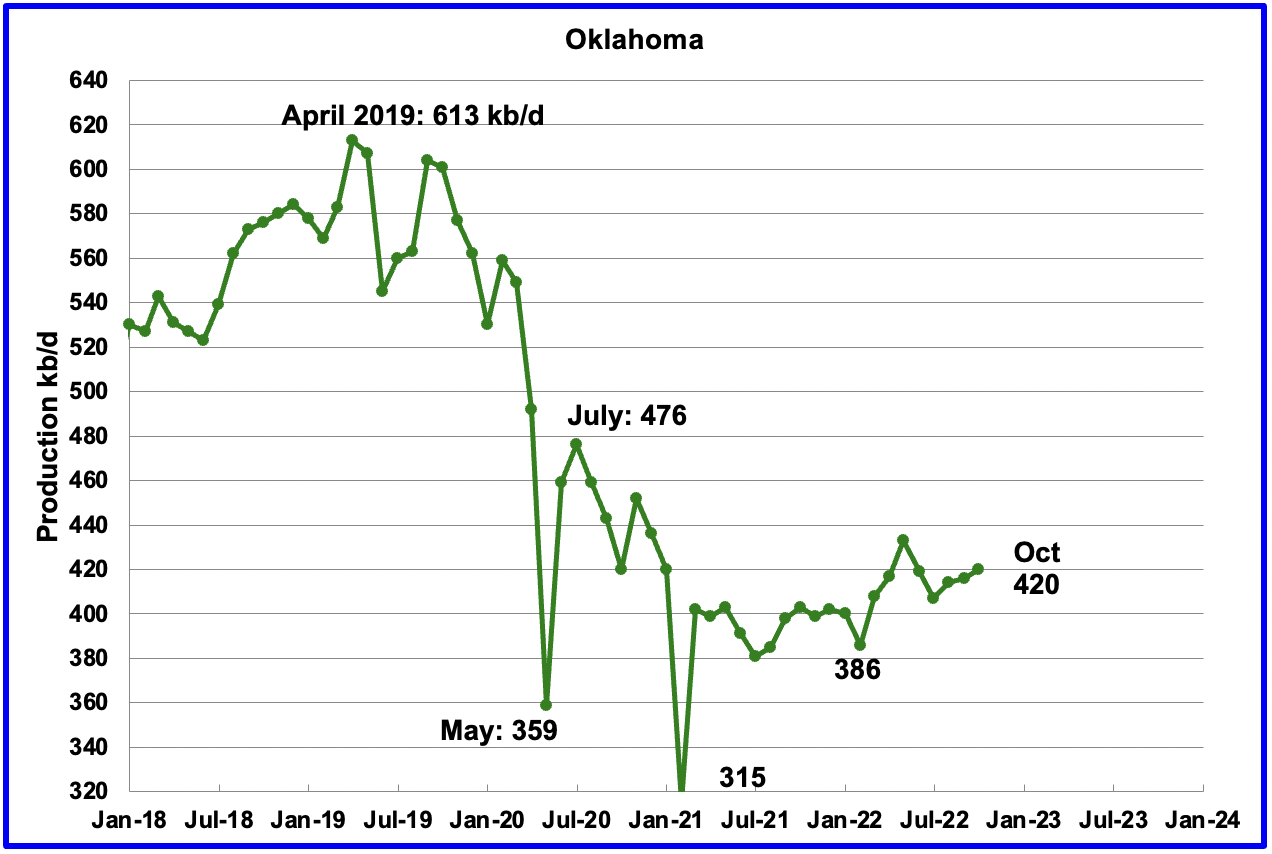
Oklahoma’s output in October increased by 4 kb/d to 420 kb/d. From January to April 2022, close to fifty rigs were operating in Oklahoma. By late October the rig count had increased to 65. Production remains 56 kb/d below the post pandemic high of 476 kb/d.
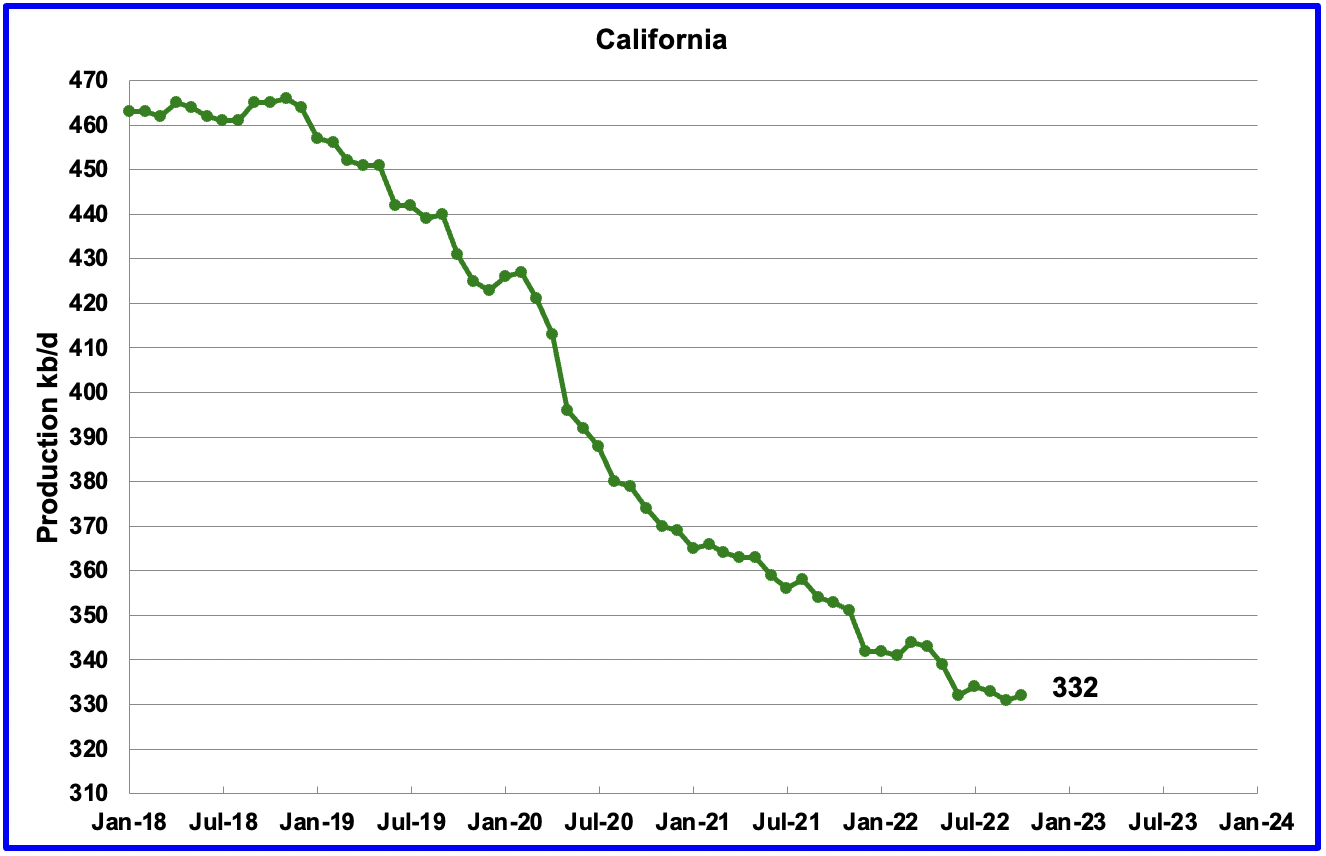
While Californiaʼs overall slow output decline trend continues, October was an exception since production increased by 1 kb/d to 332 in October.
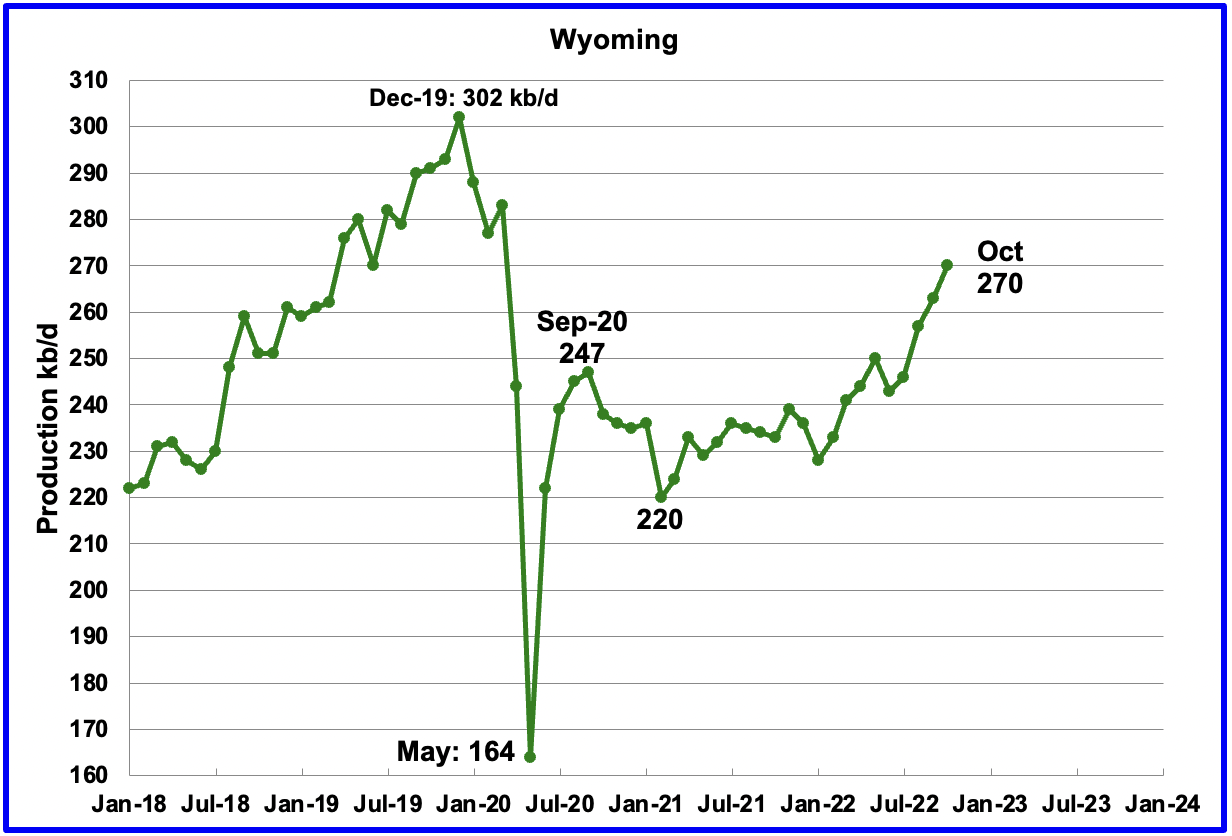
Wyoming’s oil production has been on a slow unsteady uptrend from the low of 220 kb/d in February 2021 due to increased drilling. October’s output reached a new post pandemic high of 270 kb/d, an increase 7 kb/d over September.
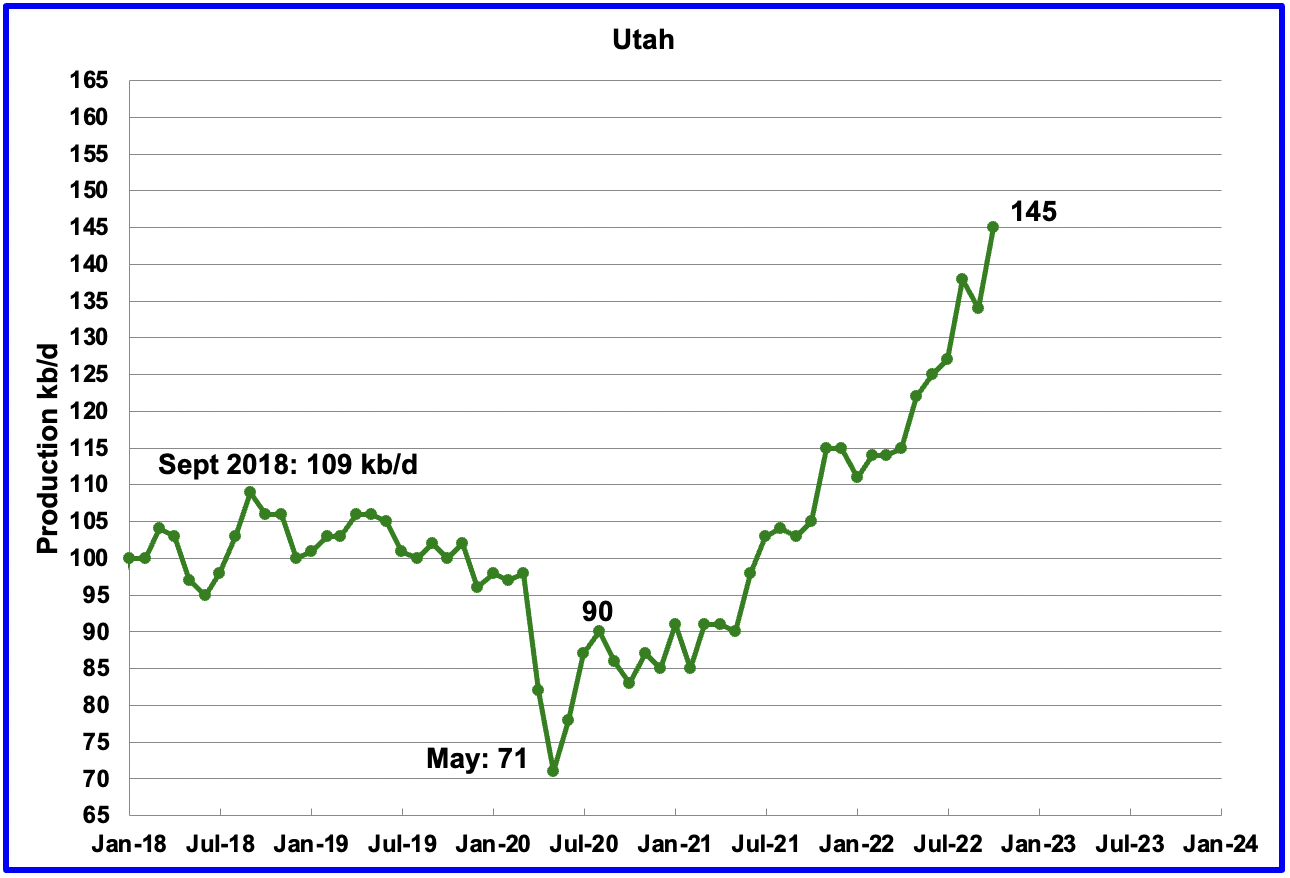
Utah’s oil production had been increasing steadily since January 2022. October production hit another new high of 145 kb/d after adding 11 kb/d to September’s output. Utah had 7 rigs operating in October.
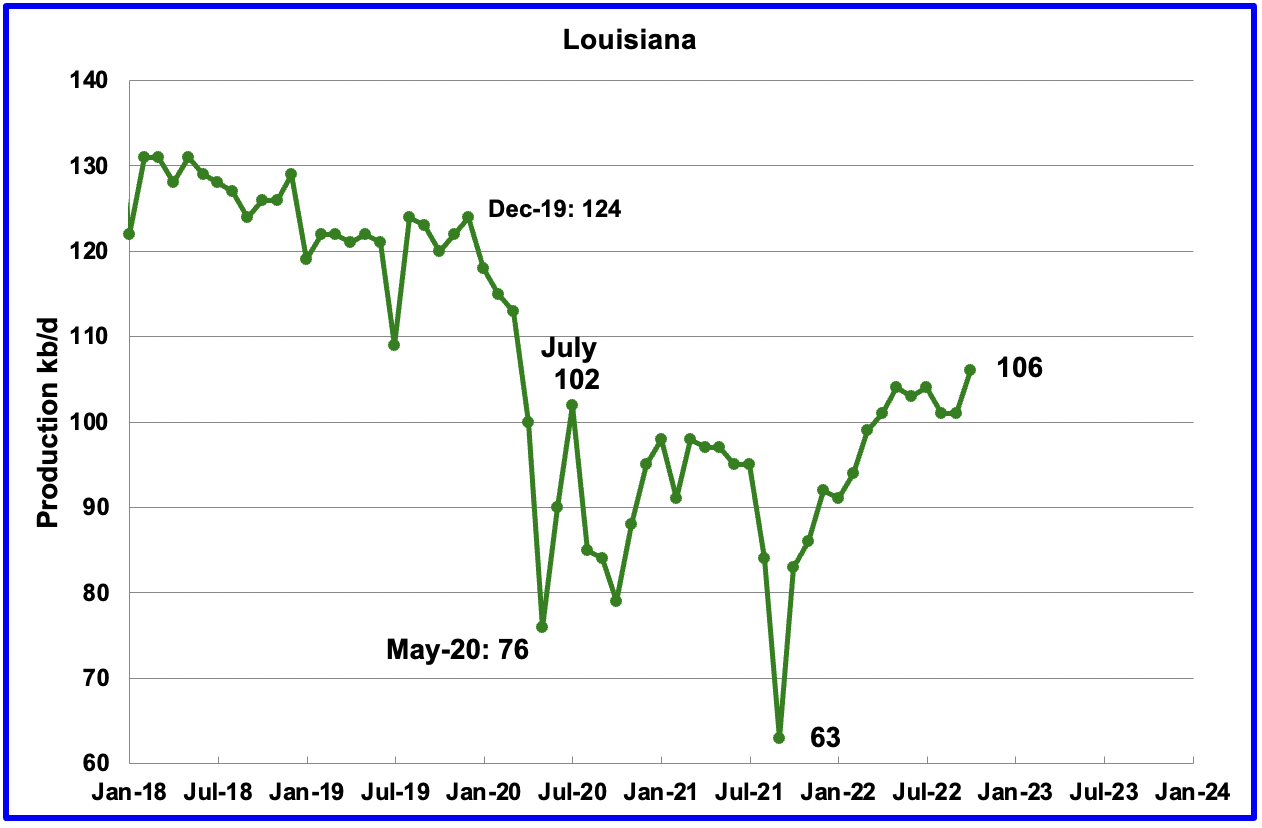
Louisiana’s output continues to climb from the low of 63 kb/d in September 2021. October’s output increased by 5 kb/d to 106 kb/d to a new post-pandemic high of 106 kb/d.
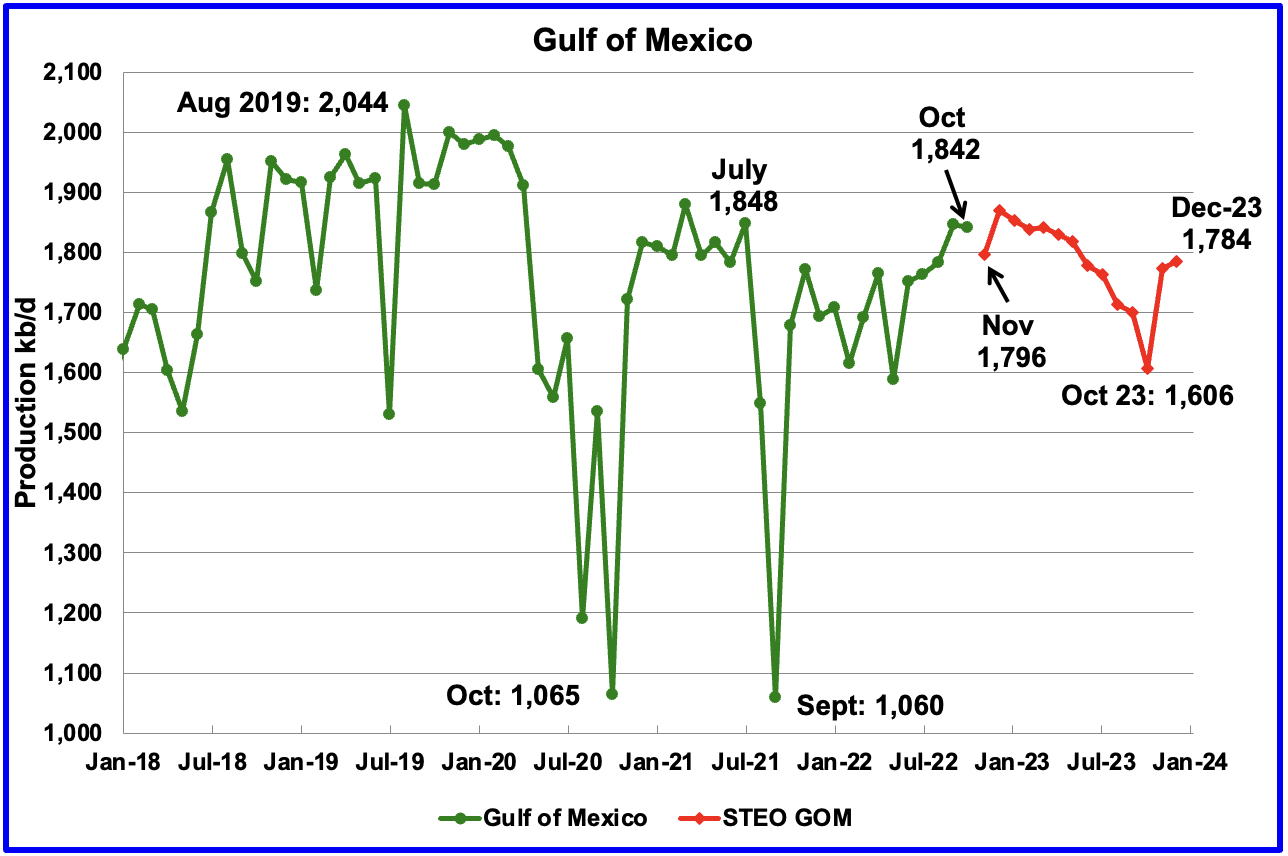
GOM production dropped by 5 kb/d in October to 1,842 kb/d. If the GOM was a state, its production would normally rank second behind Texas.
The December 2022 STEO projection for the GOM output has been added to this chart and projects output will be 1,784 kb/d in December 2023, 43 kb/d lower than reported in the November report. The production decline in 2023 is due to decline in existing GOM fields not being offset by the increases in crude oil production from the new fields mentioned below.
According to this source, the EIA expects nine new Gulf of Mexico fields to start production this year. The fields expected to come online this year include those at Argos/Mad Dog 2, Vito, Lobster, Dome Patrol, Olympus, Taggart, and the Kings Quay fields. The EIA noted that the large development fields at Argos/Mad Dog 2, King’s Quay, and Vito each has a peak production capacity of 100,000 barrels of oil equivalent per day or more.
An update from Equinor states that Vito startup has been delayed till early 2023.
A Different Perspective on US Oil Production
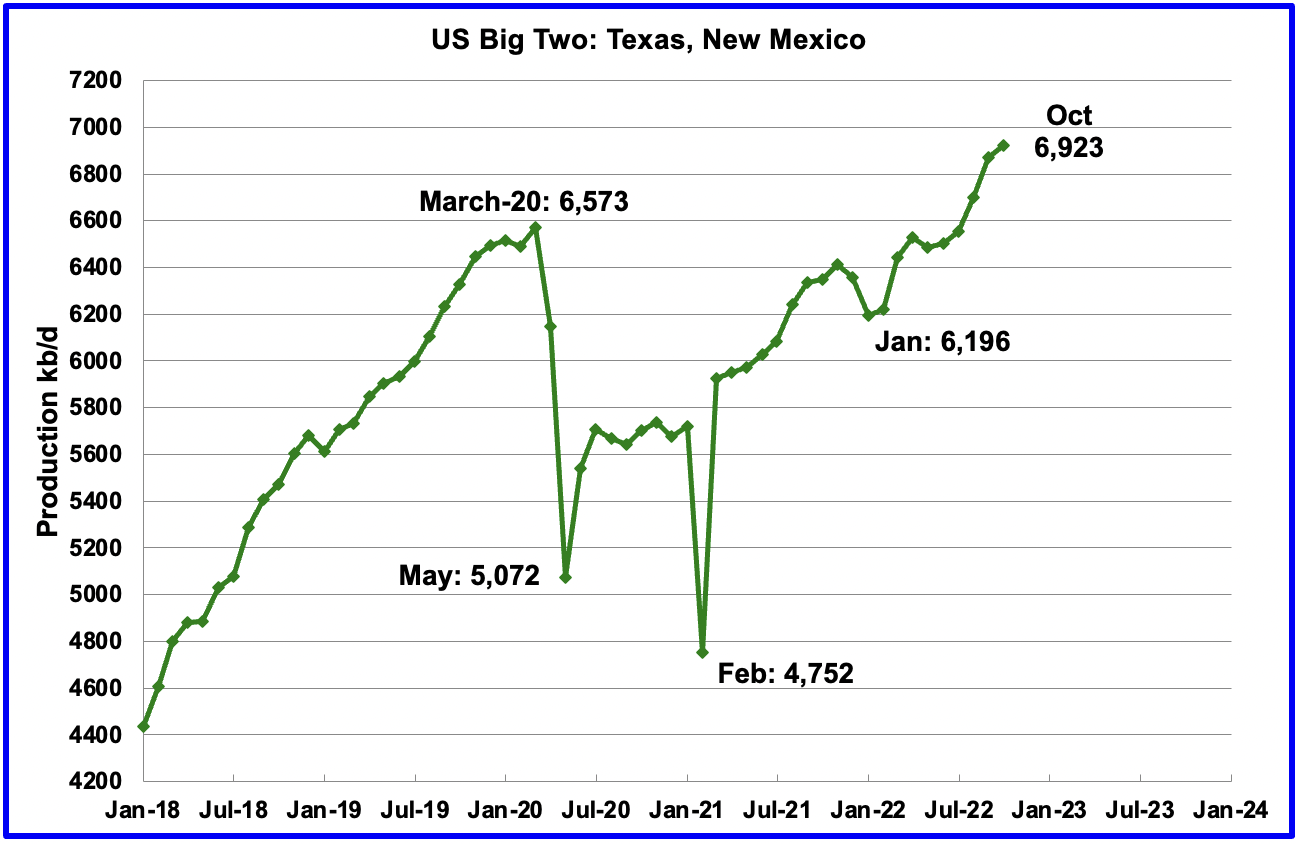
The Big Two states, combined oil output for Texas and New Mexico.
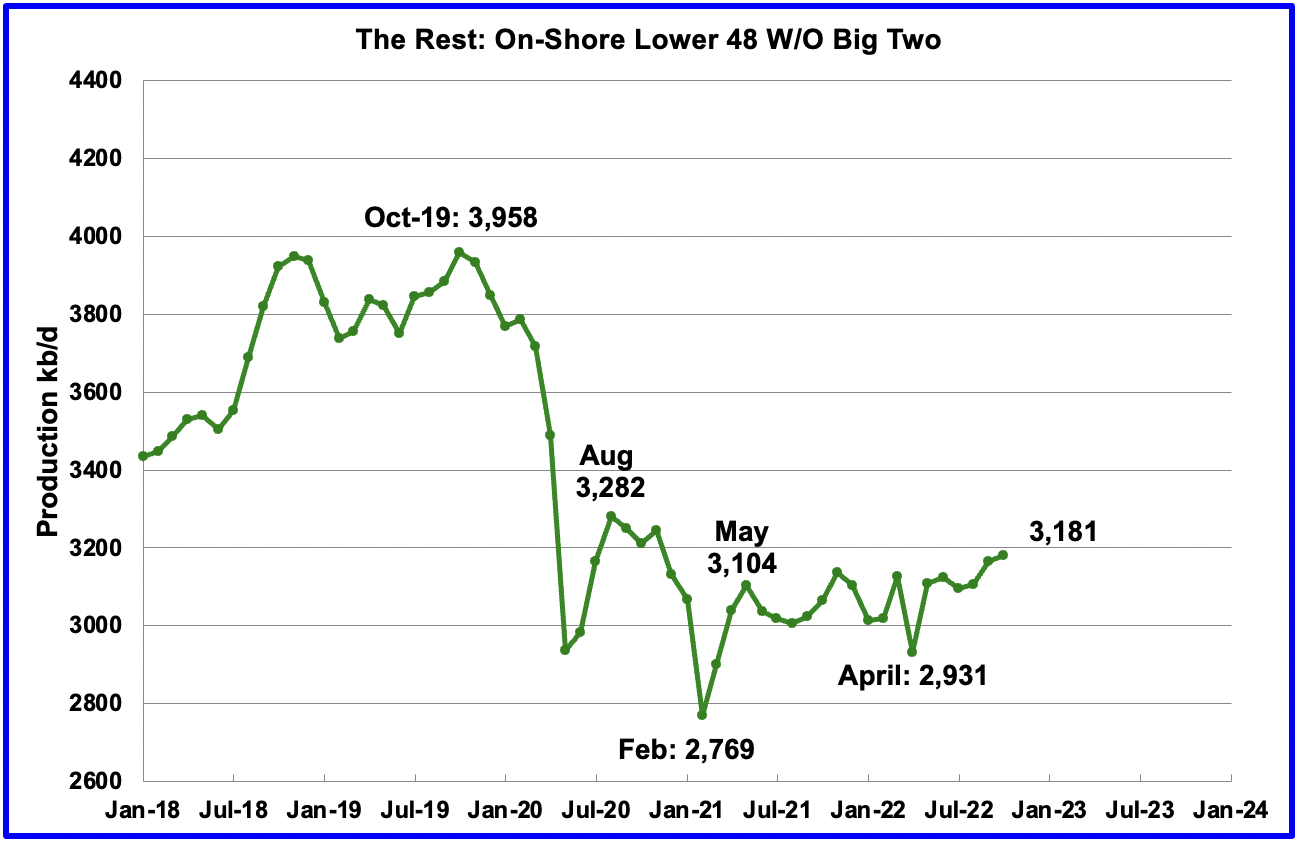
Oil production by The Rest
October’s production in the Big Two states increased by a combined 52 kb/d to a new high of 6,923 kb/d with Texas adding 11 kb/d and New Mexico 41 kb/d. In October The Rest increased output by 17 kb/d to 3,181 kb/d, most of which came from Utah 11 kb/d and Wyoming 7 kb/d.
The main thing to notice in the Rest Chart is that current production is 777 kb/d below the high of October 2019. The question we need answered Is “Is this a permanent loss that will never be recovered?”
Comparing May 2021 output with October 2022 output, the Rest have added 77 kb/d to US output, indicating a period of slowly increasing production.
Rigs and Fracs
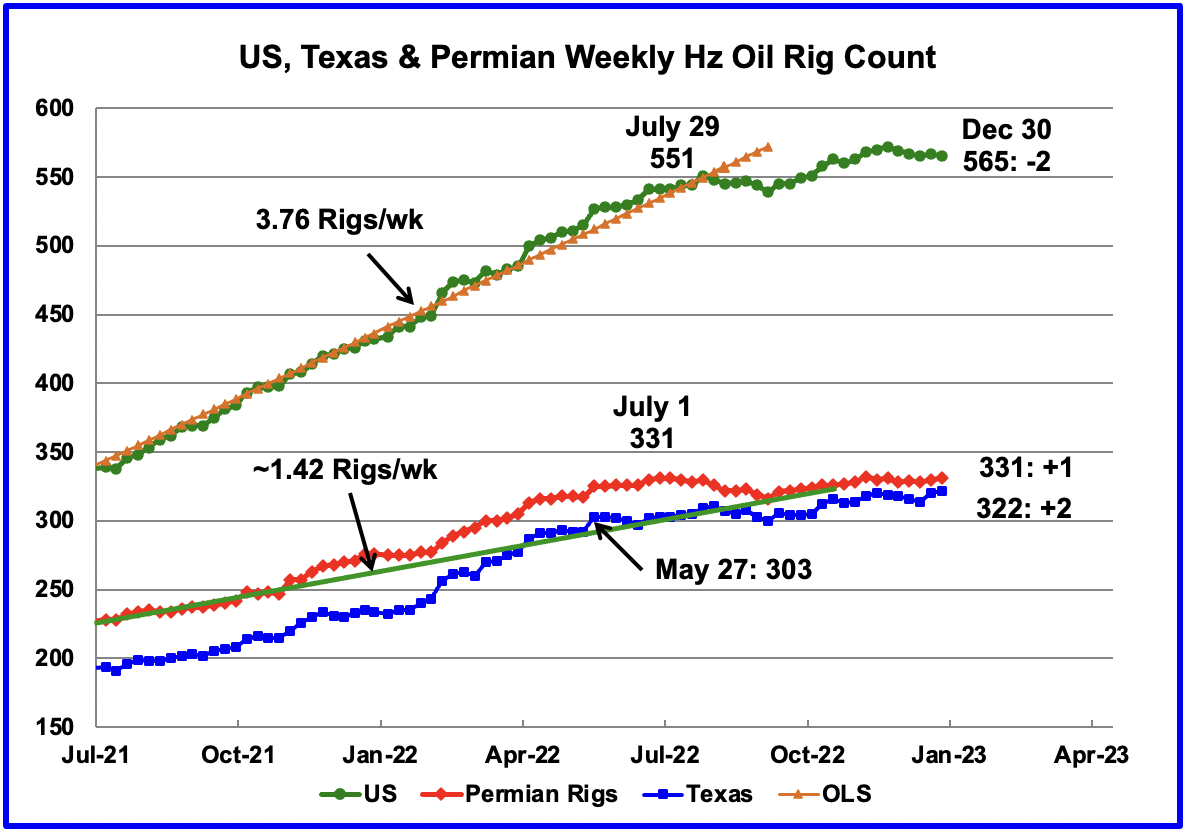
Since the beginning of April 2021 through to the week ending July 29, 2022, the US has been adding horizontal oil rigs at a rate of close to 3.82 rigs/wk, orange OLS line, and peaked at 551 rigs in the week ending July 29. However since then the number of operational rigs has wondered sideways. In the week ending December 30, the number of rigs decreased by 2 to 565.
In the week ending December 30, the Permian added 1 rig and Texas added 2.
In the Permian, the general trend for the number of operational rigs since July has been flat. This indicates that the growth in rigs has occurred primarily in the other US basins.
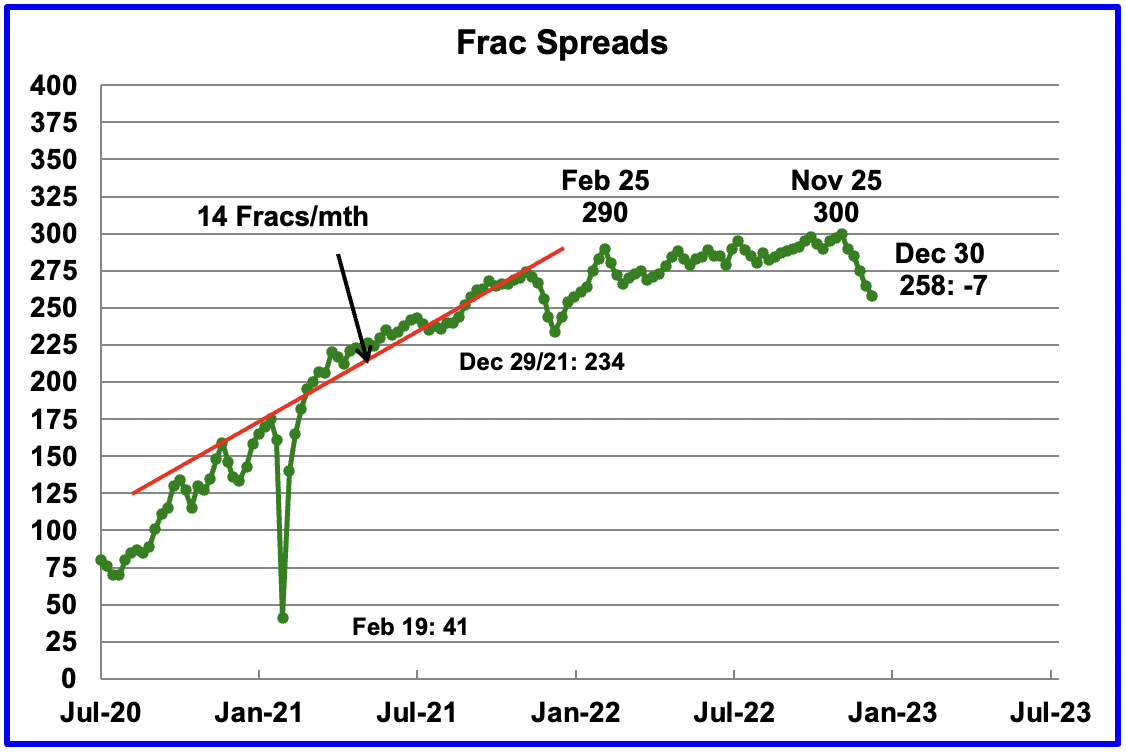
For frac spreads, the general trend since late February can best be described as essentially flat around the 290 level but with a hint of a slow increase toward 300 frac spreads. However for the week ending December 30, the count dropped by 7 to 258 for an overall drop of 42 since November 25. This is the end or close to the end of this dropping period as this is the slowdown associated with Thanksgiving and Christmas holidays. A similar trend occurred last year.
Note that these 258 frac spreads include both gas and oil spreads.
In a YouTube video I came across the other day, the commentator said that of the 300 Frac spreads operating in the week ending November 25, 160 were in the Permian. This is consistent with other reports that have stated that 1/2 of the frac spreads are in the Permian. No indication of the split between oil and gas.
Drilling Productivity Report
The Drilling Productivity Report (DPR) uses recent data on the total number of drilling rigs in operation along with estimates of drilling productivity and estimated changes in production from existing oil wells to provide estimated changes in oil production for the principal tight oil regions. The December DPR forecasts production to January 2023 and the following charts are updated to January 2023.
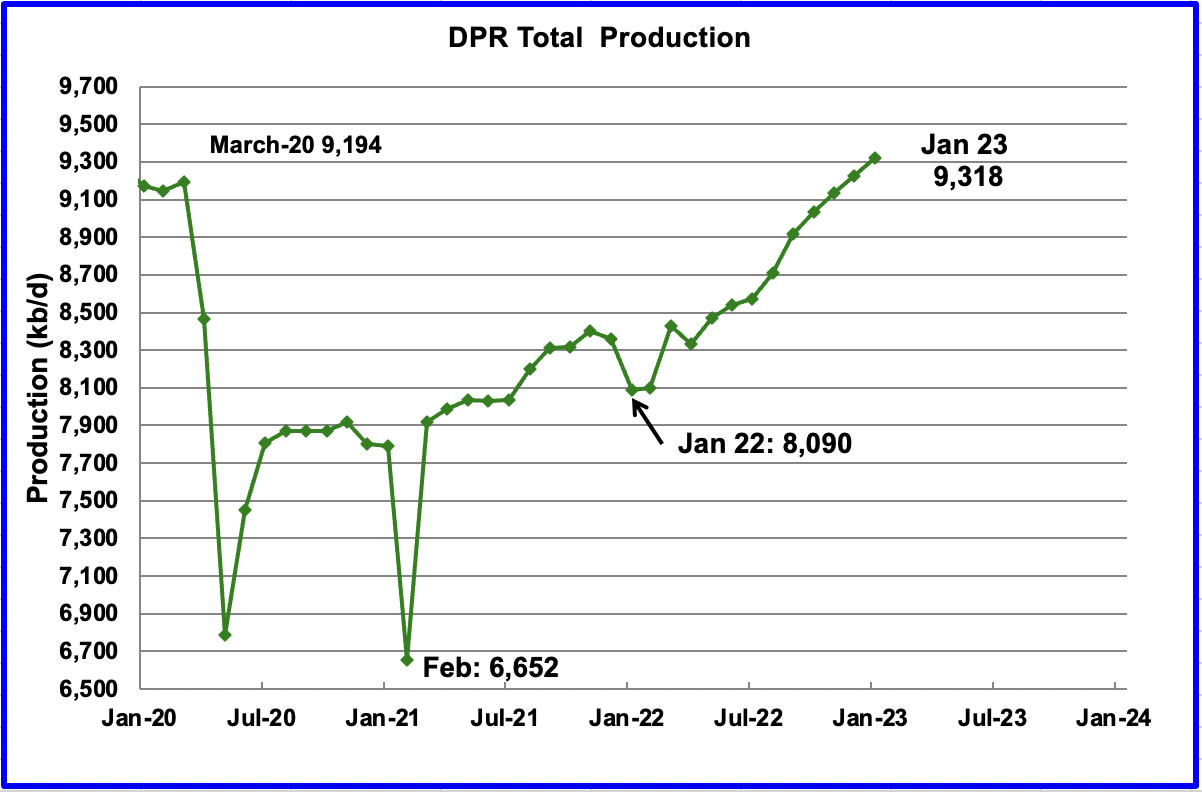
Above is the total oil production projected to January 2023 for the 7 DPR basins that the EIA tracks. Note that DPR production includes both LTO oil and oil from conventional wells.
The January DPR report made made minimal revisions to the the December report. For instance, December output was revised up by just 34 kb/d. The DPR is projecting that oil output for January 2023 will increase by 94 kb/d to 9,318 kb/d. January’s output is projected to be 45 kb/d higher than the pre-pandemic high of 9,273 kb/d.
From January 2022 to January 2023, output in the DPR basins is forecast to increase by 1,228 kb/d or by an average growth rate of 102.3 kb/d/mth. This high growth rate is almost double the rate, 48.3 kb/d/mth, shown in the LTO report in the next section. Since the LTO underwent a significant downward revision, a similar revision could be made to the DPR report next month.
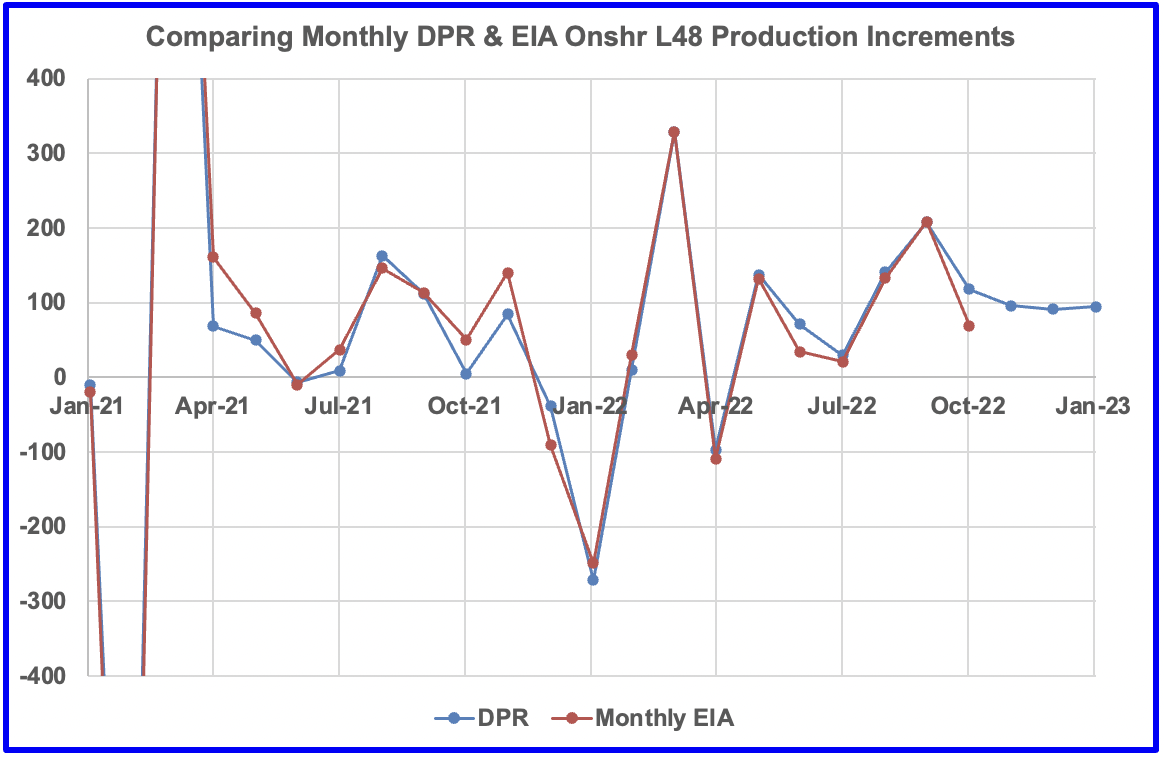
This is a comparison of the DPR’s Monthly output increments, as taken from the January 2023 DPR report, with the EIA’s monthly output increments for the Onshore L48 states. The October EIA data point was released after the DPR report was issued. The DPR got the increment correct directionally, i.e, it would be smaller in October than in September, but was smaller than predicted, 69 kb/d vs 118 kb/d.
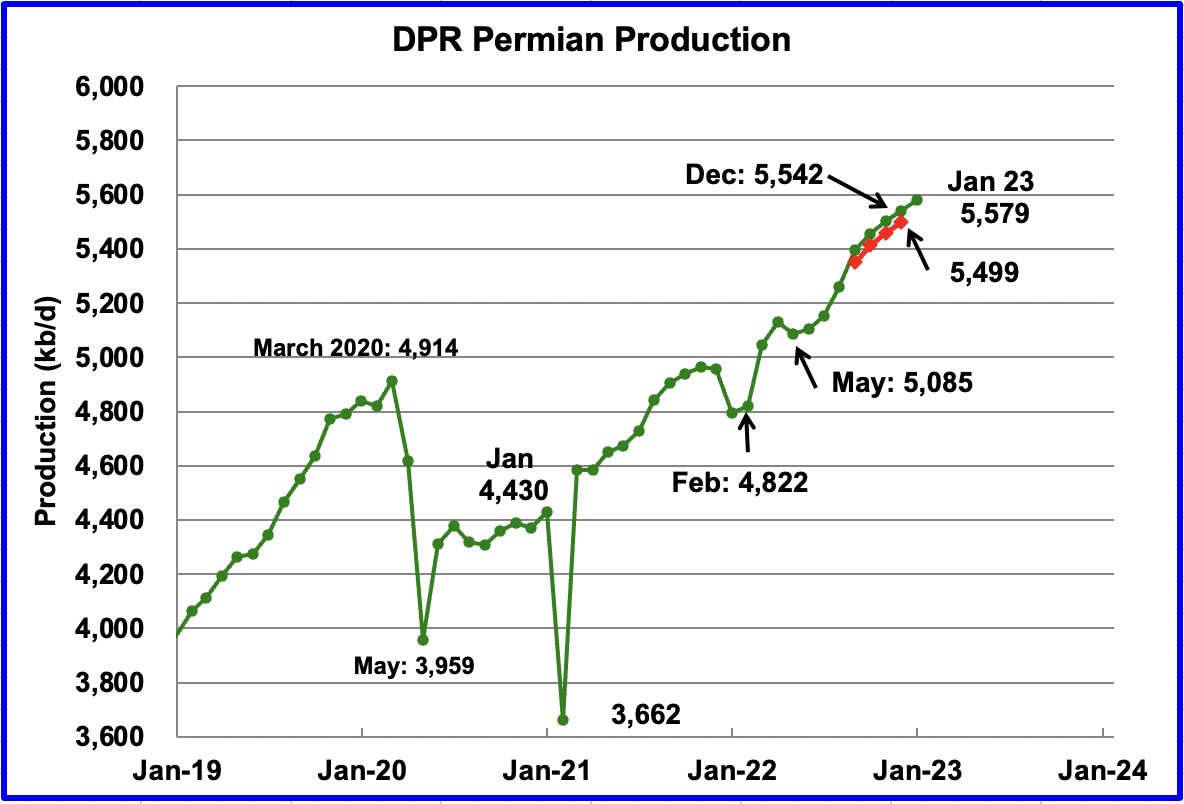
Permian output continues to rise in January. Production is expected to increase by 37 kb/d to a new high of 5,579 kb/d, which is also 80 kb/d higher than the December 2022 output published in the previous post due to revisons. Revisions have increased December output, red graph, by 43 kb/d. From May to January, production is forecast to increase by 494 kb/d or at an average rate of 61.8 kb/d/mth.
If the Permian were part of OPEC, at 5,579 kb/d it would be the second largest producer after Saudi Arabia.
In September 2022, output increased by 135 kb/d. The January increase is less than third of that at 37 kb/d. Is that a sign of slowing production in the Permian or just due to updated revisons??
During November, 427 wells were drilled and 435 were completed in the Permian. (Note that November is the latest month for DUC information). The completed wells added 366 kb/d to November’s output for an average of 841 b/d/well. The overall decline was 320 kb/d which resulted in a net increase for Permian output of 46 kb/d. Of the 435 completed wells, 381 were required to offset the decline. The completion of 8 extra DUCs over the drilled wells contributed 6.7 kb/d of the overall 46 kb/d increase, or 14.6%.
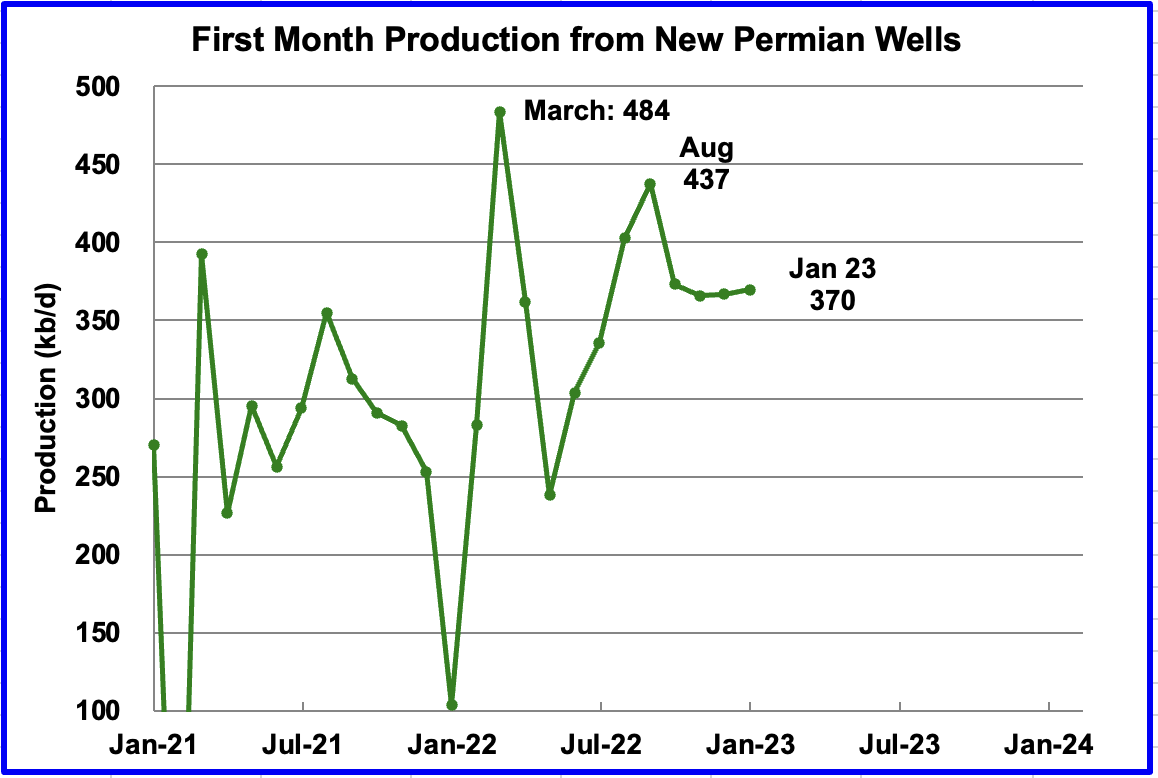
This chart shows the average first month total production from Permian wells tracked on a monthly basis. Since July 2022, the volatility shown in prior months has been reduced. Assuming the latest information is correct, total monthly production from the newest Permian wells may have stabilized around the 370 kb/d level. Part of the flat production shown is related to an essentially unchanging number of wells being completed, 435.
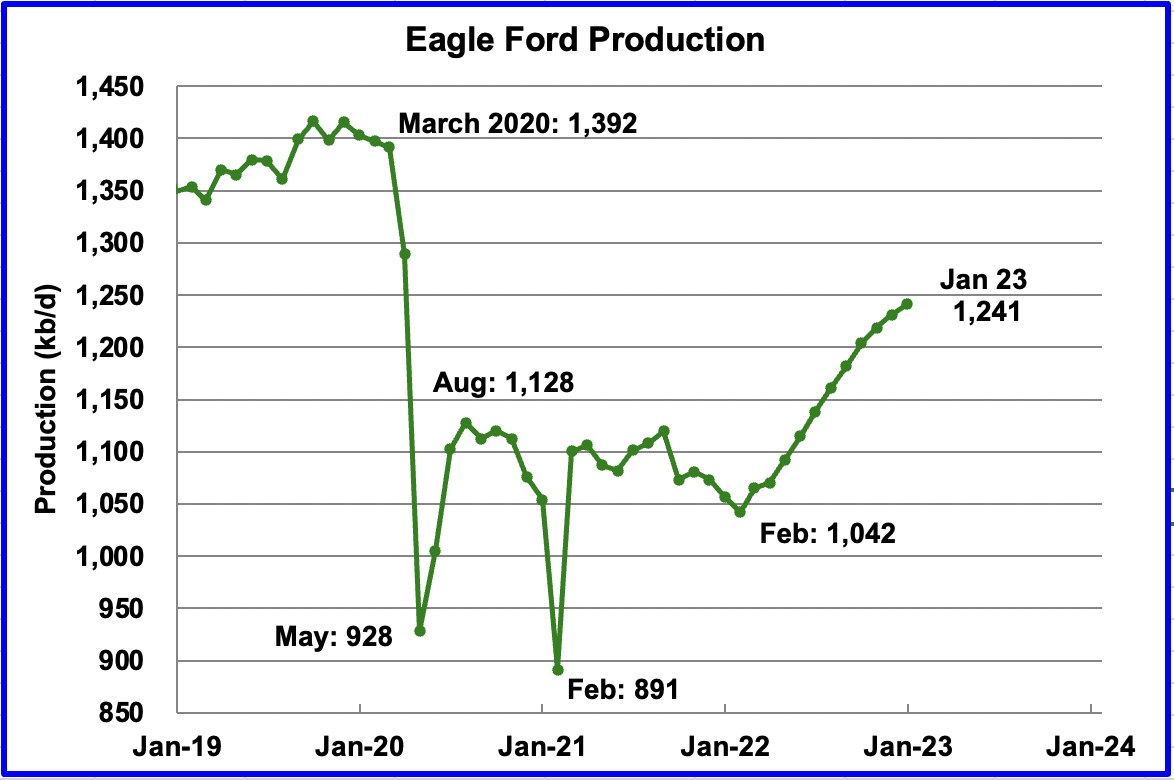
Output in the Eagle Ford basin has been showing an increasing trend since March 2022. For January, output is expected to increase by 10 kb/d to 1,241 kb/d. At the beginning of the year, 43 rigs were operating in the EF. As of December, 66 are operational and may account for the increasing production.
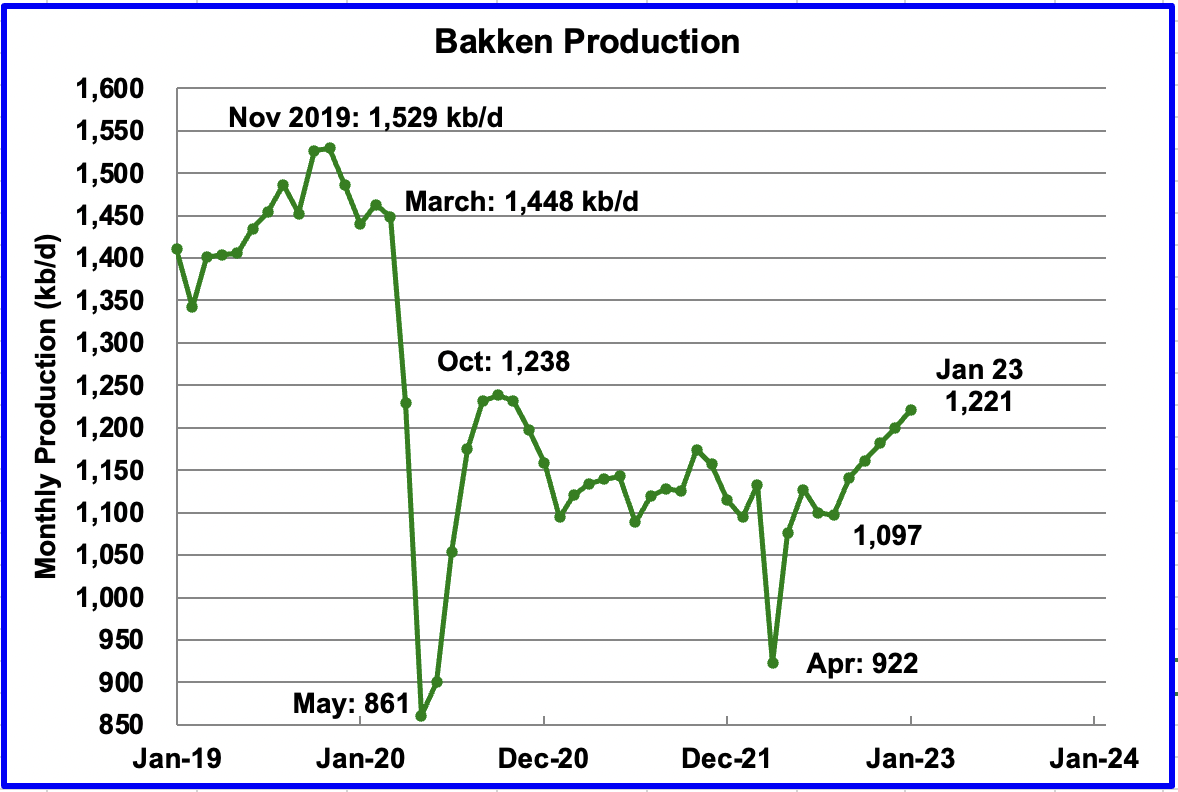
The DPR forecasts Bakken output in January will be 1,221 kb/d an increase of 20 kb/d over December. Production from September and onward looks optimistic considering the extreme weather that North Dakota has experienced recently.
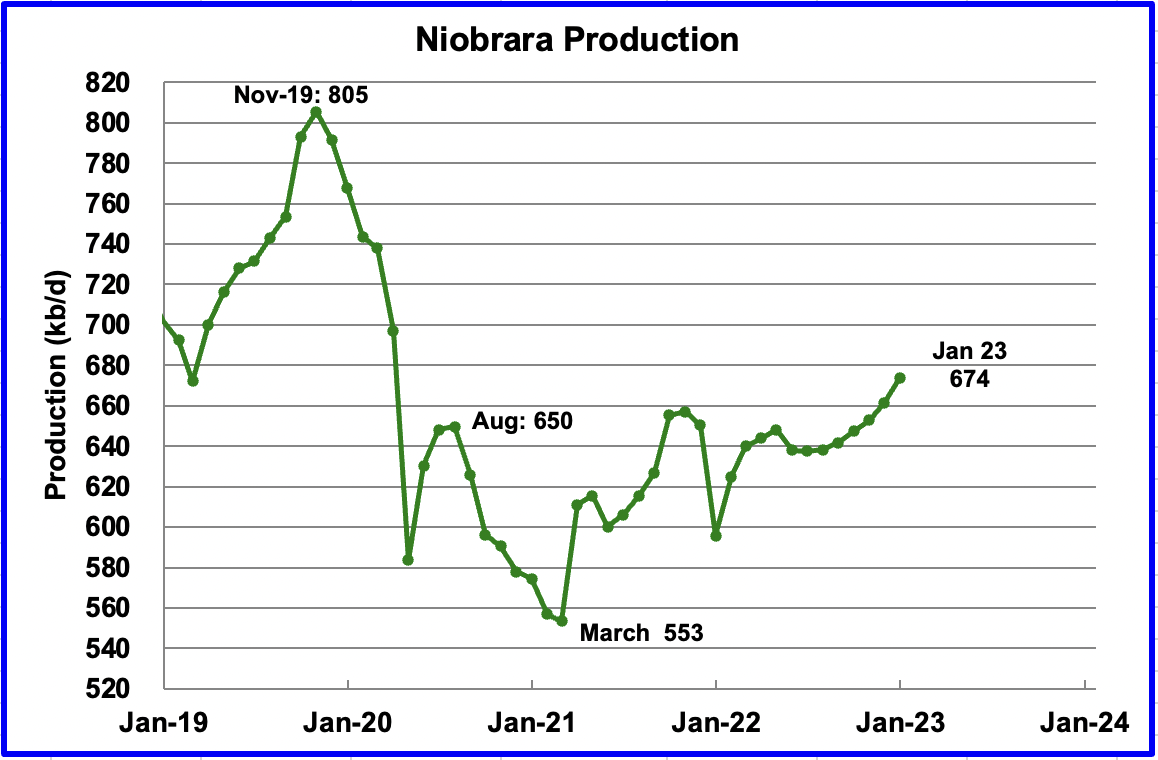
Output in the Niobrara continues to increase slowly. January output increased by 12 kb/d and set a post pandemic high of 674 kb/d.
The Niobrara had 12 rigs operating in January. By November, the count had increase to 19. In January, 83 wells were completed. By November, monthly completions increased to 112, which accounts for the increasing production. Further the number of wells drilled went from 56 in January to 75 in November and drilled exceeded completed by 10 in November.
DUCs and Drilled Wells
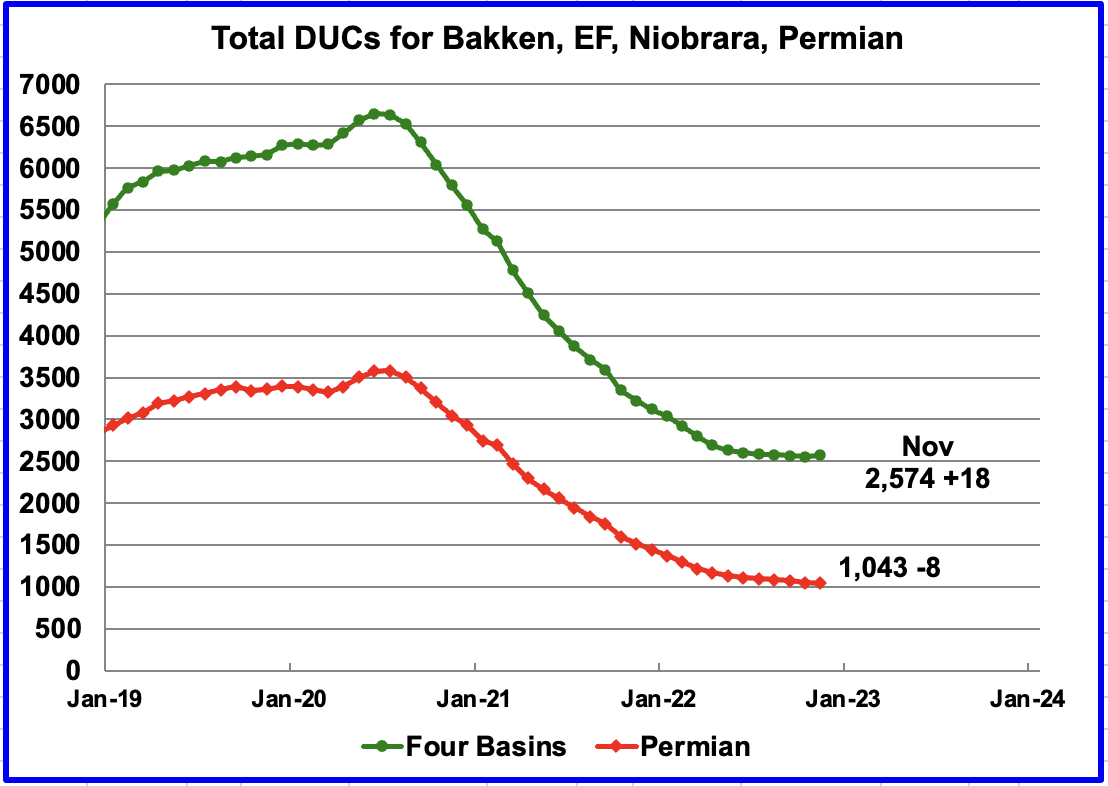
The number of DUCs available for completion in the Permian and the four major DPR oil basins has fallen every month since July 2020 but that trend has now reversed. In November the trend for total DUCs changed and increased by 18.
In the Permian, the change in the monthly completion rate for DUCs has slowed from a recent high of 82 in March to a low of 8 in November. However in the Niobrara, 143 wells were drilled and 112 were completed for an overall net increase of 18 DUCs to 2,574 in the four basins.
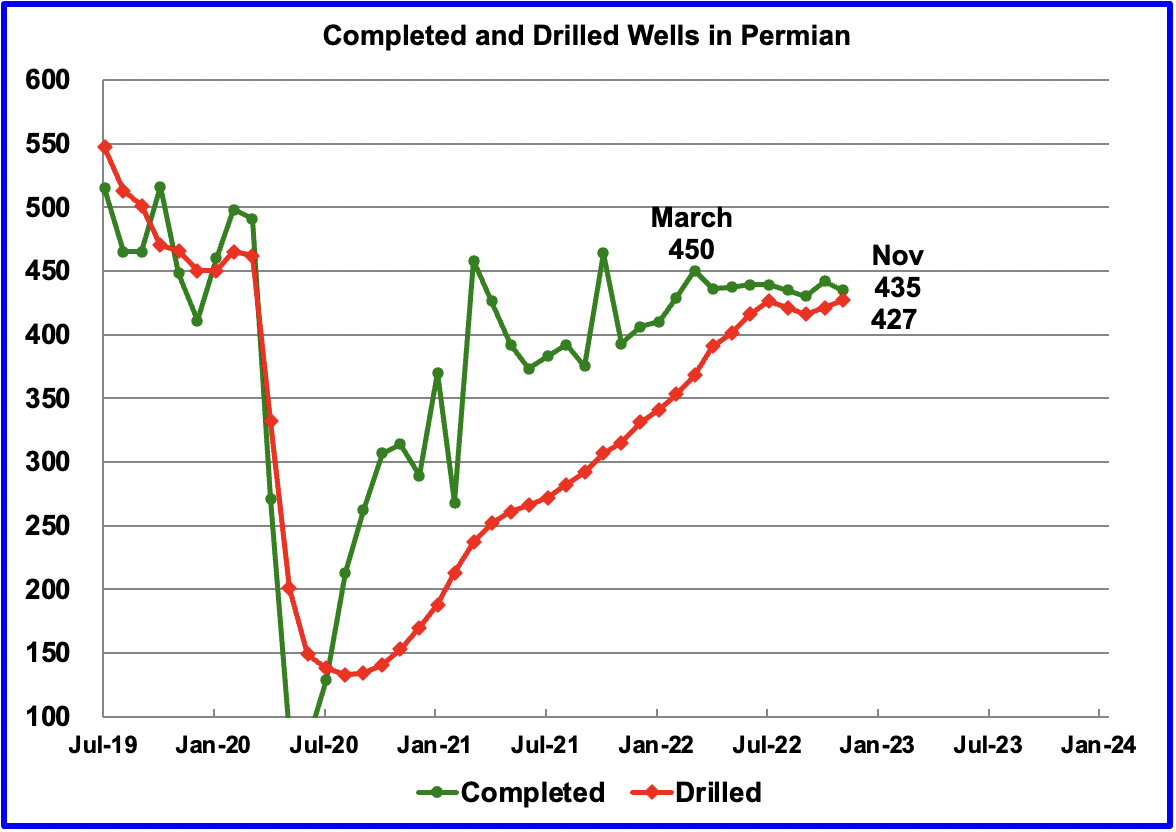
In the Permian, the monthly completion rate has been showing signs of slowing since the recent March peak of 450. This is consistent with the frac spread chart shown above where there has been little to no growth in frac spreads since February. Also the Permian rig count has been essentially flat since July.
In November 435 wells were completed, 7 fewer than in October and 15 fewer than in March. During November, 427 new wells were drilled, an increase of 6 over October. The gap between drilled and completed wells in the Permian has now reached new post pandemic low of 8.
December Light Tight Oil Update
The EIA’s LTO database provides information on LTO production from seven tight oil basins and a few smaller ones. The December 2022 report updates tight oil production to November 2022.
This is the fourth LTO report published since it was updated due operational issues. While the first report revised production down, a bit much it appears, the second and third reports revised production up. The current fourth update has reversed direction and made a significant downward revision to the production reported in the previous report.
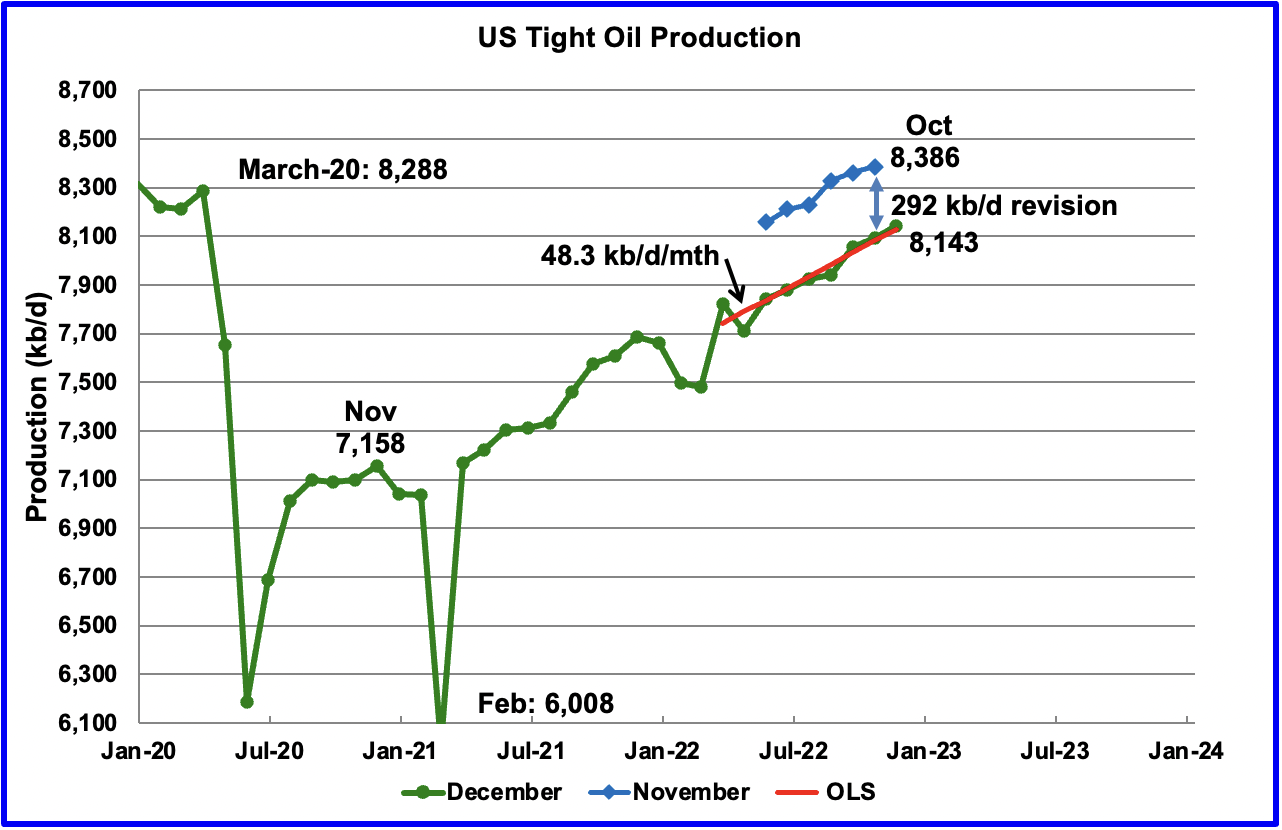
According to the latest LTO report, November’s LTO output increased by 49 kb/d to 8,143 kb/d.
However the December report made a significant downward revision to projected US LTO output reported in the November report. For instance October production in the November report has been decreased from 8,386 kb/d to 8,094 kb/d in the current report, a decrease of 292 kb/d.
The red OLS line from March 2022 to November 2023 indicates a monthly production increase of 48.3 kb/d/mth.
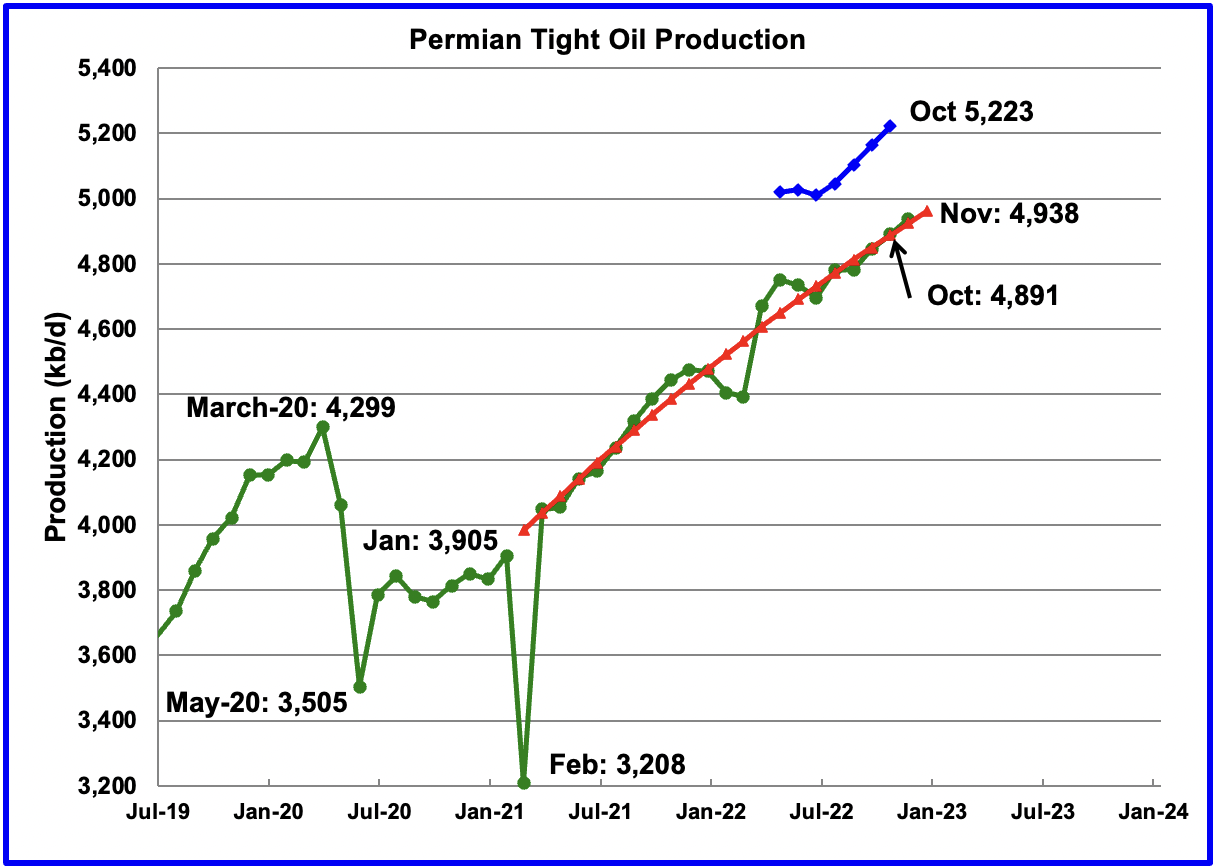
November’s output increased by 47 kb/d to 4,938 kb/d and is 639 kb/d higher than the high of 4,299 kb/d recorded in March 2020. Also shown is the October output, blue graph, from the previous post. The December LTO report revised October’s output down by 332 kb/d to 4,891 kb/d.
The monthly production increments for the last three months appear to be smaller than those around June 2021. Is this an early indication of slowing output in the Permian? In July 2021, completions were around 400/mth while the current rate is closer to 435/mth and have been steady at close to that level for the last 8 months.
To better asses whether there is a slowing trend, a quadratic least squares, QLS, was fit to the data from March 2021 to November 2022, red graph. The monthly production rate in March 2021 is 53.6 kb/d/mth. At November 2022, the monthly rate is 36.4 kb/d/mth. This slowing growth trend can be attributed to the almost steady completion rate of 435 wells per month and possibly lower quality wells. See next chart
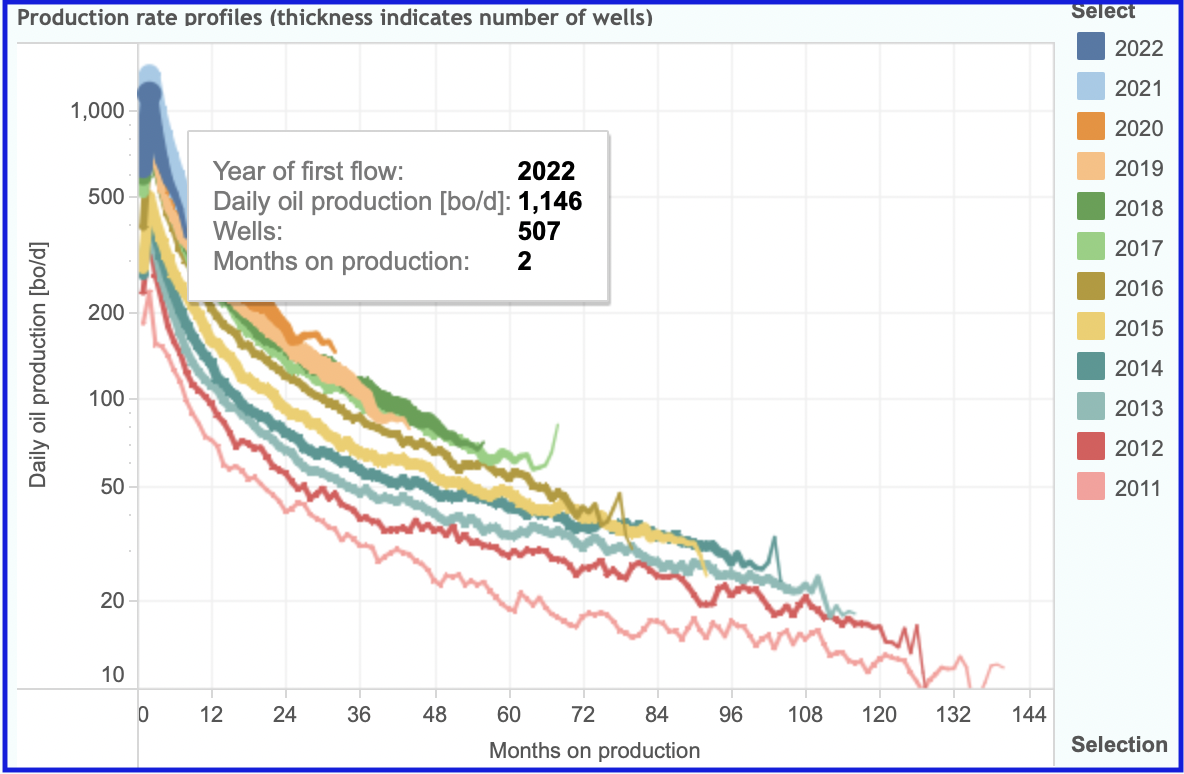
Above is a chart taken from Novi Labs. It shows peak production from the wells in Lea county, rated as one of the best Permian counties for productive oil wells, are lower in 2022 than in 2021. Peak production for the 2022 wells is 1,146 kb/d compared to 1,334 kb/d for the 2021 wells. To better assess the effect of the lower peak production, total output after one year should compared.
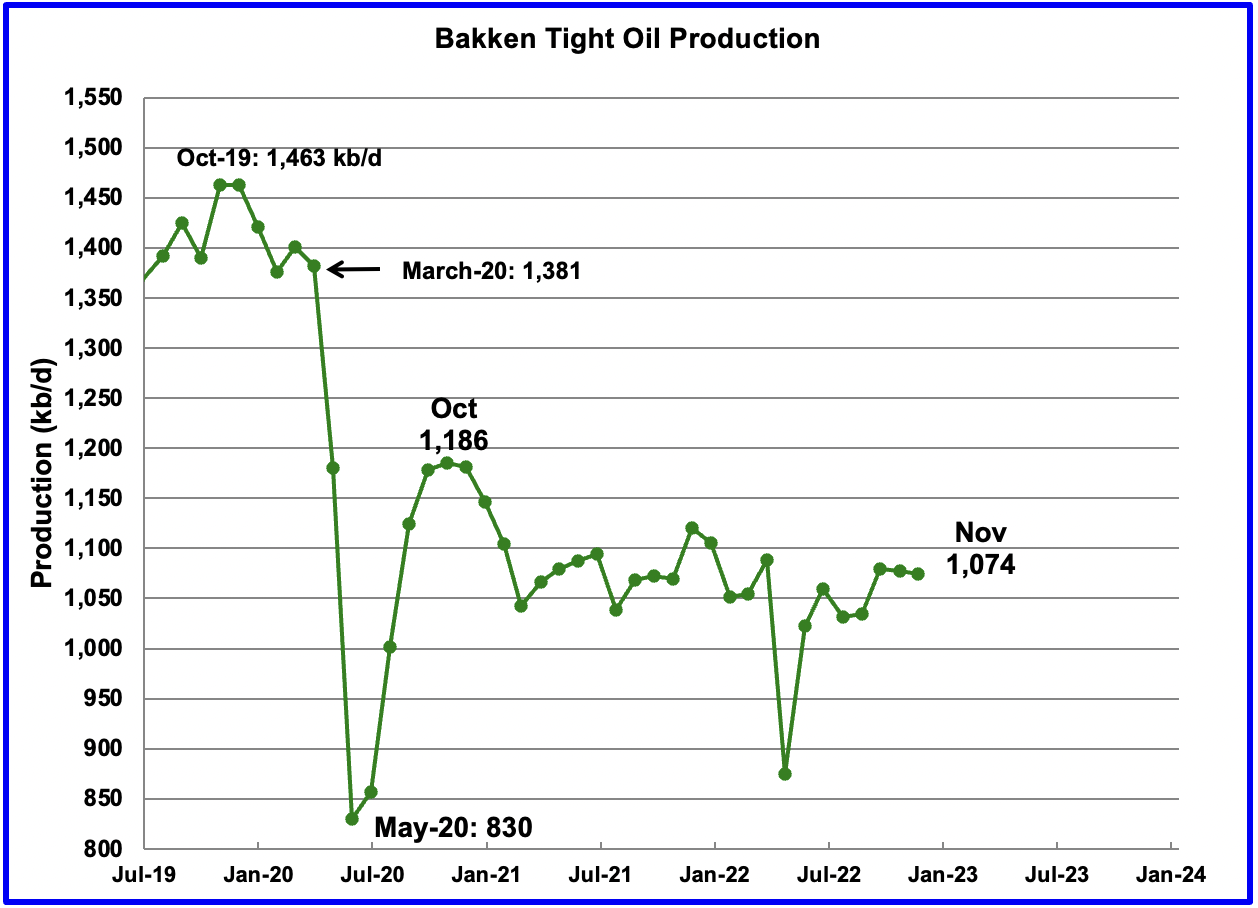
The Bakken’s November LTO output decreased by 3 kb/d to 1,074 kb/d. For comparison, note in the DPR Bakken report, November production increased by 21 kb/d and increased steadily from August to December.
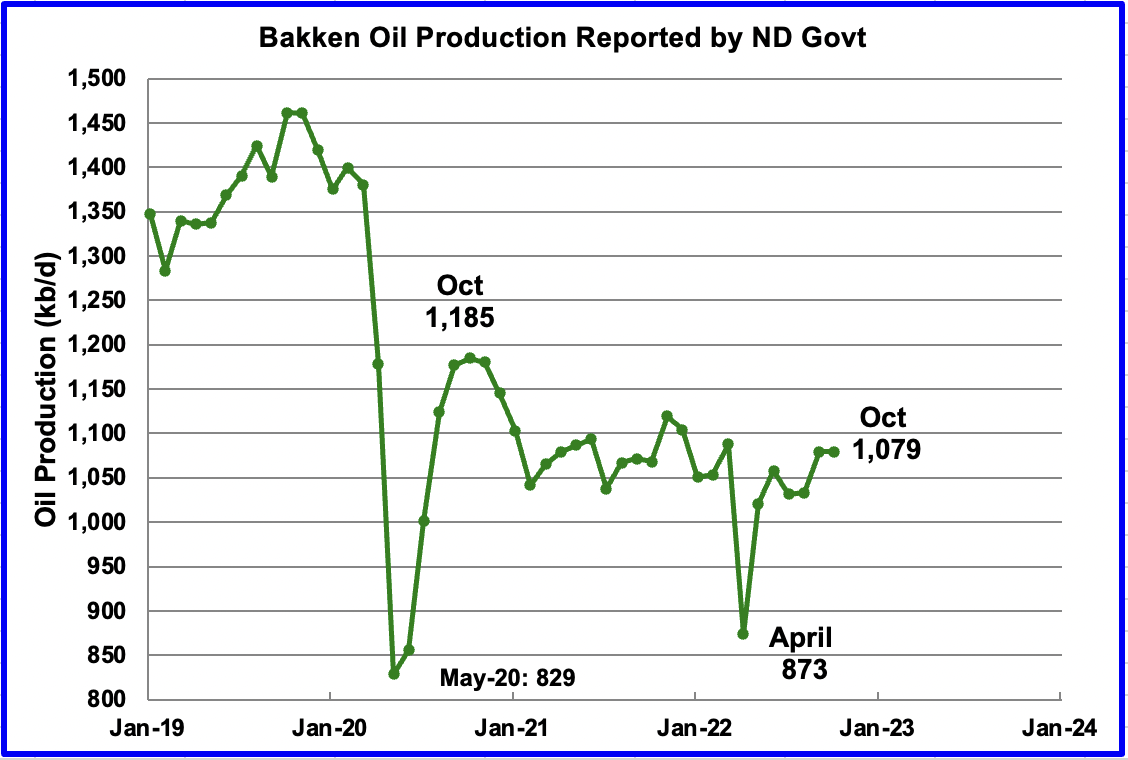
This chart shows the Bakken’s output as reported by the North Dakota Oil and Gas Division. October production was unchanged from September at 1,079. Up to October, the trends in the two charts are essentially the same.
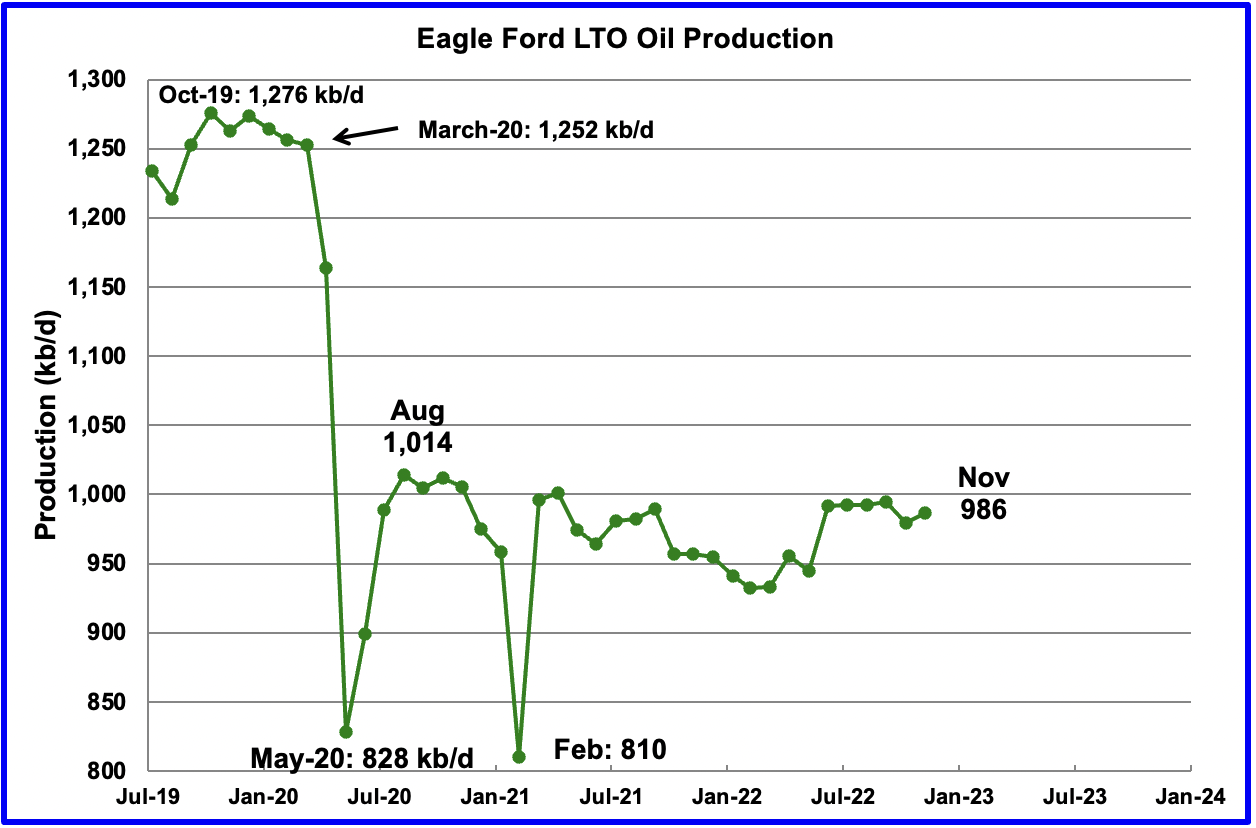
Production in the Eagle Ford basin increased by 7 kb/d in October to 986 kb/d and is little changed from March 2021. In the DPR section, November production is 1,219 kb/d and overall production is increasing.
The reason for the difference could be associated with the revised data in the LTO report that was not available to the DPR group at time of publishing.
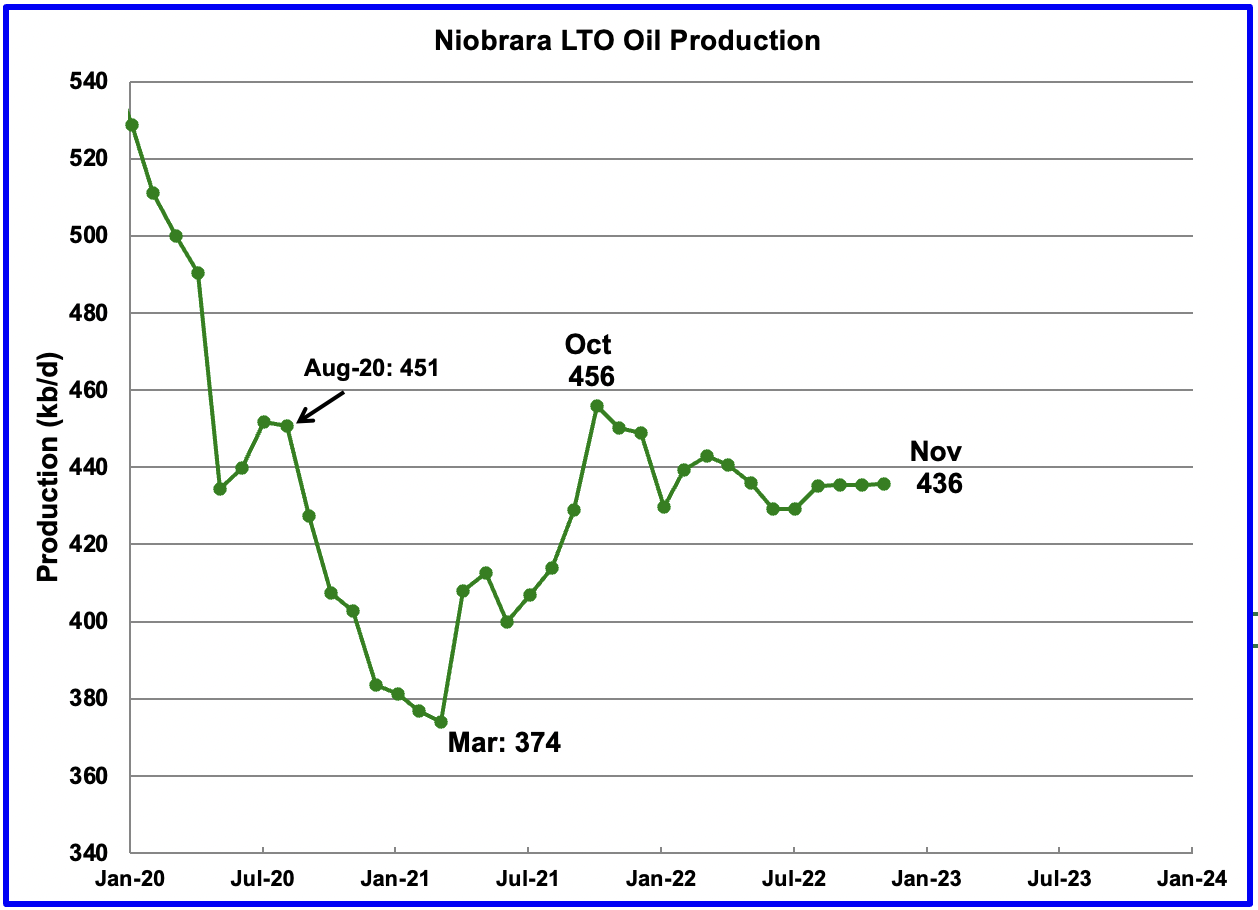
After increasing production from March 2021 to October 2021, output in the Niobrara began to drop in November 2021. Production since April has shown little growth. October’s output increased by 1 kb/d to 436 kb/d and has been essentially flat for the past four months.
Onshore L48 Conventional Production
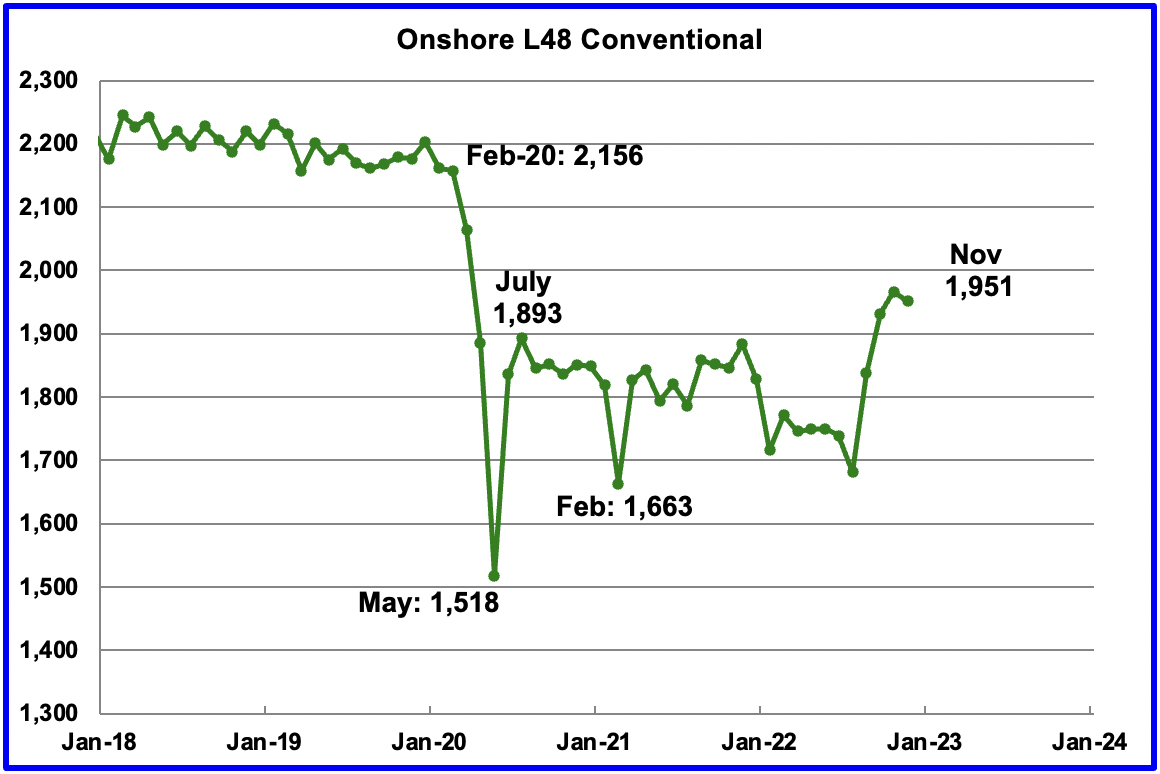
Conventional oil output in the Onshore L48 dropped by 15 kb/d in November to 1,951 kb/d and is 58 kb/d higher than July 2020. This estimate is based on a combination of the expected November LTO output and the December 2022 STEO report that has a November 2022 forecast for the US Onshore L48 output.
The big production increase in conventional crude in August 2022 is due to the the massive downward revision to LTO production shown in the first chart of this section. Note that the conventional oil estimate comes from subtracting two large numbers and is quite volatile on a month to month due to revisions.
201 responses to “US October Oil Production Pushed Higher by New Mexico”
This is a repost from the last thread:
WTI average prices for 2022 are now out:
Jan = 83.22
Feb = 91.64
Mar = 108.50
Apr = 101.78
May = 109.55
Jun = 114.84
Jul = 101.62
Aug = 93.67
Sep = 84.26
Oct = 87.55
Nov = 84.37
Dec = 76.41
2022 average closing price = 94.53.
My prediction for 2022 was $90 while Ovi’s prediction (if he remembers) was $100 so I beat him by a hair. Not bad predictions though.
My prediction was based on the post-Covid recovery of the Word economy. What I hadn’t
counted on was Russia’s invasion of Ukraine, Bidens’ release of SPR oil, China’s lock down of major cities, and dramatically higher interest rates.
My prediction for 2023 is $100/barrel average closing price for WTI. Is anyone else willing to make a prediction?
Frugal
Thanks for reminding me of that bet. Who would have thunk that we saw through all of those twists and turns.
As for next year, I will raise you by 10 to 110. I think that crude will slowly climb to 120 at which time OPEC plus will have to enter the market to get the price back down to $100 and they will try to keep it in the range 100 to 120. They will also be concerned with triggering a slow down. The big question will be will the have the reserves to control the price.
Happy New Year.
My guess for average oil prices in 2023 is $90/bo (nominal price), This is for WTI crude oil price, Brent would be 3 to 5 per barrel higher.
Great, we have covered the range 90 to 110.
My guess is even lower. The production costs aren’t increasing significantly, and producers are competing against each other. The main drivers a high oil prices are panics driven by unusual events, and the Ukraine war is so big that it is hard to think of another political event that would noticeably increase blood pressure. It’s a bit like the Arab Spring. Initially it caused a panicky oil price spike, but it subsided into the background noise after a while, and prices fell.
$97 WTI
I’m marking all these predictions down. Unfortunately we won’t find out who “wins” for another year.
We should have a good clue by September.
Put me down for 110.
Separately – I would not be surprised if slowly but surely we are going to see oil priced in other currencies. India is buying Russian oil and paying in Rupees. I suspect that this is not going to be an outlier.
When the west grabbed dollar dominated Russian assets after the Ukraine war started is going to make countries think twice about having large USD balances that the US / the west can get its hands on.
Rgds
WP
Totally agree Windpeak and the worst is yet to come if and when oil and other assets are priced in real money – gold & silver! Its only a matter of time when real assets are priced in real money.
I’ll venture $92 based on the uptake of EV’s worldwide, possible recession, and renewed impacts from Covid. Countering that will be depletion rates, poorer quality wells, and inflation in drilling costs and wages.
$60/Barrel
I’m going with $60 also
Frugal,
Did I make a guess? I don’t remember if I did or what it was if i did.
Dennis, no I didn’t get a guess from you for 2022 — it was just me and Ovi who did the guessing that year.
But I’ve recorded your 2023 guess ($90 for WTI and + $3-5 for Brent).
Best of luck, it’s not easy guessing future oil prices.
Hi Frugal,
See
https://peakoilbarrel.com/opec-update-january-22-2022/#comment-734338
I did guess Brent would be $90/b in 2022 and at that time the spread was roughly $5/b between Brent and WTI so a WTI price of $85/b was implied. So your guess and Ovi’s were both better than mine. At that time I also guessed $95/b for WTI ($100/b for Brent) for average price in 2023. But I like my more recent guess of $90/b for WTI average annual price in 2023.
Sorry I missed your guess for 2022 but it looks like all of us were pretty good at guessing!
FWIW – agree with Dennis’ estimate, might add some more downside potential, so $80 to make it interesting…
average WTI: $120
average brent: $135
with maximum around for WTI $160 beating 2008 all time high
Saya, your predictions are now recorded.
Frugal,
Interesting, now we have 60 to 120 covered for average annual WTI price in 2023.
60, 90, 97, 100, 110, 110, and 120 so far, the average is $98.14/bo.
Dennis,
Maybe multiple guesses averaged out make better predictions. We’ll find out if this hypothesis holds?
Yes, a multiple guess average is almost always better than individual guesses, but all of the guesses need to be by knowledgeable people and be independent of each other. My father taught statistics and used to have a class of students independently guess the length of a short rod he would hold up in front of them. The average was usually within 1/8th of an inch of the actual length.
Not only are multiple guesses better, you can weight the guesses based on previous performance and get an even better result.
That’s how products like H2o.AI work. They create a bunch of models, test them on subsets of the test data, weight the results, then produce a prediction on real data based on a weighted aggregation of the models.
That means that mixing in results from models you know perform badly can improve your best model. This may be because different models pick up on different aspects of the data, so a badly performing model could provide information on aspects of the data that better performing models overlook.
Seems that prices will depend on the economy. While it strives, prices will go up. When it tanks, it will take down the barrel. Therefore my humble guess for the first half of 2023 is 110$, and for the second half 70$. Average price and my final guess (WTI): 90$, Brent slightly higher. Rien ne va plus …
Adding HHH at $50/b and West texasfanclub at $90/b to previous guesses brings the average to $91.89/bo. with a range of $50/b to $120/b. The Median estimate is $$97/b.
50, 60, 90, 90, 97, 100, 110, 110, 120 are the guesses so far for average annual WTI closing spot price in 2023.
Not understanding where you get $98.14 Dennis. Are you talking about 2023 so far?
Stephen,
It is the average of the guesses for annual average 2023 WTI closing prices. If there are 7 guesses g1 to g7, I take the sum of g1 to g7 and divide by 7 then round to nearest 2 decimal places. I may have made a calculation error, the list of guesses is given, the most recent average is $91.89 for 9 guesses with a median of $97/b. You can check my arithmetic.
@Svaya, your prediction is in line with Pierre Andurand’s:
https://twitter.com/AndurandPierre/status/1612050453201817600?ref_src=twsrc%5Egoogle%7Ctwcamp%5Eserp%7Ctwgr%5Etweet%7Ctwtr%5Etrue
The supply side clearly points towards a large rise in prices this year. And China is “making its best” to immunize its population against Covid.
On the other side, IMF expects 1/3 of the countries to be in recession in 2023. This guess could easily be overcome.
I also see 2008 record being beaten with Brent future rising over 150$/bbl, but this would not be sustained. Therefore my bet would be lower than Svaya’s: WTI 115, Brent 125.
EIA just posted daily closing spot prices for the last week of December yesterday. I get an average annual WTI spot price for 2023 at $94.90 per barrel using data from link below.
https://www.eia.gov/dnav/pet/hist/RWTCD.htm
So Frugal wins last year’s bet by 10 cents, the average of Ovi’s and Frugal’s guesses ($95/b) would have won the bet. Note that my guess in early 2022 was $85/b for WTI about $10/b too low.
The average annual price for Brent crude in 2022 was $100.93 per barrel. So the spread in average annual price between Brent and WTI was about $6/b.
Kurt Cobb for those who might have missed out .
http://resourceinsights.blogspot.com/2022/12/with-us-shale-oil-boom-over-can-world.html
Article talks about the future of the Permian. Quoting the CEO of Pioneer.
https://www.reuters.com/business/energy/shale-oil-wraps-up-an-underwhelming-year-girds-lower-growth-2022-12-30/
Delboy/HIH
Let’s be clear, there have been many articles stating the shale boom is over and forecasting lower performance. These are headlines that are comparing todays growth rates with pre-pandemic rates of over 1,000 kb/d/yr.
The shale growth outlook for 2023 appears to close to 500 kb/d, not to shabby. That could still account for 50% of 2023 demand growth.
The bigger question is can shale continue to grow at the rate of 500 kb/d/yr for the next few years or will it begin to slowly roll over to 400 kb/d/yr to 300 kb/d/yr to …. Dennis’ models show a slowing trend going forward, depending on the assumptions.
The only hint of slowing growth is in the Permian tight oil chart in the LTO section.
Ovi , What was the line in “The three little pigs and the wolf ” ? You can huff and you can puff but you can’t bring this house down ” . 🙂 . Well ,12,892 mbpd Nov 2019 is the peak for USA and nothing is going to beat that . 🙂
HIH
I think the US will push past 13,000 kb/d, but not by much. Possibly by about 200 kb/d.
PS: The peak has been updated to 13,000 kb/d. See first chart.
Ovi , 12892 kbpd or 13 ,000 kbpd . What is a 100K between friends ? Updated to 13,000 . Ok , Victoria’s Secret sell a bra they label it ” push up bra ” . 🙂
HIH
It is the equivalent of raising the poll vault bar by an inch when it is near the top.
It doesn’t really matter. If the US has not yet peaked, it is very close to doing so. U.S. shale oil provided 73.2 percent of the global increase in oil production from 2008 through 2018. The US has been the primary driver of the increase in world oil production for over a decade. That era is over.
OPEC peaked in 2016, Russia peaked in 2019 and the USA either peaked in 2019 or will peak very soon. At any rate, it’s all over but the crying. The world peaked in 2018.
Ovi , so who is doing the ” pull up ” or the ” push up ” . IEA ( International Exaggeration Agency ” and EIA ” Experts In A*** ” . Wow , dream team or a team that dreams ?? 🙂
EIA ( Energy Inaccuracy Agency ) in action . Courtesy Mr Shellman
Hand To Mouth
All of this PDP reserve addition came from tight oil and should therefore be discounted significantly. If on the other hand the tight oil industry has all of a sudden started telling the truth about EUR’s, I will apologize personally to EOG and PXD. I ain’t countin’ on it and neither should you. Six billion barrels is less than one year of C+C consumption in the US. Sixty two percent of total US tight oil production now comes from tight oil basins;, 43% of total US tight oil production comes from the Permian…one $12MM Wolfcamp well making 435,000 BO at a time. Each one of those wells declines at the rate of 85% the first 32 months of production. 44 G BO of proven reserves in the US is 6.5 years of US consumption. Not 16.5, or 65 years… 6.5 years. At current export rates of 1.4 G BO per year that 6.5 years of proven reserves is actually 5.2 years of proven reserves available to the American consumer, our children’s future and out nations long term energy security.
https://www.oilystuffblog.com/forumstuff/forum-stuff/its-a-miracle?origin=notification
Totally agree with your astute assessment Ron. And remember according to Jeffery Brown’s Export Land Model – once the world reaches the peak in production, exportable oil goes down near exponentially.
I wonder what has changed since the 2022 Quarter 3 investor presentation was published. In that document they suggest about 2 decades of drilling inventory which suggests about a 10000 well inventory at the average completion rate from Jan to August 2022 (about 500 wells per year). It is possible that they are not being truthful.
Dennis , ” it is possible that they are not being truthful ” . ” You talkin to me ” — De Niro in Taxi Driver . Of course they are being not truthful . Why don’t you call it for what it is ? In a simple word it is called ” lying ” . From years I have said shale is a Ponzi and all lies , smoke and mirrors . Avoid using soft language ‘. George Carlin for you .
https://www.youtube.com/watch?v=o25I2fzFGoY&ab_channel=RobLogan
P.S ; I am pissed off with the soft language . A cop in Scotland called a pedophile as ” someone attracted to minors ” . It does not in any way depreciate the work and effort you put in here . Apologies in advance if you feel offended .
Hole in head,
Not a problem, I was trying not to offend as often what I say is found to be very offensive to some.
I am coming to the realization that many are very offended by anything that does not parrot their personal viewpoint, I have little patience for those people.
Peak Global Combustion [PGC] Day-
The time when the human combustion of Oil products, Coal, Nat Gas, and Wood/other misc biofuels
reaches a combined peak value [measured in EJ’s or reflected in carbon dioxide emission].
This will also be the peak global energy production day.
Even though global oil production is now at or near peak, this does not correspond to the combined source Peak Global Combustion…just yet.
Impending decline rates of both coal and oil are the big unknown variable.
PGC day-
My speculation is July 7th, 2037.
This is very optimistic, or pessimistic, depending on your values and outlook.
chart based on BP data, in EJ’s
A display of combined global fossil energy consumption as reflected in CO2 emissions in line graph form.
Where will it peak?
And lastly, a display of Global Energy Consumption per capita by source, over time.
-Oil peaked in 1978
-Coal peaked in 2011
-Nuclear peaked in 2000…2nd peak later?
-Solar and Wind/capita will peak later.
not charted here ( a speculation)
-Wood for fuel may undergo a dramatic abrupt peak and then precipitous decline, both in absolute terms and per capita, if there is a sudden shortfall or disruption in fossil fuel deliveries.
Once energy peaks, how long before population peaks?
Ovi,
I thought we had agreed that the November 2022 Official tight oil estimate looked to be wrong and should be ignored.
I immediately wrote to the EIA about it and they said they would look into it. Below is a chart I sent to the EIA showing how the difference between the October and November tight oil estimates look anomolous after December 2021.
Chart below uses the same scale as the chart comparing the difference between the October and November tight oil estimates, but takes the difference between the December and October estimates. We expect the estimates to increase as we get more complete data from state agencies over time, but not by 500 kb/d, note also the comparison between October and December spans two months, so the change per month would be approximately half of the levels shown (if we had not had a bad report in November).
Dennis
Yes we did agree that October looked wrong and the LTO office has revised the October estimates down in the December report.
I am not clear on the point you are making. The up and down revisions to the last four LTO revisions have been noted at the beginning of the LTO report and the downward revisions to October are shown in the charts.
Ovi,
October looked ok, November looked wrong and seemed best to ignore. I guess the point was that the more interesting comparison is October to December at least from my perspective as the November report seemed obviously wrong.
October estimates were revised higher in December, it was the November estimates that were revised lower, but I never paid any attention to those after looking at them for five minutes, the estimates were clearly in error from Jan 2022 to October 2022 in the November tight oil report.
Ovi,
Note that your chart for the tight oil estimate has the November estimate labelled as October, in the text you correctly note that it is November.
Chart below compares the October, November and December 2022 tight oil estimates. You are correct that there was a large downward revision in December compared with the November estimate, this was not a surprise, there was a slight upward revision in December from the October estimate, from April 2022 to August 2022 the average increase was about 60 kb/d for each of the estimates in November and December (if we assume an equal increase for each of those months). These are the types of revisions we expect as state data from Texas and New Mexico becomes more complete over time.
Dennis
The “Oct 8,386” note refers to the production in the month of October to compare with the updated October production of 8,143 kb/d in the December report to show the downward revision of 292 kb/d.
Hopefully the LTO updates going forward will stabilize. I am curious to see what happens to the next DPR report. Will their estimates drop. This will give us a close as to whether the DPR makes use of the LTO estimates.
Sorry Ovi,
I misread the chart. Did we see a big change in the DPR after the November tight oil update?
Dennis
The bad November/October LTO report come out on November 21and the subsequent DPR report came out on December 12. Not clear if that LTO data would have been worked into the latest DPR. There was a slight upward revision of close to 30 kb/d in earlier months. Hardly visible in the attached chart.
Also check the Permian chart in the DPR section. You can see the small upward revision there.
Ovi,
In chart below I compare the October, November and December drilling Productivity reports for tight oil production from all 7 basins covered. There was a very large revision to the tight oil report in November 2022 which is not reflected in the December DPR (very little change from November). Note that the revision lower in December was smaller than the revision higher that occurred for the tight oil report from October to November. So I would not expect a big revision to the DPR in January.
Notice the slope of the trend, about 100 kb/d per month for DPR from Jan to November 2022. For the tight oil data over the same period the slope is about 60 kb/d per month which seems more reasonable (though I expect this will fall to under 50 kb/d per month in the near future.)
Dennis
I did not see this when I posted.
As I noted above it is not clear that the revised LTO data would have been worked into the latest DPR due to the short time between reports. We will have to wait for the January DPR to see whether the gap between the two of them shrinks.
Ovi, the DPR data for the last three months they show is not worth a bucket of warm spit. In April 2022 the Bakken was down over 200 Kbpd due to the late-season blizzard. A month later, in May, the DPR did not show that 200 Kbpd decline but showed a 17 Kbpd increase instead. See the data below.
Ovi,
Perhaps it takes a couple of months for the data to be reflected in the model, this is not clear. So far the large change from October to November seems not to be reflected in the DPR model, perhaps in the next DPR this will show up.
Ron
I agree that the DPR data appears to be overly optimistic. Not sure where their data comes from and why such a lag with real numbers.
In the DPR section, I have a chart that compares onshore L48 with the DPR numbers.
The problem is the DPR predictions are just so predictable. Just draw a straight line, pointing to the right and up at about a 20-degree angle, put three dots on it, and you have the DPR oil prediction for the next three months.
Ron,
The DPR from October 2022 has the following for the Bakken DPR estimate. Click on chart to make is readable. Their model does not account for weather, so the report for May would not have anticipated future weather events. They revise eventually as they get better data.
Thanks, Dennis; you make my point exactly. But I did make a huge mistake. I said the line would increase by 20 degrees. Wow! It increases, very clearly, by 45 degrees.
Click on the Bakken DPR chart to enlarge.
Ovi,
In chart below I compare EIA data from the “shale states” (Pennsylvania, W. Virginia, N. Dakota, Oklahoma, Louisianna, New Mexico, Texas, Colorado, Montana, Utah, and Wyoming) with the DPR. The DPR does not look that optimistic in this view. The slope of the OLS trend over the March 2021 to October 2022 period is slightly lower for the DPR compared to the “shale states” EIA data (558 kb/d vs 597 kb/d).
I would agree that the last two points (Sept and October 2022) of the DPR data do look a bit too optimistic.
Another way of looking at the data is to take the difference between the “shale states” EIA data and the DPR, in this view the recent DPR data might not be optimistic, it seems less clear especially considering anecdotal evidence that suggests smaller producers are having difficulty finding materials and workers which might account for the downturn in output outside of tight oil focused counties in these states during 2022.
This chart leaves out Ohio, Kansas, Nebraska, and Arkansas which all should have been included as part of the “shale state” group.
Chart below looks at a more inclusive group of “shale states” from the list of counties provided in the DPR. The “shale states” group includes Pennsylvania, West Virginia, Kansas, Nebraska, North Dakota, Ohio, Oklahoma, Arkansas, Louisiana, New Mexico, Texas, Colorado, Montana, Utah, and Wyoming. I subtract from this the official EIA tight oil estimate (earlier I used the DPR). The most recent three months of data may be revised in the future as it seems doubtful that conventional oil output in the “shale states” has increased by such a large measure (roughly 20%) in the past 3 months. My expectation is that the tight oil estimates may be revised higher in the coming months as the state oil data sets fill in over time.
Chart below compares the quadratic fit using least squares on March 2021 to Nov 2022 data for Permian with a low scenario assuming a constant completion rate of 429 new wells per month and an alternative scenario where the completion rate gradually increases at about 4 wells per month from July 2023 to Feb 2027 reaching a maximum of 600 new wells per month in 2027 and then remaining at that completion rate until December 2028.
My guess is that reality will fall between the low scenario in red and the high scenario in green. The quadratic model may be pretty close through mid-2025, but by 2027 I expect it might be a bit low unless we see falling oil prices over that period.
The temperature in Williston, North Dakota (Bakken) got down to -49 degrees during the week of January 19th. The wind chill from Dec. 20-23 got down to -57 degrees.
Looking back at North Dakota’s coldest temperatures on record
This took from 400 to 450 Kbpd off North Dakota’s production. However, they did not say this was for the whole month. Completions were halted as well, but I don’t know for how long.
North Dakota oil output drops about 40% after blizzard, freeze; restoration continues
Oil production in North Dakota is estimated to be 650,000-700,000 b/d as of Dec. 27. Using 1.12 million b/d as the baseline, overall state oil production is estimated to be down 400,000-450,000 b/d, Jessica Petrick, spokeswoman for the state’s Department of Mineral Resources, told S&P Global Commodity Insights in an e-mail.
Usually BOEM issues GoM reserve estimates in the second half of each year for the beginning of the previous year, i.e. end of 2020 numbers were due in 2022, but this is now a few months late. The numbers would probably have been well down on 2019 given the low prices during the lockdowns.
Here is a comparison of GoM projections that I made in early 2020 with subsequent production history and a new projection. These projections do not include estimates for future discoveries and the total reserves in producing fields are based on the old 2019 estimates. There have been a few new discoveries that have gone through FID, also North Platte has been cancelled (I’ve assumed it will be delayed ten years) and Mad Dog II/Argos (with 140 kbpd nameplate) has been delayed to late in 2023 because of some equipment problems (I think with connector swivels on some flexible risers, which are highly specialised).
George,
Yes, I’ve also been waiting for that BOEM update. Maybe they are going to an every-other-year schedule?
I have over 15 GOM projects coming online between 2022 and 2030 or so – a combination of new facilities and tiebacks. In my future production projections, my downside profile includes all these projects, and assumes essentially no new discoveries, and comes closest to matching your profiles. My midcase and upside projections add better recoveries from existing fields and exploration successes. My upside projection shows GOM production in the late 2020s exceeding the 2019 peak, with the midcase projection coming very close.
What if ?
https://jpt.spe.org/what-if-oil-stays-around-100-but-it-never-triggers-a-boom
Courtesy the oily stuff .
Hole in head,
Not many are predicting very fast growth in oil output aka an oil boom. Most are forecasting slower annual growth of World C plus C at 600 kb/d or so. Oil at $100/bo probably won’t change this, though $150/bo might, I don’t think there will be enough demand to get to much above $100/bo over the next 12 months and expect an average annual WTI oil price of no more than $90/bo.
The biggest wildcard in demand this year is China.
And I think this will happen in other ways as most commentators think. The COVID wave will be very high and fast – Omicron is very easy to get, so it’s only a matter of a few weeks before most people in a town got it. And it’s rolling a few weeks already – in my opinion we see the crest in big towns in January, and in the villages in February on new year holiday. After this, it’s over.
After this – the chines people have been caged in for 2 years. All vacation and travel will be booked out. In Europe after the much less and shorter Covid restriction travel companies made good business.
The other wildcard – Russia. Will they reduce oil sale? Germany stopped importing russian pipeline oil on 1.1., at the start of February the EU will stop importing oil products from Russia.
All without any impact on oil supply, and the price can keep falling? I think the current low oil price has only to do with US WTI traders are short of money for margins, so they reduce their long positions. When oil gets scare, prices will start to dance.
So current low oil price is due to lack of ability to acquire margin?
Or maybe it due to collapsing growth and inflation expectations and imminent global recession.
Put me down for $50 average with a low around $25
A recession skips 1 mbd in history. You need a deep depression to dent in demand by big margins.
Open oil contract number is falling and is on a multi year low:
https://ycharts.com/indicators/nymex_light_sweet_crude_oil_futures_open_interest
With less and less volume volatility goes up when something is sold.
Physical markets are still enough supplied, even when storage is falling. The price actions starts only from the demand side when deliveries can’t be filled. This can happen soon, when Russia decides to do some things and the same moment China reopens.
For 2 months China demand will stay low due to the corona outbreak. After this there will be a big recovery – just my opinion. Peoples will travel, businessmen will visit all the customers in persona they met only on zoom the last 3 years, factories will produce the stalled orders – there will be much increased activity.
Or do you thing a recession will skip 10 mbpd oil from the market – the OPEC will reduce production by numbers like this when the price goes under 50$. They can do this as they have shown in Corona.
I posted this at the fag end of the earlier post . Margin calls and liquidity are the problems . Tesla went from $ 616 to $ 91 . Someone got the margin calls and they liquidated some assets to meet the margin call . Same for housing . This is going to be interesting . Too complex for me to say anything .
https://peakoilbarrel.com/the-eias-short-term-energy-outlook-3/#comment-751032
What we are overlooking is counterparty solvency . Whom do you catch off when your house is burnt down but your insurance company has filed for bankruptcy ?
Only solution for this is the same solution as in the past 15 years – cheap money and lot’s of QE, combined with a cheap debt financed state spending binge covering social tensions.
So each in fact bankrupt company can get new credit to continue the zombie economy. And creating the Eurodollars is much more easy when interrest rates are again at 0 or even a bit lower – at 0% even I can finance a fancy 1 million € home here creating lot’s of new € in the process. Kicking the can down the road a next time.
Another thing:
The Dow Jones is not even 10% under it’s ATH. So they aren’t pricing in a severe recession – which would really hurt industry stocks. From the stock side only a mild or technical recession is anticipated at the moment.
Only tech stock is correcting strong – they are hit most by the rising interrest rates.
HHH,
It will be interesting to see if your call for $25/b by March 2023 is correct.
Yeah we will just have to see how far and how fast everything goes to shit for lack of a better word.
I could be a little off on timing and still be right about where things are going. Depends on how deep this recession actually goes. But my guess is Governments and central banks won’t step in until oil prices are low. Which if oil prices are $25 they will have no problem doing stimulus.
Eulen , ” Only tech stock is correcting strong – they are hit most by the rising interrest rates. ” . Wrong assessment . Rising interest rates are hitting EM debt terribly . There will be a chain of Sovereign defaults because of the Eurodollar issue and the high level of Sovereign debt issued by EM’s . IMF has already indicated that out of the 120 members ,70 are outside the door waiting for appointments . EM’s are not the only problem . Most of the derivatives are ” interest rate ” bets so when they go sour we get into the counterparty solvency problem . By the way at 3 % interest rate on the Yen , 100% of revenue in Japan, goes only to paying the interest on the debt . Watch out for fragmentation in the EU between German and Italian debt interest rates .Up the stream without a paddle .
My guess for a low price is on China not really coming back this year. It’s true what you say of Omicron but the average Chinese is terrified of Covid still and they are very good about social distancing and voluntarily staying home to avoid transmission. 1.4 billion people many of whom are elderly so they will be quite cautious. I think it will drag out and I think there’s a chance of another vicious variant that breaks out worldwide and causes more demand destruction that way. But who knows really.
Also the supply side is pretty revved up from higher prices last year. The Permian still has legs probably another 1-3 years. When there is no big run up in prices like last summer I can see a bear market setting in.
But who knows really.
We are dealing with a mRNA.
It changes on just about every replication.
Most are not important. But the odds are obvious.
Exxon, Chevron Focus on Oil Projects in the Americas
Two largest U.S. oil companies retreat from big international projects
Their focus on the Western Hemisphere is expected to continue for years asmthey give priority to growing shareholder returns and cut costly frontier drilling projects. Their retreat from places such as southeast Asia, West Africa, Russia and parts of Latin America—sometimes by choice, sometimes by fiat—marks an era of retrenchment for companies that had spent decades putting stakes in the ground around the world.
The company’s oil and gas production was down in 2021 by almost 18% compared with its annual peak in 2011, according to S&P Global Market Intelligence. Around that time, Exxon was pursuing scores of projects across the world and made most of its money outside the U.S. The days of managing numerous international projects are running out, said Neal Dingmann, an analyst at Truist Securities.
“You have investors leaning on you harder than they have in the past,” Mr. Dingmann said. “It’s going to be critical that they prune their other [noncore] businesses.”
Meanwhile, Chevron’s international output fell 3% last year following the expiration of concessions in Thailand and Indonesia. Last year, it vowed to exit Myanmar, citing human-rights violations. Since 2019, it has unloaded assets in Azerbaijan, Denmark, the United Kingdom and Brazil, among other places.
Chevron has said it would spend most of the capital allocated for production on oil fields in the U.S., Argentina and Canada.
Still, most institutions continue to give oil companies a wide berth, recuperating from the sting of big losses over the past decade, said Kevin Holt, a portfolio manager at investment firm Invesco Ltd., which has about $1.44 trillion in assets under management, according to its most recent regulatory filings.
“They don’t think the industry will stick to capital discipline,” Mr. Holt said. “It’s going to take a little more time,” for investors to believe that oil companies have permanently changed their spending habits.
https://www.wsj.com/articles/exxon-chevron-focus-on-oil-projects-in-the-americas-11672698644
I see a lot of oil price predictions but not a lot of talk about releases or purchases regarding the SPR.
What happens there would seem very important as the SPR has been drawn down by over 300 million BO since before the pandemic.
US is still drawing.
It would seem the $70 range should be a floor if the US starts refilling the SPR at those levels?
Isn’t interesting that coinciding with US oil production growth flattening the US drew a large amount from the SPR? People have been saying for a few years we don’t need a large SPR due to shale. Is that still true?
Shallow sand,
I believe that those that predict $50 or $60 per barrel are expecting a severe recession/financial crisis, so World demand falls and the SPR gets refilled at $50/bo or $60/bo. I agree draining the SPR is dumb policy by the Biden administration, the last time the SPR was this low was December 1983. Note that US net imports of crude oil are lower today than in October 1983 (last data point is Oct 2022 so I am comparing to nearest month in 1983), today net crude oil imports are about 64 million barrels per month and in October 1983 net imports of crude oil were about 103 million barrels per month.
Also consider this chart for net imports of crude plus products from link below (where you can look at data in more detail if you wish),
https://www.eia.gov/dnav/pet/hist/LeafHandler.ashx?n=PET&s=MTTNTUS2&f=M
Russian Crude Oil Exports Plummeted At The End Of 2022
Russia’s crude oil exports by sea plunged in the last four weeks of 2022 to the lowest level of the year as shipments to Europe all but dried out following the EU embargo, declining flows to Asia due to bad weather, and what appears to be a shortage of tankers to carry Russian crude on longer voyages.
Russia’s overall crude oil exports by sea dropped by 117,000 barrels per day (bpd) on a four-week average basis to 2.615 million bpd for the final four weeks of 2022, according to estimates by Bloomberg News’ Julian Lee.
Those shipments are the lowest volumes Russia sent out on a four-week average basis last year.
Analysts Predict 1 Million Bpd Drop in Russian Crude Output
The European Union’s ban on Russian oil products set to come into force on February 5 could lead to a 1 million barrel per day drop in Russian crude oil output for the New Year, commodity analysts for UBS told Insider on Monday.
“We expect the European ban on seaborne Russian crude and refined products (to come into force on February 5) to result in a drop of Russian production of at least 1 million barrels per day in 2023, with Russia having difficulties in finding alternative markets,” UBS’ Giovanni Staunovo, told Insider.
While Russia has been rerouting crude volumes to Asia, traders are finding it increasingly challenging to secure the necessary insured vessels to carry sanctioned Russian crude. As of the first week of December, Moscow was sending nearly 90% of its crude to Asia.
OPEC oil output rises in December on Nigeria rebound
LONDON — OPEC oil output rose in December led by a recovery in Nigerian supply from outages, a Reuters survey found on Wednesday, despite an agreement by the wider OPEC alliance to cut production to support the market.
The Organization of the Petroleum Exporting Countries (OPEC)pumped 29.0 million barrels per day (bpd) last month, the survey found, up 120,000 bpd from November. In September, OPEC output had been the highest since 2020.
Output is still undershooting targeted amounts as many producers – notably Nigeria and Angola – lack the capacity to pump at the agreed levels.
The 10 OPEC members required to cut production pumped 780,000 bpd below the group’s December target, the survey found. The shortfall in November was 800,000 bpd.
OPEC’s Gulf producers complied relatively closely with their output targets under the OPEC agreement, the survey found. Saudi Arabia curbed output slightly, as did Iraq, and there was little or no change from Kuwait and the United Arab Emirates.
Among Libya, Iran and Venezuela, the three producers exempt from OPEC cuts, only Venezuela’s output showed any notable change, with some tanker trackers seeing lower exports.
https://financialpost.com/pmn/business-pmn/opec-oil-output-rises-in-december-on-nigeria-rebound-survey
Ouch $22/mcf on natural gas in California? What’s up with that?
Here’s all the WTI average price guesses I got so far for 2023:
Frugal = $100 average
Ovi = $110 average
D Coyne = $90 average, $3 – $5 higher for Brent
Hickory = $97 average
Iron Mike = $60 average
Svaya = $120 WTI average, $160 peak, $135 Brent average
Weekendpeak = $110 average
KenGeo = $80 average
Stephen Hren = $60 average
HHH = $50 average, $25 low in March
Westexasfanclub = 90$ average, $110 for H1, $70 for H2, Brent slightly higher
There’s some wild differences in guesses!
Let me know if anyone else wants to make a guess. I will stop tracking guesses once the next thread is up.
Average for WTI guesses for average annual price in 2023 is $87.91 with a median of $90/b using the 11 guesses above. The range of guesses is 50 to 120, standard deviation is 23.02, the 2 standard deviation range is 42 to 134. If the guesses come from a normal distribution we would expect about 95% of the guesses to fall in the 2 standard deviation range.
Thanks for the statistical analyses Dennis.
I have given up guessing because I can’t predict the administration releasing 200 million barrels out of the SPR, or a Skirmish between Russia and Ukraine or a worldwide recession. I know that at current product prices for oil and natural gas, the domestic industry cannot sustain growth in the LTO part of the industry. Costs are too high and returns are too low to sustain the current rig count. The volatility makes it virtually impossible for planning in the future. Hedges will play an important role in keep companies afloat but the returns on new investments are too anemic to keep the production levels up or growing at the pace we saw in 2022. This will be another interesting year and underinvestment will ultimately show up in the not-too-distant future.
releasing 200 million barrels out of the SPR
Isn’t that all that remained?
Thanks Frugal for keeping a record on these guesstimates. Should be interesting how it plays out.
The EIA has posted its weekly numbers for week ending Dec 30.
SPR: – 2.7 M barrels. This could be close to last release.
Commercial: 1.7 M barrels
Production: 12,100 kb/d
Attached is a chart comparing weekly and monthly data. Interesting how September and October monthly data is higher than weekly.
My reasoning for the 110 guess is that
a) The balance between capital and labor is slightly but steadily shifting towards labor due to boomers retiring en masse. This is causing wages to increase so they can afford more expensive fuel.
b) Drawing down on the SPR is getting harder and harder to do for both physical and psychological / political reasons
c) China ripped off the COVID bandaid and will in the short term suffer quite a bit but in the longer term (<1yr) recover quite rapidly, and with it FF consumption.
d) Shipping is somewhat aggressively moving away from HFO to diesel. That increases structural demand quite a bit yet the cost per unit shipped will go only up a tiny bit.
e) On the supplyside – as more and more resources have been extracted the remaining ones must be becoming more expensive to extract, increasing – overall – the cost of production.
f) The cost of capital to fund extractions has increased.
Rgds
WP
WeekendPeak,
a comment about your reasoning on labor costs
a) “The balance between capital and labor is slightly but steadily shifting towards labor…
A much bigger affect on global labor costs than boomer retirements is the winding down of the huge boost of inexpensive labor provided by the young workers of Asia- especially China. That 30 year story of cheaper labor is wearing thin.
Between labor costs, energy costs and geopolitical choppiness, there are plenty of ingredients for inflation.
But these higher costs may be enough to stifle economic activity.
Tug of war.
Meanwhile the lackadaisical shuffle toward fossil decline proceeds.
A countries ability to attract young motivated immigrant workers will play a big role in future prosperity prospects.
Agree – my comment was a very western-centric one. I that for now, c.p. the west has a much higher per capita as well as aggregate consumption. Over time that gap between the west and ROW will change though. Keep in mind that a large part of resources – including FFs – in countries like China are embedded in the stuff they export, so I think that you can’t really look at China’s per capita consumption by taking total consumption and dividing it by the population. You somehow should subtract the embedded exported energy first.
As young immigrants come to the west their consumption also shoots up.
Although my 110 guess is just that – a total shot in the dark – it is always good to plant a flag and then try to figure out why you did that and forcing a bit of thinking ( or rationalizing when not too much thought was put into the initial answer?)
And obviously one nuclear bomb can ruin one’s entire day.
Rgds
WP
Weekendpeak,
My reasoning for $90/b is that demand growth will be relatively slow due to the likely recession in 2023 and that oil supply will be adequate to meet demand at $90/bo. Lots of reasons this is very likely to be incorrect as my demand and siupply assumptions may both be incorrect in either direction and there are lots of unknown unknowns that may occur.
“And obviously one nuclear bomb can ruin one’s entire day”
Yes, and plenty of other wildcards in the mix
and that is why pricing prediction just an amusing guessing game.
My condolences to those who must come up with a hedging position for business purposes.
As was pointed out up above, the oil available for export on the world markets will likely decline rapidly from here on out, more rapidly than the overall global production.
I was listening to some hedgefund manager last night who had a good year and had this attitude of – “I don’t care if prices go up or down, I just care about making money”. As if it were that simple.
Listening to people like that is good if you have low blood pressure issues.
Rgds
WP
Pioneer Natural Resources CEO: “There’s no extra supply in the next 5-7 years”
Pioneer Natural Resources CEO Scott Sheffield was just on CNBC making the bull case for oil. He argued that the model for shale is changing, with companies focused on mitigating decline rates and preserving acreage rather than growing.
Sheffield predicts shale growth will slow to about 300k bpd in the next two years. Earlier today, Sheffield also got some attention for warning that Permian production would top out at around 7 mbpd in 2030, below the 8 mbpd per day he previously forecast. He warned companies are moving to tier 2 and 3 inventory.
“There’s no extra supply in the next 5-7 years and demand is going to come back,” he said, predicting that $150 was more likely in that timeframe than $60 oil. $150 ‘s the level where he sees demand destruction.
Pls go to the site and check out a map of Delaware tight oil play. Implies Wolf camp is finished.
https://www.forexlive.com/news/pioneer-natural-resources-ceo-theres-no-extra-supply-in-the-next-5-7-years-20230105/
Hello Ovi, I very much appreciate your contributions here. I am a thankful lurker in the discussion.
Just a quick rebuttal on your comment that the Delaware Wolfcamp is finished based on that Forex map on the link. I realize that Delaware Basin map may appear saturated with wells and therefore minimal locations left to drill, but I disagree.
First, there are multiple productive zones in the Wolfcamp and multiple zones in the Bonespring. Thinking three dimensionally… you would need 3-5 pages of those fully saturated maps to call the Wolfcamp (and Bonespring) finished in the Delaware.
Second, and possibly as equally important, is that cartoonish Forex map is playing tricks on your eyes on the wellbore density imagery. Zooming out to that level on that map merges and blends all the well imagery into a blob that covers many undrilled locations. My digital O&G mapping system does the same thing. At a smaller scale, you see great detail with many small and large swaths of acreage that are undeveloped or only partially developed. But when you zoom out to a larger scale, the pixel limitation makes the big green (or red) blob cover all those remaining drillable locations up…. thus implying falsely that the area is fully saturated and therefore “finished”.
I’m not saying the Delaware is a spring chicken, but it’s hardly finished as there are many quality undrilled locations remaining from what I see, and the Delaware may yet still yield new surprises down the road.
Mike,
You post lots of great stuff, I used that map as the basis for reducing the likely prospective acreage in the Permian from 50 million (in USGS assessments) to 30 million acres, with about 28 million acres developed in the scenario after June 2017 in recent scenarios (98700 wells at 282 acres per well from July 2017 to Jan 2037). The scenario has a maximum completion rate of 525 wells per month from August 2025 to July 2031 with a gradual increase from 429 wells completed per month in July 2023 (this is assumed to be the average completion rate for the Dec 2023 to July 2023). The scenario assumes exports of crude oil from the US remains legal.
See
https://peakoilbarrel.com/us-october-oil-production-pushed-higher-by-new-mexico/#comment-751267
GUNGAGALONGA
I just saw the green and grey and thought that there wasn’t much drilling area left.
My main objective was to make a comment and hope that someone with deep knowledge would correct it.
Thanks for clarifying that map.
I created that “cartoonish” map; I used the 2017 USGS Delaware Basin assessment boundary map and overlaid that with a 2Q22, SPC map showing 18,500 producing HZ wells on the exact same scale. It was designed to compare the productive limits of the play with the USGS assessment area. It says “productive limits” on the map, bigger than daylight. It is not designed to show well density over a vast area and is not labeled as such. The author of the article does not reference well densities, he begs the question…if all this assessment area is productive, why isn’t it being drilled? He asks that, specifically, in writing, below the image. The image is only “deceptive” if you are intentionally misusing it.
The productive limits of the Delaware HZ play have not changed and high grading core areas continues, even at much, much higher product prices. Why is that? Because the economics suck out there on the flanks. For RI and ORRI owners in shale plays, economics never suck and the party will never end.
The question remains, how is all that wonderful USGS TRR hooey every going to be recovered in all that skinny goat pasture if nobody ever drills a well in it? The same vast discrepancy between productive limits and the USGS assessment area exists in the Midland Basin, only worse.
Delaware Basin gassy oil wells are now mostly oily gas wells and liquids productivity is degrading. Look at EOG in the Texas side of the Delaware, for instance. Well quality, GOR, WOR and domestic issues between parents and children in the core areas of the core counties, matters.
https://www.oilystuffblog.com/forumstuff/forum-stuff/intellectual-theft
Someone’s been stealing Mike’s charts. It’s not good form to not give credit where credit is due!
Thanks, Ovi, great find. Great input from someone who should know. And I must add that almost every oil man who posts on this blog is saying the same thing. Why are some people still arguing with them?
A later follow-up on the same news release.
Pioneer Natural Resources lowers oil production forecast in Permian Basin by 1 million bpd by 2030
On Jan. 5., Chief Executive Officer Scott Sheffield said his company now sees Permian production of about 7 million bpd by 2030, down from a previous view of 8 million bbl.
His comments come amid growing concern within the industry about the fading productivity of oil wells in the Permian and whether overall production could plateau.
Permian scenario roughly matching the Sheffield expectation, URR is 45 Gb for this scenario about the same as the USGS F95 TRR estimate.
F95 means they believe there is about a 5% probability that the TRR might be lower than this estimate, the USGS best guess is Permian TRR=75 Gb. The URR is always lower than the TRR, for the Bakken the URR will likely be about 70% of the USGS best guess TRR. If true for the Permian that would imply a URR of 52 Gb.
Dennis
Eyeballing your chart I get the following increments
2023 600 kb/d
2024 300 kb/d
2025 500 kb/d
2026 500 kb/d
2027 yearly output starts to roll over.
What causes the drop on 2024?
Ovi,
12 month changes Dec to Dec.
2022 534 kb/d
2023 349 kb/d
2024 486 kb/d
2025 555 kb/d
2026 457 kb/d
2027 293 kb/d
2028 217 kb/d
2029 168 kb/d
2030 138 kb/d
2031 -42 kb/d
I assume no increase in completion rate from Aug 2022 to July 2023, that is the reason that output increases less in 2023 than 2024 to 2026, output increases more in 2022 due to increasing completion rates in 2022 relative to 2021.
Permian scenario 2021 to 2030, presented earlier, but this has shorter time scale with December data points shown on chart. My expectation is that this will be a bit too conservative, about an 80% probability in my view that Permian output will be higher than this scenario, my best guess is a peak of about 8000 kb/d.
interesting observation from a true oil and gas professional
https://mobile.twitter.com/EnergyCredit1/status/1611098812151382016/photo/1
for those of you who don’t follow Javier Blas, yes another person who’s depth of understanding of the oil and gas business was routinely ridiculed on this site, you might add his tweeter feed to your reading list. That is if you actually want to learn a thing or two about the real world. cheers from texas….. and yes i was also banned from this site, keep them straight coffee, i loved reading your post. and dennis don’t worry I have no intention of posting often, suffice to say I was right and the overwhelming number of posters here were wrong, I have notice your tilt toward the light of factual objective analysis. kudos
Not sure why you were banned?
Were you the one always promoting OK shale plays as being very oily and I argued with you about that. Pre-COVID for sure. Back when Hamm was really hyping OK shale?
shallow you seem like a decent fellow. I have leaned a thing or two from you particularly on the operation side of small town oil field life. You have endured and survived the up’s and downs of our business, as have I, for now 40 years. And yes you are correct regarding oklahoma. I would not use the term promoting. But I have participated in several dozen horizontal wells oklahoma with Continental, Marathon, Ovintiv, Kaiser Francis, Camino, to name a few. Not to promote but I own stock in all those companies above that are publicly traded. I know what the reserves are I know what the cost are because i see it every day. I bought all I could in spring of 2020, still hold and add from time to time. I also follow and own many of the mid-stream companies.
The wells we have drilled have ranged from 90%oil on the high end to 50%on the low end. So yes like other plays its oil in the oil and condensate windows. Down dip very rich gas, high BTU lots of liquids maybe 5% oil. Oklahoma can’t compete head to head with the Permian, but it is head and shoulders above the Haynesville. We are also active in east Texas and Louisiana. I am happy to be in both.
Oklahoma has been relatively dead since the covid shutdown but is now picking again with the higher nat gas prices. We participated in 5 wells last quarter. All previous wells have paid out and I am more than happy with our involvement. We have 100’s of wells to drill going forward.
The point Coffee and I were making and were routinely ridiculed for, is just how big this industry was going to be, the roll it would play in our domestic as well and the world wide energy mix. I was banned several years ago probably because I rather enjoy picking word fights with those like Mike that pretend to know such much, but who wear their ignorance like a badge of honor. The industry was changing, just like other industries, some people were not prepared for it, could not accept it, hope to change it but in any event, it changed. I was an exploration geologist for 30 years but no more, my lifelong ability to do what I do went up in smoke.
As I told Dennis several years ago, this site provides some good information from time to time, so I have continued to read it. I am now a full time investor overwhelming in the oil and gas business. No regrets. You catch teach people who have no capacity to learn, but the arbitrage between energy related fact and fiction left the opportunity for untold wealth wide open for those who could learn.
The reasons I responded to you is that I respect your opinion, even when you are wrong. best of luck to you.
So do you own stock in the public companies, actually own WI in leases, or both? Buying public shale in 2020 in hindsight was a heck of a call, but when do you know to sell?
I’m still holding onto ExxonMobil, ConocoPhillips and Phillips 66, which I have now owned for over 25 years. Sold Diamondback before it collapsed, shortly after it bought out my Energen. It has since recovered, but I’ve done fine with what I put the proceeds in. I took a bath on LGCY, thankfully didn’t have a ton in it.
Since I own a decent amount of WI, ORI and RI privately I try not to invest in the public stuff too much, as that violates diversification ideas I have.
I don’t know I was wrong that much? My primary point was that oil prices 2015-2020, with the exception of part of 2018, were too low, and with super low natural gas prices too, it just didn’t make sense to plow through drilling so many wells.
I think the NOL’s racked up from 2015-20 proved my point quite well. COVID turned out to save the industry, as it basically gutted financing of upstream and scared everyone into restraint. Also, so many people bailed out of the industry there is now a severe labor shortage and shale can’t overdrill even if it wanted to.
Seems like now the shale cos are showing restraint, which I advocated for all along. They have been making a lot of money. Which is a good thing.
That is, of course until recently, as a major slide in oil prices and gas prices has coincided with some nasty inflation in all facets of the industry. But as you can see from my post below about USA total crude stocks, unless the world economy tanks, prices have to go higher because inventories all still drawing.
If I misrepresented anything you said in the past or now, didn’t mean to. I don’t normally get to mad. In my real job I’m dealing with much worse crap than what’s discussed here, so maybe I don’t get so mad. I might if it was my only livelihood. I get where Mike is coming from and have really appreciated being able to communicate with him. He does what my family does, except he knows a lot more and does a lot more drilling.
Yes, we are still standing oil prodiction wise and had our best year since 2013. But cost of everything really is getting old. And we are just generally getting tired and have no succession plan. Getting a rig on a well isn’t easy like it used to be, most of the service rigs are still stacked around here. No labor.
Hey, TT,
Great to hear from you and hope all is well.
The term ‘frac intensity’ – on the second line of Blas’ tweet – is the controlled pressure/volume of frac fluid injected in each stage that is pre-identified by its ‘breakdown’ pressure.
That is, when the stress cracks open at 1,000/1,500 psi, those injections target and control the relatively uniform rock frac’ing with near wellbore and far field diverters to enable a thorough scouring/propping with limited breakthrough.
Biggest, IMHO, upcoming innovation will be the gradual unveiling of successful EOR.
High pressure, high volume, short soak times in controlled environment seems to be the way forward.
EOG’s purchase of ~400,000 thousand acres of Ohio Utica goat pasture (aka virgin pressure draw down) along with buying outright significant mineral rights (sidestepping royalty concerns on re-injected natgas) was a big ‘tell’.
Look forward to seeing your future comments in these threads.
coffee you are the type of guy I wish I had in my personal brain trust. You may not wish to share but I would like to know your background. I am aways impressed with the nuggets of information you provide. Your knowledge remains head and shoulders above mine, I sincerely thank you for the opportunity to learn something new. my best
Hey, TT.
Related – somewhat – to this hydrocarbon topic, I worked on offshore oil rigs for a few years in the mid to late ’70s (during the exploration boom following the first oil embargo).
Having participated in discovery, delineation and production work in Asia, South America, and the North Sea (along with unsuccessful wildcats off Pakistan and New Joisey), I took notice of the early (2008) news coming out of North Dakota.
When EOG essentially replicated effective development in the Eagle Ford in 2010, it became apparent that this ‘Shale Revolution’ could become a highly disruptive, world changing phenomenon.
While I do no longer devote as much time digging into this stuff, the natgas situation – especially the Appalachian Basin – has become my main focus.
FWIW, the concerns over liquid hydrocarbon scarcity may be overblown as replacements will continue to arise … especially natgas.
Today, in much of Ohio and Pennsylvania, retail CNG is available for $2/$2.50 per GGE (Gallon of Gasoline Equivalent).
In Oklahoma, it can be had for under a buck per GGE.
Advances in adsorption (‘d’, not ‘b’) technologies ensure widespread future adoption.
Hope that you choose to continue contributing your knowledge to this POB site.
An update for US car sales.
As expected, the oil price per barrel is still too high to allow a significant increase of car sales. The sales have increased a little bit in the last months, but sales are much below the former values of 2014-2021.
Berndt,
How does the EV/ICE mix changes and MPG changes over the years play into this?
rgds
WP
If energy gets more expensive, all products get more expensive: gasoline, food, rents, cars etc. People don’t drive less if life gets more expensive, see:
https://fred.stlouisfed.org/series/TRFVOLUSM227NFWA
People need food, gasoline, rents. But not new cars, so they buy no new cars. EVs are normally more expensive than ICEs of the same quality. I see no reason, that EVs will change much.
(Remark: This is not valid for china and probably not for india)
But then shouldn’t the correlation to CPI ( or some inflation index) to VMT be the correct one to look at, rather than one of its components ( oil)?
Rgds
WP
CPI is useless just as GDP . It is tweaked by two main factors hedonic inflation adjustment and the inflation deflator formula .
https://www.economicshelp.org/blog/603/inflation/hedonics-and-inflation/
https://www.educba.com/gdp-deflator-formula/
Govt will always tweak to the lower side . Reason COLA (Cost Of Living Index ) which effects salaries and pensions of all govt employees and ex employees . Higher CPI means the govt will have to pay out more without a corresponding rise in revenue . Understand methodology . Unemployment rate is not important what is important is the labor participation . BLS is Bureau of Lies and S**T .
Berndt , relax . It is valid for both India and China . You were right for as far as back I can remember . Peak cars 2017 . India some facts ; 850 million surviving on 5 kg of free wheat / rice per person per month . Alternative would be death by starvation
1 million individuals of high nett worth ( above $ 2.5 million ) emigrated and surrendered their nationality in 2022 . 250.000 students go overseas every year ( USA , UK, Canada, Australia ) never to return . All those who can afford a car have it . No need for more since the aspirational ( middle ) class is shrinking . As to China not very different . Food is the problem . Suggested reading > Who will feed China by Lester Brown . Be well .
HiH,
China is different in some ways:
Chinas primary energy comes 57% from coal, and only 20% from oil.
Today, China buys russian oil at a price discount. Energy costs are small compared to other countries.
Chinese people accept to buy very small EVs, which US and Europe citizens do no like.
Chinese EVs are built using energy from coal, and they drive using energy from coal. And electricity is very cheap in China.
In addition, EVs are heavily subsidized in China, and ICEs have been subsidized in the last half year.
All together has the result, that in China the decline in car sales is smaller than in Europe and USA, and that about 10 times more EVs are sold in China than in the USA.
In total, China wants to switch from oil-powered vehicles to coal-powered vehicles. Thats my impression.
Indias energy stems to about 50% from coal.
BERNDT,
While China is in the process of switching from Gasoline powered cars to EVs, it becomes much more difficult to transition the Supply Chain driven mostly by diesel… correct?
Even though they may cut back on gasoline consumption, I don’t see how they can cut back much on diesel consumption, especially in the coal mining industry, which is highly dependent on diesel fuels to extract, produce, and transport the 4.4 billion tons of coal this year.
steve
Steve, yes, conversion of heavy transport is more difficult. But if cars don’t need oil, more oil remains for trucks, at least for some years.
Chinas plans for the future include a replacement of coal energy by renewables, and a reduction of oil energy from 20% to 8% in 2060.
BERNDT,
China doesn’t have until 2060…. RIGHT? The world gets into serious trouble with the oil supply in the next 5 years, and this rapidly worsens each decade.
steve
Don’t forget affordability .
https://www.aljazeera.com/economy/2023/1/6/tesla-cuts-prices-for-second-time-in-china-fuelling-anger#:~:text=Tesla%20has%20cut%20prices%20in,the%20world%27s%20largest%20car%20market.
NIO also . They lowered their delivery target for December .
https://cnevpost.com/2022/11/21/nio-worse-may-finally-be-over-says-deutsche-bank/
I disagree with the overall premise of this mental exercise (that oil pricing is the primary driver of auto sales).
The factors that more heavily affect auto sales over the months and years include-
1- the general prosperity of the economy, as in wage levels, employment %, GDP growth, etc independent of the variations in oil price as it has been most of the time in past 3 decades
2- how long a vehicle lasts. The average age of US cars on the road has gradually increased from 6.6 yrs to 12.2 yrs from 1980 to 2022. Longer lasting cars get replaced less frequently.
3- government policies such as interest rates, deductibility of car loan payments, depreciation schedule changes, incentives, etc
4- auto manufacturer incentives
Certainly a rapid escalation of oil pricing, or just very high oil prices over say $125/b, will decrease purchasing power for all sorts of items- from vehicles to clothing. Nobody needs fancy graphs to get that point.
hint- if there is a strong relationship between two factors on a graph, the line will not look like spaghetti
Hickory, here is a “smooth” graph for you. The total car production of the world is displayed (black points). It has a maximum in 2017. And the first derivative is shown too (green). The derivative begins to turn downward in 2012/2013.
In 2013 something happened, which was very disadvantageous for the car industry. And the something was: net energy of oil production got low.
This diagram is the explanation, why the decrease of car production is not caused by the Osborne effect. EVs got importance not before 2018, that is five years after 2013.
Interesting graphs, Berndt, obviously a major infection point in 2012-13 that I agree cannot realistically be assigned to any kind of pent up demand for EVs. It will certainly be interesting to see if these trends hold up as the transition to electric mobility continues.
Interesting article on car sales and demand in the US
https://wolfstreet.com/2023/01/08/wild-ride-of-us-auto-sales-in-2022-below-1977-charts-for-gm-toyota-ford-stellantis-hyundai-kia-honda-and-nissan-oh-dear/
One possible explanation for slight downturn before pandemic is changes in EV incentives in various nations, note that the World total includes both ICEVs and plugin vehicles. The drop in 2020 is obviously explained by the pandemic, since the pandemic we have a combination of more telecommuting and many new EV models being introduced, both of these may have reduced demand for ICEVs before EV production has had a chance to ramp up. It won’t be long until EV prices fall to a level where incentives will no longer be necessary (probably within 5 years or less). In addition there will be more charging infrastructure available as convenience stores and shopping malls and restaurants realize these facilities will attract customers and will quickly pay for themselves. Level 3 charging stations will become the new gas station.
Note that the change n the first derivative in 2012 is simply explained by very rapid growth in sales after the GFC returning to normal levels. Also there may be a mistake on the chart for the first derivative in 2009 as sales decreased but the first derivative is still shown as positive (it should be negative), also the change in output was a decrease of more than 10 million in 2020, that number also seems to be off. I assume as we do not have a function we can actually take a first derivative of that “first derivative” is just delta car production for the year.
Dennis,
GM is projecting selling a million EV’s in 2025 and Ford plans to sell 2 million EV’s in 2026. I was wondering what kind of work have you done on the effect future EV’s will have on demand.
Using average annual American miles driven of 14K and 25.4 average MPG of new ICE. I came up with about 36,000 BPD saved for every million new EV’s sold. Or, world annual production of 78 million vehicles(2020) would save about 2.8 million BPD. Almost 28 million new EV’s to save 1 million BPD.
I understand this is very simplistic. Just trying to get my arms around the effects of EV’s on demand looking forward.
“Around 4.3 million new battery-powered EVs (BEVs) and plug-in hybrid electric vehicles (PHEVs) were sold globally in the first half of 2022. BEV sales grew by 75% on the year and PHEVs by 37%. And more growth is predicted for the rest of 2022, with sales expected to rise by 57% on the year to 10.6 million.”
https://www.weforum.org/agenda/2022/10/ev-sales-charging-infrastructure-transport-sector-sustainable/#:~:text=Around%204.3%20million%20new%20battery,the%20year%20to%2010.6%20million.
Thanks
Huntingtonbeach,
Scenario below assumes EV sales growth continues at 35% per year until 2029, I also assume heavy duty trucks follow the growth curve of the EV light duty vehicles, but with a 10 year lag. Following chart shows resulting demand curve with suppy curve of World C plus C shown for comparison. This demand scenario is optimistic in my view, actual oil demand is likely to be higher.
HB,
Using your figures, 14Kmiles/year/365 days in a year is 38.4 miles/day. At 25.4 miles per gallon, that’s 1.5 gallons consumed/day. If a barrel of oil produces 19 gallons of diesel and gasoline fuel, 12.6 vehicles are fueled by 1 barrel of oil. Shifting one million vehicles to all renewable would save 1,000,000/12.6 = 79,478 barrels of oil per day or about 80k bopd for every EV sold. I suspect that you are using a lower number of gallons of fuel per barrel of oil.
Reason I’m using 19 gallons is that the US uses more gasoline while Europe uses more diesel per vehicle. This is a back of the envelope calculations.
If there are 12.5 million EVs on the road today, they are reducing oil demand by 1 MBOPD.
We the car manufacturers switching to EVs and PHEVs, etc., over the coming decades, I suspect that these cars are already having an impact on oil consumption.
Thanks Dennis,
With all the battery factories coming on line in the next few years. I’m thinking your 35% increase might be a little on the low side for the next few years. Looks like your averaging a 1.5 million bpd decrease in demand from 2030 to 2040 with an increasing slope. My gut tells me you might be a little conservative there also. A ten year lag on the heavy duty seems like a good estimate to me. The next few years should really tell a lot about the direction of the demand curve. I don’t think I would be surprised if your 2040 demand estimate is a little high by as much as 3 to 5 million bpd.
If gasoline is 45 percent of current demand of 83 million bpd. That’s about 37 million bpd. There’s room for you to be to a little conservative in you projection by 2040. By 2040 I would expect heavy duty to be cutting into diesel demand noticeably. Over the road HD has a shorter life cycle than LD. There half worn out after 5 to 6 years. Running 100K to 125K miles a year.
Also, the EIA showed gasoline and diesel supplied down 3.1 % for 2022. Don’t know what’s going on there. That can’t be contributed to EV’s. The diesel can may be explained as a slow down in the economy.
Huntingtonbeach,
You may be right on the HD vehicles, I used a 12 year average life for LD vehicles and did not adjust this for my HD model, so potentially we could see a quicker ramp for HD vehicles if we have the battery manufacturing capacity to accomplish it and adequate material inputs. It may be difficult to maintain 35% sales growth over time, I just kept the model simple. We might see 50 or 60% sales growth for a couple of years, but it will slow down maybe 50, 40, 30, 20, 15 percent growth rates or something like that for 2023, 2024, 2025, 2026, and 2027 for light duty vehicles.
In 2019 for the World gasoline consumption was 24.5 Mb/d and diesel consumption was 27.8 Mb/d based on BP data. Crude output was about 83 Mb/d, so gasoline and diesel consumption was roughly 63% of total World C plus C output in 2019.
Light duty plugin vehicle sales were up Worldwide by 60% in the first 6 months of 2022 compared to the first 6 months of 2021. We will have to wait a bit for full year numbers comparing 2022 to 2021.
Dennis,
I was getting my 45% from years of watching the US EIA product supplied. I basically used 20% for diesel from the same source. I knew other parts of the world used more diesel for light duty. I didn’t realize how much.
Do you know world aviation fuel percentage ?
Thanks
My car sales data are from OICA: https://www.oica.net/category/sales-statistics/
Before determining the derivative, i applied a low pass filter to the car sales data. That is the blue line in the diagram. The filter reduces the spikes, which you miss.
Berndt,
You didn’t mention that the derivitive was of the low pass filter data. Is your filter just a moving average? You did not define what you have done very clearly.
The diagram below stems from Stephens link.
Dennis, your opinion “It won’t be long until EV prices fall to a level where incentives will no longer be necessary (probably within 5 years or less)” and this graph do not fit together.
I assume first, that cars get more and more expensive, and second, people with low income forgo to buy a new car.
All cars get expensive, and if i extrapolate the trend of the graphic, in 2027 not much people will be able to afford a new car, either an ICE or an EV.
Berndt,
This has to do with the relative cost of EVs vs ICEVs, that is the important metric in this case. Part of the recent price rise since 2020 is a shortage of vehicles due to a chip shortage, this is being resolved and vehicle prices will stop rising as fast as they have from 2020 to 2022. The relative price of EVs to ICEVs (for similar quality vehicles) has been falling, this will continue,
Notice that the last 3 data points of your chart suggest a return to the earlier 2014 to 2020 trend (actually lower in percentge terms).
A thing I remember from learning calculus some 30 years ago was that the second derivative is often more telling than the first.
A bit harder with discrete data points maybe but none the less. And I think that goes for both calculations, total sales as well as ICE/EV.
The long term reason for the decline in car sales is the aging population in rich countries. Increase urbanization will also play a role, because cars are less useful in cities than in the countryside. In the shorter term, The main reason for the decline in 2018 was the Chinese economy and changes in government policies away from subsidizing car sales.
The last few years have seen major disruptions of the international supply chains car companies rely on. These problems include trade wars, a pandemic and a real war. The main bottleneck is currently a lack of chips, not a lack of fuel.
55% of the cars sold in Germany last month had a plug. A third were EVs, a fifth were plugin hybrids.
Another 13% were hybrids without a plug. So less that a third of the new cars were powered by internal combustion power trains. And they are heavily laden with electronics as well.
https://cleantechnica.com/2023/01/08/evs-take-55-of-the-german-auto-market-in-december/
Thanks Alimbiquated.
Germany and Europe in general seem to be making good progress on the transition to electric transport.
Pioneer Natural Resources CEO: “There’s no extra supply in the next 5-7 years”
We repeat this Headline from Ovi above because the situation is much worse than CEO Sheffield is letting out to the public. Sheffield states there is no extra supply in the next 5-7 years, but what happens after that? Do the oil supply dynamics magically improve? No… HARDLY… LOL.
It’s no coincidence that Pioneer merged with Parsely in 2021 because it “DESPERATELY” needed to add some “UNDEVELOPED RESERVES.” If we look at Pioneer’s Proven Reserves from its 2021 Annual Report, 5% Undeveloped Reserves must have given Sheffield some of the worst Stomach Acid & Bile causing Ulcers.
Anyhow, merging with Parsely provided Pioneer a few more years before the PHAT LADY SIGNS as the world comes to understand, the GREAT SHALE BUST is underway.
GOD HATH A SENSE OF HUMOR…
HAPPY 2023
steve
Steve,
There is a distinction between proved developed and proved developed producing reserves. Some developed reserves have started being developed or are expected to be developed in the next 5 years, but havenot yet reached the point where they are producing oil. These are called proved developed nonproducing reserves.
Sheffield may be trying to talk up the price of oil with his recent comments.
DENNIS,
While you provided us with “YOUR” definition of Proved Developed & Undeveloped Reserves, let’s go by what Pioneer and other companies publish in their 10-Ks.
Proved developed reserves”: means reserves that can be expected to be recovered through existing wells with existing equipment and operating methods or in which the cost of the required equipment is relatively minor compared to the cost of a new well.
Dennis, please notice the “EXISTING WELLS” This may include DUCs, but it does not include WELLS NOT YET DRILLED.
As for the next definition…
“Proved undeveloped reserves”: means reserves that are expected to be recovered from new wells on undrilled acreage, or from existing wells where a relatively major expenditure is required for recompletion.
Dennis, please notice the term NEW WELLS.
So, if we read the definitions put out in these Official 10-Ks, PROVED DEVELOPED RESERVES for the most part… are from EXISTING WELLS.
GOD HATH A SENSE OF HUMOR…
steve
Steve,
Note the part after the “or” which does not mention existing wells.
Developed reserves are further divided into producing and non producing in some cases developed reserves includes wells that have not been spud, but have permits and are planeed in the future.
From SPE
https://www.spe.org/industry/docs/PRMS_Guidelines_Nov2011.pdf
on page 21 we have the following and chart below
Applying reserves status in the absence of project maturity subclasses can lead to the mixing of two different types of Undeveloped Reserves and will hide the fact that they may be subject to different levels of project maturity:
1. Those Reserves that are Undeveloped simply because implementation of the approved, committed and budgeted development project is ongoing and drilling of the production wells, for example, is still in progress at the date of the evaluation; and,
2. Those Reserves that are Undeveloped because the final investment decision for the project has yet to be made and/or other approvals or contracts that are expected to be confirmed have not yet been finalized.
Steve,
It also occurs to me that the imprtant point is producing vs nonproducing reserves, which is not reported in the 10k.
In the investor presentation from the 3rd quarter of 2022 Pioneer said they have 2 decades of drilling inventory at current completion rates. 968 million barrels and roughly 0.45 MMb per well would be 2150 wells, which is only about 5 years at current completion rates (around 400 per year). So there may be quite a bit of probable and possible reserves along with some contingent resources that are not reported in the 10k.
I wonder if the shareholders got what they expected; Parsley was one of those companies that show negative revisions to reserves almost every year since going public, and by the time it was bought it had very little undeveloped acreage left (i.e. undeveloped reserves would mostly be from wells fitted in between existing producers).
This is a more richly textured story than it is made out to be.
Old man Joe Sheffield was a crusty old driller in the Permian, and actually drilled some very successful Spraberry wells the old fashioned way: vertically. Back in the sixties, he was punching holes all around.
So here came Scott, who literally trotted all over the world to find oil. In the interim, his son Bryan becomes a trader on Wall Street, doing anything to get away from the oil field in the nineties, which wasn’t a very good place to be.
At some point, the Sheffields formed a union with Howard Parker. Then sometime in the nineties, they merged Sheffield and Parker with the mostly burned out company run by T. Boone Pickens, Mesa Petroleum. That became Pioneer. There wasn’t a lot of money in it.
At some point after John Mitchell (the unsung hero of this story) “discovered” fracking the shale (the Barnett), Scott realized all that oil he’d been chasing might be right under his feet. He began fracking too. His son Bryan, who wasn’t much of a trader, came home to Texas and started Parsley.
A few years ago–maybe ’19 or ’20, they merged, which gave them a lot of drilling acreage and economy of scale. Oil was only about $40 and nobody was making money in shale oil–except the people being paid to run the companies.
I don’t particularly like shale oil, for several reasons, but it has bailed the world out for several years. I shudder to think what the price of oil would be if it hadn’t been for shale oil. And in that world, these two men have done it about as well as the next guy. I don’t think these are shadow figures.
I mean, come on, in 2015 or so, Scott Sheffield had retired to Jane Fonda’s ranch up beside Santa Fe. He had all the money he’d ever need. I’m not saying he’s doing God’s work, but I also don’t think he’s talking up much of anything. I truly believe that Scott Sheffield has about as good a finger on the pulse as anyone, and when he says we’re going to run out of good places to drill, he probably is speaking from the heart.
I also think he’s getting old, and the young guns are coming. There is a world of technology out there, waiting to turn itself loose on the world of shale oil, as witnessed by John Hess’s blurb about producing Tier 2,3 sites in the Bakken. It’s not just the rock, it’s what is done to the rock. And John Hess and his people are figuring out how to intensely fracture the rock, and hold reservoir pressure, and furthermore to maintain the pressure far down the bore-hole, which is a big deal. They’re using ethane as a reinjection gas, to serve as diluent for long-chain hydrocarbons–another big deal.
I can tell you from personal experience that the long reach laterals in the Bakken on land that was formerly designated tier 2,3 or even condemned is producing comparably to the tier one of a few years ago. I imagine the same thing is happening in the Eagle Ford and the Permian.
This is a big story–an American story. And it’s not all written.
Tks Steve and Gerry for a view what is behind the curtain . More than what meets the eye ,
There was great commentary by Mike Shellman on his website about the non-core wells being drilled, both in the Bakken and the Permian. He is absolutely correct in that the spacing has to be spread out, the laterals long, and the frack job “intense,” which means a lot of sand and water and generally higher pressures. Even then, no one knows the life or ultimate recovery from these wells.
In the Bakken “flank,” those benches are exceptionally oil rich, but also very narrow. In my mind, the real advantage is finding a zone where the ethane cut of natural gas is very high, as it is an exceptional cleanup gas to promote longevity of fracture fissures and pores. Lots of the early decline of these fracked wells has to do with long-chain hydrocarbons–asphaltene, for ex–plugging up the fractures. Were it not for this, there would be seepage from source rock and the wells would have longer shelf life.
The fact that the industry is out there in the flank of the basins reflects the overall status of the tight oil situation. In general, it’s easy to grab onto the next great GREAT, but in reality, the pickings are getting pretty slim.
Gerry
In general, isn’t the rapid decline of LTO wells related more to the relatively small volume of oil being accessed relative to the volume being removed. Isn’t that the basic difference between punching a whole into a LTO bench vs punching a hole into Ghawar. Basic physics.
Theoretically, there is a massive amount of oil stored in the rock . . . if one could access it. But yes, you are right, the amount being accessed is rather small. In fact, that is what bothers me so much about the shale oil. Contained within the rock in a rich zone is a tremendous amount of LTO. The more concentrated, the greater the temptation to drill closer spacings in order to drain that bench of shale. Yet, because each basin is built upon a karst–limestone in the Permian, especially the Delaware sub-basin, strontium carbonate up in the Bakken–there is transmissible pressure throughout a wide area and when large amounts of hydrocarbons are brought out, the pressure drops, and then that equilibrates through walls of the karst, and the pressure falls below the bubble point of gas, at which point the GOR increases and church is out.
Occasionally, in large wells, there is a large source rock feeding the drill bore and continues to feed the rock. The concept of removing greater percentage of oil has always excited the shale folks. But in reality, the percentage is still low–maybe 25%. Each well is different, but a lot of the parabolic decline, which still persists to this day, is due to not only pressure drop but the plugging of millions of fissures and pores with long-chain hydrocarbons.
Gerry
Thanks for the additional info, especially on how the pressure drop spreads.
Gerry,
Do you have a guess on the URR for the North Dakota Bakken/Three Forks? My guess is 7.5 to 8.5 Gb.
For the Permian my expectation is about 42 to 48 Gb for URR. Eagle ford about 7 to 8 Gb.
US Rejects Oil Offers in First Attempt to Replenish Stockpiles
(Bloomberg) — The Biden administration is delaying the replenishment of the nation’s emergency oil reserve after deciding the offers it received were either too expensive or didn’t meet the required specifications, according to people familiar with the matter.
The Department of Energy rejected the several offers it got for a potential purchase in February, said the people, who asked not to be identified as details of the process haven’t been published.
The department outlined its intention in December to begin restocking the Strategic Petroleum Reserve, starting with a purchase of 3 million barrels next month. The plan follows the historic 180 million-barrel release of oil from the reserve ordered by President Joe Biden as he sought to tame the high gasoline prices in the aftermath of Russia’s invasion of Ukraine.
The department will put off the purchase it had originally planned for next month, but its program, which used a new approach that accepts fixed-price offers, will continue, one of the people said.
I dont think the SPR will ever be refilled
https://www.bnnbloomberg.ca/us-rejects-oil-offers-in-first-attempt-to-replenish-stockpiles-1.1866843
YOY, total crude oil stocks in the USA fell 218.5 million barrels.
What has changed that will avoid similar stock draw in 2023?
Aren’t total crude oil stocks really the only relevant number?
I know we used to only look at commercial, but that was because the SPR was either no change or little change.
I’m not well informed as to why there will not be a structural crude oil deficit in 2023, as their was in 2022.
Since 2017 USA has drawn down 433 million barrels of crude oil stocks. At 793 million at 2022 year end, we are down to levels not seen since 1986. The records only go back to 1982 on the EIA site I’m looking at for total crude (commercial plus SPR).
You sure as heck don’t see that reflected in todays WTI price, especially in real terms.
Shallow sand,
Weekly crude stocks
I wonder what that graph would look like without the SPR releases.
Does that impact this significantly?
Hickory,
That chart is for total crude oil stocks which includes the SPR.
Net imports crude oil (weekly). Note that a lot of crude is imported, refined and then exported as products. For this reason looking at net exports of total petroleum (crude plus products) makes more sense to me.
Note that at the end of 1986 net imports of crude were roughly 4300 kb/d (4 week average assuming exports were roughly 159 kb/d) and at the end of 2022 about net imports of crude were about 2100 kb/d (4week average for December). We do not have weekly data for crude exports going back to 1985 so I have estimated using monthly data (Dec 1986 crude exports were 159 kb/d).
Pioneer Proved Reserves For Dummies…
Even though Dennis provided us with additional footnotes on Proved Reserves, in the whole scheme of things, it’s meaningless. Yes, there could be some Proved Developed Reserves that have not been drilled. However, I doubt it’s much.
Regardless… when we look at Pioneer’s TOTAL PROVED Developed & Undeveloped Reserves, the figure they report is 967.6 million barrels. If we look at their average daily production in 2021, it was almost 357,000 bopd. Thus, Pioneer produced 130 million barrels of oil in 2021.
Using simple 4th-grade math, 130 million barrels per year would provide Pioneer 7.4 years’ worth of Proved Reserves. (967.6 / 130 = 7.4)
So, if Pioneer was able to produce oil in the Permian at the same rate, it would run out of reserves in a bit more than 7 years.
Thus, the Shale Oil Energy Cliff still occurs by 2030.
Steve
Steve,
There are likely probable and possible reserves as well as contingent resources that might be classified as proved reserves in the future. Proved reserves have about a 90% probability of being lower than the actual level of reserves. So the 7 year estimate is likely too low.
Permian basin annual proved reserve increases from 2018 to 2021, cumulative increase over 4 years is about 11 billion barrel or an average annual increase of 2.75 billion barrels per year (or about 7.53 Mb/d). Future rates of increase are unknown.
Iraqi judiciary issues arrest warrant for Donald Trump
Baghdad (IraqiNews.com) – The President of the Supreme Judicial Council, Faiq Zaidan, announced on Thursday the issuance of an arrest warrant for former U.S. President Donald Trump, according to Baghdad Today news agency.
Zaidan mentioned in a statement that the Iraqi judiciary issued an arrest warrant for former U.S. President Donald Trump, who confessed to having committed the crime, calling on those investigating the assassination of the Quds Force commander, Qasem Soleimani, and chief of staff of the Popular Mobilization Forces (PMF) in Iraq, Abu Mahdi Al-Muhandis, to make an exceptional effort to uncover the perpetrators, Baghdad Today news agency reported.
I have posted this because I think this shows how Iran is gaining more influence in Iraq and makes me wonder what effect it will have on Iraqi production and whether Iran could be selling oil through Iraqi ports to get around sanctions.
https://www.iraqinews.com/iraq/iraqi-judiciary-issues-arrest-warrant-for-donald-trump/
Should be a good battle with the US Secret Service.
They had better get in line
https://www.independent.co.uk/news/business/analysis-and-features/igor-sechin-the-oil-man-at-the-heart-of-putin-s-kremlin-10043230.html
Anyone who doubts Putin hasn’t been thinking about Peak Oil for a while, can be certain he has.
Igor Sechin, is the hand selected by Putin, inner circle oligarch and CEO of Rosneft
“He repeatedly expressed his concerns that there could be a global shortage of oil if companies did not return to investing in production and output.” – From 2015
Above Berndt posits that auto sales are related to oil pricing.
Taking the general idea a little further, I’ll add that affordable energy supply
allows population survival and growth.
A decline in energy supply will result in a lower population, after a lag of several years to several decades (at most). Pick your mechanism.
And yes, that will mean less vehicle sales. And less sales of just about everything.
the chart below is about 12 years old, with population now 8 billion
In Oregon, we had a population decrease.
First time in a long while.
Why do you think that is? The US had an overall increase of .4% is what I am finding, with Florida increasing by the most.
As I deal with substance abuse disorders professionally, I have been watching Oregon’s decriminalization experiment closely. So far it doesn’t appear to be working, but I think the state has been slow to fund the treatment side, which obviously is an problem. I’m keeping a very open mind, this issue has vexed me my entire career. I do wonder if arresting people helps. Unfortunately if Oregon keeps on heading statistically the way it is, decriminalizing hard drugs will be seen as a failure.
To relate to oil, it is a reason in my county why there is a labor shortage. Our county had the most drug arrests ever in 2021, with thankfully a decrease of almost 10% in 2022, but still the second highest ever.
Regular users of meth tend not to work. The public defenders in our county are busier than ever representing indigent defendants, many are addicted to meth, or to a lesser extent, opioids. A decent percentage use both.
We have hundreds of young men who rarely work in a county of just 18k people. They could un stack a lot of service rigs.
The funny thing is, in the 50s meth was used to work harder. Pervitin was available in every drug store, you could get it up to the 70s from a doctor when feeling tired.
Especially the old style oil jobs Mike likes to write about are classical meth jobs: Working 36 hours until the leak is fixed is much more easy with a few pills – for that reason all military has these pills in store. Want to march the day, then guard the hill the whole night without sleeping – Meth job.
A lot of people locally start using meth for that reason. Factory work isn’t easy. Lots of meth in the factories.
But what they are smoking and then later injecting must be a whole different level than what you mention. They don’t stay working long.
Just got the year going with abuse and neglect case #1 in 2023 today. Had 91 juvenile cases filed last year in our little county. Drug issues with the parents on about all of them, almost always meth.
WTF is THIS all about ?!
Nobody in the well control business EVER took drugs, EVER. We had to be fully engaged, always; one stupid mistake, or a careless error and you were dead. In all the years I roughnecked on drilling rigs around the country nobody I ever knew took drugs. EVER. We twisted off at night over beers, drank to celebrate life, but at 05:00 the next day we were ready to roll out, at 100%. 24/48…whatever, it was just work. You did it, kept your mouth shut and didn’t whine.
I don’t like generalizations about my industry, or it being cast as full of drug addicts. That’s an anti-oil observation made by people who don’t know which end of a shovel to hold. Today’s oilfield is big, fast, and full of competent men and women that are smart and wanting to feed their families, not sit on the couch and watch Oprah re-runs. Hands get drug tested constantly. In Texas if you get nailed for that crap you are blacklisted and can’t get another job. Mexicans are good, hard working, honorable people with a fierce sense of pride in being able to provide for their familia. A “strike” by good Mexican people in the Permian Basin and you could wipe your butt with all of Dennis Coynes “models.”
Kids today are not worth a shit and my experience is the further away from Texas one gets, the worse the kids get. It starts with the stock they come out of.
Drugs are a regional problem, a generational problem, a political belief problem, a social problem, an I-want-free-shit problem, not just an oil industry problem.
Meth, whatever the hell that is, seems cowardly. Like insulting people on the internet using an anonymous username. I mean, really; how big a cajones do you have to have to do THAT ?!
Mike.
I’m not saying illegal drugs are an oilfield problem.
They are an American problem. A great big one.
I’d be happy to discuss my experiences and views more privately. I think I’ve went way off topic here in the oil thread and I’ll stop now.
I’ll close with saying the long term people that have worked with us in the oilfield here are among the best people I know. Work in all the elements, we had -35 F windchills before Christmas, for example.
We have several high total fluid volume injection plants on 24/7/365 call boxes. So they can be out there at 3:00 am trying to figure out what is wrong.
Treat our leases as their own. We appreciate them so much.
“Drugs are a regional problem, a generational problem, a political belief problem, a social problem, an I-want-free-shit problem, not just an oil industry problem.”
And the state with most fatalities/capita from driving on the alcohol drug is not Texas. Its Montana.
Texas is number 2.
Yes, it is a cultural problem.
Interesting comment Mike. I agree many immigrants are very hard working, lots of industries would be shut down in the US without their labor and my models would not be close to being correct (and they won’t in any case) unless there are workers available to produce the oil. That might have been Shallow sand’s point, or that is how I interpreted his comment.
I don’t want to insult anyone, and no insult intended. The German Wirtschaftswunder was helped by (low dose) meth. That’s just fact. I don’t say the oil industry uses it – it’s only the kind of job where it is the temptation is big to use it. I know the stuff I’m not able to do anymore on a 36 hour shift and stuff I better not touch.
On the most dangerous jobs it is used, too, here a link from a government site:
https://pubmed.ncbi.nlm.nih.gov/7661838/
65% of the pilots used meth during their combat missions – here a one second delay or error can be deadly.
“Amphetamine use enhanced cockpit performance and flight safety by reducing the effect of fatigue during critical stages of flight. ”
It’s a complete other thing to beam you full of stuff brewed in an illegal kitchen lab and only dream of being a super hero. You won’t work anything then.
Oregon’s population shrunk last year, Census data show
https://www.koin.com/news/oregon/oregons-population-shrunk-last-year-census-data-shows/
I don’t see a problem, but I’m from California.
Amateurs
Brazil has gone nuts.
Shades of “The Sea Peoples”?
https://www.youtube.com/watch?v=lp5hXnw4-n4
“Refinery operators should be put on suicide watch when they figure this out.
Many of them need to recoup billions and the oil grade they designed their refineries for is going away.”
I am certain this will push ALOT of buttons.
The EIA 2021 reserve estimates for USA came out on 30th December. With prices recovering from the 2020 crash some of the negative revisions in the shale basins would be expected to be recovered, but typically it is not the full amount. For Bakken and Eagle Ford there were fairly small recoveries but Permian and Niobrara continues with negative revisions.
Discoveries (including extensions), which for tight oil are mostly development decisions (FIDs) on long known resources, picked up after large drops in 2020. The numbers are taken from EIA data for producing areas so are not strictly all tight oil from the named basin, and I don’t think EIA collect data from all companies, but the trends are indicative enough (comparing reported production rates Niobrara is the furthest out).
Bakken reserves look to be on the downslope of a bell curve and for the last couple of years may be falling as fast as they originally grew.
Eagle Ford, like Bakken, has falling reserves. Non-productive reserves, which are predominately undeveloped (i.e. with no completed wells) are falling faster than total reserves, which is usually indicative of a mature basin.
Niobrara has a fairly constant reserves but only because of acquisitions, which I think are transfers from private companies that EIA don’t include in its data, to public companies, that it does. At some point these have to start falling as the privately held reserves deplete. R/P is below ten years, undeveloped reserves are declining rapidly towards zero (presumably recent purchases have mostly been mostly developed already), cumulative adjustments are strongly negative since 2014 and discoveries are trending towards zero over the next couple of years.
Permian C&C remaining reserves may be close to their peak; the EIA numbers increased a bit but some of that was from acquisitions; discoveries have been plateauing and, if the pattern of other tight oil basins is followed, may soon start to fall – the ratio of undeveloped reserves is falling and is proportionally lower in Texas (28%) than New Mexico (46%). The negative revisions were in Texas and, proportionally, New Mexico had three times as many discoveries and extensions than Texas.
All the tight oil basins R/P numbers have been falling and all but the Permian are trending below ten (Permian is slightly above), in conventional production that is a typical value when reserves and production might start to fall together as exponential decline sets in, whether that happens with non-conventional tight oil might become apparent over the next years.
This shows total conventional gas, associated gas and shale gas from all the areas associated with tight oil and gas basins. Remaining reserves may be reaching a peak but it’s not too clear, however it’s not a pattern that is likely to support many more FIDs for full scale LNG plants.
The main wave of COVID is already at the maximum in chinese big cities:
https://www.bbc.com/news/world-asia-china-64208127
There will be an echo in the lunar festival – and then all Covid restrictions and delays will be over for China. And there will be a lot more travelling – I think oil demand will jump this year in China.
A slightly more conservative Permian scenario with URR of about 38 Gb, cumulative discovery through the end of 2021 is about 20 Gb (cumulative production plus proved reserves), potentially there may be some probable reserves, possible reserves, and contingent resources, but the amounts are not known. The completion rate is 429 per month from November 2022 to July 2023, then rises by about 4 wells per month until reaching 500 wells per month in Jan 2025 and reamians at that level until Dec 2026 and then gradually decreases to zero by April 2035. Total wells completed from Jan 2010 to April 2035 is 93616 for this scenario. Peak output is 6598 kb/d in Sept 2028 for the scenario. Output for December for years 2021 to 2029 shown on chart.
Malaysian exports…
Rgds
WP
A new thread reporting on September Non-OPEC Oil Production has been posted.
https://peakoilbarrel.com/all-september-non-opec-oil-production-increase-from-us/
A new Open Thread Non-Petroleum has been posted.
https://peakoilbarrel.com/open-thread-non-petroleum-january-10-2023/