STEO
The EIA’s Short Term Energy Outlook (STEO) was published in early December. The chart below estimates World C+C by using the STEO forecast combined with past data from the EIA on World Output.
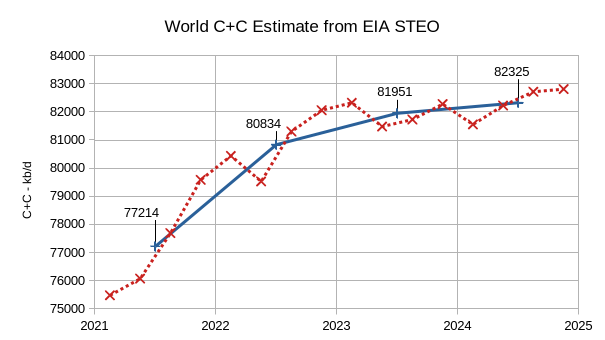
The EIA’s Short Term Energy Outlook (STEO) was revised higher for 2023 compared to last month and lower for 2024. World C+C output is expected to increase in the 4th quarter of 2023 and then decrease 2024Q1 followed by increases in quarterly output. Annual average World C+C output increases by about 1117 kb/d in 2023 to 81951 kb/d and then to 82325 kb/d in 2024, about 675 kb/d below the centered 12 month average peak in 2018. This month’s World C+C estimates are about 147 kb/d higher than November’s estimate for 2023 and 230 kb/d lower for 2024 due to the revisions in the STEO forecast since last month.
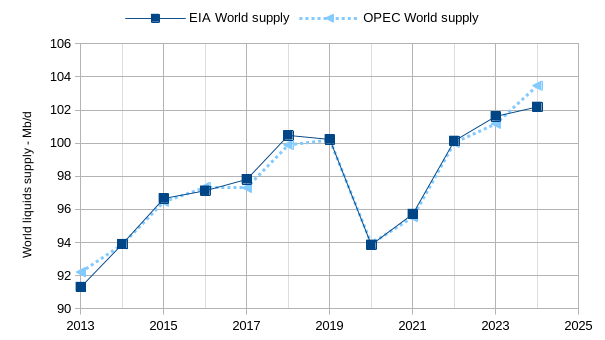
The chart above compares the EIA estimates and 2023 and 2024 forecasts of World liquids supply with the estimates and forecasts by OPEC, for most years the estimates are similar and the biggest difference is in the 2024 forecast where the OPEC forecast is 1.3 Mb/d higher than the EIA forecast.
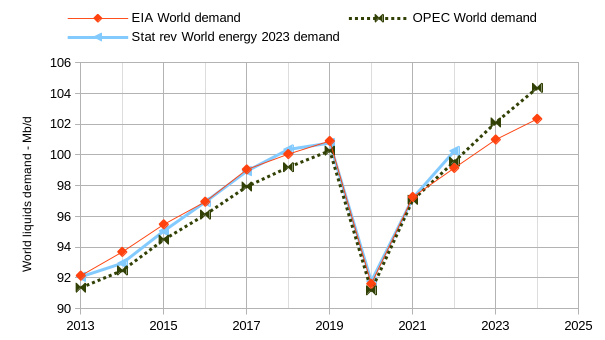
Above we compare estimates for World liquids demand from 2013 to 2022 from the Statistical Review of World Energy (SRWE) 2023, EIA and OPEC, also compared are the EIA and OPEC forecasts for 2023 and 2024 annual average World liquids demand. In this case there is a significant difference in estimates from 2013 to 2019 and in 2022. The forecasts for World liquids demand in 2023 and 2024 are also very different between OPEC’s MOMR and the EIA’s STEO, in 2023 OPEC’s forecast is 1.1 Mb/d higher than the EIA forecast and in 2024 OPEC’s forecast is 2.02 Mb/d higher.
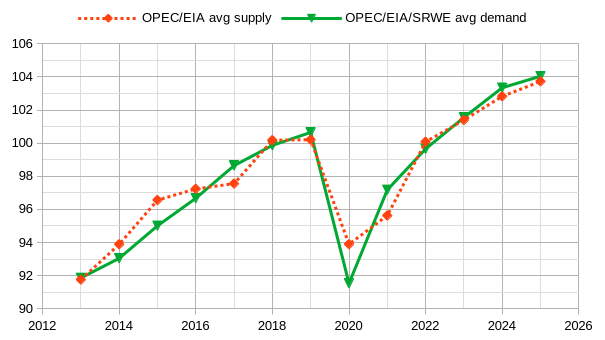
The chart above averages the estimates and forecasts presented in the supply and demand charts above, the estimate for 2025 is my guess based on recent forecasts by OPEC and the EIA in 2023 and 2024.
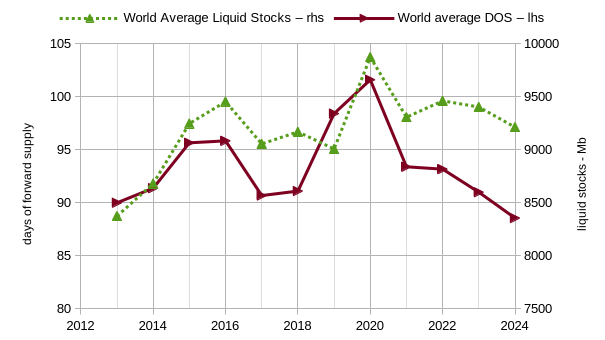
The chart above uses the average supply and demand estimates and forecasts to find World liquids stock levels. It is assumed at year end 2013 there are 90 days of forward (2014) consumption held in World liquid stocks, then supply is added and demand is subtracted from stocks each year with the absolute level shown in millions of barrels on the right vertical axis. The days of forward consumption at the end of each year are shown on the left vertical axis, with amounts that are above 92 days being oversupply and leading to falling oil prices and days of supply under 92 days suggesting undersupply and should lead to rising prices. Note that in 2023 and 2024 the chart suggests oil prices should rise, but this will only be the case if the supply and demand forecasts are accurate. The fact that oil prices have been relatively low in 2023 and are likely to continue to be low in 2024 suggests that either demand forecasts are too high, supply forecasts are too low or a bit of both.
Tight Oil
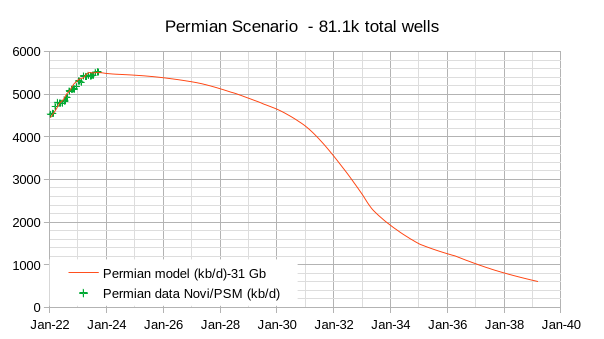
The scenario above is a departure from most of my previous scenarios where it was assumed that Permian output would continue to grow through at least 2028, before plateauing and then declining. This scenario has a 13 well drop in completions in November 2023 followed by gradual decline in completions by one well per month to Jan 2027, by 2 wells per month up to November 2029, by 5 wells per month up to Nov 2023 and by 10 wells per month up to Feb 2033 when no more wells are completed. It is also assumed the new well productivity falls by about 3.9% per year initially in 2023, with rates of decrease slowing over time as fewer wells are completed per year over the course of the scenario. My expectation of relatively low oil and natural gas prices and lower profits for Permian producers as a result lead me to this new scenario. I have left the scenario for other tight oil basins unchanged (which is likely too optimistic) so the US scenario only changes due to this new Permian scenario.
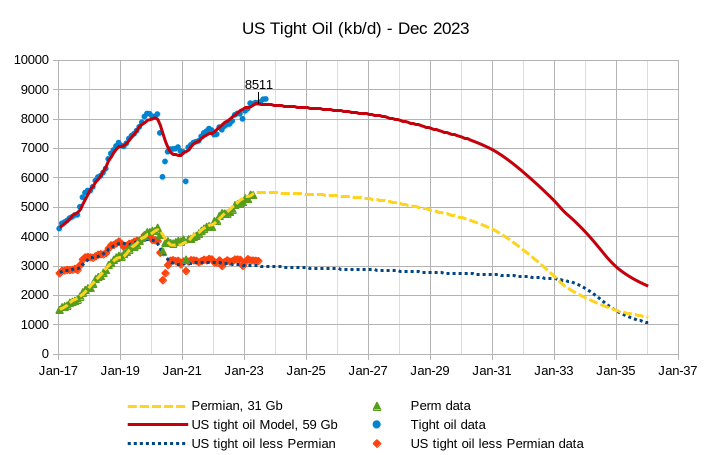
The US tight oil scenario peaks in 2023 at 8500 kb/d, about 550 kb/d lower than the scenario presented in November and about 4 years earlier. The URR is about 4 Gb less than last month’s scenario.
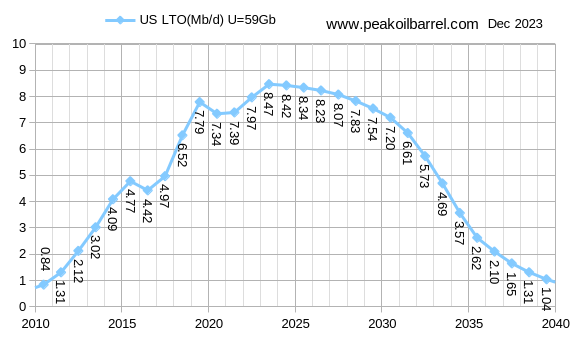
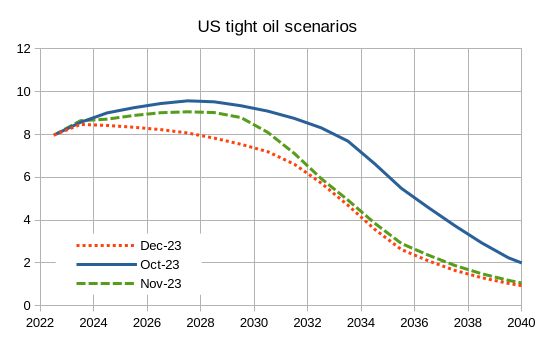
The chart above is in Mb/d (vertical axis) the Dec-23 scenario has a 59 Gb URR, the Oct-23 scenario a URR of 72 Gb and the Nov-23 scenario has a URR of 63 Gb.
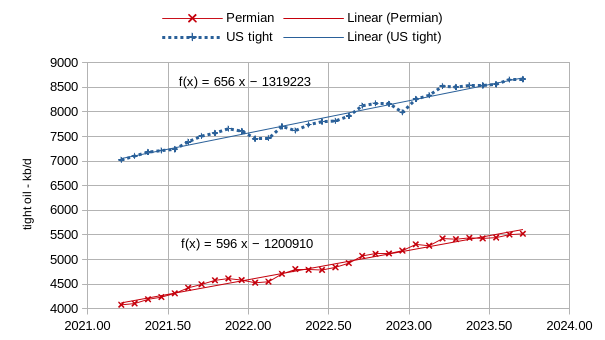
The estimates above use data from Novi labs, Texas RRC, New Mexico OCD, and EIA PSM and official tight oil estimates. Most of the increase in US tight oil output from March 2021 to September 2023 comes from the Permian basin. In the past 7 months the rate of increase has slowed to about an annual rate of increase of 320 kb/d for US tight oil and to an annual rate of increase of 205 kb/d for the Permian basin.
World Oil Shock Model
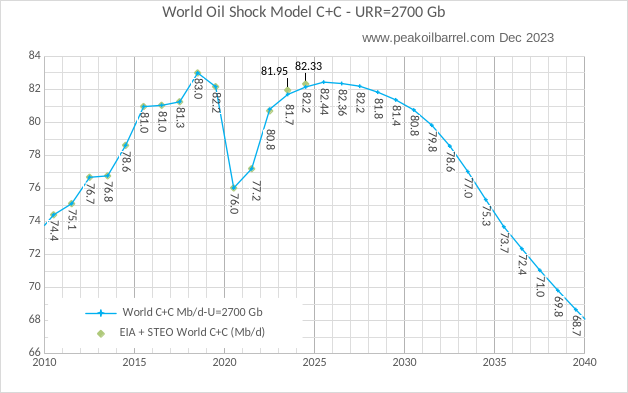
The World Oil Shock Model above reflects the new tight oil scenario with no other changes, I have changed the URR to 2700 Gb as only two digits are significant for a model with this much uncertainty. The peak is 82.4 Mb/d in 2025, the STEO estimates for 2023 and 2024 are shown from the December STEO.
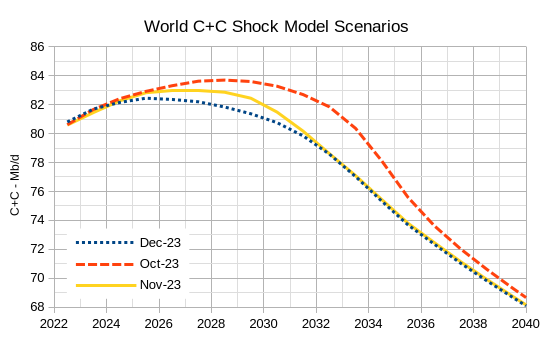
The chart above shows the evolution of the World Oil Shock model over the past 3 months, mostly due to changes in my expectation for further growth in the Permian Basin along with my expectation that oil and natural gas prices may remain lower than I had previously guessed. Roughly the Dec 2023 scenario envisions oil price at under $75/b and natural gas prices under $2.50/MCF, the October 2023 scenario expected oil prices over $85/b and natural gas prices above $3/MCF. I cannot predict future prices, but I think demand may be lower than I had expected in the past.
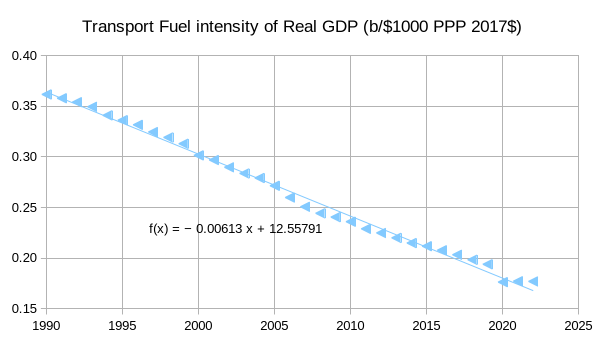
The chart above shows transport fuel intensity per one thousand dollars of real GDP for the World in 2017 international dollars which use the purchasing power parity methodology for assessing real GDP. Transport fuel is defined as gasoline, distillate/diesel, kerosene, and residual fuel found at this link. The GDP data can be found at this link. In 2022 transport fuel was about 83.5% of World C + C output by volume so I estimate World C + C demand by dividing my transport fuel estimate by 0.835. I assume World real GDP grows by about 2.5% per year due to slowing population growth in the future, where I assume the real GDP per capita growth rate of 2.2% from 1993 to 2019 continues in the future. Spreadsheet with data at this link. I use a decrease in oil intensity of 0.0055 per year after 2022 to account for the kink in the data around 2007, this may be too high a decrease in crude oil demand to be realistic, but might be considered a best case scenario for the environment and climate change.
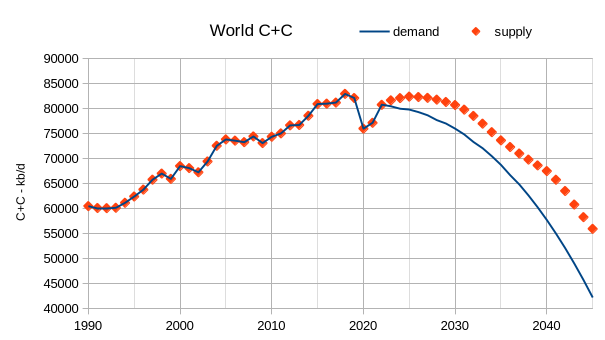
For the chart above the supply scenario is the most recent World Oil Shock Model and demand multiplies oil intensity decreasing by 0.005 barrels per thousand of real GDP each year by real GDP to get transport fuel demand. Then transport fuel demand is divided by 0.835 to get World C + C demand. A scenario with very fast uptake of plugin vehicles and commercial vehicles (assumed to lag personal vehicles by 5 years) is similar to the supply scenario through 2036, some factors not accounted for are the rapid uptake of EV 2 and 3 wheel vehicles, the improved efficiency of the ICEV fleet as more hybrids are used, and the potential of EV taxis and Uber/Lyft vehicles to replace a lot of oil use, also there is the potential for full self driving in the future, though I doubt that occurs prior to 2030 and perhaps never. In any case it is the potential for this downward pressure on oil prices due to lack of demand that has led to the revision of my scenarios. If I am wrong, then the earlier, higher scenarios are more likely to be correct.
183 responses to “EIA Short Term Energy Outlook and Tight Oil Update, December 2023”
Great work Dennis. I love it. Please keep up the great work.
Agreed.
Great work!
Andre
Thx Ron Andre and Schinzy.
Agreed!
Dennis
You have world supply of oil greater than world demand from 2024, also you assume demand which has risen over the last 3 years falling from 2024 onwards. Is that correct?
A very recent developement is the massive drive by oil companies to build oil to chemical plants. One in Saudi Arabia is due to be up and running by 2026, using 400,000 barrels per day. Another in South Korea, an Aramco subsidiary also due to start operating in 2026.
https://www.icis.com/asian-chemical-connections/2023/11/details-of-how-saudi-aramco-cotc-and-other-advantaged-feedstock-projects-could-redraw-the-petrochemicals-map/
In all 4/5 million barrels per day of oil could be diverted from producing petrol and diesel to producing chemical feedstock.
It is obvious that the oil companies and in particular Saudi Arabia are moving fast to ensure oil demand grows enough to ensure higher prices than you predict.
Nice to see a graph with C&C and NGL higher than 2018 as they are all used in the global industrial complex.
Charles,
A lot of the input of “barrels” into petrochemical facilities are barrels of oil equivalent. This includes natural gas and NGL and very little C plus C.
My expectation is that the demand forecast shown on the chart is too low and the supply forecast may be too high if oil and natural gas prices remain under 75/b, 2.50/MCF.
If prices are low reality might be between the supply and demand forecast, it is certain that neither forecast will be correct.
The demand forecast can be found at spreadsheet link.
It may be that demand is flat for C plus C for 5 years if transprt fuel intensity of real GDP decreases at 0.005 rather than 0.0055 as shown on the chart, such a simple model is unlikely to reflect reality.
Dennis
The articles explain these are new refineries that are designed to process crude oil into chemicals.
Current facilities usually produce 80% diesel, petrol and aviation fuel. These new facilities will use crude oil to produce mainly chemicals.
https://www.aramco.com/en/what-we-do/energy-innovation/advancing-energy-solutions/crude-oil-to-chemicals
facilities are being built and trials on better plants are well under way by several major oil companies.
We will just have to see what effect they have
Charles,
There is only so much demand for petrochemicals. At some point no more of these refineries will be needed.
That Saudi project is a research and development project that may or may not become a reality.
The Saudis may be worried there will be no use for their crude oil in the future.
Dennis
No they are actually building one plant in Saudi Arabia and building one in South Korea. Another plant is up and running in China.
Why don’t you do some proper research on these matters.
The additional 500 million people on the planet by 2030 and the increased wealth will ensure demand for Chemicals from oil increases considerably.
You have said several times population growth is slowing down, do you actually know the facts?
In 2030 the global population will still increase by an additional 70 million people and in 2040 by an additional 55 million
https://en.wikipedia.org/wiki/Projections_of_population_growth#/media/File:World_Population_Prospects.svg
Just like yourself they will all be using chemicals in soap, washing up liquids, rubber tyres etc etc etc
Charles by 2030 the global population would have increased by about 350-400 million not 70, thats the annual change.
Charles,
Yes you have just shown that indeed population will grow more slowly in 2040 than in 2030, so population growth is “slowing down”, just as I said.
Petrochemical use may increase, much of it may come from natural gas rather than C plus C. My guess is that the increase in petrochemical use will be less than the decrease due to less C plus C being used for land transport over time, but my guess could indeed be incorrect, the future is difficult to predict imo.
From the Link you posted above:
Of the research tracks, the most advanced is the Thermal Crude to Chemicals (TC2CTM) program.
Saudi Aramco has already entered into a Joint Development Agreement with U.S.-based leading technology provider CB&I (now McDermott) and Chevron Lummus Global to further accelerate the development and demonstration of the technology.
This collaboration will substantially accelerate this technology toward commercialization and our team is working to demonstrate the technology on a larger scale at CLG’s Richmond Technology Center.
Sure sounds like R & D to me. In fact the entire page is talking about research and development, sometimes the research does not pan out. That’s how the world works.
Charles,
OPEC is actively trying to raise oil prices which tends to reduce World demand. Though so far they have not been successful, when we see all of OPEC producing at capacity, that would suggest they are trying to increase demand.
At that point investment in expensive unconventional oil may cease, if increased OPEC output ever occurs.
Great work Dennis. Thanks.
A scenario that has slower decrease in demand with transport fuel intensity decreasing by 0.005 barrels per thousand international 2017$ (PPP) from 2023 to 2035 rather than 0.0055 as in post and then increasing to 0.006 from 2036 to 2045, and EV transition scenario with no autonomous vehicles assumed, but high growth in sales of plugin vehicles 41% per year intitially in 2023 falling to 35% annual growth by 2029 when sales are at 100% of light duty vehicles. The commercial fleet share of plugin vehicles is assumed to follow the personal vehicle share lagged by 9 years. I do not consider improved efficiency of ice vehicle fleet due to more hybrid sales or the 2 and 3 wheel vehicle market which may be significant in emerging economies and assume autonomous vehicles never become a viable technology in these scenarios.
Dennis
I think your EV transition is optimistic even for Europe and the US. Sales at 100% in 2029?
Not many will buy an electric car when petrol is $3 a gallon, if your prediction that oil prices will not go over $100 then many poorer countries will not see much growth in electric cars
https://www.globalpetrolprices.com/gasoline_prices/
Charles,
I agree my scenario is optimistic, prices of EVs will reach parity or be even cheaper than ICEVs within 5 years, currently total cost of ownership is about the same or cheaper for EVs.
Charles,
As of Dec 25, 2023 only 24 nations (mostly oil exporters) had prices under $3 per gallon. China at $4.30 per gallon and India at $4.74/ gallon. So if oil prices remain roughly where they are we won’t be seeing $3/gallon for most of the World unless oil prices fall further.
Dennis, thanks for the great work.
Curious, what made you finally abandon the AV/Robo Taxi theory in your models? I know we debated this a while back, but we haven’t discussed in a while. Was it due to the recent failures and setbacks at the trial tests? Or, did you adopt the other theory that Robo’s may only displace human operated taxi/Ubers?
Thanks
Gungagalonga,
Progress has been slow, so I am being conservative. If the problem is ever solved, it will reduce vehicles needed as most driving will be done by the vehicle which can operate 24/7 as needed. This will cut the vehicle fleet by a factor of 4 or more and accelerate any transition to EVs, a game changer that I have left out of the discussion until it becomes a reality.
If autonomous vehicles become a reality, most people will choose not to own a car as travel by robo taxi will be far cheaper per mile travelled. Only the very wealthy or “driving enthusiasts” will own a car. The driving enthusiasts may be relagated to tracks or off road courses because robotaxis will be far safer than human drivers, it will be considered too risky to allow human drivers on roads.
Charles —
You assume that cheap electricity is the only incentive to buy an EV, but that may change. Car manufacturers are aggressively downsizing their engine manufacturing already. Instead they are pouring money into battery production and software.
The industry is in the middle of a massive upheaval and companies are trying to change themselves into something more like consumer electronics companies.
The question is what vehicles will be available for end user to buy in 2030, and at what price. Consumers may turn to EVs because they are available and cost less by then.
Alimbiquated
Car manufacturers are moving away from ICE to electric in many countries. However in poorer countries there is a large market in used cars and they are the only cars most people can afford.
These countries tend to have cheap petrol also, so petrol and diesel cars are the only option for poorer people.
It will take many years for a second hand electric car market to become as big as the current ICE vehicle market.
The idea that cars are a solution to he problems of the poor is the result of decades of car company propaganda and terrible urban planning that bans a useful transportation system.
In fact cars are not a viable means of transportation in an increasingly urbanized world. And as this chart shows, most of the current displacement of oil consumption by EVs is poor Asians using electric 2 or 3 wheelers.
https://cleantechnica.com/2023/05/17/wef-sees-huge-drop-in-oil-demand-as-electric-vehicle-sales-rise/
Meanwhile the Chinese are producing very small 4 wheeled vehicles for urban use that are in a totally different price range than combustion engine vehicles.
https://electrek.co/2023/08/26/cheap-chinese-two-seater-electric-car-alibaba/
Charles,
I would think the only poor nations that have cheap fuel prices are those that are oil producers this is a pretty small proportion of the population of less developed nations.
I agree it will take time, scenario below is very optimistic/unrealistic.
Used vehicle sales are greater than new vehicle sales in the US because here too most people can’t afford a new vehicle. Cheap petrol is still expensive when incomes are low but still beats muscle power. My fella Muricans would freak out and revolt if gasoline was some ridiculously unrealistic high number like $20/gal but if the choice was pushing that 3400 lb compact 20 miles or paying $15 to do so most would pay if the need warranted it.
My $.02 is the used EV market will never get as big as the used ICE market because there won’t be the energy to build that many EVs, run the economy and the existing ICE fleet.
most people can’t afford a new vehicle
Yes, as the Canaanite woman said, the dogs eat the crumbs that fall from their master’s table. The American transportation system is built for the rich. There is little threat of it failing for the poor, because it already has.
That’s why there are payday loan companies for car insurance located in strip malls with no pedestrian access where their neighbors offer minimum wage jobs. Forcing minimum wage workers to buy cars creates all kinds of opportunities for predatory lenders. That’s also why you see huge ads for ambulance chasing lawyers when you’re stuck in traffic on poorly designed roads. If the transportation system were functional, the ambulance chasers would go out of business.
If poor countries adopt the system they will experience the same problems.
Thanks Dennis, great work and interesting scenario updates.
I got some questions, why has your URR changed ? Do you think demand will die down quicker due to higher electrification of transport hence lower oil prices/demand ? Or just reduced demand due to the global economy being weak ? Even then in both scenarios the distribution curve could have the same URR just flattened out to a larger time scale.
Do you see geological constraints coming into the picture at some point to affect supply ? Or will we never see physical supply side issues, and only the demand side dictating the market ?
Iron Mike,
The fall in oil intensity of real GDP is a big part of the story, it may not continue at the rate of the past 32 years, but if it did and real GDP per capita grows at historical rates with population following scenarios from Wolfgang Lutz et al then oil demand will tend to fall. URR falls due to lack of demand for oil as it gets replaced by other energy resources. The main geological constraint will be lower oil and natural gas prices making difficult to access resources (oil sands, tight oil, Arctic Oil and some deepwater resources) unprofitable to produce so the oi remains in the ground. So it is a story of peak demand rather than peak supply. So it is mostly a transition away for oil and other fossil fuel that leads to the lower demand as I see it rather than a weak global economy.
I no longer see $100/bo (in 2023$) in our future, I think peak oil prices (on an annual basis) are in the past.
Dennis,
So just to be clear, peak oil is a none issue for you then ?
Iron Mike,
I think the transition to alternatives to fossil fuel and the associated problems that entails is a more interesting problem. I am not fully convinced that this theory (of peak demand) is correct, I may well be wrong, it will be interesting to see how it plays out. I have expected for a long time that we would see very high oil prices. I am still waiting for confirmation, the lack of a supply shortage has lead me to alternative hypotheses that may reflect reality more accurately. We will see.
Guess I am on the fence.
Dennis,
Thanks for the clarification. It is very hard to tell whats going to happen with all these moving parts. You could very well be right. I am on the fence as well. It seems oil traders might be anticipating a recession hence the weak prices.
I personally think there is a debt saturation scenario, hence the weak global economy which is affecting oil prices. We will see what happens.
Iron Mike,
I agree very complex, I don’t see the debt problem that many see, much of the increase in World debt levels is due to more people having access to credit, in developed areas in particular, but even in developed areas the use of credit is more widespread. If credit contracts suddenly because private borrowers and lenders stop borrowing and/or lending, then there would be a severe recession in the absence of government fiscal spending to offset such a contraction.
If governments in general respond in the fashion of Herbert Hoover and decide belt tightening is the proper response to a lack of aggregate demand, then a recession becomes a Depression. Hopefully the voices of laissez faire are not listened to, but the response of Europeans to the GFC makes one wonder if economists are still being taught economic history.
Dennis,
Most people who have access to credit are already relatively asset wealthy or are borrowing large amounts to pay for property (an owner occupier whose lion share of salary goes to debt repayment reducing consumption). This further increases wealth inequality. Central banks play a major role here as the markets require access to cheap cocaine or credit via loose monetary policy. Loose monetary policy has increased asset prices to ridiculous levels, most of which are owned again by the already wealthy.
Belt tightening or rehab is a good thing for these type of markets. Zombie companies are side effect of loose monetary policy.
While the ranks of zombie companies are small, years of loose monetary policy highlighted by quantitative easing, high leverage and historically low interest rates, have contributed to their growth. Economists argue that such policies preserve inefficiencies while stifling productivity, growth, and innovation.
https://www.investopedia.com/terms/z/zombies.asp
You and I will never see eye to eye on this issue. We come from different generations. But central banks monetary policy and government fiscal policies directly contribute to wealth inequality. Now if you want wealth inequality fixed, asset prices have to come bank to some semblance of normality were fundamentals dictate prices, not speculation and gambling via cheap credit (a good recession will fix this).
The issue i have with your line of thinking is you want an end to wealth inequality but you advocate for loose monetary policy and fiscal policy to deter recessions. Which in my view is a contradiction.
Anyway i think the bottom line, all these factors are having an impact on the global economy due to the debt burden (public and private) which is causing reduced consumption and in effect lower oil prices.
Iron Mike,
We fundamentally disagree, on that we agree. Wealth inequality has much to do with government policy on income taxes and inheritance taxes. Who do you think suffers most when there is a severe recession? My understanding of history is that there were not a lot of wealthy or formerly wealthy people in bread lines during the Great Depression. Personally I don’t think monetary policy should be the main lever used by governments and have no problem with tighter monetary policy, but I doubt that will solve anything. The less wealthy will be unable to afford a mortgage to buy a home which for many less wealthy people is their only significant asset.
Let’s say we were rulers of the World and created a severe recession by very tight monetary policy say 15% interest rates for short term government securities (or whatever number you deem tight enough). Asset prices for homes and other built infrastructure fall to reasonable levels as a result.
Who do you think would benefit? Unemployment rates would likely double, middle class homeowners might see the value of their real estate cut in half and those who became unemployed might lose their homes all together because they would no longer be able to pay their mortgage and their home might now be valued for less than the balance of their mortgage. The wealthy would have plenty of money to buy up assets at half their former value, wealth inequality would likely become worse.
Alternatively a policy could be adopted where tax advantages for capital gains and dividends are eliminated (these exist in the US, I don’t know the tax codes in all nations). A highly progressive income tax structure could be established like that in the US enacted in 1969, but indexed to inflation (this was a mistake in the original 1969 tax code where the tax brackets were not adjusted annually for inflation).
The highest marginal tax rate was 70% for income over 200k (equivalent to about $1.6 million today). There is much less wealth inequality in some nations than in others due to different government policies. Other measures that could be taken are free post secondary education or more support for such education by government as this is another advantage that the children of the wealthy have.
Monetary policy is a small piece of the puzzle, fiscal policy and tax policy and education and health care policy are far more important in my view.
Perhaps it is different where you are from, in the US many people, even those who are less wealthy can get credit in the form of a credit card, or a car loan, those who save for a down payment can get a home with 10% down for a first time home buyer, in some areas homes are cheap enough for middle class people to afford, other areas homes are too expensive for most (San Francisco/ Silicon Valley area for example).
This may vary from nation to nation and area to area within nations.
Iron Mike. Question about this- “Now if you want wealth inequality fixed, asset prices have to come bank to some semblance of normality were fundamentals dictate prices”
That line of thinking depends on correction of wealth inequality by destruction of the asset worth owned by the super wealthy. Why do you not not consider the alternate path where assets are redistributed , rather than destroyed?
For example, stock option monetary gains for those with net worth over $5M could be taxed at 90%, while the owner would still have been rewarded extraordinarily for their efforts or good fortunes. Same applies to other capital gains, whether in real estate or financial assets. These things should always be taxed at much higher rates than is work income, rather than the opposite as is the current long term condition (at least in the US).
Dennis,
I actually agree with a lot of the points you made. The only thing is if we set the feds fund rate at the hypothetical 15%, people wanting to buy a house can borrow a lot less from the banks, assuming they are prudent individuals who save more than they spend. But you are right about the pain for the lower class and people who live their lives on credit. Which seems to be a lot of people.
You are also right about the importance of tax policies and monetary policy being the main lever governments rely on. The right tax and fiscal policy can reduce inequality. I am with you on that.
Our primary disagreement is I think recessions/depressions are necessary to filter out unproductivity, market inefficiencies and imprudent/risky corporate behaviours. After it is over the corporation/business’s that survive will be more prudent, productive and efficient. I’ll meet you halfway: If a recession/depression scenario was allowed to play out with fiscal policy targetting the lower/middle class that might work well. No bailouts, bailins and nothing too big to fail.
Regarding lower oil prices, I think a vast majority of incomes are going to debt servicing which naturally reduces consumption of goods and services. This phenomena might be responsible for lower oil prices I suppose, its just conjecture.
Hickory,
Rather than penalize those in the middle class that might have saved money to buy stocks, it seems better to tax capital gains and dividends the same as ordinary income.
If we want to tax the very wealthy at 90% marginal tax rates, then do so for all income, but leave middle class people to have their capital gains and dividends taxed at their normal marginal rate.
Dennis,
The middle class inherits a ton of cash annually, they aren’t all saints working and bleeding for every dollar. I know, I grew up middle class, but I have never inherited a dime. Further, many of the billionaires today started with nothing… that’s the beauty of a free market where success isn’t penalized by aggressive and unnecessary tax on success. It allows a person to achieve their goals and create amazing discoveries… also remember that many people do not desire wealth…. they are uncomfortable with it. My dad is one of those people. He is 82 and retired and still lives off only 20-30% of his retirement income. Saves money every month…. he hit Peak Lifestyle… we are not all the same and some of us don’t desire wealth. That is a very important point that many people forget.
Taxing the wealthy would erode the charitable engine that builds much of the US education, hospital, foundation infrastructure that supports countless charities and individuals. The Wealthy produce this and giveth away. I know several big donors that would stop if the US went to an aggressive wealth tax system like your90% scenarios. Without the wealthy, many of our schools, universities and hospitals would not exist as they are today. They would need to be funded by tax dollars controlled by an inefficient government… and we all witness how savvy financiers the US gov is…. right?
So, don’t mess with the wealthy…. you may not like the results and unintended consequences. Success should be celebrated, not attacked. Idiot Trump aside, of course.
Gungagalonga,
I think more equality is a good thing and don’t think society should have to beg billionaires for hospitals and universities. There are no saints, not in the middle class nor in the billionaire class. The difference is that the money of the billionaire allows them to wield undue power and influence, there amy be some billionaire saints, but there are many sinners as well. I prefer to put the money in the hands of the people and their representatives to decide how it is best spent. Some of us think democracy is a good thing.
Dennis
Great modelling. I think for now, the biggest question/mystery going forward is US growth.
Attached is the US October update. US down. L48-GOM up
Ovi,
Thanks.
Good guess on October output, note that US C plus C in September was revised higher by 16 kb/d compared to the November PSM so compared to that estimate October output was about 12 kb/d higher than the November estimate for September 2023. Also the STEO has October output at 13260 kb/d which was too high by 12 kb/d, but that is pretty much spot on (within .09% of reported value).
Dennis
I think we are heading into the slow growth/plateau phase. It really comes down to the drillers and what they think of WTI at $72/b and Permian oil drilling cost of $42/b: “The lowest break-evens across major Permian Basin counties at $42 per barrel each, compared to the Permian average of $45 a barrel” quoted from the linked reference below.
Right now Permian production is increasing slightly due to the use of DUCs. I guess the drillers and big oil companies will have to decide whether they want to support OPEC or do they just want a lower price for WTI.
I think that modifying the Permian model was the right move.
https://www.mrt.com/business/oil/article/eia-two-new-mexico-counties-dominate-permian-18199019.php
Ovi, in addition to the completions drawn from the DUC pond, the waters are muddied further by minimum annual or continuous drilling/completion obligation clauses found in many of the more contemporary oil & gas leases. These are most often included in lease documents for larger ranches in the resource plays in West Texas and South Texas. Sometimes in extreme low-price environments, the mineral owners can agree to grant the operator a temporary pause on the continuous drilling obligations, but not likely at current prices.
So, operators on larger ranches are sometimes forced to drill and complete new wells at a loss to continue to retain 100% the leased acreage.
Hard to quantify the impact of this, but it is out there and certainly adds new production in not so ideal price environments.
Gungagalonga
Another unknown to add to the mix of unknowns.
Thanks Gungagalonga. So the obligation is to drill, but not to complete the wells? That might explain DUC inventory increasing and decreasing over time, but it would be more important to have a well completion obligation and that’s probably what you mean. Also I suppose they could drill and complete the wells very slowly to meet the obligation unless there are specific time constraints. Maybe there are ways to work around this and minimize the damage.
There are often very specific time constraints in Oil, Gas and Mineral Leases that require the drilling AND completion of wells to earn or retain acreage that one has leased, or “rented” for a limited time frame. Newer leases made in the Permian Basin, or Farm-Outs, or Conditional Assignments covering old HBP acreage that is 80 years old, often require 120 days between $12 MM dollar wells to earn or retain acreage. Its rediculous.
All mineral owners do that, big or small, its not limited to big ranches. Drilling commitments are the height of American greed and pretty much the sole reason 90% of all Permian tight oil production is exported to foreign countries. We overdrilled and cannot absorb the oil in US refineries, so we export it all away, never to be seen again.
If a Lessee pays $20 MM dollars for the “right to drill” on a lease, that Lessee is going to comply with all the leasehold obligations it must to retain acreage on that lease. Many really sophisticated mineral owners, and the really greedy ones, will require a Lessee to drill a well every 120 days to specific benches…or it looses that acreage, or that bench.
It has all become so convulated that the shale sector now knowingly drills pooled units, or “allocation” wells in Texas when Texas law prohibits forced pooling. The Supreme Court is yet to rule on allocation wells but the tight oil sector thinks its shit doesn’t stink so it keeps doing it, with the TRRC’s blessing. Again, all for exports.
The TRRC could stop all this stoopid shit in its tracks with proper regulations but mineral ownership in Texas, as one might expect, is a powerful lobby group and contributes tens of millions of dollars to campaigns in Texas, primarity the three TRRC Commissioners, one of which is due for replacement in 2024.
Its all about money and <1.8% of the American population that have minerals under America's largest shale oil basins would fight to the death to prevent regulation slowing down the development of personal minerals. They bellyache the loudest about curtailing oil and LNG exports.
The SEC contributes to all this stuff with its 5 year PUD, proximity to PDP well rule also. Hundreds of billions of dollars have been borrowed on the SEC proximity rule, then bankrupted out on over the years. It was a joke.
Almost everyone involved in this enourmous shale endeavor makes enormous money from it all and believe it is there "right" to free money. They'll have enough money when there is no more Permian oil and gas to survive, the rest of America won't. They basically don't give a rat's ass.
I am a mineral owner, and a royalty owner, by inheritance from generations before me, and by purchase, using my own money. I was well aware of the risks of the purchase of those minerals and I accept them. Its just business. Life changes, my country is changing, hydrocarbons are becoming scarce and something has gotta give, somewhere, to make this stuff cheaper to get out of the ground.
Or, we're toast.
Thank you Mike,
Just the tip of the iceberg of the stuff I do not know, I appreciate the education.
Dennis, I have seen a variety of continuous drilling clauses (CDC). Some are more aggressive and mandate a larger number of annual wells to be drilled and completed and some are less aggressive and have only a few wells drilled annually and not also completed. The point of a CDC is to protect the mineral owner’s interests on larger tracts of acreage from an oil company just drilling and producing one well and still being able to hold all the acreage for the life of that single well production.
Another asset the oil company potentially loses if violating the CDC obligation is they may lose all depths deeper than the currently producing formation or depth…. meaning, for example, if they drill and produce the Spraberry on a 10,000 acre tract and then violate the CDC obligation, they may lose all depths below the Spraberry, like the Wolfcamp. Extreme example and unlikely to happen obviously… but the incentive to drill in poor commodity environments can persist due to this. This depth severance can also be designed in many different ways in the lease, so lots of variability here too.
That’s why you sometimes see continued drilling and completion activity that seems irrational relative to the commodity price environment. They are forced to do so by contract.
Thanks Gungagalonga.
Thanks Ovi,
I agree with plateau or slow growth for US, the breakeven of $42/b, is nonsense, it might apply to less than 5% of wells drilled (and maybe less), for the average Permain basin well the breakeven is at least $65/bo using a 10% discount rate and Natural gas at $2.50/MCF. A 12 million dollar well would payout at about 48 months at $70/b and $2.50 for natural gas, this would be barely profitable, Mike would prefer to see payout at 36 months to make a decent profit for the high risk of producing oil which would require $80/bo and $2.50/ MCF NG.
This is part of the reason Mr. Shellman expects Permian output to decline, he knows way more than me, he is most likely correct. There are other factors like water scarcity, declining average well productivity, higher GOR, and lots of stuff I have missed because I don’t know the oil business.
The more you know, the less you know—-
Hightrekker,
Thanks. I am often told I know less than I think, so I guess I should think I know more?
I am pretty sure the folks that teach me more are correct, there is so much that I don’t know that I cannot fully appreciate how little I know, so your adage is apt.
Thanks Dennis.
Just to clarify, this is a falling demand, low oil price scenario from here on out—aside from the occasional blip that is.
Correct?
Pops,
That is the latest guess based on what I foresee for future demand. My crystal ball has been acting up and the magician may have messed it up 🙂 Time will tell, but please don’t use this to guide future investments as I am wrong much more often than I am right (ask my wife, she will confirm that I am only right when I agree with her.)
Excellent job Dennis.
This paints the next decade or two in such a dramatically different light than most people have envisioned over the years… with demand dropping slightly faster than supply and as a result the price of oil not skyrocketing (short of geopolitical isolation events).
A repercussion of this outcome will be a larger amount of stranded oil. The ‘high cost to produce’ oil reserves will be left in the ground to a degree greater than most people had projected previously.
The 2030’s will be the decade when the world at large gets electric transportation as the new standard mechanism- Simply glance at the updated chart posted by Dennis-
World Oil Shock Model C=C URR 2700
to let this message sink in. All of the enabling mechanisms will be in place, with the biggest remaining wildcard on timing being global purchasing power.
Thx Hickory, note of caution that I may well be wrong and this may be a Pollyannaish scenario.
Hickory
History shows us that low prices for a commodity drives up demand.
Coal was expensive due to mine flooding and the first pumps were very poor at keeping the mines dry. The Newcommen engine was an improvement but still only rich and middle class people could afford coal.
When Watt invented his pump, mines could keep water free very cheaply, coal became cheap and consumption skyrocketed.
In the 1950s only rich people had televisions as the cost 6 months salary for the average family. Today people throw away working televisions to get a better model.
Oil at $80 is dirt cheap and will drive up consumption until the world cannot produce any addditional oil.
India for example has 1.4 billion people, it could increase oil consumption 400% and still only use a third of what each American uses.
I see gradually increasing prices and a global production peak around 2028, oil prices will be over $120 a couple of years before that.
I have seen high price as the most likely scenario too. Its hard to imagine continual prices below $100, although less demand is in the realm of possibilities. For example long standing tight global credit and lower collective purchasing power than previously projected could make that happen.
I also have long suspected that geopolitical discord will interrupt supply to some places even much more than it has in the past 70 years. A market that is not completely border blind makes it all much harder to predict.
I no longer make a guess as how it will play out.
Charles,
Oil will not be able to compete with electric transport, about 74 Mb/d of crude oil was produced in 2022.
Perhaps output will increase a bit with higher oil prices, but prices of EVs will continue to decrease and ICEVs will no longer be able to compete in terms of TCO, demand for crude will likely fall, there may be a bit of increase in the demand for petrochemicals that may offset some of this decline in land transport demand. So far we have not seen oil prices rise as much as I had expected, it may be that demand growth has been slower than I had expected, we will have better estimates of 2023 oil demand in July 2024.
Note that OPEC has 2019 refinery throughput (MOMR Dec 2022 page 54) at 81.4 Mb/d. The Dec 2023 MOMR (page 53) has 2022 refinery throughput at 79.1 Mb/d, and their 2023 forecast is 80.8 Mb/d for refinery throughput.
D. Coyne,
Your chart on fuel intensity of Global GDP shows a nice linear fit, which is nothing more than a spurious correlation. Both variables are highly complex, with dynamic compositional sub-variables, and there is no empirical reason to expect a neat linear trend.
This becomes clear when you dig deeper into the compositional effects.
What you call “transportation fuels” is incorrect, as you lump residual fuel oil into the group. Residual FO has been historically mostly used for heating and electricity, with a small fraction as maritime bunker fuel. All of these uses have been DECLINING with growing GDP, so if you plot Residual FO intensity of GDP it will not be linear but sharply downward parabolic. This is masking the much more robust intensity for mogas, diesel, and jet.
The simple math with this declining component would tell you that what looks like linear relationship would ultimately break down, as the declining component becomes less and less weighted in the composition. If you squint you can actually see the flattening at the bottom of your chart.
Then when you look at Global GDP, that’s an extremely complex variable, with some components that are oil-intensive and others that are not. What has been happening is that the OECD countries have been producing more and more of a low-oil-intensity GDP (Instagram videos, financial derivative trading, etc.), while transferring the oil-intensive GDP share to the non-OECD. That latter GDP is lower-valued due to currency exchange rates and wage costs in non-OECD countries.
Bottomline is that if you value GDP in a currency, such as US$, you are not accounting for physical global product, but for its valuation. With your neat downward linear trend one pitfall is that it creates an impression of a world economy that is becoming more and more fuel-efficient. In reality the two biggest factors contributing to the downtrend is the phasing out of Fuel Oil and the OECD/non-OECD dynamics in global GDP.
I have been thinking a lot about this issue and tinkering with available data, and my rough estimate is that true transport fuel (mogas+jet+diesel) intensity of true physical global product has probably held flat over the past 30 years.
Interesting, thanks.
Here is transport fuel intensity using OPEC ASB data for World and World Bank real GDP data (2017 international $). Transport fuel here is defined as gasoline, kerosene and distillate fuel.
Note that PPP methodology tries to account for cost of living differences, though no doubt is imperfect.
Note that from 1990 to 2019 the PPP method give average real GDP growth of 3.4%, the real GDP based on market exchange rates has an average increase of 3.06% per year.
There has also been a significant increase in the proportion of transport fuel as defined above as a proportion of World C plus C output from 1990 to 2022. The equation is
0.00348*year-6.282 (I drop outlier year of 2020 for this OLS). Using that to transform transport fuel (with real GDP assumed to grow at 2.5%/year in the future) by dividing by transport fuel to C plus C ratio (from equation), I get the following. Supply is the Oil Shock model from the post and demand is the analysis described in this comment.
Note that your scenario as shown in chart below might be valid through 2030, after that I expect the transition to electric land transport will keep demand significantly below supply.
The transport fuel as a fraction of C+C normally has been growing as FO is being cracked deeper, but there is no way this is a linear process. In fact it is probably close to complete, the only significant remaining pocket of FO use is electricity generation in the Middle East…
Also, can you explain the sharp kink in 2023? All indications are that mogas+jet+diesel is up sharply this year, but you have it down?
I do not have data for 2023. Prices are pretty low, so perhaps consumption is down. we won’t have real data (as opposed to forecasts) for another 6 or 7 months.
Here is ratio transport fuel to C plus C 1990 to 2022 (2020 dropped from dataset.)
Perhaps the relationship will change in the future.
D.Coyne,
The trend will inevitably change or otherwise at some point you would be getting an yield of more than 100% from a barrel of oil. Trendlines cannot overcome basic chemistry.
We can crack hydrocarbons, but it is much harder to condense them. As a result there will always be light ends that never turn into transport fuels (refinery gas and light naphthas) and on the other end, the delayed cokers will always produce petcoke, that’s just simple chemistry. All the gains have to date been from cracking residuals, and we are at the end of this process.
KDmitrov,
Perhaps correct, I don’t know where the limit is for further cracking of residual fuel.
Do you have a reference? I can’t seem to find much on this on the web.
Mistake on previous World C plus C estimate in response to KDimitrov (residual fuels excluded), revised chart below (error in previous spreadsheet.)
My expectation is that transition to EVs, plugin hybrids, and hybrids will reduce demand for oil significantly.
D. Coyne,
I still do not get how you model a sharp decline staring with 2023, without ever even reaching 2019 consumption level. That’s not very credible. 2022 was still a very pandemics-affected year, in Asia in particular. All the data we have so far for 2023 shows a healthy increase in demand.
The effect of EV at this point is just a speculation, it sounds rational, but there is no trend showing the massive dent in fossil fuels that you predict. It’s rather “handwavy”.
Kdimitrov,
If we look at crude oil output as a proxy for crude oil demand (over the long run these will tend to be equal), do you expect crude output will be up significantly in 2023? It certainly doesn’t look like it will reach 2019 levels.
The model below looks at crude plus condensate intensity directly and uses the 2007 to 2019 trend in C plus C intensity of real GDP and projects forward from 2023. Supply is from the oil shock model.
I have a model for EV/plugin vehicles based on sales growth for plugin vehicles for 2013 to 2022, the average rate of sales growth has been 42% per year, I assume this decreases by 1% each year until 100% sales are reached, I assume commercial vehicles follow a similar trajectory starting 9 years later.
A specific set of assumptions, it is assumed ice vehicles are scrapped at an average life of 15 years.
The recent models are not showing sharp decline, they are showing flat demand for the next few years maybe a slight decrease.
Below is demand 2023 to 2030
80863
81073
81193
81219
81151
80985
80717
80345
EV Model presented at link below
https://peakoilbarrel.com/eia-short-term-energy-outlook-and-tight-oil-update-december-2023/#comment-767884
I appreciate your comments, you may well be correct, this started trying to understand the apparent lack of demand growth we have seen in 2023, next year may be different.
KDimitrov,
Any research that confirms your view? I am using standard World data from World Bank and OPEC, can you point me to the data behind your analysis? Otherwise we are just telling stories. How is “true physical global product” measured in your view? That is a problem if you don’t have numbers to back up the analysis.
D. Coyne,
The way I think about is that I look at mobility indices, instead of GDP measures. The assumption is that real/physical GDP is tied to mobility, but in any case, I consider mobility as a more relevant metrics for economic development than GDP, no offense to video-gamers and Instagram influencers.
There are many mobility indices that I look at: car registrations and sales, commercial flights, ton-miles, etc.
What you see is that most of these indices run faster than global GDP in non-OECD and slower in OECD. Then, I look at fuel intensity as a measure of fuel consumption relative to the mobility index, to get a feel for improving fuel efficiencies.
Light vehicle transport measures outrun handily mogas consumption, which is not surprising given that it is extremely USA dominated, and there has been several major developments here: 1) Increasing fuel-efficiency standards, especially after Obama, 2) ethanol mandate, and 3) recently EV/hybrid adoption. In the rest of the world it is less pronounced, but there are developments with LPG powertrains, EV, etc. For diesel and jet, fuel consumption is tracking closer to flights and ton-miles…
In any case, mobility indices for non-OECD run faster than population growth, and fuel intensity is not lagging by much. So, by simple extrapolation, as the non-OECD component becomes heavier and heavier weighted, the global fuel intensity will be flattening out and not going down as the gross trends in yours (and others) charts tend to predict.
(The EV story is still just a narrative, it can cause inflection but so far I haven’t seen any inflection in mogas fuel intensity, the trend that is there from ethanol mandates and increasing fuel-efficiencies is intact. I view it as just a continuing trend for mogas, which has been growing at 1.5% trend worldwide, a bit slower than light vehicle miles and registrations, but still faster than total oil, which I think was at around 1% trend.
Oil consumption is lagging transport fuel consumption, due to the abatement of Residual FO and increasing refinery complexity which cracks the Residuals into lighter fuels…As this trend is nearing its end, oil consumption should start trending up faster, closer to the transport fuel trends)
KDimitrov,
Without specifics sounds hand wavy. We would need to know specifically which mobility indices you look at, do you have something published that we can look at?
Many have argued that oil is the master resource, but sometimes it seems people need to make up their own measures (which are available only to them) to prove their point. GDP measures are not perfect, but if you are going to create some other arbitrary measure, to convince anyone that it has relevance the numbers must be shared.
Mobility is not an end unto itself, so not the best measure of general well being in my view.
You assume mobility is tied to real GDP, but if you want to look at real GDP, then look at real GDP, rather than some made up number in your head.
D.Coyne,
Fair, this was just a comment. I have been meaning to organize all my data and research on this topic and write it up, but haven’t had the time. This is just a hobby for me.
For now all I can say is that you misinterpreted my point. You can use GDP data, it is useful for many purposes. However, you cannot equate GDP growth rates to mobility in non-OECD countries. It’s not just the raw number, but the rate of change. You may be correct that global GDP would slow from 3% to 2.5%, but it is incorrect that non-OECD mobility will have the same rate of change. That’s the compositional effect that I was talking about. OECD has a very different demographics profile, GDP composition and correspondingly oil-intensities than non-OECD. As the weight of the latter grows in the world economy its trends will become more significant in the global aggregates.
Cheers
Kdmitrov,
As non-OECD becomes developed demand for mobility will decrease, for now the growth rates are what we have seen, as the world moves to electric tranport oil demand from mobility demand is likely to decrease. I don’t have access to mobility data for non-OECD.
Just World C plus C and real GDP, I agree the relationship is lkely very complex, it is surprising there is any correlation at all, perhaps it is spurious, though I would expect real GDP and oil use to be correlated. A better correlation is C plus C vs natural log of real GDP rather than linear relationship.
Kdimitrov,
I found this from EIA (from 2017), probably the Low liquids demand case is more relevant given what has occurred fomr 2017 to 2023.
https://www.eia.gov/analysis/studies/transportation/scenarios/pdf/globaltransportation.pdf
They see a big increase in natural gas use for transport which has yet to materialize.
The two largest lithium deposits ever were discovered this year and they are both in the US. Extraction technologies have advanced rapidly from 50 to 90%. Other enormous deposits are almost certainly out there these are just the easy to find ones in our own backyard. Solid state batteries are coming on the market for real in the next two years. The price of lithium batteries looks set to fall by half over the next 4-5 years easily blowing past EV price parity with ICE cars and of course substantially lower operating costs even at $3 gas. Electricification looks unstoppable for transport across the board at this point. Exxon is getting into lithium extraction.
https://oilprice.com/Metals/Commodities/Worlds-Largest-Lithium-Reserve-Discovered-Beneath-Californias-Salton-Sea.html
https://www.chemistryworld.com/news/lithium-discovery-in-us-volcano-could-be-biggest-deposit-ever-found/4018032.article
https://corporate.exxonmobil.com/news/news-releases/2023/1113_exxonmobil-drilling-first-lithium-well-in-arkansas
EV price parity by mid-decade as battery prices fall – Goldman Sachs
https://www.goldmansachs.com/intelligence/pages/electric-vehicle-battery-prices-falling.html
It’s interesting how quickly Americans are to claim the biggest in the world of, whatever, without doing any research. For example the Exxon lithium, ….”Exxon’s landholding is estimated to have 4Mt of LCE”
In the middle of the Congo at a place called Manono there is a spodumene deposit with a resource of over 500Mt and an estimate of 1.5B tonnes overall. Brought back to LCE equivalent about 50M tonnes of LCE.
There are probably hundreds of millions of tonnes of spodumene around the Black Hills of S Dakota, if anyone bothered to look there. Plenty of photos on the web about the Etta mine that had the largest spodumene crystal ever discovered..
Lithium from brine is extracted via huge evaporation ponds in desert like conditions in Chile and Argentina. How will the evaporation ponds go in Arkansas with the rainfall there? People are working on other extraction technologies, but it will take energy, which is provided by the sun in South America.
All lithium extraction from whatever source involves mountains of fossil fuel use/extraction. Spodumene heated to 1100*C with gas, sulphuric acid coming mostly from sour crude oil and gas, etc.
There a lots of lithium deposits all over the world, lithium shouldn’t be a problem, getting pure lithium carbonate or hydroxide is the energy intensive bit. No-one bothered to search for lithium until about 8 years ago when EVs started to gain momentum..
It’s far more likely that copper becomes more of an issue in the future, we have already mined all the large easy to get deposits..
Do EV’s even actually matter?
What I mean is even if you were to switch all light vehicles over to EV’s you would still need the same amount of oil if you wanted the same amount of diesel and all the other things that get made from a barrel of oil. Jet fuel, bunker fuel etc. A lot more than just gasoline is made from a barrel of oil. You still have to have the same amount of oil. Otherwise you get less of all the things that are produced from a barrel of oil.
The argument that EV’s are going to lead to less fossil fuel consumption just doesn’t hold water.
The up a coming global depression we are going into however will do a lot to curtail fossil fuel consumption.
We could do away with globalization, global shipping and global air transport.
But then again the supply chains needed to buildout EV’s and everything solar and wind are way more complicated than the supply chains needed to build ICE vehicles.
you would still need the same amount of oil if you wanted the same amount of diesel and all the other things that get made from a barrel of oil.
Say this a thousand times, please. Art Berman has been beating this drum for a while now. What this means is that a reduction in gasoline demand alone DOES NOT reduce actual petroleum consumption.
IF gasoline consumption is reduced, and IF we still need the same amount of diesel, what is the fate of all that excess gasoline?
In Ohio in the late 19th century, when kerosene was the product everyone wanted, they just dumped the gasoline into nearby rivers. I wonder how that would go over today?
Art Bermann does not know everything.
Today oil refineries can be designed to produce alot less petrol.
https://www.mckinsey.com/industries/chemicals/our-insights/from-crude-oil-to-chemicals-how-refineries-can-adapt-to-shifting-demand
https://www.futurebridge.com/blog/crude-oil-to-chemicals-future-of-refinery/
Instead of producing 10% chemical feedstock they can produce 50% and there are plants being built that will produce 80% chemical feedstock
That changes the gasoline to something else—chemical feedstocks. That does not reduce the number of barrels of oil needed overall.
Might just result in a huge glut of gasoline. As demand for other products besides gasoline remains.
Which would make gasoline cheap.
Or chemical feed stocks become so abundant that they are too cheap to make a profit on. Yet demand for diesel, jet fuels and bunkers fuels remains. So refiners that gear up to make more feedstocks lose money.
Mike B
Tell Dennis that.
The world population grew by 1 billion people in the last 13 years and as a consequence we are using an additional 15 mb/d.
Dennis thinks that because the global population will take longer, 16 years to increase by another Billion that we will be using 15mb/d less than today. A real 30mb/d reduction in proportion to the population in 2010.
Dennis no longer believes in Peak Oil as in supply constrained but Peak Oil as in demand driven
Charles,
It’s not that difficult. We believe in bean-counting. Try counting the number of beans in a volume, using whatever method you desire, and you have an estimate of the true amount of beans in the container. It’s just that some people don’t care on the number of beans, and will only complain when they are all gone and then move on to ignoring another pending crisis.
Charles,
I use the data to guide my analysis, provide different data from a reliable source and I will adjust my thinking. Note that forecasts are not data. The fact is that per capita oil consumption has been decreasing for many years at the World level along with oil consumed per dollar of real GDP. My expectation has been for many years that oil prices would rise as oil supply stopped growing as quickly, 2023 has suggested this may not be the case as oil prices have been relatively low due to lack of demand growth. The theory in the paper you posted in the last thread suggested the linear decrease in oil intensity of real GDP as a possible explanation. Seems like a possibility, we will have to see what happens in the future, also the transition to EVs may make this possible.
My model is for C plus C, in the past 13 years demand has increased by 6.7 Mb/d (see refinery throughput data at SRWE).
HHH,
The commercial vehicle fleet may also transition to EVs and some long haul heavy duty transport may move to electrified rail, this reduce the need for diesel fuel, perhaps air travel will be reduced or move to synthetic or biofuel. There is some measure of flexibility in the refining process depending on how it is set up and it may also depend on how heavy the crude input is, I don’t have the chemical engineering knowledge to know all the ins and outs of what is possible. My understanding is that the ratios are not fixed, there is a range of possible outputs that are feasible.
Exxon will be using Direct Lithium Extraction as stated in the article I posted. The open evaporation ponds are rapidly becoming an obsolete technology. Much of EVs are currently displacing diesel consumption in Europe as many of their passenger cars are diesel. Busses and local box trucks will be next, just look at Amazon and UPS, they are already switching over. Y’all will continue to go through the 2020s confused as to why oil prices are dropping and consumption dropping at the same time the economy grows. I guess that’s what happens when you get set in your ways.
https://spectrum.ieee.org/amp/direct-lithium-2665947975
Two Chinese manufacturers just announced they will produce small urban EV’s that don’t use lithium, rather they will have Na Ion batteries. These are viable for most people who are just trying to get 50 miles a day travel accomplished.
And the world has plenty of Na, in addition to lithium.
Na as a salt, and Li as a feldspar. Both minerals which require lots of energy to crack to elemental form and thus reconstitute.
Stephen Hren ….. From the article you linked to…
“Which technology for DLE will win is still unclear. There is as yet “no clear winner in terms of what customers want and what the technology can provide,” she says. But all the DLE separation technologies being piloted now are already used for other purposes, says Goldman Sachs analyst Hugo Nicolaci, and that should speed up commercialization. “Expect the first real wave of DLE projects from later in the decade.”
Just because they are working on a technology does not mean it will be a success, or provide the purity needed by lithium batteries. Then there is the energy issue and materials needed for all the processes involved.
DLE is another of those ‘fantastic ideas’ if it ever works, with cheap materials and minimum energy. Unfortunately there are always tradeoffs, which is why the process was never used for lithium batteries at the earliest stages of lithium battery development.
The holey grail of lithium extraction would be doing it without needing soda ash to separate lithium from the brine in Lake Uyuni in Bolivia, which has high magnesium levels, requiring something like 17 tonnes of soda ash per tonne of lithium carbonate produced (IIRC).
Hideaway, read the Exxon press release I posted above. Exxon is using DLE in Arkansas, of course they won’t tell which one it’s likely proprietary. So it’s not some pie in the sky technology but one that Exxon-Mobil who obviously has tons of drilling experience will be using starting in 2026. Likely multiple techniques will be used based on local conditions and technology availability.
This type of advance is part of the all the research going on globally in battery development. It has reached enough inertia that it is consistently producing annual reductions in battery cost of 10-15%. The only exception was 2022 when lithium prices increased tenfold for a while due to a commodities bubble and supply chain bottlenecks. The main point I was making is that such a supply shortfall is unlikely for the foreseeable future. It’s also significant that Exxon is hyping their lithium extraction. Hard to imagine a decade ago.
The battery improvements are not just an EV thing. This is too narrow a focus. Most of the reductions in oil consumption from electrified transport have come from converting inefficient smaller engines in mopeds, rickshaws etc.
Batteries make everything more efficient, even burning coal. Just like renewables make power when it’s not wanted, baseload power from coal and nuclear generate electricity in the middle of the night when it’s not needed. Having batteries to capture this power for 6-12 hours and use it later in the day will eliminate the need for peaker plants and reduce waste. Lost energy everywhere can be captured and used. And for transport if that use is in an electric motor rather than an internal combustion engine, the efficiency of use increased at least fourfold. Our entire energy system has massive inefficiencies built into that batteries can help solve without more inputs.
Stephen Hren … Exxon is not using DLE in Arkansas, they ‘plan’ to. The type of DLE is ‘still to be decided’, all from the document you linked to.
They are currently drilling their first hole into the formation.
The expected resource is 4Mt LCE, a drop in the ocean compared to world supplies of lithium and demand.
It sounds to me like a great marketing exercise for Exxon showing the world how green they intend to be. DLE is still not proven on industrial scale for lithium extraction to battery grade requirements.
Uh, no, that’s not what it says. Nice try though.
“ After using conventional oil and gas drilling methods to access lithium-rich saltwater from reservoirs about 10,000 feet underground, ExxonMobil will utilize direct lithium extraction (DLE) technology to separate lithium from the saltwater.”
This is what happens when you try to have a discussion with someone who is too chickenshit to use their real name. They just lie to try and support their point and don’t care.
Stephen Hren,
The document does seem to be announcing plans with a target for 2027, in many cases these projects are never realized.
Hi Stephen,
The article includes these bits which are quoted
“will utilize”
” The company is targeting its first lithium production for 2027″
First lithium in 2027 means they are not producing any at present.
The article is just the usual corporate marketing spin?? It’s full of hopes, wishes and plans. They might end up doing it, or they might work out it is too expensive and drop it from plans, we simply don’t know.
What we do know is they will use it for marketing as much as possible..
Hi Hideaway, I understand what you’re saying now, I apologize for my insulting comment.
Lithium can be extracted from brine with filters. They have test facilities at geothermal sites already.
This evaporation method is just simple old tech you can use without thinking.
https://www.oilystuff.com/forumstuff/forum-stuff/pretty-close-to-50-of-the-bakken-oil-production-increase-is-driven-by-completion-of-duc-wells
Surge in Permian is from DUC’s that are being completed and their numbers are dwindling, straight from the horses mouth.
If I am reading correctly this is why production is up but rig counts are falling. Not greater efficiency.
Be sure to check out the comments.
https://www.msn.com/en-us/news/world/brazil-shows-concern-as-venezuela-slams-uk-warship-sent-to-guyana/ar-AA1mcS29
Things getting frisky as the UK sends warship to Guyana and Venezuela launches military excercise in response.
Guyana is the hottest oil prospect in South America at the moment.
Don’t forget the Falkland Islands history lesson.
There are things lurking beneath the water that neutralise South American Navies.
Maduro has staked all of his political capital on the ‘take over Guyana’ project. No way for him to back down from the claim without a fight.
The Argentinian’s (Falkland Island War) attempted to surround the British Royal Navy.
Then the British started sinking their ships.
Those buffoons (the Argentinian military leaders) didn’t realise there were submarines in the water…Complete incompetence.
No offense to Argentinians who are undoubtedly great people.
The buffoons were the unqualified leaders.
And the Falklands does have oil!
<iThe buffoons were the unqualified leaders.
Agree-
A group of right wing fascists .
Not the brightest porch lights on the block.
Having oil in the ground isn’t much good if its EROI is too low to find a way to extract it. The Sea Lion project has been around since 2010 and has had at least three FEED attempts with no FID yet, though one is promised for late in 2024 – we’ll see. At 250 mmbbl it’s not quite big enough for a decent anchor project and without an anchor the smaller resources in the area can’t be developed or even investigated. I’m pretty sure UK would like to see the back of the Falklands if there was a politically acceptable way out; it’s an expensive liability like most of the British Empire became after the first world war.
Venezeula and Guyana are a whole different ball game than the Falklands.
USA : “UK u guys can have Guyana; we will take Venezuela”
UK : “Agreed”
From reading George’s posts, he is smarter than me on oil no doubt and probably life in general…LOL.
Venezeula has more oil reserves than Canada and Guyana is looking juicy.
I remember Russia was over there about 10 years ago “exploring” to the ire of John Kerry and Barrack Obama.
news reads US October crude production sagged
https://oilprice.com/Latest-Energy-News/World-News/EIA-US-Crude-Oil-Production-Rates-Sag-In-October.html
Sheng WU
The US production chart was posted further up.
https://peakoilbarrel.com/eia-short-term-energy-outlook-and-tight-oil-update-december-2023/#comment-767888
The leak in the Main Pass pipeline started mid November (still not found let alone fixed I think) and takes away about 75 kbpd additional, mainly Horn Mountain, in GoM. October is about six months since the Permian rig count started to fall. The drop in Eagle Ford started a couple of months early and has steepened a bit. Rig counts have been steady for a couple of months but the most recent oil price fall should start impacting around now as existing contracts end and new ones may not be put in place with lower prices.
Sheng Wu,
September output was revised higher, October is down form the revised number, but it is higher than the number estimated for September in the last PSM, output down only 4 kb/d, about 0.03%.
D Coyne,
There is some deviation between C+C production and consumption from year to year. I use Refinery Input from the BP Statistical “bible” as a proxy for consumption. Since refined products have a shorter shelf life it is a better proxy for oil consumption than oil output.
In 2018 and 2019 we had higher production than input (520kbod and 351 kbod respectively) in 2022 we had the reverse (crude destocking) of 781 kbopd. In 2022 Refinery Input was close to 82MMbopd, and that was with much of Asia still experiencing the pandemics effects. Your model has 1MMbopd lower inputs in 2023. That would be a major surprise, IMO.
Regarding GDP, nonOECD will eventually become more “virtual” yes, however the gap in annual fuel demand per capita is so huge that it will take decades. Simply put, developed countries add miniscule amount amount of oil per each $1T of GDP produced, bringing World GDP intensity down. That’s not the case for nonOECD at all.
GDP is the valuation of goods and services produced. In some parts of the world these are more virtual and in others they are more physical. That’s the point.
Kdmitrov,
That is why we take the total real GDP of the World and don’t do it for every individual nation. Likewise we look at total World fuel demand. Crude produced will be roughly equal to crude inputs to refineries especially over a 30 year period. Yes there will be small year to tear variations between output and input to refineries.
Thanks for the suggestion on refinery throughput, using that metric we get the chart below,
Dennis, …. “That is why we take the total real GDP of the World and don’t do it for every individual nation.”
Which currency do you use, as this will make a difference? I would assume in $US being the reserve currency, but other countries where the currency has varied vs the $US, would make a difference if measured in that currency.
How does the real GDP in gold terms look compared to oil intensity??
Hideaway,
Gold is a commodity and is no longer used as a medium of exchange, it would make no more sense to use apples to value real GDP as gold, but you can do what you like, you can find real GDP in terms of any good you wish.
See
https://en.wikipedia.org/wiki/Purchasing_power_parity
This is the measure preferred by many international economists and may reflect different living standards better than market exchange rates.
For Global oil demand to fall there needs to be a total reversal in what has been happening in places like India over the last 15 or so.
https://www.statista.com/statistics/664729/total-number-of-vehicles-india/
Everyone whats to be like Europeans or Americans where there are over 800 cars per thousand people.
https://ourworldindata.org/grapher/registered-vehicles-per-1000-people
Certainly demand for oil will fall in countries that already at car saturation levels. Every electric car will replace a petrol or diesel car. In places like India, Russia, Africa this is not the case and most cars bought in the next 10 years will be ICE vehicles. India, Africa, South and Central America and Russia have over half the world population and they will end up using as much oil as Europeans do now
Charles,
I imagine Chinese EV manufacturers will have a lot of success in India and Africa, so it is not clear that you are correct except in African nations that produce oil, they might be an exception.
Rig and Frac Report for week ending December 29
Rigs Up. Fracs Down
– US Hz oil rigs increased by 1 to 456. There has been little change to the rig count over the past four weeks. Is this the new steady state rate for Rigs, 450ish?
– Permian rigs were up 2 to 295. Texas Permian added 3 to 206 while NM was down 1 to 89. In New Mexico, Lea county dropped 1 to 48 while Eddy was unchanged at 41.
– Eagle Ford dropped 1 to 49.
– NG Hz rigs were up 1 to 108 (not shown)
Frac Count for December 29 continues its typical Holiday Slump
The frac count decreased by 12 to 240 this week. The Frac count has entered the trend of the past few years when Fracs start to drop after Thanksgiving.
Friday’s count was just 6 higher than the Dec 29, 2021 count of 234.
JP Morgan Says Peak Oil Demand Is Nowhere In Sight
This a very contrarian article with a different perspective. Best to read the whole article.
Keene opened the discussion by recalling Malek’s 2021 assessment that emerging markets would push crude demand—and prices—higher, and asked Malek if that remained the case.
“If anything, I think it’s strengthened,” he replied. “There is demand in the world that we just simply cannot see.”
Malek went on to describe how emerging markets’ oil consumption would expand as those economies added everything from streetlights to modern transportation. “That intrinsic demand that is not visible is so significant that we don’t see demand peaking,” he conveyed. “I don’t think we will see demand peaking in our lifetimes, particularly as emerging market demand growth continues to surprise to the upside.”
Dennis this is for you and me. I didn’t understand the dark oil comments but with this person speaking grey and dark oil, there must be something to that. The demand/supply gap of 2.5 Mb/d shown by OPEC along with falling WTI prices to me must indicate that the grey oil market must be in the neighborhood of 3 Mb/d.
According to Malek, those forecasts failed to fully account for black or gray market barrels from countries such as Russia, Iran, Venezuela and Libya.
“That is exactly why this time last year (JP Morgan was) bearish—despite our super-cycle call—into the first half of (2023) simply because there was a lot of volume that we just could not see,” he related.
Non-OPEC output still may grow, Malek added, “but not in the millions of barrels that we need to meet future demand growth, which is at least going to be between 107 million barrels and 108 million—if not higher—by 2030.”
Malek characterized consolidation in the U.S. oil and gas industry as another bullish signal. Faced with the challenge of significantly increasing production, he said, companies were looking to apply their strategies and approaches to newly acquired properties.
https://www.aogr.com/web-exclusives/exclusive-story/jp-morgan-says-peak-oil-demand-is-nowhere-in-sight
Ovi,
There are different opinions on this question, but oil prices are low. One can claim that this is because supply is higher than OPEC, the IEA, and the EIA report or it may be because demand is lower than some (particularly OPEC) are forecasting. I tend to think the EIA and IEA have it right and will wait for actual supply and demand data to be published to evaluate if I am right. There are 20 or 30 different investment houses that have different opinions on this, I don’t think JP-Morgan has any specific insight that is better than other firms, some say peak demand others say no. I don’t think we will know for a few years the correct answer, but low oil prices certainly suggest demand is not very strong as does OPEC cuts in output, at least to me.
Dennis
What struck in this article was things I hadn’t heard/appreciated before.
– emerging market demand. We keep reading about that but he says the world has no idea what its size is because while it is there it is not visible and he thinks it will delay peak demand past 2030. I presume he means that there is no way to measure it.
– He seems to imply that that US is close to peak because of the takeovers by the majors.
– He thinks the big oil finds are behind us. Even if he is wrong, it would take at least 5 years to bring a new field online, if some company was willing to take the risk to invest in it. I thought that Chevron was smart buying into the Guyana field. That said they wanted to start getting their money back right away and that it was less risky than exploring themselves.
Ovi,
I only have a problem with the first point you mention. He seems to imply that non-OECD supply is significantly higher than claimed by IEA and EIA. This might explain why oil prices are low, if it is correct. The question I would ask is where does he think this extra 2 or 3 million barrels per day is being produced? I think there is no such extra supply, there might be 2 to 3 million barrels transported by the dark fleet, but actual output at the wellhead is likely accounted fo properly and crude input to refineries is also likely accounted for properly.
Dennis
The only thing we know is that there is a gap of 2.5 Mb/d between supply and demand in the Q4-23 MOMR report. If we are to believe the production numbers, that implies demand must be too high.
I see above that you are looking at refinery input to gauge demand. Sounds good provided the input numbers are correct. The MOMR does provide crude input to refineries data. For Q4-23 they show crude input of 81.1 Mb/d, 1.7 Mb/d greater than Q4-22.
In the August world update post, the EIA says World C plus C production was 80.7 Mb/d. Not clear if that difference of 0.4 Mb/d implies that the OPEC input may include condensate or again we have inaccurate data. More discrepancies to ponder.
Ovi,
Yes the OPEC MOMR report shows a big gap between demand and supply, the 2023Q4 numbers are forecasts, which may or may not be correct. I don’t think the OPEC estimates for Q4 in the MOMR are very good. Time will tell.
For 2023 the OPEC estimate for crude oil demand is about 80.82 Mb/d vs 79.07 Mb/d in 2022.
Yes the MOMR implies demand is considerably more than supply, what does that imply for oil prices? Do you see why I expect that either the demnd estimate is too high or the supply estimate is too low? When we look at EIA, IEA and OPEC supply estimates they are pretty close, but OPEC’s demand estimate is far higher than EIA or IEA, to me this suggests the OPEC demand forecast is not very good.
Ovi,
Chart with World Supply minus Demand from OPEC and EIA.
The US is only 4.something percent of the global population yet consumes 20+% of the oil produced. No way that demand will peak if the rest of the world wants have a lifestyle that is even a semblance of what the US has.
rgds
WP
Weekend peak,
Oil Demand will peak, the question is at what oil price, I think substitutes for much of oil use will allow the price of oil at peak oil to be relatively low, under $100/b in 2023 US$, perhaps I will be wrong. Note that Europe uses much less oil than the US with a lifestyle that is as good or perhaps better, so that is a better bench mark than US oil use imo. The world has been using less and less oil per unit of real GDP since 1984, perhaps this will stop, impossible to know if things will continue the trajectory of the past 38 years. We will see.
Note, Europe uses less energy than the US. Note, the US was largely developed for the use of the automobile. I have friends living in Denmark, and Dave is able to use his bike for the 2 mile flat ride to work most days. Their home is in walking distance to almost all their needs. I grew up in the coal fields of western Pa and the town today has about a 1000 residents and has no -none- businesses. The topography is very hilly and The nearest grocery or drug store is 5 miles from the town. Now multiply that circumstance several 1000 times heading south to Alabama. I find it offensive to glibly say, if we were just like the Europeans. Also If you need to go to a hospital be prepared to drive an hour.
No, that is not necessary so. You are thinking that demand equals what people want. No, that is not the case. Demand equals what people want at the price it is available. If supply drops, then the price will rise. Demand will fall to what people can afford. If the price rises to ten dollars per Barrell, then demand will drop to equal supply.
Demand will always equal supply. They are basically one and the same thing. The price brings them together. The price is always the arborator.
Ron, would you say “peak oil supply” and “peak oil demand” represents what we call “a distinction without a difference”? (Because if supply peaks then demand peaks by defnition.)
Ron,
Yes demand and supply are equal at some price. I am simply saying that with all else held equal, falling prices indicates that demand is less than supply at the current price level. Peak supply suggests a rising oil price environment (as in the 2010 to 2014 period) whereas peak demand would be a surplus of supply at current prices with prices tending to fall as we have seen over much of the 2015 to 2023 period. Demand and supply will both change with the price level and prices will adjust to make them equal.
The direction of prices up or down gives an indication of whether we are in a peak supply or peak demand situation.
Ron demand will peak either of its own accord or because supply peaks, when the peak arrived in 2018 oil prices were falling, suggesting that demand was not keeping pace with supply, this still seems to be the case. If we reach a new peak (whether higher or lower than the 2018 peak) in an environment where oil prices are rising and continue to do so even as output starts to fall, this will suggest peak supply rather than peak demand.
The average real Brent oil price in 2023 $ from Jan 2011 to Dec 2013 was about $147/bo. When we see this price level or higher with falling oil output, I will be ready to call it peak supply.
Brent Real Prices (monthly average price) in 2023 US$.
Great infographic on energy use per capita.
https://energynow.com/2023/09/infographic-oil-consumption-per-capita-energyminute/
We have to ask ourselves if Europe can achieve a high level of prosperity using an average of 12 barrels per person, why can’t the United States?
There are good reasons that China and India oil constumption are increasing strongly and they will both end up using as much oil per person as France which is quite frugal.
https://ourworldindata.org/grapher/per-capita-oil?tab=chart&time=earliest..latest&country=~IND
If the US was motivated (meaning it had the economic incentive) to use less oil it could make 1-2 decade transition to where it was using half as much without sacrificing much if anything on the measure of quality of life.
We will get there one way or another. it would be nice to get there in away that doesn’t leave too many suffering from severe energy poverty. But in this harsh culture I wouldn’t count on that.
“Great infographic on energy use per capita”.
But the link points to oil use. My guess is that ( as a counterpoint to Dennis up-thread) that oil consumption on a per capital basis is trending down but that at least some of that decline is offset by other energy inputs like electricity. For example EVs – with every EV mile put on the odometer oil consumption goes down but electricity consumption goes up.
Then there is the issue of outsourcing – every time you buy something from some place far away you export energy use – yet in reality the same energy is used somewhere else and in addition you now have energy that was used in shipping on top of the energy that was made to produce the widget.
i think that we don’t have enough granular information to come to conclusions about datasets that are moving very, very slowly.
Regarding EUR / US – what constitutes “better” is highly subjective. I know that a number of my European friends would love to have a bigger car, a bigger house etc but don’t because they can’t afford it. Add to that that depending on what stage of life you’re in your energy consumption changes. Plus, Europe has tons of nukes (FR) and hydro ( some country up north that has lots of water and not many people).
Rgds
WP
Weekendpeak,
Great observations. When we look at the entire World, the exporting and importing of energy both in fuels and embodied in products ends up as a wash as long as we aren’t doing any interplanetary energy exchanges. This is the reason I tend to look at the World as a whole, to avoid that problem.
I agree as oil use decreases other uses of energy may increase, but some forms of energy use are much more efficient than others.
Primary energy consumption per capita has continued to increase up to 2022, but fossil fuel primary energy consumption per capita peaked in 2013.
Do you think the peaking of per capita energy consumption (partially) a result of electrification(which tends to have a better conversion ratio from energy source to usable output) or may it be caused by general increases in efficiency? Curious what your thoughts are.
Rgds
WP
Weekend peak,
A combination of many factors including electrification, better efficiency in the use of energy and for fossil fuels the peak results in part from the rapid expansion of non-fossil fuel energy which in some places proves cheaper than fossil fuel energy.
So several factors are operating to bring about this change, policies enacted by governments also play a role.
Note that it is not clear that per capita energy use has peaked. I think we may see some further growth there.
I loked at this more closely and per capita energy consumption since 2018 has been flat (I throw out 2020 as an outlier) with an annual increase of only 0.013% on average from 2018 to 2022, so we might be close to peak energy consumption per capita, perhaps a peak in 2025 as a rough guess.
The efficiency of fossil fuel combustion applications around the world has improved over the past decades, such as improved ICE vehicle mileage and the increasing deployment of high efficiency gas furnaces/ combined cycle nat gas power plants.
By as you said, much bigger percentage gains in energy efficiency are achieved by switching from combustion toward electrification. This trend is still in the early phase in important big sectors. And electrification of generation capacity is still in the infancy of deployment (if you exclude hydro and nuclear).
So I took a quick look at housing and related energy consumption in Europe vs the US: Houses in the US are around 2x bigger than those in Europe:
https://worldpopulationreview.com/country-rankings/house-size-by-country
Surprisingly, energy consumption attributable to household is as follows:
• In the United States: The U.S. Energy Information Administration (EIA) reports that the residential sector consumed 21% of total end-use energy in 2020. Electricity made up about 44% of the residential sector’s energy consumption, and natural gas accounted for about 34%.
• In the European Union: Eurostat estimates that households represent 27% of final energy consumption and 18.6% of gross inland energy consumption in the EU.
Is this a function of climate or build quality?
https://ec.europa.eu/eurostat/statistics-explained/index.php/Energy_consumption_in_households
and
https://www.epa.gov/ghgemissions/inventory-us-greenhouse-gas-emissions-and-sinks
rgds
WP
Weekend peak,
Probably some of both, like most things it is complex. Probably it is simplest to compare energy us per capita for Europe vs US/Canada.
About this time Rystad issues a review of conventional oil and gas discoveries for the year. As a reminder this was its take on the first six months, which showed 2023 at record lows for both oil and gas.
https://www.rystadenergy.com/news/conventional-oil-and-gas-exploration-low-discovered-volumes#
Since then I don’t remember reading of any major discoveries, there have been some decent ones in Norway and South East Asia but there have been reports of a few disappointing high impact wells. The IOCs pull out from Russia must be having an impact there. Russia does not have the skills or technology (or riskable money maybe) to drill hundred million dollar exploration wells in harsh frontier basins, and if it tries the success rate would be low. Guyana must have only medium and small pockets left now. I think a lot of the planned Namibian wells are delayed. More exploration wells in the first half of the year were drilled in GoM than other basin but the successes were relatively few and small. I’m not sure where, globally, there is left to look now, especially if oil price stays low and stakeholders remain risk averse.
That a large exploration industry still exists and is expected to grow slightly, even as success rates fall and prospective wells get more expensive, is to me the clearest evidence, first, of how little effect the future threat of climate change is having on immediate decisions and, second, of how much oil and gas are still preferred to renewables. Nevertheless the downward trend in discoveries still indicates that there won’t be many more wild cats by some time in the early thirties because there will be nothing left worth finding.
Just looking at liquids, that works out to be just over 8 million barrels par day. If “liquids” also means NGLs, I guess that would be about 6 million barrels per day of oil.
Finds of 2Gb would only support developments of 300 – 400 kbpd nameplate, I’m not sure what your 8 mmbpd refers to.
I eyeballed your chart as 3 trillion barrels. That was too high. 2 trillion is closer. Divide that by 365 and that comes out about 5.5 million barrels per day.
Ron,
First, you are calculating that the 2 Gb (billion barrels) of oil by only 365 days. Are you suggesting that this oil would only be extracted in one year?
Second, George is correct that 2Gb would provide approximately 300,000-400,000 bd of capacity when these new discoveries are ramped up to full annual production.
Lastly, the world consumes about 24 mbd of conventional oil supply. Thus, if we double this 2 Gb “Half-Year” figure to 4 Gb, then we are burning 6 barrels of oil for every 1 barrel we find.
Going in the wrong direction.
steve
Up above George said “Having oil in the ground isn’t much good if its EROI is too low to find a way to extract it.”,
which is straightforward but also profound in the implications.
Another way of saying it that removes the somewhat nebulous notion of EROI is-
“Having oil in the ground isn’t much good if its [price] is too low to extract it.”
The cure for low price is higher prices, which would mean less stranded fossil fuel.
Oil products are an incredible bargain even if crude was priced at $300/barrel. Just try to push a shopping cart filled with rock up a 500 ft hill to remind yourself. Yet there are two big questions on this
-Who can afford very expensive fossil energy and the enabled products? Is it a grain farmer, a 100 million people who live paycheck to paycheck, or a nation who has maxed out their credit draw?
-And if not being able to afford very expensive (low EROEI) fossil fuel, then what else do people have at hand that can produce affordable energy. Well not much…except
I point out that in some places there are some replacements that come in the relatively affordable (adequate EROI) category. For example, some places have excellent hydroelectric power production/resource, and many places have vast solar energy reserve, and others are windy as heck. Some have significant nuclear energy, and it is good chance that many places will start the big build-out of deep drill geothermal energy (DGeo) soon. I do expect that DGeo will come in as widespread energy source…not cheap, but economically and technically viable.
Its not an all-or-none game with any of these energy resources. The mix will gradually shift.
Time will tell how much energy production that people [collectively] can continue to afford to dig up or deploy. My guess is that people will pay up in a big way for secure energy supply, considering the alternative. But I am not at all sure just how many can actually come up with the funds to keep the energy flowing toward them.
In fact, I expect economic forces to push a big trend toward the downsizing of populations in places that have far outgrown the sustainable local energy resources, and who don’t have the economic strength to out-compete other places for the exported energy available on the world market, which is most places. That is a sterile way of saying the sad notion that poverty will be the mechanism that drives population contraction. Especially for places that are pretending that the party (fossil and credit abundance) goes on forever, without taking rapid and massive measures to enable living with less of it all.
Happy New Year to Everyone, and particular thanks to Ovi and Dennis for compiling all the data in a timely fashion.
Seppo
Happy New Year
Seppo
Thanks and I wish all of our contributors and readers a Happy, Healthy and Prosperous New Year. 🍾🍾🍾🍾🍾🍾
Thanks Seppo,
Your contributions to POB are appreciated.
Thank you Ovi, you do excellent work and without your efforts POB might be history.
Happy New Year everyone.
Dennis
Thanks to you. Without you, this site would not be as interesting. You do the heavy lifting.
Ovi,
We have different opinions on this, your contributions are much appreciated by all and I find them more interesting than what I have to say. Thanks.
Saudi Aramco with partner is building a Crude Oil to Chemicals plant in South Korea
https://www.icis.com/explore/resources/news/2023/03/10/10864448/s-korea-s-s-oil-begins-building-7bn-crude-to-chemicals-shaheen-project-in-ulsan/
The research into crude to chemicals has been going on for some years. Various companies are now in the process of building actual plants. These plants can convert up to 50 crude oil into chemicals.
Sabic are not far behind, the reason these plants are being built is because they know people use oil products and there will be another Billion people on the planet by 2037.
Dennis
In my last note above, I noted that someone suggested comparing input to refineries with production. I did find input to refineries in the MOMR but it is called “crude input to refineries”.
Attached is a chart that plots the MOMR input to refineries vs the EIA’s C plus C. The correlation from Jan 21 to Jan 22 is reasonable. Not sure what happened from April 2022 to April 2023. Was that a low demand period? The other issue is EIA’s C plus C vs OPEC Crude?
Note that the OPEC quarterly numbers were interpolated to give monthly numbers.
Thanks Ovi,
I compared the Statistical Review of World Energy data on refinery throughput with EIA C C annual data and the match is quite good over the 1980 to 2022 period, especially if we look at the cumulative total from 1980 to 2022 (because individual years might have net stock additions or stock draws from crude inventory.)
Per Capita oil consumption
https://ourworldindata.org/grapher/per-capita-oil?country=~OWID_WRL
Select chart and select world, per capita oil consumption has not changed in 30 years. Since Covid, global oil consumption is again increasing with GDP, just like it did for the last 30 years. Both GDP and oil consumption are both positive figures.
Dennis is totally wrong to suggest oil consumption is a negative figure.
Global per capita oil consumption is around 4.5 barrels per oil per person per year. According to most estimates the world population will increase by 500 million when we reach 2029 and hit 9 billion by 2037.
How anyone get reduced demand when all the facts point in the opposite direction is beyond me. And also beyond predictions by IEA, OPEC and many other who know a little about oil.
Charles,
Perhaps oil consumption will never decrease? I am pretty sure that is incorrect, it is simply a matter of when it occurs and at what price level. The fact is that real oil prices are far below what they were from 2011 to 2013, that is a fact that cannot be ignored.
If we look at refinery throughput which KDmitrov correctly pointed out is the best measure of demand for crude oil and divide by World Population to get crude demand in barrels per person for the past 40 years we get the chart below. Data from Statistical Review of World Energy (SRWE).
OK Dennis
Lets take your graph, but add 2023.
The easy savings of closing down or converting oil fired power stations in the 80s and early 90s has been done with some exceptions.
Since then, the last 30 years, oil consumption per capita has declined only a tiny fraction from 3.93 to 3.83 barrels per person.
Global population will increase by 500 million in the next 7 years. For demand to fall from next year as you predict something extraordinary would have to happen. What could that be?
I still believe in a global supply peak and that is the only way the world will use less oil.
Charles,
We don’t have data for 2023, only forecasts, I do those myself, they are not reliable, not by me, OPEC, EIA or IEA, so no let’s not add a forecast for 2023 to data estimates for 1993 to 2022.
We also have the fact that oil prices are low, do you expect low oil prices if we have peak supply?
As I have said I am trying to reconcile the fact that oil prices are low with OPEC is cutting output with a scenario of peak supply, the facts are more consistent with a peak demand scenario.
Random thought…
It may be more Relative Supply and Relative Demand. Peak implies rising demand and supply… when in theory you could have both supply and demand in terminal decline, but the relative fluctuations of each create scenarios of rising or declining commodity price scenarios within that same declining channel.
Gunga
There are millions more trucks travelling billions more miles. One truck uses as much fuel as 30/40 cars. So demand is increasing.
https://www.gminsights.com/industry-analysis/heavy-duty-trucks-market
https://www.researchandmarkets.com/report/heavy-duty-truck
Dennis
When you look at OPEC estimates they are usually pretty close to actual data confirmed months later. I take OPEC estimates and your own figures above, now you don’t accept your own figures.
As I said the main change in oil intensity was due to closing down hundreds of oil fired power stations during the 1980s and early 90s. There is no such easy path this time round.
One of the main reasons of low Oil prices is a dramatic change which has happened since Russia invaded Ukraine. The global dark fleet has tripled in size and you have no idea how much oil they are taking to India, China and other countries. Because it is illegal. Do you think they a shipping dates?
Expert companies are producing estimates but they all agree the trade in hidden transactions has increased dramatically.
https://www.geollect.com/news/the-dark-interconnected-world-of-the-illegal-oil-trade/
The tankers in the pictures have got oil in them, but tracking companies often are not sure where the oil came from. One thing is for sure it goes into the global economy. But I forgot Putin always remembers to tell the EIA exactly how much illegal Russian oil is being exported. Along with illegal exports from Venezuela, Iran, Iraq, Libya etc.
The global economy has not grown without oil consumption growing since all the oil fired power stations were shut down. Think about it.
Charles,
As I have said before, where is this “extra” oil coming from? Venezuela? Russia? Iran? Doubtful that there is an extra 3 to 5 Mb/d coming from those nations above what is reported. My claim is that for data we have up to 2022 (any “data” for 2023 are forecasts by OPEC, IEA, or EIA for any month beyond July) the supply and demand estimates for crude plus condensate match quite well. The supply estimate comes from oil produced at the wellhead and the demand estimate comes from crude plus condensate input to refineries (aka refinery throughput). How the oil is transported from wellhead to refinery and whether the ships can be tracked is a matter of sanctions etc, but tells us little about World Supply and Demand.
The amount of oil needed for a dollar of real GDP has continually decreased over time, vehicles have become more efficient over time, during the pandemic there was a significant shift of knowledge workers working from home, reducing the need for travel, more shopping is now done online, many people now have their groceries delivered. On top of this we have 2 and 3 wheeled vehicles moving very rapidly to electric, along with light duty vehicles, soon we will see heavy duty trucking moving to batteries, natural gas, and some long haul trucking demand may be replaced with rail, some of which may be electrified.
There are no sanctions on Libya or Iraq, so no need for either of those nations to hide their exports.
Data for refinery throughput from OPEC and Statistical Review of World Energy (SRWE) and transport fuel demand from EIA and OPEC where transport fuel is gasoline, diesel/distillate, kerosene/jet fuel, and residual/bunker fuel and transport includes land, water, and air transport of goods and people.
Note the lower numbers in 2022 compared to 2019 for actual data (instead of a forecast), real World GDP was significantly higher in 2022 vs 2019. Oil prices were quite low in 2023 compared to 2022 (with oil prices elevated that year due to market disruption caused by Russia’s invasion of Ukraine ) and far lower than the 2011 to 2013 period in 2023 US$.
Also note the OPEC refinery input includes NGL and upgrader inputs, whereas SRWE crude plus condensate input only.
Dennis,
I am in the camp that demand is and will continue to rise on average for the reasonable future. However, I agree that a deceleration in demand growth will eventually stagnant growth. But, demand growth has a good chance to be more robust than your models suggest. Perhaps GDP is rising faster than crude oil demand, but both are currently rising.
On your examples of oil consumption reduction such as grocery delivery…
-Working from home: I don’t buy this variable anymore…. This scenario is dying off daily. Plus… it doubles the need for multiple desks, office space, equipment, etc… There may be some persistent hybrid folks like my sister, who is in the cloud biz and was working all days from home but now works 3 days from home per week…. The company changed policy last year and now mandates two days per week for her to be in Austin…. 70 miles north of us. She drives a gas powered car to make the commute.
-Two and three wheeled vehicles: What were these folks driving before? Probably human powered bicycles mostly. Now many of these are gas powered…. and many electric. But where does the electricity come from to power them and the base materials to build them? Hydrocarbons mostly.
-Grocery delivery: There is still a truck and person delivering the groceries to your home instead of you driving to the store and collecting your items personally. It is merely an energy offset in general. Meanwhile, while the delivery guy is grabbing your items and driving them to your home, you are on your computer working, or driving elsewhere to run errands and consuming energy. The delivery service does not save energy, it may actually amplify energy consumption as now multiple people are working for one person… you and the delivery guy.
It’s amazing with all these instant services how a human can be influencing energy consumption in multiple places simultaneously across the globe…. with merely a press of a button. And all these services consume energy.
Gungagalonga,
Pretty sure delivering many items in a truck is more efficient than 100 people driving in a car by themselves to the store to get the item, so I disagree there. 5 years ago do you think more people were working from home or fewer. If you drive 140 miles 2 times a week that is less than 140 miles 5 times a week, and saves quite a bit of fuel.
On 2 and 3 wheel vehicles, previously they were gasoline powered , now many are electric powered. Most electricity is not produced with oil, so oil demand is reduced, eventually the natural gas and coal can be replaced with solar, wind, hydro, nuclear, pumped hydro, geothermal in a highly interconnected grid with some battery backup. A diversified highly interconnected network will see relatively few periods where backup is needed which could be rovided with hydro/ nuclear, biofuals and potentially synthetic fuels produced in areas with overbuilt solar and wind that may produce excess power at times that could be used to produce synthetic fuel for backup power needs.
Just because something does not exist does not mean it cannot be built using the capital that would have been used to produce oil, gas and coal.
World Crude demand 2013 to 2022 from SRWE.
Dennis
Where is this gasoline coming from?
https://oilprice.com/Latest-Energy-News/World-News/Record-Global-Gasoline-Consumption-Defies-IEA-Forecast.html
Also I keep saying countries like Russia, China, India and Iran are corrupt, why do you have such a problem accepting that?
https://www.lensculture.com/projects/370849-smokescreen-the-female-coal-s
https://geographical.co.uk/science-environment/witrandjie-south-africa-villaged-ravaged-for-chrome
The extent of corruption is beyond belief
https://www.nature.com/articles/d41586-023-04090-3
Charles,
Again, that is a forecast for gasoline consumption, we will not have actual estimates (rather than forecasts) for 2023 gasoline consumption for 6 to 7 months.
From the IEA December Oil Market Report we have:
Evidence of a slowdown in oil demand is mounting, with the pace of expansion set to ease from 2.8 mb/d y-o-y in 3Q23 to 1.9 mb/d in 4Q23. A deterioration in the macroeconomic outlook led to a downward revision in our global oil consumption growth forecast of nearly 400 kb/d in the final three months of the year. Europe, Russia and the Middle East account for most of the adjustment. The impact of higher interest rates is feeding through to the real economy while petrochemical activity shifts increasingly to China, undermining growth elsewhere. Europe is particularly soft amid the continent’s broad manufacturing and industrial slump. In addition, tighter efficiency standards and an expanding electric vehicle fleet continue to curb oil use. As a result, world oil demand growth in 2023 has been adjusted lower by 90 kb/d from last month’s Report to 2.3 mb/d. China accounts for 78% of this year’s increase. Oil consumption growth is expected to ease significantly in 2024, to 1.1 mb/d, with demand baselines normalising as Covid-related distortions fade.
They seem to be telling a story of slow oil demand growth. Note that the IEA refers to all liquids as “oil” when in fact much of the “growth” has been NGL growth. The intital forecasts are often revised, we won’t have good estimates for many months for 2023 output and not for another 18 months for 2024 output.
Mike McGlone, senior commodities analyst at Bloomberg is calling for $40 WTI in 2024.
He says the US and Canada have oversupplied the market and that price is needed to curtail production.
Thanks Shallow Sand. The EIA is calling for WTI at about $78/b in 2024 in its most recent STEO, that seems more reasonable, but it could be as low as $70/b, I doubt we will see $40/bo, but as you know I am often wrong.
I don’t think he means sustained. He feels that is a level it takes for US and Canadian producers to significantly pull back.
I don’t know that I agree. But, I was surprised US hit 13+ million this year.
Seems maybe not going much higher than 13 million for awhile? Of course, seasonal plays into that.
Shallow sand,
If my tight oil scenario is correct (it probably is not), then yes, 2023 is likely to be the peak for US C plus C output.
Shallow
Looks like Permian is rolling over.
https://twitter.com/tedcross/status/1742927869201023432?t=qrbIJYs_FAJd1O-kloyrVw&s=19
thx, interesting.
Hey Ron, last week you pointed me to that link (http://tinyurl.com/yptfstcr) in order to fetch recent data for international oil production. After clicking on the key icon, it turned out to be the same page i’m using to make an API call (and btw i do use the version 2 of the EIA API). The only problem was the data only goes as far as May 2023, whereas your page shows data until August (also both May figures are not quite the same).
I decided to reach out to the EIA to figure out what was going on, they kindly got back to me quite quickly, this is what they said:
“Thank you for reaching out – glad to hear you find our international data useful.
We are still catching up with our regular data updates, which were a bit delayed because of our IT upgrades . We plan on posting the monthly petroleum supply data shortly, and it will include data for June and July.”
It’s good to know, I guess it will be solved in a few days.
Skeboo
Just clicked on your link above and it goes to August 2023.
I use a different link that gets to the same page and it provided the info for the August update.
https://peakoilbarrel.com/august-non-opec-and-world-oil-production/
Ovi, the link above shows data up to August 2023, yes.
But on that same page (say in the ‘World’ row), click on the key icon (API column), it will take you to that page (which shows data only up to May 2023): https://www.eia.gov/opendata/browser/international?frequency=monthly&data=value;&facets=activityId;productId;countryRegionId;unit;&activityId=1;&productId=57;&countryRegionId=WORL;&unit=TBPD;&sortColumn=period;&sortDirection=desc;
Skeeboo
Note what it says in the Notice at the top of the page “Retired’.
I believe this is just a heads-up for people still using the legacy API (which got retired during the month of March) telling them to use API v2 from now on. The values on the new API browser got updated until May, but then no follow-up.
Let’s just wait a bit and see if the message they sent as a reply solves it.
And it’s solved… The EIA just reached out to tell they adressed the issue and August is now available at that link (when you click on the key icon). They were quite reactive.
Dennis
I just sent you an email.
Ovi,
Got back to you sorry.
An update to US Oil production has been posted.
https://peakoilbarrel.com/us-october-oil-production-held-steady/
A new open thread Non-Petroleum has been posted.
https://peakoilbarrel.com/open-thread-non-petroleum-january-4-2024/