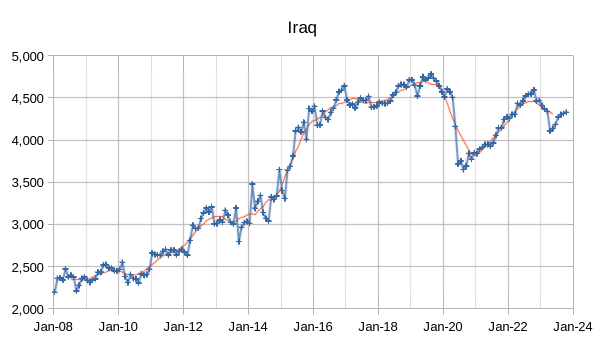
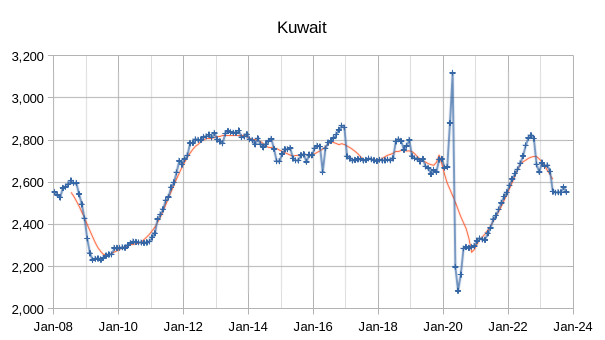
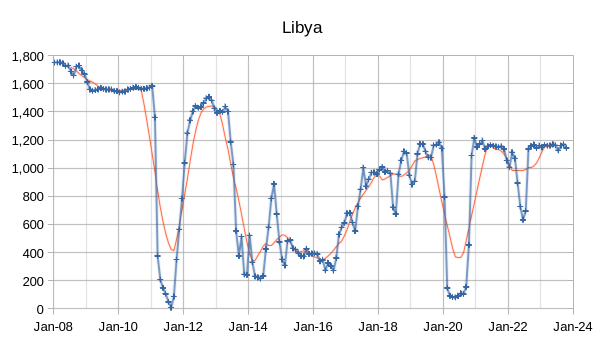
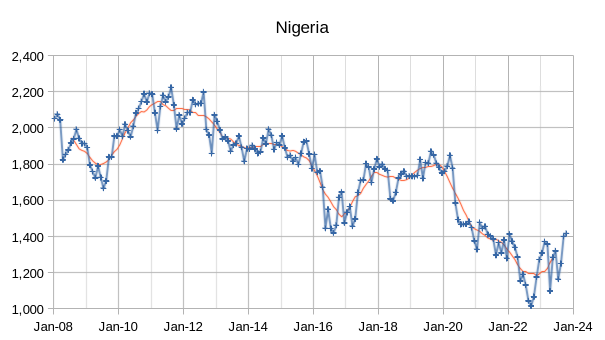
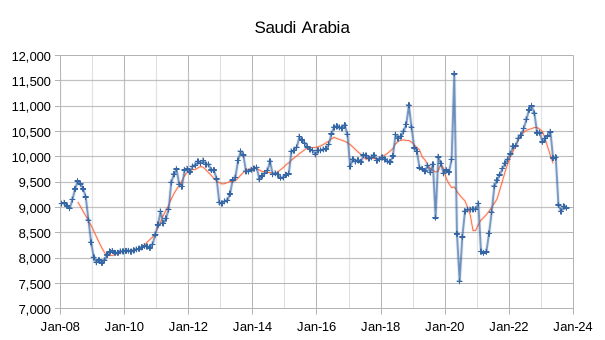
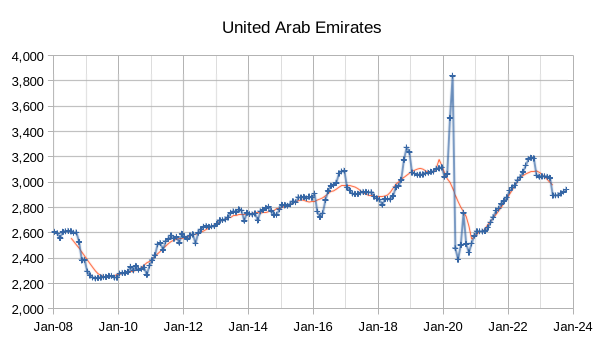
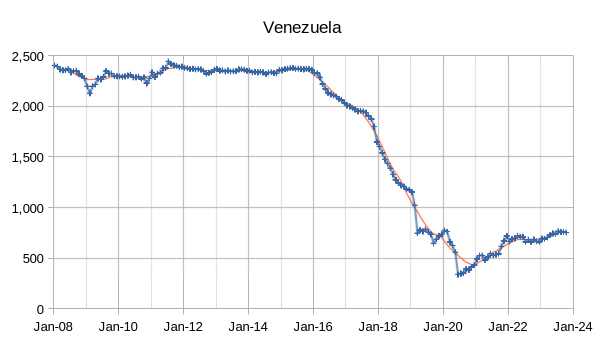
The OPEC Monthly Oil Market Report (MOMR) for November 2023 was published recently. The last month reported in most of the OPEC charts that follow is October 2023 and output reported for OPEC nations is crude oil output in thousands of barrels per day (kb/d). In many of the OPEC charts that follow the blue line with markers is monthly output and the thin red line is the centered twelve month average (CTMA) output.
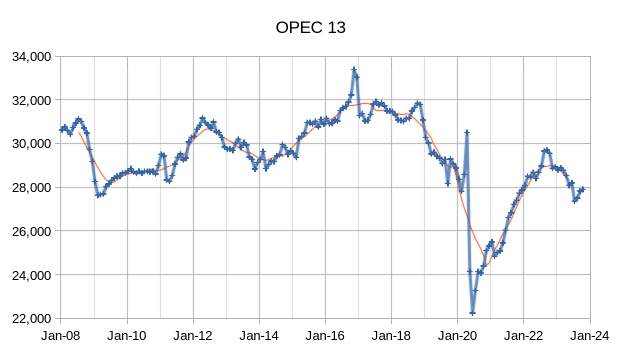
OPEC crude output was revised higher in September 2023 by 65 kb/d compared to last month’s report and August 2023 OPEC crude output was revised higher by 19 kb/d. When the World was at its CTMA peak for C+C output in 2018, OPEC crude output was about 31300 kb/d and by October 2023 OPEC crude output had fallen to roughly 3400 kb/d below the OPEC output at the World C+C CTMA peak in 2018.
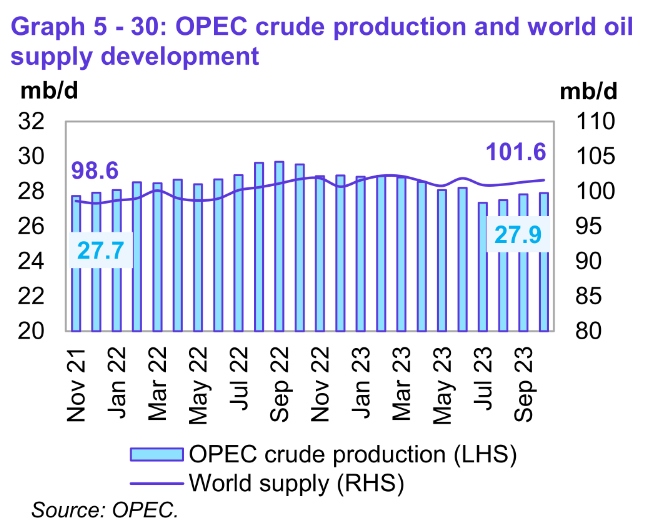
Preliminary data indicates that global liquids production in October increased by 0.3 mb/d to average 101.6 mb/d compared with the previous month. World liquids output increased about 3 Mb/d in the past 23 months (from 98.6 Mb/d in November 2021).
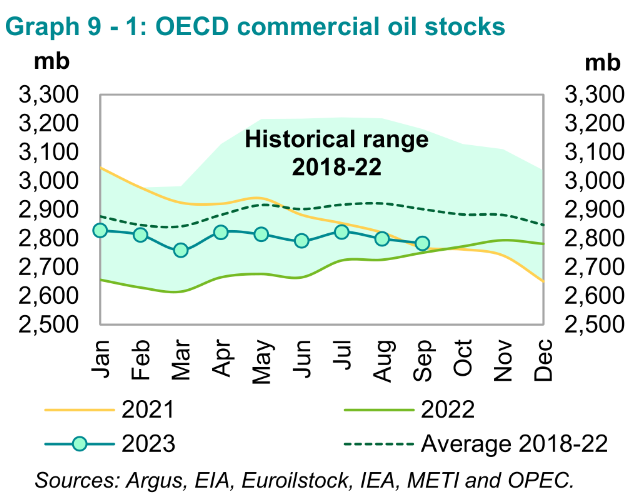
Preliminary September 2023 data show total OECD commercial oil stocks down by 15.6 mb, m-o-m.
At 2,783 mb, they were 33 mb higher than the same time one year ago, but 118 mb lower than the latest five-year average and 184 mb below the 2015–2019 average. In September I thought that if OECD stocks came close to the bottom of the 5 year range we might see oil prices spike, so far it seems I was wrong as oil prices remain subdued due to fears of falling oil demand. At the World level, based on OPEC and EIA estimates of World Supply and Demand, the World oil market is currently fairly balanced so from that perspective the OECD stock level may not be as important as in the past. Future oil demand growth may come from India, China, and other non-OECD nations.
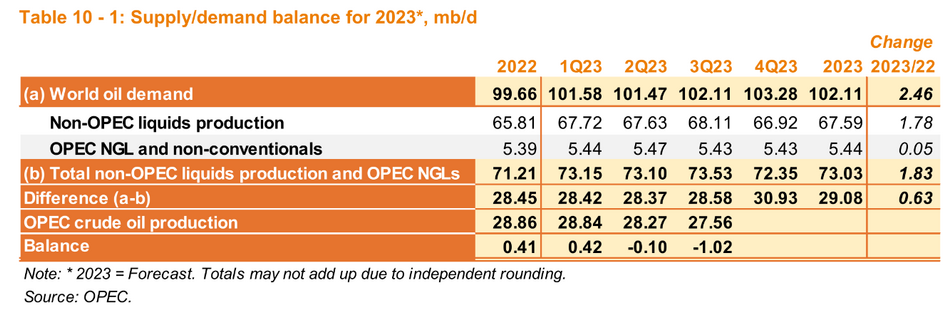
If OPEC continues to produce at the recent October level of 27.9 Mb/d for both November and December and the OPEC estimates for non-OPEC Supply and OPEC non-crude Supply and World liquids demand are correct we may see around 270 million barrels drawn from World petroleum stocks in 4Q24. OPEC still believes there are significant levels of World petroleum stocks that need to be reduced and may continue with their cuts in crude output. They may wait for higher oil prices, perhaps $95/b or more before increasing output.
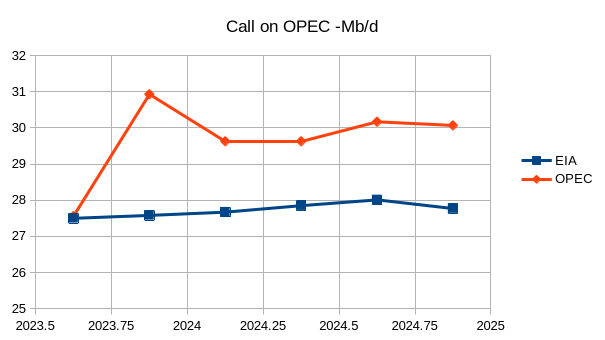
The chart above takes data from the most recent EIA STEO and compares with the most recent MOMR from OPEC, there is a significant difference in the future estimates in Oil Supply and Demand between the EIA and OPEC, it looks like the EIA thinks OPEC has supply about right and OPEC may be using EIA estimates to guide their output rather than the MOMR estimates.
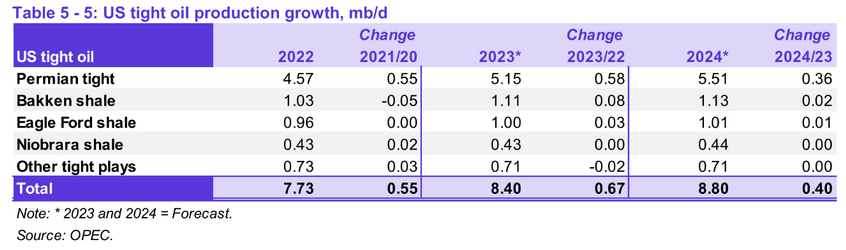
My estimate for 2022 is 7.9 Mb/d for US tight and 4.68 Mb/d for Permian output, in 2023 my guess is 8.4 Mb/d for US tight and 5.22 Mb/d for Permian (increases of 0.5 Mb/d and 0.54 Mb/d respectively). In 2024, I expect US tight oil to increase to 8.71 Mb/d (0.31 Mb/d increase) and Permian output to average 5.58 Mb/d (a 0.36 Mb/d increase).
OPEC cites Rystad estimates of about 505 wells being fracked in the Permian basin in August 2023 and in September preliminary data suggests 462 wells were fracked in the Permian basin. These are about half of all wells fracked in August (1089) and September (1007) in the US.
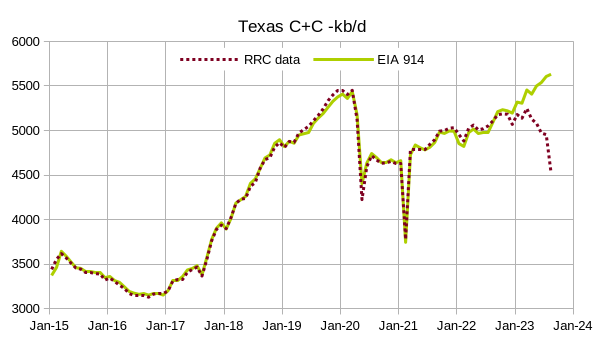
The chart above compares the initial EIA 914 estimate for Texas with statewide RRC data, over the Jan 2015 to August 2022 period (curves diverge in Sept 2022) the EIA 914 Texas C+C estimate is about 99.9% of the statewide RRC C+C estimate (on average the EIA estimate is slightly low).
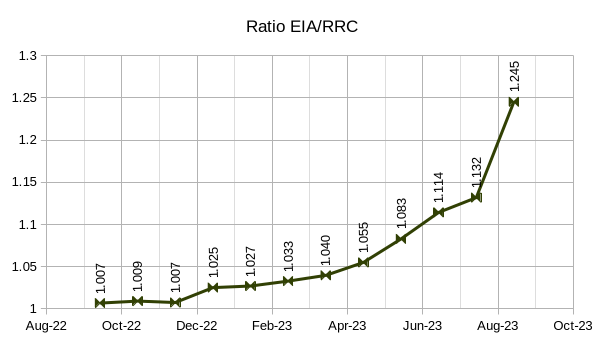
The ratios in the chart above will be used to get a corrected estimate for Texas Permian output for Sept 2022 to August 2023. First I get RRC data from all 50 Permian basin counties from Jan 2015 to August 2023 and then use these correction factors to estimate production from Sept 2022 to August 2023. I assume that the statewide ratio of EIA to RRC output applies to the Permian basin as well (this assumption may be incorrect). Note that if anyone wants to repeat this, it is easier to simply download the district 7C, 8, and 8A data, there is very little difference. See chart below which compares the two methods for Texas Permian C+C output.
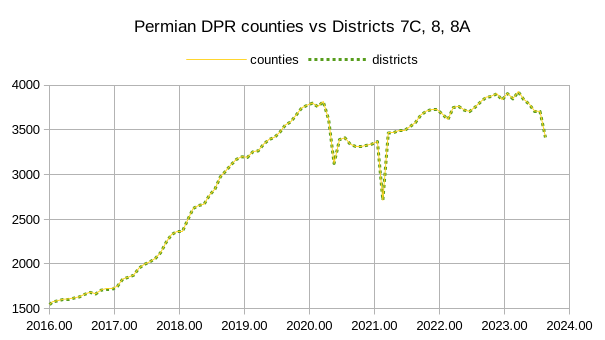
Note that DPR refers to the Drilling Productivity Report spreadsheet which lists all the Texas Permian Counties. The counties line is the sum of output from 50 Permian Basin counties in Texas and the districts line is the sum of the 3 RRC Permian districts (7C, 8, and 8A). I also downloaded state data for the 4 New Mexico Permian counties and corrected the data using the same method used for the Texas Permian data. The two data sets were combined to get a State data estimate for Permian region output which includes both tight oil and conventional oil.
Novilabs recently provided a Permian Basin Update. The data for Permian tight oil from March 2021 to December 2022 was compared with the State data for the Permian region and we took the difference to estimate Permian Basin conventional oil output.
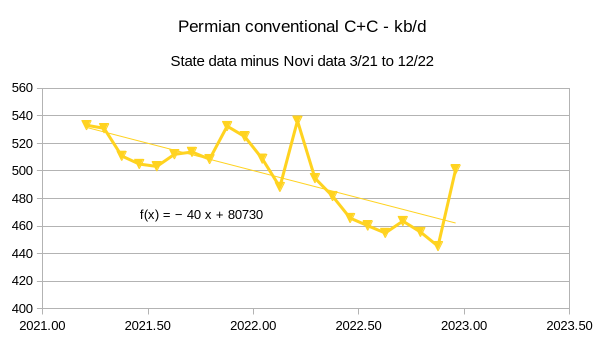
Although there is clearly a downward trend in conventional output suggested by this data at about 40 kb/d per year, I took the average of these data points from March 2021 to December 2022 (497 kb/d) and subtracted this amount from the State data for the Permian basin to get a Permian tight oil estimate from Jan 2023 to August 2023.
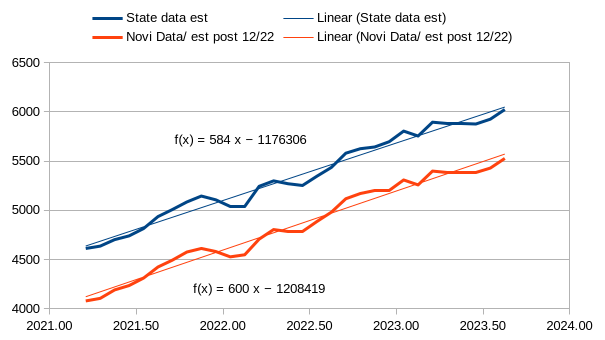
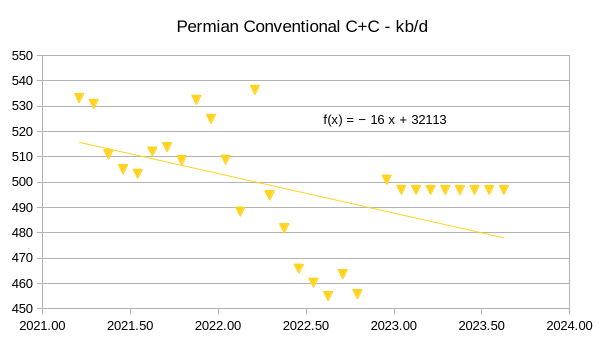
The trend over this period (March 2021 to August 2023) for Permian tight oil is about 600 kb/d per year, slightly higher than the Permian region trend at 584 kb/d per year. This is due to the declining trend in conventional output over the March 2021 to August 2023 period of about 16 kb/d per year.
66 responses to “OPEC Update, November 18, 2023”
Thanks for all the work Dennis.
Dennis
Good report.
Attached is a chart of the oil stocks, on land and on water. The interesting part of this chart starts in mid 2022 when supply and demand started to get out of balance. As can be seen, oil on land remained very steady after Q2-22 at close to 4,000 Mb but OOW started to climb and added close to 200 Mb to 1,400 Mb. Note Q1-23 and Q2-23 are plotted as January 1 and April 1 respectively.
The OPEC cuts started being effective in Q2-23 and Q3-23 but only show up by the 200 Mb drop in OOW. In Q3-23, OOW dropped by 82 Mb. Q3-23 is when Saudi Arabia introduced the 1 Mb/d lollipop cut. Over those 92 days, that would translate to 92 Mb which is mostly the OOW drop.
The last red marker reflects an expected 270 Mb drop in Q4-23 based on the OPEC supply demand estimate. I attribute the drop in OOW as the desire of countries using floating storage, Iran and Russia, to reduce the fees they are paying for floating storage.
It will be interesting to see where OOW stabilizes. If it gets down to 950 Mb, that is close to where it was in 2013.
Good chart.
Thanks Ovi,
Just to clarify, the “oil on land” is the oil in OECD nations, we don’t have a great handle on non-OECD oil stocks, but it may be about equal to the OECD stocks so that the total is on the order of 9000 Mb for the World for Oil stocks on land and water.
I know you know this, but our readers might not.
World oil consumption is about 100 Mb/d, the World tries to maintain a 90 day supply as stocks to cover future consumption. Ninety days times 100 Mb/d of future consumption is 9000 million barrels for World oil stocks.
Dennis
I just checked JODI. The big Non-OECD producers such as China, Russia and Iran do not report oil stocks.
Ovi,
There are not a lot of big producers in the OECD except the US, Canada, and Norway, both producers and consumers hold petroleum stocks, the OECD stocks are about half of World stocks on land, We do not have good visibility for non-OECD stocks, it is a big problem and a big part of the explanation for market volatility, lots of guesses, most of them pure speculation.
Dennis
Attached is my projection for Permian production. Interestingly your projection is between the DPR’s estimate and mine (blue markers). Mine is showing the same flattening trend as the DPR is showing.
The methodology uses the difference in RRC production and NM production between August and September to make the projection. It is preliminary and a few more months of data is required to see if the use of an average monthly change is better than using the last two months.
I have sent you the spread sheet showing the calculations. It only uses RRC and NM data to make the projection.
Ovi,
Interesting stuff thanks. There are some that think the EIA 914 estimates are crap, however for Texas from Jan 2015 to August 2022 the initial EIA 914 estimate when totalled is about 99.9% of the total Texas RRC statewide estimate for C plus C, that’s a pretty good result, even if it were a science experiment. The actual survey data in the 914 report (comp-stat spreadsheet) reported by the top producers in Texas to the EIA may be mostly tight oil output so that may be another good metric to use for estimating Permian plus Eagle Ford output. The EIA’s official tight oil estimate for the Eagle Ford may be pretty good (the Permian estimate is not) so we can deduct the Eagle Ford output from the 914 survey data for Texas to get a rough idea of Permian output.
Chart for Permian 914 survey estimate, this probably is 200 to 400 kb/d too high as of August 2023 (so some of the 914 survey output reported may be conventional oil (roughly 5%).
Another thing to remember is that the EIA Permian LTO estimate includes only the Wolfcamp, Spraberry, and Bonespring formations, according to Novilabs there is about 200 kb/d of Permian output from other formations as of Jan 2023. I think Novilabs data is more complete for the Permian basin than the EIA “official” tight oil estimate. The EIA would be wise to create a new column in the tight oil spreadsheet for “Permian other formations”, there is no reason they cannot do what Enno Peters is doing, or if they don’t have his level of skill, get a subscription to Novilabs and use that data as a check on their own.
Dennis Coyne: I think your response to my last comment on the last thread was, excuse me, rather pathetic. You can get away with that sort of stuff with your other readers, not me. Who do you think you are trying to con? Its poor, lazy work designed not to help people understand better, but only to promote your models and ensure the community you have relevance in analyzing oil and gas. My response, I believe, will cover it….https://www.oilystuff.com/forumstuff/forum-stuff/the-trend-is-often-not-your-friend
Our country is at a very precarious place with regard to its remaining hydrocarbon resources. 2024 is a very important year for our future as we are about to elect another TRRC Commissioner and a President that will have a direct and immediate effect on how our remaining oil and gas resources are managed. Lying about the future, which I believe you are, will negatively affect that future.
The truth matters now more than ever. Tell it !
Come on Dennis, last time we were at this kind of juncture. The Republicans were singing Drill, Baby, Drill. Then that Kenyan got elected and rised the auto manufacturers fuel efficiency standard. We can’t have that happen again. Than there was also the time Reagan took the solar panels off the White House and gave us supply side economics. We all know how that ended. The rich got their checking account jumbo sized.
Just saying the truth matters
We need both for the necessary transition to other energy sources – drilling AND efficiency in usage.
Mike is on the drilling side, others optimize processes. My company makes money with eliminating unnecessary truck trips, or make them shorter. Wasting Diesel and tire wear down is cost, and cost matter for industry.
The first coal mines where worked with horses and pure manpower, the first oil was drilled with coal powered steam engines and trains. So we need to build the new infrastructure with oil and gas now. When some write here, the solar panels are build with coal or gas electricity now – this is the normal.
We have coal, gas, oil, big hydro and nuclear as “old” energy sources now, wind, solar, geothermal and biomass will come to this mix.
Coal gas and oil will have to phase out sooner or later, at different speed each, other are already at the limit as big hydropower – the others have no such limit.
Let the republicans build some more nuclear plants, the following democrats some more wind and solar, and hopefully transform the oil drilling companies sometime in the future to geothermal drilling (you’ll have to cool down Yellowstone at some point in the future anyway…) – a mix is needed here.
Don’t kid yourself Eulen, the Republicans haven’t built a new nuclear plant in America since Raygun. Their hole diggers. Mike promotes taking 3 mbd off the global market. Which will only increase the price and feeds “OPM” into his checking account. I’ve never once seen him address the real problem which is demand. Which is like heart surgery having a stint inserted for a few extra years of life. When what is needed is a change of diet and exercise. You can wrap a pig in a Texas flag, but it’s not going to turn into a butterfly.
Just the truth
To Huntingtonbeach (whoever you are): With no due respect, your above note is the tackiest, silliest, most grammatically stupid thing I’ve ever read.
“Their hole diggers”–>They’re (it’s not hard: they are).
“Which is like heart surgery having a stint”–>stent (stint=to limit time or effort; stent=something to hold form).
“You can wrap a pig in a Texas flag, but it’s not going to turn into a butterfly.” (What, the pig or the flag? And are you actually ready to call Mr. Shellman a pig? I suspect he could and would whip your ass, and if he won’t, I will–at age 79–for being scornful of someone I respect).
You are unequivocally the stupidest poor jackass who ever tried to post something clever on this otherwise quite good exchange of ideas. If you really want to write cleverly, learn something about what you’re talking about and, most of all, learn some grammar. But in the final analysis, I doubt you will ever learn a goddamned thing.
HB is right as that’s intended as a sarcastic remark. The current batch of MAGA Republicans do not know how to govern. Wouldn’t trust them to manage a nuclear startup and maintain operation over the life-cycle. And that’s the minimum required because the free-market would make a mess and walk away, and they probably know that’s the case.
The Dems may not favor nuclear power but they would be the only ones that could do it. How about the military?
In a recent thread here there was a link to a video about coal bed fraccing as a source of NG. Add that to the mix too.
Complex problems require complex, multi-faceted solutions and to either glorify or bash one of the many elements that is going to be needed is not helpful. I think in the US both parties are guilty of that – simplification to an extreme point and it sets the table for poor decision making. Add to that there is no national energy policy, just a number of private companies trying to maximize short(er) term profits – generally by increasing volume as fast as possible and that is by and large in direct conflict with our communal national interest ( but saying that makes me a commy?)
rgds
Electrification of ICE is a huge ongoing revolution like what happened in lighting electrification earlier last century. Rockfeller saw that ICE could replace kerosene used in lamps and in fact use 10,000 times more. Now, with thousands of Starship build in the coming decade or less and each fly 1 mission a day and consumes 1kilo tons of LNG, that is 500 million tons of LNG, or roughly half of the NG US is producing right now.
Sheng Wu –
That’s kind of my point –
https://www.eia.gov/todayinenergy/detail.php?id=55025
LNG is exported for the benefit of individual companies lest the common interests be damned. IMHO there should be substantial export limitations on a number of non-renewable resources although I’m not sure to what degree NG ( LNG I guess) belongs in that category as often it’s a byproduct of oil. There are much more qualified people on the site who can chime in on that…
Rgds
Vince
before the shale revolution, US was in dire situation of gas and oil, and California was ripped off by Enron during that time. The guy who founded LNG Chenerie for LNG export was actually grabbing investor money to build LNG import ports!
If all regulated, the oil and gas bonaza now, although not forever, but will probably be delayed by decades?
Happy Thanksgiving!
I remember that Cheniere switcheroo from importing to exporting. Clearly, if your CBM fraccing is going to be implemented there will be even more NG but the question is to what extend that should be exported or not – export policies don’t have to be bimodal – there can be a somewhat happy medium where the incentive to explore/produce/invent is balanced with national interests. Where exactly that balance lies will change continuously and both camps will complain that the balance is too far to either side – but that’s life.
Happy Thanksgiving to you too!
Thanks Mike,
The numbers at Novilabs after Jan 2023 are incomplete. For data from Baker Hughes on horizontal oil rig counts over the March 2021 to Jan 2023 period in the Permian basin the average weekly operating rigs were 281 rigs, over the same period the Novi labs estimate for monthly spuds was 446. So we get a rate of 446/281 spuds per operating horizontal oil rig or 1.59 spuds per rig on average. over that 22 month period.
We do not have good completion rate data beyond Jan 2023 so I assume completions are equal to spuds and use the reported horizontal oil rigs operating in the Permian multiplied by the 1.59 spuds per rig rate. This takes the DUC question out of the picture. Chart below shows horizontal oil rig count and spuds if there are 1.587 spuds per horizontal oil rig.
The scenario below simply assumes the wells completed will be equal to the wells spud in the scenario above (previous comment at 11/18, 4:18 PM), after November 2023 it is assumed that the completion rate falls as shown on right axis.
Mike suggested somewhere about 300 completions in the near future (perhaps some time in 2024), at 1.59 spuds per rig, that implies about 188 horizontal oil rigs if we assume completions are roughly equal to spuds (no change in DUC inventory). If we exclude May 2020 to Jan 2021 (pandemic slowdown) the last time horizontal oil rigs in the Permian were as low as 188 horizontal oil rigs was November 2016. I expect this may indeed happen, but my guess would be in 2031.
Mike,
If every viewpoint that is not the same as yours is a lie, then I guess I am lying. I am a bit more generous in spirit and think others who do not agree with me have a useful perspective to offer.
Here is a link to my comment
https://peakoilbarrel.com/eia-short-term-energy-outlook-and-tight-oil-update-november-2023/#comment-766229
Basically I use Novi data and rig counts to estimate spuds per rig (updated Novi data gives my about 1.59 spuds per rig). You suggested that there aren’t many viable DUCs so I assumed completions equal spuds so DUC inventory would be unchanged if the assumption was valid (it probably is not). It is just a simplifying assumption.
The rig count has been stable at around 299 for about 6 weeks, I assume that continues (if prices rise the rig count may rise).
As far as tight oil wells declining steeply, my average well profile declines about 70% from month 2 to month 13 just as you suggest. In the Permian basin the average tight oil well in 2011 declined about 73% from month 2 to month 13 and the average 2016 well declined at about 69% from month 2 to month 13, steep decline for tight oil wells has been with us for a while, this information is used in my models.
Mr. Coyne, I should not have said you were lying, I apologize. I just don’t think you know what you are doing. I should not be so worried that you are changing people’s minds given your audience (an example would be Huntington Beach) …it’s just that I am doing whatever I can to change people’s minds before its election time.
I’ve corrected my poor previous work and updated the number of completions per month thru September of 2023 using spreadsheets from Novi, cross compared to new wells on the new TRRC proration schedule…monthly completions in the Permian are still going down, as one with any cranial capacity might expect given the falling rig count.
https://www.oilystuff.com/forumstuff/forum-stuff/the-trend-is-not-your-friend
Again, I am very sorry for saying you were lying. And I apologize to your community, except HB.
As a personal favor to me for participating here the past 10 years, tell your buddy HB to kindly kiss my Texas ass, stay in California, by all means, and keep that wanker, Alfred E, Newman, or Newsome, whatever, with him.
https://www.oilystuff.com/forumstuff/forum-stuff/stay-calm-export-on
Happy Thanksgiving to everyone, except HB. He can eat fish tacos down by the pier and wait for baby diapers to wash in to the beach. Keep California beaches clean, I say !
Thanks Mike, no worries,
Sorry about people who are rude, unfortunately there are many of those out there. Your update is great, thank you. Note that the Novi data after March 2023 is likely incomplete for both completions and spuds (wells drilled, which you know but others may not).
The scenario below uses average horizontal oil rig count and spuds from Jan 2022 to March 2023 to finds spuds per rig at about 1.44 spuds per rig. The rig count data is used to find spuds based on rig count from April to Nov 2023 and I assume spuds are equal to completions as an approximation (on average this is true from Jan 2022 to March 2023 using Novi data).
After Nov 2023 I assume completions decrease by one each month for scenario below. The scenario is 100% certain to be wrong, it is pure speculation. The average 2020 well is used as the well profile from Jan 2022 to 2033, the decrease in the number of wells completed can be a proxy for decreasing well productivity with actual completion rate held steady up to Sept 2030. After that completion rate is assumed to fall more rapidly as tier one to tier 3 locations become scarce and profits plummet. The decrease in average well productivity is assumed to be about 3% per year from the Nov 2023 to Sept 2030.
Happy Thanksgiving to you Mike. I love fish tacos. The next time your in HB have lunch at Fiesta Grill downtown at 17th and Orange. The food is to die for and good enough for you to be willing to pay DoorDash the surcharge to have them delivered to Flatdona.
BTW, those aren’t baby diapers. There oil absorbent pads from the last time an oil tanker dropped anchor on top of the feeder line from the local oil platform to the refinery. The 100,000 gallon leak is all cleaned up now. After the lawsuit the oil company had to file chapter 11. Something about the line wasn’t pressure checked before pumping it onshore.
Enjoy your Holiday
The oil price seems to be wavering between expectations of an OPEC cut on Sunday and an economic contraction next year (and with the GoM leak related shut-ins adding some noise). Neither is bullish for production and either may eventually cause the other leading to extra downturn. Additional negatives are the expected reduction in Africa production (which will mostly be referred to as OPEC ‘cuts’) and the kick in of the effects of rig reduction in the LTO basins. The first of the big three basins to start losing rigs, EagleFord from last February, looks like it may be the first to see a production decline from August (depending on how far behind EIA is), which would just about fit in with a 5-6 month from spud to completion to full production. The next few months should be interesting as to whether Bakken and Permian follow and EF decline accelerates. TheGoM may show some decline from now through 2024 depending on how much more Mad Dog II will grow and when Whale will reach nameplate (plus any longer term impacts from the leaking pipeline shut-ins).
interesting post sir, could peak oil (finally) be here? I don’t like to make predictions because it’s easy to be discredited if they turn out to be wrong, but I think we really are at a turning point when it comes to oil supplies. The three titans which are Saudi Arabia, Russia and the US seem to be facing a serious and real problem of depletion of their oil fields.
Yes, the next year is going to be interesting one way or another. Things might get a bit clearer but I don’t have that much hope. If all OPEC countries followed Angola in better reserve reporting it would make a big difference, but no chance of that.
The freely available data quality and quantity for oil is too poor to make any kind of confident forecast. IHS, Rystad and WoodMac know more but it costs a lot, and is still only really a highly informed estimate. Only the E&Ps have much idea for their own assets, and the fact that a large chunk of reserve is probable and only 50-90% known indicates how fuzzy even the best models are, and anyway they won’t say beyond the minimum legal requirement.
Lot’s of trading in the oil price.
Today 4% down on the rumor the OPEC meeting could be delayed. At least that I read.
Most day trading today are KI algos, so short time oil price doesn’t need to correspond with economic facts but charts, trends, P/C ratios and new scanners. A few 100 Millions or even less are enough in future market to create such movements.
When US production was significantly down, post-Covid: How many people here predicted we had hit the final peak and it was in the rear view mirror? How many said the opposite?
For all the grief that Dennis gets, he was prescient. And…over the years, he’s been too peakerish, not too cornucopian in his predictions. To his credit, he admits it. However, I still find it odd that he lets social pressure here drive him to making “alternate” predictions with lower/earlier peaks. If anything, instead of looking at social pressure, he ought to look at his own failures and consider OUT performance, not under performance (versus EIA, USGS, etc.). After all, the history has been that those organizations underpredicted shale.
Happy Thanksgiving.
I’ve backed off posting much because I do not have much to add.
Shale has saved the USA. I can’t imagine the US Economy without it. As a father and uncle of young adults, I also believe it saved them (thus far at least) from conflict in the Middle East.
I continue to be amazed at production levels, which seem to continually overachieve forecasts.
Go back and look at historic oil and natural gas prices. Where would they be without US shale?
Imagine 3-4 million BOPD instead of 13.
At the same time, I agree it has been somewhat mismanaged. I suspect when it finally peaks, we will look back and wish some things had been done differently.
We are still plugging away, getting older every year. Our little field turned 118 years old in August and our oldest producing well will turn 118 very soon. Over half of our producing wells are over 112 years old, which is just darn amazing when you think about it. Almost all of the rest are over 40.
We have plugged 19 wells this year, with 2 more scheduled. Hope to finish up the remaining 4 next fall after harvest. Then we should be done with the ones that won’t cash flow at $50 WTI. As of now, at least, LOL!! Some of the wells we plugged were WSW wells we haven’t used in decades. Only one WI well, as those and SWD are so hard to get permits for now.
Still remember making money in the 1990’s with $10 ballpark LOE G&A CAPEX.
Will never forget Thanksgiving, 2014. Learned a valuable lesson, Just when you think oil will never be cheap again, the rug will be pulled out from under you. We have been playing defense ever since.
Go easy on Mike, not aware of anyone else here that has his background.
Take care all!
Thanks Shallow sand,
Mike is an excellent resource, I have learned so much from him and you about how the business actually works, though obviously I will never know as much as either of you. Thanks to you , Mr Shellman and all the others who I have learned from in the past (and hopefully the future).
Happy Thanksgiving to all.
SS
For those of us that know nothing about oil wells, please translate the short forms.
“Some of the wells we plugged were WSW wells we haven’t used in decades. Only one WI well, as those and SWD are so hard to get permits for now.”
At what point is a well shut down? 5 to 10 b/d?
Please try to participate more often, especially if you pick up info from colleagues regarding the Permian.
Happy Thanksgiving to all.
Ovi,
WI may be water injection. WSW is a water source well, I think. Mr Shellman or Shallow sand can correct me (or many others who know more than me).
Dennis
Thanks
SWD???
Sorry about that.
WSW = water supply wells. Extra produced water for water flood.
WI = water injection wells. These wells inject water back into the oil producing formation.
SWD = saltwater disposal wells. These dispose of water in a non-productive formation.
Also, for those that may not know, I picked the name shallow sand because we produce oil primarily from shallow sandstone formations.
We currently operate about 200 producing oil wells. All but about 10 produce from a formation found at about 850’-1,050’ The deepest producer we have left is producing from a limestone formation at around 1,800’.
The SWD wells we have dispose of water at close to 1,300’. The WSW wells were anywhere from 100’ to 1,300’.
We produce almost 100 barrels of saltwater for every barrel of oil. Our oil API is 30-36. The well head psi for the injection wells runs 500-750 psi. For the SWD wells 200-300 psi.
Although we have many 110 year old oil wells, the ones that take water back into the ground aren’t that old. A few drilled in the late 1950’s. Most drilled 1980’s to 2014. All have cement records. All have to pass a mechanical integrity test every 5 years.
We haven’t drilled a well since 2014.
It’s a heck of a deal when oil prices are high, but when that happens, the cost of everything skyrockets too.
Labor is still tight.
Shallow sand,
Can the produced salt water be reinjected for water flood or is there too much of it and some simply must be disposed? Thanks for the information. Hope you are doing well.
We have one area that has a natural water drive. So we dispose of water in a “deeper” zone. It’s cheaper to operate, fewer SWD wells at lower pressure. Much lower electric, which is normally the greatest expense after labor. The first SWD wells were drilled there in the 1950’s and still pass mechanical integrity tests every 5 years.
The other area we inject the water back into the producing zone. More injection wells, higher pressure, higher electric power expense. Most of those injection wells were drilled in the 1980’s. Same MIT schedule. Test every 5 years with a state well inspector present.
We have a handful of leases with 1-2 wells that produce little water. We truck haul the water to a SWD well we own. I wish they were all that way. Kuwait like LOE if no down hole failures. Down hole failures on those are rare, as the units pump at just 2-5 strokes per minute. The best one makes almost 500 BO and just 70 BW annually. LOE sans labor is under $1k annually, and it’s only failed once downhole in the 22 years we have owned it.
But it’s an anomaly here. Again, about 100 BW for every BO is the norm in our field.
Shallow,
Glad to see your posts and always appreciate your contributions.
You might enjoy watching/listening to the half dozen ‘Oilfield songs’ posted today on Tom Shepstone’s energysecurityfreedom.substack.com site, particularly ‘American Blood’.
Brings back memories of my long ago experiences with the incredibly hard working men on offshore rigs.
Hope your holidays are great and the new year a prosperous one for you and your family.
Coffee.
Have you heard of Alex Zanetis? He has an album of songs from the oilfield. We used to listen to it a lot. His relatives still operate in our Basin.
Shallow,
I am unfamiliar with him, but I’ll check it out.
Coffee.
He recorded Roughneck also.
Several good songs on the album. I think it was recorded in the 1960’s.
Do we have a new global high?
If Oil Monthly is correct
https://momr.opec.org/pdf-download/res/pdf_delivery_momr.php?secToken2=accept
https://www.opec.org/opec_web/static_files_project/media/downloads/publications/MOMR%20March%202019.pdf
Non opec oil supply is 4.6 million barrels per day higher than 2018 peak
And global supply is 0.6 million barrel a day higher
Interesting—-
We shall see
Some have expressed the hope that carbon capture will be feasible, enabling the fossil fuel industries to remediate the atmospheric chemistry damage from combustion.
So far, feasibility remains [extremely] elusive.
New report IEA
“The industry needs to let go of the “illusion” that carbon capture technology is a solution to climate change, according to the IEA.
An “inconceivable” 32 billion tons of carbon would need to be captured for utilization or storage by 2050 to limit climate change to 1.5 degrees Celsius under current projections for oil and gas consumption.
The necessary technology would require 26,000 terawatt hours of electricity to operate in 2050, more than total global demand in 2022.
It would also require $3.5 trillion in annual investment from today through mid-century, which equivalent to the entire oil and gas industry’s annual revenue in recent years, according to the report.”
https://www.cnbc.com/2023/11/23/oil-and-gas-industry-needs-to-let-go-of-carbon-capture-as-solution-to-climate-change-iea-says.html?__source=iosappshare|com.google.Gmail.ShareExtension
Efforts and capital would be much better spent on other mechanisms, it appears.
I’m sure the IEA has no ulterior motive.
Good to always question motives,
however it very well may be true. Proof will be in the pudding.
Ron
Did you get my two emails?
Nope, I can’t find a thing. But I get many emails and try to check every one. But it is still possible that I missed them.
Edit: I just checked “All Mail” back to October 1 and found nothing.
Ron,
I forwarded a couple of emails from Ovi today, I think he may have been using an email address you no longer use.
Rig and Frac Report for Thanksgiving Weekend
Rigs Down. Fracs Up
– US Hz Rigs dropped by 1 to 451
– Permian rigs were down 1 to 298. Texas Permian was down 2 while NM added 1 to 98. The 1 in NM went to Eddy county while Lea was unchanged.
– Eagle Ford was unchanged at 47
– NG was up 2 to 102 (not shown)
Frac Report
One year ago, 300 Fracs were operating, 19 more than this week. The Frac Spread count started to drop after the Thanksgiving weekend. Will history repeat itself this year?
Thx Ovi.
Attached is a Frac Spread Table for the week ending October 20. The official number of reported Frac Spreads for that week was 269 while this table is showing 314. Upon closer checking, close to 90 wells were being “Simul-Fraced” by as best I could count by about 40 frac spreads. 314 – 90 plus 40 = 264.
As can be seen the majority of the fracing is occurring in the Permian. More accurately, the 314 represents wells being fraced.
Ovi,
Is it possible to come up with an average length of time the frack spread spends on each well? If on average it was 7 days per well and for the past 4 weeks the average number of wells being fracked were on average 172 wells in the Permian basin, then there would have been about 172 times 4 wells fracked in the past 4 weeks (688 wells). This number is clearly too high, but if the average length of time to frack a well were about 10 days (including average time to move from one job to the next) abd the average nuber of frack spreads operating was about 170 over the past 30 days, we would have about 170 times 3 or 510 wells fracked in the past 30 days (this also seems a bit too high).
In any case, interesting information.
Dennis
The best thing to do, I think is to provide info by county. I have looked at those at the top of the list and here is what I have found.
– Lea: Avg = 14.6 days. However a number of wells took 21 to 23 days. May depend on length of laterals and Frac stages
– Martin: Avg = 27.6 days. There are three groups. 24 days, 41 days, 33 days
– Midland: Avg = 19.7 days. Two groups. 25 days and 16 days
– Ward: Avge = 26.2 days. Representative
– Eddy: Avge =21 days. Two groups 27 days and 11 days.
I have sent you the spreadsheet with critical columns
Ovi thanks.
Using frac focus data from link below
https://fracfocus.org/data-download
I find the following for Permian fracs completed from Sept 2022 to May 2023. After May data becomes less complete and frack numbers fall due to incomplete data.
Interesting spotlight on international relations and Nat Gas involving China/Russia Power of Siberia 2 natural gas pipeline-
“[Beijing] understands well their bargaining power and the country is in a much stronger position,” the source said. “It’s a specific presidential-level of pressure. It’s about cheaper payment. They can demand deep discounts.” The source also noted that Putin is under “enormous pressure” to build the pipeline or otherwise “a huge amount of gas” will be wasted [otherwise would have been exported to Europe prior to the invasion of Ukraine] and Russia will lose money.“In terms of construction, [Beijing] wants to make sure that they have no risks and no costs. Russia is the side that foots the entire bill,”
https://www.scmp.com/economy/global-economy/article/3242612/china-wielding-bargaining-power-russia-over-power-siberia-2-natural-gas-pipeline
Under the new conditions set forth by President Xi it is unlikely that the Power of Siberia 2 will ever come to fruition. Turkmenistan has a large gas field and already supplies two or three times as much NG to China as does Russia. The fourth pipeline is–unless I’m mistaken–already underway. There is an ulterior motive: the quality of oil from Turkmenistan is of very high grade, and I strongly suspect that Xi realizes that someday the world may run shy of oil. While the Russian oil, except perhaps for Sakhalin 2, is fraught with toxins, the Turkmenistan oil is not. It may not be of the pristine quality of the pre-salt oil but it’s close. Turkmenistan is going to be the primary source of NG to China, unless Russia pulls a Ukraine type invasion on them. At NG stuck under $3, there is no way Putin bears the entire cost of a very expensive pipeline that probably wouldn’t be finished in time to have much life. Just my opinion as a longtime NG watcher.
How about the Turkmenistan plans to cross the under Caspian to connect with the Azeri pipelines heading west toward Turkey/Europe?
Probably not going to happen either, as it requires a littoral vote, and one of those littoral states is Iran with close ties to Russia, the littoral state whose Navy patrols the Caspian Sea. The Azeri pipeline originates from the Caspian “eternal flame” gas field off the coast of Baku–the thing that drew the Nobel Brothers, along with Rockefeller and Rothschild and, eventually, Hitler to try to take Baku. That old field has to be petering out and I can see why Europe and Turkey would like to buy good, cheap Turkmen NG, but Turkey also has an allegiance to Russia. This is highly geopolitical. I’m no expert on this, by the way, just an old guy who has watched the NG market for a lifetime. There is enough NG in the world to immediately replace all the coal, thereby cutting CO2 emissions just about in half. No one is touting that, and no one is putting pressure on coal-burning countries: China, India, even Germany and the UK. And that’s a damn shame.
Thanks for the reply Gerry. Certainly bears watching.
An update regarding Non-OPEC and World Oil production has been posted.
https://peakoilbarrel.com/july-non-opec-and-world-oil-production/
A new Open Thread Non-Petroleum has been posted.
https://peakoilbarrel.com/open-thread-non-petroleum-november-27-2023/