The EIA’s Short Term Energy Outlook (STEO) was published in early November. The chart below estimates World C+C by using the STEO forecast combined with past data from the EIA on World Output.
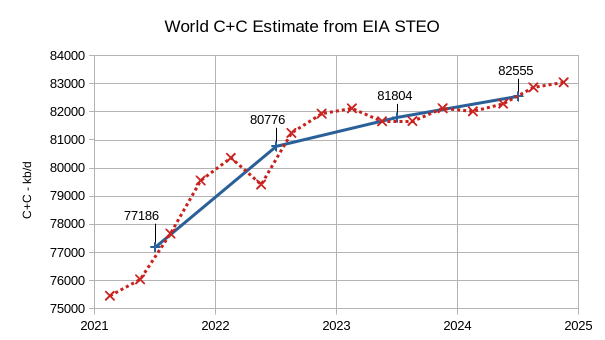
The EIA’s Short Term Energy Outlook (STEO) was revised lower in November compared to September (we skipped the October STEO). World C+C output is expected to decrease in the 2nd and 3rd quarters of 2023 and then increase over the next 5 quarters. Annual average World C+C output increases by about 1028 kb/d Mb/d in 2023 to 81804 kb/d and then to 82555 kb/d in 2024, about 445 kb/d below the centered 12 month average peak in 2018. This month’s World C+C estimates are about 400 kb/d lower than September’s estimate for 2023 and 1150 kb/d lower for 2024 due to the revisions in the STEO forecast since Sept 2023.
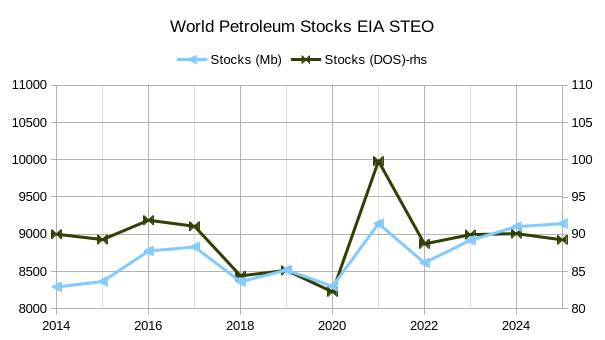
The chart above assumes World Petroleum Stocks at the end of 2014 were high enough to supply 90 days of World average petroleum consumption in 2015. Total petroleum stocks tend to rise over the long term because average petroleum consumption increases and in order to maintain a 90 day stock the absolute level of petroleum stocks must increase. The days of forward supply (DOS) on the right vertical axis is the better measure of petroleum stocks because it is very easy to see if the World stock level is above or below the target level of 90 DOS. Based on the EIA’s supply and demand estimates, at the beginning of 2018, 2019, and 2020 petroleum stocks were relatively low (less than 86 days of forward consumption) and at the beginning of 2022, 2023, and 2024 the stocks were at a balanced level (close to 90 days of supply).
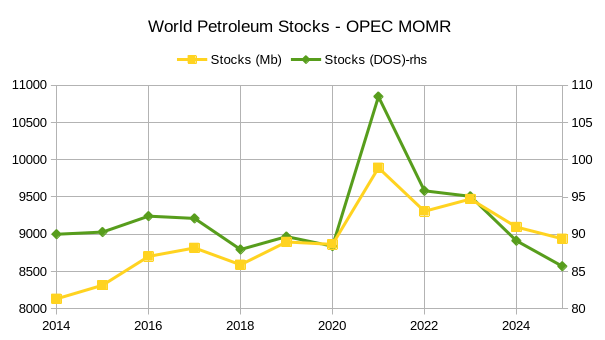
OPEC has very different supply and demand estimates for the World than the EIA. This results in the stock levels looking very different, with the OPEC estimates suggesting a balanced oil market at the beginning of 2018, 2019, and 2020 with close to 90 days of supply each year. At the start of 2022 and 2023 the OPEC estimates suggest a significant oversupply with stocks at 97 and 96 Days of forward supply in each of those years. High World demand assumptions by OPEC (about 2 Mb/d higher than the EIA estimate) result in a significant shortage by the beginning of 2025 at only 86 days of supply.
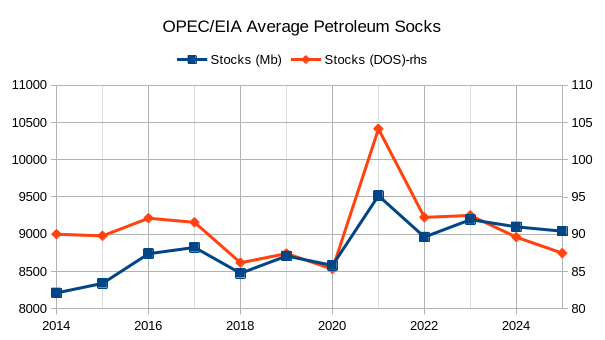
The chart above takes the average of the STEO and MOMR supply and demand estimates and uses them to evaluate stock levels based on these averages. By this estimate the World stock levels look a bit high at the start of 2016 and 2017 and flip to slight undersupply at the start of 2018, 2019 and 2020. By the start of 2021 there was significant oversupply (14 days extra), there was slight oversupply at the beginning of 2022 and 2023 with DOS at about 92 days. In 2024 the year starts at a balanced 90 days of supply and by the start of 2025 the market is a bit undersupplied at about 87 DOS. Unfortunately the World does not know if the EIA, OPEC, or IEA estimates for supply and demand are correct, this uncertainty may be one underlying cause of oil market volatility along with war, politics, weather, natural disasters and unknown unknowns.
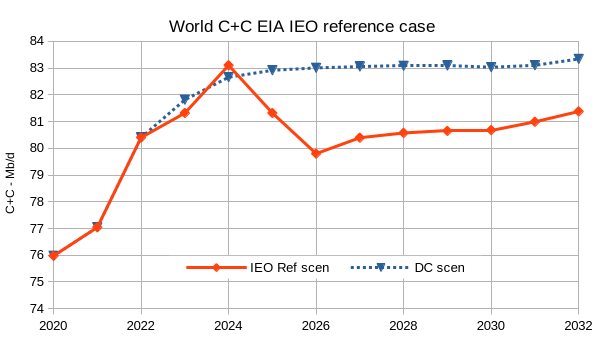
The chart above came from an earlier post on the EIA’s IEO 2023, the reasons why I think the DC scenario is a better estimate for World C+C can be found there. This chart is the motivation for a revised shock model with a plateau of around 83 Mb/d, though my expectation is that the plateau will be shorter than the DC Scenario above which assumes the EIA IEO reference scenario for transportation demand for petroleum is correct through 2032. A shortage of oil, high oil prices and the transition to electric transport are expected to lead to a fall in oil demand by 2029. See the chart near the end of this post.
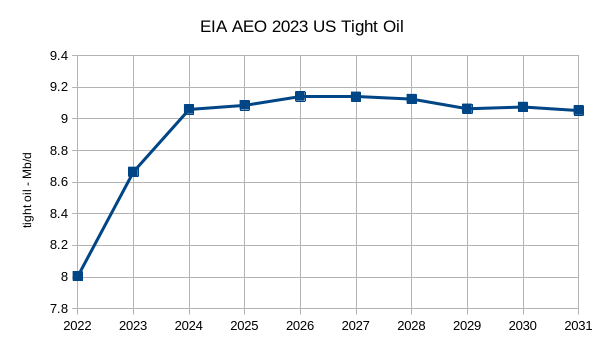
The chart above from the EIA’s AEO 2023 reference scenario for US tight Oil output suggests a plateau in tight oil output of about 9.1 Mb/d, this is part of the motivation for a revised tight oil scenario, though I expect the plateau will be shorter than the EIA scenario above. I also found an interesting paper at the Novilabs website at this link (the full paper can be downloaded at linked page) which suggests about 24000 tight oil well locations left in the Midland Basin, if we assume there are at least this many locations left in the Delaware Basin this suggests a round 90 thousand total wells for the Permian Basin (there are about 45 thousand wells currently), with only 65 thousand of these locations if limited to 20k future tier one and tier two locations.
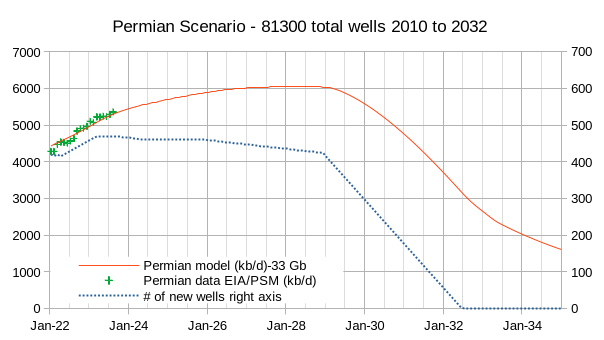
The scenario above for the Permian Basin is my main revision of my tight oil scenario with other basin scenarios unchanged from my previous tight oil scenario (link here to previous post). About 70 thousand horizontal oil wells are completed by the end of 2029 (from Jan 2010 to Dec 2029) in the Permian Basin and then the completion rate rapidly decreases as tier 1 and 2 drilling locations become scarce. The scenario URR is about 33 Gb which is much less than the USGS F95 TRR estimate of 45 Gb ( the mean estimate is about 75 Gb), note that for the North Dakota Bakken/Three Forks the eventual URR is likely to be quite close to the USGS F95 TRR estimate, so this scenario may be quite conservative. A link to spreadsheet with the above Permian scenario is here, the file is large (4.9 MB), the monthly completion rate in row 4 (delta wells) of the output sheet can be changed to create different scenarios as desired.
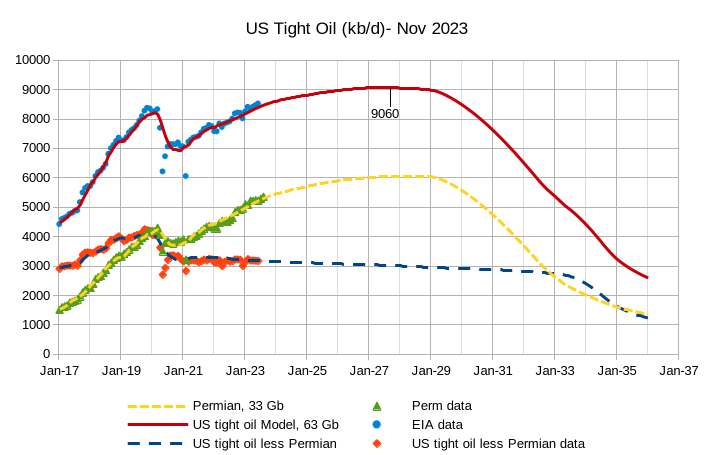
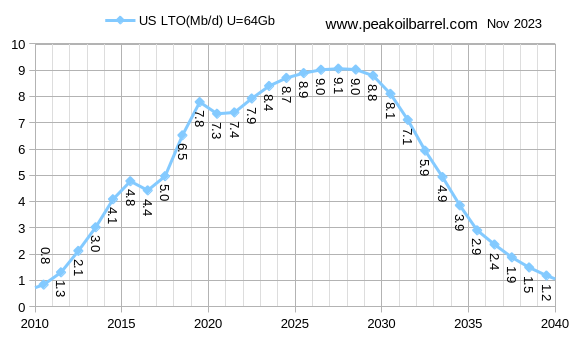
The new tight oil scenario is above with a peak about 9060 kb/d, roughly 500 kb/d less than my previous scenario, URR is 63 Gb, about 9 Gb less than previously.
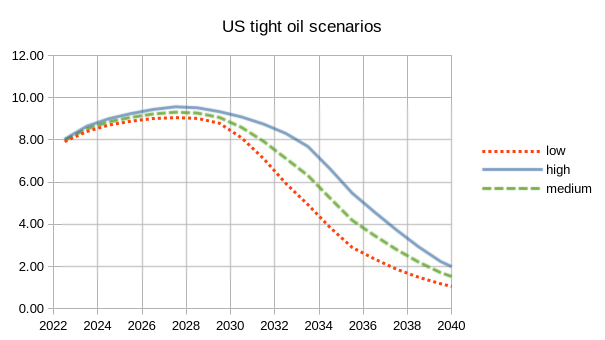
The chart above is in Mb/d (vertical axis) the low scenario has a 63 Gb URR, the high scenario a URR of 72 Gb and the medium scenario is the average of the high and low scenarios.
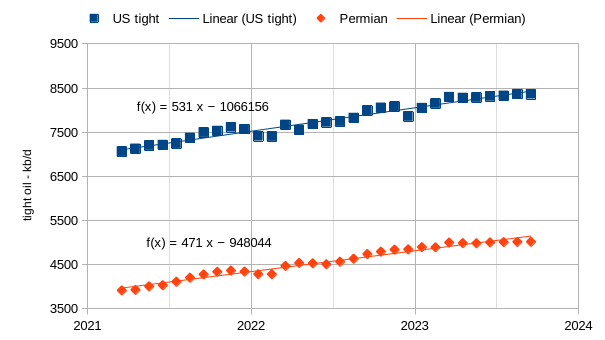
The chart above is from the EIA’s official tight oil estimate (spreadsheet at this link) and shows that Permian output has been flat since March 2023 at about 5000 kb/d. Most of the Increase in US tight oil for past 2.5 years has come from the Permian basin so we tend to focus here when considering US tight oil output.
The PSM Permian estimate in the chart above looks at C+C output in Texas and New Mexico from the EIA’s Petroleum Supply Monthly(PSM) and subtracts Permian and Eagle Ford output from the total C+C in those states to estimate conventional output. For the most recent 12 months the Permian estimate may be low due to incomplete data so we look at the conventional output over the months from 13 to 24 months before the most recent data point (September 2023) and find that conventional output was relatively flat during that period. We take the average over these months (Aug 2021 to Sept 2022) and assume conventional output remains at that average level over the most recent 12 months. Permian output is then found by deducting conventional and Eagle Ford output from the TX and NM C+C output total to find the PSM Permian estimate.
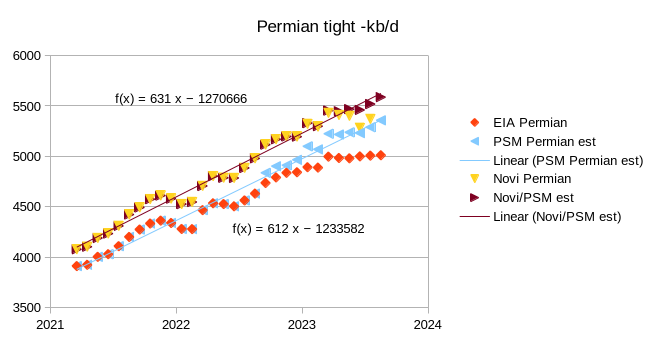
I also look at Novilabs Permian output data from the most recent Permian update (post at this link), this data is also compared with PSM data for TX and NM in the way that the EIA tight oil data was. In this case the conventional output was relatively flat for the 12 months from March 2022 to Feb 2023, I assume conventional output continues at the Feb 2023 level for March 2023 to Aug 2023 to find the Novi/PSM estimate. The trend of the two estimates is similar at between 612 and 631 kb/d per year and the difference in the estimates is explained by Novilabs including all Permian formations where the EIA includes only the Wolfcamp. Spraberry, and Bonespring Formations. Note that my scenario for the Permian is more in line with the PSM Permian estimate, actual Permian output (when including all formations) may be about 200 kb/d higher than my scenario as of August 2023. Bottom line is that Permian output is likely 300 to 500 kb/d higher in August 2023 than the EIA official tight oil estimate.
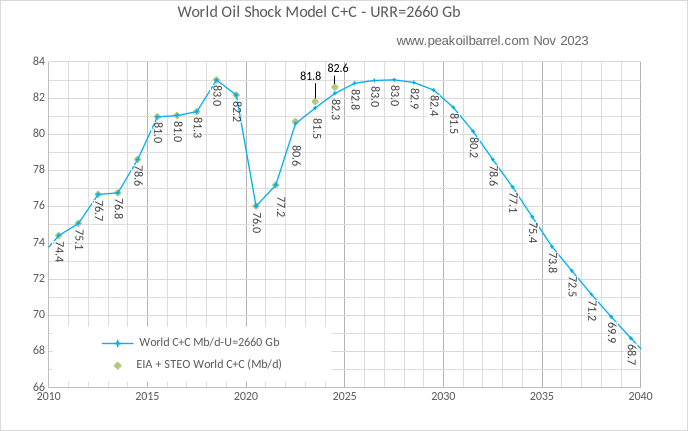
Above we have my revised World C+C Shock Model with the recent estmates from the STEO for 2023 and 2024 shown on the chart, the new scenario has steep decline starting in 2029, which is earlier than my previous scenario (where it was 2033). The peak is 83 Mb/d in 2026 and 2027 and a 4 year plateau at close to this level from 2025 to 2028, URR is 2660 Gb.
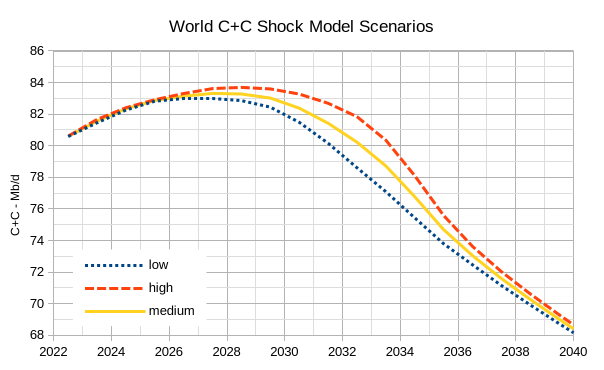
The chart above compares the previous Oil Shock Model (the “high” scenario above) with the most recent scenario (“low”), the medium scenario is simply the average of the high and low scenarios. My best guess is that World output will fall between the low and high scenarios, but it is highly unlikely any of these scenarios will be correct.
160 responses to “EIA Short Term Energy Outlook and Tight Oil Update, November 2023”
your revision in PB oil is really quite substaintial. Now, it is lower than the relatively conservative predicted in 2021/2022.
https://www.mdpi.com/1996-1073/15/1/43
The recent increase of crude, gas and coal consumption by India and China are probably underestimated, especially India, as the industrialization is picking up steam fast, i.e. the oil peaking probably will not be there till 2035 or later.
Sheng Wu,
The Novi paper is good, but only covers Midland, it is possible that there is a greater percentage of undrilled locations in the Delaware, my assumption that the numbers are roughly equal may be too conservative.
The previous estimate might be more realistic.
Shengwu,
The paper you cite has about 55 thousand new wells drilled in core areas after 2021 for total of roughly 90 thousand wells to get a URR of about 32 Gb, peak is more conservative than my scenario at about 4600 kb/d at peak, the EUR of the average well seems to be less than my scenario (which has about 430 kbo EUR for the average well) an their scenario also uses a lower completion rate of 400 wells per month. If I had as many wells completed as their scenario 190 thousand wells, maybe 140 thousand to account for lower EUR in non core areas. The scenario below has 109 total wells completed in Permian basin with a shift to lower completion rate to account for lower EUR of noncore areas (in reality, the number of wells is about 125600 with lower EUR for noncore accounted for).
Scenario from paper cited by Sheng Wu. The base plus core scenario is about 32 Gb, when non-core is added, the URR increases to 55 Gb. My previous Permian scenario had aURR of about 42 Gb. My guess is that much (more than half) of the non-core areas will not be profitable to develop.
The problem with the scenario from the paper is that it assumed an overnight shift from all core area wells to non-core area wells, the reality is likely to be a gradual shift from more core wells to less core wells over time. At some point the proportion of non-core wells completed reaches some critical level where the entire basin becomes unprofitable and the completion rate rapidly declines at the market clearing price of oil (perhaps $100 to $110/b in 2023 US$). In addition, the transition to electric transport is likely to reduce demand for oil (along with efficiency improvements in the existing ICEV fleet). The potential for autonomous robo taxis in the future would lead to a rapid increase in vehicle miles travelled with electric transport on land.
Somewhere between 2030 and 2040 we may see oil prices plummet due to lack of demand for oil.
yes, unless oil price back to over $100 and more for long, then non-core will be developed.
Otherwise, PB core or core in Bakken and EF will be limited to 300~400K BO EUR, and the above authors and several other sources and Dennis Coyne here also have similar EUR numbers.
I am attending the Latin America URTEC conference in Argentina next month, and will present the results of Vaca Muerta.
The finding is that Vaca Muerta could also potentially produce close to 30 Billion BO after the shale oil there demonstrated almost 2~3X EUR with same normalized lateral length than Delaware/Midland.
This drastically changed the previous estimate of only 10 Billion or less by EIA.
There are also several similar VM shale fields in China, espeically the Bohai Bay, which has been a major producer of heavier black oil with little gas, and the potential is there if we realize that “shale oil === HGLTO” is not true, actually low GOR black shale oil is the top dog.
Sheng Wu,
What is your estimate for tight oil URR from China? The Argentina 30 Gb, is nice, but we need to realize that the World uses about 29 Gb of C plus C per year.
Unlike with other oil sources still to be produced (such as Permian or Bohai Bay) much of the future Argentinian oil production will be available for export. It is a huge story for S. America, and for those who are able to purchase the produced oil.
The tight oil URR from China has the potential, but so far only some small scale developments. There are several factors that hinder its developement, like Vaca Muerta, and the major one is the ownership of pipeline and market regulations.
Basically, in China, unlike the US, producers can not pay a reasonable price to sell the produced gas to pipelines, and can not sell oil and gas in the market. So, you could see solar/wind companies in China could be very very competitive because there are many players and almost free market. But in oil and gas market, it is still controlled by 3 big NO.
Even in the 3 big NO fields, there are differences in control, the largest gas field in China, the Erdos basin, has lots of low margin gases, with EUR per well only a fraction of shale gas well here. But by allowing operators from smaller drilling and servicing companies from each NO’s smaller field to pitch in, they could still produce some 6BCFPD. They could lower the cost further now with new coal bed methane production revolutions now — some numbers are matching the IP and EUR in shale gas patches in US. see my video— very interesting,
https://youtu.be/PRgw-rXZMn4?si=wPV0G__NNiYwfuyC
in theory, US coal bed methane could also revive at a bigger scale and matching today’s shale gas. So, it seems US should allow for more LNG export now.
Within each major NO fields, there is basically only one or two operator, e.g. Daqing, Changqing and Shengli, and private or other operators from other fields can not get in, therefore, they have much smaller freedom/initiative to try shale oil.
Only, small tests, like the one in Subei, if proven successful, will get accelerated by local operator, otherwise it is all largely controlled from Beijing headquarters.
In terms of technology, there is a conventional wisdom like the old coal bed methane production strategy limiting people trying new things. For example, more than half of China’s oil fields have VM like low GOR black oil shales, and people does not believe shale oil could be produced efficiently, and even now, there is one-hand-full in the world trying to market this idea.
Mr. Sheng Wu,
I have watched your video for frac’ing coalbed methane multiple times and, frankly, it blows my mind.
If I understand you correctly, by applying modern frac’ing techniques to select coal fields, it might be (already is, in China?) possible to produce significant amounts of economically viable natgas?
That concept is so simple, in many aspects, that it is simply astonishing that it has not been widely done by now.
With the very shallow depths involved in CBM, utilizing advanced recycled water processing techniques, combined with cutting edge hydraulic fracturing operations, this idea could enable unfathomable amounts of natgas to be accessible to a global market.
In fact, with coal resources present in so many energy-deprived countries, the ability to locally, economically produce large amounts of natty is simply an amazingly disruptive concept.
Certainly looking forward to more info on this topic.
Sheng Wu,
Note that in my estimate for shale gas down thread, it is really total continuous gas resources and includes both shale gas, tight gas, and coalbed methane, the USGS mean TRR undiscovered resource is about 1600 TCF, some of this has been produced since it was estimated (varying years from 2010 to 2021), but my guess for the entire URR is about 1200 TCF which will peak around 2032 at about 110 BCF/d, the US currntly consumes about 84 BCF/d and exports about 20 BCF, conventional dry NG is only around 24 BCF/d and declining at over 5% per year. US consumption of natural gas increased at 2.37% per year from 2005 to 2019, if that rate continues from 2022 to 2032 the US will be consuming 110 BCF/d by 2032, leaving only about 12.4 BCF to be exported in 2032 (less than in August 2023 (at 20 BCF).
If US consumption of natural gas stops growing altogether and remains at 84 BCF/d, then the US could potentially export as much as 40 BCF/d at its peak in 2032, but this level could not be maintained as natural output will begin to decline rapidly after 2032. By 2043 output would have fallen by 40 BCF/d, eliminating all natural gas exports unless US consumption of natural gas falls.
Sheng Wu notes- “in theory, US coal bed methane….”
Correct me if I am wrong, but it is just a hypothesis- that coal bed methane could undergo a technical revolution with enhanced extraction techniques that would yield economically viable results.
Certainly nothing to make any plans or policy on.
It will be interesting to watch.
Are there prototype projects underway?
to answer some of the questions,
I made the youtube video about coal bed methane revolution above, and here are more background.
1. the production curve after massive modern hydraulic fracing is real in the published papers and only happened 2 years ago, and in less than 2 dozen wells, but the numbers are increase very fast because in the current wellhead price, all wells with such economics (1~2BCF 1st year) could recover cost in less than 1 year, and so far the 2nd year decline is similar to shale gas in Marcellus. The CNPC CBM chief claims China deeper CBM could easily surpass shale gas and even tight sand gas in less than 5 years.
2. The wells are mostly drilled deeper than 1,500m, mostly around 2km, and according to measurement of coal samples, there is already 10~25% free gas. But the wells drilled below 2km certainly has free gas content less than 10%, but production are close to the deeper wells. There are still one-hand-full geologists who believe that hydraulic fracking converted adsorbed gas into free gas, instead they still hold the same conventional CBM fracking, i.e., fracking only increased permeability or conduction, and this only works with already free gas, i.e. the CBM has to be deep enough. My video is a small step outside convention by stating water can convert adsorbed gas into free gas, and this changed everything and yet it is enticing and easy to understand or to believe based on the basic physics and now good production numbers way exceeding only 10~20% free gas. Of course, this adsorption controversy has been there in Shale because of the old CBM legacy, and shale revolution already so successful that adsorption is left in the hindsight.
Mr. Sheng Wu,
Your recents postings have been especially informative and I thank you for your input.
Congratulations on your upcoming URTEC presentation.
If it includes a plausible 30 Billion bbl Vaca Muerta estimate, it could be the most electrifying claim in the energy world for quite some time.
(Dennis … cyber shrugging off 30 billion barrels of earl … incredible.)
1. Fracked shale
2. Argentina
3. High-desert pampas
Can shrug everything off when it comes to depleting reserves of finite & non-renewable fossil fuels. [shrug] what do you expect, a cornucopia of endless supply?
While we’re talking about Argentina, keep in mind that they have a massive untapped energy reserve in the form of both wind and solar.
Vast parts of the country have solar resource on par with places like Florida, Texas and Spain. https://globalsolaratlas.info/map
Likewise with wind…the resource and extent certainly puts them in the top 5 of capability. https://globalwindatlas.info/en
With Argentina, the wildcard elephant in the room always seems to be their internal management.
Coffeeguyzz,
It was 10 Gb before, now 30 Gb so delta of 20 Gb, EUR is less important than cost per barrel, I have no idea what the cost structure is like in Argentina. In some countries a lot of infrastructure needs to be put in place and royalty burdens are sometimes prohibitive.
Argentina?
Fly Fishing and wine.
Beautiful women also.
Great place.
Thanks for your encouragement, Goffeyguyzz and everyone else in this forum!
I have been perperlexed by the low GOR black shale oil produced first in China some 7 years ago, and I had no clue how it could be produced until this June, when VM also reported larger scale success.
I first thought like rest of the geologists that such low GOR high viscosity oil must be conventional oil produced from natural fractures in shale. But, VM and recent Subei China results seem to verify again and again that they are shale and need same hydraulic stimulation with predominately water, not gel fracking. Even in VM, it is not well established until 2020 when Vista drilled into the low GOR 1MCF/bbl.
In 2020-21, I did isotope logging in wells in the original low GOR shale field, Jimusaer, and it still have the highest EUR shale wells there in China and lowest GOR in the world (50scf/bbl) , and I was shocked that the maturity read by my isotope machine is already Ro~0.95, same as the Permian core where GOR is 1MCF/bbl!YEs, 20X difference in GOR, and API is only 20° versus Permian 40~43°.
The comment ‘… finite and non renewable’ fossil fuels’ indicates an unfamiliarity with this entire RNG (Renewable Natural Gas) arena.
Practically every decomposing bit of organic matter emits (creates?) methane.
This is why virtually every garbage truck trundling down the streets of the US is fueled by essentially free fuel … CNG captured from local landfills.
Sheng Wu thanks for your recent observations/input,
Regarding- “especially India, as the industrialization is picking up steam fast, i.e. the oil peaking probably will not be there till 2035 or later”
I would agree without reservation if we lived in a world with no oil depletion. I think that India, along with most countries, will have great trouble finding oil supply to meet demand appetite throughout the 2030’s and beyond, if not earlier.
Last night I talked with a friend who lives in Bangalore. He commented how Indians are now buying a lot of large SUVs and airlines are placing orders for new planes. So no demand destruction there.
I’m constantly seeing new articles about how renewables, especially offshore wind farms, are not financially profitable, even when given tax brakes. How are we going to continue to sustain the world economy and our lifestyle after 2030 if that’s when the world crude oil production starts declining rapidly? Can nuclear and renewables take over the lack of oil and eventually replace it? Battery electric vehicles and nuclear power seems to be the best solution to mitigate peak oil, but there’s no silver bullet and who knows what will happen to our financial system that is based on capitalism and needs growth in order to function. We’ll probably all meed to live in cities and tiny apartments and take public transit in the future as nobody can afford a big suburban home and a big SUV.
Europe and Asia are going to de-industrialize on a massive scale. As available oil exports trend from current levels to zero. They’ll have to make do with what is produced on their own soils.
Which is like a 3rd or 4th of what they currently use because of the ability to currently import. It’s going to be nasty.
Renewables and nuclear aren’t going to change the outcome. Current standards of living will not be maintained.
Maybe exports would be continued if someone offered over $25 a barrel?
Exports will go to zero regardless of what the price is. It could be $25 or it could be $225.
Not a matter of price. The math behind ELM is clear. One by one producers will have to either cut domestic consumption or cut exports. Cutting exports is a whole lot easier than cutting domestic consumption.
I don’t think peak oil is necessarily about peak production. Peak exports is what matters most. And we will be in a world of hurt long before exports hit zero.
Just take away a 3rd of all exports and see what the world looks like.
Saudi Arabia burns a lot of diesel — much of it imported — to run air conditioners when the sun is shining. They’ve been talking about solar for a while now, but recently they seem to have started getting more serious.
HHH,
There are a number of poor assumptions for the Export Land Model, that is why so far there has been no shortage of exports, OPEC has cut exports lately because they believe the World is oversupplied with oil and are restraining output to raise oil prices. Exports will decrease in the future mostly due to lack of demand for oil.
Or OPEC is still pumping all they can. Or market seems oversupplied as demand has fallen for economic reasons. Like wages not keeping up with price increases. Making fewer trips using gasoline is one of the easiest ways to cutback when there just isn’t enough money to pay for everything.
Global oil exports have already peaked years ago. Trend is lower exports regardless of the reasons. Which is why we never returned to pre-2008 growth trend.
Gasoline demand in the US peaked 4 years ago and is trending downwards steadily. That’s one reason we are exporting more oil. We don’t need it anymore.
If there were no alternatives available then it would be difficult for producers to maintain exports. But subsidized oil prices in producing nations has led to lots of inefficient use (for example AC use in KSA). Much of this can be replaced with solar. So ironically solar and EVs will keep the export market well supplied for the foreseeable future. If oil prices are trending downwards now it’s because the three major markets (US, China, Europe) are all rolling over demand-wise.
https://yaleclimateconnections.org/2023/05/is-this-the-beginning-of-the-end-for-gasoline/
HHH,
The World peak in oil exports was 2016 at 71151 kb/d according to Statistical Review of World Energy, in 2022 it was 68815 kb/d which was higher than 2015 at 63341 kb/d and all other years from 1980 to 2015.
Dennis, The data in the report shows Europe exporting 2.864 Mb/d and Asia Pacific exporting 6.548 Mb/d (ex Japan). Is there some double counting here. Namely, importing oil and selling refined products.
HHH, what is you opinion on the possibility that those countries with refineries, may in the future buy oil but refine it only for their own domestic use and export none. Those without refineries will be left high and dry. Of course, market economies might make such a scenario moot, for countries, such as Mexico that is now an oil importer, exported her oil until domestic consumption exceeded her production. But refining and production are different categories and I do not want to commit a category error, for the differences may be material.
Yeah before exports actually hit zero. There will be hoarding for lack of a better word. If you have refineries and can still get imports you likely not export the refined petroleum products. But at first you’ll just export less until less becomes zero.
Not there yet. But I think as exports trend towards zero which might be 15 years out from here. There will be a huge amount of refineries close there doors because they can’t get enough crude to remain profitable.
Japan and Singapore for instance have a lot of refining capacity. But they might lose their imports before say India because a lot of that oil has to pass right by India.
Isn’t the price paid for oil determined by the monetary value of its utility? I think that the utility – more accurately the monetary value of utility – is in a way the limiting factor in that when oil is used to produce some kind of output which can (and is) measured like widgets vs utility that can’t be measured like a ride in the country on a Sunday afternoon the use which the measurable utility may likely be able to pay more for any given barrel. There is also the issue that the US (and most western countries) don’t have a national energy policy so you can have a scenario where a company exports oil for X dollars because demand at home is X-1 dollar even though the humanitarian consequences are negative.
Rgds
Seppo,
Yes net exports is a better measure for that reason, or to look at crude only exports. Chart below has World crude oil exports from EIA and OPEC which is likely a better measure than crude plus products.
One of the things to take into account is the switch to solar and electric vehicles. After 11 years on my roof and with my shingles needing replacement, I will still be cash flow positive with my PV array. With my EV, fuel cost per mile is about 1/2 to 1/3 the cost of gasoline. I can go 40 miles on a $1 worth of electricity and gasoline is about $3/gallon.
Recent advances in solar cell efficiencies are edging up into the low 30% range (33.9%). That means, I will eventually be able to replace my array with something that is twice as efficient and cost a lot less per kw. Labor and material will still be going up in price.
While I could store my excess generation in a Powerwall, I think we will eventually see the electric power generating companies take over that aspect of managing electrical generation and storage. Maybe we will see them rent our roof space and save our farmlands for growing food.
In the meantime, there are a lot of voices here that have insights. We’re all trying to tease out our various and precarious situations.
“How are we going to continue to sustain the world economy and our lifestyle after 2030”
It will not be sustained.
“If Something Cannot Go on Forever, It Will Stop“ ~ Herb Stein
For example, the insanely wasteful energy consumption of the last 50 years or so. No great loss though, since little of that consumption actually improves living standards.
Take cars for example: They are almost entirely used for moving single passengers around cities and suburbs. This could easily be done with a vehicle weighing less than a on, but on average, new American cars weigh more than two tons. The huge improvements in engine efficiency since the 70s has been wasted on ridiculously oversized vehicles.
And even now, 80% of the fuel you put in your vehicle goes to heating the radiator. Switching to EVs would greatly reduce waste.
But that isn’t all. The real solution id to stop requiring people to travel long distances on a daily basis. Most car travel is the direct result of bone-headed planning by city governments.
The idea that we are better off than we were 50 years ago because our cars weigh twice as much is bonkers. But that is were all the added consumption went. The idea that we would be worse off it they weighed half as much is equally bonkers.
Coal is the answer. Liquid fuels can be made from it, and it can be burned directly. There are vast amounts of coal, way beyond present reserve levels. Lignite and peat are everywhere. When people are coldband hungry they will turn to coal to survive. CO2 and climate change are so much bullshit. The coming volcanic eruption in Iceland will expell more CO2 than man has burned in the past 100 years.
“A NASA study showed the amount of carbon dioxide that came from the Mt. Pinatubo eruption, the largest in over 100 years, is equal to half the amount of carbon dioxide that humans produce every day.”
You’re making up the numbers so outrageously.
https://skepticalscience.com/volcanoes-and-global-warming-intermediate.htm
“Volcanoes emit around 0.3 billion tonnes of CO2 per year. This is about 1% of human CO2 emissions which is around 29 billion tonnes per year.”
thanks for a great visual comparison, but I don’t understand the optical thickness scale, is that for the volcanos?
It just indicates the increase in aerosols that have come from the volcano – i.e. a proxy for volcanic activity (see link).
Well, depends how you read the sentence. Could also be understood as “CO2 coming Pinatubo eruption corresponded to only half of CO2 produced by human activity in a single day” 🙂
==> Vulcano eruptions contribute marginally to CO2 emissions. However they contribute a lot to stratospheric dust.
A big eruption in Iceland could even cool the atmosphere for a year or two.
Try to land. The carbon dioxide emissions of the volcanic activity are approximately 0,6 billion metric tons/year according to a study published in 2013. https://www.climate.gov/news-features/climate-qa/which-emits-more-carbon-dioxide-volcanoes-or-human-activities
$.02 the best path for mitigating peak oil is antiticipating it and reducing oil consumption by choice before being forced to do so by price or availability. Expending wealth and income for an expensive energy consuming vehicle in order to maintain petrol fueled behaviors is missing the mark.
As I look at your charted projections Dennis (thank you!),
I just don’t see how the time from roughly 2029 and throughout the 2030’s is going to avoid being a time
of severe oil product shortage for most of the world. Shortage as in appetite much higher than supply, with severe consequence.
Yes, there will be an accelerated and urgent shift toward electrification of all oil product combustion applications,
but this global project is too big to get done quickly enough at this late stage and meanwhile the population is growing towards 9 billion (estimated 2037).
Lets keep in mind that replacing light transport combustion mechanism is only one facet of the oil supply issue.
And I believe that there is zero chance that extremely turbulent geopolitical storm will be avoided in this period, and that this factor adds up to the very high risk of oil supply disruption below the potentials charted. Sorry to say that this disruption risk cannot be overestimated, and yet is not predictable in scope, timing, locale and specific repercussions.
Those who have had things the easiest (US as the best example) have a huge risk of shocking shortfall. The current glut of oil has made us extremely complacent.
Hickory,
The rapid decline in oil output assumes demand for oil decreases due to the transition to electric transport, yes there are other uses for oil, but land transport of goods and people is at least 60% of demand for C plus C. The problem for oil companies in the 2030s may be low oil prices due to insufficient demand, high cost unconventional, deepwater offshore, and artic oil projects may cease.
In 1901 Spindletop came in. In many ways it marked the beginning, as well as Iran oil discovery in 1908. Oil was now proven to be abundant enough to be reliably used as a primary energy source. In 1917 NYC retired its last horse drawn tram and gasoline powered trams and cars became the primary transportation. WWI used horses as the primary infantry transportation however by the time WWII took place it was the keep trucks and tanks. In only 45 years the complete energy transition had occurred. Including rockets planes and nuclear which was supposed to be the next transition but it never happened.
We might say that by 1945 we saw the end of the beginning. From 1950 to 1973 the total industrial output of the world was greater than the period of 1800 to 1950. The US GDP was growing at 6% through that period. All the moon landings took place during that period and most nuclear power was planned during that period. The fastest military and private planes were designed and built during that period. Then suddenly it ended why did technology dry up?
In 1970 US oil production peaked causing the entire global economy to shudder. It always been about energy not technology. Technology is a corpse without energy. So in 1970 we were at the end of the beginning and the beginning of the end. Try as we might after 50years there is no transition from oil rather a desperate increase in its production and consumption.
The middle of the end was 1970 to 2005 and was met with multiple boom bust cycles as the financial and real economy out paced each other all the while debt was added to masks the underlying contraction in real GDP inflating assets and keeping energy prices low. By 2005 conventional oil peaked and the debt was untethered from any reality . Energy is Money. That marked the middle of the end.
Where we are now is the end of the end. There is no real growth in any economy. It’s all just supply side shortages inflating prices. Shale was the last gasp of a dying industry that was built on cheap credit and inflated production figures. And no matter how you want to count it the growth in C+C NGL and all the other light components are dragging down the energy content of oil in aggregate.
Prices are making wind and solar unaffordable now but no surprise because it was also unaffordable in the 70s .
If an energy transition could have worked it would have already just as it did in 1901-1945 it never came and never will.
JT,
Alternatively, from 1945 to 1970 oil output grew at about 7% per year and prices were cheap as oil supply kept pace with the increase in demand for oil. After 1973 oil prices became more expensive and after 1979 output crashed and prices increased even more. It took 13 years for oil output to return to the 1980 level as higher oil prices reduced growth in oil demand to under 2% per year from 1982 to 2004, from 2005 to 2019 output grew at only 1% per year and we may never produce more than in 2018. It will take time to transition to electric transport, just as it took many years to replace horses. For the past 5 years most energy growth at the World level has come from non-fossil fuels. If non-fossil fuel energy growth continues its recent pace of increase, it won’t be long (maybe a decade or so) before fossil fuel energy use starts to decrease. due to lack of demand for fossil fuel energy.
For the World real GDP grewe at an average rate of about 2.8% per year from 1980 to 2022. High World growth rates from 1945 to 1980 were due to recovery and rebuilding after World War 2 and the Great Depression.
If we consider GDP per capita for the World, the growth rate from 1960 to 1979 was 2.6% per year on average and from 1980 to 2019 it was 1.65% per year on average. As the World becomes wealthier on average growth rates will tend to slow. Population growth will also continue to slow as it has been doing since 1971.
Dennis, oil grew at a rate of 7% per year to 1970, because it was relatively easy to find and despite the TRRC trying to keep a lid on too much supply, there was plenty from around the world.
Oil became cheaper than gas, coal or wood as an energy source. While the world GDP on average did rise, there were still 80% in abject poverty, relative to western lifestyles. The growth rate did not fall because the world was wealthier, it fell because oil was still cheap and the easy to find and develop stuff had been found and developed. EROEI started to rise..
Western lifestyles were at there peak at the end of the cheap oil phase in the early 70’s. In this country a man on an average/median wage (they were around the same back then), could buy an average house, have an at home wife, 4-5 kids and still afford annual holidays, boat and/or caravan etc. The house only took a decade to pay off as well. Now 50 odd years later, it takes a 2 income couple with no kids to pay off a mortgage on a below average house on average earnings (which are way above median earnings), over a much longer time period…
Average GDP per capita is higher because it’s concentrated in the top 1% in 2023. The wealth exists on paper, meanwhile the world is in deep debt paying for everything pulling future resource use into the present.
Solar, wind and nuclear are struggling because of high interest rates, making the economics much worse. Offshore wind cancellations, SMR cancellations, large solar projects just not being planned anymore (in this country), because of negative pricing when the sun shines and wind blows. Theoretical capacity factors of 37% becoming actual 24% further destroying economics.
Oil, coal and gas discoveries have made individuals, companies and countries wildly wealthy relative to others. Can you name any that have become wildly wealthy from the energy provided by solar, wind or nuclear??? I don’t know of any. It tells you everything you need to know about the economics and energy return. It’s just not there…
“Population growth will continue to slow”… So what? It needed to be negative decades ago to provide a world in the future, worth living in. We have been destroying the environment at an increasing rate by destroying forests and habitat to graze domesticated animals and grow crops on for centuries, and now the burning of fossil fuels are catching up with massive changes to climate which will accelerate the decline of the overall environment.
Everything about the ‘transition’ is an illusion. It’s all based on fossil fuels being increasingly used to mine ever lower grades of ore to build out everything, which requires more energy than in the past for the same production. It requires more building of processing plants, smelters and factories, for the ‘growth’ of all the transition goods..
The mining, processing, smelting and factories all have to be built creating the raw materials needed to put together a solar panel or wind turbine, so a lot of the energy cost is upfront, all done with FFs.
The ‘reserves’ of the minerals are nowhere near enough for the transition and the claimed reserves by USGS often don’t exist. The one country I bothered to look into detail of USGS reserves being Australia, only has 25% of the claimed reserves. I wonder if every other country is similar.
It is debt, that is now getting hard to service that has kept our civilization going as long as it has, with promises of a bright future from a simple transition spread to keep the masses relatively happy. Meanwhile people are slowly waking up to how much worse off they are already compared to their parents and grand parents for the young…
Some people are better off, the average GDP or whatever not telling the real story as the EROEI continues to fall.
Any energy generating plant that has a LCOE more than a tenth of what current common energy production units are, (EG oil currently $47/Mwh) are not compatible with a modern civilization for anything other than the very few wealthy.
At some point though the population will rebel against the increasingly fewer wealthy, and/or leaders get elected promising to take action against the wealth of someone else to make people his/her supporters) better off. It could be the wealthy, a minority, or the neighbouring country/countries, history is replete with examples.
Once the production rates of oil fall, with an accelerating rate, the investments for renewables and nuclear, batteries will dry up, they will become unaffordable to most. I’ts obviously because they totally rely on oil for mining and transport, then use coal and gas in manufacture which also rely upon oil for their production..
We live in an extremely complex system with many feedback loops affecting all types of investments, building and supplies of everything. Problems are relatively easy to overcome when there is more of everything from increasing fossil fuel availability, but once in severe decline cascade failures from negative feedback loops will effect everything imaginable and some you wont see coming..
Hideaway,
The growth rate was high from 1945 to 1970 because the World was rebuilding after the destruction of World War 2, poverty is a problem which is likely to continue, more equitable distribution of wealth could in theory be addresses with tax policy, but the wealthy have great influence in government and in some nations (such as the US) are permitted to buy elections with unlimited spending so I am not hopeful that things will improve (in the US things have become much worse since major tax reform reducing taxes on the wealthy under Ronald Reagan.
Note that in the past energy use was much less efficient, fossil fuel typically only converts about 30% of the energy to work, a system using electric power produced by wind and solar does much better (likely 2.5 times better).
In my nation, most people paid of a home mortgage over 30 years in the 70s and earlier and the average home was much smaller back then than it is today. For the US real GDP per capita grew at 1.8% per year from 1970 to 2022. For China real GDP per capita grew by 7.4% per year over the same period. Wealthy nations grow more slowly than less wealthy nations.
https://fred.stlouisfed.org/series/A939RX0Q048SBEA#0
https://fred.stlouisfed.org/series/NYGDPPCAPKDCHN
As fossil fuel becomes short in supply prices rise and humans adjust. Goods and people can be moved using electricity (both EVs and electric rail) as oil becomes expensive. As prices rise more supply will be available (compared to a lower oil price scenario) and demand for oil will fall.
Fossil fuel consumption (sum of oil, gas, and coal) grew at about 4% per year from 1965 to 1979, at about 1.9% per year from 1982 to 2010 and at about 1% per year from 2011 to 2019. From 2018 to 2022 the growth rate in fossil fuel consumption has been about 0.3% per year on average.
Data from https://www.energyinst.org/statistical-review
Dennis ….. “The growth rate was high from 1945 to 1970 because the World was rebuilding after the destruction of World War 2”
So totally ignoring the other 80% of the world is OK by you. The reality is that whether it’s re-building or just building it takes a lot of energy, energy we didn’t have after the growth of oil stopped being exponential in nature around 1970-3.
If there was plenty of energy then the growth could have continued unabated until the rest of the world had caught up.
Dennis…. “Note that in the past energy use was much less efficient, fossil fuel typically only converts about 30% of the energy to work, a system using electric power produced by wind and solar does much better (likely 2.5 times better).”
This is the biggest lie stated by the entire renewables and nuclear industry, not because it’s untrue, but they miss out the biggest part of the picture… It ignores all the products which directly come from fossil fuels which would have to be made by electricity. It ignores all the storage needed with renewables, much larger and longer transmission systems, it ignores long distance travel by planes and ships.
So what is the efficiency of making synthetic fuels using electricity and carbon capture from atmosphere for plastics, fertilizer, bitumen, coking coal and cement?? Make sure to include all the energy that goes into the equipment like electrolyzers and the mining for the raw minerals, plus the processing plants for those minerals, plus, plus, plus…
EVs wont move without plastic contents, which are not recyclable for original use….
What happened when fossil fuel use declined below 4% again?? Debt blew out across the world. Our economic games created money out of thin air in the form of debt to drag future use of resources, the easier stuff into the present, because the energy component of the cost was too high to do it out of present cash flow. The growing level of debt, even if it is to ourselves overall, still has a cost in interest that isn’t borrowed into existence, so becomes a larger percent of the overall cost of the system…
Do you think it’s only a coincidence that right around when growth in fossil fuels slowed, the EROEI of those fossil fuels also started to go down, that debt went up and economic growth went down, while those in poverty were kept in poverty by the lack of growth??
Hideaway,
The fact is that wealthy nations grow more slowly than less developed nations, as the World becomes wealthier on average growth will slow.
In most developed nations, HV transmission network is already in place. Note that fossil fuel could continue to be utilized for petrochemical inputs, ships can be powered with natural gas, wind, or nuclear and air travel could be reduced or eliminated, it is not a requirement for human existence.
Average annual growth rates for real GDP per capita from World Bank has high income nations at 2.7% per year from 2000 to 2022 and for low and middle income nations the average annual growth rate for real GDP per capita was 7.65% per year.
https://data.worldbank.org/indicator/NY.GDP.PCAP.KD?locations=XO&view=chart
Also EROEI of wind and solar at point of use are better than for oil and natural gas.
See
https://www.mdpi.com/2071-1050/14/12/7098
Hideaway
You are wasting your time trying to open the eyes of Dennis.
He is blinded by his learning of old economic thinking that is already showing itself to be based on classroom theory and not real world experience.
You will notice he uses things like GDP per capita, which is the biggest distortion of what is really happening in the world.
For the poorest 20% in the US their household purchasing power has declined over the last 30 years. Working in the same jobs they must work overtime just to buy what they did 30 years ago working 37 hours per week. Most middle income families are no better off.
https://www.pewresearch.org/social-trends/2020/01/09/trends-in-income-and-wealth-inequality/
The richest 0.1% people have a total wealth of over 18 trillion dollars, while 50% have only 3.6 trillion.
https://www.federalreserve.gov/releases/z1/dataviz/dfa/distribute/table/
You will notice Dennis never talking about the Gini coefficient because he simply doesn’t understand how it actually relates to real people.
You are correct the best time for poorer people was when oil and food was cheap. That time has gone.
Also Dennis has not got a clue of the cost of electricity storage he says mindless things like storage is getting cheaper. Cheaper than what?
There is no one so blind than a rich man who can afford food and electricity no matter the cost. Today people in so called rich countries are dying because they can’t.
Charles,
Yes there is wealth inequality in the US which I am well aware of, and I am aware of the shortcomings of mainstream economics, in some places in Europe wealth inequality is far less than in the US. I advocate for a highly progressive tax code with no special treatment for the income of the wealthy class (dividends and capital gains are taxed at lower rates in the US than wage and salary income). I also favor high tax rates on the wealthy as was the case from 1932 to 1981 in the US which tends to reduce wealth inequality.
I agree median income is a better measure than the average. For the US real median personal income (income per person) rose at about 1.03% per year on average from 1982 to 2022 while real GDP per capita (which is average income per person) rose at 1.64% over the same period due to increasing wealth inequality, much of this was due to changes in the US tax code after 1981, with top rates on income reduced from 70% in 1981 (from 1944 to 1963 the top rate was over 90% for wage and salary income) down to 28% by 1990, it has since increased to about 39.6% for the top income bracket.
Wealth inequality is improved with tax code and social safety net and the US does a very poor job of this, My one vote cannot change the political landscape in the US.
The GINI index is a national index, I usually look at the World as a whole and the GINI Index is not available at the World level.
Comparing UK with US, the GINI index is much better in the UK (32.8 in 2019 and 27.4 in 1979) than the US (41.5 in 2019 and 34.8 in 1979) a lower number means less income inequality. Part of this is a far better social safety net in the UK, I am not familiar with tax policy in the UK.
Dennis, respectfully, outside of people with real physical or mental issues…. wealth inequality is truly helped by education, desire, tenacity, hard work and maybe a little luck. Many billionaires started with very little and yet achieved great financial success. Social programs tend to get people hooked on free money, risking the lazy syndrome to kick in.
But really a discussion for off topic…
Gungagalonga,
Wealth inequality, has more to do with the advantages wealth gives people to accumulate more wealth. Tax policy and social safety nets have a powerful influence on a more equal distribution of income. It has very little to do with innate talent and hard work. The wealth distribution in much more equal in most European nations than the United States and this is mostly a reflection of differences in government policy between nations.
The US is very backward in this regard, that’s why we have amongst the lowest average life expectancy of high income nations and one of the most unequal distributions of income.
We could do much better, but alas many people in the US believe in the myth that the laissez faire economy results in the optimum outcome.
Dennis
For every dollar of GDP growth since 2008 has been accompanied by 3 dollars of debt. And the rate of GDP growth is less than the rate of inflation. We can easily argue that present GDP growth is an artifact of inflation. And not a very good one since they should at least be equal. Solar and wind projects are being cancelled because even with subsidies they’re not economically viable and particularly wind is learning that it has engineering and maintenance limits. All the while interestingly lithium prices have collapsed. Which sounds like a good thing unless you’re a lithium mining company who built out the operation on higher prices and lower interest rates. And what happened to demand?
When we publish chart after chart based on future assumptions the moon is the limit. URR will be what it will be but projections based on future guesses are well guesses. Might as well pull numbers out of a hat. 2000, 3000, why not 10,000.
What are we seeing actually happening? SPR is drawn down Cushing is drawn down Russia and Saudis are “limiting “ exports. Prices aren’t rising. Diesel demand is falling and dollars are in short supply globally. Bankruptcies are rising wars are increasing migrants are flooding over national boundaries around the world. Retailer are closing stores because of theft including fast food chains. The city’s of the future are refugee camps that are now multigenerational.
These things don’t happen unless the system is under extreme pressure in the real economy not the financial fantasy economy that the government projects. When a ship is sinking who are the first to know? The rats. When you see rats abandon ship it’s time to abandon ship. Those living at the lower levels of this enormous dissipative structure called the global economy are the first to recognize the problem and do something about it. The Marie Antoinnette set are still holding on the their techno green utopian dreams.
The narrative of flying cars and energy too cheap to meter and the like were fantasies to keep the serfs inline. All the while their pensions were pillaged by an economic system built on infinite growth on a finite planet. Things that are impossible are, well, impossible. And there are no particularly bad characters behind the scenes or in front of the screens they’re all bad actors because that’s all they are. They’re acting as if they’re able to make a deference and they never could.
Resources and the access to them drive economic development and nothing else. When resources decline you have to shift to where they still exist by negotiation or war from an individual level in the case migration or national level in the case of the US proxy war with Russia.
JT,
The metric I used is real GDP per capita which adjusts for inflation. So no we cannot argue that real GDP groeth is due to inflation. At the World level there is no net debt as long as we don’t have any interplanetary debt. For every finanial liability in the World there is an offsetting financial asset, in short debt is money owed to ourselves. There have always been problems in the World, I expect this will continue for a long time.
My resource estimates are based on the research of others, the USGS estimated conventional oil resources (crude plus condensate from non-continuous oil reservoirs) for the World at about 3000 Gb in 2000, Laherrere et al estimated about 3500 Gb for total World C plus C resources (includes continuous resources) in 2022, my estimate is about 2660 Gb.
Prices of resources will rise and fall based on market conditions (rising when the market believes the resource is in short supply and rising when the matket thinks there is an over supply.
From an EROEI perspective wind and solar at point of use are as cheap as coal.
See https://www.mdpi.com/2071-1050/14/12/7098
Except coal is dispatchable Dennis. You burn it when you want. The wind blows when it wants.
That simple fact is lost to those living with mortal fear of carbon dioxide.
Feel free to ignore depletion, and global warming, and election results.
Its what you do.
C185 pilot,
Coal is expensive, and climate change is a problem, also coal will become more and more expensive as it depletes.
See https://history.aip.org/climate/index.htm
Except coal is dispatchable
Depends on the fleet. Traditionally, coal plants are not built to react quickly to changing demand. Instead they are designed to generate a steady “base load”, regardless of real demand.
The term “dispatchable” can be pretty misleading. especially considering how old the fleet has become in rich countries.
Your’s is an exceptionally evocative paper, sir.
One nice thing about inflation is that it reduces the value of outstanding debt. If I have $100 in debt and inflation is 5%, then a year later that debt is worth 5% less. And societies that have experienced hyperinflation are essentially debt free. It’s not a great trade-off, since savings vanish as well, but it’s true.
The Maoists also demonstrated this in the 1930s and 1940s. Rural China had gone though a horrible period starting roughly with the silting up of the Grand Canal in 1848. The population crashed, and the surviving farmers had been reduced to debt slaves. It was common for farmers to being paying debts so slowly that it would take a century to pay them off, and debt was inherited. They often lost their land when they couldn’t make payments but weren’t allowed to leave the village.
The Maoists, on the run from the Nationalists and the Japanese, would curry local support by marching into the village, seizing the municipal building where records were kept, and burning all the records of debt and land ownership. Problem solved. Rural debt simply vanished in their trail and the peasants cheered. Again, not a great trade-off, considering the insane excesses of Mao’s reign, but an excellent demonstration that debt is a social construct only vaguely connected to physical reality.
I don’t see how it makes sense to claim debt is directly connected to energy and that inflation is real, unless you assume the real value of energy is falling. If energy is the basis of debt and money, then energy shortages should lead to massive deflation and increasing debt. If currency is simply government fiat(or more realistically, manipulation), then it would lead to inflation and decreasing real value of debt. But I don’t see a scenario with increasing inflation and increasing outstanding debt being triggered by energy shortages.
I have a feeling that some very powerful people may take umbrage at debt vanishing and may even have something to say about it.
Above the numbers are real GDP per capita from
https://fred.stlouisfed.org/series/A939RX0Q048SBEA#0
From 1947 to 1979 average annual growth in world real GDP per capita was 2.36% per year, from 1980 to 2008 average annual growth in real GDP per capita was 2.10% per year. From 2009 to 2019 the average annual growth in real GDP per capita was 1.60% per year, as less developed nations grow their rate of growth slows so we expect World annual growth rates in real GDP per capita to fall over time.
Another way to look at real GDP per capita growth rates is to look at the natural log of world real GDP per capita, there is a clear break in the data around 2008/2009. The average annual rate of growth in world real GDP per capita from 1947 to 2007 was 2.19% per year, and from 2009 to 2022 (dropping the 2020 pandemic data point which is an outlier) world real GDP per capita annual growth rate was 1.62% per year.
Note for those not paying attention. In 2008/2009 there was the Worst Global recession since the 1930s, followed in 2020 by a worse recession than the 2008/2009 episode, the claim is that the GFC had something to do with high oil prices, but oil prices were high from 2011 to 2014 with little ill effect on the World economy so the claim that the GFC was caused by high oil prices seems dubious. The more likely cause was poor regulation of the Global financial system from 1980 to 2008 which eventually led to the GFC. The slowdown in global real GDP per capita after 2009 is likely a good thing for the planet from an environmental perspective.
JT,can’t argue with that.
I’m going to state the obvious. Why would anyone invest in shale oil or renewables or nuclear when the risk free return of government debt is 5%? And you can actually use leverage to make outsized returns on risk free returns?
Until conditions force interest rates back to near zero where is the money going to come from? Shale oil now has to compete with government debt for dollars.
While I totally expect interest rates to go back to near zero over time. The conditions required to get them back to zero are not oil price positive. They are actually very negative for oil prices.
So less capital available to oil ultimately means less oil supply. One would assume higher prices right? But I think oil prices have to go much lower to open up capital via low interest rates.
How do you lever those returns when the yieldcurve is inverted? What capital is cheap enough to make that work?
Rgds
Banks can’t make money by borrowing on short end and lending on the long end but that doesn’t mean other entities can’t take a treasury bond or MBS and go into REPO market and borrow funds to purchase government debt yielding a risk free 5%
US government debt is extremely attractive right now. And since borrowing dollars in Eurodollar market requires collateral why not hold US debt? You have to have dollars to operate on global scale.
That’s just how it is. Here lately Euro’s and Yen have become less transacted in globally. Which are the two runners up to the dollar on a global scale. So dollar has become more reinforced as global reserve currency as of late.
But if we see interest rates spike in REPO due to say insufficient collateral. Price of oil is going to implode. Because that’s where the leverage is created and used to borrow the dollars needed to drive oil prices higher.
Remember back in 2018 when interest rates in the REPO market spiked to 10% basically overnight? In response FED immediately dropped rates to zero and did QE but said it wasn’t QE. I don’t think their response matter one iota as they don’t set rates in REPO but they have to react. Anyway I think something similar maybe worse is likely to happen in REPO market within the year or so.
Banks have tightened lending standards. As property values fall both commercial and residential real estate backed securities will fall in value. Which are used on a large scale to borrow funds via REPO.
My question still remains – Where can I borrow at a rate less than what treasuries are yielding?
Rgds
Vince
Sunday morning musings on oil and world energy by a lifelong energy watcher:
If the world doesn’t have adequate energy it will most likely devolve into chaos, fear and anger. In a word, war. And any nation that develops inadequate energy will fall behind; that age-old experiment has recently been substantiated in Germany. The planet suffers from a crisis of expertise; it needs an energy guru.
We are in the middle of one of the silliest transitions imaginable. Wind projects are untenable outside high-velocity wind tunnels (like the one through Texas, Oklahoma and Kansas, on up into Wyoming). Solar has a different problem–the panels are made in China using low-quality coal. Even the EV’s pose a problem: due to the battery they weigh between 2 & 3 tons, eating up the roads. Ask the UK: they now have established a 9B pound pothole fund–and seem to have been unaware that macadam is manufactured from bitumen; at an API of 8-10 the heaviest (and frequently the dirtiest) of the oil hydrocarbons. In the U.S. road taxes are hooked to gasoline, so the ICE drivers are subsidizing the EV drivers–which won’t stand forever.
Nuclear has been the answer for a very long time. It is clean and about the only carbon footprint comes from the vast amount of concrete in building a plant, harvesting ore and developing yellow cake. There is plenty of uranium; we certainly know how to enrich it. The safest way to power the utility plants that are already in place would be with SMR’s, which if fast-tracked could be developed, along with the fuel source, in very short order.
People may have to come right up against the inconvenient truth of the energy formula. Right now there are too many idealistic untruths being promulgated, too much silly money going into untenable projects. As that transpires, LTO exportation is moving steadily along, connate water is distorting Ghawar, and the only exciting new discoveries are Guyana and the coast of Africa. There are the fabulous Brazil pre-salts, of course. That oil is pristine but getting to it is a very expensive, hazardous endeavor. We’ll treasure the pre-salt oil so much some day that it’ll be worth going after in great quantity. All in all there should be plenty of hydrocarbons to use for necessary petrochemical production if power plant electricity were generated by nuclear.
BUT, in order to get from A (a terrible, untenable situation) to Z (what I’ve outlined), we need to switch from inelastic to elastic hydrocarbon pricing–perhaps tying the price of oil to a linchpin, like say core inflation (similar to lending rates tied to the Libor). We can’t continue to see individuals and companies pour billions into a project only to experience a dump in pricing down to $20/barrel, then, when the project is bankrupt and supply is pinched, experience a moonshot to $150/bll. Regulation? Probably if it can be done without corruption, but if the TRRC fails to regulate unheralded venting and flaring of methane gas into the troposphere, it is hard to imagine the regulation of production and exportation of hydrocarbons on a broad scale.
There are a few energy experts out there with Big World ideas and a pragmatic thought process. It would probably take a board. And there’s where it all goes to S#*t! Show me the money!
‘LNG export capacity from North America is likely to more than double through 2027’ !!!- EIA
We expect North America’s liquefied natural gas (LNG) export capacity to expand to 24.3 billion cubic feet per day (Bcf/d) from 11.4 Bcf/d today as Mexico and Canada place their first LNG export terminals into service and the United States adds to its existing LNG capacity. By the end of 2027, we estimate LNG export capacity will grow by 1.1 Bcf/d in Mexico, 2.1 Bcf/d in Canada, and 9.7 Bcf/d in the United States from a total of 10 new projects across the three countries.
https://www.eia.gov/todayinenergy/detail.php?id=60944
Hickory,
Yes we are under the illusion that natural gas is plentiful, many of these projects will never pay out unless the US reduces natural gas consumption to zero in order to have enough natural gas for export. We should really slow down on the rush to export all of out energy resources, it is not smart policy.
For this coming 10-15 years it will be a mad rush to use up Nat Gas as quickly as we can.
‘Slow and steady’ is not a method of conduct we are familiar with.
Mr. Coyne: “We should really slow down on the rush to export all of out energy resources, it is not smart policy.”
If you own natural gas, what are you to do with it, Mr. Coyne? On a daily basis the administration, including the Energy Secretary, takes potshots at fossil fuels, highlighting, by the way, NG. They threaten to shut it down, and along those lines have blocked pipelines that would take NG from the wellhead to where it is needed in the United States of America. So, given that political backdrop, is the owner of natural gas property supposed to just sit there and go bankrupt? I actually do own quite a bit of natural gas, and I want it out of the ground and sold before the very leader of the free world blocks it, and I want as much as possible run through an LNG train and put on a tanker, before he also shuts that down. I’m just curious here, what would be the game plan for making a living and also saving some for the future? With the administration blocking NG cooking stoves, when do you suppose they’ll block NG altogether?
Mr Maddoux,
I agree with Mr Shellman that exporting our energy resources as quickly as possible is a poor policy decision. There is lots of drilling for natural gas which could be slowed down to conserve for future use.
My suggestion is to not increase the LNG export capacity any further.
That’s not an answer.
Does the owner of NG get reimbursed when the federal government prevails and shuts it down?
Who is the arbiter of production and shipping?
And while millions of tons of coal with a GHG # twice that of NG is burned by china of course but also (last winter) by Europe.
Lots of criticism, shy on solutions.
Gerry, you have called for an ‘energy guru’ to make policy. If this country had such a thing- [wise longterm energy policy]- then nat gas and oil would be regulated to keep steady production out into the future rather than to use it all up quick.
But I seriously doubt that any such regulation is in the cards.
I won’t pretend to have any good idea for how an individual such as you should handle their holdings.
Gerry Maddoux,
Nobody except you has suggested shutting down natural gas production, don’t ascribe something to me which I do not agree with. I think exporting our energy resources may be a bad idea, for all of the reasons that Mr Shellman has given more eloquently, than I have done.
One example at this link and read Mike’s comments where he expounds further.
https://www.oilystuff.com/single-post/the-case-against-us-oil-exports
I did not always agree with this and used to advocate for free markets, but in some cases that may not be the best policy.
The US banned crude oil exports for 40 years, I am not suggesting a ban on natural gas exports, just slowing down the approval of new LNG export facilities (those that have not begun construction). Production is decided by the producer, just as when there was a crude export ban, individual producers made production decisions based on the market conditions.
I guess you are not a fan of Mr Shellman’s suggestion that reducing energy exports is a good idea. What he suggests makes sense to me. The US government (FERC) can decide which export facilities get approved which has been the case for years.
Also consider the following chart for a future shale natural gas output curve for the US (most recent growth in US natural gas has been from shale gas). The peak is around 2033 at 110 BCF/d with an assumed URR of about 1200 TCF for shale gas. The LNG export facilities have about a 30 year life, for those built by 2025 they would plan to operate until 2055 (at which point output will be about 20 BCF/d. If the 10 BCF/d of expanded export capacity get built adding to the current 20 BCF/d that gets exported we would be at 30 BCF/d by 2027 and by 2052 there would not be enough production to fulfill export needs, unless US consumption of natural gas falls to zero by then. In August 2023 the US consumed about 86 BCF/d.
Not clear we can get to zero consumption by 2052.
Also I would not suggest investing in these LNG export facilities, the excess capacity by 2042 at LNG export facilities will result in many bankruptcies, probably once the peak in 2033 becomes clear.
Gerry were you involved in this before 2015? If you produced any oil was there reimbursement because you could not export your crude oil?
I am not in the business, but am not aware of any such reimbursement to crude oil producers from 1975 to 2015 when crude oil exports were not allowed. Perhaps I missed it.
Revised Shale gas scenario URR=1480 TCF (previous scenario was 1200 TCF), reality may be somewhere between these two scenarios, maybe 1340 TCF URR for continuous gas resources in US (includes shale gas, tight gas, and coalbed methane resources).
For this scenario the peak is about 125 BCF/d in 2035.
Dennis, slowing down natural gas production (or oil) can’t happen in the USA… private mineral ownership rules. Holding back production and development merely for a possible unknown future need that isn’t guaranteed is not going to happen. We are free to develop (or have developed) our privately owned mineral interests as we see fit and when we see fit.
As I have told Mr. Shellman, this discussion of slowing down O&G mineral development in the USA is only good for a conceptual discussion. We are a capitalist society with free markets. The Federal government could slow things down on their mineral acreage, but the majority of the US mineral ownership is private US citizens that will benefit from developing at a pace responsive to market conditions… and those minerals will be developed as market conditions allow, not brutalized by government shutdowns. So, slowing down production for a prognosticated future is not going to happen in the USA. Nor should it.
Gungagalonga,
The US did not allow exports of crude oil from 1975 to 2015 and it was a mistake to repeal that ban in 2015. It would be perfectly legal for the US to reinstate that ban and add natural gas and even coal to the export ban for national security reasons.
Then the resources could be privately developed as owners wish.
The natural gas export ban would not be fair to those who have already invested in LNG facilities so the best option would be to not allow any future LNG facilities to begin construction after Jan 1, 2024 and also not allow any expansion to existing facilities that have not already been approved by FERC, at least there would be less future growth in natural gas exports than with current policy.
I disagree that draining the US of its energy resources as quickly as possible is wise policy. US legislators were wise enough to see this in 1975, maybe Mr Shellman can convince others. I would love for him to lay out his case here at peakoilbarrel, but he has declined.
A smart investor would not touch these future LNG projects with a ten foot pole, they will fail badly as natural gas peaks in the US as the decline may well be faster than any reduction in natural gas demand and US shale gas will be too expensive to be profitable on the World LNG market.
Untrue, actually. Google “proration,” “allocation,” old rules on GOR tests of individual wells and the history of the TRRC.
The Texas Natural Resource Code is part of our State’s Constitution and the law. It mandates the prevention of resource waste, conservation of natural resources, preservation of bottom hole pressure to maximize recovery rates and the protection of the correlative rights of other parties affected by mineral extraction issues. Those laws are written for ALL Texans, not just mineral owners.
Three individuals elected to the TRRC every six years have taken it upon themselves to ignore those laws entirely. All of that happened with the beginning of the tight oil phenomena in 2008-2010. One the many results of that has been flaring and 10% recovery rates of tight oil in place.
American companies have spent trillions of dollars to develop other countries hydrocarbons over the past century only to get run out of that country when nationalization occured, everything lost. Nothing in life is a done deal.
Mineral ownership in America is a privilege, not a right. The privilege belongs to very few, actually. That ownership IS subject to risks; if the TRRC, for instance, was to get its head out of its ass and be forced to adhere to existing laws, to save what’s left of our country’s valuable resources, production could slow down any number of ways. And should.
But it won’t. Money and personal greed in America now takes precedence over our country. We’re on a mission from God to drain ourselves dry, ASAP.
Thanks Mike.
Hello Dennis, I never said we should drain “as quickly as possible”, I just support free markets responding to demand by delivering supply as it is needed in the framework of reasonable regulation on production to minimize waste, etc. It’s never perfect as we overshoot and undershoot, but free markets are better than government control mechanisms.
I wonder if Morocco should stop exports of phosphate as they will need it all eventually, likewise for various other commodities that some countries control the lion’s share of, like say Brazil banning niobium exports.
The world has been a relatively peaceful place since the mostly free trading of commodities has happened. Restricting something that another country needs is one of the easiest ways to start hot wars, anyone remember Japan around 1941 and their lack of access to oil..
Dennis if you believe that Natural gas/oil is so important for the future of The USA, then you really don’t believe that renewables are able to substitute for all FFs at all…
Gungalonga,
I also think well regulated free markets work fairly well for allocating scarce resources. Note that behind this “optimal allocation of scarce resources” meme is a theory that assumes a perfectly competitive market where goods are traded at market clearing prices which are known to all. Such a world only exists in Microeconomics textbooks, it is very far from reality.
The system as it exists in Northern Europe where many externalities (both positive and negative) are fairly well addressed by governments in those nations is probably about as good as humans have come up with so far.
Hideaway,
Nations are free to choose which goods are traded without regulation, many nations tightly control their trade in military hardware for example and the US restricted crude oil exports from 1975 to 2015. For a time I argued that that free trade was best for oil and natural gas, but have been persuaded by arguments made by Mr Shellman.
This is a hedge on non-fossil fuel energy not being able to ramp up as fast as I believe is possible. I do not claim ominiscience nor clairvoyance, in fact the odds of anyone predicting the future are very close to zero. If I create any single scenario of the future out of a set of possible future scenarios that is infinite, the odds that I have chosen the correct scenario is one divided by infinity, which is zero.
The banning of natural gas stoves is just a way of torturing the general public. Gas stoves are the most efficient way of using natural gas – 90% of the heat generated goes into the cooking utensil. If you burnt natural gas in a turbine to make power then possibly 35% of the contained energy of the gas might make it to the cooking utensil after transmission losses.
Only about 28 to 34% of the energy of the natural gas ends up in the pot based on this piece
https://www.treehugger.com/induction-vs-gas-cooktop-5498617
and
https://doi.org/10.1016/j.applthermaleng.2015.10.061
Hickory;
I am 100% in agreement that oil and natural gas world production will peak in the not to distant future. I have yet to be convinced that building a system to provide the worlds energy needs based first and foremost on carbon dioxide emissions will matter one iota to the weather we experience. Since the dawn of time the climate and weather have been in constant flux. Humans can dam the rivers feeding the Aral Sea which has completely change the weather downwind of the dried up sea. As of now, all that I read is, coulds and mights. No predictions made about climate change have occurred.
Ervin,
The predictions have been pretty good when you adjust for actual emissions. See
https://www.realclimate.org/index.php/archives/2018/06/30-years-after-hansens-testimony/
Denis,
check the charts in page 13:
https://aspofrance.files.wordpress.com/2021/02/cop21commitmentsin2021.pdf
The IIASA might be good at many things, but predictions does not seem to be one of them.
Luis,
The IIASA scenarios are simply scenarios based on different estimates of resources and historical rates of emissions. Did you read the real climate piece? It is based on actual emissions of greenhouse gases from 1984 to 2018 (the time the piece was written) and how Hansen’s scenarios A, B, and C from simulations that were run in 1984.
Nobody can accurately predict future emissions, but it turns out that Hansen’s scenario B was fairly accurate when we adjust for actual forcings from anthropogenic emissions over the 1984 to 2018 period.
Chart below from real climate post from 2018 linked in earlier comment.
” I have yet to be convinced”
Ervin, you simply don’t want to believe the science, the data
and therefore you won’t. You are not alone.
The day that you become convinced of combustion related global warming
we will almost out of things to burn.
Half-life of CO2 in the atmosphere is right about 120 years.
Its piling up.
Ervin, I recommend you to read about Svante Ahrenius, one of the first Nobel prize winners, about his research on CO2 and it´s heat capturing features, from the late 1800s…
https://en.wikipedia.org/wiki/Svante_Arrhenius
Hickory,
The half-life is short, but the tail is very long, the mean lifetime of anthropogenic CO2 released into the atmosphere from burning fossil fuel is about 35 thousand years. See
https://geosci.uchicago.edu/~archer/reprints/archer.2005.fate_co2.pdf
At the end Archer says:
A better approximation of the lifetime of fossil fuel CO 2 for public discussion might be ‘‘300 years, plus 25% that lasts forever.”
In other words if we release 1500 Pg of Carbon about 1125 Pg will be sequestered in 300 years and the rest of the carbon about 375 Pg will remain in the atmosphere for 30 thousand years or more, the tail is very long.
You probably know this, but I imagine others do not.
Hickory
This is one of many examples that makes me skeptical. Look at the carbon dioxide levels measured at the Mauna Loa observatory for 2020 and 2021 and even thought the use of fossil fuels dropped by 20% or so for the spring and summer of 2020 due to Covid, I cannot see any change whatever in the measurements trend. One more. In the 1980s we were warned of Arctic ice free summers. It’s now 2023 and the ice melt ended with nearly 5000 cubic kilometers of ice. Maybe next summer?
Ervin,
The Global Carbon cycle is complex. You need to dig a little deeper.
Try
https://press.princeton.edu/books/paperback/9780691144146/the-global-carbon-cycle
Maybe you can find it a University Library or check your local library.
Ervin … In late 2019 into 2020 there were massive bushfires in Australia burning over 240,000 km2. This released massive amounts of CO2 into the atmosphere, which would take time to reach the recording station at Mauna Loa.
Plus the Chinese coal fleet grew by just on 30Gw.
I’ve always regarded the actual numbers we get from reporting authorities to be a bit rubbery while the real indication of total carbon burnt are the readings from Mauna Loa.
Too many people, both for and against climate change are focused on what is one part of overshoot only. The big issues are resource depletion and denial of overshoot, despite overwhelming evidence for those that care to look..
Ervin- its a good question about the levels of CO2 and Covid. But you don’t have to get too deep into the complexities to understand why/how it is as it is.
The Keeling curve- https://keelingcurve.ucsd.edu/ (look at the 1700-present chart)
doesn’t show a downtrend or even flattening during the Covid years, despite a big downturn in economic activity and global combustion.
This is because the measurement of CO2 in the atmosphere shown is an accumulation curve, with CO2 that came out of the tailpipe of the very first Ford Model A still about 1/2 in the atmosphere as represented on the chart. [The atmospheric 1/2 life of CO2 is about 120 years]
So even though global emissions dropped in the range of 5-10% during the pandemic compared to 2019, you were still adding a huge amount of CO2 to the accumulation totals in those pandemic years (similar in amount to the then record levels of year 2016).
It would take a long sustained time of lower emissions to show up in the rapidly climbing curve.
To Mr. Coyne:
Contrarily, I’m a very big fan of Mike Shellman; if fact, I believe him to be the quintessential man, a gentleman of principle and a fellow who has learned the nuts and bolts of the industry from the ground up. My comments aren’t an attack on him or his patriotic ideology of preserving domestic assets, but it would take an idiot to be holding oil and gas assets and not be alarmed by the rhetoric of this administration. And for those who might attack me for being partisan I don’t think Mr. Trump is one bit better.
Look, I’m pretty sure the green energy deal is going to fall, ingloriously, on its rare earth elemental ass. It just doesn’t add up. Getting REE’s out of the earth takes a lot of earth-moving. The batteries are heavy and the heavier cars are going to eat up the macadam. Wind projects are going down daily, all over the world. I’m a big fan of nuclear, but it’s not the favorite toy of the politicians. We’re going to need oil and gas for many decades. What really sticks in my craw is that instead of trying to construct a phase-in of green, the administration has talked vociferously and openly about trying to shut down fossil fuels, particularly natural gas. The SPR has been treated recklessly before, but not to this degree.
You don’t think there’s a war being waged against natural gas? Boston offloaded Russian LNG a couple of winters ago. They’ll probably have to do it again. I sincerely believe that there will be American brownouts this winter due to lack of pipelines. Not a shortage of NG, but a shortage of pipelines. If we have ample NG and our elected officials decline pipeline buildout, then what should we do with the stuff? I’m not attacking you, Mr. Coyne, as your tone seemed to suggest, I’m merely venting frustration.
Hell, I agree with Mr. Shellman about preserving oil and gas, but if you’ve got a lot of money tied up in it and your own government won’t allow you to move it to the good folks in Boston, or wherever, what should we do with it? Okay, I get it, leave it in the ground. But I can assure you the optics cause this to look a little differently if you’ve got a bunch of this stuff and everything you read is how badly the administration wants to get off of it. The tacit message is that we have a narrow window of opportunity to sell our NG (and oil too).
In America, we don’t have a reasonable energy policy, and we don’t have a great energy czar. That alarms me. For the most existential commodity in the world, as far as driving turbines to produce electricity, we’re choked down by a lack of transport modality. Do I think we should slow down exportation and preserve our precious commodity? Yes. Do I want to go broke because I can’t sell NG to my countrymen? No. Does that make me a bad person? Possibly.
Gerry Maddox, thank you for ALL those kind words. I am flattered.
Ms. Catherine caught a 30 inch Rainbow on a 22 Midge (below an indicator), in S. Colorado just 10 days ago….you’da had a heart attack watching that rodeo. When the guide scooped the pig up I was so stressed I had to immediately go to the bank and find the flask in my pack.
This mineral ownership thing is hard. I used to be one. I never inherited or was given shit in my career; I bought those minerals with what I believed was great risk, and I accepted those risks. It’s a volatile world we live in.
I think it is very different for mineral owners who inherited that from fathers, grandfathers and great grandfathers who labored the land to KEEP those minerals, hoping someday they would be worth something.
Please forgive me, I have little empathy, including for many landmen friends of mine, who bought leases and flipped them with ORRI’s. In my mind, they have no “rights” to have their ORRI’s developed. They need to get a job and consider what they have already been sent, free and clear of all costs, a gift. Lease and mineral flippers can kiss my Texas ass.
I don’t know what the answer is to this issue. I sorta agree with Hickory…its a fucking mess that started in the Carter days when we KNEW, anybody with an cm of cranial capacity knew, we were headed for scarcity problems. We coulda stretched this all out where all your gas would would have been worth a lot more over the years, for your heirs, and America would REALLY be energy independent. In reality we made a shit show out of all of it. Republicans and Democrats alike.
I am old and tend to zero in only on the issue that we are running out of resources. America is great country that is going to need a lot of that stuff; exporting it away is a big mistake, oil and gas alike.
Dennis, thanks for re-posting that article. I stand by every noun in it, 100%. Oil exports, particularly, are the biggest domestic energy policy fuck up in history.
I bought 99% of the minerals that I hold too. But I also have working interest in several of the few conventional oil and gas wells being drilled anew in this country. In fact, my entire investment focus right now is in conventional oil and gas–and it’s not an easy road.
It’s not hard to pick out the black hats in this bunch of cowboys. They’re sit atop the swollen heads of the TRRC and other state oil and gas regulatory board members. There are strict rules (pretty much the same throughout the shale states) that limit the duration of venting and flaring. These has been grotesquely violated, and it flooded the market with NG by-product, and consequently LTO as well.
This is my time to live. Unless there is reincarnation I will have no other. So since I have made these choices I will send my small sluice of hydrocarbons into the giant mix, and some of it will inevitably make its way onto a tanker bound for parts part away. My entire point has been that while there have been repeated comments that we should slow down and preserve domestic production, there have been none regarding regulation. Certainly it would not be the TRRC, who has greenlighted endless flaring.
Our great dereliction in this country–well, one of them–has been the utter failure to seek out a small coterie of men and women who are savvy in energy. Our current Energy Secretary is a political person who is clueless about all of this. The president is clueless. Mr. Trump is clueless. These warnings about exportation of our domestic blessings are meaningless without action, or at least a hint of a suggestion. Because neither I nor any other investor, producer, CEO, etc, is going to voluntarily withhold his contribution from the world market. To do so is financial suicide.
Gerry,
I agree the natural gas flaring rules should be followed and producers should be free to develop resources as they see fit, I think it is bad to flare or otherwise waste Natural gas and also bad policy to expand LNG export terminals and export the gas. I would be in favor of building more natural gas pipelines and repealing the Jones act so that natural gas can be moves to where it is needed in the US, at the same time we can increase capacity of solar, wind, geothermal, hydro and nuclear power to handle the eventual depletion of fossil fuel resources while also improving efficiency in the use of energy by insulating buildings and using heap pump technology for heating of buildings and water.
Other countries, and perhaps the US, will at some point restrict exports of fuels and minerals when supplies get tight…even if they have to nationalize the ownership.
And that is basis of the oddly named ExportLandModel.
Seems inevitable.
If the governments would be honest with green energy, they would start building up a big pipeline network all over the country to transport bio gas and hydrogen to cover shortages.
Think the northwest has 4 weeks of winter storms and lot of wind power, and the midlands calm and fog. And you have to store the stuff, and no, batteries are no way beyond the 24 hour range.
So good old pipe + cavern technology is needed if nuclear and big geothermic is fubar. First for nat gas, later for other things when they ever work. It’s proven to work with hydrogen, too.
Nothing to see here so far.
A German Canadian companies tries to build a dual fluid nuclear reactor at the moment that is build to run on atomic waste. Prototype will be build in Ruanda – less environmental airheads there I think.
Doubleplus good, using waste, and if something goes horrifically wrong, nobody will care.
I´m currently a bit disappointed that no one recognized the amount of doublethink needed in the above post…
Mr. Maddoux,
Note that the administration has little to do with natural gas pipelines being built from Pennsylvannia to New England, the only practical path is through the state of New York and they will not allow it. I am not a lawyer and do not know that there is a way to force New York to allow such a pipeline to be built, I believe (but am likely wrong) that States Rights allow New York to make this determination.
One possibility would be to repeal the Jones Act which would make it easier to transport LNG from one part of the US to another.
I agree the SPR has been handled very badly and the EIA does not seem to understand that resources are limited. it would be nice to have better leadership at the department of energy.
My main issue is that natural gas, like crude oil, is less plentiful than most US citizens are aware of. It would be wise to do as Mr. Shellman has suggested and conserve this resource for future use.
The plan to ramp up non-fossil fuel energy (solar, wind, geothermal, hydro, and nuclear) as quickly as possible is to fill the need for energy as fossil fuel resources deplete. It will take 2 or 3 decades at least.
Dennis, I agree the SPR management has been very badly managed. That was a political tool that may bite us back soon…
However, I do disagree that US “nat gas is less plentiful than most US citizens are aware of”.
I think it’s the opposite…I feel the public is unaware of the Nat Gas bounty we have. We may never burn through it all at any pace the industry can realistically support… at least in my lifetime which I hope is another 40 years. This is why the LNG Export industry is scrambling to build out export capacity… and these aren’t dumb people. Maybe not a guaranteed result on this strategy, but odds are good in my opinion that they can buy relatively cheap US nat gas and sell into Japan, Europe, etc. for a decent margin for quite some time.
It depends on your time frame, of course, but there are thousands and thousands of undrilled high-quality locations in many of the US gas rich plays/basins. Much of this acreage remains unleased even though it offsets high volume proved production. Reason?… No competition as operators have huge undrilled nat gas location inventories already, why pay to lease when they can’t even drill them in time before the lease expires. We are saturated with undrilled locations in East Texas, West Texas, Marcellus, down dip Eagle Ford, Arkoma Basin… the list goes on. So, as mineral owners, we wait for our turn to be leased and it may be decades in some cases… even though we sit on proven acreage.
Meanwhile, new 20,000 MCFGPD wells are still popping up all over the place in new plays like the Deep Bossier in Roberts and Leon Counties, TX, Marcellus, improved Haynesville, etc. Some of these wells are the 0.25 to 1.0 BCF per month type with 25-50 BCF/well type curves. A single of these BCF/month wells can supply all the nat gas for electricity generation demand per day for 30,000 homes probably. Heck, New York State hasn’t even allowed Marcellus/Utica development and has millions of acres of untapped potential if (when) it opens up.
I remember when a 1,000 MCFGPD well was a decent discovery…. now that’s a failure and 10,000 MCFGPD seems to be the expectation. We have plenty of nat gas for decades, even with growing exports. I hope to see $5.00/mcf again someday but probably won’t for more than a month or two.
The market will respond to the demand it is faced with. Banning exports and controlling production is not America…. And I think Trump is a blazing idiot.
I never thought I would be complimenting someone with a name like Gungagalonga, but I agree completely with your very thoughtful post.
Gunga,
I am glad that you chimed in with some comprehensive context regarding US natgas potential.
Years ago – as the Mighty Marcellus was just ramping up – Dennis and I got into a little back and forth regarding Cabot’s EURs. I believe the projected, average EUR was about 4 Bcf (over ~30 years[!!!], mind you) and skepticism was expressed at just how widespread this ‘cherry picking’ of best-in-the-world Susquehannah County rock would prove out over the vast expanse of the Appalachian Basin.
Well, as you certainly know, it is now routine for numerous wells to produce 4 Billion cubic feet in their first 6 months online.
I spent some time earlier today going through the USGS’ site to get their original assessment data going back almost 10 years.
When one sees the diagnostic parameters used (for example, core Marcellus wells – ~150 sq. acres drainage [this equates to 4 5,000 foot long laterals per pad] expected to average ~3 Billion cubic feet over its lifetime!!) knowledgeable observers can see just how low these projections are versus ‘real world’ operations.
The Utica/Point Pleasant and Upper Devonian assessments are even more skewed when seeing the actual production numbers.
Anyone can spend ~10 minutes online and view these USGS assessments … the basis for Dennis’ viewpoint.
When comparing these specs to actual output, (I’m guessing Enno’s site has the production numbers), one can recognize that the US has a century’s worth of natty.
Gar. Own. Teed.
Coffeeguzz, Gungalonga, and Mr, Maddoux,
The USGS assessments will likely be too high rather than too low, the total mean assessment is about 1635 TCF for undiscovered technically recoverable resources.
The USGS also has done assessments on the Permian basin resulting in a TRR of roughly 75 Gb, but it is likely that economically recoverable resources will be around 34 to 42 Gb.
Let’s assume 42 Gb is the better estimate (many would argue that the URR will be closer to my low estimate or that my low estimate is too optimistic). That 42 Gb URR is only 56% of the TRR estimate. If we assume for the continuous gas resources in the US that the URR will be 56% of the TRR (roughly 2085 TCF when we add in 2P reserves plus cumulative production up to Dec 2016) then we get a URR of 1167 TCF (that’s where my 1200 TCF scenario estimate came from I rounded up). An alternative estimate has continuous gas at 1480 TCF which is about 71% of mean TRR.
Also note that if natural gas is as plentiful as you speculate it to be this implies low natural gas prices which would tend to reduce the proportion of the mean TRR that is profitable to produce.
For the higher 1480 TCF URR estimate for “shale gas” resources (really all continuous gas resources including coalbed methane),
if natural gas grows linearly at the annual rate from June 2020 to August 2023 (an annual rate of increase of 4.24 BCF/d) through 2033, then cumulative continuous gas (aka shale gas) output through 2033 would be 634 TCF and would reach 740 TCF by June 2036.
This is about half of the URR and the peak would likely be around this time point. Annual average output in 2036 would be around 125.5 BCF/d for continuous gas with perhaps another 15 BCF/d for conventional natural gas (assumes 4% annual decline for conventional gas) for a total of about 140 BCF/d output in 2036. After that it is all downhill (output will be about 67 BCF/d in 2050).
Also note that lateral lengths have been increasing at about 8% per year, so when we normalize productivity for lateral length there has not been a lot of increase in productivity. Also note that for the average 2020 Pennsylvannia well 6 BCF cumulative is reached at 24 months, though we could probably cherry pick and find a couple of wells that reach 6 BCF at 6 months, those are exceptional wells rather than typical wells.
On USGS assessments, the EURs are low because they have wells with short laterals assumed probably around 5000 feet. If we increase lateral lengths to 15k there will only be enough rock for a third of the number of wells assumed by the USGS and each well might have 3 times the EUR, but the overall TRR is unchanged. Also 3 of the assessment units have very low EUR and will likely never be developed, this drops the mean TRR to about 70 TCF from the reports 93 TCF, also note the F95 TRR for the three best assessment units is only about 30 TCF less than one third of the mean TRR usually quoted. So of we tak the entire US continuous gas assessment and divide by 3 that would be about 540 TCF, add about 450 of 2P reserves and cumulative output and we get a URR of about 1000 TCF, which might be a more realistic number than 1500 TCF.
Chart to go with scenario above
Dennis,
While I hold very different views from you on most hydrocarbon potential issues, I have rarely seen you act with anything other than the utmost integrity.
Good for you.
Knowing that you have primarily focused on oil related topics – not gas – over the years, consider this a potential ‘learning moment’ opportunity should you (or any POB reader, actually) choose to invest merely 5 minutes of your/their time …
1. Google ‘USGS Marcellus Gas Assessment’, published in 2019
2. Click/tap on blue highlighted ‘Report’, a brief, 2 page 984 kb pdf
3. As the Mighty Marcellus is so vast, (these guys ALSO included the Geneseo and Burket!!!), the formation was subdivided into 6 parts
4. In Table 1, simply look at ‘Northern Interior Marcellus’ (this is essentially Susquehannah, Bradford, Tioga, Wyoming, and Sullivan counties) and ‘Southern Interior Marcellus’ (Pennsylvania counties are primarily Greene, Washington, and Allegheny)
5. Now, the parameter per well is 146.7 square acre drainage AND the EUR Calculated Mean is 3.125 Bcf (Northern)/2.093 Bcf (Southern) FOR EACH WELL over its lifetime!
While I use the state production figures (Pennsylvania, Ohio, and West Virginia), any user of Enno’s site should quickly see the perposterous discrepancies between this assessment and reality.
Bonus addendum … the Haynesville/Bossier combo is assessed at 300 Tcf – triple the Marcellus/Geneseo/Burket formations’ value, and the little known, shallower Cotton Valley Formation – at 34 Tcf – is considered about one third the size of the Marcellus assessment.
Make of this what you will, but I strongly lean towards Real World numbers when evaluating situations.
Jes sayin’.
PS,
The 3 and 2 Bcf EURs are for 5,000 foot laterals. Doubling gives 6 and 4 Billion cubic feet over a multi decade lifetime of production.
Dennis’ number above has all Pennsylvania well average at 6 Bcf at 24 months … lottsa years (decades?) still to produce.
While 2 – of the 6 sub units assessed (Southwestern Interior and Eastern Interior) contain a lot of goat pasture over its maximal ~13 million acres (twice the size of Massachusetts), the USGS’ EURs of 2 and 4 Bcf (for normalized 10,000 footers) in these regions has already been surpassed by several older wells using archaic drilling and completion methods.
As Gunga has implied above, if/when $5/$6 in basin prices ever appear, you best believe that much of this vast region will see effective development.
Coffeeguyzz,
Note that abundant natural gas as assumed by you and Gungagalonga and Mr. Maddoux is not really compatible with the assumption of high natural gas prices, either gas is abundant and prices are low or it is not and prices are high, you cannot have it both ways. My guess is natural gas at 3 to 4 dollars per MCF until the peak is reached in 2030 to 2036, then we might see higher natural gas prices if demand for natural gas continues to grow. Note also that the continued expansion of non-fossil fuel energy might result in a lack of demand for natural gas around 2035 or so which does not bode well for natural gas prices and the investment in LNG export facilities which will prove unprofitable over the long run (30 year life of facility). Investors would be wise to see payout in 5 to 10 years and the smart investor will let others take on this high risk.
Dennis,
I agree that U.S. nat gas prices should remain subdued for the forceable future, not sure where I implied otherwise. Supply is too abundant. Absent occasional brief spikes in extreme winter demand, I think low prices will persist… I would be happy with your $3.00-$4.00 estimate!
Like I said before, I hope to see $5 nat gas again, but I know it won’t last there for long. Supply can respond so quick to demand, rallies will likely be extinguished quickly.
Demand will be what it will be and supply will respond as best it can… usually a little late or ahead of itself.
Gungagalonga,
It was Coffeeguyzz suggesting high prices will make the goat pasture profitable to develop. I assert that low natural gas prices will only allow the core areas of shale gas and tight oil plays to be developed. The tier 4 and tier 5 stuff will require high oil and natural gas prices to be developed. That’s why we are more likely to see a URR for continuous (shale) natural gas of 1000 TCF than 1500 TCF, but 1200 TCF would be my best guess.
I agree supply will respond to demand, and after 2035 or so demand may start to fall as wind and solar start to supplant natural gas for electric power and as more people switch to heat pumps from natural gas for both water and space heating.
Dennis,
Just did some checking on some Marcellus’ (current) goat pasture …
At $5/mmbtu (unrealistically high, IMHO, but what was thrown out in earlier comments), a 2 Billion cubic foot well ultimate recovery – which is the USGS Calculated Mean for the Eastern Interior normalized for a 10,000′ lateral – will throw off $10 million in gross revenue (likely just below current D&C costs).
McKean county has 75 wells already over 2 Bcf
Elk has 90 wells over 3 (thatsa three) Bcf
Cameron … 70 over 2 Bcf
Clearfield … 40 over 2 Bcf
Clinton … 60 over 2 Bcf
Centre … 16 over 2 Bcf
Combined total acreage in these 6 counties is about 3 1/2 million square acres.
Your comment about higher prices being necessary to develop this lower quality rock is both accurate and slightly missing the point.
Gunga originally pointed out how much recoverable natgas exists in the country.
Exactly.
The huge ‘core’ Marcellus presently restricts development of lower tier acreage. (With the exception of Seneca working the Utica in Elk county, most of these above enumerated wells are a decade old, archaic by current standards).
That said, there are a HUGE number of locations sitting atop natty just awaiting market conditions to become viable.
Related aside … you – along with (probably) the majority of POB commentators – envision a wildly unrealistic view concerning renewable adoption/hydrocarbon rejection, in my (heretical) opinion.
Cummins X15N engine will be introduced in just a few months.
As per Cummins recent comment, 20% of new heavy duty truck sales in China are now natgas fueled (the X15N was introduced there a couple of years back).
So, yes, a super abundance of natgas supply is apt to keep prices low.
If/when prices start to creep up, vast swaths of resource awaits to fill those needs for many decades to come.
Demand for natgas is certain to rise – not fall – in the coming years.
The doubling of demand for export LNG will be accompanied by a transition – pace as yet undetermined – from diesel/gasoline to CNG.
Keep an eye on how the truck market responds to the new natgas engine introduction this coming spring.
Coffeeguyzz,
I believe you were the one repeating claims by Hamm that the Bakken would produce 30 Gb or more a few years back. I will stick with USGS mean TRR estimates as a high point and go with knowledgeable people such as Mike Shellman who suggest that even the F95 TRR estimate for the Permian may not be achieved (about 45 Gb) which is about 60% of the mean USGS TRR estimate(75 Gb).
Total mean TRR for US shale gas is roughly 2000 TCF, if we take 60% of that we get about 1200 TCF for a reasonable TRR. With a scenario where shale gas consumption increases by 4.24 BCF/d per year from the current level of about 83 BCF/d, we get to half of the 1200 TCF URR by mid 2032, that’s likely around the peak.
The resource is not unlimited, we will see how much progress is made with wind, solar, hydro, geothermal, and nuclear power and how quickly natural gas demand falls if prices reach $5/MCF, that price will probably make many LNG export facilities not profitable this would lead to a glut driving natural gas prices lower.
You have mentioned the switch to natural gas in the past for transport, so far not much happening in the US. In 2022 about 64 BCF per year was consumed by vehicles, or 178 MMCF/d. Compare this to the 79981 MMCF/d consumption by the US (deliveries to consumers), the vehicle use was about 0.22% of the total natural gas use in 2022.
KSA enters the shale era.
https://www.reuters.com/business/energy/aramco-produces-first-unconventional-gas-south-ghawar-2023-11-14/
.
The oil price is falling hard again.
Reading the financial articles, the common sense is there is a strong oversupply in oil markets and US production will grow string into the new year. OPEC is saying the opposite.
Money is enough in the market – NASDAQ is in spitting distance to the ATH, so nobody world wide will part from his precious APPLE stock.
I think it’s market mechanics – after the strong long from the cuts an earning securing sell of longs got into a short rally that still persists – and such rallies write their own story. Especially the growth of US production next year will be strong hindered by this price slump, leaving small producers at the mercy of high interest rates to finance their drilling of B wells.
The average stock in the US is down 36% this year. But because of 7 to 10 large tech stocks the index’s are near all time highs. Most stocks are currently in the worst bear market we’ve seen in a long time.
Further more the Vanguard’s, State Streets and Blackrocks of the world are passively buying these stocks. Retirement funds passively buying.
Stock markets aren’t really a good reflection of how well the economy is doing. More of a reflection of retirement needs and corporate buybacks because making profits buy selling more goods and services is so out of date.
Globally the inflation data is coming in really soft. It’s all interconnected.
The hard landing the financial media says isn’t going to happen is almost here. Barring something crazy happening in the Middle East oil is going to fall hard with this incoming hard landing.
In this ambivalent market comes Exxon with a loud splash. I would never suggest that Exxon is superior to Pioneer in technique, but they do have a great feel for the market and they have gotten along with Saudi Arabia for almost a hundred years. Exxon will most likely coordinate their drilling and production pace to suit the market. They neither want $50 oil or $120 oil.
The drilling style of many of the small producers in the Permian has been frenetic. Almost crazed. And so has the flaring. As the Permian devolves toward less desirable and more challenging ground, it is actually a good time for consolidation.
As others have said, Q2, 2024 is going to see a fairly sharp decline in Permian LTO production. What is happening now is a rare opportunity, a strategic market force to bring the price down in preparation for either one whopper of a recession or a massive bull run. I expect both, one after the other. The first will make for one heck of a buying opportunity in preparation for the latter: Oil $120.
When you think about it, what is happening is really rather extraordinary: major combative conflicts going on in two volatile parts of the world, a balanced oil market, yet oil prices falling like a stone. That’s due almost entirely to American production announcing to the world that it is hitting new peaks–and that in turn is due almost entirely to putting enough lipstick on a pig to make her pretty for the box supper (an American rural event of yesteryear).
Stephen Hren comment above bears on this
“If oil prices are trending downwards now it’s because the three major markets (US, China, Europe) are all rolling over demand-wise.”
The demand for gasoline has not recovered from preCovid peak. Will it ever?
His link-
https://yaleclimateconnections.org/2023/05/is-this-the-beginning-of-the-end-for-gasoline/
They note- “Another reason is improving fuel economy, especially as the adoption of hybrid and electric vehicles is growing. In the first quarter of 2023, electric vehicles [in the US] accounted for 7.2% of all new car purchases, and EV and hybrid sales are booming.” (source Kelley Blue Book- https://www.kbb.com/car-news/ev-sales-broke-records-in-first-quarter-of-2023/)
China and Europe are far ahead of US on EV implementation (since they have much less domestic oil production).
I suggest it would be an opportune time to top off the SPR…with diesel.
There’s a virtuous cycle going on. In order to compete with a powertrain 4 times as efficient, traditional gas car companies are embracing hybridization and other efficiency measures. Gas use is getting squeezed on both ends.
https://www.reuters.com/business/autos-transportation/toyotas-camry-best-selling-car-us-goes-all-hybrid-2023-11-15/
There is now more than one fuel source available for personal transportation. This is what happens when monopolies are broken. Prices crash.
Rig and Frac Report for November 17
Rigs Up. Fracs Up
– US Hz Rigs were up 6 to 452
– Permian rigs were up 5 to 299. Texas Permian was up 1 to 202 while NM added 4 to 97. Of the 4 in NM, 6 were aded to Eddy county while Lea dropped 2 to 52.
– Eagle Ford was unchanged at 47
– NG was down 4 to 100 (not shown)
Fracs up 8 to 276
One year ago, 297 Fracs were operating, 21 more than this week. Will this be the last week for Frac additions? Frac spreads start to drop in Thanksgiving week and into Xmas. Will history repeat itself this year?
NM Drilling Activity
Rigs are surging in Eddy county (+6) and dropping in Lea (-2) this week. Has there been a new discovery in Eddy?
Exxon, with unlimited drilling budgets, trying to get closer to its projections and take advantage of IDC before YE. Drilling commitments. Waha was near negative or negative all week… imagine that from stuff in the Delaware that is 50% gas and NGL related? No one can possibly believe they are drilling wells in the gassiest county in the Permian because of good economics, right?
December production the EIA is ranting about is actually October production that occured from field operations 5-6 months ago and is just now being reported. YOU CANNOT ESTIMATE PRODUCTION FROM YOUR WELLS, FOR INSTANCE, IN THE MIDDLE OF NOVEMBER FOR THE MONTH OF DECEMBER. DECEMBER HASN’T EVEN BEGUN YET.
DUC’s are gone, save a cursory few every month; if we use 1.25 wells completed per drilling rig and rig counts are down 38-42, what will make December production, reported in February of 2024, increase as per the EIA? If fewer rigs are drilling more wells, creating the big ‘E’ for efficiency, why are frac spreads not sky high trying to complete those abundant new wells?
If you believe Permian production is going to keep growing, or plateau, what exactly is the metric you are using to come to that conclusion? Surely it is not trendology based on past performance.
Mike,
Take a look at my spreadsheet linked in the post. It is based on completion rates of 450 wells per month, but you can change it to anything you like in the spreadsheet. It uses the average 2020 Permian well, which so far looks consistent with the average 2022 well (when not normalized for lateral length).
According to Rystad, there were about 505 wells fracked in the Permian basin in August and about 462 in September (a preliminary number that is often revised higher) Novilabs reports Permian DUCs at 3557 as of July 2023. We can only guess at future completion rates. Scenario below has plateau in output, lower completion rates would result in decline. Comparing the August number of Permian wells fracked in this month’s MOMR with last month’s estimate the number increased by 6 (from 499 to 505).
An alternative scenario for Permian with 16 thousand fewer wells completed and a more rapid decline in the completion rate.
Actual future completion rates in the Permian basin after September are unknown and completion rates for recent months could be revised as data becomes more complete.
In the most recent Natural Gas Weekly update
https://www.eia.gov/naturalgas/weekly/archivenew_ngwu/2023/11_16/
The EIA said:
The price at the Waha Hub in West Texas, which is located near Permian Basin production activities, rose $1.39 this report week, from $0.96/MMBtu last Wednesday to $2.35/MMBtu yesterday. The Waha Hub traded 52 cents below the Henry Hub price yesterday, compared with last Wednesday when it traded $1.25 below the Henry Hub price.
I do not have access to Waha prices.
I am thinking that you are aware of how the DPR estimates production, they assume wells completed will mirror drilling rates which they base on rig counts. They have rig counts for October and they assume the wells drilled in October will be completed in December, they probably assume the average well profile will remain relatively steady over the forecast period. Essentially completion rate is based on rig count from two months ago. Not a perfect model because completions can occur by drawing down DUC inventory if it exists.
If all those “inputs” are correct, then we should expect the Permian to keep growing until the end of the year. I have no faith in the no. of wells “completed” from anybody but the TRRC, certainly not Rystad and only Novi, but two full months after filing. It can take 2-4 months to process a W-1 at the TRRC. I have no way of knowing what the no. of completions were, for instance when there were 39 more rigs running in the Permian. Please, don’t even bring up the EIA.
I have a chart up that shows IP60’s for new wells are down 10% since 2021. New wells are declining at 70-80% the first 12-14 months, steeper than <2021.
Your argument seems to be that the Permian will keep growing, in spite of fewer rigs and fewer frac spreads, in spite of lower IP's, steeper declines and falling percentages of C C in the production stream…because the number of completions is holding 50 wells higher than those wells that the current number of rigs can drill…all because of DUC's.
All of these inputs are essentially guesses, I think, based on past performance, on trendology, and DUC's make up the difference in fewer wells being drilled. DUC's are then artificially creating the illusion of "greater efficiencies," more production from fewer wells, blah, blah.
I don't believe there are anywhere close to 3000 DUC's that are economic at $70/$2 in the Permian and I do not believe there are 50 DUC's a month being completed from inventory. But thats me. We'll see. Wells are getting worse, not staying the same, there are fewer rigs running, and if there were 10 DUC's a month being completed, I'd be surprised, then ask how much longer can that go on.
So, the debate essentially is about remaining DUC's. It is the contention of everyone touting increased tight oil production in America that the numbers of DUC's completed, OFFSET, the fewer wells being drilled by fewer rigs.
PS; uphole, the average APP Basin natural gas well now makes 450 MCFG/day. I use to have wells that cost $200K each to drill and complete, each, with 20:1 ROI's that would make monster APP Basin wells look like cat dookey. Here today, gone tomorrow. Big numbers are just that, big numbers.
Thanks Mike.
My well profile matches the 2020 well profile from Novilabs data. Compare the 2022 and 2020 well profiles at Novilabs, they are pretty darn close. Yes the mormalized well profile will be different. but the numbers we have are wells completed and average output per well. I cannot create data I do not have , I work with the data available. Basically
https://novilabs.com/blog/permian-update-through-july-2023/
and before that
https://novilabs.com/blog/permian-update-through-april-2023/
Mike,
I am not arguing that Permian output will increase, I am saying it depends on the future completion rates and well profiles. I expect that if oil prices rise the rig count may increase (the horizontal oil rigs in the Permian basin have been increasing for past 6 weeks). Future rigs operating, wells completed and well profiles are all unknown.
Yes, they are unknown. A case in point might be that, in spite of much higher prices ( $75), rig counts are down, not up, a direct contradiction to economic “theory.”
The source of well completions, the numbers per month and what sort of wells, real or DUC’s, is a joke. Where does that information come from that is dependable, particularly months in advance, before, for instance, the TRRC even knows?
You did not address my questions very well (nor does anyone else, actually, so no big deal)… what metric are you and others using that enables predictions of growth and or plateauing for Permian tight oil thru the rest of the year with rigs down 38 since May? Is is because the big boys say so? Is it because of trendology? Is it because past performance is indicative of future results, Is it because of DUC’s, more wells drilled with fewer rigs, bigger frac’s, longer laterals? What is it?
All I can see in my data is that fewer rigs and much, much steeper first year decline rates are going to result in just the opposite. In saturated sweet spots, in core counties, where ALL drilling is still occuring, first 12-16 month decline rates are now staggering to me. If those wells don’t make 300K the first 30 months of production they will never pay out.
A one rig addition to the Permian count (last week) will add 550 BOPD to Permian oil production by next May, in 2024. Between now and then Permian production in the aggregate will decline almost 900,000 BOPD. I don’t understand the incessant belief in growth. And how can anybody be guessing about December production half way thru November? We won’t even know about November until January !
Mike,
Thank you for the response, sorry that I did not address your questions adequately.
There are about 1.45 wells drilled per rig (based on Novi spud data and baker hughes rig count from Jan 2022 to March 2023) so if we use rig count data to estimate future completions up to Nov 2023, the model shows what future would be assuming output from future wells have a profile similar to the average 2020 well (which looks very similar to the average 2022 well). Note that the well profile I use in my model has output decline at 70% from month 2 to month 13. The scenario below uses Baker Hughes Horizontal rig data to find the drilling rate and completions are set equal to the drilling rate (so DUC inventory would be unchanged). Note that oil prices are lower today than they were 12 months ago (Nov 2022 average WTI spot price was $84/b and 6 months before that they were about $109/b). It takes a bit of time for the rig count to react to changes in oil price as you know. The scenario below assumes rigs stabilize around 300 horizontal oil rigs in the Permian basin (enough to drill about 425 wells per month), the decreasing completion rate after Jan 2024 is a simple way to simulate a 3% per year decrease in well productivity, if such a productivity decrease occurs the actual completion rate would remain at 424 wells per month for this scenario. Obviously this won’t be right, I cannot predict the future well productivity or or rig count or completion rate or oil price. The average annual rate of increase from Sept 2023 to Dec 2025 for this scenario is about 75 kb/d per year.
In my view this is a very conservative scenario as I expect in reality we will see oil prices rise and the rig count and completion rate will likely be higher than this scenario assumes. The scenario attempts to match what I think your expectations are for rig counts in the future (though you haven’t actually said specifically what your expectations are.)
Did a quick check on average Permian cumulative at 3 months for average 2020 and 2023 wells at Novilabs (not normalized for lateral length) and the 2023 well is about 2.5% lower than the average 2020 well at 3 months cumulative. In my opinion it is too early to judge 2023 wells accurately as there is insufficient data.
ND Directors Cut came out several days ago. Another good gain and post Covid oil production record.
Remarks in the video call said Oct production, reported in Dec, will be flat or down. Was an early winter storm.
By the way, something about OPEP monthly reports or world oil production?
Jean-Francois,
OPEC post will be up before midnight US-EST. We are waiting for new World data from the EIA coming out late this week befor doing a World and non-OPEC post.
Thanks for reply
There is no doubt about it: we are entering, more each day, a phase-out of predominant LTO and a phase-in of gas production in the Permian shale. Several wells each day are entering the bubble point, the ineluctable signal of rapid oil production decline.
Eddy County is known for its high GOR right from the get-go. So production of NG from these wells is going to be crackerjack all the way through. Still, new players are entering Eddy County, along with Exxon’s expansion.
And therein lies the problem with the sale of natural gas.
The EIA ran a mock trial, called believe it or not, “No Interstate NG Pipeline Build” between 2024 and 2050, in order to analyze the effect it would have on the green market. The results are staggering (sarcasm here). By 2050 there would be 5% less NG produced and 4% less consumed, with an 11% higher price. This gained, mind you, by blocking egress of NG from Texas and ND and the Appalachian Basin to points west, midwest, and northeast. This is nothing short of madness! Indeed, if you asked the inhabitants of a mental institution to come up with a plan, they could likely beat this by a country mile. And yet the ban stands.
At the same time, there is absolutely NO pressure exerted by the world community on China, India and Indonesia regarding coal usage. Indeed, Europe used more coal last year than in a very long time. Maybe that’s a peculiar circumstance, but perhaps not too.
So as Eddy County New Mexico goes on increasing its rigs, and even a new player from Australia comes in to partner with a Roswell company, venting of pure methane into the troposphere and flaring too will go unabated. Why? Because NM gains several billion dollars each year in payola. Pardon the pun, but this burns me up!
yeah, this “no more pipeline” is probably more effective in slowing down tapping gas reserves or artificially lifting renewable and coal use than any price or resources limiting factors.
My guess is the “no new pipeline” thing that Gerry is talking about may have been a scenario run by the EIA, it does not mean that such a policy is being considered.
Currently there are about 116 pipeline projects in the pipeline with total additional capacity of 90 BCF/d that have been either announced, approved, or have begun construction in the US. If we only consider projects that are approved, under construction or partially completed (58 projects in all) the total is about 45 BCF/d of additional capacity. About 38 projects have either been announced or had their application submitted with a capacity of 28 BCF/d, about 17 BCF/d of additional capacity is in projects that have been put on hold (20 projects about 17% of the total number listed in the spreadsheet).
See
https://www.eia.gov/naturalgas/pipelines/EIA-NaturalGasPipelineProjects.xlsx
and
https://www.eia.gov/todayinenergy/detail.php?id=52478
when starship get popular in couple of years, each pop consumes 1kilo ton of LNG, we will need more pipelines and build LNG facilities for dual use Exportx2. In fact, maybe the launch got LNG from Port Christie nearby?
https://www.energy-cg.com/NorthAmericanNatGasSupplyDemandFund/NaturalGasDemand_MethaneFuelMuskStarship.html
we should abandon the all confuse MCFPD unit for gas well production, instead use 1SSPD, 1 starship pop a day.
You’re making a very good point that is often overlooked: Spaceflight is extremely energy intensive.
The problem with the Starship is that even if it does eventually work, there may not be any demand for its services. In particular, the claim that it will bring down prices is yet to be tested.
Space X is already hogging the launch market by offering rock bottom prices, but these prices are partly subsidized by its patient investors. It created Starlink to increase launch demand, but is far from making money.
Somebody is going to have to build an awful lot of expensive equipment that actually has some use in space to make daily launches of a giant rocket feasible. Who and what that would be is not at all clear. And where all that fuel is going to come from is also an open question.
In the years to come we will see a decrease of coal consumtion in Europe, at least for steel industry. Arcelor Mittal is modifying three blast furnaces (one in Spain and two in France) to make them able to function with hydrogene to replace coal. The other three blast furnaces of Arcelor Mittal in France will be closed and replaced with electric arc furnaces to use more scrap metal to produce steel. British steel wants to close old blast furnaces to replace it by two electric arc furnaces even if there are discussions to save the current installations with electrification (hydrogen?). In Germany, Thyssenkrupp has decided to modifiy its four blast furnaces to make them compatible with the use of hydrogen. The big problem is, in that case, the use of German electricity produced, in part, with … coal.
Yeah, switched off our nukes, replaced the capacity with old coal plants running longer – ouch. Tore down a newer coal plant in Hamburg before going life because of climata issues (not wanting coal), so the old less efficient take up the load now – double ouch.
It’s good the steel industry is doing the change (with a lot of subsidies of cause, nothing is for free) – but there is still no green hydrogen in reasonable amounts in production. And there would be a lot of demand for hydrogen in the industry even before converting these plants. All of it is produced from nat gas at the moment.
So it’s a chaotic process, very expensive with no result at the moment. It would be better to start with the hydrogen production.
Industrial usage is 55 TWH per year already at the moment (that’s round about of 10% electric capacity), all created from nat gas. It’s so much so we have already some hydrogen pipelines here (they are made from steel, just for information for the crowd who things hydrogen is not transportable).
Producing green hydrogen first to satisfy this demand would be much more useful than converting the steel plants now, funneling this money into building up capacity here. Converting steel could be done later when already half or more of normal usage would be covered by non-fossil sources (or CO2 storing fossil if you can pay needing the double gas).
New posts are up.
https://peakoilbarrel.com/opec-update-november-18-2023/
and
https://peakoilbarrel.com/open-thread-non-petroleum-november-18-2023/