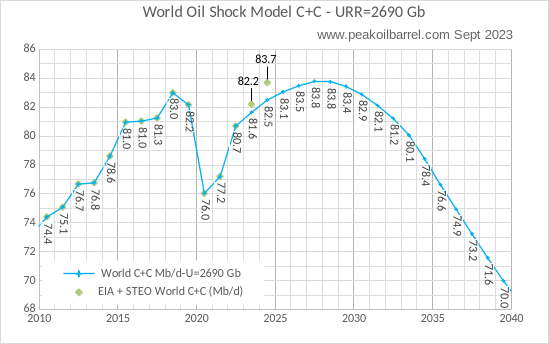
The EIA’s Short Term Energy Outlook (STEO) was published in early September. The chart below estimates World C+C by using the STEO forecast combined with past data from the EIA on World Output.
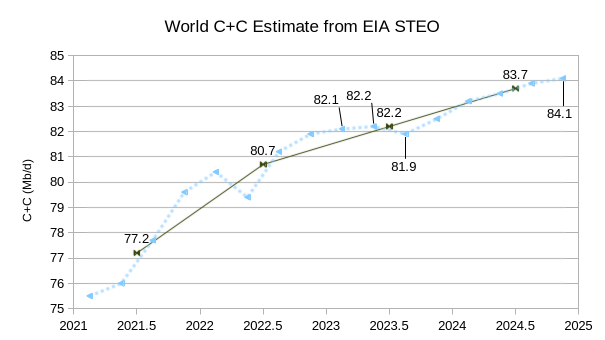
The EIA’s Short Term Energy Outlook (STEO) was revised higher in September compared to August. World C+C output is expected to decrease in the third quarter of 2023 and then increase over the next 5 quarters. Annual average World C+C output increases by about 1.2 Mb/d in 2023 to 82.2 Mb/d and then to 83.7 Mb/d in 2024, about 700 kb/d above the centered 12 month average peak in 2018. This month’s World C+C estimates are about 500 kb/d higher than last month for 2023 and 700 kb/d higher for 2024 due to the revisions in the STEO forecast this month.
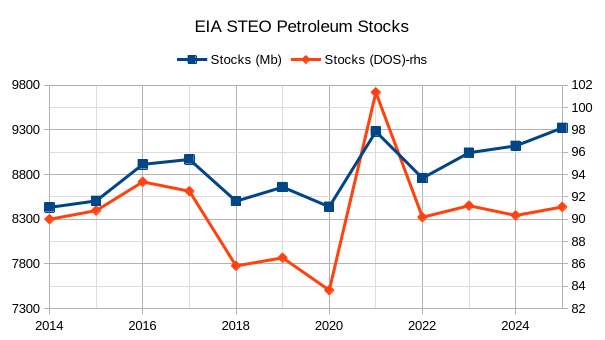
The chart above assumes World Petroleum Stocks at the end of 2014 were high enough to supply 90 days of World average petroleum consumption in 2015. Total petroleum stocks tend to rise over the long term because average petroleum consumption tends to increase over the long run. In order to maintain roughly a 90 day stock, the absolute level of petroleum stocks must increase. The days of forward supply (DOS) on the right vertical axis is the better measure of petroleum stocks. Based on the EIA’s supply and demand estimates, at the beginning of 2018, 2019, and 2020 petroleum stocks were relatively low (less than 90 days of forward consumption) and at the beginning of 2022, 2023, and 2024 the stocks were at a balanced level (close to 90 days of supply).
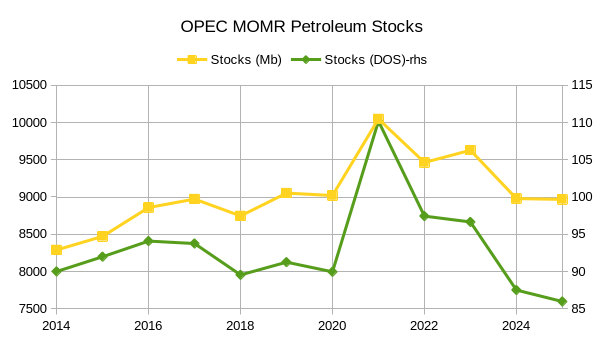
OPEC has very different supply and demand estimates for the World than the EIA. This results in the stock levels looking very different, with the OPEC estimates suggesting a balanced oil market at the beginning of 2018, 2019, and 2020 with close to 90 days of supply each year. At the start of 2022 and 2023 the OPEC estimates suggest a significant oversupply with stocks at 97 and 96 Days of forward supply in each of those years. High World demand assumptions by OPEC result in a significant shortage by the beginning of 2025 at only 86 days of supply.
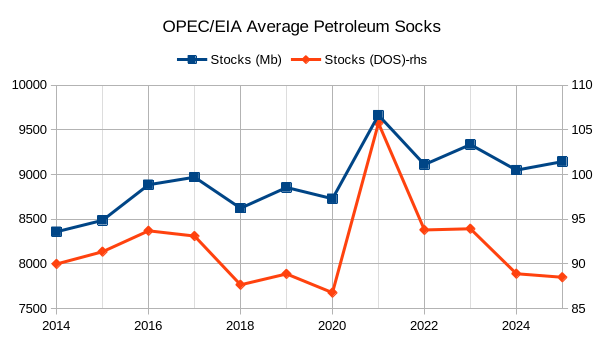
The chart above takes the average of the STEO and MOMR supply and demand estimates. By this estimate the World stock levels look fairly balanced except at the beginning of 2021, there was slight oversupply at the beginning of 2016 and 2017 with DOS at about 93 to 94 days slight under supply from 2018 to 2020 (start of year), then oversupply in 2022 and 2023 and sight under supply (stocks under 90 days of supply) at the start of 2024 and 2025. The lack of transparency in the level of World petroleum stocks is one of many reasons for oil market volatility.
The chart above has not changed from last month except the inclusion of the new STEO estimates for 2023 and 2024 on the chart based on the September STEO.
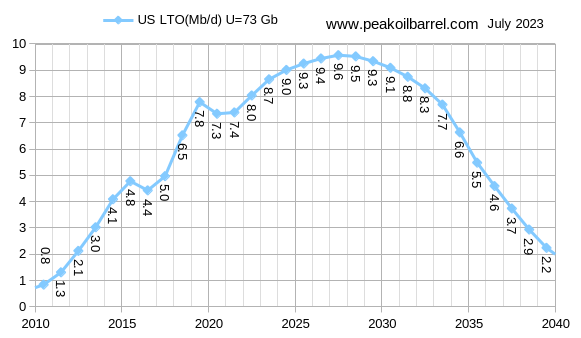
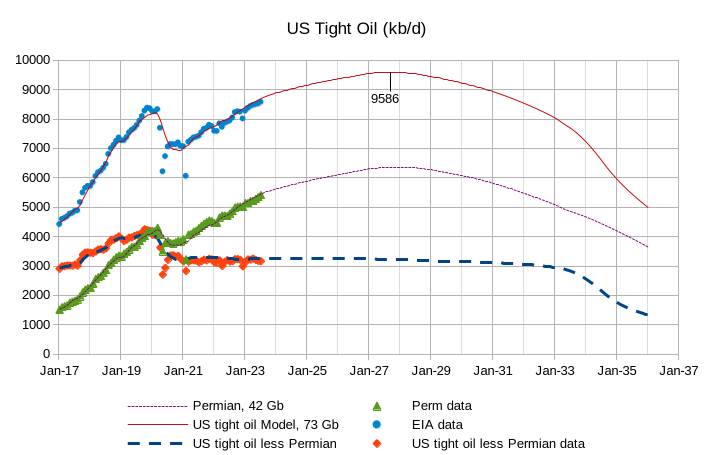
The US tight oil model above is unchanged from last month. Annual average US tight oil output peaks in 2027 at about 9600 kb/d.
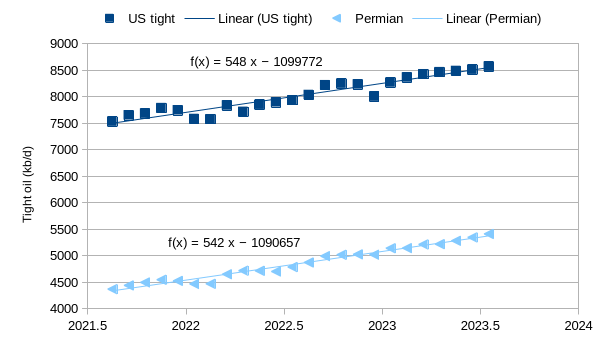
The chart above shows the annual rate of increase in US and Permian basin tight oil output from August 2021 to July 2023, over this period almost all of the increase in US tight oil output came from the Permian basin.
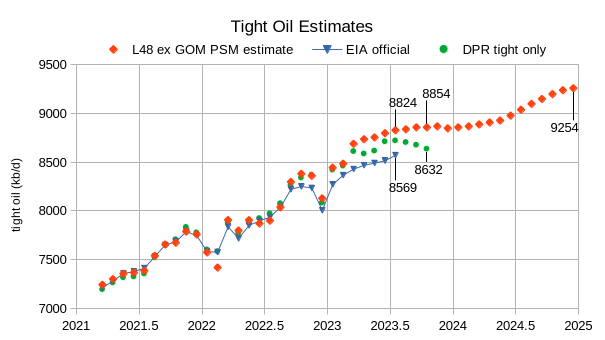
Two alternative estimates for tight oil are compared with the official EIA tight oil estimate in the chart above. The first uses the recent Drilling Productivity Report (DPR) and takes the difference between the DPR and official estimates to find the conventional oil produced in the DPR counties. Over the period from October 2020 to September 2022 conventional output was relatively stable at an average of 759 kb/d. We assume conventional output remains relatively stable at this level from October 2022 to October 2023 to create our estimate by subtracting 759 kb/d from the US DPR estimate for all regions, this is labelled DPR tight only. From March 2021 to September 2022 this estimate follows the official estimate closely and then diverges.
For the other estimate I use L48 excluding GOM from the Petroleum Supply Monthly (PSM) and the EIA STEO after June 2023 and subtract tight oil from this estimate to find all L48 excl GOM conventional oil over the period of interest. In this case I take the average conventional L48 onshore output from Sept 2020 to August 2022 which is 1776 kb/d and this is subtracted from the L48 excl GOM PSM estimate to estimate tight oil output, this is labelled L48 excl GOM PSM estimate (but perhaps “tight estimate” would have been clearer). Note that as before the estimate follows the official estimate quite well from March 2021 to September 2022 and then diverges. In July 2023 the difference between the largest and smallest estimate is about 250 kb/d, it will be interesting to see if the official estimate is revised in the future, it is possible that the assumption that conventional output is relatively stable is incorrect for the tight oil regions.
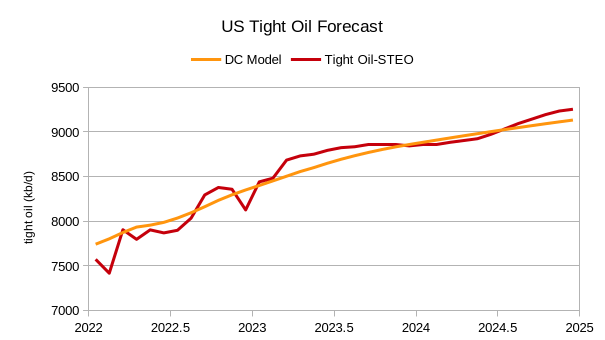
The chart above compares the tight oil estimate using the PSM and STEO data for L48 excl GOM with my tight oil scenario (DC model), the model is likely to be wrong as it is just a guess and the estimate may also be revised in the future by the EIA.
The only revision to this chart from last month is to update the EIA, data to the most recent official estimate, the models are unchanged.
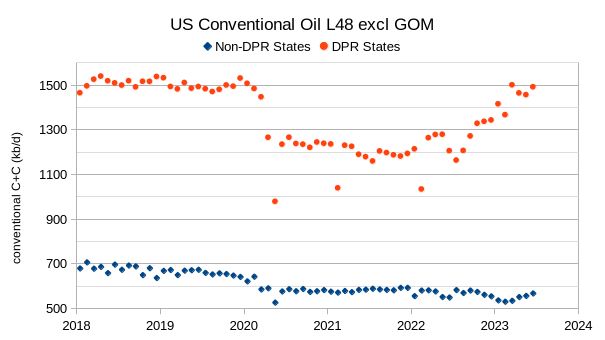
This chart shows why I think that conventional output has been relatively stable from about June 2020 to June 2022, it is not clear why there is such a difference between the tight oil producing states (with counties represented in the DPR spreadsheet) and those states with no tight oil production over the June 2022 to July 2023 period. One area shows a significant increase in conventional output while the non-tight oil states show a slight decrease in output.
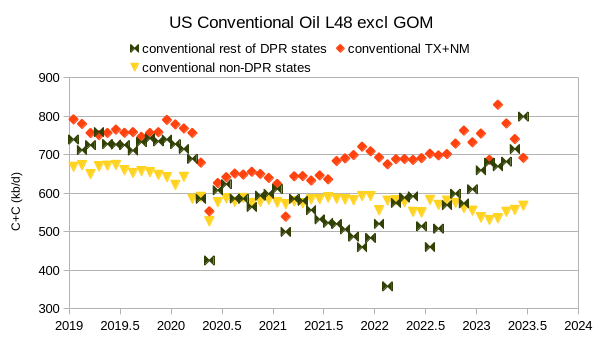
This chart divides the DPR regions conventional oil (red dots in previous chart) into two parts, New Mexico and Texas conventional (found by subtracting Permian and Eagle Ford official tight oil from New Mexico and Texas PSM C + C output) and the rest of DPR states conventional, in this chart things seem much less stable especially in the “rest of” the DPR states, unclear if this is real or just bad data.
160 responses to “STEO and Tight Oil Update, September 2023”
On possible diesel shortages.
Overall oil supply shortfalls were always going to manifest themselves first as shortages in one particular cut; it’s just been a question of which one. Since about 2010 the gap left by declining conventional oil production has been filled by LTO and NGLs, which have diesel content between low and none. EVs may reduce gasoline consumption but at the cost of increased diesel use in the mining of their constituent materials. Similarly renewable electricity generation reduces overall fossil fuel demand, but with an initial upfront increase for their manufacture and installation with the heaviest burden on diesel. There is some flexibility on the supply (e.g. changing how heavy oil is cracked) and demand side but it’s a question of how fast the changes can be made especially as oil supply decline appears to be accelerating, especially in some of the grades most attractive to refineries.
‘Limits to Growth’ report from 1972 did a good job of illustrating the concept that there will be some critical feature of the earth that becomes a hard constraint on the explosive human economic and population growth. It may be diesel, or copper, or grain harvests, fresh water, or a stable and hospitable climate…among other candidates.
And we will see not just constraint on growth, but very likely a hard reversal.
Simply, we have overdone it. Accomplished too much. Slashed and burned too much. Taken too much.
Our collective appetite is the accelerant of own destructive fire.
And I suspect we will rush things to the downside. Russian invasion being an early example of that.
In 2022 USA diesel (distillate fuel oil) used for transportation was 75% of total diesel consumption [EIA]. Much of that is not ‘light transport’, and cannot be as easily replaced by electrification.
I know a lot of people in the sustainability sector as well as in the automotive industry. They seem to have reached a consensus that we are going to phase out diesel last and gasoline first. We are going to start by phasing out gas powered cars and lawn mowers, and do trucks and tractors last.
When I point the realities of oil, they react as if I am talking about UFOs. Phasing out gasoline first and then diesel seems to be the consensus and the sensible mainstream opinion. Transitioning diesel machines to gasoline doesn’t seem to be a priority.
There is an unfortunate rift between energy people and climate people and the two would benefit from openly discussing the realities of the energy situation instead of hiding in filter bubbles.
Five or ten years ago, more than half new cars in Europe were powered by Diesel. Now, less than 10% of new cars are diesel, thanks to the emissions cheating scandal and the very rapid take up of EVs. Demand for diesel is going to fall in Europe in the medium term, as the existing diesel fleet slowly retires. This is only one market, but it will delay the days of shortages for the fuel. There is a lot of flexibility in the balance of demand between petrol and diesel, many vehicle types can be built to use either power source, and as diesel prices rise relative to petrol, more petrol powered machines can be built in the medium term. Aviation, on the other hand, has much less flexibility in fuel choice.
In the last thread I mentioned that I should try a Hubbert Model for conventional and unconventional oil, chart below does that and combines the two separate Hubbert models (conventional and unconventional oil) to create a World Hubbert Model with URR=2660 Hb. The Hubbert Model is compared with my Shock Model (URR=2675 Gb) in chart below. Peak for Hubbert Model is 83.5 Mb/d in 2024 and for Shock Model it is 2027 at 83.8 Mb/d. Peak gets shifted later for Shock Model due to the pandemic.
Forgot to label vertical axis, it is World C plus C in millions of barrels per day.
Dennis
What assumptions are made on price?
Charles,
A Hubbert Model makes no assumptions about oil prices. For the Shock Model I assume prices remain relatively high (over $90/bo in 2023 US$) from 2024 to 2030, then I expect a gradual decline in oil prices as the World moves to electric transport with demand starting to fall faster than supply by 2033 and with oil prices falling to $35/bo by 2040. Price is not explicitly incuded in the OIl Shock Model, but I incorporate these assumptions by assuming that extraction rates for conventional oil start to decrease after 2040 and that tight oil wells stop being completed at such a high rate after 2032 and fall to zero by 2037.
Dennis
As production falls, obviously the world will have to do with less of everything that is made from oil, not just petrol and diesel.
Personally I don’t see heavy trucks in Russia, Iraq, Iran, India etc charging up batteries any time soon.
What about bitumen? The world is using more and more to build and repair the ever increasing road systems. As far as I know bitumen cannot be made from petrol but from the heavy elements of oil. So if oil is needed for one element the other parts will be used or wasted.
Electric cars will fix the petrol element of declining production but not many others. So I see oil prices staying high as production falls by a million barrels per day with each passing year.
Charles,
There is some flexibility in output of diesel vs gasoline depending upon refinery setup, also there will be less tight oil after 2030 and most of the oil in the World is of heavier grades that may be more suited to diesel output. There is plenty of bitumen in Canada, more than the World is likely to need. Also roads can be built with concrete rather than asphalt.
Dennis
No, roads cannot be made with concrete. Roads need to be dug up on a regular basis to repair mains water, sewers etc. Asphalt can be reused many times the amount of concrete used would be ridiculous. That is why it is hardly ever used.
I don’t think oil, once in decline will ever become cheap it is needed for too many things other than petrol.
Charles,
Many of the products from oil that are used are simply cheap by products, in many cases there will be substitutes. There is a lot of natural bitumen, not likely to be an issue.
That’s funny, the roads I drive on every day are in fact concrete. Maybe it’s different in other countries?
“Concrete pavement accounts for 20% of the US interstate system. Concrete roads have several benefits, making them a popular construction material choice for building roads and interstate highways in America. Mar 28, 2023”
From what I remember at least parts of the early Autobahns in Germany were built with concrete, but since cement and thus concrete manufacturing is VERY CO2 emitting that may give some trouble nowadays…
There are apparently some work on “green cement” going on, but might take a while to get there.
I’m glad the world isn’t running out of conc-
https://www.bbc.com/future/article/20191108-why-the-world-is-running-out-of-sand
Oh, nevermind.
Exxon appears to have updated their “View to 2050” report. I found a date of August 28, 2023. Here is the link:
https://corporate.exxonmobil.com/what-we-do/energy-supply/global-outlook/energy-supply#Liquids
The fourth graph down is one I have mentioned here several times. It appears that the inflection point has moved from around 2050, to 2032, and it now appears to be around 2030. Although the graph is very very flat for transportation fuels (anything below the purple area). Which says, you all have been doing some very fine analysis.
Thanks PeterEV,
The forecast for World C plus C supply (conventional, deepwater, oil sands, and tight oil) looks fairly reasonable. Looks like a plateau from 2025 to 2032 roughly.
Dennis
Are you serious?
The graph shows oil falling by only about 4% between 2030 and 2050
Charles,
I was focused on the shape from 2020 to 2030 only, I agree that output is likely to fall faster after 2030 than predicted by Exxon.
50 by 2050.
Reminds me of one George did.
Chart below shows conventional, unconventional and combined World Hubbert and Shock Models.
As always these are 100% certain to be wrong, just my guess.
Dennis
Your prediction is about right from what we know about all oil producing countries and how many are already in decline. The Exxon graph shows production at about 75Mb/d in 2050.
You said that looks reasonable
Charles,
You are correct, I was focusing on their forecast through 2030, after that their forecast seems high to me.
Thanks Dennis – All great work.
One point I’ve raised before, the total amount of oil that was not produced on account of the covid situation amounts to on 73 days of production (total of ~6.2 Gb).
If you are shifting the HL by several years then I don’t believe that’s an accurate representation.
Shifting by 2/3 months is certainly noise level and no point in doing so. Also, it’s always helpful to put a vertical line where the present date exists, or better, make vertical lines every 5 years and color them light gray.
Even so, your work suggests world production to be flat for next year or two, then start the decline.
Thanks for your dedication and hard work!
Kengeo,
Cumulative production for the two models is nearly identical, note that I do not purposely shift the peak, it is a result of the fit of the Hubbert models to the data. Chart below has cumulative output of the two models in Gb, there are two lines, I have made one a dashed line so you can see the line below.
Kengeo,
Chart with vertical lines. Note that from Jan 2019 to December 2025 there is a significant difference in cumulative C plus C output for the Shock Model vs the Hubbert Model.
Shock Model=178 Gb
Hubbert Model = 190 Gb
Thus the Shock Model Scenario has an extra 12 Gb of oil at the end of this period relative to the Hubbert Model (where this oil has already been extracted. This amounts to an extra 33 Mb/d over one year or 5 Mb/d if spread over 6 years.
Note that if output had followed the Hubbert curve you would be correct that we would expect flat output over the next few years, in fact the output curve followed the Shock Model through 2022 and for the past few years output has been trending higher. My best guess is that the trajectory will continue gradually higher until 2027, but it might be flat, most major reporting agencies are predicting increased output over the 2023 to 2027 period. Many of these predictions will be wrong after 2027 (those that expect continued higher output such as the EIA’s IEO.)
A quick Hubbert analysis of US Shale Gas, it looks like exports of LNG are not a very good idea as Mr. Shellman has pointed out. Peak in 2033 at about 110 BCF/d.
Probably better to keep the natural gas in North America. Perhaps it can be reinjected into the field to keep pressure up and save for later when needed, the oil men can comment on whether this is a dumb idea or not.
Or we could just drill fewer wells and stop exporting both tight oil and shale gas (except perhaps to Canada and Mexico).
At minimum we could suspend the future construction of LNG export terminals. In 2022 about 4 TCF of natural gas was exported as LNG with another 3 TCF exported to Mexico and Canada by pipeline.
The EIA does not expect demand for natural gas to increase very much in the US from 2023 to 2050. I think conserving as much of our resources for North Americans as is feasible makes sense, this includes both tight oil and shale gas.
Saudi Arabia intends to use 4 million barrels of oil a day in crude to chemical plants.
https://www.energyintel.com/00000185-1abe-dbb8-abed-3ebff2510000
And other companies have similar plans
Dennis –
I completely agree, over the next several years we can expect all producers to reconsider their exports. Either they will send more production to their own facilities or they will cut back to keep supplies in the ground. Effect is the same, exports will decline significantly. In the US natural gas will play a critical role in substituting for oil between 2030 and 2050.
Dennis – Would it be accurate to assume that in your model/URR=2660 Gb, 2P reserves will decline by ~10 Gb annually? This would mean that production kept constant at 30 Gb would come from 33% existing 2P and 67% discovery/growth? Point being that if a higher URR is in fact possible, then we should expect relatively low annual drawdown of 2P. In a nutshell, how do 2P reserves evolve in your scenario (I know price plays a role)? If we see large declines in 2P year over year, might that indicate that URR is lower than expected? Likewise, if we see steady growth in 2P and growth in production, could we wager that URR is higher than expected? What about 1P evolution, I would think it would grow to a point then decline, not sure what that might look like…
Kengeo,
The Hubbert model does not consider 2P reserves, it simply looks at past output data. For the Shock Model only producing reserves are considered in the conventional part of my model. For the tight oil model average well productivity and completion rate determine output and reserves are not specifically considered. The extra heavy part of the model relys mostly on the forecast of the Canadian Energy Regulator.
Chart below has producing conventional oil reserves from the Oil Shock Model from 2022 to 2035. Some portion of the reserves that are produced each year get replaced by newly developed resources.
Note that the model assumes that extraction rates for conventional oil will increase over the 2022 to 2035 period (from 5.07% to 5.32% over that span of time). In 2018 the extraction rate was 5.42% for conventional oil in my model, and in 2010 it was 5.6%, and 5.9% in 2000. Output =extraction rate times producing reserves.
Saudi Arabia will use 4 million barrels per day of oil to produce high value products
https://www.energyintel.com/00000185-1abe-dbb8-abed-3ebff2510000
An alternative shale gas model that assumes exports stop increasing after 2024 and that US demand does not increase after 2024 as wind power and solar power expand and the use of heat pumps for space and water heating also expands in the US. After 2041 it is assumed that shale output starts to decrease, Model URR is 1150 TCF.
I mistakenly called this a Hubbert Model on the title, it is not, but the previous model used a Hubbert curve from 2027 to 2100.
WSJ has a somewhat realistic article on shale:
https://www.wsj.com/business/energy-oil/oil-prices-are-rising-shale-isnt-coming-to-the-rescue-83a672d?st=a0hcrh1kmht6mqw&reflink=desktopwebshare_permalink
not sure how long the link is good for.
rgds
WP
Dennis
Good report. What assumptions are in the tight oil forecast regarding WTI price and completions. I note in the WSJ report that many of the big companies claim they ignore the price of WTI on drilling/completions when WTI goes higher.
Ovi,
Do you mean the STEO tight forecast or the DC Model? For my model I assume oil prices will be over $80/bo from now until 2033 and then prices will start to drop. The tight oil model assumes a flat completion rate (no changes) from 2023 to about 2027 and then the completion rate gradually drops with the rate of decrease incrasing after 2032.
Dennis
Sorry. I should have been more clear. Your model. What is the completion rate over the next few years?
Ovi,
In the case of tight oil in the US, I expect the June level of completions to continue for the next few years, around 940 wells per month until early 2029.
For Conventional Oil I do not have specific completion rates for the World, I have producing reserves and the extraction rate for those reserves (this is a little like my guess for future completion rates, it well certainly be incorrect.) Below I have World Conventional C plus C producing reserves and extraction rates for my Shock Model Scenario.
Dennis
I am wondering if I am getting forgetful. I have a recollection from about six months ago regarding some discussion on this board of a world URR in the range of 3,000 Gb to 3,250 Gb. Now I am seeing in this latest post, discussion of a URR slightly less than 2,700 Gb. What happened to cause the drop or am I missing something.
I thought that maybe I should take a look at this issue also. Attached is a 2 logistic fit for EIA C plus C from 1960 to 2024. I added estimates for 2023 and 2024 using the STEO projections. The URR came out to be 2,564 kb/d, right into your seat in the ballpark. Also attached is the non-liner HL.
Still puzzled/confused about the 3,000 Gb URR discussion from months back.
Non-Linear HL
Ovi,
First, I do not think applying the logistic as you have done will give a very reliable result. They are nice looking models though.
If we apply a single logistic in the manner of K. Deffeyes the result is a URR of about 3050 Gb or so. My models break up output into conventional and non-conventional and result in a lower URR of about 2660 Gb. A further refinement would be to break things up further to tight oil, extra heavy oil, and conventional oil.
Hubbert Model below uses an HL on data from 2005-2024 (used STEO estimtes for 2023 and 2024). This also will likely not give a reliable result, no model will.
Dennis
What is your basis for saying that that the way I have applied the logistic model would not give good results, given that it gives the same answer that you have using your separate models. Why even bother if you don’t believe in models, as noted in your last statement.
I don’t see the relevance of then putting up a single logistic to over a shorter time span to come up with a 3,000 Gb URR.
And yes, they do make nice clear graphs.
Ovi,
The point of that model was to check what I would get by adding estimates for 2023 and 2024, I had mostly used data up to 2019 in the past to avoid the pandemic which I thought would skew the results lower.
I agree your model is great, we will see what the future holds.
The basis is research on what others have estimated for URR, USGS estimated about 3000 Gb for conventional resources in 2000 see
https://pubs.usgs.gov/fs//fs-062-03/FS-062-03.pdf
Oil =649 undiscovered plus 612 reserve growth plus 2P reserves of about 920 Gb, plus cumulative production of 539 Gb. plus US resources of 280 Gb (including cumualtive production), total is roughly 3000 Gb, add unconventional resources to this total and we would get about 3200 Gb (this assumes a very conservative URR of 200 Gb for unconventional oil.)
There is also the paper below which gives a very different result from 2660 Gb, from well known authors.
https://www.sciencedirect.com/science/article/pii/S2666049022000524
There are a number of scholarly works that disagree with my estimate and suggests it might be in error, certainly there have been many underestimates of World Oil URR in the past (including my estimates), the HL method tends to underestimate URR (or has done so in the past).
Perhaps your method will do better.
A Hubbert Curve makes no assumption on oil price and basically assumes all out production with oil demand increasing forever.
The models are imperfect in my view and the future is difficult to predict.
The USGS published its estimate in 2000, one could experiment with data from 1960 to 2001 using your method (imagine it was April 2002 and we did not have data from 2002 to 2024). For the standard HL method, I get the following using a Hubbert Linearization on data from 1991 to 2001. Cumulative production for data and model through 2001 is very close with data at 905 Gb and model at 904 Gb.
By eyeball it looks like your 2 logistic model predicts about 77 Mb/d in 2027 and 75 Mb/d in 2030. It will be interesting to see what happens.
Dennis
I don’t believe that these models can predict the future.
I think that the URR it predicts is possibly the lowest estimate. As more production years are added to the model and the OPEC cuts are rescinded along with increased production from Guyana and OPEC, the URR predicted by the two logistics will slowly grow. Not sure by how much.
Agreed.
Ovi those are great charts and I would say they seem to honor the existing data very well.
My only critique is that there will likely be a sharp drop at the very end instead of a straight line.
See 1P and 2P added to you chart.
In my mind the question is this:
For the next ~3 years, will the decline rate be modest in the range of 2% (2P reserves),
or could it be extreme in a range near 9% (1P reserves),
or maybe somewhere in the middle at ~5% (average of 1P and 2P).
My guess would be toward the average, or slightly below 2P (URR = 2,000 Gb).
Timing wise, I get low/zero production of 2P reserves around 2050,
for 1P/2P I get zero production around early 2040s,
for 1P I get zero production late 2030s.
Unless reserves are much higher than they appear to be, significant oil shortages will show up between 2025 and 2029.
We will learn much in the coming years, and should have a clearer picture in a handful of months.
Kangeo
When discussing decline rates one must be clear on the definition. From the work I do on decline rates I can only look at historical country production charts. This implies that the decline rates I have are known as “Net decline rates” since I have no idea of how much drilling has occurred. I have looked at a number of small countries that don’t do much drilling and are in a slow decline. They show a net decline rate 529 kb/d/yr.
To get the cliff that you are showing would requires the majority of world oil producers to hit the cliff at the same time. I cannot see that happening.
Ovi,
I agree.
Ovi,
Your chart has an annual decline rate of roughly 2.9% (529/18500) over that period. For my Conventional plus unconventional Hubbert Model the annual decline rates are below, in the same ballpark from 2036 to 2045 as we find for declining producers over the past 20 years.
100 a barrel financing might be a issue. BRICs issue too
It not only the banks that are sitting on unrealized losses. Corporate USA owns a lot of treasury debt that they bought when rates were low.
Now everything is fine if they can hold to maturity. But if banks cut off lending for any reason and corporates have to sell those treasuries before maturity. Unrealized losses turn into realized losses.
Lending standards are continuing to tighten. Banks know what is coming and are trying to create a cash cushion to absorb the losses they know are coming.
10 year bonds are selling off right now.
Something is moving – and this crash will cost all companies money and rating, costing more money if it doesn’t stop fast.
Part of it is a dollar shortage outside US. Governments selling treasuries to get dollars that Eurodollar market just isn’t providing.
Governments also have unrealized losses that are turning into realized losses.
Dennis and Ovi –
Please take a look at monthly oil production of the World less US (last time I looked at this detail was over a year ago).
Decline since 2016 continues at almost 1mb/d (or ~1.3%), this is only thru May 2023 so it doesn’t take into account significant recent drops.
What it means for sure is that the World excluding US hasn’t seen production this low in over 20 years.
This likely means oil price will need to spike extremely high in order to balance this very low supply and a fairly high demand. I’m not sure what that would look like, but if history repeats itself, I think a temporary spike to $300 per barrel is not out of the question…
Thoughts?
It’s all over but the crying.
Great Job Ron!!!
With Mike Shellman’s forecasts on USA Shale…
http://www.oilystuffblog.com
Coal to Liquids is my unfortunate prediction….
Watch Australia and USA with 40% of the worlds coal reserves…
Only “God” knows how much natural gas…
https://www.oilystuff.com/forumstuff
Yes, Ron
This is my graph:
https://pbs.twimg.com/media/F6c2SO2aoAASwvC?format=jpg&name=small
I am tweeting it all the time at @crudeoilpeak but governments still look away.
I expect more of these kind of statements from OPEC.
“The UAE’s energy minister says over the past 3 years opec plus lost 4 million bpd because of lack of investment and that volume will not be coming back.”
“The UAE’s energy minister says the UAE decided to speed up its upstream expansion plan to reach 5 million bpd by 2027 in order to counter for loss of supply from other producers.”
We are working on it, all will be well by 2027 !!!
and then this is along the same line.
https://oilprice.com/Latest-Energy-News/World-News/OPEC-Secretary-General-Sees-Oil-Prices-Staying-High.html
https://www.msn.com/en-us/money/markets/head-of-opec-warns-of-a-dangerous-lack-of-investment-in-oil/ar-AA1hzvwo
Yes, I think 24/25 are going to show up a few truths about oil availability in the biggest producers one way or another despite all the noise that changes on the demand side add as countries may or may not go into recession. Apart from how unbelievably hot next year seems to be shaping up to get.
If prices were set by some authority which they aren’t maybe in theory oil could go to $300.
Oil prices are bid through future contracts. Where is the money going to come from to bid prices to $300 or even $200?
It took a lot of leveraging of collateral to get oil to $95. Where is the collateral coming from to get enough dollars to push oil to $300 or $200?
HHH,
My expectation is $90 per barrel over next 6 months or so, price might rise if demand grows faster than supply over the next few years I doubt it rises to more than $135/bo in 2023$ over the next few years.
Not many are calling for 200 to 300 per barrel. Analysts are predicting about $85/bo in 2024.
HHH,
I realized later you were responding to what Kengeo suggested on oil price. He expects steep decline in oil output in the future. If he is correct oil prices may indeed rise, I do not think he is correct so do not think $300/bo for Brent is in the cards.
If the tanks empty too much prices will be set by refineries buying on the spot market. The future market is without meaning then.
The first possible shot here is an empty Cushing. Futures without meaning for buyers when you don’t get the goo only paper.
Fuel is after food the second important stuff, before Iphones and Bitcoin and even tech stock. So the buying here will continue a long time .
200$ oil in today $ was reality already in the past, so there is no magic limit at 100.
Of cause a lot of things will break.
Imagine a Russian Civil War breaking up for example on a military coup attempt.
Why exclude US production? It is World C plus C output that matters, that is expected to rise at least for a few more years.
Kangeo
Attached is the World W/O the US with a projection out to December 2024. This is the April version since the EIA published incorrect production information for Russia in May. Bottom line is that production is flat for the next 18 months. There is still close to 2,000 kb/d being held back by OPEC plus which could be rescinded in 2024. I think in 2025 you could be looking at World W/O US in the 71,500 kb/d to 72,000 kb/d range due to additions from OPEC, Brazil, Canada and Guyana. There will be some declines, possibly a big one from Russia. I think picturing a plateau in the 71,500 kb/d to 72,000 kb/d range over the next two to three years is not an unreasonable expectation.
Ovi,
Sounds reasonable to me.
Ovi – Looking at past data the plateau shown seems very unrealistic, I don’t believe it accounts for all of the countries (or any) in decline. Here’s a quick look at the existing data, peak is 2016 plus or minus 2 years depending what threshold you use for the peak (using such a short time period really makes it difficult to see the big picture):
Strictly speaking, the plateau period was ~10 years that led up to the peak (Nov 2016 @73.9 Mb/d). For 120 months prior to the peak, average production was 69.6 Mb/d. Since the Nov 2016 peak, there have been 78 months of production averaging 68.1 Mb/d. The last time average production was this low was in 2005, almost 20 years ago.
Projected decline rate for this group will be 2%-3% annually.
>68 Mb/d – Jul ’04 thru May ’23 (~19 Years)
>70 Mb/d – Jul ’08 thru Dec ’19 (~11 Years)
>71 Mb/d – Dec ’14 thru Dec ’18 (~4 Years)
>72 Mb/d – Jul ’17 thru Dec ’18 (~18 Months)
>73 Mb/d – 3 months = OCT, NOV, and DEC 2016
I see no mechanism for oil production to maintain a constant plateau at ~70 Mb/d. That would need new output growth to offset the declining countries (which are almost everyone at this point)…seems unrealistic to me, but I’m just looking at the data (and weighing heaviliy the fact that global production peaked >7 years ago (after oil prices skyrocketed).
US July Production up 91 kb/d
Looks like those petering out LTO wells keep on giving. Big increase in Texas and GOM.
Thanks Ovi,
For the past 24 months the annual rate of increase in US C plus C output has been over 900 kb/d (monthy increase of 75 kb/d) using OLS on the past 24 months of EIA C plus C data. This is higher than I expected.
I expect it will slow down over the next 24 months to around 500 kb/d or perhaps less.
Dennis
It is difficult to understand the number of pessimistic comments made regarding US future oil production vs the reality we keep seeing in the growing US production numbers at the end of the month.
I count myself as a small pessimist because I keep looking at the four largest Permian producing counties that are giving peaking signals. More on that in the upcoming US post late Wednesday.
Something really dramatic is going on at the EIA. In May they dramatically revised Russian production data. Then, this month, right in the middle of the month, they revised the data even more radically. Beginning in January 2017 they revised the data down, then up, then down then up again.
I have no idea what is going on at the EIA and I am not sure they do either.
If you lower some or many points the average will go down. You could also have some “slightly above average” to mask the effect.
My experience working at an Energy department doing forecasts.
You are constantly under the pump working flat out everyday. There is not a bunch of guys sitting around having tea and cookies.
There are approvals and overrides (management hierarchy can override the forecast with new values).
It is an iterative process all month long, no break for the weary…u have to start on next months forecast and the other reporting and analytics you have to do.
Other government departments can throw random data requests at you…and you have a statutory obligation to deliver them.
Understaffed. Data and Analytics people are 6 figure salaries.
Things go wrong in IT. Servers fail, Software has bugs, Data gets mistakenly deleted…etc etc…
1 or 2 guys in the room know how to run the forecasting software and may be on vacation or sick.
Everyone thinks they have a better way of doing things.
EIA is doing best they can,
but I doubt the management hierarchy are peak oilers. If the numbers aren’t going up they think someone made a mistake.
Andre that is all well and good as far as forecasts go. The EIA does make forests in their Short-Term Energy Outlook. But my complaint has nothing to do with their forecast. My complaint is about their historical data! Forecasts are uncertain, but history is fixed. One cannot change history. History is what it is. Why does the EIA’s historical data keep changing?
Ron
I did receive an email from the EIA explaining that they were in the process of splitting out condensate data for Non-OPEC members. See below.
“We are in the process of splitting out crude oil and condensate production for non-OPEC participants in the OPEC+ agreement and it looks like our Russia condensate production data didn’t get picked up in the latest data load. We will work on fixing this.”
“There are approvals and overrides (management hierarchy can override the forecast with new values).”
Where I have worked doing forecasts (Telco, Energy, etc). You spit out a spreadsheet and the management can write in new values for the forecasts including historical values .
You reread in the spreadsheet and go with managements values instead of what the software produced.
Historical data can change if it was wrong…or got loaded incorrectly…..or a new set of data mapping rules or algorithms are implemented.
The world of data is very complex
I don’t know. what the motivation would be to purposely change it by human intervention………..
Ron,
There are humans at the EIA, and they are fallible. Historical estimates change as data becomes more complete, so historical data is not fixed.
The EIA may not be in control of their upstream source data.
Or some other department or organisation generates it and they have to react to historical data changes that they aren’t in control of.
In a large organisation, what seems like a reasonable request like “stop changing historical” data can fall on “deaf ears” because they don’t want to spend the money to fix the root cause of the problem.
Where I work now (not energy) we grab 5 years of historical data because the data in the upstream data warehouse does change and we don’t know why.
Some other department has asked them to change something and you have to just accept that.
Government organisations can be very territorial and won’t tell you why things are changing.
I think the oil statistics are getting more and more political and become geo-strategic narratives. Another sign we are at peak.
Exactly, see my other post today, whenever it appears : -)
Rig and Frac Report for September 29
Both Rigs and Fracs are Down again this week
– US Rigs down 4 to 447
– Permian rigs down 4 to 296 with 5 from Texas while NM added 1.
– Eagle Ford flat at 43
– NG down 1 to 105 (not shown)
Fracs down 4 to 255
Go figure. Rigs down, Fracs down, US Production up. Major efficiencies somewhere.
“Major efficiencies somewhere.”
IMHO I wouldn’t agree with that way to interpret it. I think of it as a “constellation/configuration moment” or a “leanness accident”. I’m going to sound weird and esoteric, but it really isn’t that mysterious or mystical. From what I have read and seen on this blog and it’s informed commenters, shale wells reach maximum productivity at around 3 months from initial drilling/fracking completion. Assuming a maximum number of financially viable wells were completed before a financially viable horizon came to the fore (determined by the increasing cost of capital i.e FED rate hikes) then what we’re looking at is the snapshot of the moment where returns are ahead of costs and operations, but because it’s shale, costs catch up and negate returns relatively quickly .
The configuration/constellation of factors give the impression of efficiency or pseudo efficiency. Shale has always been lean and its not a surprise when it looks lean and toned right before it atrophies.
What I am trying to say is this: if shale drilling stopped today, maximum new well productivity occurs 3 months from now on average. That fact alone can momentarily/temporarily obfuscate/compensate for the fact or explain why things look super efficient if drilling should roll back today as well. We stop drilling today, but theres still three months to reach peak from a newly added shale well, despite ceasing new drilling. Maybe “activity-production differential” is what this seeming “major efficiency” is.
Horizontal wells carry about a six month inventory of DUCs. It may be less in the Permian but there are a number of vertical rigs operating there, which can drill wells relatively quickly and with virtually no delay before completions, and therefore skew the overall numbers. Some DUCs don’t get completed so the average time between drilling and completion might be about 5 months. There might be another couple of months before maximum flow. Therefore it may not be surprising that the accelerated decline in rigs that started in may hasn’t yet really shown much impact on completions or reported production. If this is the case then any effect there is will likely show up starting with October reported numbers, probably most obviously in EF as this lost the most rigs early.
I meant to say “non financially viable horizon”.
The lag in shale can help make things look good for a short while.
Anon, you are correct, as is Mr. Kaplan; there are NO improving “efficiencies” occuring in the tight oil patch other than longer laterals and proppant loading for cash flow purposes, that in turn reduce EUR, RR of OIP and hurt LT well economics. Everything that looks good today actually happened 6-8 months ago, including over 500 DUC completions not included the normal inventory scheme. Rigs didn’t start going to the barn until May. Wait to 1Q24; you won’t like it.
From three days ago…
https://www.oilystuff.com/forumstuff/forum-stuff/here-is-what-you-should-know-about-july-us-production
Thanks Mike,
Any guess for Permian tight oil output in 1Q24?
My guess for Permian tight oil output for 1Q2024 is about 5300 kb/d plus or minus 50 kb/d.
To Dennis:
My guess is your estimate is heavy.
EIA drilling report has Permian production peaking
https://pbs.twimg.com/media/F7PIjLsa0AEQnqg?format=jpg&name=small
Some of you may need to sit down for this. This is a bit like when you first found out there really is no santa clause. As I have been stating for some time, like years, there is no energy transition. There never was one. All the Green Energy buildout is accomplishing is gaining some part of NEW energy demand and driving up cost and bankrupting the nations who are on that path. The data is clear and has been, but easily ignored by the blue pilled green cult followers. NOW comes Larry Fink of Blackrock, you know the puppet master who was in the tank and the BIG MONEY ESG green energy cheerleader.
“Larry Fink oversees $10 trillion in assets for BlackRock, the world’s biggest asset manager. BlackRock was ridiculed by some late last year for calling on companies to invest through an environmental, social, and governance lens.”
Stating:
“We are not going to have a transition unless we can find technologies to bring down the competitive cost of renewables. We cannot do that.” Fink said, adding that BlackRock conducted a survey that showed 57% of their global investors are planning to put more money into decarbonization technologies.
“We saw what happened with elevated energy prices just two years in Germany and in Europe. You can’t have a transition.” Fink argued that when energy prices go up, emerging nations use more coal—because “life is more important than the future.”
https://oilprice.com/Latest-Energy-News/World-News/No-Energy-Transition-Unless-Tech-Can-Make-It-Cost-Competitive-BlackRock.html
This is a bit like the Pope telling all catholics he was wrong about Jesus Christ.
Now as a country bumpkin, dull spoon and all around low level scientists (geologist)with barely average grades, it was and has been obvious to me as I was trained to 1) think critically, 2) use all available data to draw conclusions, 3) be skeptical of any and all governments claims regrading, well everything. Lucky me as I have made a fortune exploiting the arbitrage between energy fiction and energy reality.
So as we move forward it might help to recognize people all over the world will chose life and comfort NOW and all the scare tactics, chicken little arguments, over the top predictions(Al Gore), personal attacks, name calling and intimidation will not change that. If you truly are concerned regarding the slight (very slight) warming and any implication to the planet in the future you might need to adjust your approach to what will actually work, what can be done (accepted) by the worlds population, and what is affordable. Nat gas is the future, say that out-loud to yourselves 3 times and you will be on the path toward a better outcome. Accept and embrace governments lie to us and that any true energy alternative will be designed and build out by the private sector, without force or coercion when the technology and cost are truly ready for prime time.
“its good to be the king”👑
A 100% transition to non- fossil fuels is of course not going to happen.
But a transition to a situation where 30-80% of global consumption is non-fossil will certainly happen.
Its a matter of time as fossils deplete. Nothing complex on that.
Whats up for grabs is the speed of deploying complimentary energy systems and the eventual size of the energy pie.
Some regions will do much better than others, depending on natural bounties and on choices made.
To rely heavily on a depleting source without aggressive action at replacement mechanisms is the greatest foolery.
We are in the process of transitioning. There are large incentives for purchasing alternative cars and appliances. Tax credits are there for EVs, electric cook (induction) stoves as opposed to those fueled by natural gas, and better insulating our homes. We are becoming “energy independent” not by drilling more but by switching to electric based transportation. The question comes down to rates of change and adoption. Will the cavalry arrive in time to save the day (or what’s left of it)?
https://corporate.exxonmobil.com/-/media/global/charts/global-outlook/2023/2023-globaloutlookcharts_liquid-supply-growth.png?usecustomfunctions=1¢ercrop=1
I entered the link to the 2023 Exxon Oil Supply by Type graph that I have mentioned several times on this site. One of the things I have noticed is that there is no sharp drop in supply. It’s fairly flat all the way to 2050 (and beyond) while some of the graphing on this site shows a very pronounced drop off. Where does reality prevail?
Peterev,
My analysis assumes that a transition to electric transport will occur and that oil prices start to drop in 2033.
Also note that many of the charts posted do not have a scale to zero which makes decline appear steeper.
The scenario below assumes the EIA STEO output estimates are achieved with flat output from 2024 to 2027 followed by decline. I assume oil prices don’t start to fall until 2050 (very slow transition to EVs). Chart is zero scaled. It is different from Exxon scenario which I believe is too optimistic.
Dennis
Have you properly considered that oil companies including Aramco are in the process of converting or building new plants that will convert up to 8 million barrels per day of oil into chemicals.
Saudi Aramco et al are smart enough to realise that electric cars would reduce the demand for oil, so they will use that spare oil to produce chemicals which will make a much bigger profit.
Charles,
No I have not input every possible future scenario into my model, my expectation is that transportation demand will fall to the point that demand for oil will decline faster than the decline in oil supply. It is possible the scenario is incorrect, it is also possible ththe Saudis will take market share in petro chemicals from other nations as they have a cost advantage that may drive other petrochemical producers out of business. We don’t know how it will play out.
I doubt the Exxon scenario will be correct.
Dennis
The amount of oil being used in crude to chemical plants in the coming years is certainly one to watch.
It could change the balance of supply and demand considerably
Charles,
I expect that number will grow, but that growth is likely to be less than the decline in demand for land transportation use imho.
Jevons paradox?
Maybe——
Texasteatwo,
Natural gas will also deplete. For the World perhaps 2033 will be the peak at about 167 TCF per year (US production in 2022 was about 40 TCF per year) assuming a URR of about 18000 TCF.
https://www.zerohedge.com/energy/these-are-worlds-largest-oil-producers
Ranked: Oil Production By Country, in 2022
The U.S. has been the world’s biggest oil producer since 2018 and continued its dominance in 2022 by producing close to 18 million barrels per day (B/D). This accounted for nearly one-fifth of the world’s oil supply.
Almost three-fourths of the country’s oil production is centered around five states: Texas, New Mexico, North Dakota, Alaska, and Colorado.
We rank the other major oil producers in the world below.
Rank Country 2022 Production
(Thousand B/D) YoY Change Share of
World Supply
1 🇺🇸 U.S. 17,770 +6.5% 18.9%
2 🇸🇦 Saudi Arabia 12,136 +10.8% 12.9%
3 🇷🇺 Russia 11,202 +1.8% 11.9%
4 🇨🇦 Canada 5,576 +3.0% 5.9%
5 🇮🇶 Iraq 4,520 +10.2% 4.8%
6 🇨🇳 China 4,111 +2.9% 4.4%
7 🇦🇪 UAE 4,020 +10.4% 4.3%
8 🇮🇷 Iran 3,822 +4.6% 4.1%
9 🇧🇷 Brazil 3,107 +3.9% 3.3%
10 🇰🇼 Kuwait 3,028 +12.0%
“Notably, all top 10 oil giants increased their production between 2021–2022, and as a result, global output rose 4.2% year-on-year.”
Texas tea,
Propane, ethane, and butane are not oil. Crude plus condensate is oil and in 2022 US average oil output was 11.9 Mb/d.
HHH,
My expectation is $90 per barrel over next 6 months or so, price might rise if demand grows faster than supply over the next few years I doubt it rises to more than $135/bo in 2023$ over the next few years.
Not many are calling for 200 to 300 per barrel. Analysts are predicting about $85/bo in 2024.
Dennis,
Keep in mind that 30 million student loan borrowers will have an average $400 monthly payment starting October 1st. All of these borrowers live paycheck to paycheck. They have to cut spending somewhere to payback these loans.
61% of all Americans live paycheck to paycheck. And 45% of all Americans making $100,000 a year live paycheck to paycheck.
Means they’ll be buying less stuff that is made in China. So don’t count on China to turn around.
Any prolonged government shutdown would also have some negative consequences on demand.
This seems an interesting analysis
https://blog.gorozen.com/blog/oil-market-natural-resources?utm_campaign=Weekly%20Blog%20Notification&utm_medium=email&_hsmi=276319262&_hsenc=p2ANqtz-9ZeGZig1vYvfUjuaPUQhmF5qx-v5B1HRucsBheNtkp5Tb7mbAuVU43IX4WUTP-Junj–U1k772jXTiGlWJdgreAR8HeOvSw-ViaW9giJixjItGi5I&utm_content=276319262&utm_source=hs_email
Key paragraph
According to the IEA, demand will average 103.2 m b/d in the second half of 2023. Global supply (including OPEC NGLs, processing gains, and biofuels) will only reach 101.5 m b/d, leaving the market undersupplied by a massive 1.7 m b/d. We think this understates the problem. The balancing item ran at 1.3 m b/d in the first quarter, suggesting demand was understated. Adjusting demand higher by 1 m b/d for the rest of the year implies a 2.7 m b/d deficit that would take inventories down by over 400 mm bbl by December 31st. At that point, commercial inventories would reach a record 500 mm bbl deficit while total inventories would reach a record 820 mm bbl deficit – the lowest levels since our data begins.
JT.
Good piece thanks. They also call for the Permian to roll over in 2024, I disagree, I think Permian growth may be slower than the past 12 months going forward, but think the rollover occurs in 2027.
Here is how the Washington Post provides analysis about fossil fuels. A bit lacking in focus.
https://www.washingtonpost.com/climate-environment/2023/09/30/end-fossil-fuels-biden/?commentID=30cf6a11-cdcf-4ad2-b193-02050f9f4730
Appomattox is the first HPHT development in the GoM, Anchor and Shenandoah are in development and due for start up in the next couple of years, Sparta (ex North Platte) is under its third operator and still looking for a cost effective solution, and Davy Jones is a potential shallow gas development and probably not economical. HPHT need 20,000psi (or higher) wellhead equipment and special steels to handle the high temperatures. They are high cost and high risk. Appomattox was originally expected to recover 650mmboe from the Vicksberg and Appomattox fields (with another 150 in surrounding fields for future tie-backs), but that was downgraded after the first wells come on stream, probably to around 400. However even this is looking optimistic with both on-line fields appearing to be past peak after so far only producing 110 mmbbls of C&C in Appomattox and 30 in Vicksberg. The 175kboe nameplate for the platform has never been achieved and two medium tie-backs are in development: Rydberg at 13kbpd due later this year and Dover at 17kbpd in early 2025. Gettysburg and Fort Sumter are smaller discoveries in the area. Even with these it seems unlikely that throughput will exceed 100kbpd. Operators of the other HPHT projects might be a bit nervous.
OPEC Oil Output rises 120,000 bpd in September- Reuters survey
OPEC and allies, known as OPEC+, agreed to cut their output target by 2 million barrels per day from last November through 2023. As part of this, the 10 OPEC members bound by the deal had a target to produce 25.416 million bpd.
In addition, several OPEC+ members in April pledged additional voluntary cuts of 1.66 million bpd with effect from May 2023, of which OPEC’s share amounts to 1.039 million bpd.
Saudi Arabia said in June it would make an extra voluntary cut of 1 million bpd for July, which it later extended to include August and September. Algeria made a further cut of 20,000 bpd in August although this was not maintained in September.
All of these cut decisions bring the implied OPEC target for September to 23.377 million bpd, based on Reuters calculations.
The figures in the first, second and fourth columns in the table are in millions of barrels per day.
The table in the Reuters report is bigger than posted.
https://www.reuters.com/article/oil-opec/table-opec-oil-output-rises-120000-bpd-in-september-reuters-survey-idUKL5N3B82LJ#
What should we make of the recent uptick? Does it not take more time to compile such recent production figures?
https://www.eia.gov/dnav/pet/hist/LeafHandler.ashx?n=PET&s=WCRFPUS2&f=W
Not much to make, just Nigeria up that amount, the rest are sum zero…
Likely a very temporary situation for Nigeria
Well, the uptick i mentioned is about US crude production as reported by the EIA here: https://www.eia.gov/dnav/pet/hist/LeafHandler.ashx?n=PET&s=WCRFPUS2&f=W
No other countries involved in that chart.
What should we make of it? Isnt it a little too soon to report on September figures already?
EV Battery Factory Will Require So Much Energy It Needs A Coal Plant To Power It
“Kilowatts don’t just fall out of the sky,” he said.
Besides the energy demand for the industrial capacity in America, there will be more demands placed on the grid to charge all these vehicles.
“That electricity has got to come from somewhere. It’s not going to come from solar farms and wind turbines,” he said.
Western said renewables are a great source of “auxiliary supplemental power,” but without a solid base load to ensure a reliable energy supply, they don’t work. These are realities that some still don’t want to accept.
“This administration wants to put lipstick on a pig, but it’s still a pig,” he said.
https://cowboystatedaily.com/2023/09/22/ev-battery-factory-will-require-so-much-energy-it-needs-a-coal-plant-to-power-it/
again I would like to personally thank the green energy cult for making life life so much easier, prosperous and guaranteeing me a lifetime of full employment in the oil and gas business supplying energy (even as it is waisted on obsolete technology) this come from the bottom of my oh so black gold heart.
As I have been saying for month TEXAS will use more gas and coal to shore up its wind and solar shortfalls. so now we get the official announcement.
Oct 2 (Reuters) – “The Electric Reliability Council of Texas (ERCOT) sought bids from power producers on Monday to increase its operating reserves by around 3,000 megawatts in case of any unexpected spikes in demand during the upcoming winter season.”
“The Texas grid has been concerned about extreme weather since a deadly storm in February 2021 left millions without power for days as ERCOT struggled to prevent a grid collapse after the closure of an unusually large amount of generation.”
“The request for proposals seeks capacity from both dispatchable generation and demand response solutions to cover the period of December 2023 through February 2024, the Texas power grid operator said, citing the significant peak load growth since last winter and retirements of dispatchable resources.”
“Dispatchable resources comprise nuclear, coal, gas, biomass and energy storage,” but not wind and solar, which cannot control output based on ERCOT instructions, it said in an emailed statement.”
“ERCOT’s market notice said offers from mothballed or decommissioned units could include a more than 10% “Incentive Factor that reflects the revenues the unit owner determines would be necessary to bring the unit back to operation.”
“It determined that a winter storm comparable to December 2022’s Elliott would raise the risk of an energy emergency during the peak-demand hour to almost 20%, well above its 10% adequacy standard.”
https://www.reuters.com/business/energy/texas-power-grid-seeks-increase-operating-reserves-winter-preparation-2023-10-02/
It has been clear for now two years, to the most casual observers, the issue with Texas is the over reliance on intermittence energy during all to common and predictable high demand surges as well as the continued increase in overall demand. With the numerous “emergencies” we saw from June to mid September officials would have no choice but to once again build out reliable electrical energy capacity. All the green washing in the world can’t cover up the issues any longer.
Texasteatwo,
So now we need subsidies for fossil fuel, interesting. What happened to the free market?
First and the biggest cause for fossil fuels needing $ help is the First in Line subsidy for wind and solar then the investment tax credit and $/ kwh produced. Please Dennis, use your intellectual prowess to correctly put into the picture the cost of staffing and maintaining a fossil fuel plant that HAS TO RUN let’s say 500 to 1000 hours a year to prevent blackouts.
I suppose some want to run out of fossil fuel as soon a s possible.
They hope to make more money in the short term that way.
Good for them, they hope.
Hickory
Thanks for the truthful response. The cliff is in front of us, there is no question. I’m 76 and hope I’m not around when it happens. What I hate is the Great Lie that wind and solar will save the world from the carbon dioxide molecule. The world with limited oil and natural gas will not be a pretty place and in that world a few more PPM of carbon dioxide will not matter one iota.
In Germany wind and solar can only compete because they have dispatch priority.
https://energytransition.org/2017/06/new-proposals-would-kill-solar-and-wind-in-eu/
Coal and gas must shut down wherever wind and solar are producing no matter what the price.
Wind and solar also have minimum price guarentees. And compensation if they are producing too much and nobody wants the electricity!
Then certain people on this website say coal cannot compete and wind is cheap.
So Ervin it sounds like the plan is, burn more fossil fuels, add more people to the planet, mess up the climate even more, then let them all die when fossil fuels run out but it won’t matter because I’ll already be dead too. Sound about right?
Ervin-
“the Great Lie that wind and solar will save the world from the carbon dioxide molecule”
When it comes to energy supply and security, which is everyone’s (99%) primary concern, the rapid deployment of wind energy where it is windy and solar where is it sunny on a big scale
is a straight forward way to extend other energy sources that are now available, including the big depleting ones.
The utilities of the world see this clearly and are revving up to make it happen.
It is silly for TexasTea to say it is a failed effort (solar and wind in Texas) when it is only the first inning on this,
although I will point out that all of the human energy production systems will eventually look like a failed effort.
When it comes to global warming from humanities mass combustion experiment, only the eventual inability for humanity to afford more combustion materials will slow down the process, with a few possible exceptions (that are a very big roll of the dice to rely on)
-reverse grandscale geoengineering. I don’t trust anyone on these ideas
-an event of massive volcanism such the Deccan volcansim ‘episode’
-switch from fossil fuel to fusion energy. Feel free to hold your breathe while waiting for this, if you are optimistic about the prospects. “Since the 1970s, commercial deployment of fusion power has always been about 40 years away.” Maybe someday.
Nonetheless, I am 100% in favor of global abandonment of coal as best we can manage at a brisk pace. The case for this action as a solid benefit to the biosphere (which by the way includes us) is overwhelming.
If you take carbon dioxide out of the equation reaching that 99% would be allot easier and an infinitely more honest task. Thirty years ago we were told that by now there would be ice free Arctic summers and Indian Ocean island nations would be under water. I guess maybe in 2043.
It’s rare to meet a person who is dissatisfied with how quickly global climate disruption is progressing lol
Thirty years ago we were told CO2 wasn’t a problem, strangely, from the companies that produce a metric buttload of it. Was most curious, given they did studies in the ’70s and ’80s that showed what a clusterfuck we were heading for.
Care to show where ice free summers in the Arctic were predicted? Because the IPCC had that pegged at later this century, and now it’s going to be by the 2030s. You’re getting mad at things that don’t exist and, in actuality, the reality is worse than what the people you guys keep pointing to as “alarmists” state.
Yeah, the scientists are wrong. They’re massively conservative on all fronts.
But don’t worry. I’m sure solar and wind will offset the gigatonne of carbon pumped out every couple weeks by our species.
Ervin Wrote: Thirty years ago we were told that by now there would be ice free Arctic summers and Indian Ocean island nations would be under water.
Bullshit, we were told no such thing! Why do deniers feel they must tell fucking lies to make their case? Do you do not know that we have the internet and can fact check your fucking lies? Post a link that supports your bullshit lies, or shut the fuck up.
Thanks Stephen. The irony is hilarious.
@ron patterson : the PIOMAS said that, with the graphic of the decrease of ice pack surface before 2007, the Arctic Ocean would be free ice in 2030-2040. But, in the meantime, the Arctic dipole phase enabled the conservation of the ice pack and the PIOMAS didn’t know that.
Global combustion won’t peak until the collective purchasing power of humanity can no longer afford to find find more stuff to burn.
And within 20 years after that the population will peak.
And by that time the tree of life will have yet more dead and barren branches.
And the world will be much hotter.
And Ervin (if he lives until a ripe old age) will see stuff he will blame on Gods failure to love all creatures… who don’t pray correctly? (sorry Ervin this is in jest, I hope).
Hickory
Global abandonment of coal.
But they are not, they are doing the opposite
https://globalenergymonitor.org/press-release/china-permits-two-new-coal-power-plants-per-week-in-2022/
India will go ahead with every single plant under construction
https://energyandcleanair.org/publication/india-enters-an-unnecessary-coal-plant-permitting-spree-in-2023/#:~:text=Three non-captive coal plant,additional coal plants (2.9 GW
That’s about 35 1Gw plants being built
https://news.mongabay.com/2023/08/captive-to-coal-indonesia-to-burn-even-more-fossil-fuel-for-green-tech/
All this will push global temperatures well past 2c increase
https://pbs.twimg.com/media/F7hnna7bYAA2v80?format=jpg&name=small
Good for somebody?
Bullshit indeed
Scientific American Sept 24, 2012. By David Biello
What will Ice-free Arctic summers bring.
Third paragraph
Some Ice Scientists have begun to believe that the Arctic will be ice-free in the summer as soon as the end of this decade. The 2023 ice melt ended with almost 5000 cubic kilometers of ice.
Erwin, do you have any idea how to post a link? Try that instead of just telling us what the article says. We would like to read it for ourselves. I will not just take your word for it. I have never heard of an “ice scientist.” And what would an ice scientist know about climate change? Just because someone knows a lot about ice does not mean he knows diddley squat about climate.
Ron. I don’t know how to post a link. Sorry.
Ron Here is a link to the article
https://www.scientificamerican.com/article/arctic-sea-ice-loss-implications/
Note the quote is “some scientists believe…the artic may be ice free…”
Thanks, Dennis. I realize that there were overzealous people back then. But the fact that Ervin said “ice scientists” instead of just “scientists” stresses the fact that we need to post a link when we make such claims. I could be wrong but to my knowledge there is no such thing as an ice scientist.
However, anyone can “copy and paste”, or should be able to do so.
Your article is behind a paywall, so I have no idea who these scientists are or when these scientists are predicting what.
Irvin – It looks like you are posting your bat-shit-crazy garbage to the wrong feed, this is the petroleum only side…please look for the “Im-bat-shit-crazy” side of POB…
For sea ice minimums:
1950- >8 million SQ KM
1975- 8 million SQ KM
2000- 6 million SQ KM
2025- 4 million SQ KM (Est.)
2050- 2 million SQ KM (Est.)
On the floor of the US Senate in 2009 John Kerry said that the Arctic would be ice-free by 2014.
Erwin, stop this shit! Either post the link to support your claims or do not post at all. I think you are nothing but a fucking liar. Post the link to back up your claim or shut the fuck up.
The Guardian. December 2013
The Department of Energy lead by US Navy researchers have concluded the the Arctic could loose its ice cover as early 2016. I have to ask myself why Ron would make such a definitive statement when a simple internet search can find so many examples that proves otherwise.
Again, post the link to back up your claims or stop posting!
I am going to bed now. Tomorrow if you have not posted links to back up your claims, you will post no more!
Ron, Ervin is correct. His citations are correct. There have been lots of alarmist statements, many by probably well meaning folks trying to avert future disaster. This is not to say that there is not a probably insurmountable environmental disaster ahead. But Ervin is correct to point out all the exagerations and overstatements. There is a genuine lack of credibility.
Okay, perhaps you are right. But now the science has been improved. Now we know exactly what is happening and why. To deny climate change today just shows how uninformed anyone is. Either you believe in the science, or you are just a Flat Earther, and deny the science.
Ron
Here is the IPCC report. Possibly a bit of exaggeration above.
It is very likely that projected Arctic warming will result in continued loss of sea ice and snow on land, and reductions in the mass of glaciers. Important differences in the trajectories of loss emerge from 2050 onwards, depending on mitigation measures taken (high confidence). For stabilised global warming of 1.5°C, an approximately 1% chance of a given September being sea ice free at the end of century is projected; for stabilised warming at a 2°C increase, this rises to 10–35% (high confidence). The potential for reduced (further 5–10%) but stabilised Arctic autumn and spring snow extent by mid-century for Representative Concentration Pathway (RCP)2.6 contrasts with continued loss under RCP8.5 (a further 15–25% reduction to end of century) (high confidence). Projected mass reductions for polar glaciers between 2015 and 2100 range from 16 ± 7% for RCP2.6 to 33 ± 11% for RCP8.5 (medium confidence). {3.2.2; 3.3.2; 3.4.2, Cross-Chapter Box 6 in Chapter 2}
https://www.ipcc.ch/srocc/chapter/chapter-3-2/
Search for “Ice Free”
My take is that they will have the science down when they can produce a good mathematical model explaining the climate. I have not heard of the existence of such a model, so for me, the science is still quite foggy. There are increasing calls for climate scientists to integrate the role of
plants into climate models (see for example https://www.resilience.org/stories/2023-07-17/millan-millan-and-the-mystery-of-the-missing-mediterranean-storms/ and https://www.youtube.com/watch?v=B-oJyInmTTo)
Data, however, does indicate that something is happening with the climate. This year the Atlantic Ocean registered a significant rise in temperature.
Schinzy said:
There is ZERO consensus in climate science when it comes to explaining anything more difficult than the changing of the seasons. Actually AGW climate change is relatively simple compared to predicting the dates and intensities of the next several El Ninos. In fact AGW is really just a control knob elevating the temperature slightly, but trying to figure out the fluid dynamics of oceans and atmosphere that will control a massive global heat wave for several months at a time is a challenging mathematical physics problem.
“Could” is not the same as “will”. In this context could just means they ran various models within the range of their existing knowledge and the earliest ice free year came out as 2016. Could says nothing about the chances of it happening except it’s not 0 or 1. I could win the lottery next week but I’d be stupid to spend money assuming I will (i.e. not 100%), equally my house could burn down but I’d be stupid not to buy insurance assuming it won’t (i.e. not 0% either, could is somewhere in between). Two outlier weather events in 2007 and 2012 (when a virtual hurricane churned up the ice for a week in June) have shown that the ice can be lost quickly. If such events happened now, with the ice much thinner, all of it could definitely, and would likely, be lost, at least temporarily. Even without such extremes the decadal average ice cover is clearly declining, and probably at a slightly accelerating pace (see below). It is highly likely some years could be seeing zero coverage (usually taken to mean below a million square kilometres) in the thirties (but it’s still could not will).
About 4 yrs ago maybe I decided to attempt to challenge the imagination of some of those here by claiming that by year 2030 we would see global light vehicle sales consist of 90% vehicles with a plug.
Sounded outlandish at that time perhaps, but it was pretty clear that the trend was going to push strong in that direction, with oil depletion pushing up petrol prices.
Seems like the estimate may come in pretty close… maybe with a couple years.
https://www.utilitydive.com/news/evs-reach-86-percent-global-vehicle-sales-2030/695324/
Reports like this are completely meaningless. It’s hard enough to know what will happen one year from now. Forget about projecting things 7 years into the future. The times of predictability are over.
Agreed
In 2018 I was not saying you should bet your life’s assets on the specific projection,
rather pointing out that this major industrial transition in transportation (and thus energy)
was just underway and that it will happen more quickly and more completely than almost all of you are
considering. That still is the case today.
Sure, it might only be 86% by 2033. Close enough for me.
What I have no clear sense of is whether global light vehicles sales will be much higher or lower than they are today. I suspect lower, but that is predicated on a general pessimism about a finite world having 8.5 billion people (in 2030) and is not any kind of fact based projection.
“US shale bosses vow to hold back drilling despite rising oil price-
“America’s shale pioneers have vowed to keep a lid on drilling even if oil hits $100 a barrel, citing a need to maintain capital discipline and what they claim is a “war” on fossil fuels waged by the Biden administration.”
https://www.ft.com/content/056217fb-7e80-4da1-b6b8-489f8b20510e
Not surprising. Its actually good for the nations longer term petrol supply to restrain drilling and to have higher pricing for the products, however.
Great regardless of the reason, we need to actually drop production by 1% annually (will likely far exceed that soon enough though). The high price game is over, even if prices go thru the roof there’s not any growth left to be found…
The latest podcast from our old friend Nate Hagens ; “Peak Cheap Oil and the Global Reserve Currency – The Great Simplification”
The dilemma facing oil exporting creditor countries and oil importing creditor counties and the US that supplies USD to the world.
https://youtu.be/bIq0o40Jo80?si=B4UvIwf2GcuTVXbi
This is well worth the time it takes to watch.
John
WTI down 5.5% today. Obviously some CTA selling to lock-in profits from where they went long at about $70.
They selling on downward momentum has nothing to do with any news or data.
Yes pure future market mechanic. NASDAQ is up.
Luke Grommen: https://www.youtube.com/watch?v=bIq0o40Jo80 says the cost of LTO is going up 8-10% per year.
I just finished a hike while listening a good podcast interview with him on this subject and more. Good one…my expectation for future scenario of risks is in close alignment with what he touches on here
https://www.thegreatsimplification.com/episode/91-luke-gromen
A new update regarding US July Oil Production has been posted.
https://peakoilbarrel.com/us-july-oil-production-rises-on-texas-gom-jump/
A new Open Thread Non-Petroleum has been posted.
https://peakoilbarrel.com/open-thread-non-petroleum-oct-4-2023/