By Ovi
All of the Crude plus Condensate (C + C) production data for the US state charts comes from the EIAʼs Petroleum Supply monthly PSM which provides updated information up to July 2023.
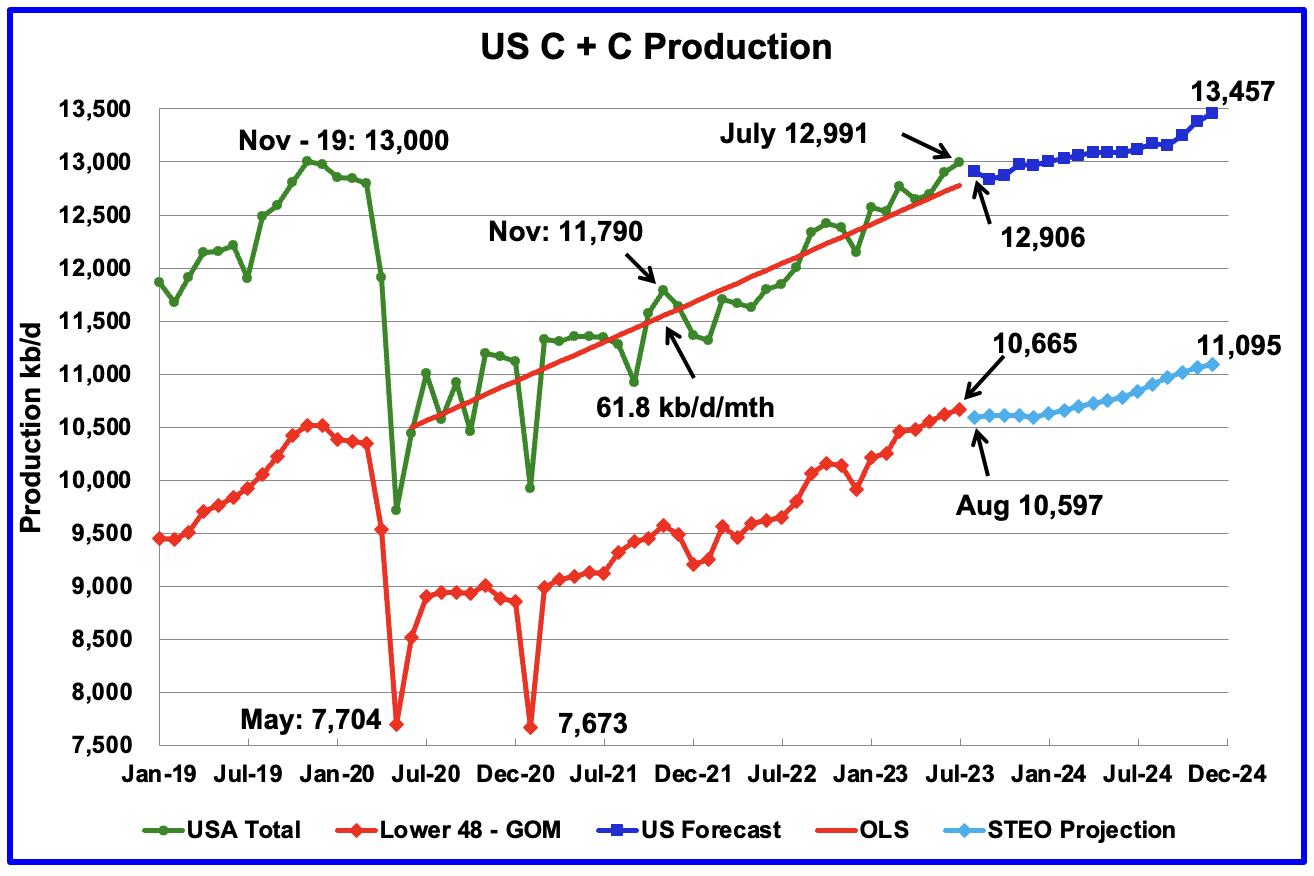
U.S. July oil production increased by 91 kb/d to 12,991 kb/d. The large increase was primarily due to a 73 kb/d increase in the GOM and a 72 kb/d increase in Texas.
The dark blue graph, taken from the September 2023 STEO, is the forecast for U.S. oil production from August 2023 to December 2024. Output for December 2024 is expected to be 13,457 kb/d which is 457 kb/d higher than the November 2019 peak of 13,000 kb/d.
The red OLS line from June 2020 to July 2023 indicates a monthly production growth rate of 61.8 kb/d/mth or 740 kb/d/yr. Clearly the growth rate going forward into the rest of 2023 and 2024, shown by the dark blue graph, is lower than seen in the previous July 2020 to June 2023 time period.
While overall US oil production increased by 91 kb/d, the Onshore L48 had a production increase of 44 kb/d to 10,665 kb/d in July.
The light blue graph is the STEO projection for output to December 2024 for the Onshore L48. From July 2023, to December 2024, production is expected to increase by 430 kb/d to 11,095 kb/d. However that increase appears to have two distinct growth periods, a no increase growth period out to December 2023 and a higher one in 2024. On average, the 430 kb/d increase indicates a monthly increase of 25.3 kb/d/mth or close to 300 kb/d/yr.
Oil Production Ranked by State
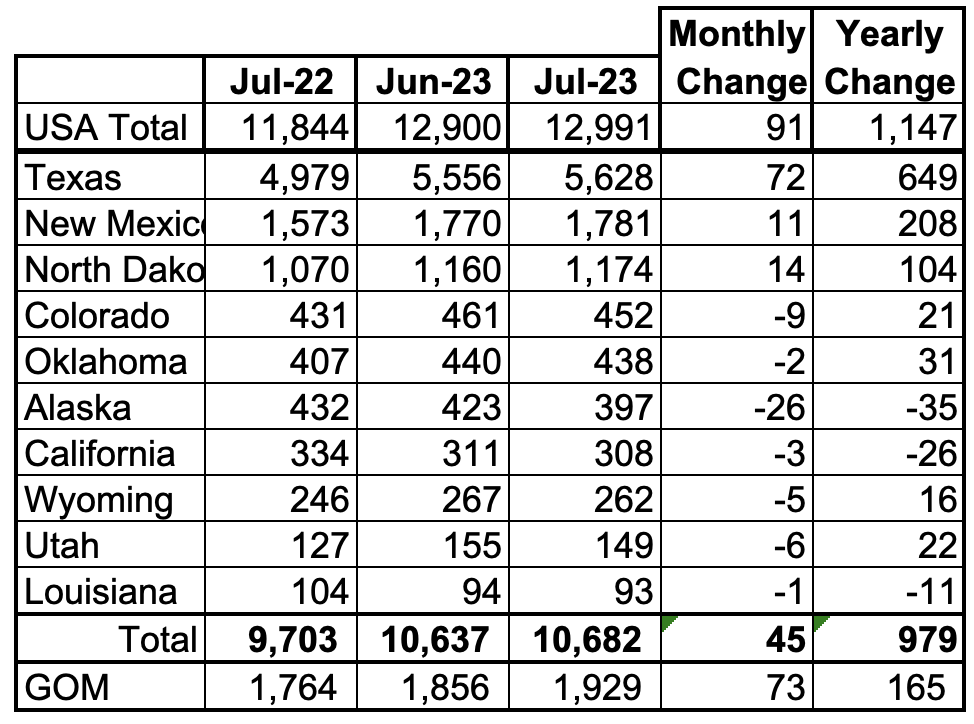
Listed above are the 10 states with the largest US oil production along with the Gulf of Mexico. These 10 states accounted for 82.2% of all U.S. oil production out of a total production of 12,991 kb/d in July 2023. Note that MoM production increases from the GOM and Texas are the main components of the overall July increase.
On a YoY basis, US production increased by 1,147 kb/d with the majority, 857 kb/d coming from Texas and New Mexico.
On a YoY basis, the average growth rate of Texas production has been 54.1 kb/d/mth or 649 kb/d, (See next chart), an incredible rate considering that the rig count and frac spread count are down. For how long can this rate be sustained?
State Oil Production Charts
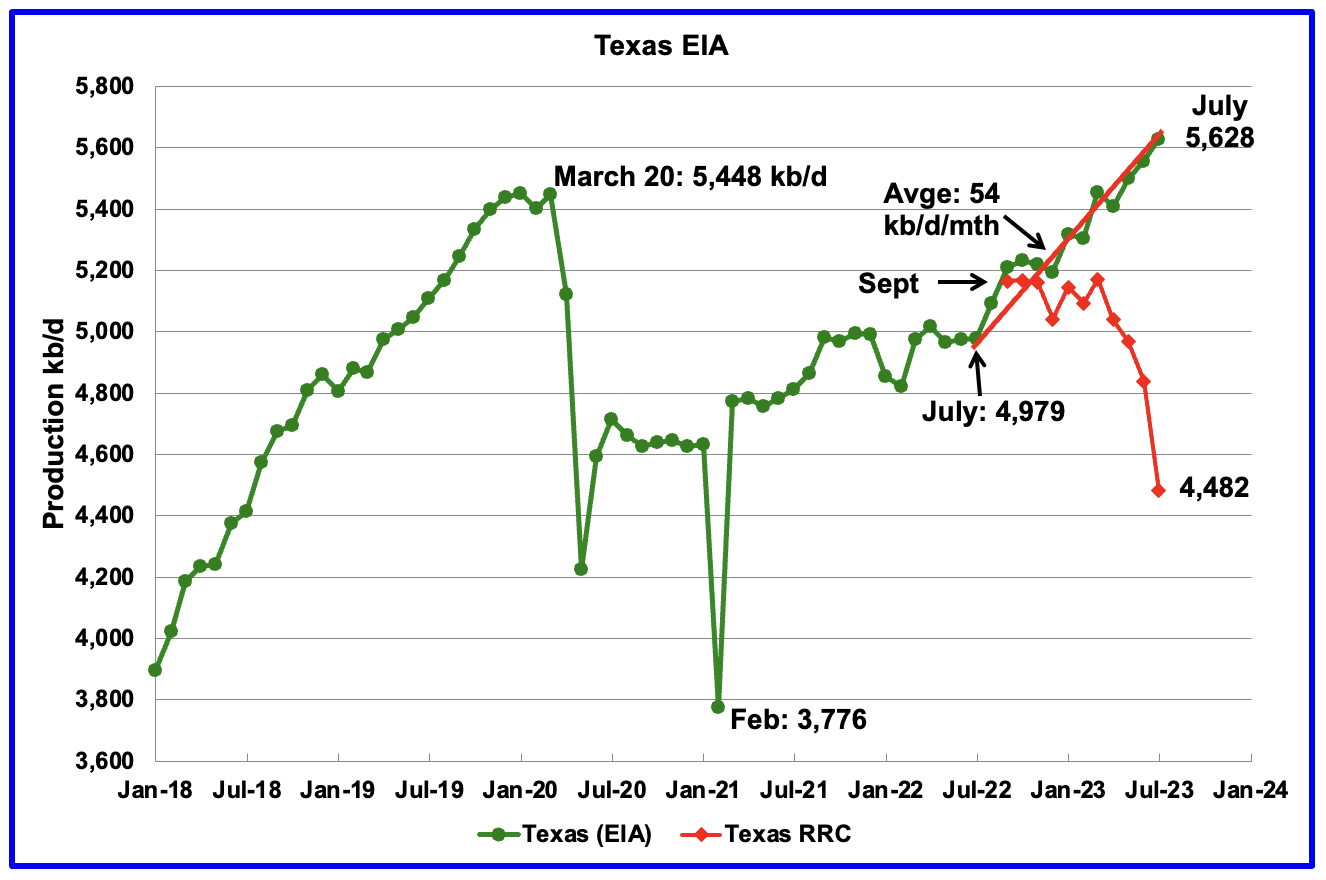
Texas production increased by 72 kb/d in July to 5,628 kb/d. July’s output is 180 kb/d higher than the March 2020 high of 5,448 kb/d.
The Texas RRC September production data has been added to this chart to compare it with the EIA data. While the first three red markers, September, October and November 2022 are reasonably close to the EIA’s production, the July 2023 gap is big. Not sure whether the July gap of 1,146 kb/d between the EIA and the RRC is typical for the RRC’s first report for the latest month.
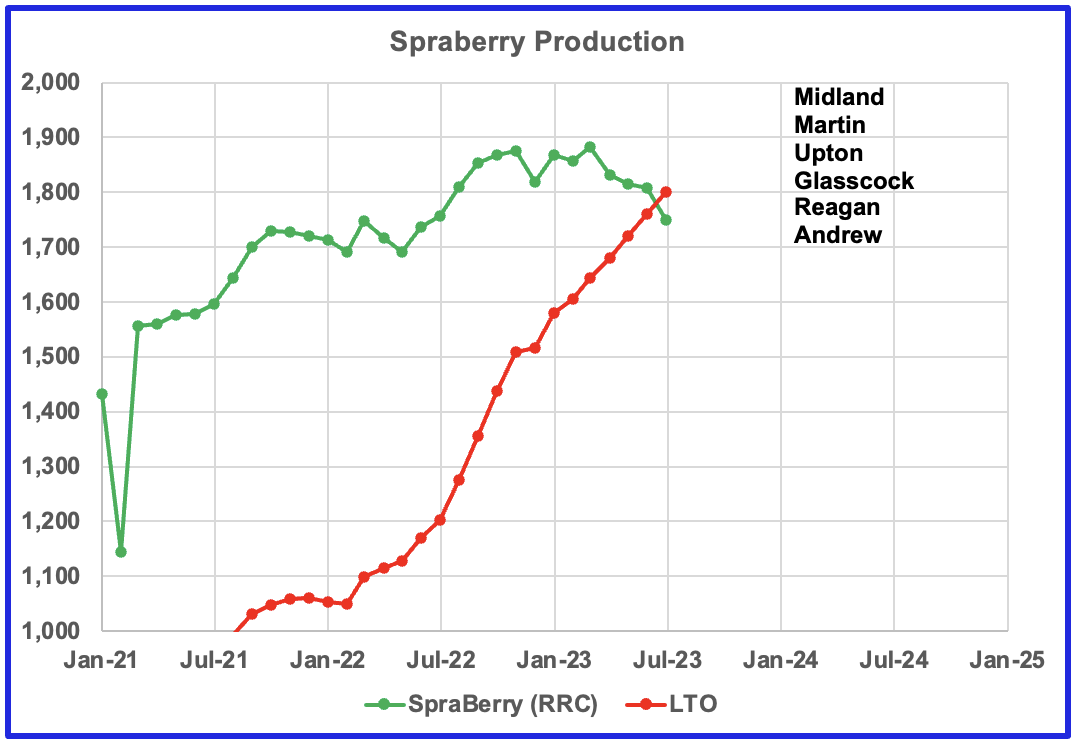
This chart compares the LTO projection for the Spraberry trend vs production from the six main Spraberry counties shown.
According to this Source, the Spraberry includes “portions” of Irion, Reagan, Upton, Glasscock, Midland, and Martin Counties, although the underlying geologic unit also touches Dawson, Crockett, and Andrews Counties. Currently Dawson, Crockett and Irion have minimal output of ~10 kb/d to 15 kb/d. The Spraberry RRC production shown is for the whole county, not portions.
This chart has been added to show the coincidence in the production increase shown in the LTO Spraberry trend and the EIA Texas output. Over the period July 2022 to July 2023, Spraberry output rose by 597 kb/d while the EIA is indicating that overall Texas production rose by 649 kb/d. These two increases are very similar. Also the overall LTO increase over the same period is 633 kb/d. Over the same period the RRC data is essentially flat, especially the production from September to March. The production from April to July is down due to late incomplete reporting. Also the growth rate from July 2021 to July 2022 is much lower than the growth shown in the LTO data.
These three increases are so close as to make one wonder if the EIA is using the LTO projection to update the latest monthly Texas production? For the next several months, the Texas chart will include the results from the Texas RRC to see how well it tracks the EIA forecast to try to answer that question.
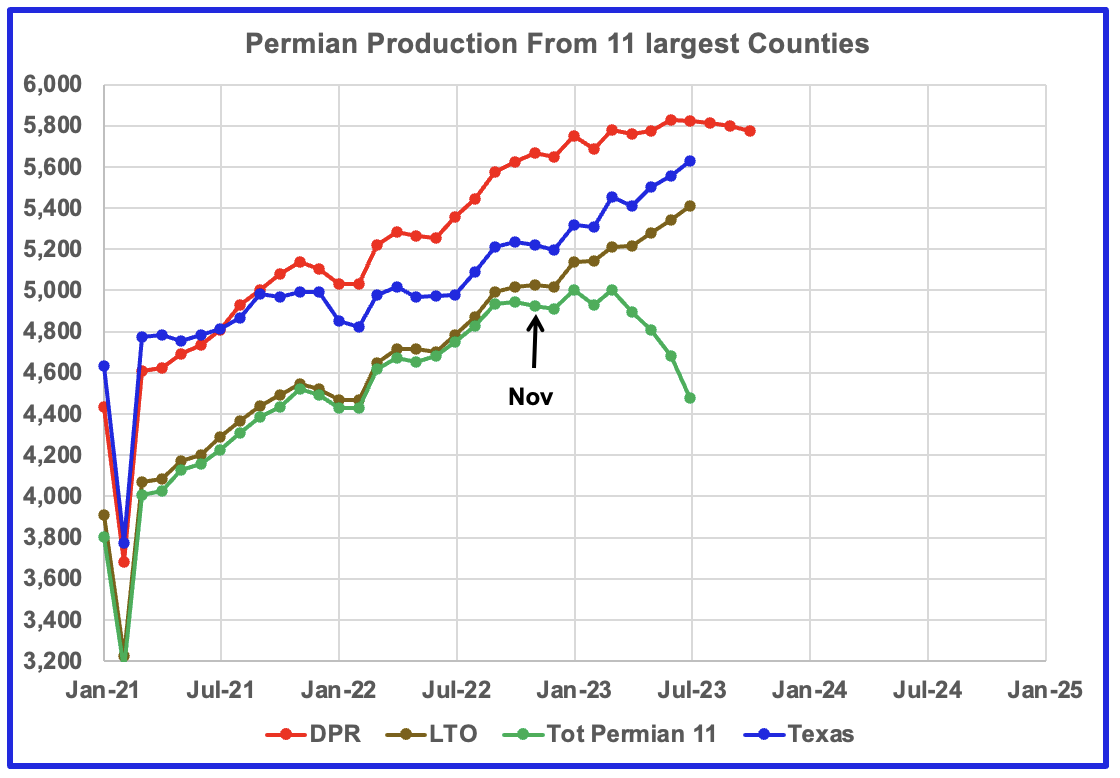
This chart compares Permian and Texas production in four different ways. The DPR Permian, LTO Permian and Texas graphs are from the EIA. The total Permian graph is from the Texas RRC and New Mexico Oil and Gas division and includes production from the 11 biggest Permian counties. What is interesting to note is the rough parallelism between the Permian 11 and the DPR from November to March. The divergence after March is due to the late reporting from the Texas RRC and New Mexico O & G division. As noted above the LTO graph is more similar to the Texas chart, especially after July 2022. From January 2023 to July 2023 the average gap between the Texas and LTO graphs is 203 kb/d.
Over the next several months, it will become clear which one of these four graphs best reflects the trend in Texas production, the DPR or LTO.
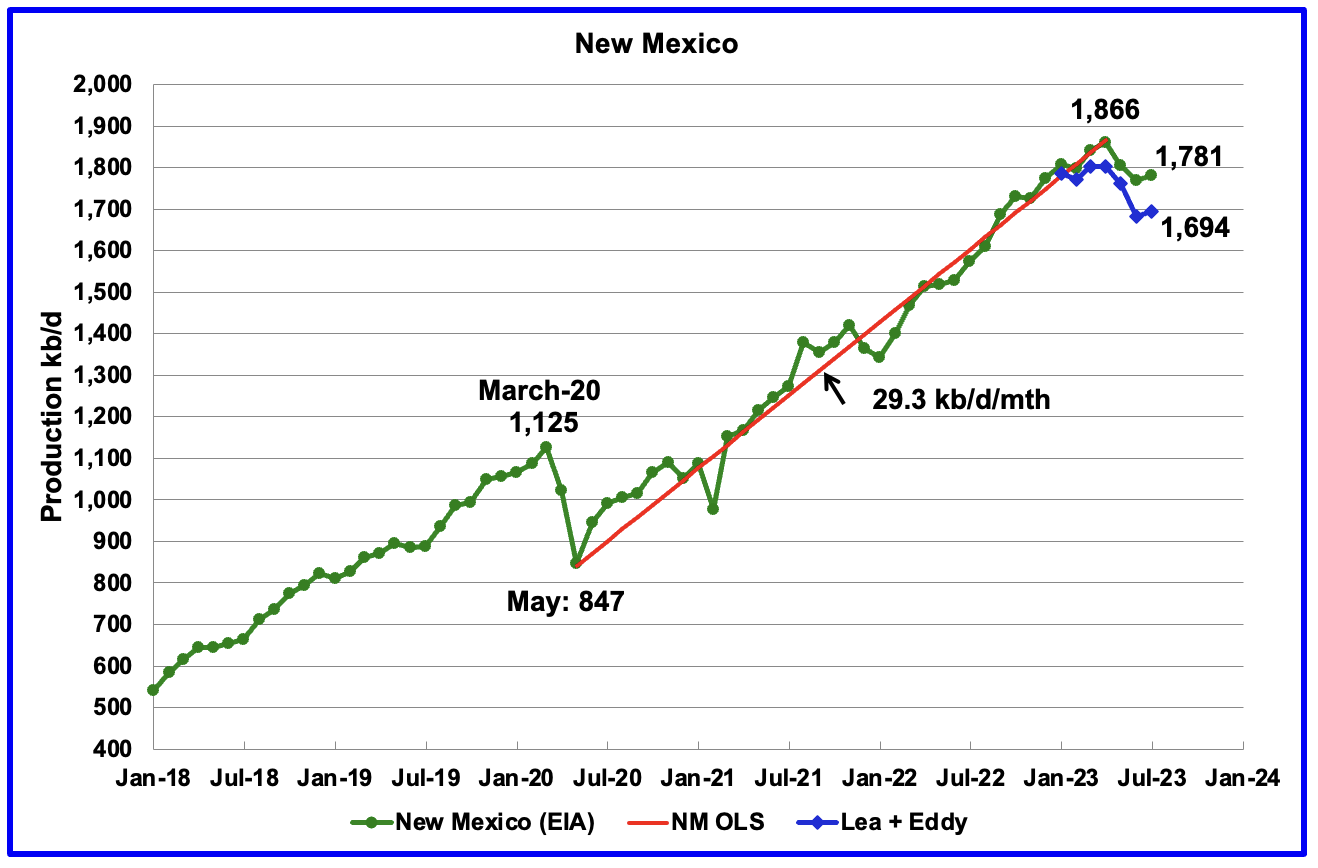
New Mexico’s July production rose by 11 kb/d to 1,781 kb/d. Lea + Eddy rose by a similar amount, 12 kb/d.
Of the 1,781 kb/d, 1,694 kb/d (95%) came from the Lea and Eddy counties. The Lea and Eddy county production data for July is not complete and will be updated over the next three months. The first blue marker is January’s total production from NM’s Lea and Eddy counties. Their combined output was 1,785 kb/d compared with 1,808 kb/d for all of New Mexico, a difference 23 kb/d. For February, the comparable production numbers are 1,799 kb/d and 1,771 kb/d, a difference of 28 kb/d. The combined output for all the remaining NM counties is close to 30 kb/d, which could be added to the May to July production.
More production information from these two counties is reviewed in the special Permian section further down.
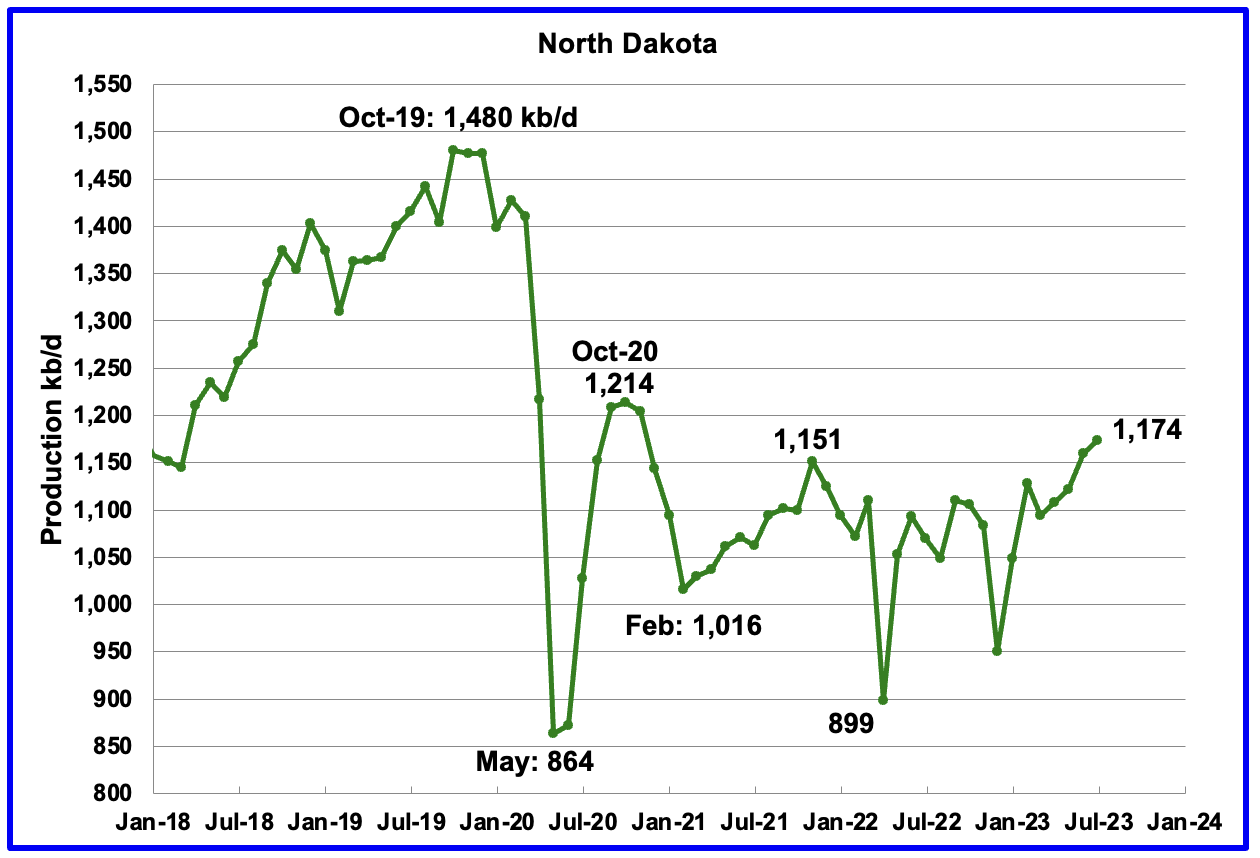
July’s output increased by 14 kb/d to 1,172 kb/d. Current production remains below October’s 2020 production of 1,214 kb/d. Production over the next few months may slow as the rig count is projected to drop according to this Source.
“North Dakota oil production rose in July to a level not seen in two years, while natural gas production set a monthly record, the state’s top oil regulator said Thursday.
The state produced an average of nearly 1.18 million barrels per day in July, a 1% rise from June.
The state’s drilling rig count as of Thursday was 33, down from 37 in August. Rig count statewide is expected to gradually rise to the mid-forties over the next two years, according to Mineral Resources.
Helms attributed the low rig count to workforce shortages.
The rig count was still high enough to maintain production Helms added, but not enough to “create strong growth of more than 1 or 2% (annually).”
Well completion, which is the process needed to prepare a well for production, rose to 91 in August.“
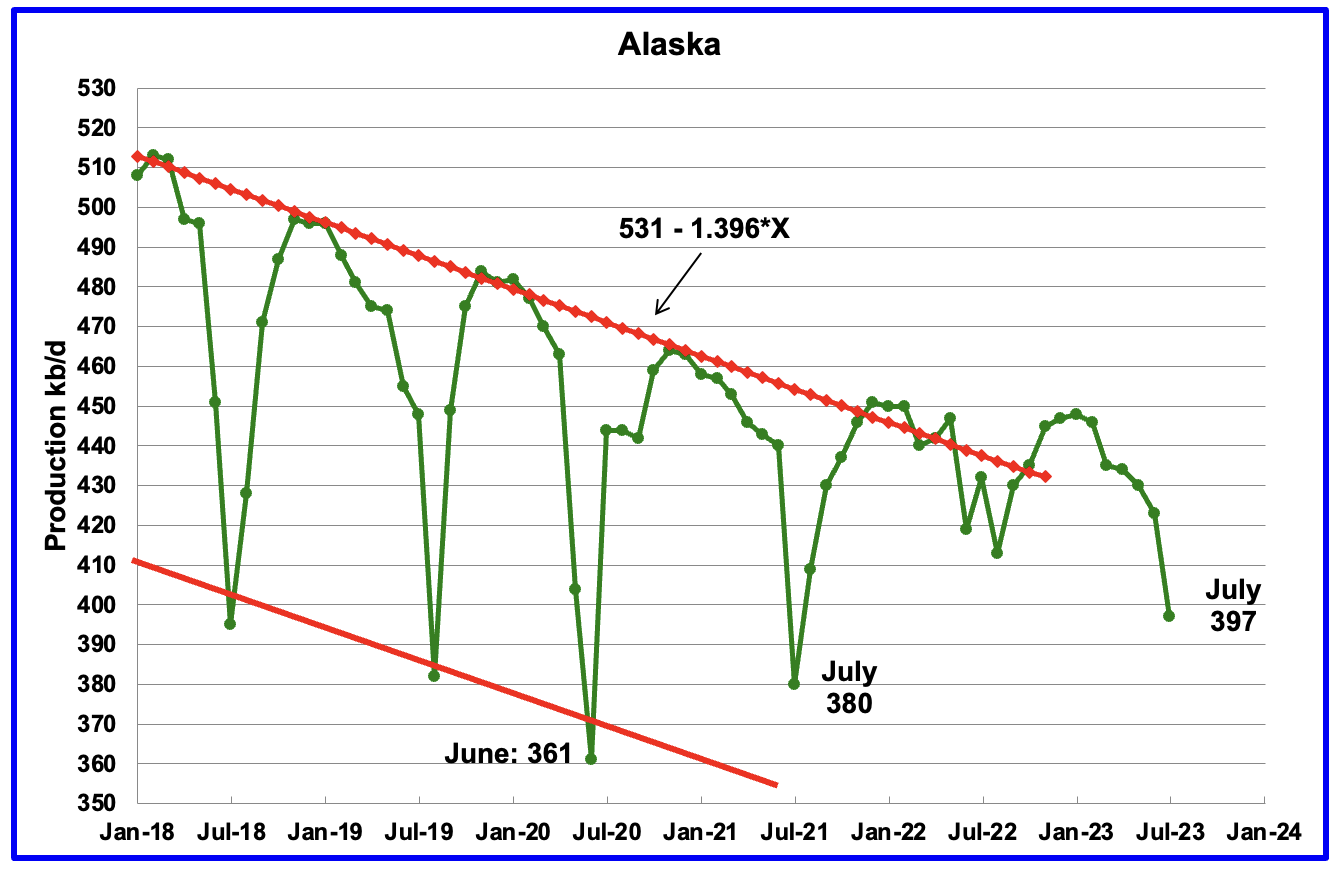
Alaskaʼs July output decreased by 26 kb/d to 397 kb/d. Production in 2023 is deviating from the down trend line of previous years due to the addition of a new oil field. Production YoY is down by 35 kb/d but up 17 kb/d from two years ago.
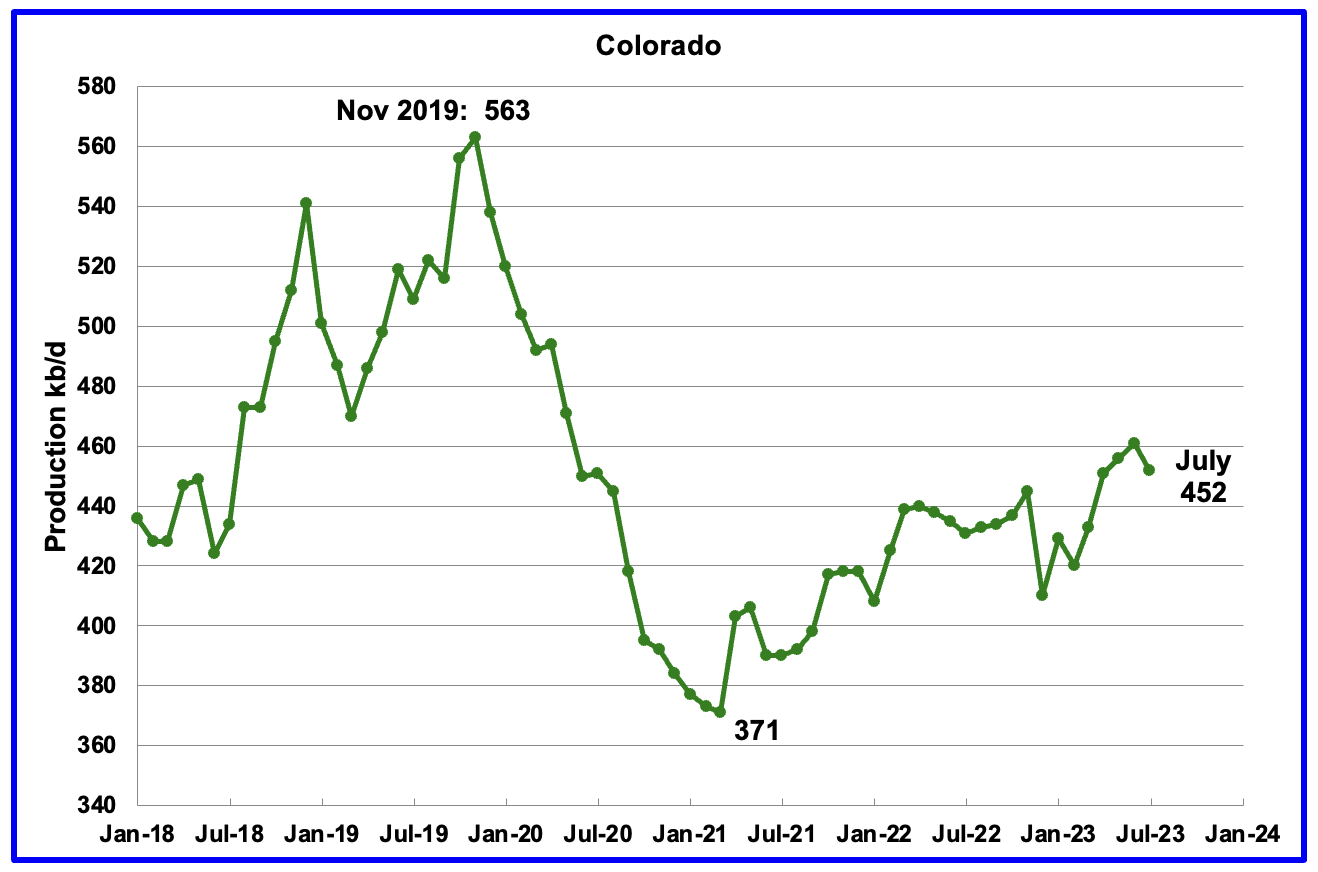
Coloradoʼs July production decreased by 9 kb/d to 452 kb/d.
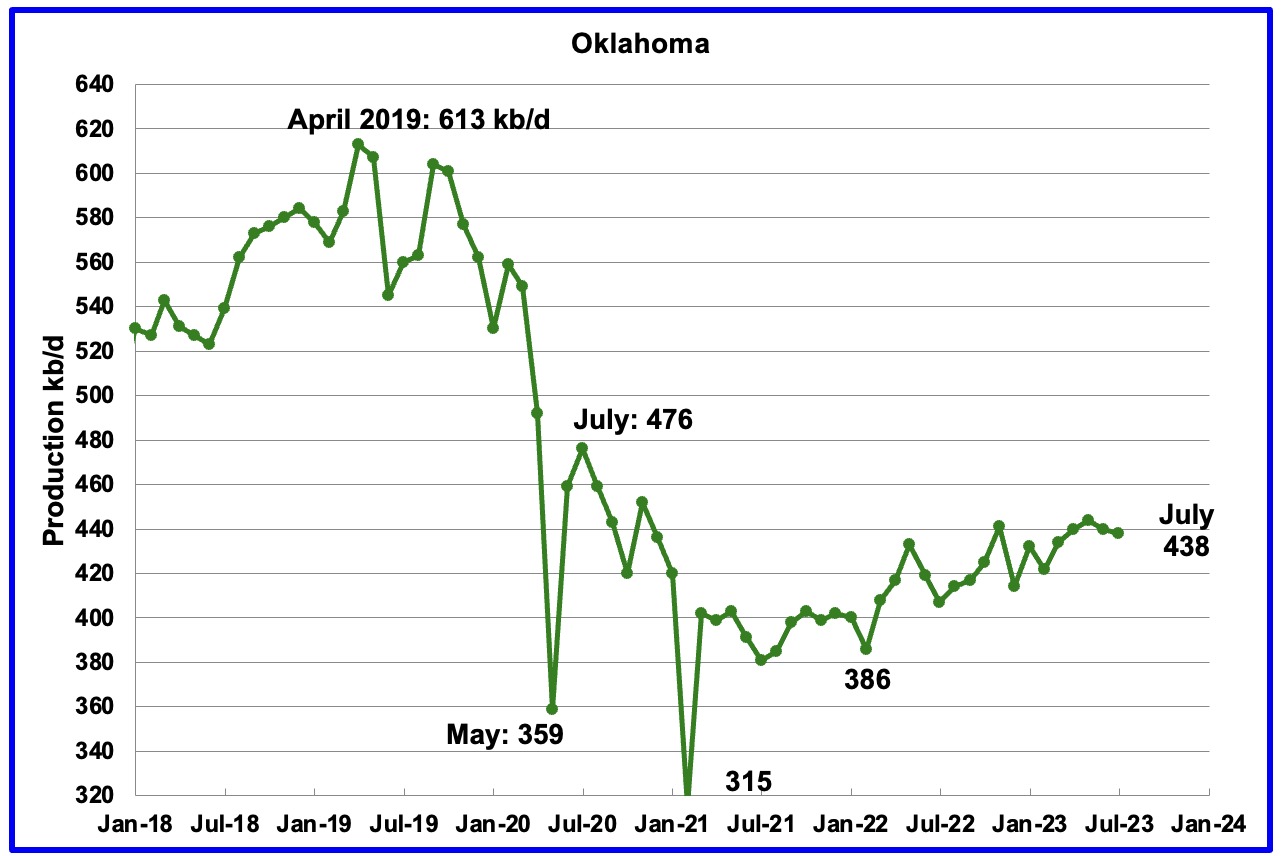
Oklahoma’s output in July decreased by 2 kb/d to 438 kb/d. Production remains 38 kb/d below the post pandemic July 2020 high of 476 kb/d and may be on a plateau phase.
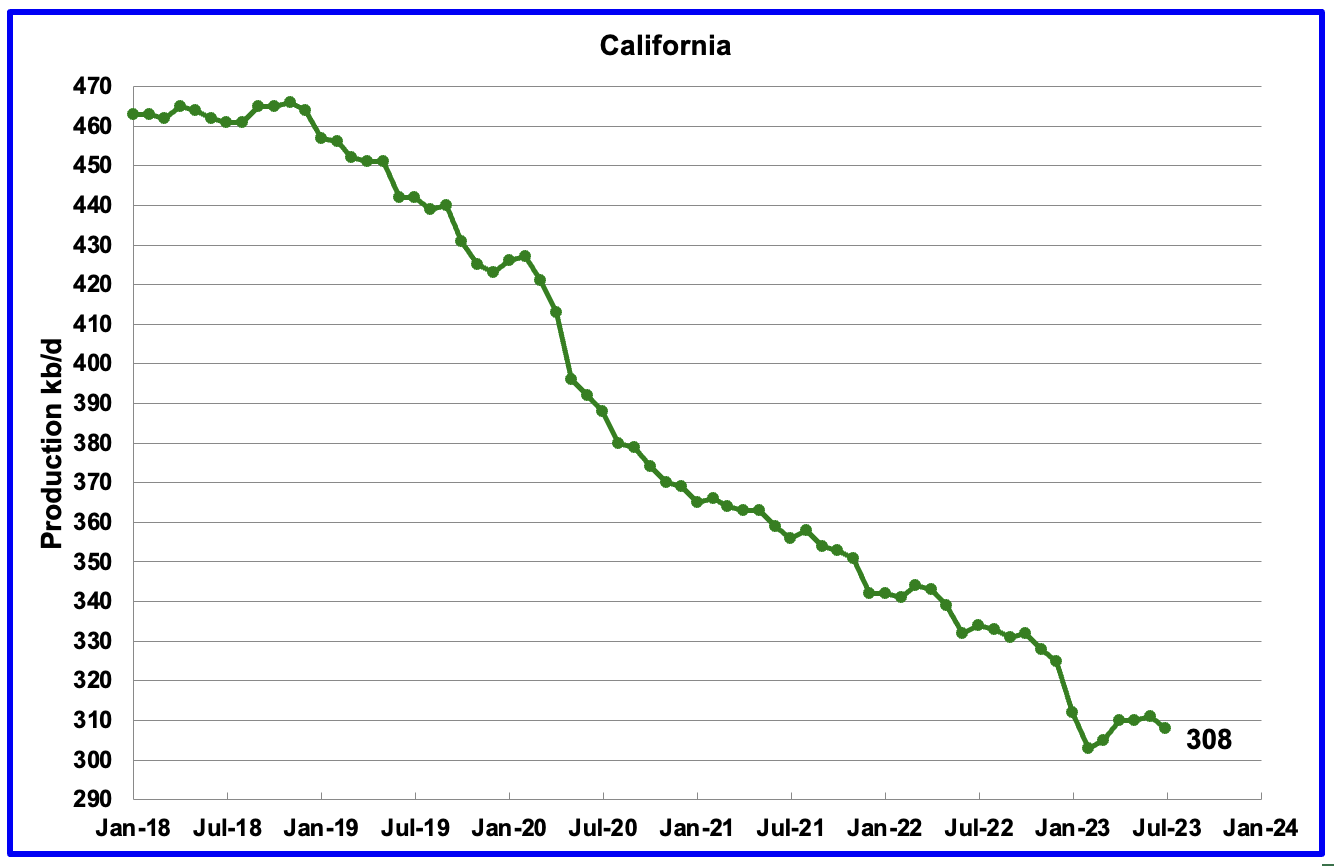
Californiaʼs overall slow output decline trend accelerated in January and February. However from March, through June production rose. July has returned to a declining trend by dropping by 3 kb/d to 308 kb/d.
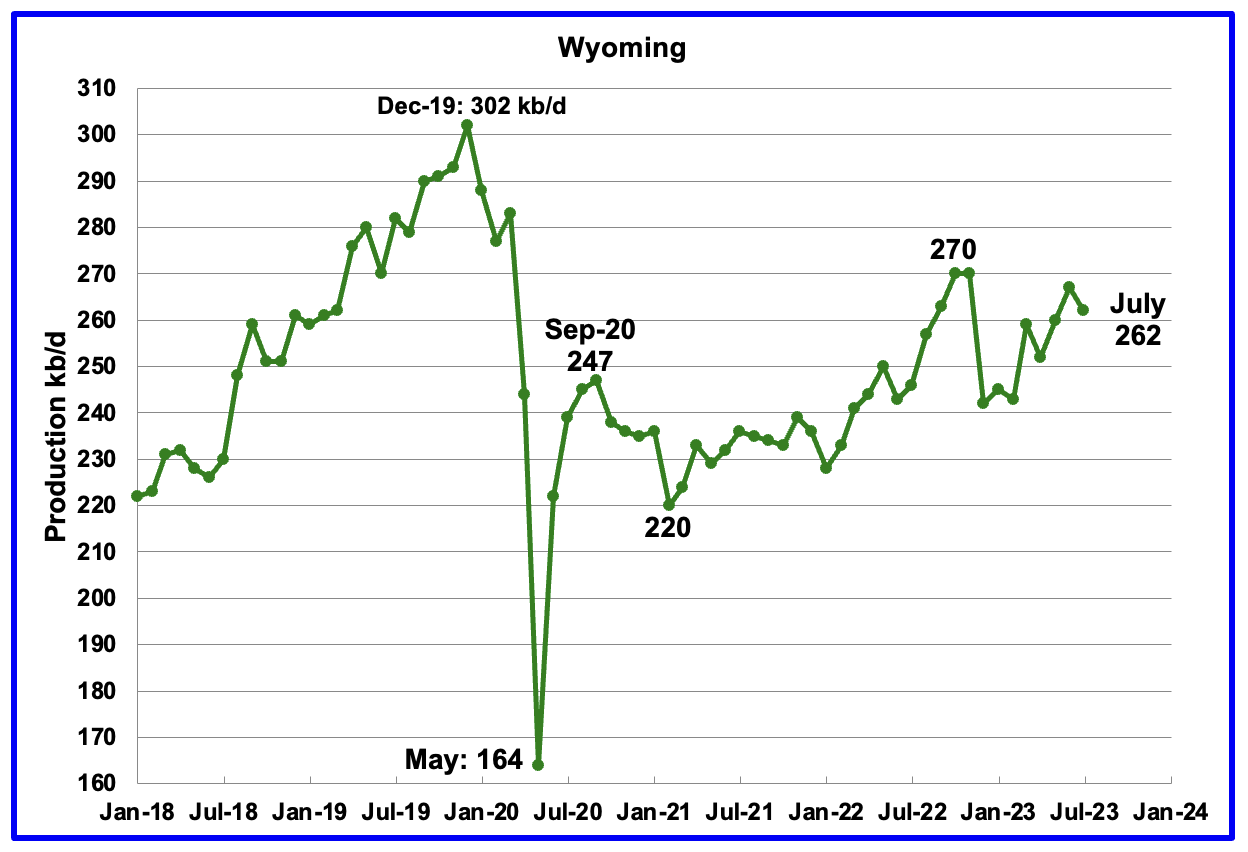
Wyoming’s oil production in October and November 2022 reached a post pandemic high of 270 kb/d. July’s oil production decreased by 5 kb/d to 262 kb/d, 8 kb/d lower than November 2022. Production has been rebounding since February.
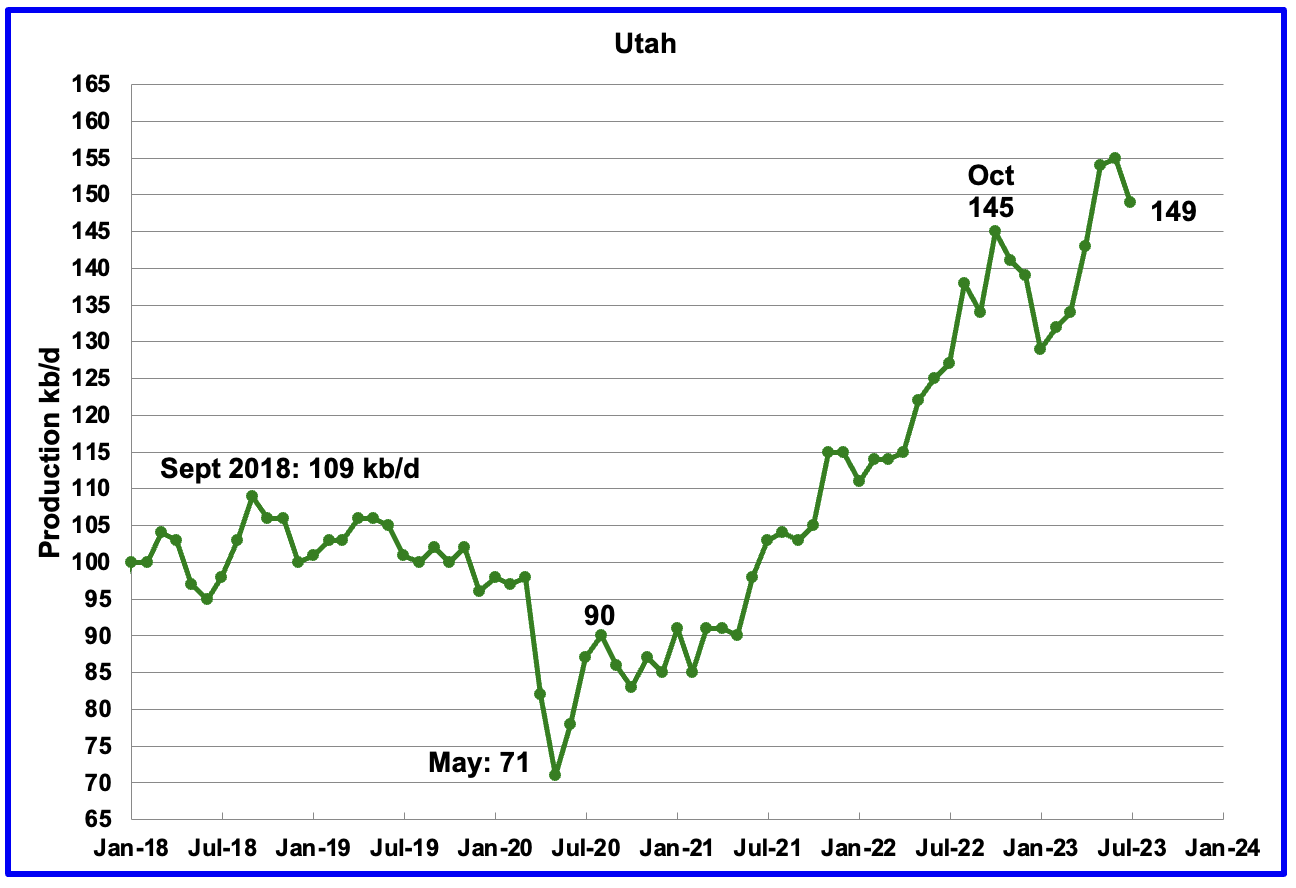
July’s production declined by 6 kb/d to 149 kb/d. For the first 4 months of 2023, Utah had 7 rigs operating. Since May the number of operational rigs has bounced between 8 and 9, which may account for the increased production.
The increased production since February has come from the Uinta basin.
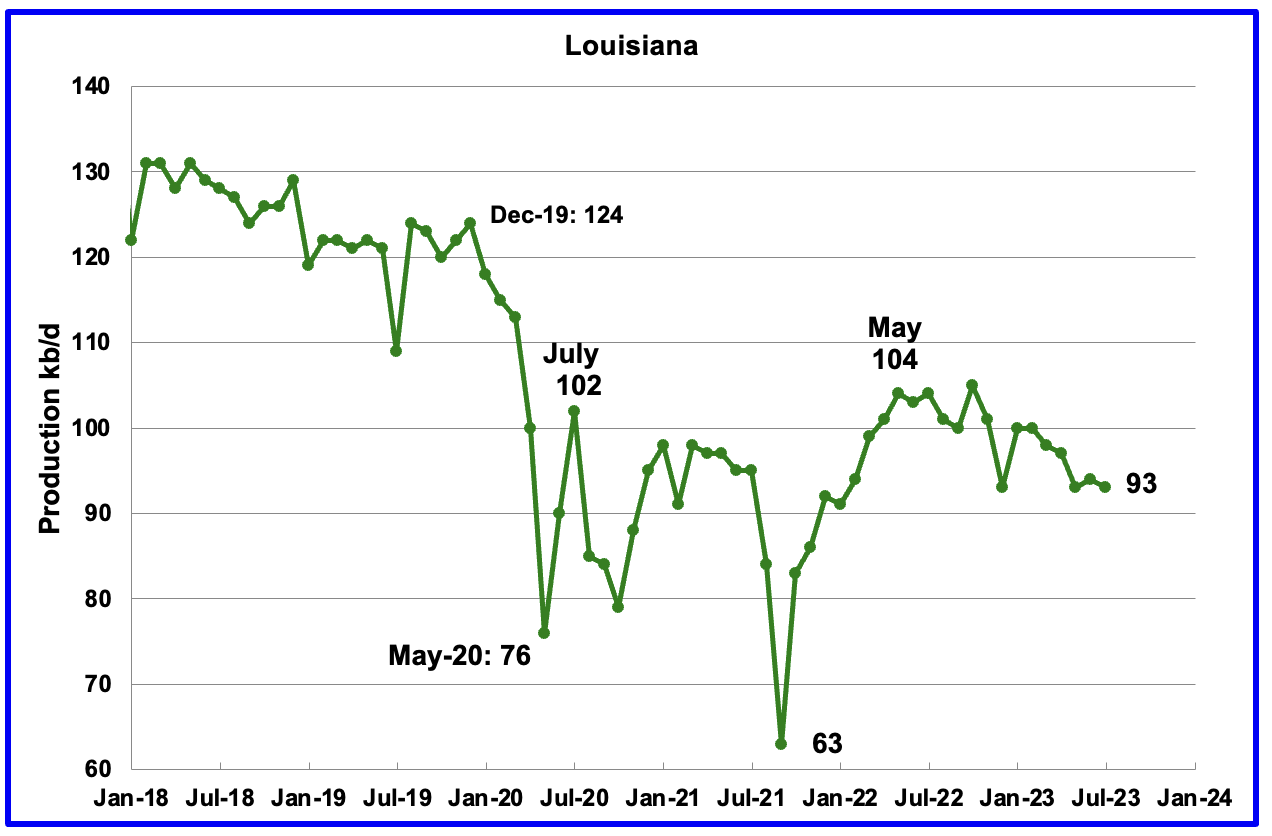
Louisiana’s output entered a slow decline phase in November 2022. July’s production dropped by 1 kb/d to 93 kb/d and is 11 kb/d lower than May 2022.
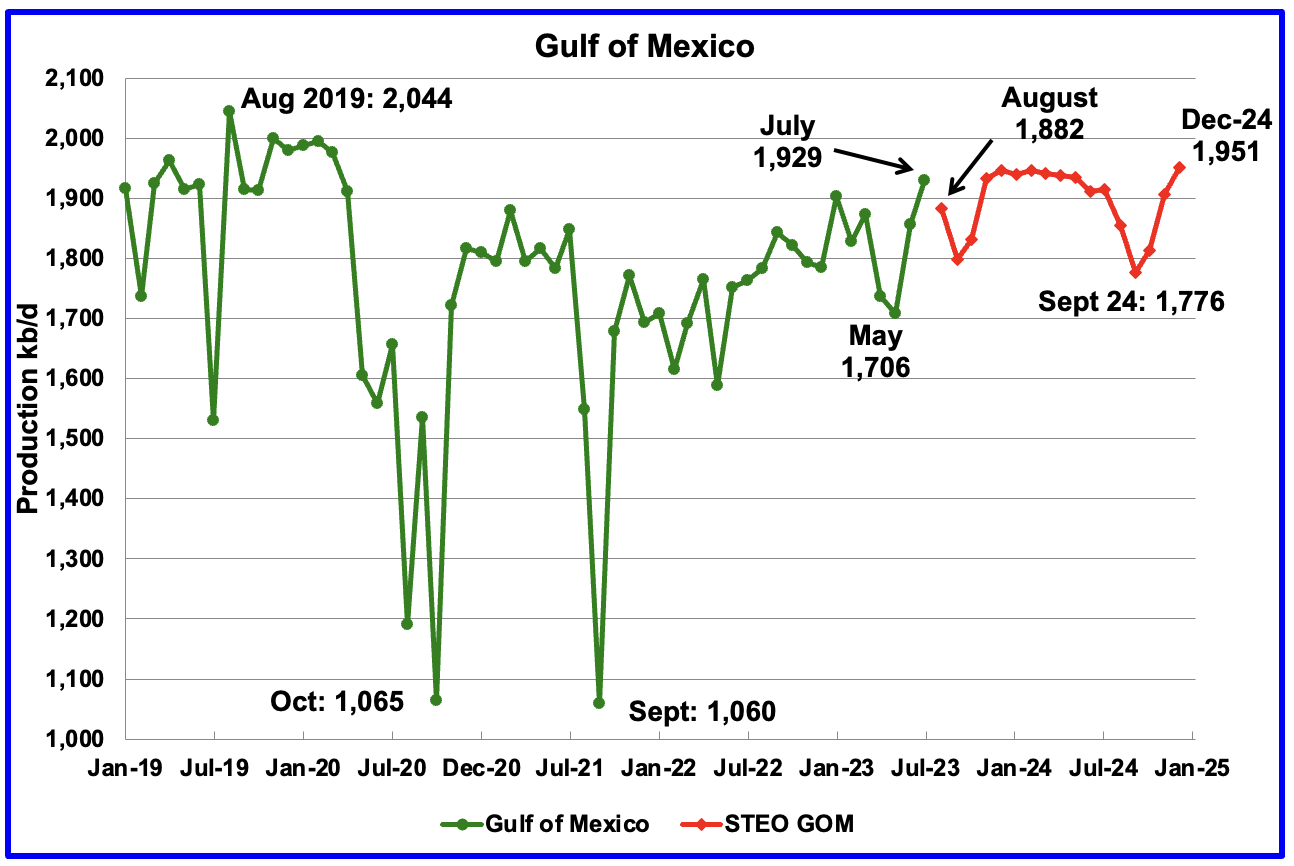
GOM production rose by 73 kb/d in July to 1,929 kb/d. Over the last two months, June and July, GOM output grew by 223 kb/d and is close to its peak for the next 17 months
The August 2023 STEO projection for the GOM output has been added to this chart and it projects that output in August 2023 will drop by 47 kb/d to 1,882 kb/d.
The August spike to 1,992 kb/d is a combination of the Vito platform and Mad Dog 2 field coming online.
It is not known if the GOM decline shown for August and September 2023 is related to extensive maintenance or potential hurricane activity.
A Different Perspective on US Oil Production
In this section US production is broken down into two parts, the Big Two, Texas and New Mexico, and the remaining states, The Rest.
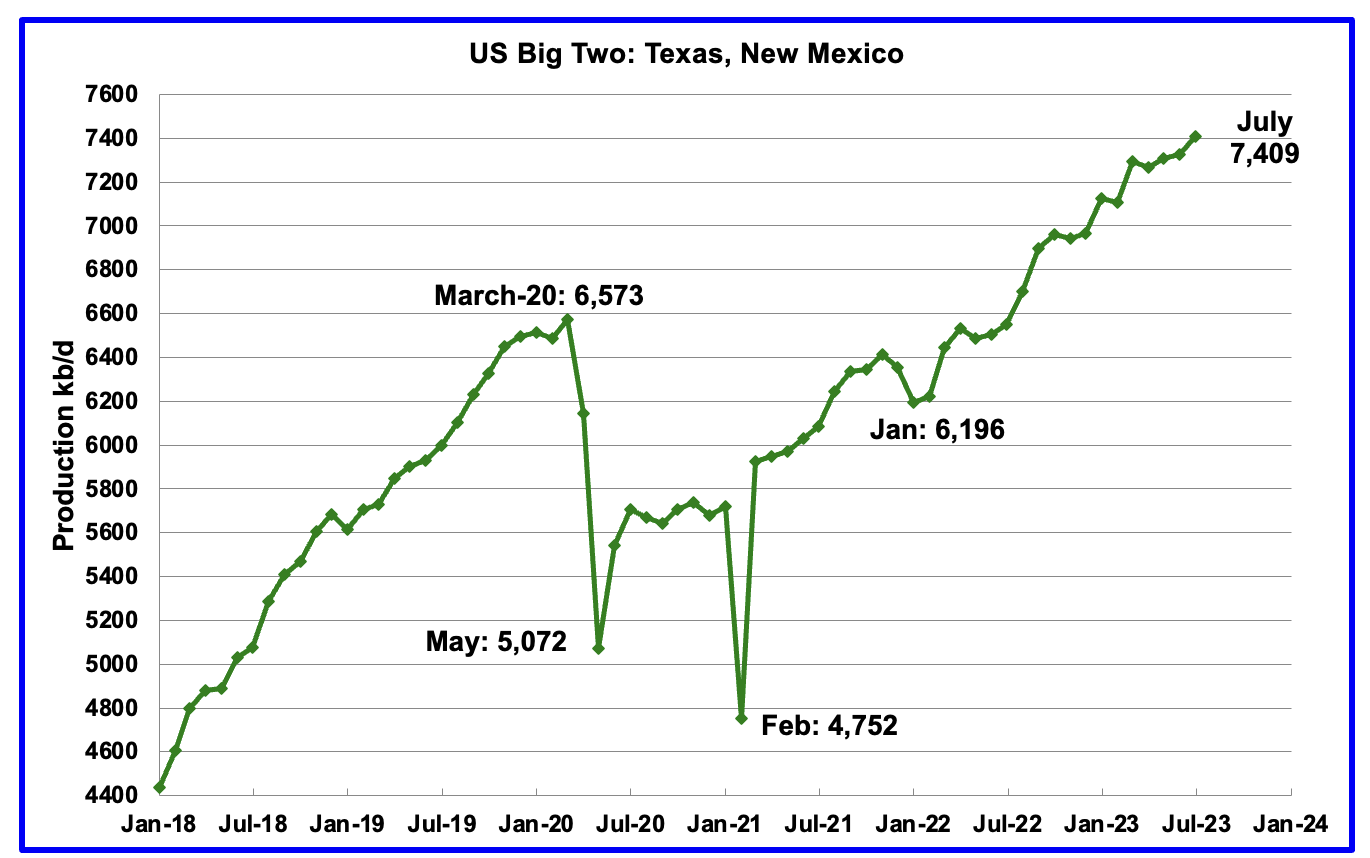
The Big Two states’ combined oil output for Texas and New Mexico.
July’s production in the Big Two states increased by a combined 83 kb/d to 7,409 kb/d with Texas adding 72 kb/d while New Mexico added 11 kb/d.
Oil production by The Rest
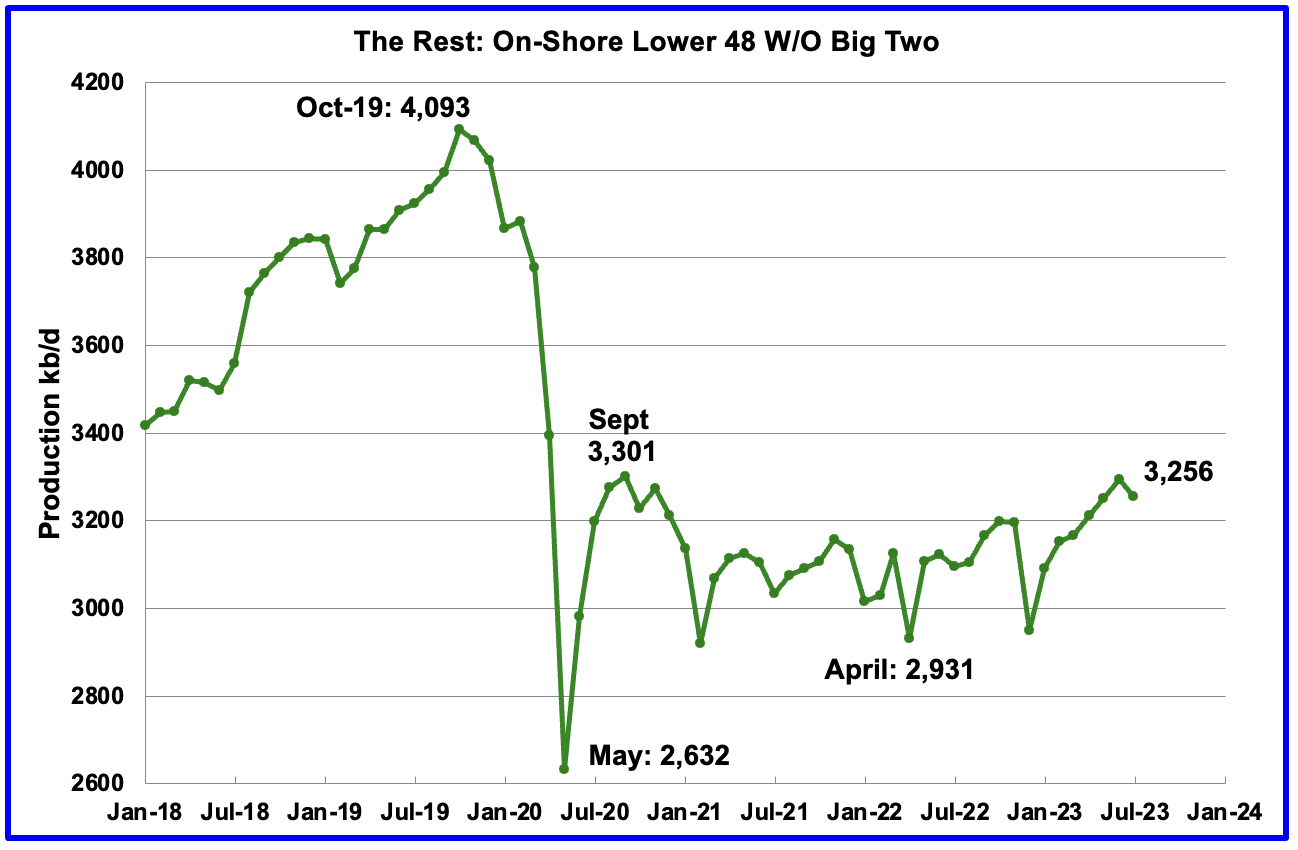
July’s production in The Rest fell by 39 kb/d to 3,256 kb/d. From May 2021 to April 2023, oil production in The Rest has been range bound between 3,000 kb/d and 3,200 kb/d. However May and June were the first months in which output broke above 3,200 kb/d. July’s drop brings output closer to 3,200 kb/d.
The main takeaway from The Rest chart is that current production is 837 kb/d below the high of October 2019 and this appears to be a permanent loss that will never be recovered.
Weekly Rig and Frac Spread Count
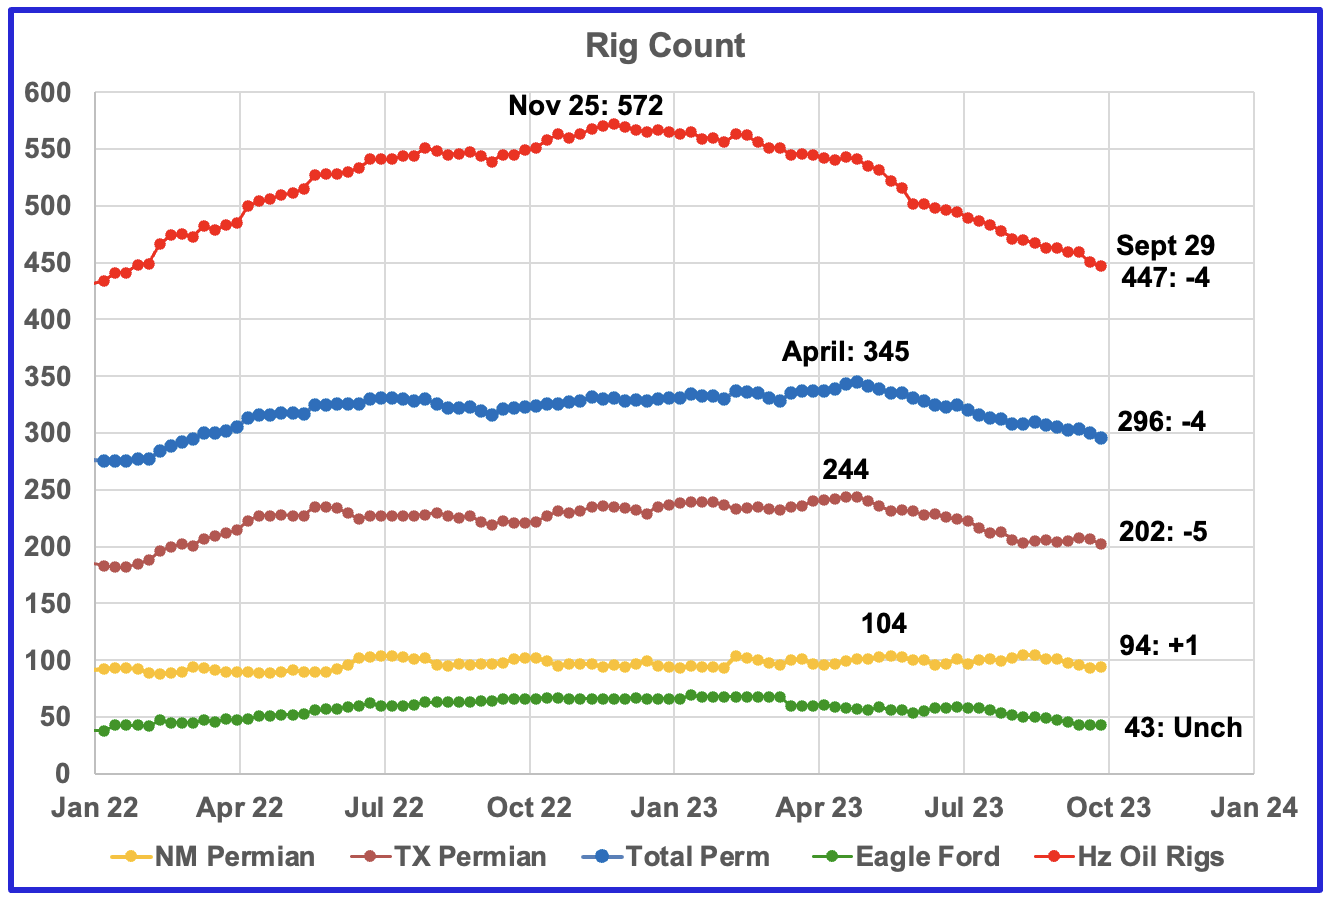
A high of 572 Hz oil rigs was reached in the week ending November 25, 2022. In the week ending Sept 29, 2023 the number of rigs dropped by another 4 to 447 and are now down 125 from the November high.
In the week ending September 29, Permian rigs decreased by 4 to 296 and Texas rigs were down 4 to 252, (not shown). Specifically for the Permian, Texas was down 5 to 202 while New Mexico was up 1 to 94. Note that the general trend for rigs in the Permian is a slow decrease since the April high and is currently 49 fewer than the 345 rigs operating on April 28, 2023.
In April 2023, WTI was over $80/b and dropping. Now that WTI is back over $90/b, will the decreasing rig count trend reverse?
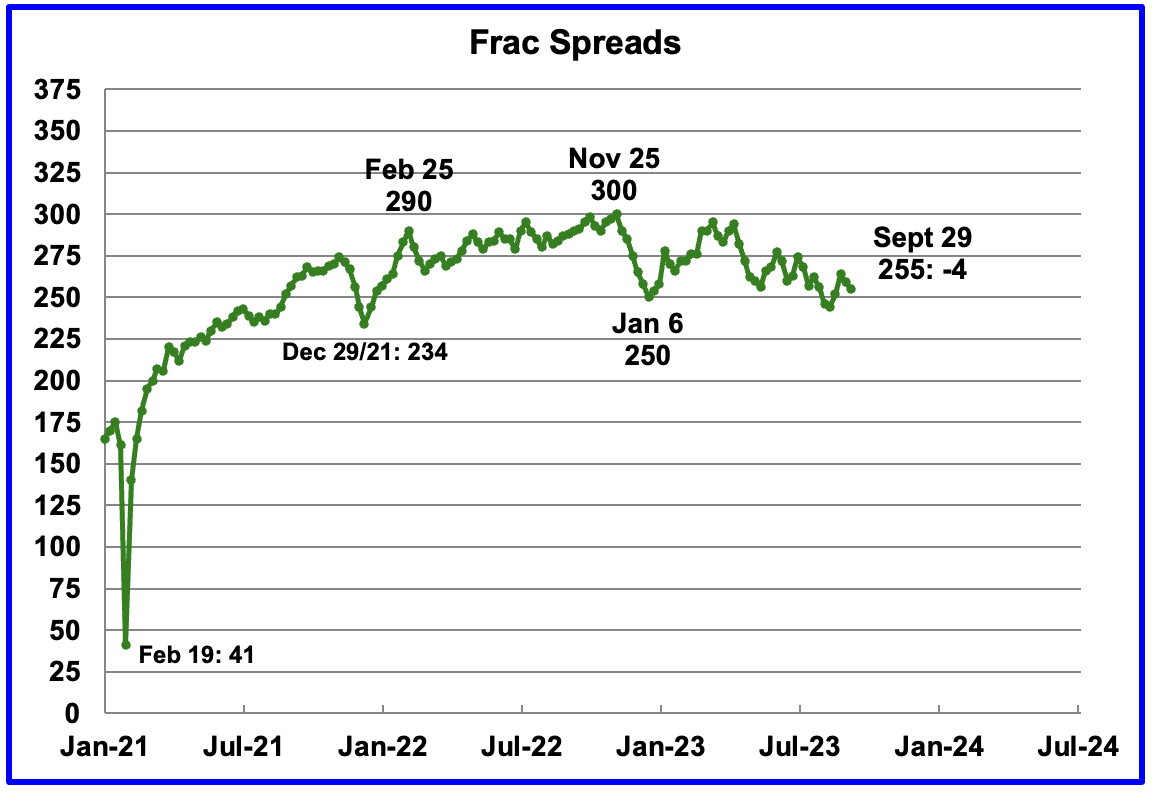
For most of 2022, the frac spread count wandered between 250 and 300 fracs per week. For all of 2022 the average weekly frac count was 280.
For the week ending September 29, the frac count dropped by 4 to 255 and is down 45 from the high of 300 in November 2022. The current count is significantly lower than the 2022 average of 280 frac spreads per week.
Note that these 255 frac spreads include both gas and oil spreads.
Frac Spread by County and Basin
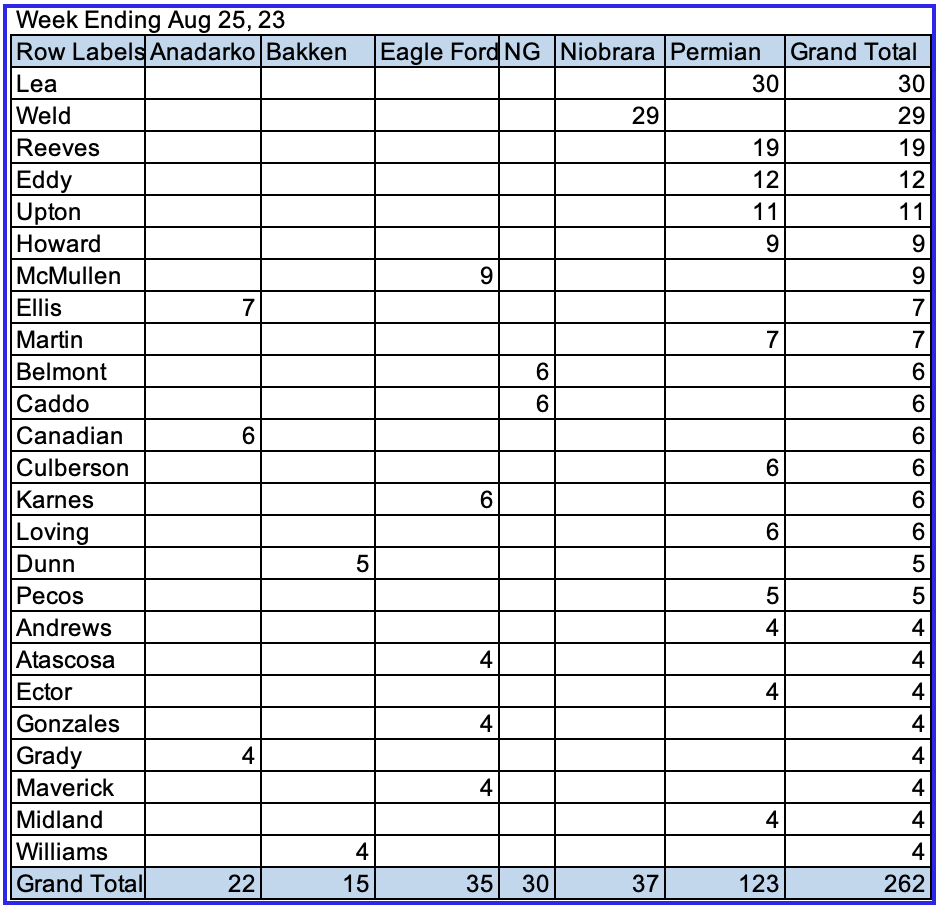
Above is the Frac Spread count by Basin and County for the week ending August 25. Only the counties with 4 or more frac spreads are shown.
The CSV data published by this site appears to be about 5 to 6 weeks delayed. While data for later weeks is published, it appears to be incomplete. For the week ending August 25, the official frac count reported for that week was 246. This analysis is showing 262. This leads me to think that the analysis is reasonably correct and that the late reporting adds frac spreads missed on the week of the count.
The largest number of frac spreads are operating in New Mexico’s Lea and Eddy counties, Colorado’s Weld county and Texas’ Reeves and Upton counties.
Note that the majority of completed wells produce oil, 232 out of 262.
Permian Basin Report by Main Counties
This monthly Permian section is being added to the US report because of a range of views on whether Permian production will continue to grow or will peak over the next year or two. The issue was brought into focus recently by the Goehring and Rozencwajg Report which indicated that a few of the biggest Permian oil producing counties were close to peaking or past peak. Also comments by posters on this site have similar beliefs from hands on experience.
This section will focus on the four largest oil producing counties in the Permian, Lea, Eddy, Midland and Martin. It will track the oil and natural gas production and the associated Gas Oil Ratio (GOR) on a monthly basis. The data is taken from the state’s government agencies for Texas and New Mexico. Typically the data for the latest two or three months is not complete and is revised upward as companies submit their updated information. Note that the natural gas production shown in the charts that is used to calculate the GOR is solely the gas coming from the oil wells.
Of particular interest will be the charts which plot oil production vs GOR for a county to see if a particular characteristic develops that indicates the field is close to entering the bubble point phase. While the GOR metric is best suited for characterizing individual wells, counties with closely spaced horizontal wells may display a behaviour similar to individual wells due to pressure cross talking . For further information on the bubble point and GOR, there are a few good thoughts on the intricacies of the GOR in an earlier POB comment. Also check this EIA topic on GOR.
This chart shows oil production from the 11 largest counties in the Permian. In the New Mexico Permian, there are two counties Lea and Eddy. The remaining nine are in Texas; Midland, Martin, Reeves, Karnes, Loving, Howard, Reagan, Glasscock and Upton . The graphs are updated to July.
The red markers show production from the two NM counties while the blue markers show total production for NM from the EIA monthly production report. The EIA must have some correction factors to increase NM’s output from NM’s official site. The brown markers show output from the 9 biggest Permian counties in Texas.
New Mexico Permian
Over the past 6 weeks drilling activity in Lea county has been dropping while in Eddy it is holding steady.
Over the last three months, gas production has risen faster than oil production in Lea county. The May production numbers will see a small increase while June and July will have bigger increases because their production has not been fully reported.
After much zigging and zagging production in Lea county stabilized above 1,000 kb/d while the GOR exceeded the semi-bounded GOR for the time time while production slowed and possibly has begun to decline. The data for the last two data points, June and July, is incomplete. May production will see a small increase.
This pattern of a zigging and zagging GOR within a semi-bounded GOR while oil production increases to some stable level and then moves out to a higher GOR to the right has shown up in a number of counties. See an additional three cases below. However this is the first month in which Lea county has registered a GOR outside of the semi-bounded GOR range.
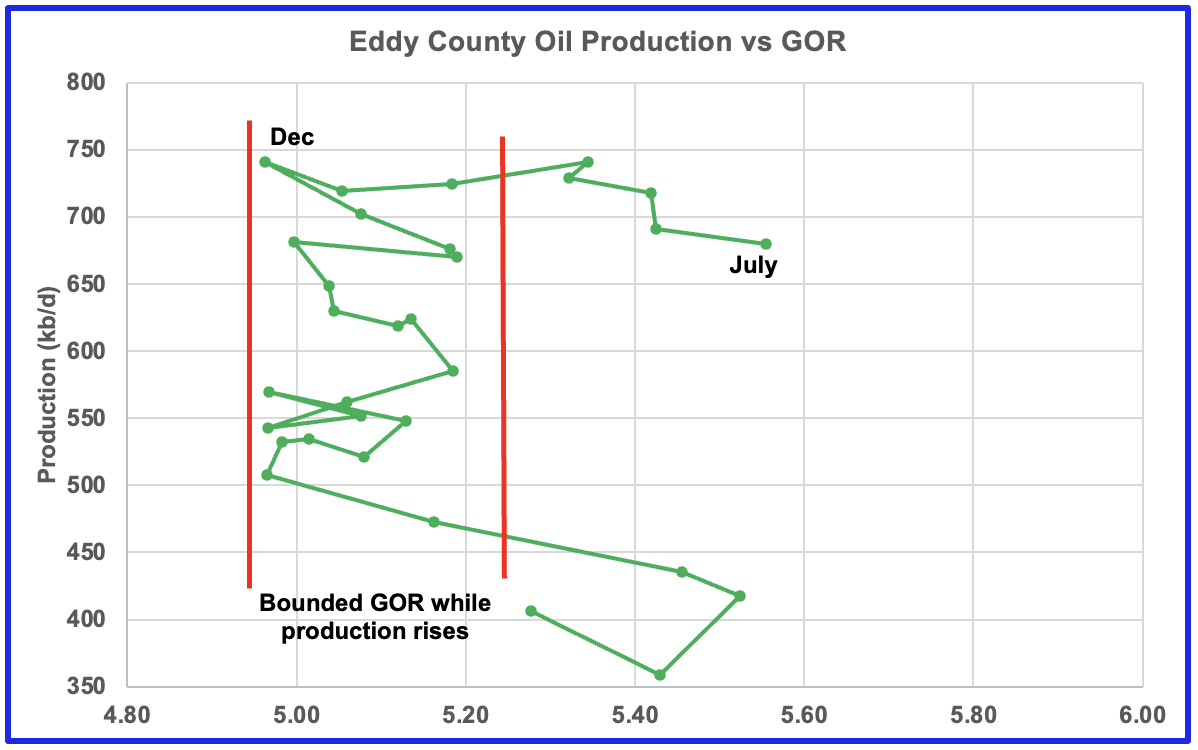
The Eddy county GOR pattern is similar to Lea county except that Eddy has broken out from the semi bounded range for a longer period. Does the breakout indicate that most of the wells in this county have entered the bubble point phase?
Texas Permian
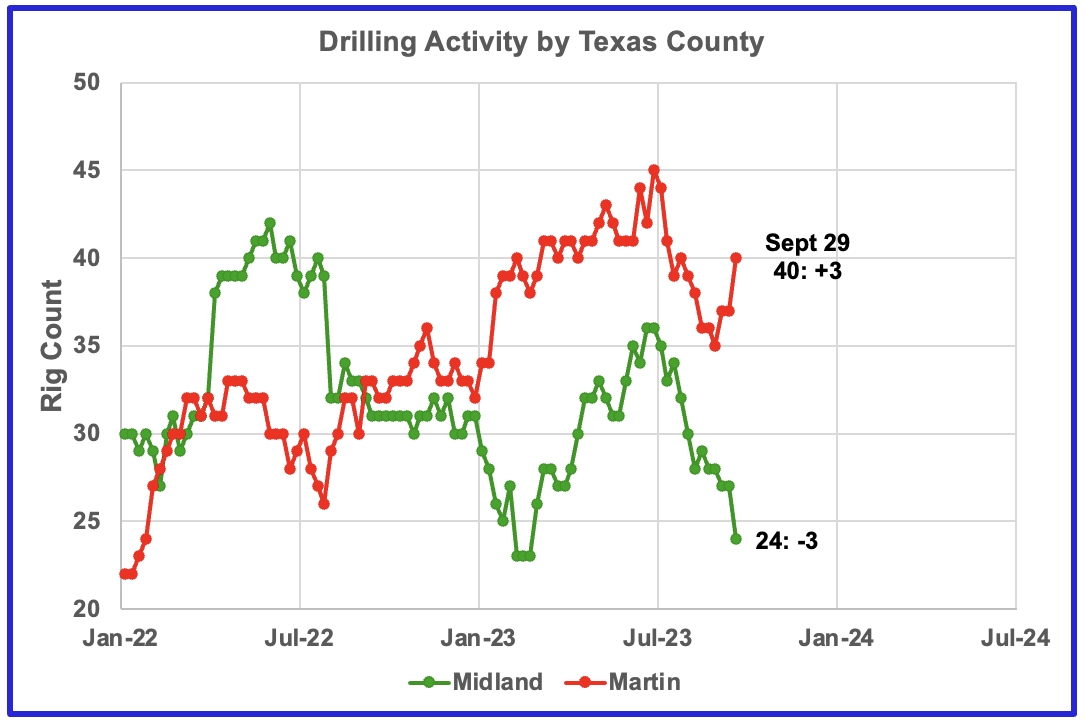
During September, drilling activity has been increasing in Martin county while it has been dropping in Midland county. Since these two counties are adjacent, could these rigs just be moving between counties.
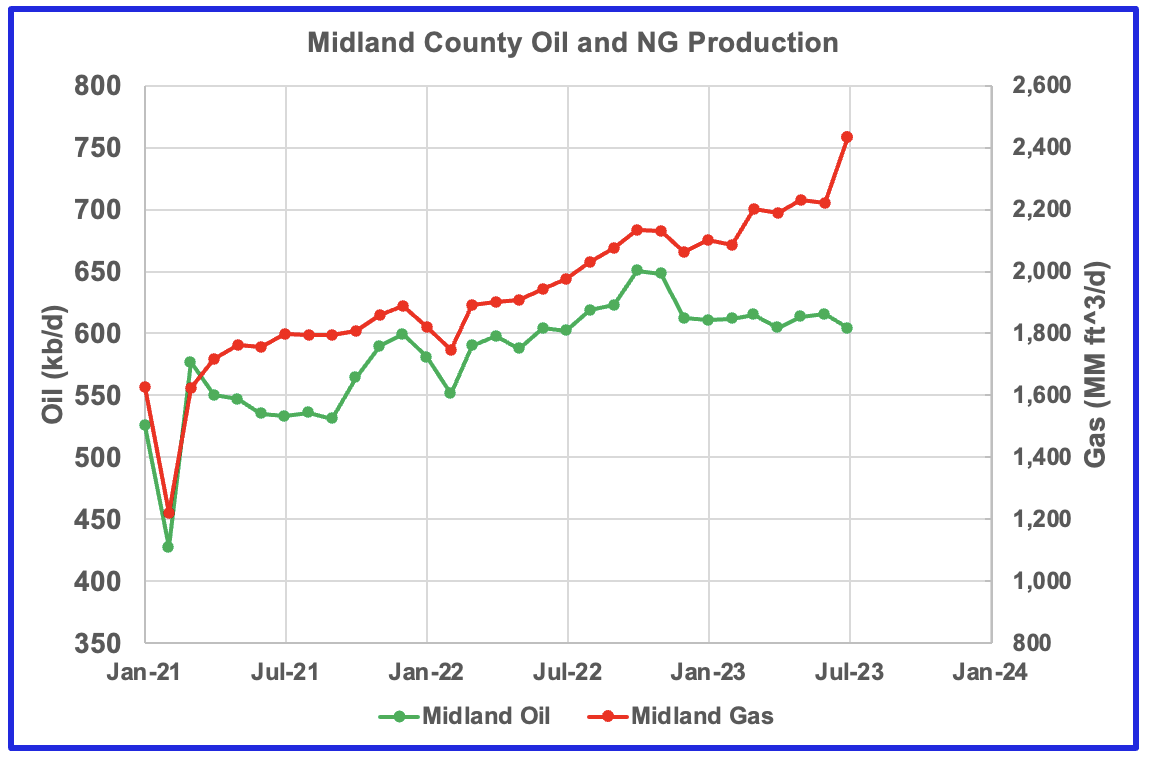
Natural Gas production is increasing while oil production drops in Midland county.
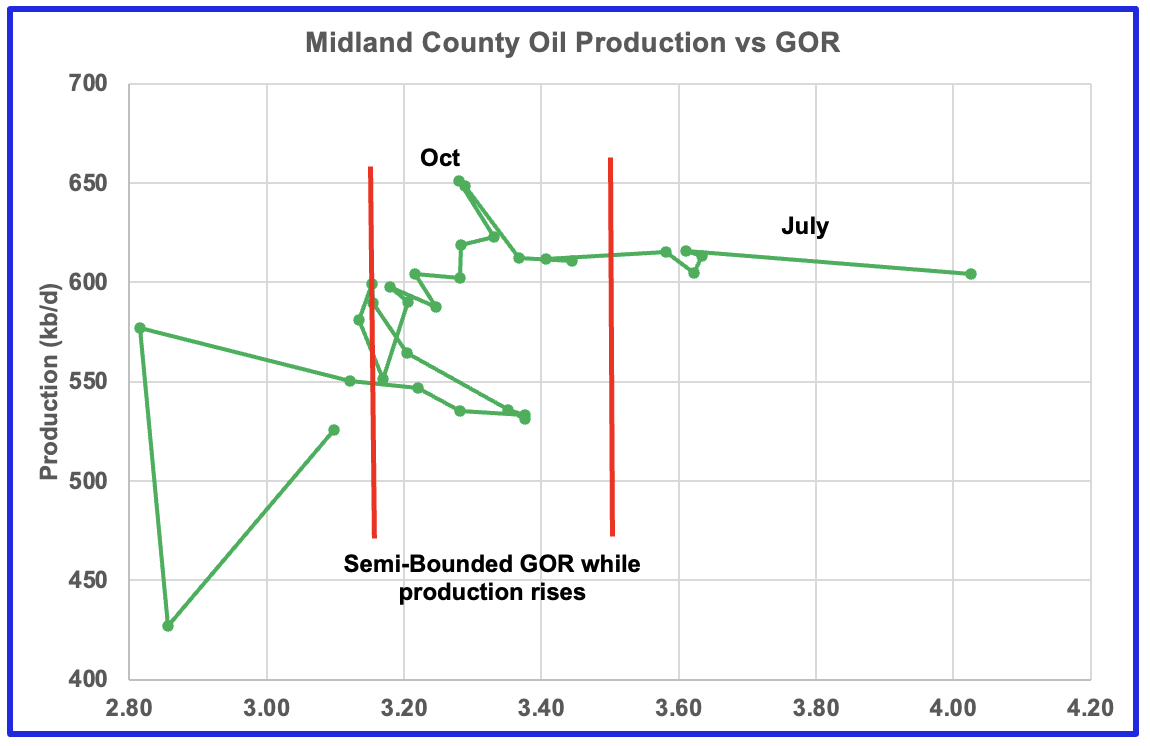
GOR breaking out to higher values and oil production dropping. Has Midland entered the bubble phase?
Natural Gas production is increasing while oil production drops.
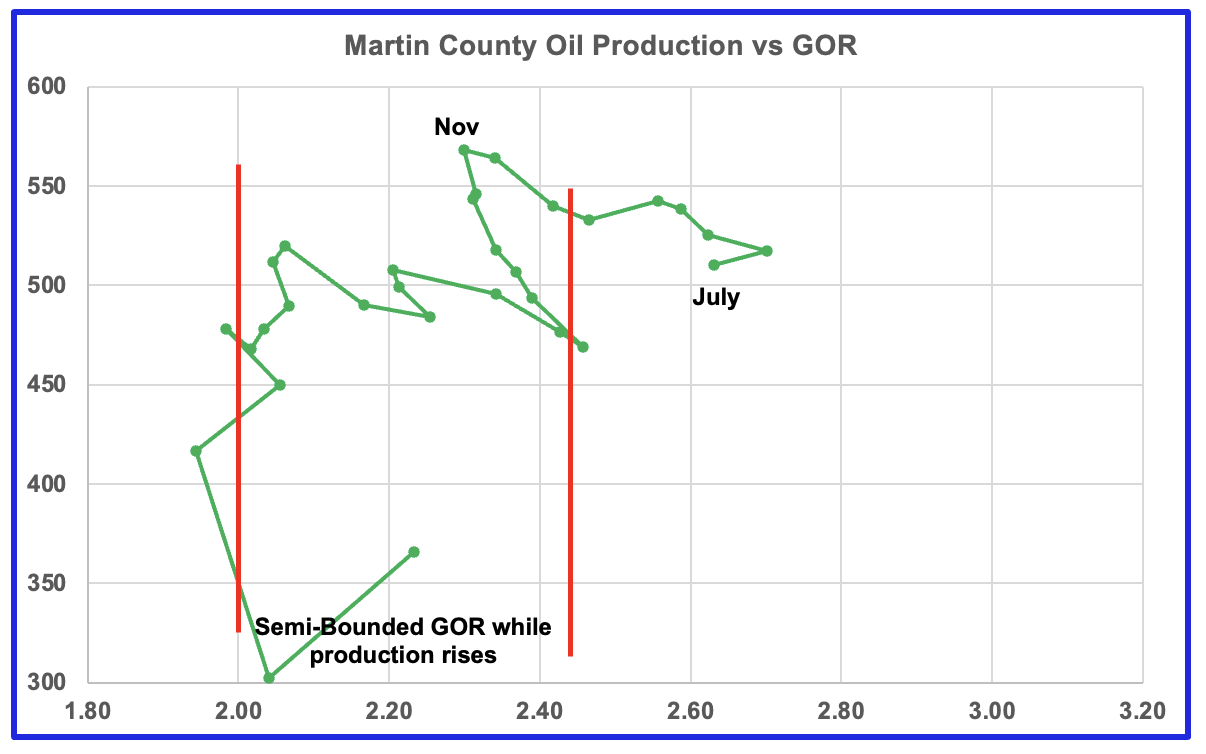
Similar GOR pattern to Martin county. Note that Midland county is adjacent to Martin county and the pressure could be dropping in both fields.
All of the oil production vs GOR charts above are exhibiting characteristics indicating that the four largest oil producing counties in the Permian are in the bubble point phase and are close to or past their peak?
In the latest Goehring & Rozencwaig Report, the authors believe that Permian production will roll over in 2024 as noted in the paragraph below. They are looking at the same data as shown in the Permian charts above, in addition to adding their own deeper knowledge. The four largest Permian basins shown above are all showing signs of peaking. However when looking at production in Texas as reported by the EIA, it continues to show no signs of rolling over.
This divergence in the production trend between the G & R report, the above Permian charts and the Texas chart hopefully will resolve itself over the next three months.
“Since we last wrote, Permian depletion has accelerated. Last year marked the first time Permian productivity per lateral foot decreased year-over-year, falling by 7%. For the first three months of 2023, productivity per foot fell by a further 4% compared with 2022. According to the Energy Information Agency (EIA), by August, the Permian will be growing by only 360,000 b/d year-on-year, compared with nearly 700,000 b/d as recently as February. Our models suggest that year-on-year Permian growth will be less than 100,000 b/d by year-end and turn negative in early 2024. Although the next few months may be bumpy, we believe the Permian will definitively roll over sometime in 2024 as companies run out of their best drilling prospects. Despite high prices, producers dropped fourteen rigs in the Permian over the past three months, potentially signally inventory exhaustion. The other US shales are not faring any better. Shale production outside the Permian has not grown in nearly three years, despite oil rallying from $20 to $75 per barrel. The only material source of non-OPEC+ growth over the past fifteen years is about to peak.“
Biggest Oil producing County in the Eagle Ford
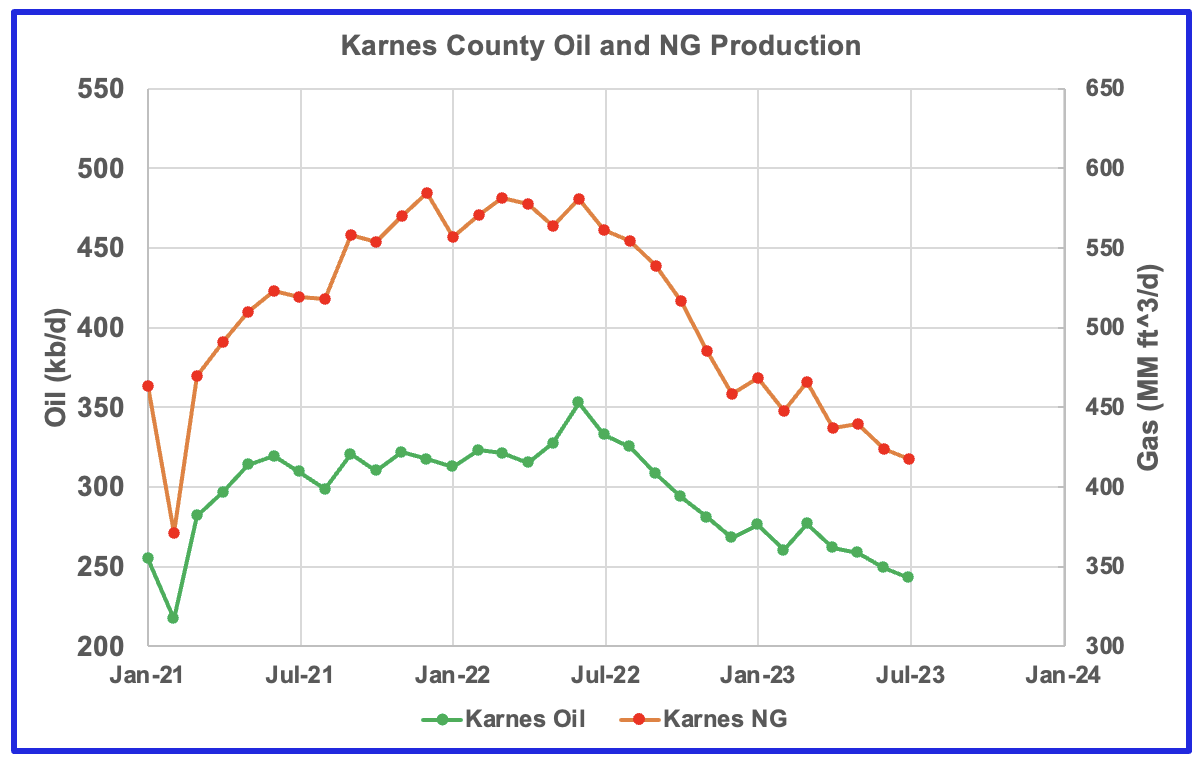
Both oil and gas production are falling in Karnes county and both are down 55%.
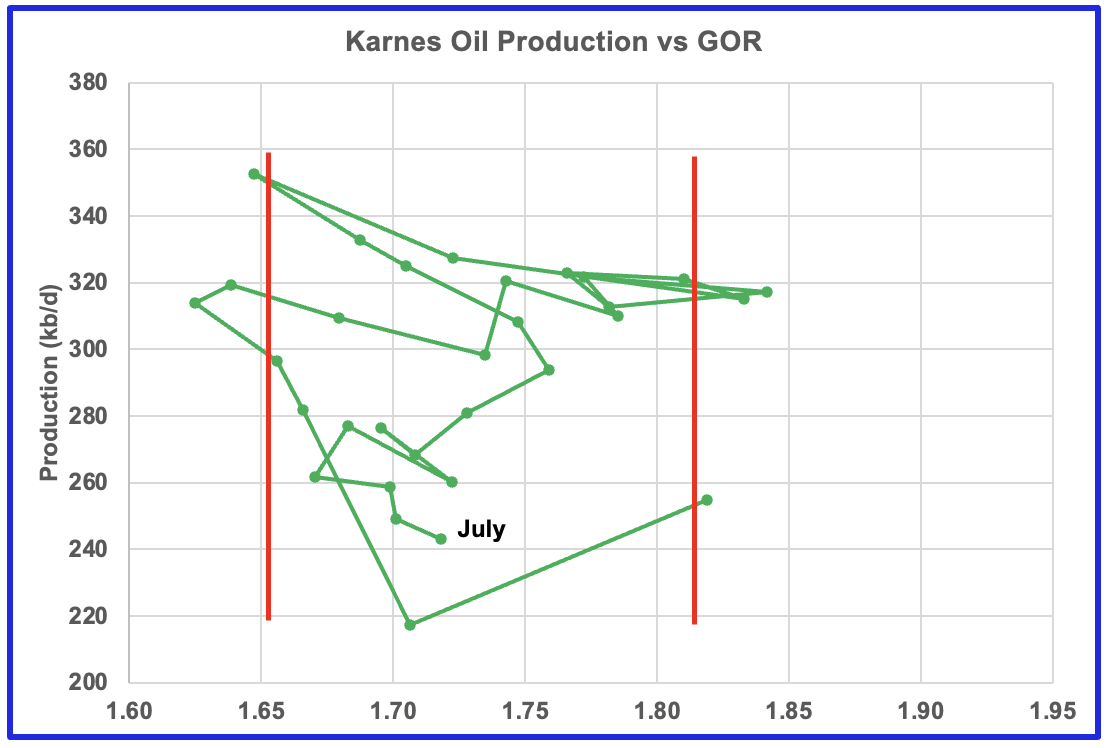
This is the GOR vs oil production for Karnes county but the GOR is still within its typical range while production is dropping. This may indicate that Karnes county wells have not entered the bubble point phase.
Drilling Productivity Report
The Drilling Productivity Report (DPR) uses recent data on the total number of drilling rigs in operation along with estimates of drilling productivity and estimated changes in production from existing oil wells to provide estimated changes in oil production for the principal tight oil regions. The August DPR report forecasts production to September 2023 and the following charts are updated to September 2023. The DUC charts and Drilled Wells charts are updated to July 2023.
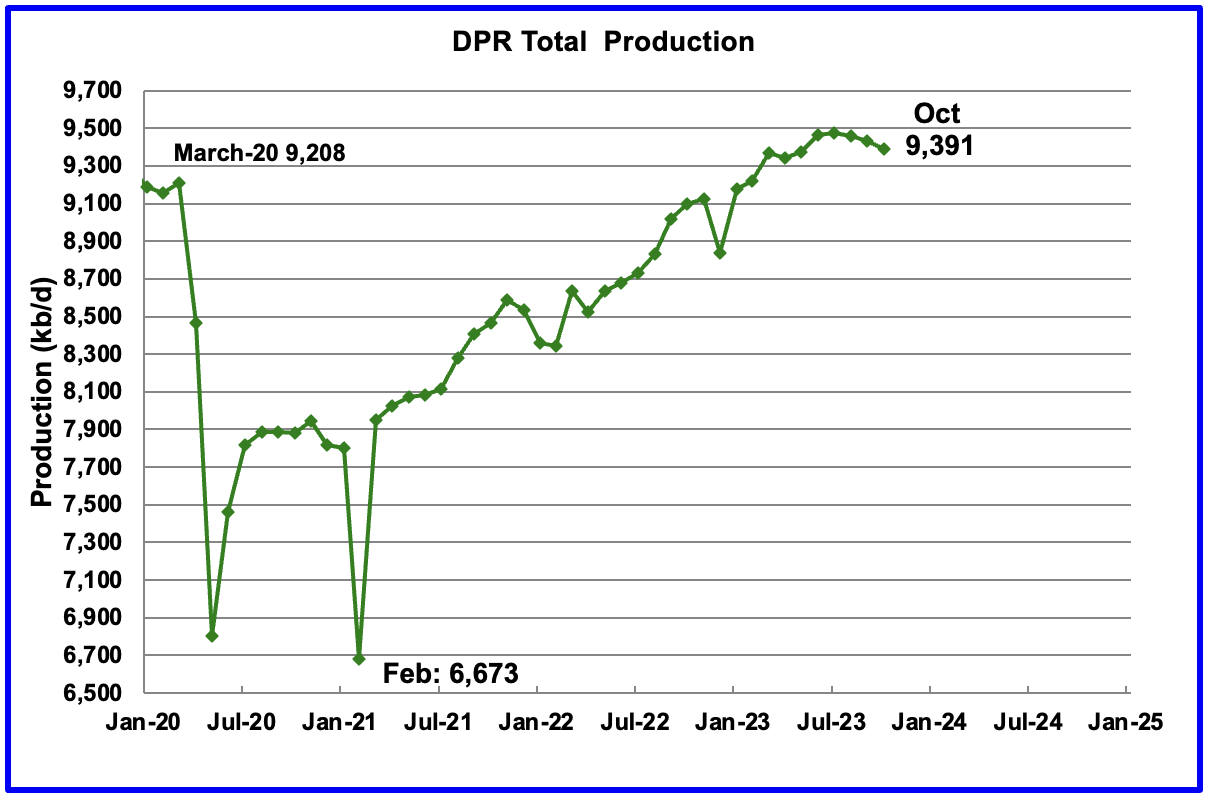
Above is the total oil production projected to October 2023 for the 7 DPR basins that the EIA tracks. Note that DPR production includes both LTO oil and oil from conventional wells.
The DPR is projecting that oil output for October 2023 will decrease by 41 kb/d to 9,391 kb/d. This is the second drop in a row since the July peak of 9,476 kb/d. The drop is due to the reduced drilling and completions that began earlier this year.
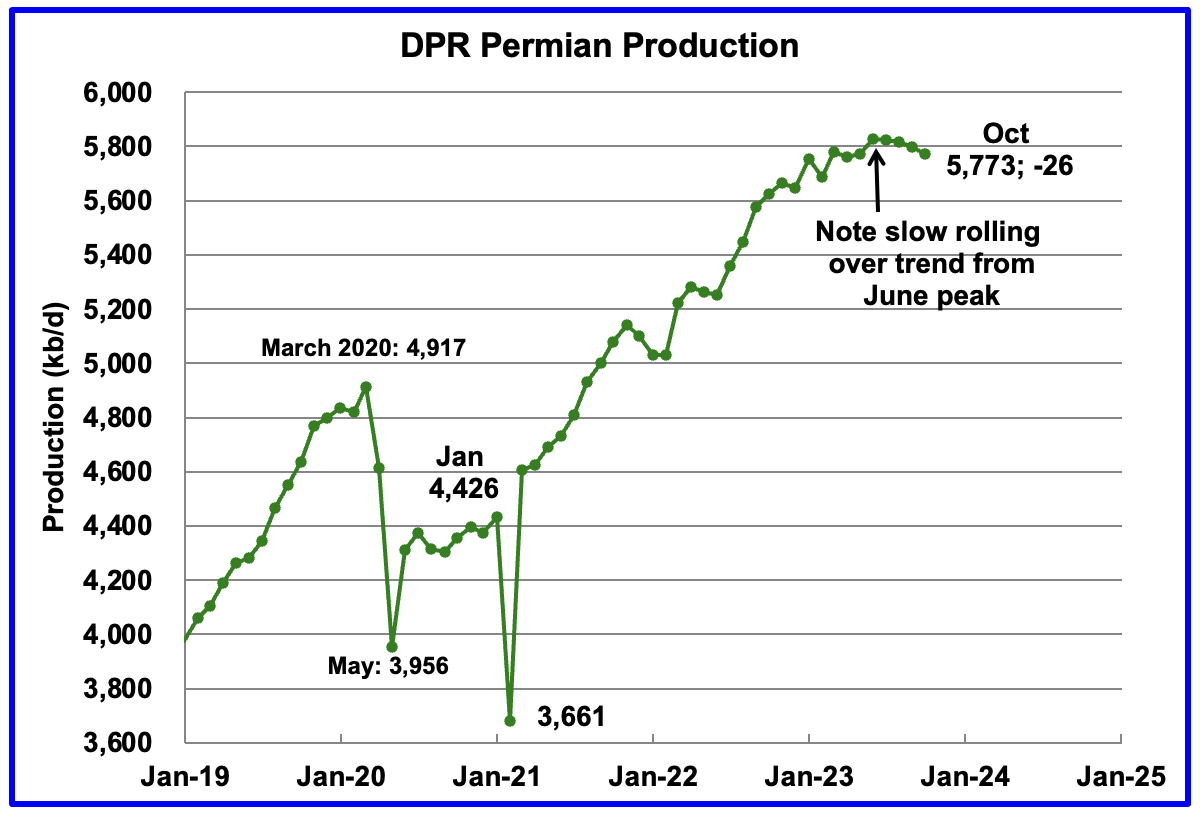
According to the EIA DPR report, Permian output continued to roll over in September. It is expected to decrease by 13 kb/d to 5,799 kb/d. The last six months of production data clearly shows a slowing trend in monthly production increases which now has turned to decreases, similar to the trend above for the total oil production in the DPR regions. Watch this Note the production difference with the following LTO chart.
October’s output is 856 kb/d higher than the pre-pandemic high 4,917 kb/d.
During August, 450 wells were drilled and 453 were completed in the Permian. (Note that August is the latest month for DUC information). The completed wells added 367 kb/d to August’s output for an average of 811 b/d/well. The overall decline was 377 kb/d which resulted in a net decrease for Permian output in August of 10 kb/d. Of the 450 completed wells in August, 464 would have been required to offset the decline, 11 fewer than than the 453 completed.
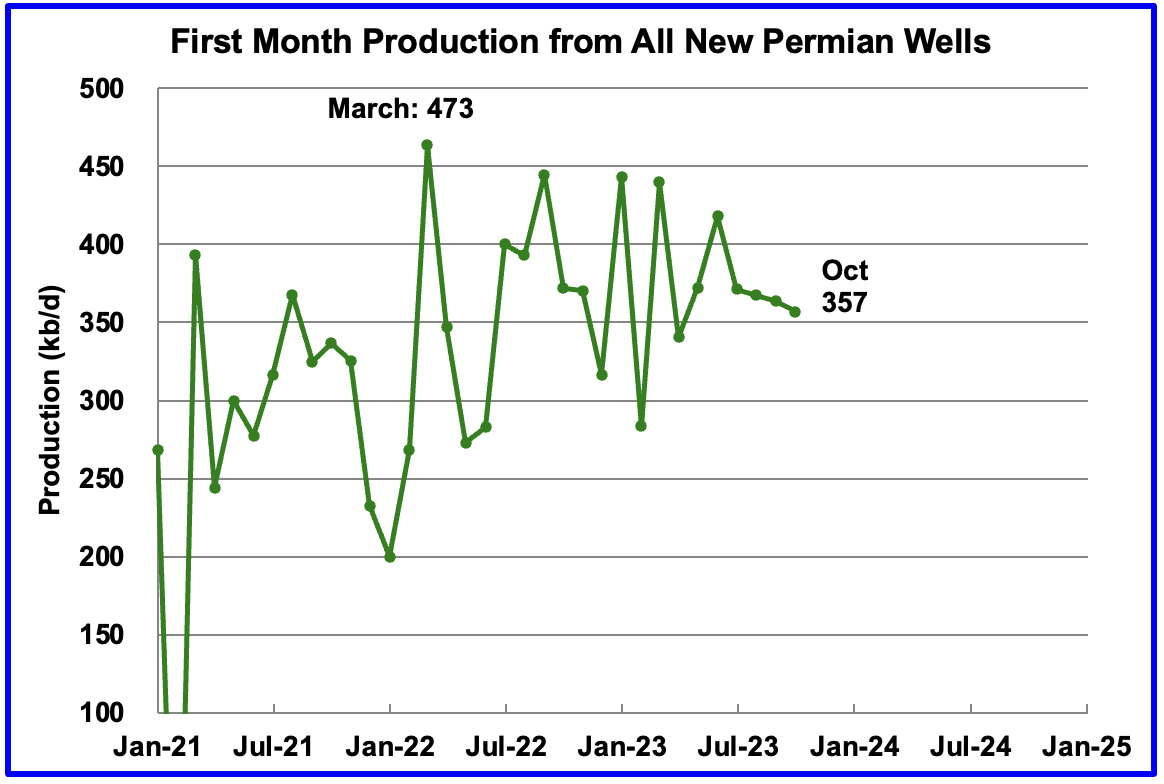
This chart shows the average first month total production from Permian wells tracked on a monthly basis. The total monthly production from the newest Permian wells in October is expected to be 357 kb/d. Production since July continues to drop slowly. Production dropped from 371 kb/d in July to 357 kb/d in October. Recall that this production of 357 kb/d is offset by a decline of 383 kb/d for a net decline of 26 kb/d.
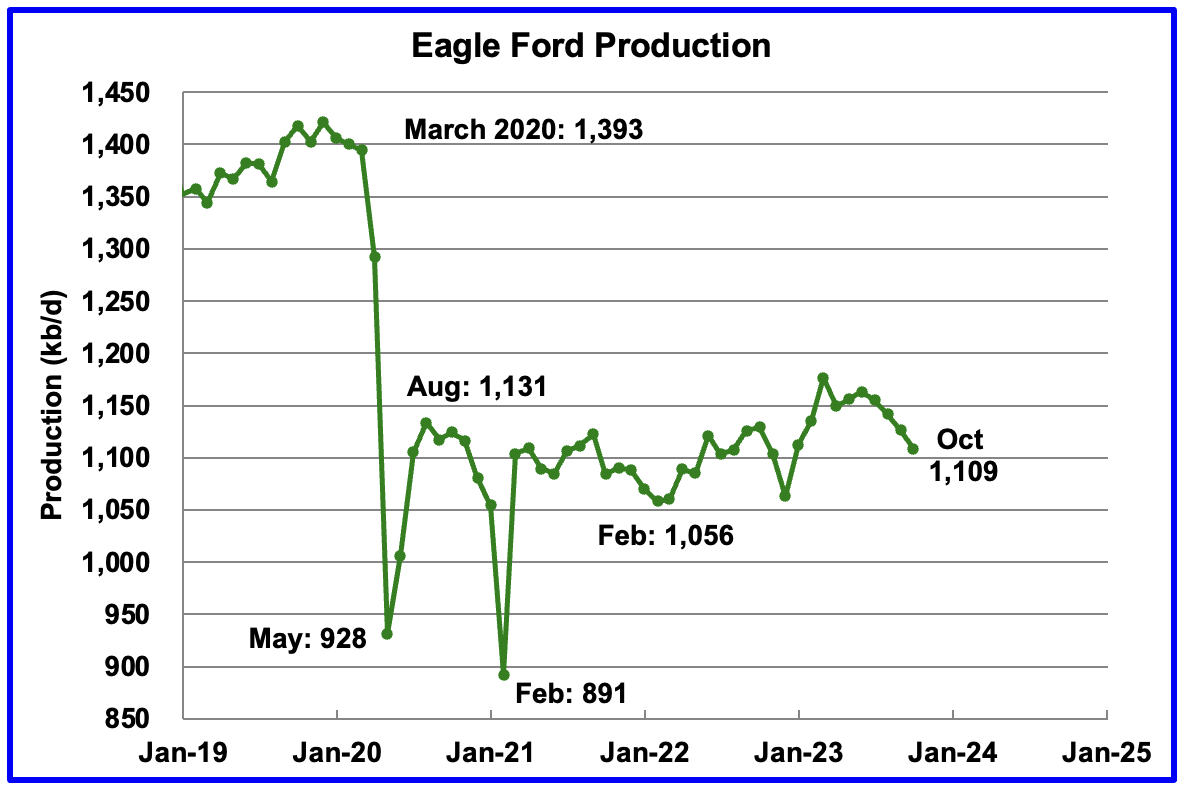
Output in the Eagle Ford basin has been in a generally flat trend since March 2021, fluctuating over a range of between 1,050 kb/d to 1,150 kb/d. October’s forecast projects output is expected to decrease by 17 kb/d to 1,109 kb/d.
At the beginning of the year 2023, 68 rigs were operating in the Eagle Ford basin. The rig count began to drop in mid March to 60 and slowly dropped further to 43 in September.
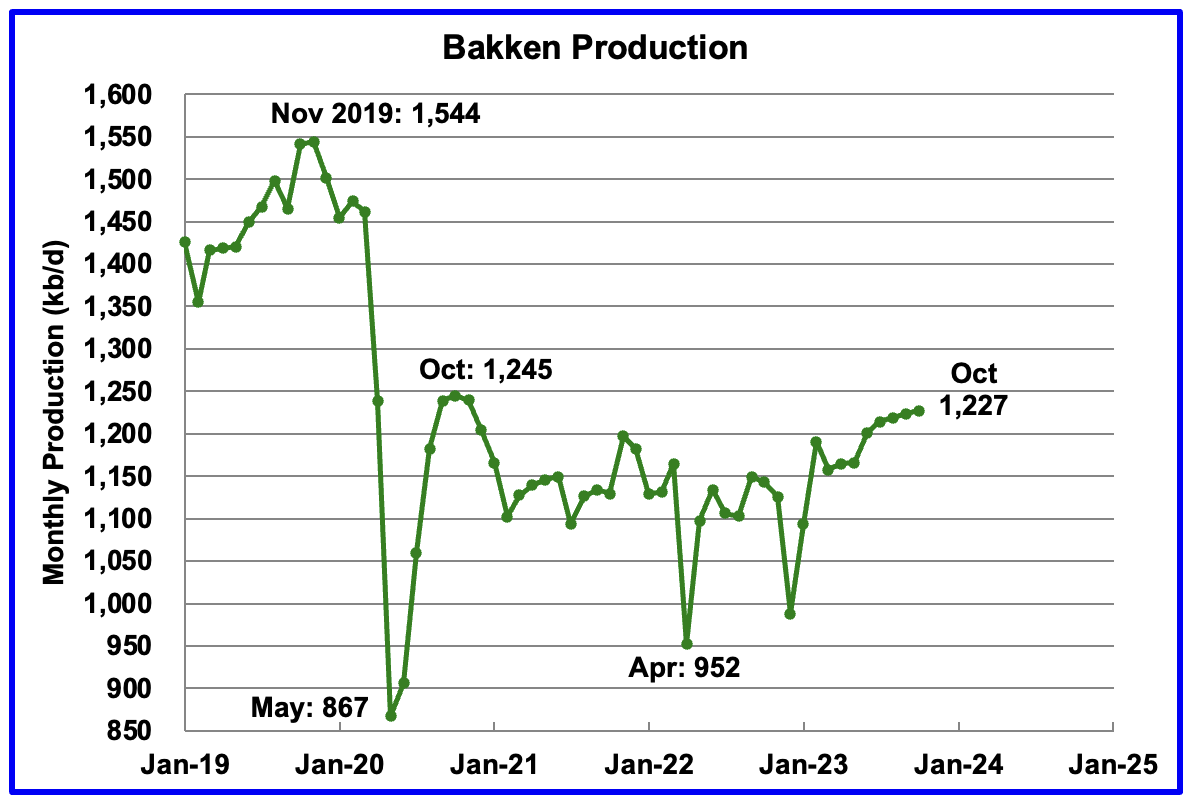
The DPR forecasts Bakken output in October will be 1,227 kb/d an increase of 3 kb/d over September. October production is 18 kb/d lower than the post pandemic peak of 1,245 kb/d in October 2020.
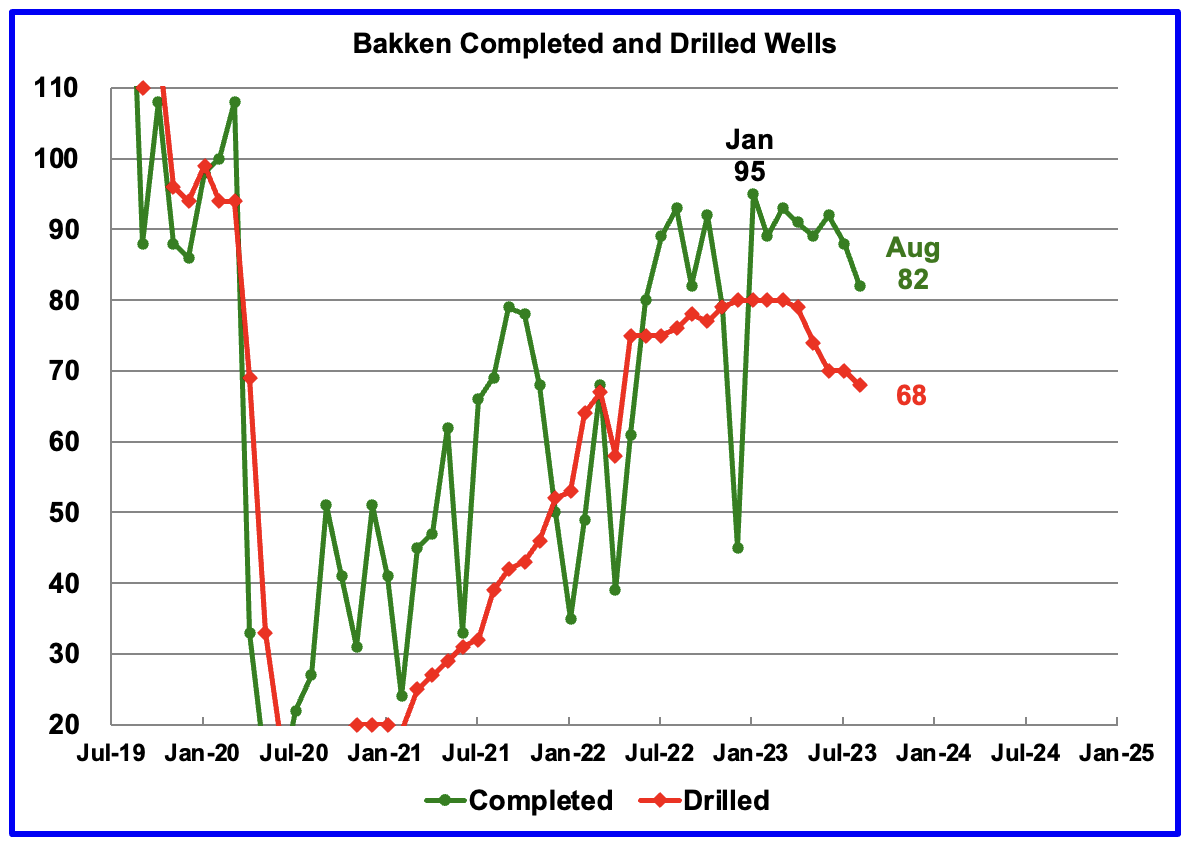
The monthly completion rate and drilling has shown signs of dropping recently since the January highs.
In August 2023, 82 wells were completed while 65 new wells were drilled.
The North Dakota government reported that July production increased by 14 kb/d to 1,181 kb/d. With completions dropping, as shown in the previous chart, production increases can be expected to slow.
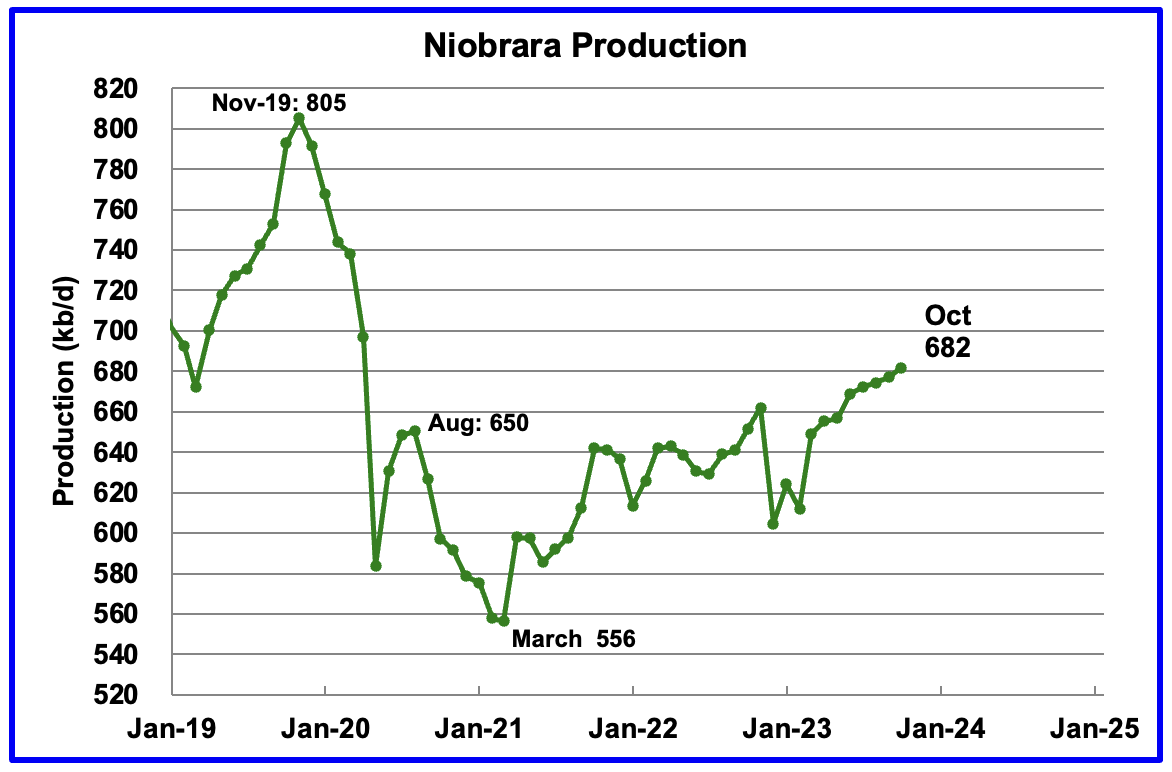
Output in the Niobrara continues to increase slowly. October’s output increased by 5 kb/d to 682 kb/d.
Production increased due to the addition of rigs into the basin but stabilized at 16 ± 1 rigs in March and April. However in August and September the rig count dropped to 14.
DUCs and Drilled Wells
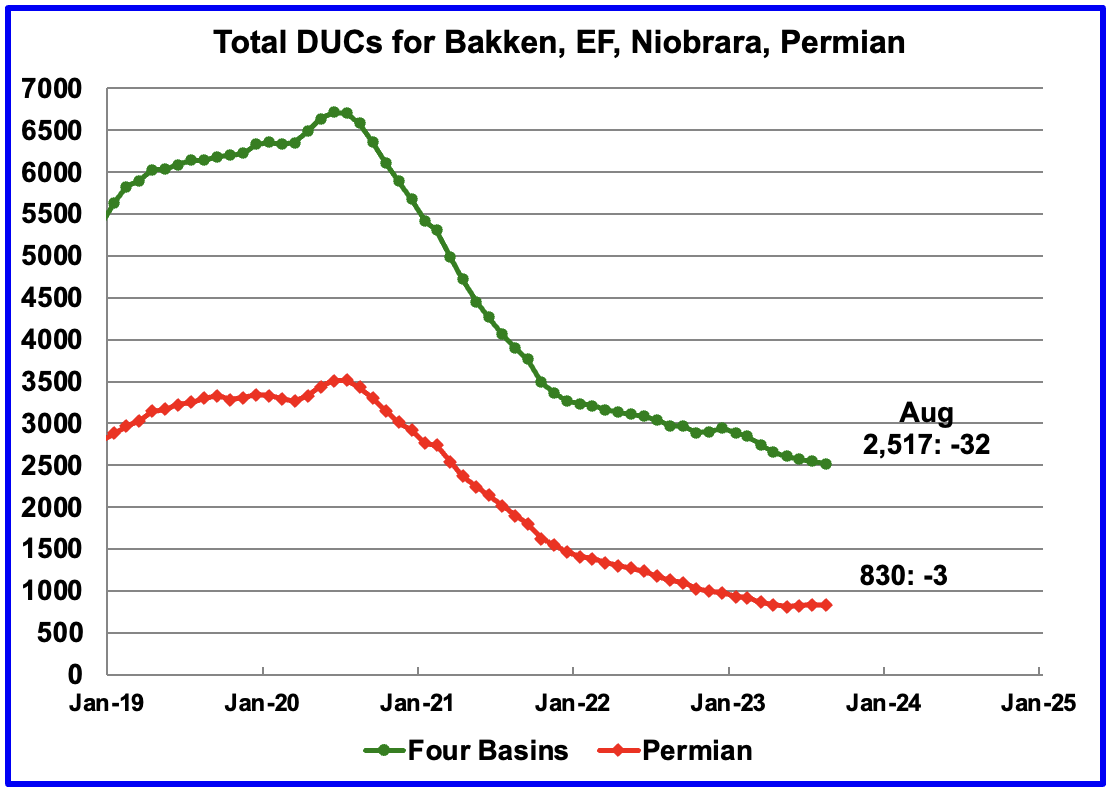
The number of DUCs available for completion in the Permian and the four major DPR oil basins has fallen every month since July 2020 and continued to decrease in August. August DUCs decreased by 32 to 2,517. Of the 32 DUCs decrease, 14 came from the Bakken and 9 from the Niobrara.
August Permian DUCs decreased by 3. However July was revised down from 856 to 833, a downward revision of 26 DUCs
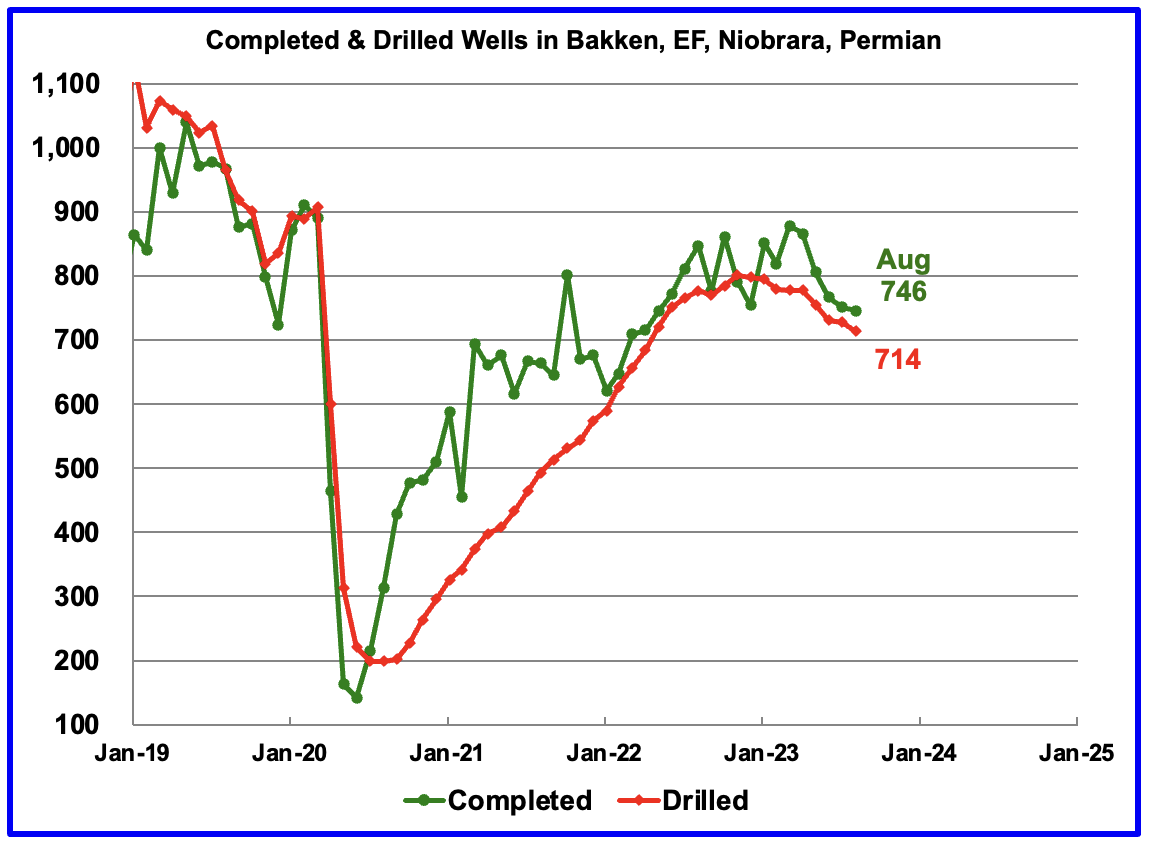
In these 4 basins, 746 wells were drilled while 714 were completed. Both drilled wells and completions are down from higher levels in late 2022 and early 2023.
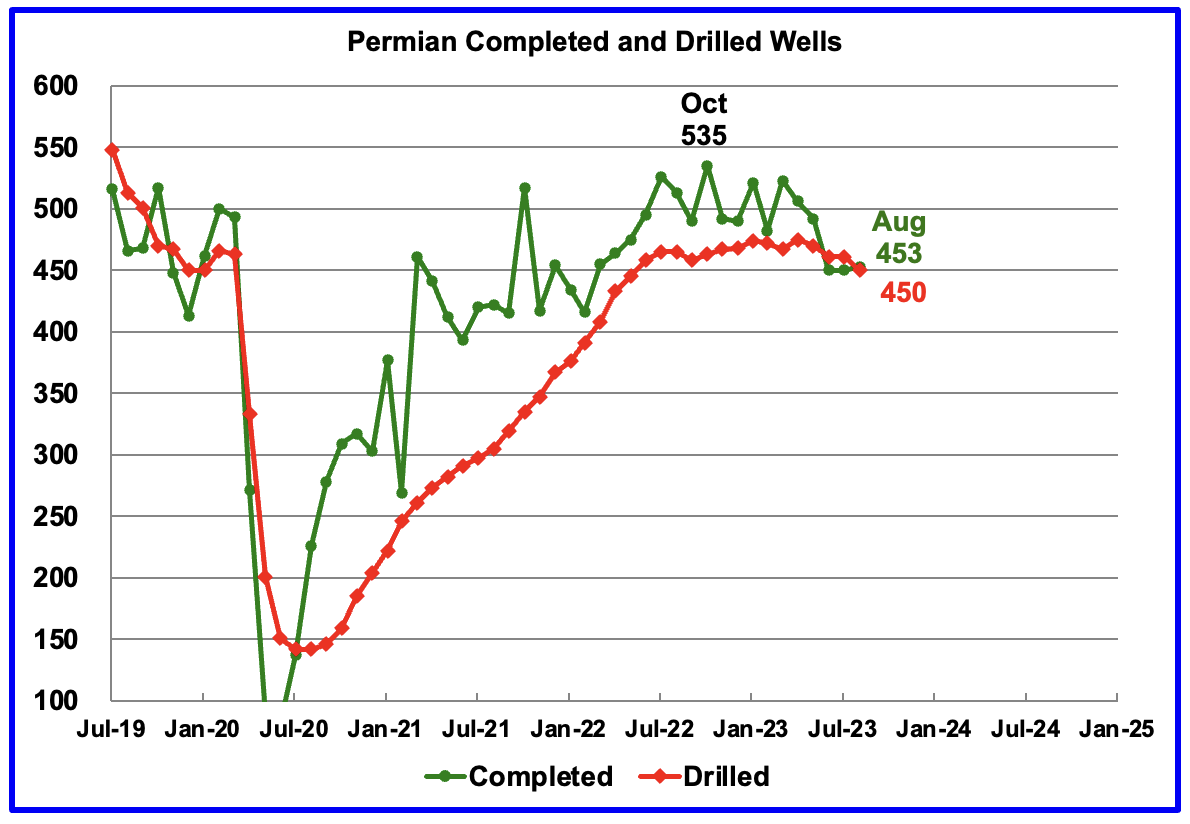
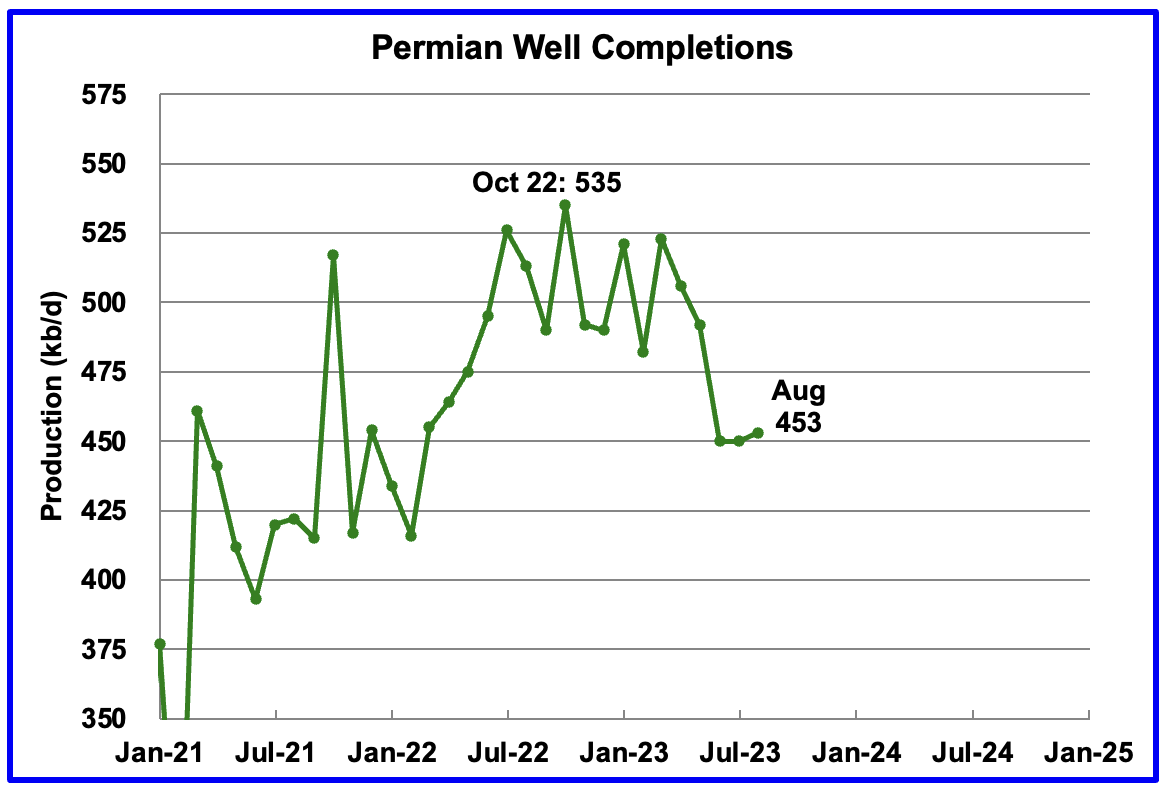
In the Permian, the monthly completion rate has been showing signs of slowing since the October 2022 high of 535.
In August 2023, 453 wells were completed while 450 new wells were drilled. The gap between completed and drilled wells in the Permian is now very small compared to late 2022 and early 2023.
The Permian, as of August, had 830 DUCs remaining and the completion rate was 453 wells/mth. This means that the current cycle time between drilling and completions is 1.83 months or 56 days.
147 responses to “US July Oil Production Rises on Texas & GOM Jump”
.. and then there was one.
I really do think New Mexicos days are already over with. The dynamic duo should be reduced to one if Texas is still the last man standing in the LTO producing category. I think sometime next January or February we will really know. With Kaplan’s prediction that GOM will roll over ’24 or ’25, will Texas growing a 100k to 300k be enough to make up decline elsewhere?
There seems to be little correlation between frac spreads and completions or production when there are 37 recorded in Niobrara, 35 in EF but only 15 in Bakken. The spread and completion data seems pretty noisy too. Is it known how the frac spread numbers are recorded (e.g. total rigs in area or only those active etc.)?
George:
I have pointed out that rig count numbers are not accurate for the states our company operates in (Kansas, Illinois and Indiana).
Granted, those are very small producing states with very old fields and low oil production per well, even for new wells.
Thanks Ovi, nice report,
On RRC data, I have an old chart comparing RRC data fro two different dates for all of Texas, this gives an idea of how incomplete the C plus C data was at that time (April 2019 compared to June 2022).
The EIA looks at historical data and estimates how far off the most recent 12 months of data have been in the past and they use this to information to make their estimates.
Dennis
Thanks
I would like to compare the June 2022 data with the current RRC data. Unfortunately I can’t figure out the dates from your chart. The June report would be reporting May results. Could you post the numbers for the last 4 months of the June report and then I will put up the latest chart along with the last 4 months of the June report to show what the typical increase is.
Ovi,
I cannot find that June 2022 RRC report, but have data from October 2022 (last data point is Aug 2022) from the RRC (statewide C plus C data).
Data from Sept 2021 to Aug 2022 below (C plus C in kb/d)
4965
4969
4970
4959
4873
4788
4906
4909
4782
4691
4589
4207
For this data we have to go back 10 months to be within 1% of currently reported data from the RRC for statewide C plus C output.
Ovi,
Below is data from November 2022 for RRC statewide C plus C in kb/d the data starts Jan 2021 and last data point is Sept 2022. Just copy and paste into spreadsheet.
4619
3768
4765
4758
4759
4756
4805
4860
4965
4969
4973
4967
4886
4800
4922
4934
4835
4780
4701
4608
4043
Dennis
Thanks. See below for reply.
Also consider the information below from the EIA
https://www.eia.gov/petroleum/production/
in particular look at the spreadsheet linked below
https://www.eia.gov/petroleum/production/xls/comp-stat-oil.xlsx
The 914 data comes from the largest producers in the US in each individual state, typically about 25 to 30 companies are surveyed in each state and their output typically makes up 90% of total state production. The EIA uses this data monthly in combination with historical information on state output vs these 914 reports to make their estimates.
The chart below considers the 914 survey amount from Texas and New Mexico and compares with the EIA official estimate for the Permian and Eagle Ford and also considers the ratio of these on the right axis in percentage terms (914 estimate divided by tight oil times 100).
Chart with shorter time frame (Jan 2021 to July 2023) with an estimate for Permian plus Eagle Ford (EF) tight oil output using the average ratio for 914/tight (TX and NM 914/Permian and EF tight) from Jan 2022 to Dec 2023 (92.6%) and assuming the ratio remains at that level from Jan 2022 to July 2023. I call this the Permian and EF (DC estimate) in the chart below.
Dennis
The light blue and light green are parallel and going up in almost straight line. I still think that Texas and NM are linked to the LTO which as noted above I think is incorrect, based on the Texas RRC info.
Ovi,
I don’t think they are linked as you surmise.
See link below for the EIA’s methodology for PSM data
https://www.eia.gov/petroleum/production/pdf/eia914methodology.pdf
https://oilprice.com/Energy/Crude-Oil/The-Permian-Oil-Boom-Isnt-Over-Just-Yet.html
Article bullet points:
-Occidental’s president and CEO, Vicki Hollub, asserts that the Permian still has significant oil to develop, disputing concerns about falling well productivity.
-U.S. crude oil production forecasts show record outputs in 2023 and 2024, with the U.S. leading non-OPEC+ production growth.
-Despite the shift towards capital discipline and focus on returns to investors, major U.S. producers like Occidental, Pioneer Natural Resources, ExxonMobil, and Chevron reported robust Permian production in recent quarters.
Never mind next year, high oil prices are already destroying demand.
Yesterday’s $5-a-barrel slump in the market was given impetus by weekly US data that showed gasoline consumption at its lowest seasonal level in 25 years.
The fuel typically gets a boost over the summer months as Americans take vacations, and this year was no exception. But demand remains well below its pre-pandemic level. The recovery is still fragile.
US gasoline use averaged 600,000 barrels a day — or 6% — below 2019 levels during the driving season, which runs from late May’s Memorial Day to Labor Day at the start of September.
And we can’t pin the blame for lower consumption on more people heading overseas for their holidays. US jet fuel demand also lags behind pre-Covid levels, down 9% from 2019’s summer average.
True, the oil-price plunge wasn’t just a reflection of lower fuel use.
A broad malaise in global financial markets has stoked concern that the Federal Reserve may not be done raising interest rates, while a stronger dollar has hurt buyers paying for their oil imports in the currency.
Real demand destruction — the result of high and rising prices in the midst of tighter economic conditions — has already begun, and consumers from South America to Africa are under pressure.
In Nigeria, the government scrapped unaffordable fuel subsidies that cost $10 billion last year. Gasoline sales subsequently fell 27% year-on-year.
As my Bloomberg Opinion colleague Javier Blas has noted, the countries where consumption is being pummeled aren’t, yet, the global centers of demand growth. But the peripheries matter.
Growth in countries such as China, Brazil and India needs to be even stronger to offset declines elsewhere, if producers are to see an expanding market for their output. There’s no sign that’s happening.
India has already told producers that oil is too costly. “High prices lead to demand destruction,” Pankaj Jain, secretary at the Ministry of Petroleum and Natural Gas, said earlier this week.
OPEC+ members, led by Saudi Arabia and Russia, have slashed supply to balance the market. They have no intention of reversing those cuts before the end of the year.
The repercussions of those decisions are being felt. The steady upward march in prices — benchmark Brent crude rose by more than a third in the three months to Sept. 27 — hit the buffers last week.
–Julian Lee, Bloomberg Oil Strategist
And the $400 average monthly payment on 30 million student loan borrowers is just now kicking in.
Higher oil prices are just the thing to tip a teetering global economy into an economic crisis similar perhaps worse than 2008.
Real wages have been negative for over 2 years. This doesn’t end well. It’s also doesn’t end with inflation and high prices.
Government debt is another massive concern.
https://bondvigilantes.com/blog/2023/08/uk-government-debt-interest-payments-set-to-weigh-heavy/
The UK will spend £120 billion on debt interest, which is more than is spent on defence, the police and fire services and the prison system together.
There have been strikes by nurses, ambulance staff, doctors, rail workers, teachers, civil servants. They all want inflation matching pay awards.
There simply isn’t the money, and our tax burden is the highest since the war.
There is no room to maneuvre any more
But that means that bond holder’s income is going to be 120bn – which should be a positive, no? And the holders of the bonds are holding the safest asset in the country.
I think that the fact that liabilities are the flip side of assets frequently gets lost.
rgds
WP
Thank you Required…I think that piece hits the nail on the head.
Affordability of oil is the key.
If oil is too expensive the demand for discretionary use, and the demand for important use among 90% of the worlds ‘non-rich’, will be scaled back.
And expensive oil makes electric transport more cost compelling, especially for those with stable and affordable electricity.
Once again- diesel. How much diesel consumption is ‘optional’ and sensitive to high price?
People have said we will not have peak demand, just peak supply.
Well, high price and global stagnant economic conditions just might cause peak demand before physical supply potential declines.
Peak affordability?
HHH- “This doesn’t end well. It’s also doesn’t end with inflation and high prices.”
It might not end with stagflation, but it will spend a long time in that zone testing the limits. The country will go through a multiyear phase of intentional rapid dollar devaluation at some point. First things first. Atleast thats my take on it.
How exactly are “they” whoever they are going to devalue the dollar? And devalue it against what? Other currencies?
Dollars value is decided in Eurodollar market. Central banks currency reserves or bank reserves aren’t the same thing as credits on the balance sheets of dollar liquidity providers in the Eurodollar market. One is money that the entire world uses to trade in. The other is “money “ that only banks can use. Not really money.
How many QE’s have they done? Did any of them kill the dollar?
Only way dollar goes down is if we get into a Goldilocks scenario where we have endless cheap energy and economy is booming. Otherwise the banks that create all the money via loans stop making loans.
There is no way to unwind the dollar without it getting massively stronger. Only way to weaken it is to reinforce it by borrowing it into oblivion and even then you end up in scenario where you don’t have enough dollars to pay the debt back so the dollar ends up strengthening.
The notion that governments are in control of the value of their currency is utter nonsense.
Massive printing by the fed managers will in effect lower the value of the dollar. That is how we will de facto default on the debt and pay some of the obligations. That is the devaluation. Only choice the managers will have at the next go round.
All I have to say on it.
The Fed doesn’t print money – they can create reserves by buying assets from banks. Banks create deposits by lending.
Rgds
WP
US Tight Oil up 54,000 bp/d July to August. Up 347,000 bp/d from August 22 to August 23. Down 72,000 bp/d since peaking in March 2023. This data is from the EIA. Dennis says this estimated data is much lower than from Novilabs.
The chart below is the combined production from all basins. The data is in million barrels per day.
Ron
Attached is a comparison of the LTO data you posted above along with your favourite DPR data, aka “not worth a bucket of spit”. 😁😁😁Looks like the DPR got LTO production “flattening/rolling-over” right starting around March 2023.
July in the August report has been revised down by 464 kb/d to 8,105 kb/d. This will/should have a massive downward revision to next August’s Texas production and also the US.
Maybe the oil men can comment on whether this looks correct, it doesn’t look right to me. It takes the DPR estimate for all DPR regions and subtracts the most recent LTO “official” estimate. The increase from July 2022 to July 2023 is 375 kb/d from a base of 996 kb/d, so an annual increase of over 37.5% in conventional output in DPR regions. Makes me wonder if I am missing something.
I think both the DPR and official LTO report are wrong. Novilabs data is much better. Hopefully there will be a Permian update soon from Novilabs.
Dennis
I put my faith in the raw data provided by the Texas RRC and NM. There is good correlation between the LTO August data with the Permian 11 up to March 2023.
Subtracting two large number to get a small difference cannot in general provide a reliable result,
Ovi,
The data for the RRC and NM may be pretty good through July 2022, after that it becomes worse, I have followed RRC data for years, the raw data is not very good until you go back about 12 months.
Dennis
The RCC data doesn’t move much after 6 months. The trend is established by then. March is the last brown marker before the production fall off. April will probably move up above March next month but not by much. That will begin to confirm a small plateau, similar to the August LTO.
Ovi,
The data from Nov 2017 (last data point Sept 2017) only reached 99.5% of true value (based on current RRC data) for C plus C output when we go back 23 months. We have to go back 13 months (July 2016) to get to 99% of true value. It takes 9 months to get to more than 98% of true value.
Ovi,
Note that the conventional estimate looks pretty consistent until 2023, my point is that something changed in the data around Jan 2023, after that date the estimates are questionable for both the official tight oil estimate and the DPR, we don’t know which is bad, it may be both.
The changes in the official tight oil estimate recently do not inspire confidence. I remain confident that the PSM estimates are reliable. See chart below that looks at the 914 estimates from the compstat file linked below compared with the most recent RRC estimate. The 914 estimates are quite good, usually within 1% of RRC value until about October 2022, after that date the RRC data is probably incomplete, based on past history.
https://www.eia.gov/petroleum/production/xls/comp-stat-oil.xlsx
Data in chart below ends in April 2023. If we take the sum of both the RRC and 914 estimates from Jan 2017 to September 2022 and then take the ratio of 914/RRC the ratio is 99.9%. This suggests the 914 estimates for Texas are pretty much spot on over that 4.75 year period.
Dennis
I think you and I have a different perspective on the oil production data. I do not hold up production data to the level of a scientific experiment.
From my perspective once the data from the two sources gets within 5%, changes after that just do a slow crawl. The other thing I look for is a stabilized trend that the updated small increments cannot overcome.
That is the situation I see in the chart posted above. There is good correlation between the LTO August data with the Permian 11 up to March 2023. I expect that the next update will see March Permian 11 go up more than January but not enough to change the plateau trend that has started.
I think the bigger question that has to be answered here is whether this plateau is related to geology or excess cash being returned to investors rather than drilling/completions. Maybe our hands on Oil Men can weigh in on this. As I recall, I think their views favour geology.
Ovi,
We will see how it plays out. It will be interesting to see what the next Novilabs Permian report shows. The EIA LTO data has been pretty inconsistent, they do not seem to have a good handle on the data, maybe they never did.
For me, the bottom line remains that the PSM data is far better for the most recent 12 months than the RRC data. I haven’t looked as closely at New Mexico data, that might be better.
Interesting, 5% error is good enough. So for 10,000 kb/d that would be 500 kb/d, that’s not very good, I have higher expectations. The EIA estimates tend to be within about 1% of the true value, that is how it is done imho.
On geology vs completion rate, both are factors and with good data we can make a determination, without it we are flying blind.
Dennis
Once the data is within 5%, the increments are small and that the trend is established by that point and is what this whole discussion is about plateau vs peak vs growth.
Attached is a comparison of the LTO data you posted above along with your favorite DPR data, aka “not worth a bucket of spit”.
Yea, thanks, Ovi, for the comment. Yes, the EIA finally took my advice and got their at together. 🤣 I am glad to be observant of them. Looks like the DPR may be a little better with their predictive data from now on, thanks to our constructive criticism of them. 🤣
Another way to consider US conventional output is to look at the PSM estimate for L48 excluding GOM and subtract the EIA’s official tight oil estimate to get an estimate of L48 excl GOM conventional oil output. Again we see a big increase over the past 12 months, about 28% per year.
I have far more confidence in the EIA’s PSM estimate than the DPR model, so if there is an error here, I believe it would be due to a poor tight oil estimate.
Is this increase evident out in the oil field? Would love to hear from those in oil country. From 2017 to 2019 conventional output was pretty steady at about 2350 kb/d for L48 onshore, it fell to roughly 1950 kb/d after March 2021, but the tight oil estimate combined with the PSM estimate suggests it has recently increased to above the 2017 to 2019 level to about 2500 kb/d (from June to August of 2023). A 28% increase in the past 12 months suggests there would be a lot of conventional oil activity which would be apparent in the big oil producing states (Texas, Oklahoma, New Mexico, North Dakota, and Colorado). Are we seeing this?
Conventional C plus C output in Texas and New Mexico found by subtracting the official EIA tight oil estimate for the Permian basin and Eagle Ford play from the Petroleum Supply Monthly (PSM) estimate for Texas and New Mexico. From July 2022 to July 2023 conventional C plus C output increased by 54% per year in Texas and New Mexico. That would be true if the EIA tight oil estimate is correct, I think that unlikely.
Dennis.
A possible explanation could be the residual oil zone recovery methods being employed in the shallow fields in Central Basin platform?
I have read about more CO2 and more horizontal drilling here. OXY being the largest one who is doing a lot of that. XOM buying Denbury for the CO2 infrastructure.
OXY claims to have 1.4 million of tertiary acreage, with over 20k total wells and over 6k production wells.
If the numbers are accurate, has to be Central Basin Platform CO2 floods in places like Wasson, Hobbs, etc?
Or maybe you are correct, and the data is messed up?
Shallow sand,
I was not aware of that, thanks. A 50% increase seems like a big jump, it is not clear that the shallow field CO2 work would result in a 500 kb/d increase from a base of 1000 kb/d in 12 months, but I know much less about this than you so I may be wrong.
Maybe other oil field pros could chime in with other ideas.
There are many “stealth” plays being developed on the CPB and other non-core areas outside of the Midland Basin that could be contributing to rapid growth of what they classify as conventional production. Not sure how EIA qualifies production as tight… is it merely a geographical fairway, or truly a formation level analysis independent of location?
Regardless, some of the stealth plays with recent significant action on the CPB include Wolfcamp/Mississipian Hz plays in eastern Winkler County where Boyd & McWilliams and also Saddleback Expl are completing many recent wells in the 300-1,000 bopd range.
Over in Andrews and Ectpr Counties…. Continental, Fasken, Slant, Elevation and Zarvona are also making decent Hz wells in the Mississippian and Barnett. These are also generally in the 300-1,000 bopd range on average.
Meanwhile, Steward and others continue to chop wood nicely up in the San Andres Hz play in Yoakum and Lea Counties on the CPB/NW Shelf.
Random thoughts and observations…. but these and other regional plays may be indirectly adding significant recent new production to your Conventional C&C number by not being classified as tight oil due to not being located in the classic Midland Basin.
Gungalonga,
All of those counties would have the oil from the tight oil formations as included in tight oil output at Novilabs, the EIA Permian tight oil estimate includes output from Wolfcamp, Bonespring and Spraberry fromations of the Midland and Delaware Basins, the Novilabs estimate is better because it includes all of the Permian Basin tight oil formations, but it does not include output from vertical tight oil wells.
The question is does a 50% increase in 12 months seem reasonable (from 1000 kb/d to 1500 kb/d) for conventional oil output in Texas and New Mexico?
Dennis.
My gut reaction is the data is messed up.
Thanks Shallow Sand,
You would know best imho.
A longer term look at US L48 excl GOM conventional C plus C with vertical oil rig count on right hand axis.
The increase in 2023 looks quite steep compared with 2011 to 2014 when oil prices averaged $110/bo in 2023$, also the vertical rig count in 2022 and 2023 averaged about 17 vs 394 from Feb 2011 to Dec 2014.
Ron,
To clarify, I said the Permian tight oil data reported by the EIA in their “official estimate” is quite a bit lower than reported by Novilabs. My guess is the Novilabs data is better, though it has not been updated since June. For April 2023 the Novilabs Permian estimate is 5.3 Mb/d with the EIA estimate at 4.9 Mb/d about 8% lower than the Novilabs estimate.
I did some more detailed comparisons with Novilabs and EIA data breaking the data out by formation and it may be that the EIA data is fine. The difference may be that the EIA only reports on the largest 3 formations (Wolfcamp, Spraberry and Bonespring), the other formations which Novilabs includes adds about 300 to 400 kb/d to the Permian total, the EIA may include some ot this output in their “rest of US tight oil column”, or they may drop some of the data, this is not clear.
The Big Picture –
By 2030 will production be down by 5 mb/d or 10 mb/d?
I’d say down 5 is a best case scenario (and unlikely).
Down 10 is a 50/50 chance, and maybe down 15 is possible (afterall that’s just a loss of ~2 mb/d annually) but might also be unlikely. If we extrapolate the loss from 2018 to 2023 of ~5 then we’ll be down another 5-6. So most likely we’ll be near the 70 mb/d mark.
Kengeo,
It won’t be down by much from todays level by 2030.
Dennis, you’re too optimistic about the future.
Larry,
Many have said exactly that about my past forecasts. In almost every case my best guess estimates have been too low.
Perhaps the future will be different. Time will tell.
Really? Please share your crystal ball…
Source: https://www.eia.gov/petroleum/data.php#crude
Kengeo,
We will see how things play out, my guess is the EIA estimate for Permian tight oil output may be incorrect, we will see if there are future revisions.
This is a response to @WHUT’s comment on the previous post (https://peakoilbarrel.com/steo-and-tight-oil-update-september-2023/#comment-764379): You are of course correct and I should have specified a mathematical model for global average temperature rather than climate.
Fine, that’s probably doable.
OTOH, climate variations will take some extra doing. Can try to capture the variations in a manner similar to tidal analysis, but with important mathematical twists
https://user-images.githubusercontent.com/2855758/271754927-d0240534-e515-43a0-b4af-6d355b3eec56.png
Should take this over to the non-petroleum thread for further discussion. This past September was a huge global spike in temperature.
Dennis
Thanks for the November 22 Texas RRC data. I have compared that report with the latest September 2023 report to extract some typical monthly increments.
The results are shown in the attached chart. The first step was to calculate the monthly increments from January 2021 to July 22 from the November 22 data relative to the latest September 2023 data.
Those increments were then added to the blue graph starting in January 2022 to get the Red graph, “extrapolated”. The next step was to add the January 2022 increments to the red graph to update it to possibly close to 98% of its final value, dbl extrap.
As can be seen there is still some potential increase but it has hints of slowing/plateauing. The average slope from June 2021 to June 2023 is 23 kb/d/mth, a far cry from the 54 kb/d/mth shown in the Texas chart in the post. I chose June over July because it gave a higher slope.
I have sent you the sheet that shows the calculations.
Thanks Ovi,
An alternative is to use the 914 Survey data from the EIA (see compstat spreadsheet from 914 report), from Jan 2021 to July 2022 the average of the 914 survey divided by reported State data (from the RRC) is 0.892. This can be used to create the following estimate using the 914 survey data.
We can check back later to see which performs better for the estimate of Texas C plus C output.
Dennis
Since I think the 914 data will see a significant change next month, that is a risky comparison. The nice thing about this discussion is that it should resolve itself by next month
Ovi,
I don’t think you will be convinced next month. We will see. Note my estimate is 71 kb/d lower than the 914 estimate, my guess is that the EIA’s methodology is better in this case as they have all of the individual company data from the 914 survey (representing about 88% of the total 914 estimate for Texas) which I do not have access to.
Since Jan 2015 the EIA’s 914 estimates have been very accurate on average about 99.9% of the final RRC reported data (once complete). I don’t think that will change.
If oil is really going out of style within 10 yrs, Why is Exxon buying pioneer?
Exxon in advanced talks for $60 billion acquisition of Pioneer
Oct 5 (Reuters) – Exxon Mobil (XOM.N) is in advanced talks to acquire Pioneer Natural Resources (PXD.N) in a deal that could value the Permian shale basin producer at about $60 billion, people familiar with the matter said on Thursday.
The acquisition would be Exxon’s biggest since its $81 billion deal for Mobil in 1998 and would expand its footprint in one of the most lucrative regions of the U.S. oil patch.
Some of those profits have tapered off this year as energy prices, which surged after Russia’s invasion of Ukraine, have fallen over concerns about a global economic slowdown weighing on fuel demand.
Acquiring Pioneer would give Exxon more established oil-producing land it can rely on to increase production when needed, rather than risk its cash on the development of unproven acreage.
“It makes complete sense,” said Bill Smead, chief investment officer of Smead Capital Management, an investment firm which manages $5.2 billion in funds. “You replenish your reserves without poking holes in the ground.”
Exxon produced about 620,000 boed in the Permian basin in the second quarter, a record for the company. Still, this was dwarfed by Pioneer’s output in the basin, which averaged 711,000 boed in the same period.
https://www.reuters.com/markets/deals/exxon-mobil-advanced-talks-60-bln-acquisition-pioneer-sources-2023-10-06/
Ovi – Because they prob. know better than anyone that in 10 years oil scarcity will be the only issue at hand, and there will be those who have it those who do not…
Right now most people spend a relatively small amount on fuel (maybe 5-10% of their income). While extreme, it’s entirely possible that oil could go to $500 per barrel, resulting in gas prices around $10 to $25 per gallon.
This would obviously be devastating to the economy. Buckle up…
Kangeo
I would agree with you on that assessment. I think they also know what is happening in SA, UAE and Kuwait and that adds to their confidence in making this move.
“If oil is really going out of style within 10 yrs,”
It will peak, but that doesn’t mean going out of style.
C+C peaked in Nov 2018–
It is currently in the rear view mirror.
Since 2015 ExxonMobil’s reserves have dropped from just over 25 Gboe to 18, mostly from natural gas but, even with Guyana discoveries, oil reserves have been falling since 2018 and with nothing much on the horizon (especially after the recent failure of a couple of high impact wildcats like east coast Canada). It has lost Russia, where it had high hopes at one time, and is probably looking to sell up in some mature basins like West Africa, GoM and, maybe, the oil sands, where reserves are susceptible to price, Kearl III looks unlikely to proceed at the moment and ESG optics are probably not to its liking. Pioneer would add 2.4 Gboe.
George,
Yes, it is true that Exxon would gain 2.4 Gboe from Pioneer, but it will likely overpay by $20-30 billion, similar to how Exxon overpaid for that Disaster called XTO Energy.
Funny how CEOs make the same mistakes over and over.
BHP Billiton CEO did the same thing by overpaying for its Shale Assets in the early 2010s.
You would think these CEOs are truly smart people, but really, they must do it for the Inside Greed of the management, because it is certainly not for the shareholders or debt holders.
steve
But first CEOs will be thinking about satisfying shareholders in the next quarterly report, secondly the next annual report and somewhere in the back of his mind will be the medium term future that someone else will be having to deal with. (Actually that’s not quite right, firstly would be their bonus payment and retirement package).
Here’s a look at US production for last 100 years and future decline scenario:
This assumes there is another ~55 Gb of producible oil in US. This is ~10% higher than the most likely estimate.
This may be a high assumption given the most recent estimates for US:
Rystad 1P = ~38 (conservative estimate)
Rystad 2P = ~51 (most likely estimate)
Rystad 2PC* = ~122 (* – includes noncommercial volumes)
>> Here’s a look at US production for last 100 years and future decline scenario: This assumes there is another ~55 Gb of producible oil in US.
Where are you getting these numbers from? I came across a recent presentation (youtube) by Art Berman where he said US proven reserves are about 11 years and have been thereabouts for the last 20 years, because they keep discovering more. If the US uses ~7Gba annually then 11 years of proven reserves is almost 80Gba. You’re saying all production amounts to even less than what we know about and then go on to totally ignore further discovery. Also, if prices rise, then proven reserves rise, because the ~80Gba number depends on the price cutoff (again, according to Berman). So, for someone who is neither an oil data junkie nor even involved with this field, would you mind explaining how you arrive at this number?
To add a little more context, according to Berman, proven reserves basically means “known oil economical to extract at today’s prices with today’s methods”. Also, let’s not bring in world proven reserves – I am aware that they’re (1) much less reliable and (2) not being discovered enough to offset use.
Fantastic work Ovi!!
Andre
Thanks. Never expected to get some encouraging news the day after I posted. This Permian peaking/plateauing issue has been bugging me for a while and thought I should share it with our readers.
Rig and Frac Report for October 6
Rigs Down and Fracs Up
– US Rigs down 2 to 445
– Permian rigs down 4 to 292 with 5 from Texas while NM added 1. Permian rigs are down 12 from 3 weeks ago.
– Eagle Ford up 2 to 45
– NG up 2 to 107 (not shown)
Frac Spreads Up 5 to 260
Frac spreads are down 31 from one year ago when 291 were operating
Here’s an additional more conservative decline model (2300 Gb) along with optimistic (2500 Gb), and overly optimistic (2800 Gb). The conservative model uses an additional 800 Gb of oil remaining while the others use 1,000 and 1,300, respectively.
Bottom line is once the steep drop starts it doesn’t let up and it looks like another 3-6 months will confirm that there’s no plateau coming to save the day…
Dennis – I look forward to seeing your revised models over the coming months (if or when you come to accept the data).
Sorry Ken, charts like this really remind me of reading theoildrum.com in 2006. So many charts with oil production about to go into STEEP decline. These days I’m more inclined to accept Dennis’ shock model with his assumptions and modelled scenarios as within the envelope of reasonable future outcomes than predictions that fit some curve to historical oil production that assume we are past peak and the only way is down.
Cheers, Phil
Remember ACE? Every single graph plunged steeply to zero starting the day after being posted. What was that, 15 years ago? At least they were zero-scaled graphs, on the other hand.
Kengeo,
We will see what the future holds. I find annual data more useful.
Hey Dennis, sorry for the repetition since i posted this on the previous POB article too, but what should we make of the uptick here?
https://www.eia.gov/dnav/pet/hist/LeafHandler.ashx?n=PET&s=WCRFPUS2&f=W
Precisely:
How can the oil production stats be compiled so quickly? The last data point is for the last week of September (1 week ago!)
What explains the uptick starting August?
Skeboo
These are just best guesses. Once a month they recalibrate the weekly production based on information in the STEO. Note how the last three weeks are the same, 12,900 kb/d, and rounded to 100 kb/d.
Skeboo,
I agree with Ovi, personally I don’t find the weekly data very useful. I focus on the monthly data as found at the link below, this is the gold standard for US C plus C output.
https://www.eia.gov/dnav/pet/pet_crd_crpdn_adc_mbblpd_m.htm
Alright, thanks. I was just curious about how reliable you thought this was.
I usually fetch the data from the API for the top20 producers just to see how world production is evolving, and it shows only the historical data up to May 2023 (because, i thought, it takes time to collect the data from different parts of the world and the USA, so when i saw that datasource above i considered including it).
https://rb2110.shinyapps.io/EIA_oil_stats/
Attached is a frac spread table for the week August 26 to September 1 as extracted from the October 6 Frac Focus CSV file. The CSV file is updated 5 days a week and is not complete till 5 to 6 weeks later.
For the week ending September 1, Frac focus reported 244 frac spreads. This updated analysis found 239.
This table should be compared with the one shown in the post above. The largest number of frac spreads continue to be found in New Mexico’s Lea and Eddy counties and Colorado’s Weld county.
The biggest WoW frac change occurred in the Bakken 5, EF 6, Permian -21 and Niobrara -13.
The table only shows counties with more than four operating frac spreads.
Thanks Ovi,
Reeves and Loving have more spreads than Eddy, but Lea has the most by far and of the 102 frac spreads in the Permian basin, 70 of them are operating in the Delaware basin (with 33 of these in the New Mexico part of the Delaware basin in Lea and Eddy), with the balance in the Midland basin. Delaware basin dropped 8 frac spreads form what you reported in the post and the Midland basin dropped 13 frac spreads.
Dennis
Frac spreads have been trending down since March, US overall and in the Permian. In the meantime Permian production according to the EIA has continued to increase. Maybe the latest LTO data makes more sense in the light of completions dropping.
Not clear what the completion rate is, I don’t think the estimates in DUC spreadsheet are very good, Novilabs is better imo.
As far as output continued increase, completion rates must fall further to reach a plateau in Permian output.
Excellent information as always Ovi.
One chart and statement caught my eye-‘Oil Production by The Rest’
“The main takeaway from The Rest chart is that current production is 837 kb/d below the high of October 2019 and this appears to be a permanent loss that will never be recovered.”
It looks like the production from these states is almost 20% down since before Covid. Looking at the chart, it doesn’t look like this is a geology/depletion story. More likely, the decline is due to production coming off the table suddenly with the Covid disruption of demand, and subsequently not managing to be put back up again.
Failure to ramp production back up fully is not due to low demand/ low price, with price for oil having recovered to pre-covid levels about 2 years ago.
Seems to me that costs may have grown too high to make the production worth it…costs for labor and all sorts of other inputs. Or there is simply a labor shortage at any price paid out. Alternatively producers may just be waiting for much higher oil prices to come along.
Is my rationale on this off-base?
Hickory
I think you are correct. Without new wells to replace the rapid decline from the older wells, those 837 kb/d will not be recovered unless significant drilling and completions are ramped up.
Colorado, Wyoming, North Dakota and Utah have been slowing adding production, but they may nearing their plateau phase. Will be interesting to see the high the Rest can achieve.
Ovi and Hickory,
My expectation for tight oil from US less Permian basin is a plateau with slight decline up to about 2030 with rapid decline to follow around 2030 to 2032, but I may well be wrong.
Did you change your stance can you graph that?
Svaya,
No change, though I didn’t remember accurately, I guess the steeper decline for US tight minus Permian is 2033 or so.
Note that I do not expect a plateau or decline in Permian basin output until 2028.
Also see alternative scenarios below for Permian basin.
Svaya,
Below is a slight revision to my Permian model with 454 completions per month assumed from August 2023 to August 2027 followed by a lower completion rate. From August 2023 to July 2026 that average annual increase for Permian tight oil output for thi scenario is 184 kb/d.
The scenario is likely too conservative imho. I think with higher oil prices we may see the completion rate increase to 500 per month.
A gradual increase to 500 completions per month (an increase by 1 each month until mid 2027) for scenario below, then decreasing completion rate. Total horizontal tight oil wells completed in the Permian basin for the scenario from Jan 2008 to the final completion in August 2039 is 106 thousand wells (about 44 thousand wells have been completed by August 2023). URR increases from 41 Gb in conservative scenario to 46 Gb in scenario below, the 41 Gb scenario has about 95 thousand total horizontal tight oil wells completed in the Permian basin.
Annual rate of increase from Aug 2023 to July 2026 for this scenario is 259 kb/d.
https://edition.cnn.com/middleeast/live-news/al-aqsa-storm-militants-infiltrate-israel-after-gaza-rockets-10-07-intl-hnk/h_b9a3c6b220012ce32b09a64012c0bcc6
Israel declares war. Oil Prices???
https://news.sky.com/story/israel-hamas-war-why-the-prospect-of-this-conflict-being-contained-to-gaza-seems-improbable-12980756
Israel blames Iran for attacks
“Why the prospect of this conflict being ‘contained to Gaza’ seems improbable”
RUSSIAN Oil Industry Starts to Break Down as Russia Experiences Shortages, Price Rises & Export Ban
This is a 24-minute Joe Blogs YouTube video.
It was interesting that they reversed the diesel export ban this week too. Will have to watch this.
Initial Market reaction to Hamas Attack
Dow Down 200. WTI Up $4/b.
Ovi,
I am waiting to see if Israel attacks Iran. If that happens, count on another $10-$15+ move in oil.
steve
Steve
The press and pundits are talking about a failure of Israeli intelligence.
The only way this attack could happen without the Israeli intelligence not knowing is that this group was trained in Iran, out of site of Israeli informants. Also note they used the same tactics as the Ukrainian’s, small groups, drones and attacks on multiple fronts.
Netanyahu may have allowed it to bolster his faltering support within Israel.
Regardless, that will be the effect.
Steve
What about that gas prediction?
Iran is off limits.
They can bring down the world economy in 10 minutes.
https://mishtalk.com/economics/after-attack-on-israel-gold-up-oil-up-stocks-down-treasuries-unknown/
Economic perspective on Israel
Don’t forget Israel has nukes!
I could see bond yields going lower here which would take some of the pressure off banks. Dollar would move lower as well. Taking some of the pressure off other currencies that have been taking a beating.
If this weeks CPI number comes in soft we will likely see a peak in rates and narrative will likely change to wait and see more data which if also comes in soft then the rate hikes are over.
Demand was already slowing. War premium on oil prices is the last thing the economy needs right now.
Ovi,
Yeah… I did an update for subscribers. My call for $1 Gas seems unlikely. However, I believe this breakout above $3 Resistance Level may be more Trader Momentum driven than fundamentals.
Europe’s Natgas Inventories are now nearly 97% full. And, they still have 4-5 weeks more of building inventories to go.
So, if you are asking my 1-3 month time frame, Natgas Supply & Demand fundamentals are still more BEARISH, but Oil, even without the current Israel-Hamas War, is still quite BULLISH.
steve
Steve
As I mentioned previously, I don’t follow gas. How much of the price rise in the US is being driven by internal US demand. For instance are LNG producers locking in deliveries before winter when US home heating demand kicks in?
Also I keep reading that German chemical demand is rebounding and being supplied by more LNG gasification terminals.
Most world scale LNG facilities are structured around long term contracts, especially in the US. It’s very difficult and risky to shut down production at a liquefaction facility – once all the piping and heat exchangers are cold you want to keep them that way to avoid thermal shock on the steel due to expansion/contraction during temperature cycles. Ergo production doesn’t really change much day to day over the course of a year. Mostly you just produce flat out for a given ambient temperature. The shippers have to show up and provide ships or else they take big hits due to contract fines.
Once on the ship they can get rerouted due to spot pricing arbitrage based on local shortages or severe cold snaps but the export facilities don’t care about that, it’s a shipper problem. The facilities just keep producing flat out and expect a ship to show up on time so they can load it.
US heating season gets started in a couple weeks though we did get a jump on things with this early cold snap in the east. It’s looking like a modoki El nino this year so I’m expecting a much colder winter in the East-Sout East US with larger inventory draws…and probably higher prices relative to last winter. Last winter also had Freeport offline which helped keep US prices low and that shouldn’t be a factor this winter since they’re back up and running.
LNGUY
Thanks for the background info. So are you saying the jump in NG prices are related to an expected colder winter and hence a bigger draw.
Ovi,
That and Freeport being online which leads to higher LNG exports than last year.
My US shale gas scenario based on a Hubbert model, in this scenario most of the increased production gets exported as LNG, US demand is not expected to increase much. Not clear if an extra 30 BCF/d capacity will come online for LNF export facilities and they would not be wise to create that capacity because there might not be enough shale gas after 2033, in addition conventional output is decreasing in the US so not all of the 30 BCF/d increase would be available for export. A more likely scenario is a plateau in US output (including conventional) with shale gas output rising enough to offset the decline in conventional natural gas output.
There is about another 15 BCF/d of LNG capacity either approved or under construction as of June 2023.
About 10.6 BCF/d of LNG was exported in 2022, if all of this capacity comes online we could see 25.6 BCF/d of LNG exported by 2026 or so. That takes US output up to about 121 BCF/d of dry natural gas output (from about 106 BCF/d in July 2023, of this total about 25 BCF/d is conventional dry natural gas output).
If we assume conventional dry natural gas output is unchanged, this implies an increase in shale gas output from about 82 BCF/d in August 2023 to 97 BCF/d in 2026 or so. Any further expansion in LNG facilities beyond those already approved seems a big risk, in fact even approved facilities are a big risk and may become stranded assets unless wind and solar power and conversion to heat pumps in place of natural gas furnaces and boilers reduce natural gas demand in the US.
Well said Dennis. I’m actually more concerned about a peak in natural gas production than I am for oil. It’ll be a real shock for electricity prices when that day comes. I also think the US is incredibly stupid to allow unfettered access to export so much of it. Very short sighted. Ironic as most of my career has involved building these export facilities in the US. So I’m a bit of a hypocrite.
LNGGUY, you are not a hypocrite. You are being a very good American. I, for one, appreciate that a great deal.
The APP Basin, I believe is now in significant decline. I don’t buy the market “obstruction” rhetoric. The single biggest source of free natty in the US is the Haynesville and it does NOT work economically below $4 MMBTU.
Associated gas from tight oil wells will decline to nothing, eventually, by nature of the rock and depletion. I am asked, often, if investing in midstream, downstream export facilities along the US GC is wise based on the Permian Basin hoopla and my answer is always, categorically, NO!
Thank you! Short sighted, indeed. The rush to drain America of all Her remaining natural hydrocarbon resources, for the sake of exports, and money, is a grave disservice to the future of our children.
It is very un-adult like.
Our nation is now facing the probability, not the possibility, of war on two fronts in the East. Our SPR is drained to nothing and we export/burn tight oil production in the US as fast as we can produce it. We’ll likely have to borrow JP8 fuel for our military from Delta Airlines before this all over. Nobody, I repeat NOBODY in our great country can, or is capable, of thinking past next week anymore.
If I may. You have plenty of waste land to install bioreactors producing microalgae biomass,to methanize it, to burn it to produce electricity and fuel with the exhaust gases the growth of the next batch of microalgae. That’s not circular, sure, but it will reduce the amount of gas needed from elsewhere. That can seem crazy and nonsensic but every part of the cycle is available and working.
That is exactly what happens when a country doesn’t have a national policy but instead allows individual companies to maximize for one variable – profit – rather than longer term national interests.
rgds
WP
Thanks LNGguy.
Hopefully wind, solar, hydro, geothermal, and nuclear power ramp up enough to reduce the need for natural gas, as natural gas prices increase it may accelerate the move to wind and solar and also to heat pumps and might lead to a fall in US demand for natural gas.
I agree that exporting our energy resources is a bad idea.
Iran Oil exports
Iran is funding Hamas which is hell bent on violence. Iran was pretty well isolated when Saddam was in power but since America decided to get rid of him Iran has aquired powerful friends in Iraq. These Shia Iraqis had little power before now they can help Iran move it’s oil out of the country.
https://www.mei.edu/publications/iranian-sanctions-evasion-and-gulfs-complex-oil-trade
Iran does not use this money to help it’s people but uses the money to increase it’s hold on power killing any civilian who even dares hold a peaceful protest.
https://www.youtube.com/watch?v=zPKAY7yQ91Q
Iran govenment funding of terrorist groups is distabilizing countries in many areas not just Hamas. Boko Haram receives funding from the Islamic Republic.
There are many far more important things going on with oil than never ending graphs of Bakken.
Interesting piece from EIA from about a month ago.
https://peakoilbarrel.com/us-july-oil-production-rises-on-texas-gom-jump/#comment-764589
Excerpt:
Against the backdrop of a decreasing total horizontal oil rig count in the Permian, the rig count for medium depth wells has increased compared to pre-pandemic levels. Each rig in the Baker Hughes rig count is categorized by well depth. According to data as of September 8, 2023, the rig count for wells deeper than 15,000 feet (>15,000) decreased by 69% (58 rigs) from the March 13, 2020, pre-pandemic rig count (Figure 1). In contrast, the rig count for wells between 10,000 feet and 15,000 feet increased by 2% (4 rigs) compared with March 13, 2020. This decline in >15,000 wells suggests a strategic change. Although deeper wells produce more oil per well—thereby increasing revenue—they are also more expensive to drill.
Chart below uses Baker Hughes data from week ending October 6, 2023. TVD=total vertical depth. I wonder if oil companies have come to the conclusion that longer lateral wells (more than 10 thousand feet or 3048 meters) are not the best option. It might be that around 3000 meters is the optimal lateral length (such a well would be around 15 thousand feet TVD or about 4500 meters.
Dennis – I have some trouble understanding why you would think this:
“It won’t be down by much from todays level by 2030.”
Afterall, your URR for World is only ~2,660 Gb, which on the graphic below would be ~2,500…
With a peak of 74 Mb/d for the World less US all the way back in 2016, the world less US is already down 7 Mb/d in as many years…
Take a look at the graphic below and see if maybe you want to rethink that statement, or provide some rationale why you would think production doesn’t fall in the next 7 years, I can’t understand it at all…
RMI makes a strong case for oil demand falling by 1mbd by 2030 due to EV penetration. So if we can stay on a bumpy plateau until then, things might just work out, at least in the transportation arena. You may not agree with it but you should read it just the same
https://rmi.org/wp-content/uploads/dlm_uploads/2023/09/x_change_cars_report.pdf
Its a good summary of where things are heading, even if on the optimistic side of the timeframe. I know that in US and Canada people have trouble seeing the global situation, since there is such abundant domestic petrol production here (for now).
The gasoline demand graph out to 2028 looks feasible.
I think the authors may be a bit optimistic about the rate of ICE ‘scrappage’ over the next 10 years. Rather, I suspect that people will hold onto current ICE vehicles for longer than the past decade or two. This results in a slower trend shift toward EV by a handful of years.
Hickory,
People may hold onto icevs, but the miles they are driven may fall, before long EVs will be cheaper than ICEV and only the very wealthy will continue to drive them, a bit like horses.
I think there will also be a big chunk of working class people who will be holding onto and using their current ICE as long as they can, even if the price of gasoline is very high. Also for those who don’t have home charging capability, the advantage of EV is less dramatic unless they have access to very convenient and quick charging elsewhere.
I do think we will get to a point where light vehicle sales without a plug drops off quickly, later on this decade.
Hickory,
In the future even apartments may provide charging capability. Eventually there may be a large used car market for EVs and plugin hybrids, though it will take some time. Sometimes these transitions happen more quickly than we believe possible.
Also there is the potential that self driving cars will reduce car ownership for many in the future. A lot of day to day travel may become low cost Uber/Lyft service provided by self driving EVs. This could speed up the transition to electric transport for passengers by a factor of 3 or more.
On the optimistic side the study doesn’t account for what I would call heavy drivers, people who put on 25K plus miles a year and cycle through their cars every 5-8 years. These folks benefit most from transitioning to EV and the high turnover rate means they will switch sooner. I can’t find any numbers anywhere on this phenomenon but I see it every day in the construction/real estate industry and lots of folks are switching or talking about it.
Kengeo,
First It is World output that matters not World less US, my earlier comment was on World C plus C output (which was the previous chart you presented and which my comment referred to) and applies only to that. The shock model scenario remains the same, see chart below. My expectation for World C plus C output in 2023 is 81.6 Mb/d and in 2030 about 82.9 Mb/d.
Note that I expect World conventional output will be 4.1 Mb/d less than the 2016 peak in 2030, but unconventional output will be 5.9 Mb/d higher in 2030 than it was in 2016, a net increase in World C plus C output of about 1.7 Mb/d from 2016 to 2030 ( and 0.1 Mb/d less in 2030 than the World C plus C peak in 2018).
A URR of 2675 Gb would result in a mid point of 1338 Gb, suggesting a peak in 2018.
Shortly after the 2018 peak of 84.5 mbpd, a decline of ~1.5 mbpd each year would occur (plus or minus 0.5 mbpd depending if URR is higher or lower than 2675 Gb).
2019 – 83.0 mbpd (2019 ave. was 82.2, slightly below)
2020 – 81.5 mbpd (2020 ave. was 75.5, below due to COVID)
2021 – 80.0 mbpd (2021 ave. was 75.3, below due to COVID)
2022 – 78.5 mbpd (2022 ave. was 79.2, slightly above)
2023 – 77.0 mbpd (2023 ave. is 81.8 thru May)
2024 – 75.5 mbpd
2025 – 74.0 mbpd (URR = 1550 Gb)
2026 – 72.5 mbpd
2027 – 71.0 mbpd (URR = ~1600 Gb)
2028 – 69.5 mbpd
2029 – 68.0 mbpd
2030 – 66.5 mbpd (URR = ~1680 Gb)
2035 – URR = 1800 Gb
2040 – URR = 1900 Gb
2045 – URR = 1980 Gb
2050 – URR = 2050 Gb
2060 – URR = 2150 Gb
2070 – URR = 2200 Gb
Kengeo,
There are two things going on, a slow decline in conventional (URR=2500 Gb) oil and an increase in unconventional oil (URR=175 Gb). The two cycles are not in sync. The peak of conventional occurs around 2015 near 50% of URR and the peak of unconventional occurs around 2026 for unconventional, though the decease in output during the pandemic pushes the World peak to 2027.
Average World C plus C output in 2022 was about 80.5 Mb/d, based on EIA data and the Statistical Review of World Energy has crude plus condensate at 81.2 million barrels a day for the World in 2022.
Thank you Dennis for all of the strong work on this topic.
The effort is very much appreciated, and your outcome
projections have been remarkably solid.
Hickory,
Thanks.
Note that the model for the past is not predictive, it essentially tells me for known discoveries and and assumed rate of development of resources (about 39 years on average from discovery to becoming a producing reserve, with this average rate assumed to continue in the future) the historical extraction rate over time can be determined for conventional resources. I then make an assumption about future extraction rates, based on the historical trend. This guess on future extraction rates is certain to be incorrect, as is the assumption that development rates for discovered resources will remain unchanged also certain to be wrong.
Bottom line, any part of the curves beyond 2022 will be incorrect with near certainty.
The curves are pretty, but are not predictive.
“The curves are pretty, but are not predictive.”
Good for everyone to hear and understand that.
Ipsos poll shows over half of Americans unlikely to buy an EV
Americans and more than likely (Canadians my opinion) have a different perspective of EVs penetration than the rest of the world.
The United States is in the middle of an electric green wave. Electric vehicle sales are expected to reach 40% of total light vehicle sales by 2030, and some forecasters even see it topping 50% by the end of the decade. While it seems the transition from gas powered cars to electric vehicles is going to be a swift one in the US, new polling from Yahoo Finance and Ipsos finds Americans are still very skeptical of that transformation.
https://finance.yahoo.com/news/new-yahoo-finance-ipsos-poll-shows-over-half-of-americans-unlikely-to-buy-an-ev-130040140.html
Ovi the report I linked addresses this issue. This number does not stay constant and willingness to own an EV has been rising over time in a manner that is unlikely to limit sales in the foreseeable future.
What link
https://rmi.org/wp-content/uploads/dlm_uploads/2023/09/x_change_cars_report.pdf
A big change in the EIA’s International Energy Outlook 2023 from the last report in 2021, especially for crude plus condensate output from OPEC. The chart below shows the two C plus C forecasts.
The EIA is not expecting much from OPEC+ through 2024. The chart below includes Azerbaijan, Bahrain, Brunei, Kazakhstan, Malaysia, Mexico, Oman, Russia, South Sudan, Sudan, and all 13 OPEC nations.
IF the EIA is correct in this projection, any increase in world production between now and the end of 2024 would need to come from the USA, Canada, and Norway. They expect Brazil to decline by half a million barrels per day by December 2024.
The oil data is crude only. It does not include condensate. The data is million barrels per day.
Dennis –
We can make this incredibly simple.
The maximum production for the entire world was November 2018 at 84,650,000 barrels of oil per day (BPD).
The most recent 6 month average was 81,500,000 BPD. The most recent peak was 82,400,000 BPD in February 2023. As of May 2023, production is down to 80,700,000 BPD.
From recent drops in production from big producers we can also wager that it’s now down a couple more million BPD.
If you assume a URR of ~2,900 Gb, then production would decline at ~1.4% annually. In 3 years from now, production would be at ~77,000,000 BPD (from May 2023 level).
If however, you take into account Rystad estimates, you might assume a lower URR of only 2,500 Gb. In this case production would decline from the peak by ~2.8% annually. In three years this would mean production would be ~73,000,000 BPD.
Using lower URR (~2,100 Gb plus or minus 50 Gb), production would fall to ~65,000,000 BPD plus/minus 5%.
It’s important to note that this lower URR estimate is in fact the “most likely” estimate thereby making it the conservative estimate to use.
With that in mind, we might expect oil production to fall by an average monthly amount of more than 300,000 BPD.
Take a look at Ron’s chart, you will see that OPEC alone has fallen by almost 10% since 1 year ago.
The other simple fact alone is that production has not been climbing since 2018, if it were, then a future peak might be a possibility. As it stands now, we are ~5 years post peak. We are also 5 MBPD below that level, what do you think production will be in 5 years…84 MBPD??????? You must realize that’s an impossibility as all the major producers are in decline…
Kengeo,
I use yearly averages, monthly peaks are of little importance in my view. So I put the annual peak at 83 Mb/d in 2018. The EIA has been having difficulty processing their World data correctly. So recent EIA World data from last month will likely be revised. OPEC output has decreased recently due to cuts by OPEC producers who believe the World Oil Market is oversupplied. We will see what happens, I think 81 Mb/d in 2030 is much more likely than 65 Mb/d for World C plus C output.
FF subsidies are increasing -or have increased at least
https://www.statista.com/chart/31016/volume-of-global-fossil-fuel-subsidies-timeline/?utm_source=Statista+Newsletters&utm_campaign=9be8f6b841-All_InfographTicker_daily_COM_PM_KW37_2023_Th_COPY&utm_medium=email&utm_term=0_662f7ed75e-9be8f6b841-314934925
Rgds
WP
Weekendpeak
The blue bars are economic fantasies. You don’t see how much taxes these companies pay and how many benefits this oil and gas brings to our society.
Yes we have to move on but would somebody come upon with a plan for the transition that is required instead of useless charts.
Ovi,
There is not a lot of planning in a market economy. The idea for mature industries is that they should not need subsidies, also note that the tax rate on corporations in the US is quite low relative to Europe (I am not sure about Canada, taxes are probably higher there than in the US as you have a decent safety net relative to the US.)
It is fine to subsidize oil and gas, but we hear a lot from the industry about the subsidies for other industries when they are feeding from the same trough.
Any subsidy to oil companies is a direct subsidy to shareholders – it is a transfer from tax payers to equity holders. What positive effect does that have on anything, aside from the shareholder’s pocketbooks? Would that money not be better used in pushing the transition away from FFs?
rgds
WP
There is no transition away from gasoline unless there’s huge growth in natural gas electricity generation.
Nat gas electricity generation needs to grow by 5-10% per year to satisfy demand from all the EVs that will hopefully be buzzing around (that’s light transport only), if heavy transport with EVs is even possible then the growth prob. needs to be more like 30-40% (at least initially)…
EVs solve one problem yet they make an entirely new one (electricity shortage and resulting high prices)….
No transition away from FFs (that’s a fairytale), only pivots to different mixed uses…
LNGGUY and Mike are spot on, major issues soon for Nat Gas…looking at Dennis’ graph above, best we can hope for is Nat Gas to grow by 2-3% annually…this alone tells me there’s a major disconnect in the whole EV growth estimates…electricity prices are already making EV ownership less appealing than it was 12 months ago.
I would bet the utility companies will figure out a way to price energy by not only the total amount of KW but the speed it’s delivered (charging EV or using AC for example). Or even charge a monthly rate for 220 v service vs 110 v…
Kengeo,
More electricity can be provided by wind and solar as they ramp up. From 2018 to 2022 based on Statistical Review of World Energy World Electric Power Generation increased by 2419 TWh and over that same period Wind and Solar Power generation increased by 1582 TWh, providing about 65% of the increase in electric power output over that 4 year period. Over time the proportion may grow.
For example if we consider the 2014 to 2018 period only 35% of the increase in electric power output came from wind and solar over that 4 year period.
As natural gas output approaches a peak in the 2030-2040 time frame (best guess around 2035) it will become expensive and the transition to wind and solar may accelerate.
Interesting point about the Exxon-Pioneer deal:
“The Wall Street Journal called this an “era of megadeals”, which would reshape the industry, leaving a handful of large players in charge rather than the hundreds of small independents that pumped at will at the height of the shale revolution.”
Slower growth and a fatter tail from consolidation?
https://oilprice.com/Energy/Crude-Oil/Shale-Consolidation-Could-Put-A-Permanent-Lid-On-Oil-Output.html
More info on EIA’s IEO 2023
See
https://www.eia.gov/outlooks/aeo/data/browser/#/?id=24-IEO2023®ion=0-0&cases=Reference&start=2020&end=2050&f=A&linechart=Reference-d230822.30-24-IEO2023~Reference-d230822.6-24-IEO2023&ctype=linechart&sourcekey=0
World C plus C increases to 83.1Mb/d average output in 2024 and then decreases due to lack of demand from 2025 to 2026 (reaching to as low as 79.8 Mb/d in 2026) and then gradually increasing to 80.7 Mb/d in 2030, to 82.7 by 2035, and to 85.4 Mb/d by 2040, and to 92.7 Mb/d by 2050. The EIA reference scenario for World C plus C is not realistic in my view after 2030, I also expect that World C plus C demand from 2025 to 2030 is likely to be higher than the EIA’s reference scenario.
I wonder where the authors of the report think that all of this oil will come from.
Seems like they are simply drawing a demand line that follows population up.
US production was down in September? That is what the latest OPEC MOMR says.
Non-OPEC liquids production (including OPEC
NGLs) is estimated to have decreased by 0.3 mb/d
m-o-m in September 2023 to average 72.9 mb/d. This
was higher by 1.4 mb/d y-o-y. Preliminary estimated
production increases in September were mainly
driven by Other Eurasia and the UK, and were more
than offset by drops in Russia and the US.
EIA Weekly Supply Estimates…
LOL,
steve
Steve,
That is based on the most recent STEO forecast for October with output at 13170 kb/d.
A new thread updating Non-OPEC and World Oil Production has been posted.
https://peakoilbarrel.com/june-non-opec-and-world-oil-production/
A new Open Thread Non-Petroleum has been posted.
https://peakoilbarrel.com/open-thread-non-petroleum-oct-12-2023/