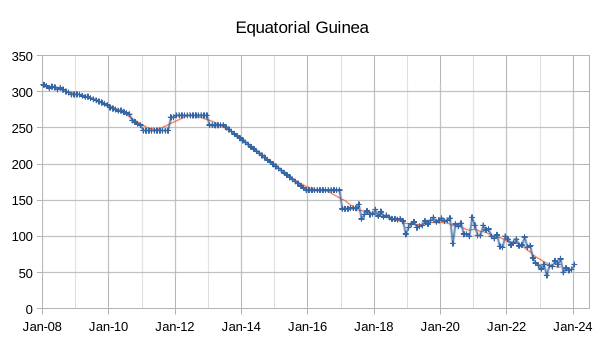
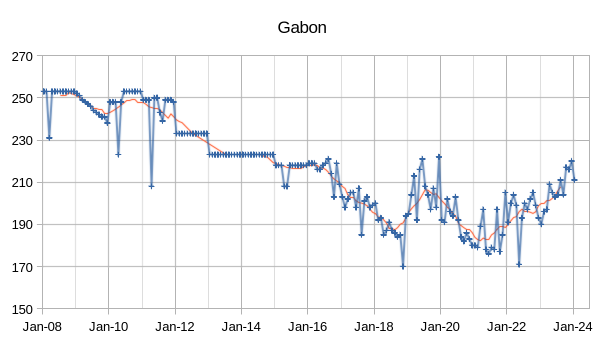
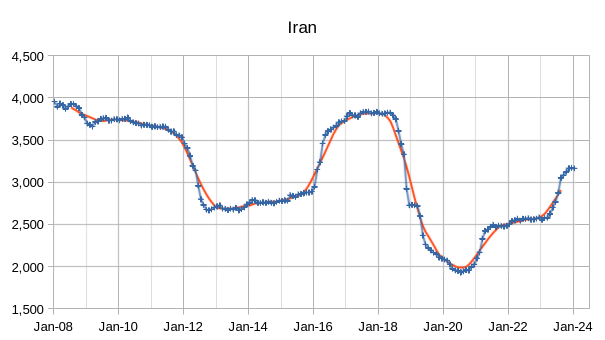
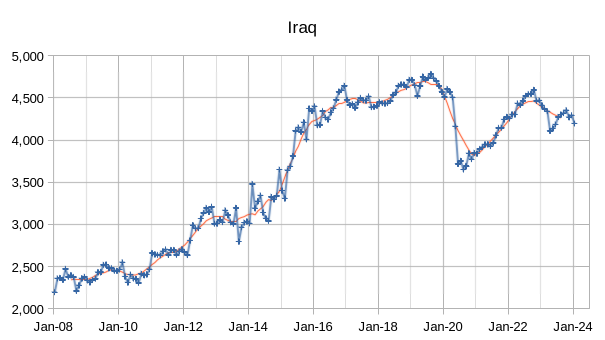
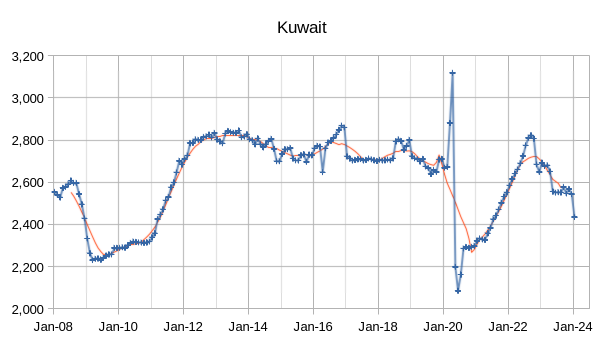
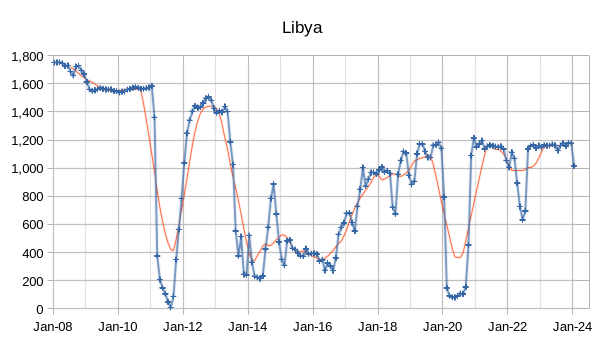
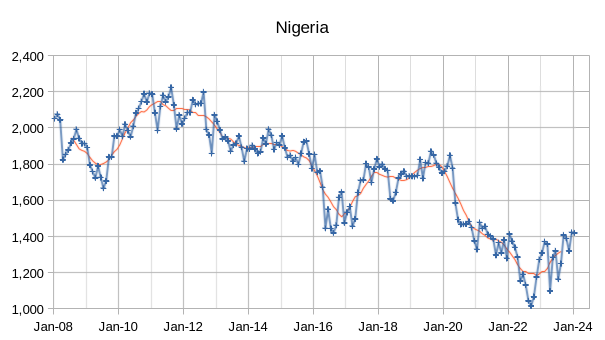
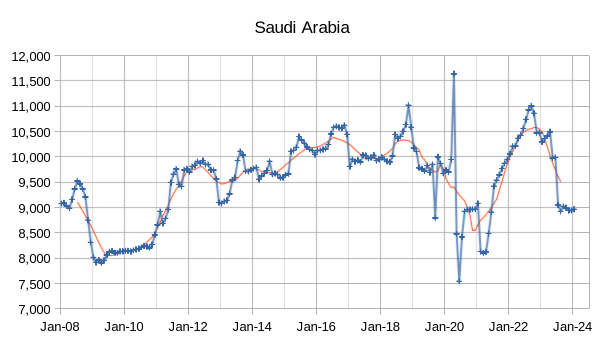
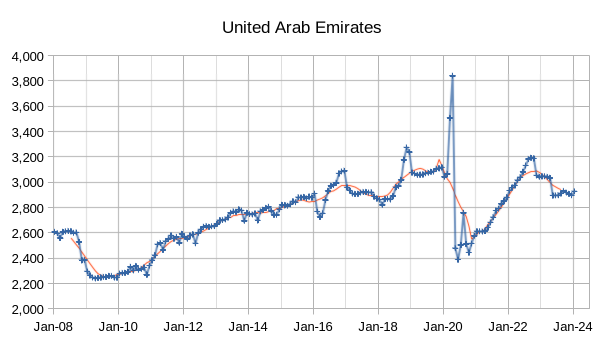
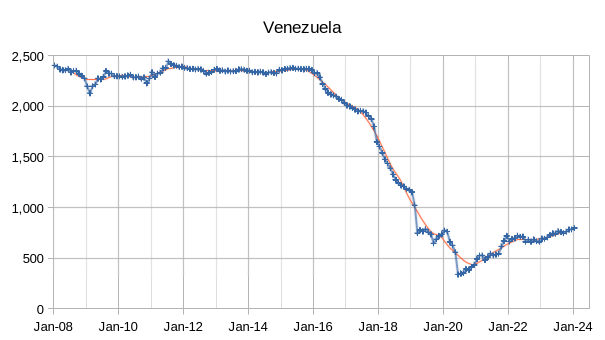
The OPEC Monthly Oil Market Report (MOMR) for February 2024 was published recently. The last month reported in most of the OPEC charts that follow is January 2024 and output reported for OPEC nations is crude oil output in thousands of barrels per day (kb/d). In the OPEC charts that follow the blue line with markers is monthly output and the thin red line is the centered twelve month average (CTMA) output.
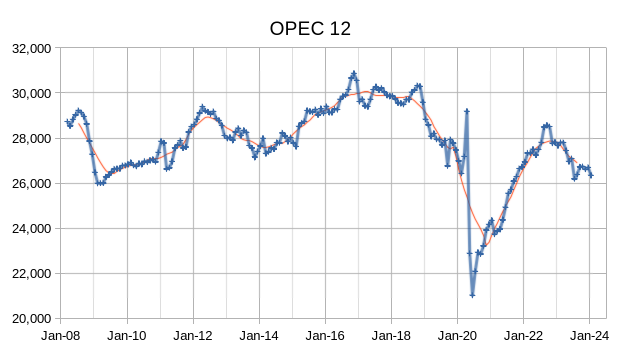
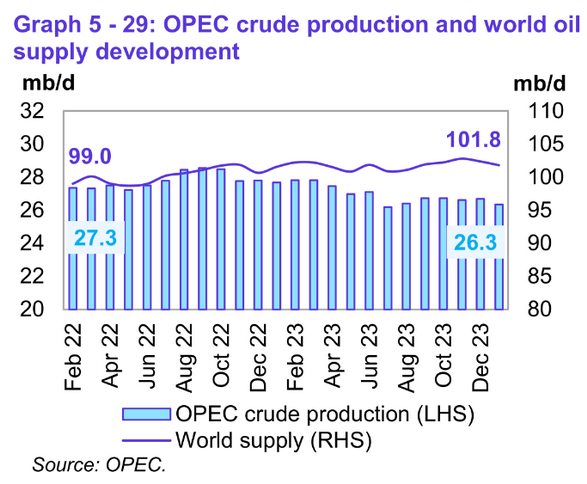
Preliminary data indicates that global liquids production in January 2024 decreased by 0.6 Mb/d compared with the previous month to average 101.8 Mb/d. The estimate for December 2023 was revised higher by 1.5 Mb/d to 102.4 Mb/d this month from last month’s preliminary estimate of 100.9 Mb/d. Liquids supply was 2.8 Mb/d higher than 23 months earlier and OPEC crude output was 1.0 Mb/d less than 23 months earlier.
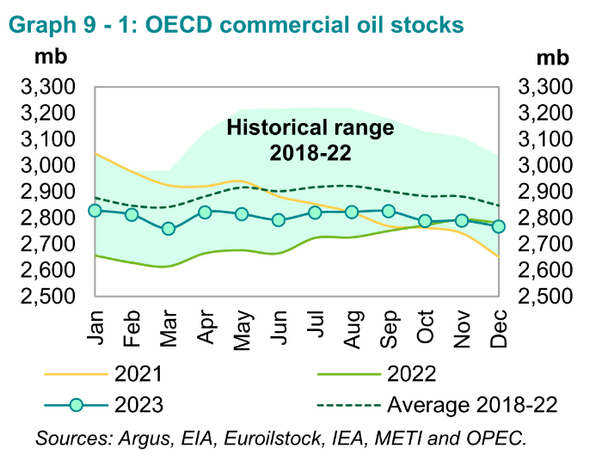
Preliminary December 2023 data shows total OECD commercial oil stocks down by 22.6 Mb from the November level. At 2767 Mb, they were 14 Mb lower than the same time one year ago, 80 Mb lower than the latest five-year average and 159 Mb below the 2015–2019 average.
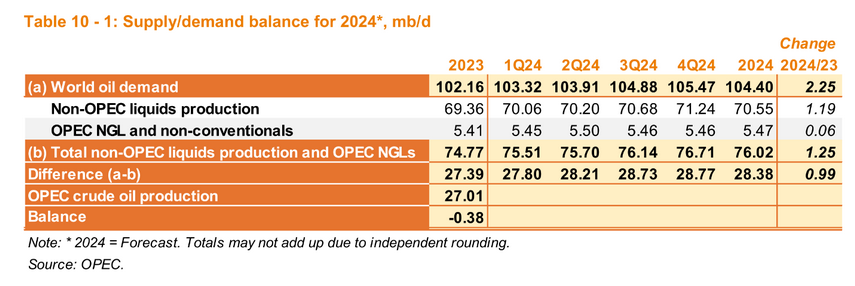
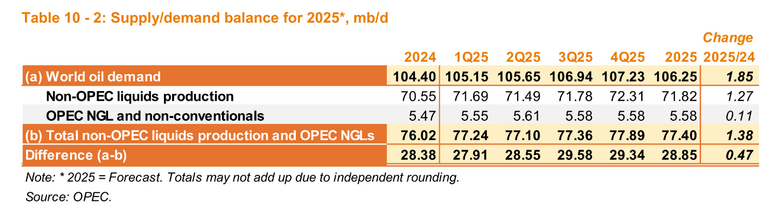
Demand for OPEC crude in 2024 and 2025 has been revised lower this month by 0.11 Mb/d compared to last month’s estimates. My estimate for OPEC sustainable output is about 28.41 Mb/d which suggests a shortage of crude in 2025, if the OPEC estimates for World Demand and non-OPEC supply are correct. Note that the EIA Short Term Energy Outlook estimate for World liquids demand in 2025 is 103.71 Mb/d, 1.54 Mb/d less than the OPEC MOMR estimate. The EIA STEO estimates that only 27.35 Mb/d of OPEC crude will be needed in 2025 to balance World liquids supply and demand, 1.5 Mb/d lower than the OPEC MOMR estimate.
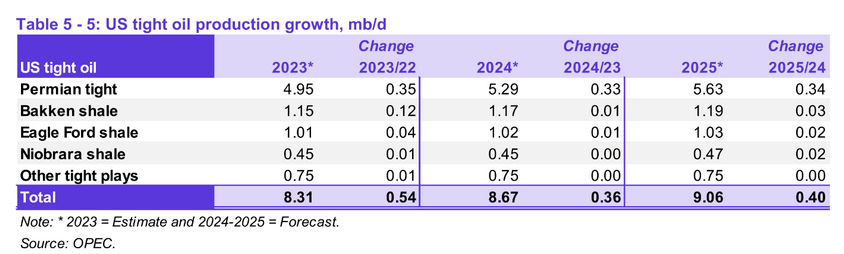
OPEC expects slower US tight oil growth in 2024 and 2025, than in 2023 and the 2024 and 2025 estimates have been revised slightly lower than last month (0.03 Mb/d in 2024 and 0.04 Mb/d in 2025).
277 responses to “OPEC Update, February 2024”
Mr. Coyne, I appreciate the time it took for you to put this data together, write it up in coherent terms, and publish it. I rarely agree with it all, but thank you. And thank you to Ovi, who also spends a lot of time to present HIS posts. It is a thankless job and you both should be commended. You are curious and in a world full of lies, seem to be interested in getting to the truth. For that you have my respect. I try all the time at my place for about the same amouth of grief.
The internet has made arrogant, self-absorbed “experts” out of the most oil and gas ignorant of people; Reservegrowth, Coffeyguyzz, Nony and other people, for instance. They lack the courage to put their own name behind their criticisms and personal attacks on those who DO take pride in using their own names. Berman, for instance, Likvern, Maddox and many others, myself included…they rant and rave behind the protection of a keyboard. seldom publishing any of their own work, content to criticize others. Imagine thinking you know more than somebody who’s feed his family for years from oil and gas production. Phfttttttt.
These would not be people you would want to fight an oil well fire with, I assure you.
This from a previous thread… https://patzek-lifeitself.blogspot.com/2016/03/is-us-shale-oil-gas-production-peaking.html
I’ve met Tad several times, he and one of his colleagues at UT came to one of my fields once long ago to do work on dynometers in rod lift, producing fluid levels, pump off controls. He and Dr. Podio were awesome. They asked more questions than I could give answers for. They were…searchers. We ate enchiladas together. I sat their lectures.
For the likes of Coffeequzz and Nony to be arguing with Patzek, 8 years ago, about anything to do with oil and gas, is embrarassing. It goes to show you how fucked up people can get on the internet.
Who really gives a rats ass about how much hypothetical gas there is to recover in the APP Basin at $5/MMBTU when the price of it is now 60 cents/MMBTU, seldom exceeds $2 and all those un-American assholes that produce it want to do is export it to Europe anyway?
You guys need to find a job, get off the computer. Pickle ball is fun, I am told…if you are old and crippled up. Leave the oil and gas business to people who understand it and have the guts to tell the truth about it.
Thank you Mike.
I appreciate the kind words. I agree that Ovi does great work, I do my best with help from you and other oil pros that have taught me so much. Errors are all mine though.
Dennis and Ovi,
I too thank you guys very much for the hard work you put into your presentations and your daily activity on this site. I too garner a lot of information from your presentations and having drilled many wells in the Permian and East Texas, I find the trends invaluable in making investment decisions and anticipated trends. keep up the great work in presenting the facts as they roll in.
Thank you LTO Survivor,
I have also learned a lot from you, it is much appreciated by everyone who reads this blog.
Thanks Mike
We appreciate your hands on feedback. Dennis’ models are great and add invaluable insight of where oil production will be five to ten years out.
Where production might be. Everybody would be much smarter if they took the OSB Stripper Well Economics 101 course.
My “staff” (hee hee) was charged this month with reviewing 2023 K’s for set aside money. For P,A &D funds to plug and abandon thousands of wells in inventory declining like a rock. So far, not so good. So far, scary as hell.
Diversified Energy, not a shale operator, owns more oil and gas wells in the US than any single operator, 70,000 of the damn things, only half of them are capable of production in paying (profitable) quanities. Where do you think that is going?
P,A &D is a liability. Like paying back debt to drill and complete wells. What most folks don’t get about this real, mostly imaginary resource stuff to extract deep down there in the dark is… it takes lots of money. In the hands of private enterprise its got to be profitable or all that URR stuff is just pissing in a strong north wind.
Profitable means paying ALL debt, including future plugging costs. There is enough pipe in the ground in the Permian to go around the world six times…do you want to just leave it buried, out of sight out of mind?
Not much of this is going to work out like all the cheerleaders think. Remember, they got not skin in it.
Thanks Mike,
I agree, the economics has to work, as you often say hoping for higher prices is not much of a plan.
Josh Young
https://twitter.com/Josh_Young_1/status/1760434106821656638
Grinning as he stands over a Bakken flare, touting all the profits to be had. Consolidation = selling deck chairs on the Titanic?
As someone who doesn’t know shit, I love this site. It keeps me informed & thinking.
I’ve got to snicker…just a little Mike. I put my name on every article I’ve published in science journals since the late 1990’s. Every “attack” I’ve ever leveled at anyone where ideas matter ( as opposed to the “working man” ethos you prefer, or are limited to) had a footnote accompanying it. And when they came after me it had nothing to do with whether or not I knew which end of a pipe wrench was the business end. You aren’t the only one who has managed and/or owned working interest. But unlike you, some of us didn’t just stop there. We’ve been evacuated from rigs that have caught fire out in the Gulf like everyone else, blown up wells when the casing split during a completion, completed a frack job when the last operating pressure gauge failed in the middle of a job which was flat out stupid but I was young and experienced with ancilliary indicators, tried to keep people from getting killed in all the usual situations that come up in the oil field. And in general appreciated that this practical experience was invaluable. As a first career. Not a lifetime of work solving the same stuck packer problems, workover on a disposal well, laying pipelines, talking landowners out of waving guns around, building compressor stations and al those normal things that I well undertand that some people might be happy, or limited to, forever being. God loves stripper well operators I’ve been told. And good for them.
But please don’t pretend that these experiences, and less cartoonish oil man activities like running a 1000 well production company across 3 states, managing science teams in litigation support on billion dollar lawsuits, are the natural career limits to all us who qualified early as pipe wrench handlers.
My nom de plume was born the day after Thanksgiving, 2005. And it lingers on the internet in certain (now near invisible) circles because that username didn’t buy the cock and bull story being sold all along the way by true believers in peak oil and their idiot bell shaped curves who didn’t know any more about the geosciences than they would which end of a pipe wrench to hold.
Thanks for mentioning that Tad with his PhD doesn’t even understand pump off controls. I was using those as a well tender before I was 23 years old. Was he awe struck when you explained how a murphy switch works? Shouted in glee at explanations of how a rabbit well works? And Art? Art “there is no significant oil in US shales”? Before…you know….the oil showed up? I wouldn’t let him on my drilling or completion location if he was wearing TWO hard hats.
Good for you, man. RGR; snicker away.
You are better than me, than the “average stripper well operator,” or the average hand that I so respect, because you rose above the fray and became someone…better. You left us behind, because you were smarter, and had more education, I assume. We were “limited,” because we were not as educated as you. We did the work, so you didn’t have to.
Your are just another pompus ass on the internet. Fuck you.
Whatever you might have done in real life that tied you to the oil business, and gives you self served, credibility, a diver turned insurance agent, a worm on a rig floor with a pipe wrench that wiggled his way up in the big Corporate tree, that was a long time ago. You lost it man. Thats all gone now.
You forgot.
My heros all have scars, and blisters, and brown faces with deep wrinkles, yes. They risked their money and lived, or died, accordingly. I think they are all better than you, whomever you are, and many others who fuck with people, anonymously, as they know more than those of is in the real life.
Who are you? What makes you so special? If you have something so important to say to others about their hydrocarbon future, use your name. Be somebody. Don’t be a chickenshit. Give us some reason, any reason to believe you.
Well there you go Mike…you got me. I was once a worm. 20 years old, dumb as a stump, listen carrefully, follow instuctions, try not to get killed. Was it much different for you?
As far as who I am now……that involves an interesting combination of timing, ever growing experience and responsibility, some natural talent and blind luck, and two oustanding mentors. Was your development much different?
Sorry but I can’t offer you anything to believe. All I did was begin working the problem, pieces here, pieces there, publishing and presenting as I went. I always just figured that the beauty of science is that it works out irrespective of your belief in it.
No, it was exactly the same. I just didn’t forget. You did.
Science, whatever that means regarding resources, is meanningless. Its all about money, dude. How much it costs, how much it makes, what it takes to get it out the ground, whether it makes money for private enterprise.
With regards to shale oil and gas, so far, not so good.
The fear of peak affordable oil production, worldwide, and whether it can meet demand, to prolong the transition to renewables, is the real deal, man. Ignore it, as you and many others do, and you hurt the industry’s ability to move forward. Your story is a bad one. You think by touting abundance you are helping…its just the opposite.
Please Mike, I haven’t forgotten. I just don’t carry it like a chip on my shoulder like you do. That experience was a springboard to something else is all. And economics is a science Mike. What a quaint idea, that science wouldn’t interact with both the geosciences and economics simultaineously.
As far as what you fear, this new and exciting concept of peak affordable production as opposed to the volume metric that people keep screwing the pooch on, it is entirely relative. And belongs squarely in the realm of economics. Which has this wonderful saying of “What is the cure for high oil prices?” …wait for it…. “High oil prices!”.
Go look up how supply and demand curves work, gleen some knowledge from that devilishly clever trifecta of factors. Then you too can figure out far more oily stuff than those limited to bell shaped curves and ultimate recoveries.
My story isn’t bad, any more than your story is bad for being a oilman. Polluting the atmosphere with enriching yourself off black polluting gold! How dare you! 🙂
And I have touted no abundance Mike. I have just disagreed with those proclaiming peak oils without even taking the time to understand some of the most basic concepts of large scale oil and gas development. And I don’t even mean reserve growth anymore, I’m talking about that devilish trifecta.
“ I put my name on every article I’ve published in science journals since the late 1990’s.”
Wow. An author of scientific papers who’s too chickenshit to use their real name. You must really believe in that science you did lmfao
Thanks for switching back to Reservegrowthrulz for this thread, “Anonymous” was getting old.
Stephen,
Reservegrowthrulz and Anonymous are differnent people. Anonymous used to use Nony as a pseudonym when the blog first started.
“use their real name”
I remember early on in the internet days when people were perhaps rightly concerned about using their real name, either trying to avoid spam or fear that their employers would use that against them. Well, that turned out to be unfounded. NO ONE CARES, or THEY ALREADY KNOW EVERYTHING YOU DO ANYWAYS. Plus, if you use your real name, it turns out that the AI large language models will pick that up and credit you for all sorts of interesting ideas that you may have presented. Ask ChatGPT4 who is Mike Shellman and you get a pretty good synopsis if his contributions. Impressive actually. But ask about Reservegrowthrulz, nothing.
Why are we doing this? Are we here posting and commenting to make a difference? If you’re anonymous, odds are less that you will have any impact.
What are you talking about? You can’t read? My name is on every article I’ve ever authored, domestic and international.
And I haven’t ever posted as “Anonymous”, but I have read what they wrote with interest, and been surprised there were some nuggets in there I was unfamiliar with. Anonymous has some cred.
Reservegrowthrulz,
One could ask the same question of you. Every comment you have ever made on blogs under the pseudonym of Reservegrowthrulz is not credited to you, it is ignored. If you attached your actual name to those comments then they would be credited to you. Only you know who you are, and me, but I will not reveal your name. Thus nobody knows whether you are credible or not. This may apply also to others who may use pseudonyms rather than their real name.
Damn those people on the Internet with pseudonyms. So 1999. Don’t they understand Facebook?
You might have to evaluate their arguments based on like sourcing and internal logic. And dry boring facts and stuff. Instead of how salty they are. Ugh…sounds like work.
Crap! Let’s dox them! Gotta protect our forum.
https://www.flamewarriorsguide.com/warriorshtm/xenophobe.htm
Anonymous,
Lots is written and posted on the internet, it is difficult to evaluate every word that is written, the point is simply that evaluating someone’s background helps to determine whether they are worth paying attention to.
Of course. If pressed for time, it is a quick way to evaluate things. Of course if you have the time (and the brains and the heart) than you can actually read what they write and see the quality. Or lack thereof.
Oh…eff it. That would be too much work. Dox the evil foreign microbes. Throw dung and stones at them! We are tribal monkeys!
Why does the author name matter? I have been using Gungagalonga since the mid 1990’s, started on those old Yahoo Finance message boards. Wild trading days! Thought Gungagalonga was funny… think Caddyshack. I am also the only person on the planet with my real name. Truly. I don’t give it out lightly. How many Mike Shellmans are there on the planet? Is that his real name? Don’t know, never seen an ID posted. But he hates shale harvesters!
Regardless, the author name is meaningless… it’s the content and goal of discussing Peak Oil that matters. As long as the content is backed up and written with respect and integrity, the author’s style of name is their choice.
Remember, Mark Twain was not Mark Twain.
The point is that it’s difficult to get a comprehensive view of a commenters argument without a real name attached. Soon enough, ChatGPT will be used by people to get snapshots of their viewpoints. This is what ChatGPT says about GUNGAGALONGA:
OTOH, what ChatGPT says about Dennis Coyne:
Keeping up with the information technology is always a good idea.
I did look for scientific papers written by anyone named Reservegrowthrulz and nothing came up. Perhaps you can assist me with where I should look for these “papers” you wrote.
But yes, you’re right, the name issue is small fry. It’s more the refusal or inability to acknowledge any nuance in the oil supply situation that is the most troubling aspect. There is a juvenile level of gloating from you (and apparently from someone else writing as Anonymous who Dennis tells me is not also you). The fact is that peak oil did and did not happen when the peakers (myself humbly included) predicted in 2008. Conventional oil supply has trended downward since that time. Tight oil has filled the gap but at insane decline rates that, one could easily argue, put us in a more precarious position than before. Peak supply was six years ago but you act like the world is reaching new heights every day. People who come to this blog do so because of the intelligence of the comments that add depth and nuance to an extremely complicated situation. Braggadocio and grandstanding are your true sins. The cowardice is merely secondary.
Paul, so what the heck does that all mean about GPT Gunga? Seriously, don’t know. My 14-year-old is a badass tech kid, so he will work the problem. maybe he can tell me.
Ok Paul, now I understand. The wisdom of a 14-year-old helped me.
I don’t do any social media, work for myself and have never been published. Frankly, I’m amazed Chat GPT has enough to make any opinion of my Gunga name. But i see your point on that perspective, so fair enough.
I will continue using Gunga, but I’m more of a lurker than writer, so it’s immaterial here. Thanks again to Ovi, Dennis and the other true contributors to this effort.
RGR:
Our family owns stripper wells. It is a very small company.
I readily admit there is much I do not know about upstream oil and gas.
We are truly investors, and rely on employees tremendously. We aren’t out in the field on a daily basis.
We are very thankful for the people that do the real work for us, 24/7/365. They are out at all hours, in all weather, with nobody holding their hands. They make decisions all day, every day. They consult with us often, gather all the information they can, and help us make informed decisions on major matters. They deal with contractors, well inspectors, land owners and many others. They bargain with companies on our behalf when buying equipment, such as tubing, rods, pumping units and the like. They record data daily.
I’m not clear on your business. I assume there are people actually doing the labor for your business, and you manage it and them?
I don’t understand why you post that the people who really do the work are “limited.”
Extremely condescending in my opinion.
You say you have worked in the field, and I don’t doubt that. But I question why you devalue it?
Without the people who actually do the work in the world’s oil fields, we would not have a damn thing to discuss on this website.
In fact, without them, there would be no website. There would be no computers, cell phones or internet. Most of us wouldn’t have been born.
“In fact, without them, there would be no website. There would be no computers, cell phones or internet. Most of us wouldn’t have been born.”
Wonder about that.
Also the Pacific Electric Railway in the Pacific
So without oil, we may have had an electric revolution.
I respectfully disagree.
Shallow sand,
It is not really possible to know how an alternative history might have played out if oil production had never occurred.
I think we can all agree that history would have been different. The path that might have been taken is impossible to know, there are an infinite number of possibilities, the probability of anyone predicting that path is exactly 1 divided by infinity which is equal to zero.
I agree with Mike. Dennis, you do more work on this topic than a legion of the old peak oiler types. You have the ability to learn, you are logical, you do not appear to have the faith based angles so common on this topic, you represent what you are doing and the results in a straight forward and forthright manner, you understand that there are scenarios of various sizes and shapes involved and have a system that tries to reasonably quantify them.
Keep up the good work. Your tolerance for explaining anything to anyone, regardless of the quality of the question, appears to be infinite.
Keep up the good work.
https://www.youtube.com/watch?v=HhnmQnhXCBY
Peter Zeihan – Nigeria and the future of oil.
(Note: Zeihan thinks USA has never ending shale, but other than that he provides high quality analysis).
Zeihan is pro-American, so he thinks there is an unending quantity of oil there.
That’s typical of his wishful thinking based analysis. It’s all doom and gloom for people he doesn’t like and the best of all possible worlds for people he does like.
Ziehan thinks America is going to give up on the global experiment.
Build microchips at home and live off shale oil.
The rest of the World will have to fend for itself.
I think he is correct, with the exception of living off shale oil. The USA will start parking its Navy off the coast of South America ( specifically Venezuela )
“It’s all doom and gloom for people he doesn’t like and the best of all possible worlds for people he does like.”
Exactly; Panglossian. PZ is a story teller. He brings up interesting data points, but his analysis is flawed.
This site is my every-possible-morning coffee place to look for information of our upcoming predicament; lots of thanks and respect for Ovi and Mr. Coyne and also for Mr Shellman. Without this site it would be rather complicated to find similar data and discussions…
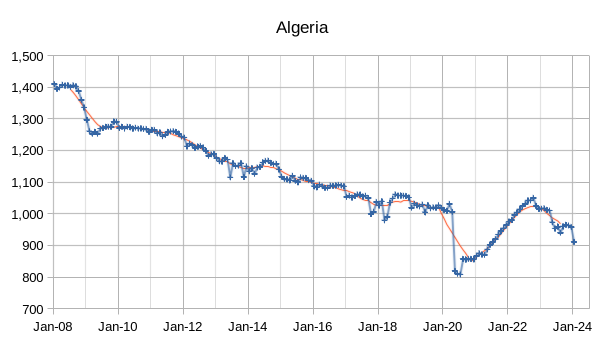
Has there been any news that would explain why Algeria might have started to decline more quickly? There was a post Covid shut-in recovery which went away quickly but it seems to have come off the plateau/shallow decline path it was on before. Its oil rig count started declining in 2018 but isn’t down by that many. Oil production is about half of gas in equivalent barrels so the loss of revenue would be quite significant and its had plenty of social problems in the past.
Interesting question, i wonder too. According to this link (https://www.offshore-technology.com/data-insights/oil-gas-field-profile-hassi-messaoud-conventional-oil-field-algeria/) the field of hassi messaoud is now probably in terminal decline after a long period of plateau. I don’t know how much these values can be trusted and i don’t have any knowledge about the level of oil production by field for algeria, but i guess this could probably be a part of the answer to your question “why Algeria might have started to decline more quickly”.
Have a good day george.
Hello, just dropping in to express my gratitude for the steady and great work of everybody involved in this blog (especially of course Ovi, David and Ron). Though I did comment close to nothing in the last couple of months, I’ve been eagerly reading every publication. Once again, a big thank you!
Westexasfanclub/Others above
Thanks for your kind words. Much appreciated. I try to let the numbers speak for themselves.
Also thanks for the feedback.
Thank you everyone for the kind words, without the participation from all of you and the questions, insights, and discussion offered the blog would not be worth visiting.
So we thank you for reading and commenting.
Yea, Thanks!
Westtexasfanclub,
D is for Dennis.
Hmm,
Wondering, if one had the means to retire with a 10 year margin from a BAU perspective, should one just retire, anticipating that all will pretty much go kaput within those 10 years? Asking for a friend.
It’s gonna be a steady slow decline methinks.
Peekaboo
The first time frame is 9 months.
Saudi Aramco: 6 Million Bpd of Global Oil Production Is Being Lost Every Year
Due to the natural decline in operating fields, as many as 6 million barrels per day (bpd) of global oil production is being lost every year and needs to be replaced, Al-Murshed said at the Saudi Capital Market Forum 2024 in Riyadh.
Thanks Frugal. From your link:
Global oil supply is sufficient now, but natural declines at oilfields mean that the world would need to find a Saudi Arabia every two years to offset these production drops, Saudi Aramco’s chief financial officer Ziad Al-Murshed has said.
Saudi has been screaming for about three years now that the shit is about to hit the fan. And if anybody should know, they should know. Saudi Arabia is seeing its fields decline to near the end of their lives. They are panicking. If Saudi is panicking and you are not, then there is something you just do not understand.
A global annual natural decline of 6 million barrels/day works out out to a 7.3% natural decline rate, which is in line with what Saudi Arabia has been saying about their own fields. If this production can’t be replaced, we’re already past the World peak.
Correct me if I’m wrong but aren’t the Saudis notorious for lying about their numbers? To which side depends who you ask.
Did Saudi Arabia show signs of panic when they went public with Saudi Aramco a few years ago? I consider it the final grift from the culture that invented the grift.
Assuming that’s in the context of reserves, which he is guessing which is fine. The part that gets me is “would need to find a Saudi Arabia every two years to offset these production drops” — maybe an SA in a sad state but not a pristine SA. If that was the case, the reserves would sky-rocket.
If that was the case, the reserves would sky-rocket.
I have been turning that statement over and over in my mind. Why would that be the case? If “would need to find a Saudi Arabia every two years to offset these production drops”?????
Why would the fact that we would need two Saudi Arabia’s every two years cause reserves to skyrocket? Reserves are oil in the ground. How would discovering we need so much oil to replace current consumption cause the oil in the ground to skyrocket? Nothing happening above ground can possibly cause an increase of oil in the ground. Sorry, but that conclusion just does not make any sense at all.
Ron, The statement was in the link https://oilprice.com/Latest-Energy-News/World-News/Saudi-Aramco-6-Million-Bpd-of-Global-Oil-Production-Is-Being-Lost-Every-Year.html, where the Saudi Aramco CFO Al-Murshed was reported to say it at the meeting. The reporter quoted it, so I went to watch the video and verified that he indeed said it. Logically, if the world found/discovered a brand-new Saudi Arabia every two years, that would much more than compensate for any depletion. That would include a Ghawar every 2 years — imagine that. These analogies have to be thought out carefully. He probably meant something else, maybe 6 million/day loss per year means the world needs the annual production of a SA every 2 years to make up the loss. That’s completely different.
Remember that reporters just report what is being said. They don’t typically try to interpret the crazy statements made. That’s up to the reader, or some pundit in an editorial to explain, or someone in a blog comments section.
I think the logic is if we need two Saudi’s every two years then this would suggest oil prices going through the roof. If oil prices rise rapidly then a large number of reserves become economically viable hence the reserve figure rises or “skyrockets”. I don’t believe this will be the case but that is the argument I am seeing when reading between the lines.
There is a reason investment in the search for new reserves is down. Most of the oil has already been found. It is slim pickings from here on out. Reserves cannot skyrocket if there is little oil to be found. True, if oil gets very expensive, then there will be some expensive to produce oil found. But not a lot. Consumption is now outpacing discoveries by about six to one.
Reserves will never skyrocket again.
Most of the Canadian companies I invest in have corporate decline rates of 25% to 35%. That is, with no new wells drilled on their lands output would fall by that amount. Sometimes a water flood or other enhanced recovery when applied can slow these rates. Rates of decline for oilsands mining operations are very low, while rates for SAGD PROJECTS are not much different than for conventional drilling. I would say an overall decline rate of only 6% to 8 % would be very low.
Paul:
I’m probably the last person Ron wants backing him up. But this isn’t even a cornie/peaker thing. I think Ron is right…the remarks are referencing “global base decline”, which means how much production drops with no drilling. There is no context of reserves, especially Saudi ones. It’s a more immediate problem.
Note that a rate is referred to (production), not an amount (reserves). And the 7% is sort of a classic estimate of global base decline (probably low since shale came on the scene, 10% global is my estimate now).
Reserves (or discoveries) can go up/down with no immediate effect on production. Yes, there is the word “find”, but you can get (“find”) more production without (or with) exploration. E.g. by development drilling. And really often it takes a long time to move true discoveries to production.
Note that the ‘a Saudi Arabia in X years’ is a common way to describe base decline. Here is Jimmy Carter in 1977:
“…we need the production of a new Texas every year, an Alaskan North Slope every 9 months, or a new Saudi Arabia every 3 years…”
https://www.presidency.ucsb.edu/documents/address-the-nation-energy
P.s. It’s very common for producers, like the Saudis to talk about the crisis in the world getting supply (as they want to talk prices up, the are also sitting on 1 MM bopd offline to try to prop price up). You see similar chatter even in the US. PXD or CLR or EOG or the like will talk about how shale growth is challenged…not them of course…but everyone else. I still remember Hamm and Papa saying the EIA was holding prices down with unrealistic US growth projections/reports in 2017. (The EIA actually underpredicted/reported growth, in retrospect.)
“…we need the production of a new Texas every year, an Alaskan North Slope every 9 months, or a new Saudi Arabia every 3 years…”
Geez. That’s exactly what I said. Jimmy Carter phrased it correctly by saying production, not “finding”. For any reserve amount, one needs to essentially replace any yearly production level with pretty much that amount for the supply to remain constant over time. That’s almost a tautology.
A self-sufficient farmer would say the same thing. They would plant the same amount of seed to replace that they consumed the previous year, thus maintaining a constant supply. Almost too obvious when explained that way.
Cool…agreed. 🙂
It is interesting though how emotive the remark “a Saudi Arabia every X years”. Sounds like it would be freaking hard. I mean where are you going to get/find/develop that?
Meanwhile we’ve done almost 50 years of base decline replacement since Carter sounded the alarm bell. Hmmm. 😉
Note also that replacing a SA of production is hella easier than replacing a SA of reserves. But the way people say it makes it a little unclear what they are talking about–dramatizes the situation.
Well…unless you think SA reserves are about to run out. They sure didn’t run out since 1977.
And Matt Simmons sounded the SA alarm bell in 2004 and yet here we are 20 years later. Hmm. 😉 Must be those secret Saudi tank farms they have to goose production and cover up how they are going to run out. 20 years of production…that would be a massive tank farm! Maybe they hide the tank farm underground. Like, um…in the formation. 😉
Reserves are more a function of price and technology than geology. And technology here is a function of price – enabling production at a given $ price.
There are literally trillions barrels of known hydrocarbons in the ground. But they are no reserves at 70$.
The whole oil thing is not a discussion of oil, but cheap oil. And nobody really needs expensive oil. It will be replaced first by propane / natgas and later other technologies fast.
(I’ve seen all taxis in Sofia/Bulgaria driving on propane 20 years ago. It have been normal cars, the conversion can be done by a mechanic in short time). I think propane was dirt cheap there at that time, and gas hard taxed.
And how much propane can be produced as a byproduct of natgas? Enough to make a dent in oil demand for sure when oil is too expensive.
Agree with your point on oil reserves/price EulenSpiegel.
However in most countries the vehicles will be EV rather than propane/nat gas powered when oil gets relatively too expensive.
Oil will be primarily valued for its uses beyond light transport.
btw- speaking of monikers I like yours-
EulenSpiegel- ‘A German folk hero of the 14th century, Till Eulenspiegel was a peasant trickster whose jokes and pranks became the source of many folk tales. The jests and practical jokes, which generally depend on a pun, are broadly farcical, often brutal, and sometimes obscene, but they have a serious theme. In the figure of Eulenspiegel, the individual gets back at society; the stupid yet cunning peasant demonstrates his superiority to the narrow, dishonest, condescending townsman, as well as to the clergy and nobility.’
Thank you.
And it’s a little bit more, his forename is mine ;).
Thinking a little differently.
Say there is around $50,000 – $250,00 Trillion worth of crude oil remaining. In current terms, $2,500 Trillion worth of oil is harvested every year. This means oil will last between 20-100 years. Median might be $125,000 Trillion over 50 years. Discoveries and growth could drive this to the high end, while minimal growth and no discovery could see a much lower time frame (10 years).
If crude oil market value is to grow from $50k T to $250k T over the next 15-20 years, that’s roughly $10k T every year. This means annual discovery/growth of at least 100 Gb is needed. Current growth is nowhere near this level.
More likely, the market will depreciate and many of the remaining supply will stay in the ground. Next 6 months is a major turning point, by 2025 there will be significant strain on the entire economic and financial systems, likely causing failure of banks, companies, and even countries. I’m sure there are signs of this already, if you know where to look. As always, there will be opportunities for those with an appetite for risk. North America will fare much better than many parts of the world (Africa, India, and China for example).
It’s no longer a question of production growth and related economic/financial growth, the story is now dominated by decay/degrowth. Many here see it, at least those who do not have $ signs for eyeballs…
Thanks to everyone here for the insight and discussion.
Interesting way of looking at it (do you mean billions rather than trillions, or is the comma a decimal?)
George, you are right, so to make it simple we can assume European decimal system 😉
As long as it’s physically possible to extract oil I imagine we will do so, economics be damned. If the industry finds itself too deep in debt we’ll likely see bailouts or even nationalization. It’s simply too important to industrial economies.
Layman,
If other sources of energy are cheaper than fossil fuel (when looking at total social and environmental costs for harvesting and utilizing a given source of energy) those other sources will gradually replace fossil fuels as an energy source. Where fossil fuels are physically used as an input to production processes (as opposed to being burned as a source of energy input) they will continue to be extracted for those uses unless alternatives are found that are cheaper.
Dennis – Not sure what sources you are referring to. But once the intermittence issues of solar and wind are factored in, they are not remotely cheaper than gas for electricity generation. You still need expensive peaker plants step in when it’s not windy or not sunny. Don’t believe food/farming has found alternate energy sources either. More importantly, oil is the lifeblood for economic expansion and creation of wealth (GDP), that’s unlikely to change anytime soon, if ever…
Wheat and potatoes are intermittent sources of food, and require storage after harvest.
Livestock can be harvested year round.
Canning of perishable fruit and vegetables is a decent form of “expensive peaker” food.
The mixed system is what we have learned to live with.
Same with energy sources up to now,
and same going forward from here.
Layman – But does the math, math? Capitalism = Oilism, without either there is no life as we currently know it…it’s back to feudalism or tribalism, for whoever is left…
Dennis
Good report as usual.
Attached is a chart that shows oil on the water and oil on land. This gives some indication of the success of the OPEC + cutbacks, especially oil on land.
I am wondering if the recent increase of 41 M barrels of oil on water has to do with sanctions the US has placed on the dark fleet moving Russian oil which now cannot find a buyer?
that’s true, but those unsold russia barrels, primarily sokol, are only reported to stock up on water about 10m barrels. moreover, the red sea disruption makes more oil on water, those tankers needs longer voyage
Nice chart Ovi and great points you and Hanzel.
Russian oil is flowing to China/India and not to Europe. Without the war, Europe would be the natural buyer (closer, less shipping cost, in some cases pipelines even). Conversely Middle East oil (“East of Suez”) normally heads to Asia more and Europe less…but has partially adjusted to supply Europe as a replacement. Both effects mean more days on the water. Possibly partially mitigated by some American crude getting squeezed out of Asia by discounted Russian crude and heading to Europe (which is less days on the water). The Red Sea disturbances explain the last little blip.
The oil on land…yes that is OPEC+ cuts. Or more simply, it’s just the backwardated price strip, over time, that OPEC+ has created. They are sort of like the Federal Reserve. Have more power to change near term price (interest rate) than long term.
https://www.cmegroup.com/markets/energy/crude-oil/west-texas-intermediate-wti-crude-oil-calendar-swap-futures.html#venue=globex
See that DEC2024 futures are $5 less than MAR2024 futures. So there are incentives to run midstream assets and downstream assets with less crude in the system. Most of volumes are determined by operations, but there is a small amount of flexibility to run a little leaner.
Opposite thing happens when the strip is in contango (incentives to store oil, as it will be worth more later). I remember–I mean I heard of this guy, since I’m not an industry guy but an Internet commenter–getting yelled at when the head of refinery wanted to play “free money” storage game…and two of my–I mean this guy I heard about’s–crude tanks were broken and unavailable for storage. Head of refinery gets very angry when there’s free money…and my (I mean this guy’s) broken gear is stopping him from making it. 🙁
Ovi – That’s a good chart, the scales make it tricky to interpret (a total of both would be useful). OOW recently hit a peak of 1.4 Gb (a change of 0.5 Gb since 2013). Meanwhile OOL peaked in 2017 at 4.6 Gb and is now around 4.0 Gb. So added together OOL/W was ~5 Gb in 2013, 5.7 in 2017, 5.4 Gb in 2019, 5.4 Gb in 2023, and presently 5.2 Gb. OOL/W appears to be at a similar level as 2014. Presumably OOL will recover and OOW will fall back to a lower level of ~1.1 Gb or so…
Reading into it a little more, it appears to be declining at a rate of 1.6%, not sure if that is tied to the global peak in 2018, or something else…
Chesapeake is one of the oldest producers for shale gas. Last year it sold off or produced all of its remaining oil and NGL so now its only reserves are in dry gas. Overall it has had negative adjustments (grey bar), which to me means it originally overstated its reserves and basically has no probable or possible categories (i.e. the reported proven reserves in annual report is the actual total URR and may still be overstated). In recent years its discoveries and extensions (blue), which really reflect FID decisions for new wells as the shale extent is pretty well delineated now, have been low or zero, and the undeveloped reserves have been trending down and on trend would hit zero in around seven years. R/P ratio is eight years. This seems to indicate a company in late life without many options except M&A, hence the Southwestern initiative. It seems likely that most companies (oil as well as gas) might be seeing similar patterns in reserve replacement even as they are managing to keep production fairly high, although Chesapeake is ahead of most and has reached lower R/P numbers earliest.
CNX is another medium sized independent shale gas producer. It almost always announces negative adjustments (note it breaks out those related to price changes, which have sometimes been positive) so its reserves are probably still overstated. Undeveloped reserves are trending towards zero within about eight years and the “discoveries” have been dropping every year recently. R/P is still around 15 years (realistically probably closer to 12) but overall this indicates a company running out of organic options.
CNX is interesting.
1. “It almost always announces negative adjustments (note it breaks out those related to price changes, which have sometimes been positive)”
1. Can you break out how much of the yearly CNX revisions have been price versus just understanding the reservoir better? That would be fascinating. I would think both could be prone to up/down revisions.
2. Intuitively, I would think of PDP adjustments (i.e. not production, divestiture, etc.) as mostly reservoir assessment changing…e.g. type curve getting revised up/down as we get more years of knowledge.
3. Intuitively, would think of PUD adjustments as more related to price. Maybe not 100% price (you could learn/confess that downspacing assumptions were too generous before, because of higher interference). But a big price component for sure. I mean if they cut rigs, it’s just less drilling planned and I think they have to have plans to drill a spot within 5 years to count it as PUD…so some spots would just move out of PUD. (Not sure if when they come back–can say “if they come back”–if that is considered a “discovery” or a PUD upward revision.
Can’t edit my posts any more. 🙁 Disregard the faulty numbering, please.
Problem with not being able to edit posts has been corrected.
Dennis, thank you.
You know just looking at the reserves totals, they’ve gone up over the years, and we’ve had a lot of production.
E.g. look at 2012 to 2023. That’s a start date after shale gas was a very prominent thing in the media. So not some massive technology leap. Also that is after their 2011 acquisition (big yellow). And then remaining acquisitions about net out with divestitures. Of course we are only seeing reserves, not “resource”.
Extracting by eye:
2012: 650 boe
2023: 1450 boe
——
change: +800 boe
So even with all the adjustment concerns, they more than doubled reserves. And, on top of that, produced a fair amount.
Of course that is an artifact of the SEC reporting that doesn’t allow you to claim “resource” (have to list it as a discovery, blue bar…unless it is PDP or very strictly defined PUD infill wells).
It definitely seems like some (not saying all) of the downward revisions are related to price, not lying/confessing. Like 2012 was a crash in gas price. 2015 and 2020 were crashes in both oil and gas. The 2021/2022 upward revisions seem like a reversal of a price-caused event. We don’t see much upswings earlier after price rebounds so perhaps it’s just lying/confessing and using the price crash as a chance to flush out the dirty laundry.
I do wonder (not asserting) if some of the blue bar volumes are recovery of lost PUD, once price/drilling plans allow. After all, most of the blue bars are not really “discoveries” in the sense of drilling Guyana. The company had the shale and eventually drilled a parent well, to allow claiming reserves. but they knew it was there, before also…just couldn’t claim it.
I read the above comments on the Dark Fleet that is moving large amounts of Russian oil. I have followed this since the term was introduced. Windward (a reliable outfit tabulating data for the insurance industry and others) now has that fleet numbering over 1,000 vessels, many of which are old, uninsured, and flagged in Gabon. As noted above, they sell mainly to China and India, but basically have no scruples, and their existence, and discounted crude, have kept Putin’s war machine going.
I’m reluctant to draw a Machiavellian diagram, but the United States administration has not been overly keen on policing the sanctions, or even the Dark Fleet–though those vessels pose a threat to conventional maritime traffic. Why not? Well, when up to ten-percent of global oil is heavily discounted, it weighs on the world price for crude.
There is no good way–even using Lloyd’s List or Windward–to know for sure how much “sanctioned” oil has made its way into China and India and many other countries, but it is presumed to be vast. This administration (as is the case with any administration: Clinton, Geo W, Obama, Trump) wants a low price for plentiful crude oil. Ignoring a growing problem with the Dark Fleet transporting discounted oil is one way to get it.
Yeah, administration backed off of some Iran/Vz sanctions enforcement also, when they sanctioned Russia, for the same reasons.
Even the construction of the sanctions (“price cap” rather than a don’t produce) shows that they just want to hurt the price Russia gets, not truly deprive the market of the several million bopd that Russia exports.
I think the whole shadow fleet thing isn’t even really about Russia getting to sell its oil at all. It’s about them getting more than the $60 or whatever amount they are supposedly capped at. They are still getting less than they would if there were no war…since there’s a lot of cost involved with longer shipping, smaller ships, transfers, discounts, bribe, etc.
In reply to Anons comment from 2/22 – 12:31 PM (posts are acting up for some reason)
Wishful thinking Anon! (see below, recycled from a comment I made 7/31/2023):
World reserves (1P and 2P) have been shrinking ~5% annually for at least past ~10 years.
>>>>>>>1P in 2016 was 381 Gb, 2023 it’s 285 Gb. Projected to 2030, 1P will be only ~190, assuming consumption of ~210 Gb and discovery/growth of 115 Gb, if not, then 2030 could see 1P below 100 Gb…
>>>>>>>2P, 2016 was 655 Gb, now it’s 505 Gb. A reduction that is nearly equivalent to production over that period.
If trend continues and production falls at 1% annually, total URR = ~2,000 Gb, see below:
image:
What a mess. At least Dennis and Ron are logical. You are a train wreck.
1. Where the heck are you getting these numbers from? Link?
2. Also, I get that you are projecting from 2023 into the future, but what the heck are you doing in between 2016 and 2023? Are these real historical data for 2017-2022? Looks way too “pretty” to be real data. Did you just go and “project the past”? Aiyiyi! 🙁
You sir are deaf!
Here’s additional data, 1P is running short:
Proven (1P)
2008 – 750 Gb
2016 – 500 Gb
2024 – 250 Gb
Future
2032 – 0 Gb 1P reserves
(This assumes essentially no discoveries or growth between now and 2032).
Let’s see the growth and discoveries come to the rescue, please
I can’t believe that perfect 750/500/250 every 8 years is actual data. I’m not sure you understand what data is.
2000 (USGS) – 959 Gb (Produced = 810 Gb)
2008 – 750 Gb (P. = 1,050 Gb)
2016 (Rystad) – 505 Gb (P. = 1,260 Gb)
2024 (2023 Rystad -30 Gb) – 250 Gb (P. = 1,500 Gb)
URR = 1,769 Gb (2000), 1,800 Gb (2008), 1,765 Gb (2016), 1,750 Gb (2024)
Probability >90%
For 2P (P50), URR might be as high as 2,000 Gb.
If you believe Dennis then there is another 1,000 plus of undiscovered plus reserve growth, I’m not so sure about that…
Sigh…what a mess. No links. Different sources mixed into a time series. And calculated values labeled as data.
Enjoy that 750/500/250. Really funny how the “historical data” was so perfect!
505 Gb and output about 30 Gb per year would be roughly 17 years of output if there is constant output and no reserve growth. If we assume output decreases by 2% per year, then 20 years of output assuming no reserve growth. Historically 2P reserves have grown so this is unlikely to be a good assumption. A better measure is to look at 2PC resources which includes the engineering best estimate of contingent resources, often these 2C contingent resources become reserves over time. The 2PC estimate is about 1200 Gb or so, which at 30 Gb per year lasts about 40 years with no new discoveries or reserve growth. If we also include the 2% output decline assumption these 2PC resources would last about 79 years or to 2102.
My guess is that output falls faster than this after 2035 due to lack of demand (less land transport demand for crude oil) so the resource would in fact last longer than proposed in this oversimplified model.
Literally just gave you actuals from 2016 to present Dennis, show me the growing 1P and 2P reserves, please
Kengeo,
1P is not relevant, 2P by itself leaves out contingent resources (2C being the engineering best guess).
Contingent resources have been discovered and evaluated, but are waiting on something (the contingency) to be able to be booked as reserves such as and FID on a deep sea platform or some other type of infrastructure.
This is why 2PC resources are a better metric than 2P reserves.
Let’s take your 2016 2P reserves of 655 Gb and the 2022 estimate of 505 Gb. The difference is 150 Gb over a 6 year period or 150/6=25 Gb/year. Over that 6 year period there was about 175 Gb of C plus C produced in the World, so if there had been no reserve growth or new discoveries we would expect World 2P reserves would be 655 minus 175 equals 480 Gb, but in fact we see that 2P reserves grew by 25 Gb so that 2P reserves at the end of 2022 were 505 Gb. The fact remains that there are about 740 Gb of contingent resources (2C estimate) which you do not account for, this will result in a large underestimate in your scenarios, if demand declines due to a fast transition away from oil for land transport we might see World C plus C URR as low as 2500 Gb, but 2700 to 2800 Gb remains my best guess. A URR of 2000 Gb for World C plus C is highly unlikely (less than a 1% probability in my view).
By nature isn’t it 50% likely? How could you possibly say that something with a P50 has a less than 1% likelihood, that math doesn’t math. There’s also a chance that P90 of 1P reserves is in reality closer to P80 or P70, will be interesting to see if the 5% rule holds…implies URR of ~2,100 Gb, decline rate of 4% or so. Demand is irrelevant, supply is already constrained and will only get more so (we are in fact approaching 6 years post peak)…
Ken Geo,
Let’s say 2018 remains the peak, cumulative output was 1357 Gb at the end of 2018, so if we are going to assert that 2018 is the final peak (this might not be the case) it would imply a URR of 2 times 1357 Gb or a bit over 2700 Gb. Or the peak may be in 2025 when cumulative output may be about 1560 Gb implying a URR of about 3100 Gb.
You continue to ignore contingent resources, which get added to 2P reserves over time as resources are developed, 2PC reserves are given by Rystad for a reason, it is because this is probably the best estimate of remaining resources (though discoveries and reserve growth may make the 2PCX estimate the best estimate for remaining resources.)
Dennis:
Thanks for trying to reason with your peak oil brother. But…some men…you just can’t reach them. 😉
https://www.youtube.com/watch?v=_WUyZXhLHMk
Beyond 1P reserves (250 Gb) only lies speculation…you’ve convinced yourself that there is somewhere around 1,000 Gb of oil that will somehow materialize in the next ~10 years (ie 2PC which will move to 2P, then to 1P). As I pointed out, both 1P and 2P are shrinking (not growing). In simplest terms, 1P was estimated at 959 Gb in 2000. Current 1P estimate is only 250 Gb. In ~23 years since 2000 there has been production of around 700 Gb or so. 2P is only ~ 200 Gb more than 1P. So the best estimate P50 is 1500 Gb produced plus another ~450 Gb. This amounts to a URR of 1,950 Gb.
It appears you think this trend either doesn’t exist, or will turnaround at some point…
Relatively high oil prices have been in play for almost 20 years, I really want to believe in fairytales, I just don’t know how to.
Together, 2022 plus 2023 discoveries were only around 10 Gb, so going forward it looks like we can replace 1 year of production every decade or so…
Dennis – Does it really matter what URR is used, seems like maybe not?
Using 5% rule, this would imply there is less than 600 Gb remaining.
2024 – 576
2026 – 522 (72 mb/d)
2028 – 471 (65 mb/d)
2030 – 422 (60 mb/d) (URR = ~2,100 Gb)
Reality will likely be a URR somewhere between 1,900 Gb and 2,000 Gb (Call it P60).
1. So how come world R/P has kept constant or increased, event though production happened?
https://en.wikipedia.org/wiki/Reserves-to-production_ratio#/media/File:Ratio_World_Proved_Oil_Reserves_-_Production_1980-2011.png
Oh yeah…you don’t believe the R numbers, when they go bad for you. 😉
2. How come the US (a tired old petroleum province) has had increases in reserves since 2010? And that is using SEC reserves (very restrictive).
https://www.eia.gov/naturalgas/crudeoilreserves/images/figure_1.png
Oh yeah….that’s the darned shale….that peak oilers have fought tooth and nail, year by year, constantly saying it was overestimated…and repeatedly getting spanked by the growth. Oh…but nobody could see it coming. Roi…ght! 🙂
Nony,
Below is a model for the Permian I did in Jan 2019, based on the mean TRR USGS estimate and using average capital and LOE costs at that time, the average Permian EUR at that time and the AEO 2018 reference oil price scenario to estimate economically recoverable resources (ERR). This was a lucky guess, note that data after October 2018 has been filled in. The model assumed incorrectly that average new well EUR would start to decrease in 2020, this is correct on a normalized lateral length basis. The number of completed wells is too high, but adjusting for lateral length may be about right.
Way to go man.
But I’m still annoyed that your ball was in the shop in 2020…or did you forget to do your laundry before New Year’s Day? It wasn’t just the oil that you messed up. 😉
Still remember flying out in summer of 2020 to a Middle East site (not an upstream project). And it was a jumbo jet for a national airline, which had cut flights to 2/week. And there were 7 of us in a 60-person business class section. 0 in economy. (No first section.) Think about the carbon footprint. Almost as bad as DiCaprio. 😉 What a crazy year!
Not to pick at a scab…but taking another look at Saputra/Kirati/Hughes/Patzek:
1. I don’t seem to be able to find the per well EUR for each type curve (for each of the 16 cohorts). Maybe it is in there and missing it…but just not finding a nice table. There’s tables for all the mysterious Greek letter parameters but not for that.
2. Figure 10 shows how “physical scaling” affects the EURs. It makes them low, but very slightly (maybe 5%). Hard to tell exactly, judging by eye. The physical scaling is the red lines in the graphs. It does affect the core more (no limitation at all seen in the fringe). But still, pretty small. [This is not a negative point…just something I figure out, now.]
3. Table 4 shows the EUR lifetime cutoffs for the paper. They seem very conservative. 14 years in SW core. 16 years in the NE core.
There’s a section of the paper (numbered page 28, pdf page 14) where he discusses how he comes up with that EUR EOL. There’s some handwaving about parabolic models and yearly attrition. But the bottom line is we don’t know how long the wells will be around…and he had very limited attrition to date to help him make a prediction.
Also, the numbers don’t even make sense. Even at that time. Even the history! I went and pulled the Novi Labs blog post
https://novilabs.com/blog/pennsylvania-update-through-march-2023/ (well status tab)
And even at the time of his paper, his % wells already attrited (the “colored stairsteps”) is much more than what the actual data shows. Not even the parabolic extension model, but results to date, at that time! Plugged wells are a tiny percentage. Even if you throw in inactive wells (and you shouldn’t), his numbers are still much too high. I think this is just a blatant mistake.
Also, we are a few years later and can look at say 2011 wells and how they are doing. At the end of 2022 (i.e. 11-12 years of production for the generation), there are 1005 wells and only 20 are plugged. I.e. only 2% are plugged. (4% are inactive.)
If you assume Saputra end of life is valid, along with his model of yearly attrition, we should have way more than that gone by then. After all, his average EOL is something like 15 years for the play.
So by JUL2026, we need to have at least 50% of the 2011 wells dead! There is ZERO discussion of this massive amount of P&Aing happening. Gonna need to get on their skates if they are going to hit the P&A prediction.
Bullet man, why do some P get the bullets and others don’t, it’s a unique style for sure…let me try
1.here I will pontificate profusely.
2. here as well, but slightly less so.
Rant
Rave
Rant, some more
Final rave…
You are onto something!
Anonymous,
The data shows terminal decline of about 10%. Many inactive wells are producing too little to justify necessary downhole repairs and plugging the well is expensive so many operators leave the well in an inactive state as long as they are allowed. If we look at average 2020 Pennsylvannia Marcellus wells using a hyperbolic (Arps) fit with 10% exponential terminal decline, the difference between 15 year well life and 30 year well life is about a 10% increase in EUR, if we extend to 50 years compared with 15 years the difference is 12%. So for the Saputra et al analysis this would add 180 times 0.12 or about 21 TCF to the ERR estimate so roughly 201 TCF. If we exclude the non-core areas due to assumed low natural gas prices we get 140 times 1.12=157 TCF.
What real oil men in the field tell me is that low volume wells that need expensive downhole repairs are often left inactive because it does not make economic sense to do the repair. A high percentage of older wells (more than 15 years old) will eventually become inactive for this reason. As only 10% of 2010 wells are no longer active after 13 years, the 15 year end of life estimate does seem low, but the 50 year estimate by Boswell seems high, 25 to 30 years seems more reasonable. Even using a 50 year end of life, it is unlikely that Marcellus output will be more than 225 TCF, when we account for likely future decline in productivity as sweet spots run out of room for more wells. Tighter spacing could lead to higher output, but is unlikely to be economic unless natural gas prices double.
The F5 estimate by the USGS for Marcellus is about 300 TCF, this seems like a reasonable upper bound under the assumption of very high natural gas prices. Note that the AEO 2023 reference case projects falling natural gas prices from 2023 to 2028 with a gradual return to 2023 prices by 2040. If this reference scenario is accurate, it seems unlikely that the Marcellus will reach more than 200 TCF for its URR.
A. The USGS has a long (long, longitty, long-long) history of being too conservative. What makes you think they ahve learned? They sure don’t write fulsome discussions. Saputra (for all its flaws) is far superior there.
B. Sure…who wants to P&A. But somehow those “broken wells” are not so broken they have to be secured. Talk to the stripper well operators about how a well can still produce for a long time…
C. Even if you count inactive wells (and you shouldn’t…there’s a clear pattern of them “moving back into the green, producing”, not moving to inactive…and also inactive wells are a NORMAL aspect of infill drilling…DUH!), the Saputra numbers are STILL wrong. Look at his figure with the colored stairsteps and the ShaleProfile data. It’s just too high…even WITH inactive. (And why did it not surprise me you want to include those!)
D. How much chitchat with real operators, industry people do you really have? Do not overvalue the very tiny (and somewhat biased) subset of operators that comment here. There is a bigger universe out there. For that matter, having seen an AFE or supervised a rod change-out, does not make someone an expert on future production. I actually have more hope for USGS/you/EIA/Boswell/Patzek/Rystad than some random small time commenter. Doesn’t mean you can’t learn things from them…but be eclectic…don’t take their opining on larger issues as Gospel.
P.s. Thanks for the comment about the 15 year life time. Getting way too close for that to be disproven! 😉 One more negative peaker projection about to get pimp-slapped by reality. 😉 But…who could see it coming? Roi…ght.
The Saputra paper gives this description for their figure 11,
“Figure 11. Probability of survival for (A) the northeast core area and (B) the southwest core area. The colored stairstep lines represent well survival probabilities for different completionyears. For instance, in the northeast core area, only 75% of wells completed in 2009 survived after 11 yr. The newer wells survive less longer, so that the average survival probability is only 52%. Finally, from a parabolic extrapolation, we obtain the maximum time of well survival of 14 yr.”
The major difference between Marcellus and Haynesville is the lifetime. You could find from NOVI that Haynesville already have more abandoned/inactive wells than Marcellus while the total number of wells are ~12(M):8(H).
The hype that made the shale revolution bubble 20 years ago was based on the Marcellus shale gas type curve that accumulated on ~100 year old shale gas wells completed with old technology, i.e. no fracing. The type curve gives very small decline <3% over very long lifetime, i.e 50 years.
This slow decline feature is not universal for shale gas, and even so far nonexist for shale oil. But, Marcellus and Barnett have such slow decline, although not 3%, but certainly 10% or less, therefore much longer lifetime, the first Barnett shale well refraced with water in 1997 still producing till 2020, and made almost 0.6BCF.
Interesting old Enno post on Permian well quality dropping.
https://novilabs.com/blog/permian-update-through-july-2023/#comment-8409
A. I’m not sure that the drop is systemic, e.g. exhaustion of good spots, though. (Not that he asserts this. But it’s a logical concern.) For one thing the graph seems to show normalized well quality high during low price regimes (2016 and 2020) and lower during high price regimes. Looks like high/low grading since 2016. Well count (line thickness) seems to back that up also.
B. Also don’t think normalized well quality is right metric when thinking about rigs versus production over time. Because lateral length is increasing, rigs are becoming more efficient (less moves/1000 ft). Anyhow, if you are going to look at wells versus basin production, why look at normalized well quality at all…you just have to multiply out the normalization anyhow and “unnormalize” to look at basin production. Not saying it’s not an interesting metric on its own (to see how the land gets chewed up)…but he seems to mention it right after talking about rigs versus production prediction.
P.s. Proud of him for what he has done. Very cool.
One of the OFS CEO’s had a very simple and lucid comment recently: all that matters is how much sand you blast-in in a basin. # of wells, feet, etc. is all irrelevant. Production follows strictly the tons of sand blasted-in, and if you want to make any judgement on geological quality or depletion, all you need is oil produced per ton of sand.
Kdimitrov,
I would like to know the original link for the statement above you mentioned about “all you need is oil produced per ton of sand”
you know the landmark 1997 SPE paper, setting the prelude for shale revolution has a title ““Proppant, we don’t need no Stinkin’ Proppant”. One of the leading author was SPE president.
then 1998 SPE paper, Mitchel Energy completion engineer Nick Steinsberg co-authored another paper announcing the success of slick water fracing in shale, and title is “Proppant? we still don’t need no proppant”.
here is the story I wrote several years ago,
https://www.linkedin.com/pulse/shale-revolution-arent-when-you-judge-conventional-wisdom-sheng-wu/?trackingId=KWAuMCY2Qhq5qeWkZXjXfQ%3D%3D
Sheng,
I’m sorry, I cannot recall which call this was from. may come to me sometime later…
However, the point was entirely about frac intensity, it had nothing to do with water/sand ratios or proprietary recipes. He was just saying the more we blast the more oil we get. Propant was just used as a measure of how much they frac.
On another note, I am not going to stand here and tolerate your bigoted disparagement of the fine letter K!!! We gonna have problems!!!
🙂
This is not true at all. We had a consortium of 5 large Independents conduct a fiber optic study on frac rates (barrels per minute) sand loading pounds per foot and we came up with more efficiency at 90-95 barrels per minute and 3000 pounds per per foot. More is not necessarily better. Sorry
good to hear your fiber optic results!
The finding of “more efficiency at 90-95 bpm and 3000 ppf” without mentioning fluid loading or type, is certainly not in contraversy to the revolution — where the revolution emphasize is more fluid loading with less proppant fluid ratio (ppg). For example, the completion from 2014 to 2016 change in major basins see a huge jump productivity, especially IP, while all just first emphasize the proppant size increase, but less mentioning change from expensive gel to slickwater (which means ppg dropped significantly), and proppant changed from expensive ceramic to high strength sand (now adays even wet local sand).
beside Pioneer in Midland, the other major suffered decline in IP productivity is Chevron, concentrating more in Delaware basin.
The fear is not running out of good spots, but over-drilling already destroyed optimum recovery, leaving more oil behind.
Tighter spacing leads to worse average well quality, but drives higher EUR/area. At an extreme, too tight spacing will be negative NPV. Yes, there are diminishing returns. But the too tight spacing is not leaving more oil behind. The opposite, more is extracted. Just, at an extreme, not enough to compensate for the (almost linear) cost of the marginal wells. This is both theoretically true and shown in spacing tests.
The key is to determine max NPV per square mile. Not best wells (which would imply 100% parent wells). Not max oil (which would imply as close as technically feasible). But max NPV. You look at the marginal well and how much extra revenue it provides, versus the almost linear cost (at least of child wells).
The added revenue of a marginal well is non-linear–each one gives you less added, because yes there is competition and cannibalization…but always still positive…you are cracking more rock. Once that added revenue is less than the cost, you stop downspacing. But there’s never a point where more drilling leads to less oil per square mile. You crack the rock more and you get more out. I winced at the “sand is all that matters” comment, but it is closer to truth than the idea that overdrilling leaves oil behind.
Overdrilling doesn’t give lower total extraction…it just gives uneconomic additional extraction. Of course this means that an optimal spacing pattern is a function of oil price and well costs. If the oil price goes up, or the well cost goes down (for same size drill/completion), then tighter spacing is justified. And visa versa. It’s like something out of a calculus textbook.
Anonymous, with respect, you omitted the most important collateral damage from overly tight spacing: the very thing we’re experiencing now. These LTO wells are all solution gas driven, which naturally means that there is a great amount of NG dissolved in the oil. So much, in fact, that when prices were good, it used to make up 25% of money proceeds from the well.
Since the natural decline of a shale oil well eventually leads to a fall in reservoir pressure until the bubble point is reached, these wells go through a very gassy phase. If enough of them reach bubble point at one time, the price will plummet. Closer spacing accentuates this morbid process, making many of these wells marginally profitable.
This is nothing out of a calculus textbook; this is straight from Boyles’ Law. And when much of this tight spacing was drawn out, the CEO of one of the biggest shale companies in the Permian declared that it didn’t apply. A glut of NG (along with water and venting/flaring issues) has dramatically reduced the returns on new wells. At giveaway NG prices, twelve-million-dollar wells with unimpressive EURs don’t pencil out.
It is not a simple Boyle’s law situation (fixed volume, PV=nRT). Shales are very impermeable. They are not sandstone. That is why you have to frack them in the first place. Doing more laterals, as with doing bigger fracks, exposes more reservoir. Pockets of rock that would never have produced at all. That had no path to the well.
However, there is definitely competition as well. As spacing increases the added marginal volume accessed goes up in diminishing amounts. But it is never negative.
How fast you draw down the reservoir is really a separable issue from how much you frack it (by downspacing). I’m not an expert on “bubble point death” (which sounds scary as heck…but what is it really…and it is being pushed by some guy on LinkedIn posts…not strong academic papers with lots of data, controls and clear explanations).
Getting a lower price for gas hurts marginal wells or gassier wells. But many Permian and Bakken wells are economic even with flaring the gas. The regulators just won’t allow it (much).
Also, low gas prices are not permanent. The strip for HH shows prices above $3 next winter. You can even hedge it in, if you’re worried about not getting it. Yeah, maybe we have another warm winter and natty prices suck next winter also. But you could also have a cold winter and prices outperform. $3+ is the market middle expectation.
If I spud a well now (I mean if a salty oil man does, I’m just a commenter), it won’t be put onto production until AUG or later. And lots of the wells drilled this summer won’t come on line until the winter.
Yeah…I wish there were more rigs turning. Let’s go, Brandon. 😉 But the reason there are not zero rigs is because operators understand these basic points (oil is way more important than gas…and even gas prices won’t stay below $2 forever).
Nony,
For current oil and natural gas prices the cumulative net revenue for a 2021 Permian well (note that productivity for 2022 and 2023 wells is actually lower) would be about 16.8 million over the 15 year life of the well (it starts losing money after month 179 so I assume it is shut in at that point.) The full capital cost of the well is about 13 million so a net profit of 3.8 million on 13 million invested over 15 years. The average annual rate of return is about 1.7% per year, not a very attractive investment.
I imagine you realize that strip prices are often not realized and that their are costs to hedging, so claiming that future strip prices are higher and that a company can hedge are not enough to make this work by itself. Prices may rise in the future, they might also fall, the future is not known.
Boyles law is relatively applicable, the volume increases as incompressible fluid (oil) is removed from the rock and the pressure in the rock decreases in the volume where the oil has been removed. At some point (the bubble point) pressure becomes low enough that the gas dissolved in the oil is released and we see higher volumes of gas produced with the oil and the volume of oil produced falls. In areas where wells are tightly spaced (core areas) we may see a generalized loss of pressure in that volume of rock such that any new wells drilled (so called child wells) will be less productive due to the overall lower pressure. This is the reason we see average normalized productivity falling in the core areas of the Permian Basin.
Dennis:
If the volume were fixed-Boyle’s law, PV=nRT, V fixed and n(subzero) fixed–then I could produce an entire shale formation with a single well. I wouldn’t even need to frack it. Clearly this is not true. There needs to be a path for hydrocarbons to move to the lateral. This is not a pool, not a porous sponge, not a pressure vessel, not a tank. Yes, there is an ASPECT of Boyle’s law. And this is part of why results are diminishing as you space tighter (the amount of new resource versus competition for the same resource drops). But…no…you won’t get the same ultimate TRR from a section with one lateral as you get with six. Parts of the rock will keep their secrets forever, if you go down that road.
Dennis:
Yes, there is a cost to hedging. Personally I’m against it. Like exposure to risk. Think it motivates the management team. Think the investor wants it actually.
All that said, even with a cost of hedging, you can still lock in higher prices than the prompt. Let’s say DEC2024 is $3.37 (is as I type this). And it costs you ten cents to hedge. That means you can lock in $3.27. I have no idea the cost to hedge. (Just a basement dweller who reads the Internet…not an “earl guy”.) But even if it’s a quarter or whatever…clearly you can lock in higher than the $1.67 at the prompt.
So the “nobody looks at strip–makes decisions off the prompt” is a non-starter. Either you just take the risk and use the casino odds (strip) or you lock in the prices (at a cost, sure). But there’s NO WAY that your decision should be based on the prompt.
A PROVOCATION: Let’s say the prompt was $6 and the strip showed reversion to $3 several months from now. (This is not unrealistic, in the event of a cold winter.) In that case, would you advocate for doing projects that required $6? Hmm? 😉
Dennis:
1. I’m proud of you for doing a little financial model/estimate. Seriously. Not patronizing. Good work-way to start to get your arms wrapped around things.
2. Of course 1.7% return is not adequate. That doesn’t even match Brandon-flation! 😉 We can argue about what the WACC should be. But for a simple picture, assume I need 10%. Really, I want more…but also, setting it impossibly high just leads the management to lie harder. I might know how to help them lie…oh wait, I am a basement dweller…let’s say I read about that effect. 😉
3. But…have a little humility. You don’t exactly know capital or operating costs or future production or end of life. It could even be worse! Like did you include P&A at the end? Granted it is discounted over 15 years, but still, part of the project. I’m totally in favor of you making best estimate you can…point (1), but just keep humility.
4. I also wonder a little bit about the structure of your model. Did you include gas? What prices did you use (prompt or strip)? Did you consider that the revenue actually is somewhat front loaded (because of shale decline)? There are also aspects of “option value” that play into some final decisions. E.g. HBP. [The classic MBA case study example is Hollywood blockbusters where option to do a sequel actually justifies negative NPV on first film.]
5. Have you ever made a project NPV model in a corporate setting? Not just supplied inputs or looked at what the bizdev guy was doing, but done it yourself, from start to finish? Not meant to say you can’t comment…I am just a basement dweller also, hypothetically. 😉 Just watch out for Dunning Kruger. A man needs to know his limitations.
https://www.youtube.com/watch?v=uki4lrLzRaU
6. In any case, you can see how rigs go up/down with price. They are certainly not completely irrational. Perhaps they just get a different answer than you do. But they are not government programs divorced from economics.
Nony,
Model includes natural gas and NGL, plugging at end of life would add 500k to capital cost, the model simply assumed constant prices at $82/bo with $5/b transport cost to refinery, 30% of oil price for NGL and Natural gas at $1.61/MCF, note that for Permian basin the Waha price is much lower than Henry Hub. Of course we don’t know future prices, but an assumption they will be higher is not always correct.
The point is that claims of wells being profitable at $50/b and $2.50/MCF do not pass muster. For the average 2020 Permian well at $250/MCF for gas and 30% of wellhead oil price for a barrel of NGL, a refinery gate price for crude would need to be $75/bo for the NPV at shut in for a well (assumed to be when well starts losing money costs more than revenue) to be equal to capital cost of well with a 10% annual discount rate.
Boyles’ Law still applies to fracked slits and pore spaces. At all times in a fracked well, there is an adsorbed gas phase and free gas. Indeed, Boyles’ Law works better the lower the pressure. As you obviously know, it’s the drop in pressure that brings the free gas into a “bubble,” as it exits the diminishing oil-gas phase and the remaining gas comes out of rock. Call it the bubble point or something else–perhaps simply the “death zone” whereby reservoir pressure drops, oil volumetrically contracts, and free gas increases–with a corresponding (relatively brief) increase in the GOR. The higher the gas cut at the inception of production, the higher the cut when the well gasses out. We don’t need more shale wells right now; we need fewer–until we get past the point where thousands of wells are “gassing out” at the same time. And I’m saying that as a man who makes his living from oil and gas wells, a good proportion of which are shale. Scott Sheffield didn’t really believe that the traditional gas laws applied to shale, initially, But it does, as he belatedly discovered, and the lower the pressure falls, the better the equation works.
Dennis:
Your oil price is too high, for lifetime. Your gas price is too low, for lifetime. Overall, I suspect the effect of the former is more important…so it actually makes returns WORSE.
You STILL didn’t answer my question about if you would invest in a project that requires $6 natty, when the prompt is $6+ and the strip is much lower. Don’t duck!
The P&A is actually not that important to the project, since it happens so long away (discounted over 15 years). But in any case, you shouldn’t lump it in with the upfront capital cost (that happens at “year zero”).
Dennis, of course many projects can’t survive $50 oil. That’s way more important than the gas, so let’s just stop there. The “super premium” is IR booshwa.
That is why you see rigs drop when oil prices crater. And the converse when prices increase. (With some lag, but still.)
P.s. I feel like I have successfully talked down US natty prices. Mwahaha! But it’s a lot harder to talk down oil. Global market. And OPEC. Sigh. 🙁 Just kidding…but on SA, they used to always accuse me of being a bear market mover…and actually I don’t even speculate…just opine.
Gerry:
I’m just a dumb Internet commenter, but I did get a national award in college chemistry. I know PV=nRT out the yingyang. I mean I heard of a dude like that…I’m just an Internet commenter (zero expertise claimed, judge the posts instead.) 😉
The analytical issue is if volume/moles are fixed or are a function of completion. And the answer is (because the rock is not perfectly porous) that some volumes require stimulation. Duh!
If you know hard rock mining, look at production of gold from sulfide ores. If you don’t run a POX plant, you will never see those ounces. The cyanide will never access the gold. It is shielded. This is analogous to unfracked shale rock. You need to access!
https://www.mckinsey.com/industries/metals-and-mining/our-insights/refractory-gold-ores-challenges-and-opportunities-for-a-key-source-of-growth (I just read about it…don’t get the mistaken impression that I have actually gotten my boots dirty.)
Mr. Coyne, I can’t help but feeling SOME responsibility for this economic analysis…your well costs are a little higher, depending on the Basin, your EUR’s are a lot higher, but the bottom line is you are basically correct…the annualized rate of return on a type curve Permian (Midland) Basin well is <2% per year. Delaware Basin wells are about 3.5%. Anybody can make more money investing in CD's at the bank than drilling US tight oil wells. I stand by SWE101.
Why does the tight oil sector keep drilling these wells? Are they smarter than you, or me; do they know something we don't? That is a common argument for the peak oil defamation league…these guys spending the money are smarter than we are.
They are NOT smarter. I give you no less than $500 B of bankruptices, incinerated capital, shareholder losses, etc, etc, since 2008 as proof. It has not gone away. Why has everyone in American forgotten that? The money lost in the entire tight oil phenomena is staggering. Even today.
There are loan covenants regarding debt to asset ratios, drilling commitments to retain, or lose acreage, M&A commitments, CEO's are trying to cash out…they MUST drill or they are fooked.
Its not that they are spending CAPEX now that they hope in six months will result in higher returns because of the CME strip…that from Nony is the 37th stupidest thing he/she had EVER said, in a long line of stupid shit, most recently that pressure depletion does not adversely affect RR or EUR's. Whoa Nellie.
Goodonya, Dennis. Respectfully, these tight oil well economics make top down URR predictions worthless. Its important to work from the bottom up. The single most important factor in predicting the future of US tight oil is well economics. It doesn't really matter if its "there" down in the dark or not.
What will it cost going forward, can the world afford it, how can the US tight oil sector pay for its still outstanding $200 B of long term debt, how can it pay for an additional $140 B of mergers and acquisitions…how can it do all that at $32-35 net back?
It can't. All the rest of this URR, 1P, 2P, Berman has been spanked stuff… is dribble. The more everyone acknowledges Nony' s spuddle, the more you give him/her credibility.
Don't do that! If this is somebody you should listent to, let "it" declare why. He/she actually qualifies its comments by saying they are not relevant. They are not. Ignore them.
Mike,
Yes I learned most of the economics from you, Shallow Sand, LTO Survivor, and another fellow who has asked me not to use his name, so I won’t. I understood the basic economics as I studied that, but the actual numbers for CAPEX, OPEX, etc and how the real world business of producing oil works I got that from oil men.
Mistakes in the analysis are all mine however, thanks for correcting me over the years, it is appreciated.
Anonymous,
The normalized well productivity is important because the volume of productive rock is fixed. If wells are accessing an increased volume of rock due to longer laterals there will be fewer total potential wells. It is easy to look at rigs operating and the number of wells drilled to get a metric of wells drilled per rig, then it it easy to find wells drilled per year for any given average rig count per year.
The reason for the normalized productivity is rather obvious to me. We see productivity increase by 10% when increased lateral length is not accounted for, but if the average lateral length has increased by 12% we have actually seen a decrease in actual productivity for a given volume of rock. It is important to recognize the difference, if we would like to create accurate scenarios for future production.
I agree that it is generally a nice metric for understanding production from an area. 100%. And have posted links before with similar point.
However, normalized well quality is not the right metric when thinking about how many rigs it takes to keep production flat (or grow it) next year or two. You need rig productivity for that. If rigs are drilling more lateral feet per day (and they certainly are if the laterals get longer, which means less moves per 1000 feet), than the rig productivity may stay same (or increase). You need to compare the two factors and see which won.
New oil/month=(new oil/spud)(spuds/month/rig)(#rigs)
Or if you prefer:
New oil/month=(new oil/1000ft)(drilled lateral length/rig/month)(#rigs)
As you can see, the rigs MAY actually get more productive even if the normalized well quality goes down…because they “drill faster”. And if it is lateral length driving the drop in normalized quality (i.e. unnormalized not dropping), than it sort of implies the rigs WILL be “drilling faster”. In that they will move less often.
This is a made up example and I’m not claiming the real numbers are this stark. But I just want to explain the concept itself:
Let’s say a rig can drill 1,000 feet per day. And let’s say it takes 5 days to take the rig down, move, and put the rig back up on a new site.
Q: If the rig habitually drills 5,000 ft laterals, how many 1,000s of lateral feet will it drill in a month (30 days)?
A: It will drill 15,000 feet. Three five-day 5,000-foot wells. And three five-day moves.
Q: If the rig habitually drills 10,000 ft laterals, how many 1000s of lateral feet will it drill in a month (30 days)?
A: It will drill 20,000 feet. Two ten-day 10,000 foot wells. And two five-day moves.
P.s. I’m not saying these numbers are exact…and yes, I ignored the vertical part of the total drilled depth (vertical plus lateral). But do you get the basic concept? That it is more efficient to move less often, while drilling longer? Oh…and having less vertical shafts actually helps my point even more!
Nony,
Yes costs can decrease when drilling longer laterals, I take the data I have, normalized productivity is useful to determine potential URR as we are not creating any new planets, the volume of rock is fixed and the geology simply exists due to natural history. I look at wells drilled and average lateral length for those wells and number of horizontal oil rigs turning, no need to look at feet drilled per rig and such, it just adds unnecessary complexity. The rig productivity metric in the DPR is not very good, I ignore it because their model is not very good. Wells drilled per rig, average lateral length, and average productivity per well gives all the information needed, assuming no change in DUC count (wells completed are equal to wells drilled, with a 6 month lag between drilling and completion as a simplified model). Also assumed that wells drilled per rig remains about the same as recent history (past 12 months) when projecting forward, at some point an optimal lateral length will be reached where NPV is maximized and lateral length will stop increasing (we may be close to this point in the Permian basin as productivity per foot may decrease faster than any cost decrease with further increases in lateral length.)
Like I said…I think normalized productivity is the right metric for basin EUR (and I know that is your main focus).
But if you are looking at rig productivity, it’s not the right metric. Click over to the Enno blog post (and actually read it) and you will see my point.
Anonymous,
I don’t use rig productivity, it is not a useful metric in my view. Productivity normalized for lateral length is much more useful as it shows the real well productivity rather than having productivity of 10 thousand foot wells being compared with productivity of 5000 foot wells which gives the false impression that productivity is increasing when in fact an apples to apples comparison shows the reverse is true.
Different metrics for different problems, Dennis. You are stuck on a tape with “this is always best”.
As I already explained, if you want to understand land productivity…yes normalized is best. If you want to understand how many rigs it takes to keep production stable, it is not.
You still don’t seem to have clicked over to read the article, in the context of my post.
Anonymous,
I read every word that Enno writes, you are not revealing anything new. Wells drilled per rig is useful, I figure that based on rig counts and historical completion rates, rig productivity may be useful to you, but has no added value in my opinion.
An article with much information on the finance side of oil:
https://oilprice.com/Energy/Energy-General/Standard-Chartered-Sees-Oversupplied-Gas-Markets-Tightening-Oil.html
The market looks like to be tight, but the price is made by financial traders at the moment who keep it low. Chart and algorithmic trading is having the upper hand at the moment against the OPEC.
As a conspiration theory it could be said that Wallstreets wants the oil price low before the election to prevent Trump.
Anonymous: ” But many Permian and Bakken wells are economic even with flaring the gas.”
Many of the older wells were quite profitable when the gas was vented/flared–that’s the reason we’re in this pickle. The TRRC rule on venting/flaring was disregarded and drilling became a bloodsport. The point I’ve tried to make to you is that thousands of those hastily drilled wells are now gassing out, and that gas (coupled with a warm European winter) has dropped the price of field gas to 50-60 cents. In the old days, it might cost $8M to complete a well and that was in the Permian core. These days the cost is frequently $12M and it’s most definitely not in the core, in most cases. The Bakken wells are/were, in general, substantially more profitable than the Permian: the cost basis is much lower, and frankly, more attention was/is given to making sure the well performs at its best. Some of that is due to a slower pace of drilling & completion.
I don’t care if you won the Field Award for mathematics, there is definitely a finite point whereby reservoir pressure drops, oil production falls off dramatically, the free gas phase rises, and that point defines the beginning of the end for that well. For a short while–a matter of about six months–such a well will produce more gas, less oil. And then it will go into a rapid decline.
Right now, we’re seeing thousands of Permian wells, drilled during the go-go years, hit that spot: call it a bubble point, or entering the danger zone, or whatever fits your fancy. You can plot these damn things all day long, and they all have similar curves. We have so many wells at that point–of gassing out–that the NG glut is predominately emanating from that very phenomenon. The only way to cure that is to cut back on drilling these wells until NG supply-demand equilibrates.
I don’t care to argue with you further, but for Pete’s sake, man, if you don’t believe me go look at the life cycle of a shale oil well that started out with a high level of solution gas. None of these wells are water-drive wells; they’re solution gas drive wells and the higher the gas cut, in general, the higher the pressure. They go gangbusters for a while. But when the pressure falls low enough that gas begins coming out of the adsorption phase, church is out. Drilling more wells is like finding yourself in a hole and digging deeper. The glut of NG coming out of the shale oil fields has destroyed the modest profitability that was present. We have to pull back and wait for the gas glut to fall (unless there’s a war).
Gerry,
That’s Bubble Point Death (BPD), described by Scott Lappierre that will hit the shale oil just as hard as conventional oil. I don’t quite convinced till a year ago.
see his website:
https://www.shalespecialists.com/about
BPD is not Boyle’s ideal gas law, it is phase diagram derived.
At the end of the day, it is an EUR argument. Whether you want to call it chickenpox death or bubblepoint death. If the well doesn’t make enough, it’s not worth drilling. If it does, then it is.
I would just remind you…that the peak oilers have gotten spanked HARD by shale over the years. Have repeatedly been more negative than the norm and repeatedly been wrong. So…caution when you see Art Berman, David Hughes, Tad Patzek, Ron Patterson, or Rune, or Dennis Coyne sounding the alarm bell (YET AGAIN) on shale. They have a bad record…and consistently in the peak oiler direction. (I’m going to ignore the tiny fraction of Dennis Coyne predictions that were decent…by and large they were crap…and even his fellow peak oilers get sick of him making 10 different scenarios…you don’t get credit for a random high case.)
Anonymous,
Your bravery against peakers are well received.
I am also impressed again when reading President Carter’s “Address the nation’s Energy” 50 years ago — how desparate the US and how real the peakers were at that time!!!
Arte and Patzek must got their birthmarks from that era.
However basic physics, i.e. phase diagram, still holds true even for shale oil.
Phase diagrams? We don’t need no stinking phase diagrams!
https://www.youtube.com/watch?v=i2FW1WJc0lg
We COULD use some proppant though. Got a cheap deal on Wisconsin white? I don’t use it myself. Asking for a friend. 😉
haha,
The shale patch in Permian are using local wet sand (unfiltered, from dirt to gravels) to save $$ these days, basically drive a bulldozer and push dirty into the tank.
Anonymous: “I would just remind you…that the peak oilers have gotten spanked HARD by shale over the years. Have repeatedly been more negative than the norm and repeatedly been wrong”
In the 1950s, peak oil is in sight. In the late 1960s, it’s here.
But wait, we have Alaska now!
Well, Alaska’s peak is in sight, and now it’s here.
But wait, we have offshore!
Well, offshore peak production is in sight, and now it’s here.
But wait, we have tight oil!
Well, it look’s like tight oil’s peak is in sight.
No way man! You guys are always predicting peak oil, and look how wrong you are with tight oil!
But wait, we still have the moon. There may be oil on the moon. So you peak oil guys are just way off into outer space. Or…wait …outer space???
What happened in 1970 with USA oil production, RYF? Conventional that is.
Maybe, we can wait another 40yrs before abiotic oil is finally within reach.
Well that’s rich, someone being “more conservative” than even Dennis…
Dennis is used to arguing why 3,000 Gb URR makes more sense than 2,000 Gb.
All we hear from you is arm waving (you a geologist?) , but I haven’t seen you actually make a case…
Seems you just want to tell everyone they are wrong when you haven’t got a clue about it yourself.
What’s your theory on why global crude oil production is no where near exceeding the previous peak set in Nov. 2018? All the peakers are wrong and you are right, about exactly what?
OPEC/Covid/Ukraine/JenniG. Those are my excuses and I’m sticking to them! 😉
P.s. If you only remembered Ron Patterson saying 2015 was the peak. Or all the random Ace/Staniford TOD posts saying we were at a peak every few months slowdown in the 2000s. Or the people who thought the Bakken had magically peaked every freaking winter (funny how that worked). Or George Kaplan saying EIA were crazy to predict GOM heading up to 2.0 MM bopd–he thought it was going down to 1.5. (It DID go up to 2.0 and he went radio silent for years.)
P.s.s. And I remember when peakers were saying US would never break 13 again. Hmm…how’d that work out for you?
https://www.youtube.com/watch?v=6-sYTAHtzXM
I guess your brain peaked long time ago Annoymous, in need for some horizontal drilling. LOL
Since 1970 oil price was under $4/barrel, and now something like $80.
https://www.eia.gov/dnav/pet/hist/LeafHandler.ashx?n=pet&s=f000000__3&f=a
That 20 fold rise in price is in large part a reflection of the approach to peak.
There are big deviations from a smooth line, from episodes things like wars, economic downdrafts, embargoes, pandemics, and fracking,
yet the limits of recoverable resource, inexorable demand growth, and depletion
are the big stories on this long march toward peak production.
Peak Global Combustion Day (including all sources) is not far off now.
July 27th, 2033 is where I have placed my bet on the International wager board.
Nony,
Do you think that oil production will reach a peak?
Yes.
I actually think your comments about demand are the most interesting. I think you make too much of US Yuppie Tesla owners (when considering global demand). But there’s something going on there. We do need a cheap source of electricity though, for long term massive conversion.
I just don’t trust the instincts of peak oilers. They have a long history of predicting peak too soon. It’s not as exciting to say 2050 as it is to say 2018. And not saying 2050 is the number…my point is
“fast peak” sells with peakers. (Look at all the abuse you get here for your shale predictions being too cornie…when they, mostly, were too timid!)
Peakers have just repeatedly underestimated the industry. Jimmy Carter and the 70s peak oil fad. Hubbert (more than once). Campbell (more than once). WW1. WW2. Etc. Doesn’t mean they will always be wrong. But…just don’t ignore their past fiascos and how bias may drive their estimates.
And a HUGE pattern of peakers underestimating shale EVEN as it was a big topic in the media. I mean…I can get they were wrong. But why always in the same direction? Why coming out with all this Berman and Hughes and others anti-shale stuff? If it was too new to understand, they could have just said that. But no…instead they went out on limbs and said it would be less than EIA predicted.
And I WARNED YOU that EIA shale estimates might be wrong, but wrong in the OTHER direction. I didn’t know it would be. But I knew it could be. I knew uncertainty was much higher than you were talking about. And it included uncertainty in the “other” direction.
US went from 10mbd to 5mbd from 1970 to 2005 so it did peak long time ago, if not for the bleep on the radar in SD and Texas.
U.S. oil production had seemingly peaked in 1970 at 9.6 million barrels per day (BPD), and by 2005 had declined for 35 years. Production in 2005 stood at 5.2 million BPD, and crude oil imports had reached 10.1 million BPD — just under 50% of total U.S. petroleum consumption.
annoymous
Anonymous:
“I just don’t trust the instincts of peak oilers. They have a long history of predicting peak too soon. ”
When did US Conventional oil production peak?
When did Alaska production peak?
When did US Offshore peak?
When did tight oil using 2010 knowledge and technology peak?
When will tight oil using 2020 knowledge and technology peak?
What new technology and knowledge will be around in 2030?
I think you’re just being contrary. No new ideas or data, just squirming and complaining.
Nony,
I had done a poster at AGU meeting in Dec 2018, just after USGS 2018 Permian Assessment was released, poster had already gone to printer so could not be revised in time to have poster ready for meeting. Below is the revised TRR scenario for Permian where TRR might be achieved under a very high oil price scenario.
When we use the AEO 2018 reference scenario to evaluate ERR the scenarios are modified as in the chart below, bothe of these scenarios were done around December 10, 2018.
Dennis, Dennis, Dennis. Do you even realize how funny this is? 😉
You expect me to evaluate what you WOULD HAVE PUBLISHED instead of what you did! It actually provoked me to Google your published abstract:
“The most likely case for Permian basin tight oil with medium TRR and a medium oil price scenario has an ERR of 32 Gb, with peak output of 4.62 Mb/d in 2023.”
https://ui.adsabs.harvard.edu/abs/2018AGUFMIN11E0669C/abstract
Oops. We’ve already passed that peak and heading higher. And that’s with a lower price than you required.
Oh…and what incredible bad luck the USGS got revised WAY UP. Wow. I bet that had NEVER happened before. 😉 Or will ever happen in the future.
Oh…and nobody had ever warned you about the danger of this. And there were ZERO indicators that the Permian was booming and other people had higher estimates…and Scott Sheffield was predicting way more. And there was an investment boom in the Permian. To include vast amounts of pipeline projects?
P.s. Hey, too bad you were too cheap to go to the 24 hour Kinkos and remake the poster. What did you tell people that stopped by the booth? “The numbers changed last night–we’re really double the ERR?”
—
Just having some fun…but damn if you don’t see how this is a lesson.
EDIT:
Look, I actually went back and looked at the early DEC18 discussion on POB. And I do give you credit for (a) changing your views and (b) dealing with all the peakers who were NOT happy with higher numbers.
But damn, dude. Don’t you see how fragile your method is? For years, your estimate could be based of the USGS from before 2018. Then on 28NOV2018, they double their numbers and you are forced to double yours. Do you see how fragile and uncertain that makes your method? Did Rystad, EIA, etc. have to change their views radically on 28NOV2018? No. Because they had an independent view.
Nony,
I base my estimates on the numbers available. The Potential Gas committee also increases their estimates over time. To my knowledge there were no good estimates for the Shale resource form the Delaware Basin prior to the USGS assessment released in November of 2018.
Paul Samuelson once quipped that he changes his view based on the information available, I do likewise, what about you?
Nony,
I told people the scenarios needed to be revised and would look like the charts I just presented based on the new information. There was a deadline to submit the poster for the conference as I remember. Not possible to redo at last minute.
The poster was also published.
See link below for poster
https://agu.confex.com/agu/fm18/mediafile/Handout/Paper446221/permian%20basin%20tight%20oil.pdf
The USGS Permian Delaware Basin assesment is at link below
https://pubs.usgs.gov/publication/fs20183073
Note that this assessment was first available online on December 6, 2018, just 4 days before the poster was presented.
Hi priced oil production will hit a wall.
That wall being formed by the replacement of the light transport sector demand with
electrification of the global vehicle fleet.
No one has a crystal ball that tells us what is the trigger price level for that to happen at a brisk pace is, but price is clearly nibbling at the bottom end of the range now.
We are already about 10 years into the global oil production peak plateau phase. Another ten years of this phase should be seen as a fortunate outcome (for those who see stability as a good thing).
Nony,
I haven’t sounded any alarm bells, just used the information available to make a best guess. The future cannot be predicted, though perhaps you could give us your prediction and we can see how good a job you do as you seem to believe it is an easy call. You call for humility in others, but take a look in the mirror.
My early predictions were quite low, but in line with the EIA’s predictions for tight oil. Most of the focus early on was the Eagle Ford and Bakken in the media and USGS assessments for the Permian came out in 2016, 2017, and 2018.
When I had that new information, I adjusted my thinking.
The USGS has tended to be a lagging indicator. If you are going to wait for them, you need to realize that your estimates will be biased conservative. Even just by time to wait for them. (Also they tend to be conservative on amounts…but even leaving that aside, just waiting for them to make their estimates.)
Anonymous,
The USGS estimates for tight oil have not been conservative since 2013, perhaps earlier they may have been. As far as shale gas, we will see, their estimates are more conservative than the PGC, but it is possible the PGC is wrong. Note that the highest estimates are not always the best estimates. For Bakken their mean estimate from 2013 looks pretty good and the mean TRR estimates for Eagle Ford and Permian look high to me, much depends on future oil, NGL, and natural gas prices, if we use the EIA’s AEO reference price scenario with the mean TRR estimate we get the scenarios I have devised, I have also shown what we get for F95, mean and F5 scenarios under the AEO reference price scenario.
Also note that Bakken assessment was updated in 2019, there was not a significant change from the 2013 assessment when we account for reserves and cumulative production.
Most of the significant producing areas have been covered, though we could use updates on Anadarko and Niobrara.
The EIA’s AEO 2018 had US tight oil at 6.8 Mb/d in 2023 vs actual of 8.3 Mb/d. For the US Southwest they predicted 3.6 Mb/d in 2023 (this includes the Permian Basin). Actual output for Permian Basin alone in 2023 was 4.97 Mb/d. Forecasting future output accurately is difficult. Note that my guess was better than the EIA’s estimate at the time, even with the underestimate of Permian TRR which was corrected with new information.
I only work with information available, blathering by oil Company CEOs does not count as reliable information, remember the rants of Harold Hamm on Bakken having URR of 30 Gb, that is clearly nonsense.
Ted “Kris” Cross, from Novi (Enno’s firm) on how base decline from shale is moderating:
https://twitter.com/tedcross/status/1759944417685750209
Oh…yeah…but that just means they are stripper wells.
Wait! I thought stripper well operators were the salt of the earth.
No…not if they are horizontal. Totally different.
Why?
Because I say so! Grr. >:( Don’t make me bubblepoint death you. It hurts. A lot.
you are PatzekXArteXHughesXLeherre of the forever endless no limitation oil!
Ted also admitted and stated/cherry picked,
Shale gas (Marcellus) slow decline is not the same as all shale gas, Haynesville really die out quickly and lifetime less than 10 years and then need refrac — maybe also with local wet sand now to save$$
Bakken slower decline is not the same for all other shale oil.
Not clear that shale oil has the long lifetime of a conventional stripper well. The latter are drawing from an originally high-density reservoir that is draining from pocket remnants, while shale oil is from diffusion over a wide area with a much lower density of oil. According to diffusion theory, the shale should have long tails but there really is a limit to how far oil will diffuse, so a different diffusion model is used called Ornstein-Uehlenbeck which goes into an exponential decline after a time.
The tail end of shale oil will likely play out differently from conventional.
BTW, I didn’t realize that Ted Cross was associated with NoviLabs as I had been reading his SubStack on Geology. Had a discussion with him where he said that geology has “some of the most complex spatial problems in any field”, and I responded hold my beer.
I think Ted is much more fundamental geology on his substack, not even oil and gas…just fossils and crap. On LI and Twitter, he is a little more political. On NoviLabs, he’s more business. Think that is fine. Good to have different sides to yourself.
I think the thing that is different in geology than solid state science, Paul is that we are talking about heterogenous materials in the earth sciences. It’s basically dirt and rocks and stuff. Not a single material like a 3-5 semiconductor grown epitixially! Or YBCO or the like (and I am not trivializing their theoretical complexities in band structure…after all Bednorz and Muller was a phenomenological discovery, first!)
For that matter, it blows me away how many commenters here do not understand that there is not an “oil molecule” or “oil element”. That you are dealing with literally a natural product (biologically formed and then degraded over millions of years), with a lot of the resultant complexity of biological materials. Oil is a hydrophobic solution of hundreds of different hydrocarbon molecules, reflecting a lot of the inherent complexity of organic chemistry. From CH4 to multi-ring aphaltenes with several hundred AU molecular weights. I’ve had people that seemed to think “condensate” was an element…and different on the periodic table from “oil”!
You’re also dealing with varying length scales. From the pore size of tight rocks, to the strata to the areal extent in many mile areas. It’s something that brings out extremely “old school” science like (gasp) surveying to gamma ray measurement to seismic (and growingly complex data crunching, not just idealized situations.)
If you ever got into it, Paul (and we are probably both too old to do it), I would suggest looking at geophysics. And NOT in shale but in offshore. Your math and physics abilities would serve you well there. Although…still don’t be too cocky…need to learn new things, not just decide your physics degree rules all. But geophysics would be much closer to home than geology (which has a lot of description and field work and the like…sort of like marine biology…sometimes cute girls too, although not as many as with dolphins and corals.)
wow, do you actually have anything useful to say?
Paul, that’s possible. It’s even possible the opposite. That there are slower pathways extending life, e.g. desorption. Not arguing that, but just saying we really have very limited knowledge of old shale wells. (The best we can do is very old verticals in the Eastern Gas Shales or medium old verticals in the Barnett. If you want to look at old horizontals, you have to look at Montana Bakken wells or Barnett gas wells. Still not a large amount of P&A in those groups yet. And a little early to say what the exponential decline phase will be (which is a simplification anyhow).
This is the chart that Ted Cross presented. The production cushion from all USA shale fields started prior to the start of 2020 is only 2 million barrels/day.
Does that sound overwhelming or underwhelming?
This is really poor work on Novi’s behalf. Its meanningless hooey designed to keep people engaged and interested in buying the data…so you can sort the confusing shit out.
60% something percent annualized decine rate of Permian tight oil production in 2014 was very little.
48% of almost 6 MM BOPD in 2024 is 3 MM BOPD and hard to replace every year, year on year, before all the crap growth projections can occur in the Permian. At $32 per BO net back. How can they do that ?!!!
Put another way…the mighty Permian Basin now looses more HZ tight oil production every year than when it started producing the stuff in 2014.
People really need to get un-fucked about this tight oil stuff. And fast. Its going down and the 4.5-5,0 MM BOPD of tight oil exports, from the Permian!, needs to stop now. Before its too late.
Yeah…that Nony is a bad guy. Not part of our tribe. 😉
The concept of base decline is not like discovering antigravity or something. But it is a powerful concept that routinely people fail to appreciate, either cornies or peakers.
Essentially after recent growth, the well population gets younger and it becomes that much harder to grow/maintain.
AND the converse. After a decline, setback, it is that much easier to recover. (This has flummoxed the anti-shale crowd repeatedly.)
Here is a video discussion of the concept in 2017-18, from a Novi competitor:
https://www.youtube.com/watch?v=KKGlzlJaLrY (see minutes 22:50-24:50)
Of course, Cross is also correct about the effect of well population over time. You see this in the Bakken for instance as a bigger low decline population builds up over time, even with flat production. That is the GOOD thing about “stripper wells”. (Lower decline.)
P.s. Any way you cut it…how are we producing 13 MM bopd and 120 BCF/d with less than 700 rigs? What happened to the “have to drill like crazy”? Anyone realize how low that rig count is on a historical basis?
No tribe, only people that desperately need, and deserve, to know the truth about their hydrocarbon future. Sadly they can only get bits and pieces from extemists.
America first. Always. Before frail egos.
Paul,
in a classical diffusion model the exponential decline of mass flow, that is due to the advancing depletion layer, is moderated by the geometric expansion of the boundary layer. In a single straight line the mass flow declines, but in unconstrained 3-D space the boundary surface grows cubically, which in theory would eventually result in a constant flow rate (non-declining).
In real world, however, the boundary surface will start bumping into other wells’ boundary surfaces and/or the boundary of the basin itself, so the situation is a bit more complicated….
KDIMITROV, My diffusion models are always generalized by including an uncertainty on the diffusivity, reflecting the reality of a significant variation of the substrate. I use a Maximum Entropy qualifier on this, and it actually makes the analysis tractable in many cases. I wrote and published the detailed analysis and I think it provides an alternative to fractal analysis, and is closer to the superstatistics approach advocated by others.
Not sure what you are adding is anything other than a conservation of mass, i.e. divergence = 0, the Laplacian of the concentration = 0. I don’t see how that can be a constant flow rate though considering it’s a random walk, and it will still be centered, unless the whole suspension is flowing by convection. There’s a fascinating study of stream solute flow via analysis of breakthrough curves where I have also added a maximum entropy value of uncertainty.
The main goal of this is to match the empirical observations with the most parsimonious minimal complexity model that’s physically plausible, and that’s not a heuristic like the typical decline rate models applied (exponential, hyperbolic, harmonic).
Paul, isn’t shale oil mostly “trapped” in the shale? Otherwise, wouldn’t it, over time, have migrated into the much more porous and permeable carbonates that separate all shale layers? In the Bakken that’s strontium carbonate; in the Permian it’s a limestone karst. They’re amenable to in-migration of oil.
I’m much below your league in this. I understand that conodonts and other marine organisms were cooked under just the right pressure and temperature in shale, where they’d been trapped by sedimentation. My question is naive, but it would appear that the model you refer to above (Ornstein-Uhlenbeck, which I had to look up) would work only over a vast expanse of time.
In other words, if permeability occurred much at all, the oil would have migrated out of the shale into the carbonate layer that lay below. Naively, it would seem that the only meaningful migration in most shale is via pores opened up by fracking.
Thank you in advance for humoring me.
GERRY MADDOUX.
I’m sorry that I didn’t spell out the context enough. The diffusion I am discussing is AFTER the shale subbstrate is hydraulically fractured. Can’t really control which way the solute (oil) will flow as the fissures will go deep as well as shallow. Random walk diffusion describes this process and the Ornstein-Uhlebeck provides an attractor to limit the effects.
I’ve wondered a lot about horizontal wells as stripper wells, from the standpoint of how long can they be produced economically.
I really don’t know the overall answer, and it’s tough to obtain data.
I note that EOG’s Parshall was a heck of a field back in the early Bakken development. Parshall seems to have a lot of SI wells, which I assume means they aren’t presently economic.
Went back and counted and almost 20% of EOG’s Parshall wells are SI or had 0 production in 12/2023. Another 8% recorded less than 100 BO for 12/23.
Whiting has almost 100 SI or 0 production wells out of 680 in Sanish, which is another “old Elephant.”
Looks like about 10% of the total wells in the Bakken were not producing in 12/2023, but this includes pre-2006 wells.
I also suspect labor is still an issue in ND, and so many of these wells could be just waiting on a rig.
I’d speculate that a Bakken well producing under 100 BO per month would be uneconomic at current WTI. Assuming an 80% NRI, the gross monthly income would be below $6k. One down hole failure would doom such a well.
Mike has indicated in the past there are a lot of EOG wells in the EFS that have been SI for years.
As to P&A, much depends on how agressive specific states are in regulating inactive wells. Many companies won’t plug them until the state makes them.
A lot of questions I don’t know the answers to. Maybe the people actually involved with producing shale wells could fill us in? I think RGR might be able to? Maybe LTO Survivor? I think Mike has some ORRI in some EFS shale wells?
Who are you?
Why come on here and attack these fellows?
You seem like a very smart fellow.
But a pain in the ass.
🙁
I actually don’t mind sparring with Anonymous, unless WTI drops below $50. That’s when our pain threshold is met.
Actually, if WTI drops below $50, it’s probably best that it just go on down to $20 or below, far past a point where the shale fellows can convince business media that they can still make money.
Although the COVID plunge was rough, it was cathartic with regard to shale storytellers. They couldn’t hype their “Triple gold 6 star super prolific” locations at that level.
Rig Report for Week Ending February 23
– During this week the US Hz oil rig count increased by 2 to 452. The rig count has continued to stay close to 450 since the beginning of October.
– Permian rigs rose by 1 to 295. Texas Permian was down 1 at 203 while NM Permian added 2 to 92. In New Mexico, Eddy county added 2 to 49 white Lea was flat at 43 rigs. Midland dropped by 1 to 17, down 29 from a high of 36 in July.
– Eagle Ford was unchanged at 46.
– NG Hz rigs dropped by 2 to 107. (not shown)
Frac Spread Count for Week Ending February 23
The frac spread count was up 6 to 270 and is down 2 from one year ago. Will the frac spread count get back to the 275 level where it will be in equilibrium with the wells being drilled?
More flow testing about to commence in Alaska.
Mike Shellman and I took an interest in the claims originally made following the drilling of the “Ice wine” well. There have since been a number of wells drilled by 88e and Pantheon. Prior flow tests were predominantly gas but this one may or may not confirm oil. It’s of little consequence to peak oil but makes a change from arguing about the Permian.
https://nextinvestors.com/articles/88e-found-oil-does-it-flow-we-will-soon-find-out/
For SS (not even a cornie/peaker point…just some free analysis).
Too cheap to buy the data, given I am just an Internet commenter. But using Enno’s free blogs.
Looking at MT Bakken 2004 wells, at DEC2020 (i.e. ~16.5 years old):
active: 112 (87%)
inactive: 15 (12%)
plugged: 2 (2%)
total: 129 (100%)
FWIW, there were 2 plugged wells in 2012, so no more plugging for last years examined. Inactive grew, but not monotonically. E.g. in the winters you will get a bit more and some will return to production in summer.
For 2007 ND-Bakken wells, at MAY2023 (~16 years old)
active: 181 (71%)
inactive: 47 (18%)
plugged: 28 (11%)
total: 256 (100%)
So even though slightly younger a higher pattern of P&A. Also, FWIW, the P&A percentage seemed to grow pretty steadily (was only 2, 10 years prior to end of the data set…looks almost linear rate of change). Again, inactive does do some bouncing up and down, not a monotonic increase, but still more at end of data than 10 years ago).
—–
I looked at rate to compare the ND and MT samples. It’s actually kind of hard to look at the last year of production rates . (Data seems to jump around and dive down on last month– think there is an issue of Enno’s Tableau algorithm or some aspect of the math I don’t get.) But looking at “next to last year”, you see ND wells averaging ~20 bopd, versus MT wells averaging ~14 bopd. So it’s actually the ND wells seeming to look better as a group (of course we really need to look at the ones right before they get plugged). But…maybe that indicates ND is harsher regulated than MT. Could be other things like lease terms or operator behavior or Covid or cost or whatever. But my guess would be the regulator stricter in ND. Just an initial guess though.
Note also that these average rates INCLUDE the wells that are inactive/P&Ad. So that’s not what the average active well is doing. Including the bad wells is usually the right way to think about things (e.g. at project start, or for a retrospective of basin performance). But if you look at acquiring/operating assets, right now, you really need to separate out P&A wells (and maybe inactive ones or some fraction of them).
In any case, doesn’t seem like the wells turn off after 10 or 15 years or whatever…as some of the h8er have said in the past. Well…not in the Bakken, they don’t. (Eagle Ford is crappier geology, sure…but at least they got nice weather and are much closer to markets.) Probably looking at at least 20 year Bakken lifetimes, more likely 25+ for the average duration, even in ND. After all, wells decline slower as they age. (Even with exponential flow, the math works out so that magnitude of change decreases, since percentage decrease is constant.)
I have heard worries that bigger modern completions may lead to earlier EOL. As if the ONLY effect of fracking harder was to accelerate production, not to crack more rock and expand the effective size of the reservoir. But you don’t really see it in the data for H and M gas wells. In general, it seems like the well rates do come down to match the older smaller wells. But not to cross them and get worse. I sorta suspect that the tails of the bigger completions will be similar to the tails of the smaller completions. That the mechanisms going on at that time and flow scale are similar. But it is early days. Still. And I haven’t done some study, controlling for geology, spacing, lateral length, fully developed sections, etc.
P.s. Thanks for the kind remark. Hope you are enjoying that WTI price bump from “the Kingdom”. And the natty price doesn’t matter, for your wells.
Older wells never die, they simply dripping on
but the impact to EUR is minimal, or it will stop dripping for a while or forever if the dripping rate is too low.
There is difference between H&M gas wells even as their IP 1st years keep on going up the same pace.
The H gas wells certainly drops faster than before 2015, although with a higher IP, it is still higher, but you can not count on it for EUR.
The M gas wells almost drops the same speed as before 2015, and with higher IP, it will make the EUR noteably higher and life longer.
Similar difference could be found for shale oil wells/fields.
here is a list of # inactive (incl. plugged) : #total wells (round to 10/100s)
M(Penn): 474/11,500, ~4.3%
H: 701/7,880, ~8.9%
B: 2,106/18,900, ~11.5%
P:2,448/44,100, ~5.3% (with much shorter history than B,M&H)
Too tired to look at M now.
But looking at the H, pre an post “propageddon” (TM-Chesapeake, 2017), it seems like the newer wells are not just higher IP, but even slower decline. Like look at 2018 or 2019 versus 2012 or 2009 (I played around with several comparisons, but no change to the story below).
https://novilabs.com/blog/haynesville-update-through-april-2023-4/ (select well quality, select appropriate years of first production)
What you see is a near linear decline in rate (on the semilog graph) of the later wells, but at a lower % change than the older generation. Note that this is the part of the hyperbolic decline where % drop is extremely steep.
So, basically it’s not just higher start. But lower % decline for first few years. Unfortunately, it’s too early to see the later wells turning (or if the don’t turn, meeting/crossing the older wells. And if you extend the near linear (i.e. exponential) declines forever, you’ll eventually see a crossing. But it is too early to see that yet. But big picture….early years probably matter more. And it’s actually not even just a higher IP. But lower % decline for first several years.
Note that lateral length increased over time, but less than the IP shift. This is NOT a play where one can tell the normalized quality dropping story. Also, of course, it does not explain the first few years, lower % decline (as that is relative over time, not length dependent).
P.s. Perhaps of interest (dated, but on target):
https://www.youtube.com/watch?v=KNjgLMmHGLk
you seriously digged the NOVI Haynesville?
My finding is different from yours.
I looked at CHK in H, and got the following Month13-Month37 decline:
2012: 78%
2019: 80%
The youtube lecture about Haynesville is fancinating, lots of useful info although so few viewers, and I wish the 2nd wave of HayneGeddon will make the decline much smaller.
Note CHK has always been trying to apply the slow decline observed only in Appalachians old and new to other shale patches, and here in the PropaGeddon 2nd wave Haynesville, they are doing that again.
I get the same result as you for CHK.
But if you look basin-wide (all operators), 12 to 37 month rates, it’s
2012: 73%
2019: 71%
And you actually can see it by eye on the semilog rate versus time plot.. Especially on year 1 and year 2. (I think in year3, the older wells look more hyperbolic (concave up) versus the newer wells that are more exponential (linear).
For CHK. you can see at month 48, the yearly rates are equal. Basin-wide, they don’t touch yet (2019 still higher). Granted, these are unnormalized and in general length has been increasing.
To really judge the completion size versus decline curve, of course, we’d want to control for geography and look at completed sections of same spacing and length. Those may have all changed over time.
Here’s the raw data:
Basin wells 2012 decline
13mo 598 2853 NM
37mo 598 764 73%
Basin wells 2019 decline
13mo 442 8069 NM
37mo 442 2366 71%
CHK wells 2012 decline
13mo 64 4264 NM
37mo 64 940 78%
CHK wells 2019 decline
13mo 71 9092 NM
37mo 71 1856 80%
Note that the 2019 CHK are higher at 13 months than the average 2019 basin well, but lower at 37 months. This prompted me to compare the 48 month cums of overall basin versus Chessie:
48month cum
chk 8265
all 8042
So, even though they are crashing harder, the CHK wells are “nicer” than the basin average, for first 4 years of life. Of course, there may be reasons of geology (e.g. depth) driving differences in IP and decline of Chessie versus the overall basin. Not just that they are flowing them harder.
AT least I don’t have to worry about bubble point death (scary, scary) in the Haynesville. 😉
It will be interesting to see how shale oil will react to the next oil price collapse. Reason being, investors could not care less about production growth in relation to income.
So maybe when oil prices collapse back below $50 WTI, they won’t try to fake it like 2015-19?
It will also be interesting to see how many BOPD USA will climb past 13 million BOPD. It gets tougher to climb with each one million.
I do agree, there is a higher base from low volume wells that are declining less. But they are still declining.
Last, I thought we were at peak oil demand worldwide awhile back. What happened to that?
We do own Hugoton RI and ORRI. Has been mostly dismal for many, many years.
Shallow sand,
It is not clear we are at peak oil demand, where oil is defined as C plus C, perhaps soon, maybe within 5 years, depends on the speed of the transition to electric land transport, at least in part. How fast that occurs is difficult to predict. The peak demand hypothesis is intended to explain why oil prices have remained relatively low leading to OPEC cuts and restraint by tight oil producers.
As I am certain you are aware, most of my scenarios are not correct, this may be a case of that.
shocked to read that
In a YouTube video, Arthur Berman says that Doomberg has stated that the world will produce 140 to 150 million barrels of oil per day by 2050.
SS
I see no reason for WTI to collapse back to $50. For the coming year, the EIA has US oil production flat. Both OPEC and the IEA are calling for increased demand for this year.
On the supply side there is a big difference. The IEA sees a production increase of over 1,000 kb/d from Canada, US, Guyana and Brazil for 2024. No way. The EIA has world supply increasing by closer to 500 kb/d. As long as OPEC + holds the line, WTI stays close to $75/b and heads to slightly above $80/b this summer.
Ovi.
I don’t either, but assume it is inevitable.
Maybe not this year, but at some point.
We try to plan for $35. We try to keep enough cash on hand to survive $35 average for 24 months, up from 12 months. We held back a good chunk of the 2022 profits and put them in the bank.
It is easier to do that with higher interest rates. We also took some and put into some ETF’s, which have done well.
We also plugged wells last year that were marginal with some of that $$.
I would like to see $80 WTI, I think more likely $60-70 with election coming up.
Biden wins, prices will be strong. Trump wins, prices will be weak. Just my guess.
SS
I think your prudent thinking on spending is the way to go.
World demand is what drives Brent and WTI not US elections. However I do see one factor that could upset the applecart.
If congress does not approve the $100 B package for Ukraine, Israel, Taiwan and the border, that would be a significant drop in government spending in about 35 states that make armaments. That could slow GDP growth. I think it is that spending that has kept the US economy out of a recession and defied the inverted yield curve theory and driven the US market to new highs.
It is sad to say that a war is helping the US economy, but if that is what it takes to defend democracy, so be it. There is too much at stake here.
I wish the Putin wing of the GOP understood this.
US election and Wallstreet computer traders drive the oil price.
We had a January with oil deficit – very rare – no effect.
The Houty make target practicing with iranian rockets on US oil tankers – no effect.
They nove the price to the max pain point to feed from hedges and fundamental traders.
Demand can dictate the oil price only when tanks are overfowing or at working minimum. Between future traders make the price.
CTA’s don’t have endless money. And if other sources of liquidity don’t come in behind them to bid prices higher or lower depending on how the CTA’s are positioned they eventually take profits and exit positions.
I’d argue prices would already be in the $60’s maybe $50’s if It weren’t for the CTA’s buying in and exiting shorts and flipping and going long oil when WTI was in the low $70’s. Momentum bottomed.
CTA’s chase momentum. If momentum tops out in Nvidia. The entire stock market will roll over and head lower. Which I think is likely to happen starting between now a March 11 as money is taken off the table. Ahead of the FED.
Money or liquidity will also leave the oil futures space. Lower prices. CTA’s are currently long oil. But if they get flushed out of their positions. We could see a $20 drop in oil prices relatively quick.
If prices head lower those CTA’s will lock in some profits and sell. And they potentially won’t return until momentum bottoms out again.
CTA’s don’t give a damn about elections. All they care about and are programmed to do is make profits for their owners.
@HHH
The physical oil market is 8 billion$ a day (100 million barrels x 80)- but most of this is traded in long running contracts, so it’s even much smaller. Cushing has 91 million barren capacity – so its round about 7 billion $ – peanuts for wallstreet.
Trading in NVIDIA alone is 30 billion $ a day, Apple 10 billion.
So you tell me the CTAs don’t have enough money to play the oil market? And why should oil cost only 50$ when we are in a deficit and this price would hinder development much?
wish Starship will demo LNG charge this month, and use lots of gas to go to moon and Mars
After hitting new highs in 2023, US lower 48 oil production growth will begin to slow considerably in 2024 and beyond
https://www.woodmac.com/press-releases/2024-press-releases/after-hitting-new-highs-in-2023-us-lower-48-oil-production-growth-will-begin-to-slow-considerably-in-2024-and-beyond/
They are still predicting growth however.
In its report “Is the Lower 48 tight oil supply boom over?” Wood Mackenzie projects Lower 48 oil production to grow by 270,000 b/d in 2024 and another 330,000 b/d in 2025.
Some type of turnaround is expected/projected for June/July…
If this happens, a return to pricing from 15 years ago is likely (bottom of $100 per barrel, top of $140 and average price around $120)…I think 2022 was a foreshadowing of 2025 higher prices….
$160 by 2030, average inflation of 10-15%…I know, a very bold prediction…
This US chart was posted in the last World update. It show no growth for 2024.
The light blue graph is the STEO’s projection for output to December 2025 for the Onshore L48. For 2024, the STEO is forecasting dropping production in the L48 states. From December 2023 to December 2024, production is expected to drop by 127 kb/d. Not clear where the 2025 growth comes from.
Quite a difference between the EIA and Wood Mac projections. In the next few months, the effects of the dropping rig count should begin to show up.
I have to admit severely underestimating LTO production. In hindsight, I
think my principle error was the naive assumption that unprofitable oil
would not be extracted. I watched in amazement as the 260 bankruptcies in the
LTO sector just seemed to attract more capital. It would be interesting to
subtract all the oil produced by wells that won’t pay out from current
production and see if that production is closer to other analysts
projections.
However I am much more interested in the economic effects of peak oil than
the actual date. In that respect my predictions have held out fairly well:
1. Since 2008 I have been saying that oil prices would be lower than most
people expect when peak oil occurs.
2. I have predicted a shift to agroecology after peak oil completely
changing the labor market.
3. I have been predicting negative real interest rates after peak oil.
Negative real interest rates change everything. If you own a resource
and real interest rates are positive, you should produce your resource as
fast as possible to make as much money as possible today. In the future,
if you need the resource, you can always buy it with your money. If on
the other hand real interest rates are negative, you do the opposite.
That is to say you husband your resource and only produce what you need.
In the future, if you need money you sell a little of your resource to
get the money you need. I think negative real interest rates will
significantly effect oil production post peak oil.
I don’t think commenters here read shale 10k and 10Q.
Rune Livkern was one of the few that did in depth.
I used to. I quit awhile back.
I did just look at Pioneer’s 10K ending 12/31/2023. It says as of 12/31/2023, Pioneer still has $779 million of net operating losses that can be carried forward to future years.
As I recall, Pioneer had over $5 billion of NOL carry-forwards as of 12/31/2020. So it has finally used most of them up.
It might be interesting to see what federal income tax Pioneer has actually paid in years 2021-23. I’ll try to look that up later when I have some time.
I interpret this to mean that in the all the years after Parker-Parsely became Pioneer, and started drilling HZ wells in Saudi America, it was never profitable. It never quite got into the… black.
If the sale to those dumb asses at Exxon goes thru, Exxon assumes $4.6MM of Pioneer debt…so PXD’s 2020 NOL never got a lot better to 12.31.2023, this in spite of longer laterals, 1,300 more wells in Saudi Arabia each stuffed with 250,000 pounds of dirt and 600,000 BW. And MUCH higher oil and gas prices.
Thats remarkable, when you stop and think about it. Pioneer was the best the Permian had to shovel up. Saudi America was the best.
Pioneer found a sucker desperate for drillable locations and sold out. I will let somebody else determine then if it got black, in the end. I doubt it. Whether Exxxon makes any money buying that stuff remains to be seen; its gassy as hell and PXD’s liquids productivity is down 18% in 30 months. Can Exxon do it better than Pioneer ? Your asking big government to run your pizza place. It sure hasn’t in Eddy County with the BOPCO thing. Exxon still can’t meet its promises.
This tight oil shit is tough to make a living in; I am a telling you.
Down hole there is a comment about peak oil. The defintion of “peak oil” always meant peak AFFORDABLE oil production necessary to meet demand. The peak oil defamation league changed the defintion to suit their rants.
People forget the US tight oil industry lost $500 B, with a B, in burned up capital, shareholder equity and bankruptcies before 2020. I think those losses are real, and still on the books, however you look at it. Like Pioneer, tight oil is still not really profitable.
So, yeah, moar money delayed the enivitable, along with a host of other things people will choose to ignore, things like frac source water, flaring gas, exports, earthquakes, 330 foot BHL’s between wells, illegal allocation wells in Texas and other bad stuff. None of us in Texas EVER thought the TRRC would allow forced pooling in Texas.
Don’t let others with the inability to think past next week sway your concern for the future of oil and gas in the US and in the world. Their arguments are weak.
Hold my beer, give me enough money, and enough water, and I can make Kuwait look like Augusta National, for instance. Same thing with US tight oil. About THAT stuff you should be very concerned.
In addition to the E&P accumulated losses, one must factor-in OFS write-offs. For the current frac fleet for example, the most horsepower comes from the 2013-14 vintages. This equipment was written-off in the 2018 and the 2020 crashes. This allowed lower 2021 frac costs, the equipment was already amortized.
Mike. It appears as of 12/31/2023 Pioneer had $4.8 billion of long term debt, up from $4.1 billion at the end of 2022.
What I found interesting is that Pioneer had $3.8 billion of cash at the end of 2021. They paid a ton of dividends in 2022, and cash dropped all the way to $1 billion. They paid less dividends in 2023, as cash dropped all the way down to $240 million at the end of 2023. They had to borrow $700 million in 2023, presumably to pay the dividends?
Oil production did grow 6% in 2023 over 2022, after no growth from 2021 to 2022. Natural gas production grew 17%. Getting gassier.
Maybe a metric that doesn’t make sense, but PXD has about $645 of cash on hand per net barrel of daily oil production, at least as of 12/31/2023. That would be like our little company just having about $100k in the bank.
PXD’s 2023 borrowings would be equivalent to us borrowing about $340k (on a per BO basis) to pay ourselves distributions in one year.
It is really absurd when you consider it. But that is what investors are demanding. That was with WTI at $78 in 2023.
Easy to see why PXD is selling for no premium.
I don’t think these guys can keep paying a dividend without either much higher oil prices or borrowing more $$.
Maybe someone smarter than me will look over the 10k and correct my errors in analysis?
Mike, I had kind of quit looking at 10k because nobody here would take me up on it.
Why I always liked Rune. He read 10k and 10q.
They probably have a line of credit.
Fussing about how they manage cash is kinda small beer, I mean if you want to say bad things about their inventory or valuation or decline or whatever those are much bigger concerns. XOM could care less about how PXD manage cash. They are buying the assets (flowing barrels and future locations), not buying the CFO. Sure, the contract will have caveats on what cash and debt can be when the deal closes (to prevent any snaky last minute financial games). But XOM is not doing the deal for the financial assets, but the physical ones.
Shallow Sand,
I always appreciated your reports on 10K’s and still do. I also appreciate it when you report numbers from your business especially when compared to those of publicly traded companies.
Schinzy
Are negative interest rates associated with long mild recessions and the government is trying to get people to spend money to revive the economy?
Isn’t this what has been happening in Japan for the last five years?
Ovi,
Note that I said “real” interest rates for which a first order approximation
is the interest rate minus the inflation rate.
My conjecture is that we are in a period in which real interest rates are
close to zero yielding the type of phenomena you mention. The answer also
depends on the actions of central bankers. For the last few decades, central
banks have added an additional task to their mandates: maintain the price of
financial assets. Back in the 1990s they used to call this the “Greenspan
put” because anytime it looked like the stock market was heading down
Greenspan reduced interest rates enough for the stock market to recover. The
practice has since morphed into a “central bank put”, see
https://www.goodreads.com/book/show/36204933-collusion and
https://www.goodreads.com/book/show/58485511-the-lords-of-easy-money. I
actually think this is related to why all the unprofitable oil was
extracted. The first course in economics should be on money creation and
destruction. Unfortunately it is not. Central banks are currently worried
about inflation. Keeping inflation in check and the price of financial
assets supported is extremely tricky.
I do not think our financial system is well adapted to an environment in
which real interest rates are strongly negative. As I stated above, negative
real interest rates change everything. A few years of negative real interest
rates will strongly change peoples preferences in terms of consumption,
production, and investments.
Old school peak oilers:
Economics doesn’t matter. Geology does. You can’t print oil.
—–
New school peak oilers:
No fair! Shale investors funded a production boom.
🙂 🙂 🙂
Sorry, but what a dumb comment. It is obvious that they are linked. That’s one of the reasons we have 30-40% recovery factors on most fields.
It’s a matter of how you define “oil”.
For most of the oil era economics did not matter. Conventional gushers from high porosity fields were not sensitive to economics. The returns were so high that the only difference oil prices made was between ginormous and super-enormous ROIs. This type of oil led to some of the largest fortunes ever amassed, it lifted whole countries from backward poverty into luxurious opulence.
Other “oil” resources such as LTO are not like that, they are sensitive to price and economics. There is a reason why North Dakota looks nothing like Abu Dhabi…
The USA also has the ability to take on tremendous amounts of debt, as evidenced by the $35 trillion and counting at the Federal level.
That is something I admit I missed back in 2014.
I’m expecting oil prices to tank because grain has tanked big time. Corn is over $1 below “break even.” But farmers are going to plant it. They have to, they have no choice.
It’s the same as the continuous drilling terms of oil and gas leases.
Grain tanked in 2014. Oil followed. No reason it cannot happen again. In fact, nat gas already has.
There are a lot of things that don’t make sense in commodity markets. Farmland prices are sky high. Waiting to see if they are going to break. The return on a crop share farm lease, after paying real estate taxes, has sunk below 1% on a lot of farms.
I’m aware of one auction recently that is a bust. Bid stopped at just 65% of the seller’s reserve. But that is very anecdotal. Have to see what happens in other areas of the Midwest.
Imagine if mandates for ethanol in gasoline were removed.
This country allocates a massive chunk of prime farmland to ethanol production, with its marginal net energy yield/acre. This marginal net yield of energy project results in a massive misallocation of resource and distortion of the agriculture economy.
Example, from Missouri- “All gasoline offered for sale at retail stations within the state must contain 10% ethanol (E10). This requirement is waived only if a distributor is unable to purchase ethanol or ethanol-blended gasoline at the same or lower price as unblended gasoline. Premium gasoline is exempt from this requirement. Ethanol is defined as fuel that is derived from an agricultural source and that meets ASTM Standard D4806.”
If you took 1 acre of average Iowa farmland put it under utility scale spacing PV production you would provide the same annual transport miles as approx 144 acres of corn ethanol.
Even better would be to put the solar on sparse (and sunnier) rangeland 500 miles to the west and spare the prime farmland for other uses.
Thanks Hickory. I live in Missouri and always buy the ethanol-free premium. I am very aware of what you just texted.
“Imagine if mandates for ethanol in gasoline were removed.”
Then the price of corn would *really* crash. Ethanol mandates were primarily intended to absorb ag surpluses.
Anonymous, are you one of those who says Federal Debt is irrelevant?
It would be interesting to know how much PPP, etc went into the financial markets.
There is probably more than one study on that, if I would bother to use Google.
Care to look at where USA National Debt has went since 2005? Don’t think that has any connection to the shale boom, I assume?
At the end of 2005, we were at $7.9 trillion.
If we truly are Saudi America, why have we went from there to over $35 trillion?
It appears there is probably shale in other parts of the world. One can argue it isn’t being drilled primarily because the money cannot be borrowed to make it work.
I see ExxonMobil wants out of the Vaca Muerta. I assume that is because Argentina isn’t a great place to do business, unstable currency and all?
Another metric.
PXD’s NGL and natural gas production is of little value at present. It’s just a byproduct of the oil they are producing.
PXD’s oil production, if we completely exclude gas and liquids, is at $134k per BOPD as of 12/31/23. That is very high IMO. Even if we assign some value to the other products, it has to be north of $100k per BOPD.
Those are values we’d see at $100+ WTI, not $70s WTI.
The dividend was presumably holding up the share price. They really shouldn’t be paying a dividend. Wonder what would have happened to the share price if they eliminated the dividend? Drop in half or more?
Fun to speculate I guess.
I’m not defending the market or XOM valuation of PXD. But two points.
1. The value is not just based on current production, but on the inventory of undrilled locations. (Consider in the extreme a leasehold of undrilled acreage with zero production…it would have value.)
2. I’m fine with ignoring the gas/NGLs but would just remind you that the valuation is not based on the prompt but the strip. I.e. the future expectations. This applies also if prices are temporarily high. The reason I’m OK with ignoring the gas is it’s small…plus the oil price is backwardated (which might make it a wash).
I put a value on the gas and NGL; dropped the oil to $100k per BO; which is still double to triple too high, IMO.
But; shale can get financing. Stripper cannot.
It’s why all the MLP’s went bust. All of them. There wasn’t one that survived.
I completely agree that the reality is shale can still borrow, and always could borrow at a much higher amount and on much better terms than stripper. It was a big flaw in my analysis, and why we are doing our best to build up big cash/liquid reserves.
I also made a big mistake regarding continuous drilling requirements.
Finally, I have never really understood how the commodity funds work.
Will say I am very thankful we have zero stored grain, contracted it all in 2023 or 2022.
But this year is looking awful. Very bad, and if the lenders start cutting people off, look for asset values to plummet.
No credit = huge asset value reductions. It is why shale sells for 4 to 5 times stripper oil well production values.
As to putting values on undrilled locations, I guess I’d like to see how that all pencils out at current WTI and other products prices. And then maybe knock $20-$30 off WTI.
One thing; LOE should finally level off. The cost of tubulars has dropped, at least in our area. I saw PXD LOE was up 10% in 2023 over 2022.
Finally, I don’t know if you all recall me discussing how these guys juice EPS by understating unit cost depletion? Don’t know if I will have time to look into that or not. It’s harder to do without having free access to Enno’s data on a monthly basis.
PXD’s liquids productivity, along with its EUR’s, have has been declinning since 2017. Exxon inherited debt and pressured depleted, gassy oil wells, with gas and gas liquid prices falling like a rock. Nobody drills wells on hope, nor a CME futures strip. Natual gas prices have no reason to go up at the moment. The stuff is everywhere.
At $75 WTI Midland, when pundits say “breakeven” prices are $40, that means net back prices are $35. Divide $11 MM well costs by 35 and remember Novi says the mean averaged Midland Basin EUR is 435K BO.
Exxon paid Pioneer an estimated $3.5MM per drillable location (googleable)…that raises well costs to $15.5 MM each, less by $1.5MM if the well is stacked in two benches. Divide net back price into the cost of THOSE wells and then estimate the amount of oil you have left in a type well to make a profit on. You’d be better off burying that money in the backyard with the dog bones.
The way I read the statistics on that graph — after 2 years you will get the cumulative production that you expect to get over the next 10 years. In other words, the cumulative doubling time is 10 years. After 12 years, the next cumulative doubling time would be at least another 100 years, essentially a stripper-level output that is accumulated (unless it gets shut-in).
Last I checked, the government didn’t invest in shale.
At the end of 2005, we were at $7.9 trillion. If we truly are Saudi America, why have we went from there to over $35 trillion?
Because taxpayers, especially wealthy taxpayers, are much happier about buying t-bills than paying tax bills.
That’s pretty much the whole explanation. That’s why taxes keep getting cut even during deep deficits and good economic times.
Right now we’re raising interest rates instead of raising taxes. It’s insanity.
I don´t really understand the point of this comment. I thought you were
interested in why forecasts underestimated U.S. LTO production. Then when I
give my reason you characterize me as a peak oiler and make the unjustified
accusation that I thought something was unfair. I don’t know what a peak
oiler is, and I by no means said anything was unfair. I only indicated that
my underestimate was due to misunderstanding how the economy worked.
I also indicated that my interest is less about when peak oil occurs and more
about the economic effects of peak oil and oil production in general. For
example I believe that extracting unprofitable oil reduces the price of oil
which can prevent people from making contingency plans with respect to peak
oil, cause producers with high lifting costs to shut in wells, and reduce long term investment in oil making the possible occurrence of
peak oil a more disruptive event.
Anonymous loves to throw around the term “peaker”
Makes him/her feel important.
There is something about calling people nicknames that is a sign of something? Oh wait, 45 does that all the time?
My comment was a general one and not specifically aimed at you. Your post was actually better than most, here, in acknowledging an error and learning from it.
The general point still does apply. Cornies have said (for decades) that there is an elasticity of supply, which would mitigate some peak oil concerns. That higher prices will incentivize going after oil (doing projects) which aren’t being done at lower prices. Geology-oriented peakers (Campbell, Deffeyes, most of ASPO and TOD, etc.) have said this was silly and did not need to be considered. So it is telling to see the success of tight oil (helped by high oil prices granted) and to hear them say “well…we didn’t include THOSE barrels in our resource estimate.”
The other issue, of course, is technology development. Where the cornies [look, I used a nickname!] have said the industry has decades of new technology development (evolutionary and step change) and that this will enable new resources. And the peakers dismissed it. Then when shale came in, they said “well that doesn’t count, it’s new technology!” And then, even their anti-shale comments (and there were a lot of them) were shown wrong by continued improvement of shale wells and they said, that doesn’t count either since the wells got better. As if this is news to the world that new technologies improve over time!
Somehow cornies isn’t as derogatory as peakers.
Maybe we need to come up with another nickname.
Spendthrifts is my suggestion. Most who complain about higher gasoline prices tends to be spendthrifts who are in consumer debt up to the hilt and that extra $1,000 per year in fuel expenses is enough to put them in arrears on the credit card payments.
I should clarify here.
I am not meaning any price is ok.
My ire is directed at those who currently think the price of oil today is way too high, and think $40 is appropriate for a top, and that we should just “compete.”
Also, I understand there are a lot of people who are working low wage jobs and struggling. Not sure if anyone posting here is in that boat, and don’t mean to offend if so.
Then when shale came in, they said “well that doesn’t count, it’s new technology!”
Bullshit! I don’t remember anyone saying that. We all said that no one expected the shale revolution. But shale oil is still oil, and it counts. Please stop making up shit. It only makes you a shit distributor.
I have said several times that the 2018-2019 peak was the final peak. If I am wrong, then I will just say I was wrong. But at least I had the courage to express my opinion about when peak oil occurred. I don’t think you have ever done that. Put up or shut up.
I am in full support of your opinions, Mr. Patterson.
Both of them.
But I especially admire the one about the distribution of shit.
While some here hold on to hope of a future crude peak like it’s a $10 B lotto ticket, I’m less interested in oils continued downward trajectory and starting to focus more on natural gas (and future peak within next couple years…maybe more).
I see natural gas, wind, solar and hydro/geothermal as derivatives of crude production. They all require cheap crude at a fundamental level primarily either for materials, transport, labor, equipment, economic conditions, or some combination of these factors.
So I ask you all, is there any chance that natural gas and crude oil peaks are not coincident? I could see NG delayed by a couple years but not 5-10….
I’m resigned to crude oil falling by x% annually, but natural gas is likely a different story, but how different exactly is of interest…
Kengeo, my crystal ball opinion is…. yes, I believe crude and NG will have different peak profiles.
NG volumes associated with crude production will probably have a lag peak from the crude produced for obvious GOR reasons. Eventually, NG will follow with a peak… don’t have the sense of the lag time.
The wildcard though is in the immense acreage of dry gas production and undrilled future locations. This will potentially push the NG peak many years out from crude peak. There are still huge swaths of domestic US acreage, for example, that remains unleased… even though it sits in a proven NG fairway. Too many dry gas locations in inventory already, so why lease up what you can’t/won’t drill right now. This inventory may sit undrilled for many years, pushing new volumes out into the future.
Meanwhile Qatar is adding significant global LNG export volumes to the party…. gees!
https://www.reuters.com/business/energy/qatarenergy-set-further-expand-lng-output-north-field-2024-02-25/
Thanks, that makes sense especially if we see heavy vehicles move to being NG powered, that would shift the crude demand profile down and NG up. Limiting factor will obviously be pipelines and transport, I don’t have a feeling how that plays out but it certainly seems there will be opportunities in that space. It’s ironic that the EV revolution is/will be NG powered ( i typically charge at night when prices are lower, sun isn’t shinning and wind is usually less than during the day)…
“It’s ironic that the EV revolution is/will be NG powered”
even if this was 100% correct, and such a transport system was applied to all light transport
it would be a much more energy system than we currently have, less expensive and less polluting.
e-Generation from Wind+Solar+Hydro < Nuclear, together that group+Nuclear is < NG…coal makes up the rest, so you are right, NG has replaced coal as the #1 electricity fuel source.
It's just a shift, where the 70s – 00s were time of cheap oil, the 20s and on need cheap NG to survive…
While large volumes of natural gas come out of those big Appalachian Basin wells, and even the Haynesville, the great excess of NG is emanating from the gassier new wells in the Permian, and also from tens of thousands of old wells coming to whatever point you want to call it where they produce much less oil but still quite a bit of gas. The Northeast quadrant of the U.S. doesn’t want the gas from the Appalachian Basin and the rest of the country doesn’t need it. Haynesville still has too many rigs working, supposedly for this “strip” of future $3 NG prices (which may or may not develop, as some of the new Permian wells are REALLY gassy). Natural gas is the economic choke point for shale oil production, no matter what certain commenters say. In ideal times NG contributes about 25% to a shale oil well profitability. At 60 cent NG in the field, that’s gone, which is one reason why XOM, Chevron, Oxy, Diamondback all plan to cut back rig count. This would actually be a good thing if the country had any plans to put in new pipelines and use NG as a bridge to nuclear, but that’s not in the cards. The only way to get rid of all this excess NG and reestablish market equity is to LNG it and ship it. But Qatar and KSA are quietly filling that void. That’s what makes the future of shale oil so questionable: the NG excess coming out. And it could take a long time to get back to equilibrium–especially with a tighter watch on venting/flaring.
Dennis, you’re not as bad as the average here, but you’ve still got a miserable predictive record, and consistently biased low and consistently lower than the EIA, industry, investment banks, academic consortiums.
I do give you credit for adjusting your Bayesian prior. But I take off credit for not recognizing the structural issues with your model before it failed and after it failed. And even after USGS screwed you…you’re somehow convinced USGS must understand the Marcellus better than others (despite not even reading some of the competing views.)
Also, the USGS has not been great on tight oil since 2013…after all their estimate until NOV2018 was half of what it changed to. So they were off until then…proved by your relying on it!
You’re repeating points you’ve already made–and even I have already conceded–like the similarity of the last two Bakken TRR estimates. At the same time, you’re ignoring points that I have brought up, e.g. the round number EURs in the Marcellus “input form” (I bet you didn’t read it, when I mentioned it), showing they didn’t even have trained EUR (as Patzek did).
Big picture, this isn’t going anywhere and (when points are being repeated), it’s a waste of time. Have fun. I’m moving on.
I told you ten years ago…that you weren’t incorporating enough uncertainty on the high side. Even if you were low, your uncertainty was too small. I was right. And you were wrong. Oh…but it’s the USGS’s fault. If they told you Iraq had WMD, you’d just trust the experts and invade…especially since they were giving you the answer you liked better. You wouldn’t look at other people’s views…or pressure test the expert (Curveball or USGS). Sorry…I can’t accept that…it’s not just the SMEs fault. You could have done more. And…you still haven’t learned your lesson.
Oh….and I still wonder if you told people at your poster that all your numbers had doubled, but you didn’t want to pay for reprinting. 🙁
Sayanora. Have fun. You may have the last word! 🙂
Anon – What empirical evidence for your nonsensical bantering have you provided? Zero, nothing…care to change that? Told-you-so’s and everybody’s wrong isn’t worth a thing if you can’t articulate exactly why…
The most important part of the entire debate is really quite simple…there’s a very narrow window (~5-6 years) for a new world peak to form. Every day that world oil production doesn’t increase is a nail in the coffin for the Nov 2018 peak. Right now production is at least 4-5 mb/d below that peak…tell us where and when 5-6 mb/d of production increase will come from?
Limits of physical oil supplies aside, price would need to go up substantially in order for that production coming online.
So, do you believe $200 per barrel oil is coming and soon enough to make a difference?
My guess is you can’t see the forest for the trees…
In South Texas it was 88 F today. Wednesday the high will be 61 F with a FL of 43 F. We say about the weather here, if you don’t like it… wait a minute and it will change.
So it is with US tight oil.
Tight oil growth in 2023 had nothing to do with better rock, better technology, drilling the LAST of the longer laterals, more dirt stuffed into those micro fractures, none of that. It had to do with gutting wells during flowback and DUC’s. US (tight oil) production keeps going up because of things that happened in the field 8 months ago, when there was free cash flow to piss off. Things are different now. Forget about breakeven and focus on $30-$35 net back. Use that and start dividing.
You are about to about to see the weather change, big time.
What will all the abundance cheerleaders say then?
Nada. You will notice they like to come out from under their rocks when oil prices are high and production is way up.
Great point Mike, Anon – Why have you been so quiet for the past 10 years?
Yes, something that most here underrate – the price of oil ist the most important factor when peak oil occurs. If you make $ or need to get even more credit to continue producing.
It defines the amount of OPM you can throw at all these projects – be it fracking or paying down double digit billion $ in new big offshore or distant onshore projects.
The same with gas – here politics come additional. For example, we have a lot of nat gas in Germany, but it will be never produced. Fracking is evil (you can read it in every newspaper and new show in TV), and so we deccided to import fracked gas from somewhere else because this is more ecological (without the logic in it).
I guess–
https://dangerousminds.net/content/uploads/images/mithlogogogogogog.jpg
Nony,
The areas that the USGS evaluated, they have done a good job on. I read all the links you provided, unlike you I don’t think every analysis that gives a high result is necessarlily a good analysis. I have included wide boundries and the high limit has rarely been exceeded. Claims that others are better remain just that, at the times when my analyses have been too low, the EIA was also low.
As far as the predictive power of any model, every one will be wrong. The statistics are very simple, infinite possible scenarios of the future, one correct future. Probability of picking the correct scenario is exactly zero.
I have learned a great deal over the years, like many I am fallible. I have never seen a prediction by you so though you know so much more than anyone else, you offer little insight.
Also – You may or may not have noticed that US oil production has been flat for almost 6 months (0.5 year).
Sounds like US will not be contributing to bringing world production back to 2018 levels, right? And that’s right, Russia and OPEC are down so they won’t either…so who will?
Well, Guyana and Canada, for two.
Well that’s reassuring!
OPEC can increase production, there is also Brazil and US output will also gradually increase.
Nah, ain’t gonna happen. And even if it does, the rest of the world will decrease at a faster rate than these three will increas.
Dennis – A factor I’m sure in your EV displacement of oil consumption calculation, the grid isn’t and will not be ready!
https://energycentral.com/o/esri/5-ways-dispel-grid-panglossian-illusion?utm_source=browser&utm_medium=push_notification&utm_campaign=vwo_notification_1699327059&vwo_powered=1
Kengeo,
Not clear the grid cannot handle charging for EVs, most is done at night when demand for electricity is low, this is far less of a problem than many believe and it is possible to upgrade the grid, it isn’t rocket science, just as roads were built in the 50s, the grid can be expanded as needed.
The article you linked to provides a number of strategies for increasing grid capacity. The article focuses on replacing all fossil fuel for electric power by 2050, rather than the charging of EVs so not as relevant to that discussion.
Dennis
The transformers on a grid are designed for a duty cycle. High use during the day and lower at night. During the day the transformers heat up and the oil in them transfers the heat to the walls to get rid of it. At night they oil is supposed to cool off. That will as more EVs are added to an area.
In our area, the line voltage was doubled and the transformers were replaced in anticipation of this problem.
Error
That one line should have read:
At night the oil is supposed to cool off. That will not happen as more EVs are added to an area and charge over night.
Ovi,
The EV charging at night is not significant at present as a percentage of daytime use, so it will be several decades before this is a problem, generally it is a smart move to increase line voltage as the i squared losses will be smaller. Certainly the grid will need to be upgraded over time, but the process will be gradual. This does not seem to be a problem that cannot be overcome.
Dennis
I agree it is not a problem now. It will be a problem at some point and I guess planners in utility companies have to figure out a schedule for upgrading the system. I just found it interesting that our utility started upgrading a few years back.
Our area is fully built with homes. I presume the only new significant load they see are EVs. In walking the neighborhood I see only one Tesla 3 and he charges at night.
Don’t forget the significant portion of solar which is on customer rooftops, which doesn’t go through those transformers.
The solar “duck curve” greatly reduces the load during the day, reducing the heat load you were discussing. In California and Australia the load in mid-day is going to zero:
“As solar capacity grows, duck curves are getting deeper in California”
https://www.eia.gov/todayinenergy/detail.php?id=56880
https://en.wikipedia.org/wiki/Duck_curve
Ovi,
I agree it could become a problem in the future especially in summer in warmer areas.
Nick G
Interesting tid bit. we now have to listen very carefully to distinguish between DUCs, Duck curves and Duct tape.
Ovi,
What happens when a duck flies upside down?
It quacks up!
just watched a wonderful youtube PPT by BEG, it has quite some hard number grudges against EV and renewable
https://www.youtube.com/watch?v=jqnAYCyyuqI
although Tinker forecast for Haynesville and shale gas deviates from reality is as large as the coal consumption between China and India
https://www.youtube.com/watch?v=IZ5piwC0S1c
Guyana the world’s fastest growing economy.
The paradox of plenty – Becoming a petro state
Exxon’s curveball move in Guyana alters Chevron-Hess deal prospects
Exxon said on Monday it may exercise pre-emptive rights that could block Chevron from acquiring a 30% stake in a giant Guyana oil block, the centerpiece of its rival’s $53 billion deal to buy Hess
https://boereport.com/2024/02/28/exxons-curveball-move-in-guyana-alters-chevron-hess-deal-prospects/
I thought this thread was for petroleum news?
Baytex Energy reported tonight. They make this statement:
“We recorded a non-cash impairment of $834 million on our legacy non-operated Eagle Ford and retained Viking assets as the carrying value of our oil and gas properties exceeded their recoverable amounts.”
Is this another indication that EF has had its best days?
https://www.baytexenergy.com/content/uploads/2024/02/BTE-Q4-2023-Press-Release-MDA-and-Financials.pdf
I have interest in this junk; Baytex was stoopid. “The carrying value of our properties exceeded their recoverable amounts.” That means they paid more for it than its worth.
The EF was done 3 years ago. The question is not whether its seen its best days, the question should be, why blame the rock? It was crap when it was discovered. 60% of all EF tight oil wells never paid out D&C&LHC. Why is that so difficult for people to grasp?
Can we expect the exact same sort of statements from Exxon, about PXD, FANG about Endeavor, Chevron about Hess? Oh wait a minute, Chevron tried to buy something from Hess, the only thing they had that had any value, with a preferential right to purchase provision held by Exxon, who is now, rightfully, going to excercise that right to purchase. We are now going to see what Chevron thinks of Hess Bakken crap.
I swear, watching the US oil industry these days is like watching Gilligans Island reruns.
New posts up
https://peakoilbarrel.com/opec-update-february-2024/
and
https://peakoilbarrel.com/open-thread-non-petroleum-feb-28-2024/