A guest post by Ovi
All of the Crude plus Condensate (C + C) production data for the US state charts comes from the EIAʼs Petroleum Supply monthly PSM which provides updated information up to April 2023.
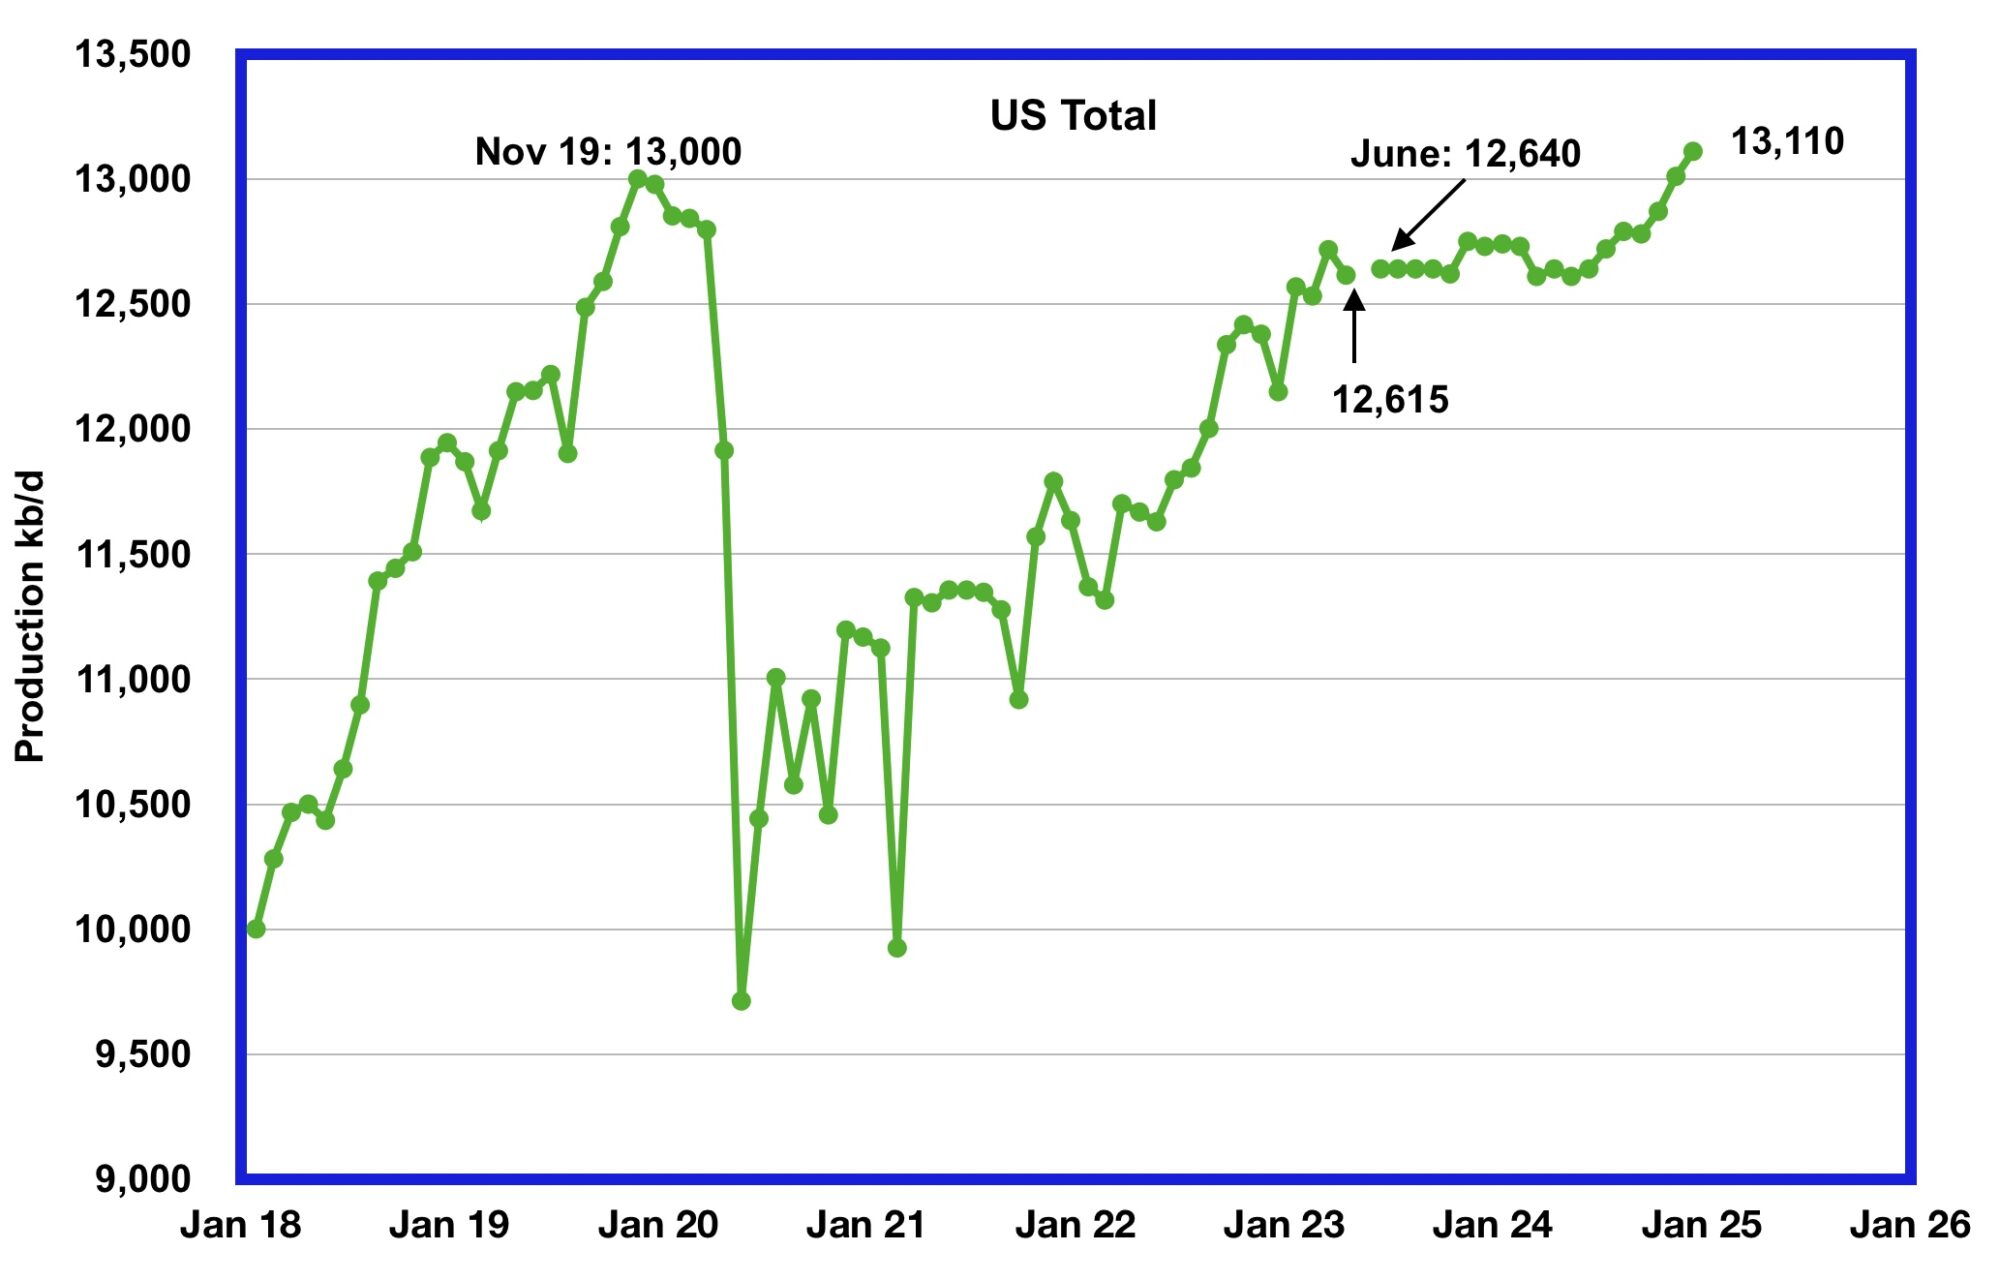
U.S. April oil production decreased by 102 kb/d to 12,615 kb/d, a drop from last month’s post pandemic high of 12,717 kb/d. Note that March’s output was revised up by 21 kb/d from 12,696 to 12,717 kb/d.
Onshore production increased by 37 kb/d to 10,447 kb/d.
The green graph from June 2023 onward is taken from the June 2023 STEO and is the forecast for U.S. oil production from June 2023 to December 2024. Output for December 2024 is expected to be 13,110 kb/d which is 170 kb/d higher than forcast in the previous post. Also it is 110 kb/d higher than the November 2019 peak of 13,000 kb/d. Production will be essentially flat from May 2023 to May 2024 before production begins to rise.
Oil Production Ranked by State
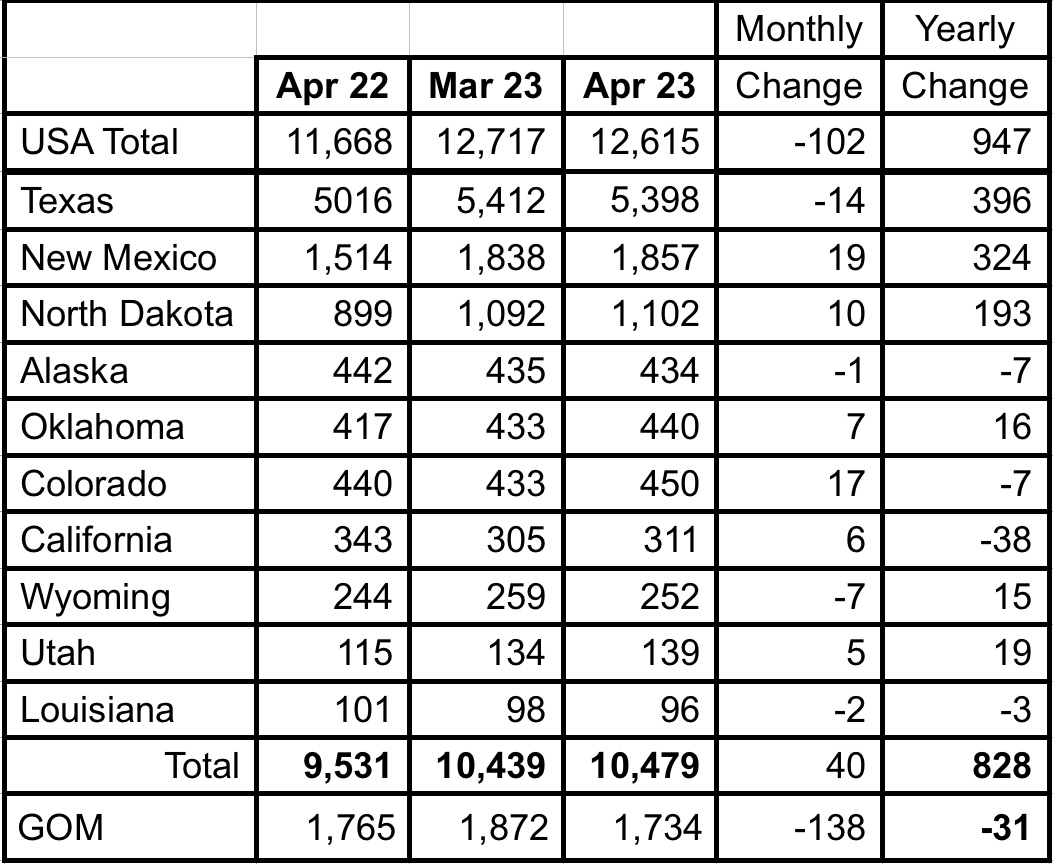
Listed above are the 10 states with the largest US oil production along with the Gulf of Mexico. These 10 states accounted for 83.0% of all U.S. oil production out of a total production of 12,615 kb/d in April 2023. Note that GOM MoM production is down more than overall U.S. production.
Note that New Mexico’s oil production, for this month, has passed the GOM’s production.
On a YoY basis, US production increased by 947 kb/d with the majority, 720 kb/d coming from Texas and New Mexico.
State Oil Production Charts
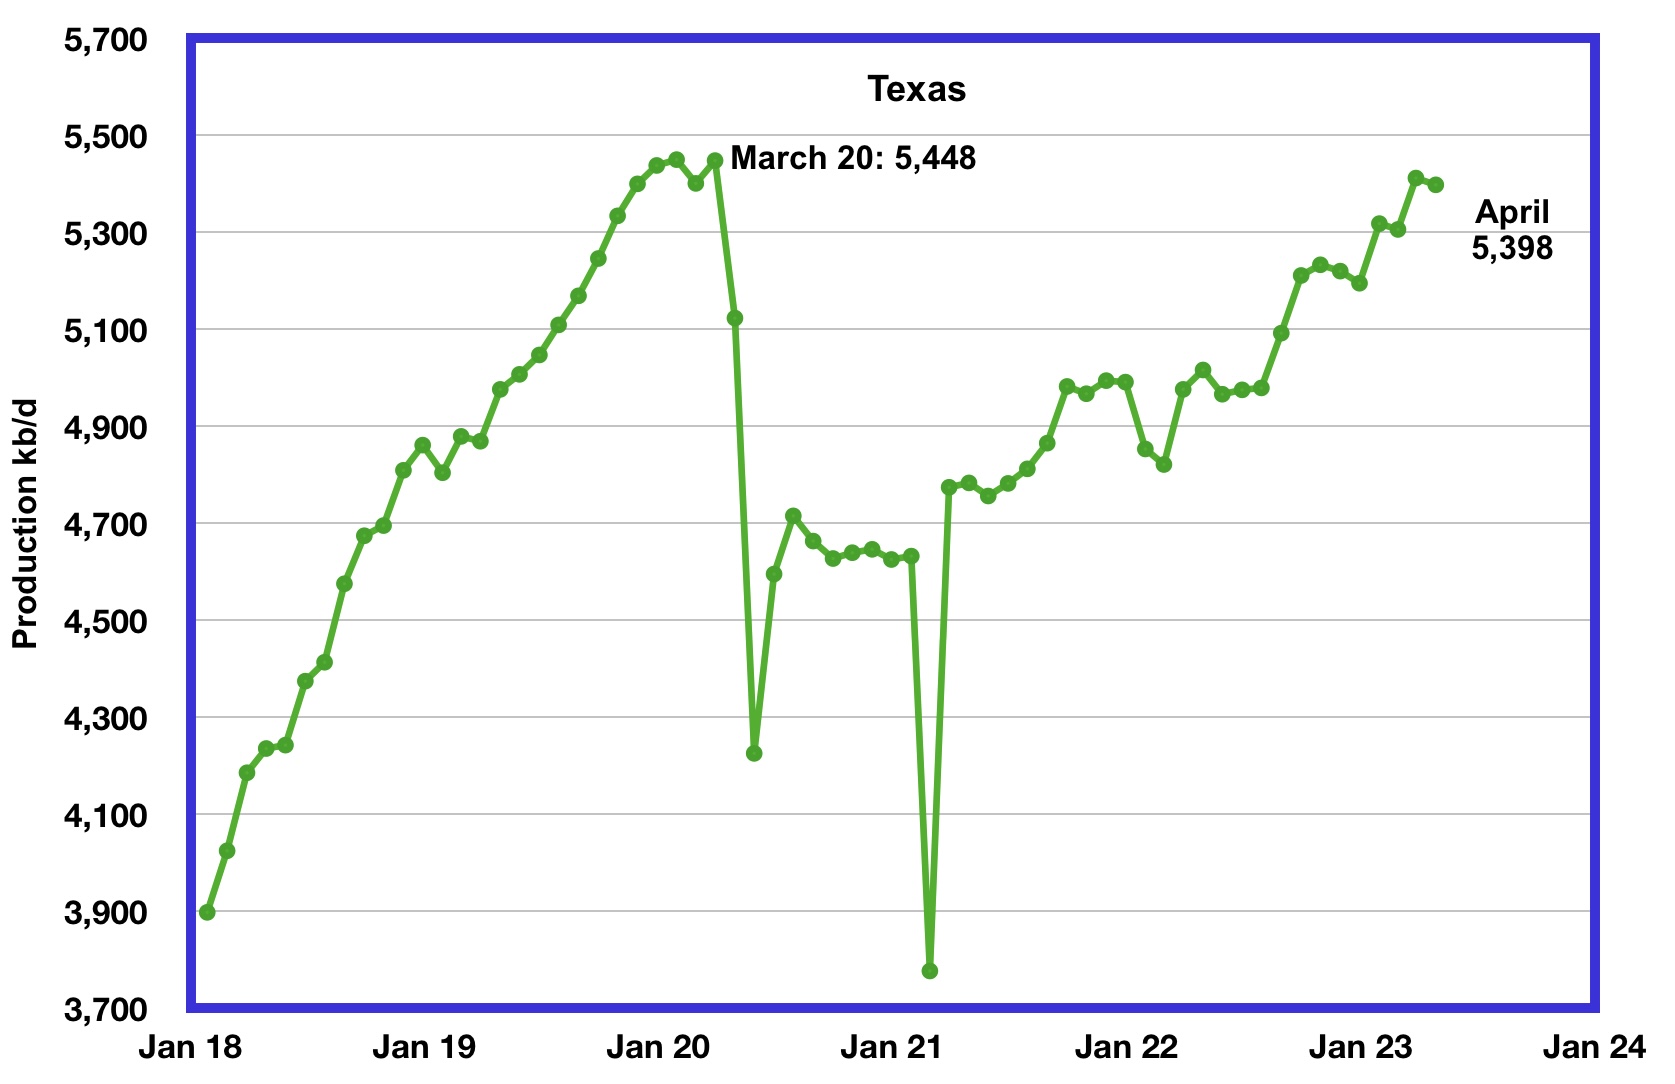
Texas production decreased by 14 kb/d in April to 5,398 kb/d. April’s output is 50 kb/d short of the March 2020 high of 5,448 kb/d.
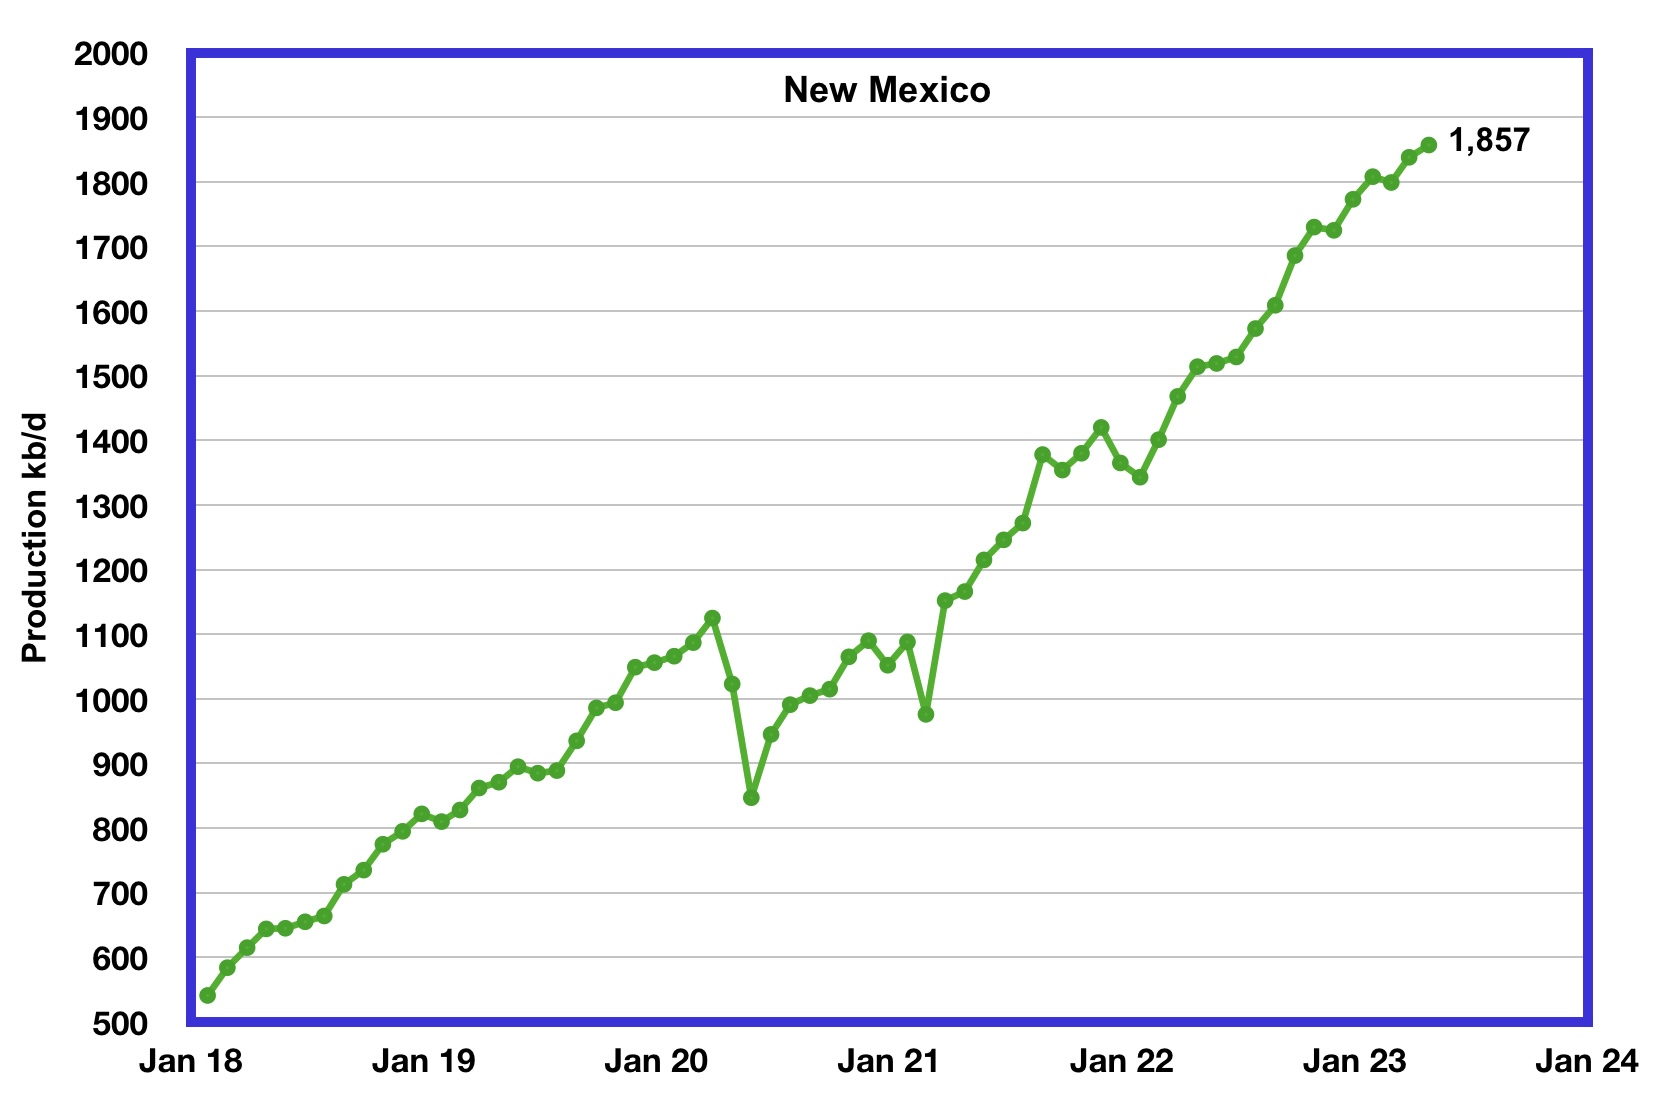
New Mexico’s April production continued at a record level but was little changed from March. April’s production increased by 19 kb/d to 1,857 kb/d.
Of the 1,857 kb/d, 1,633 kb/d came from the Lea and Eddy counties, according to this source. More production information from these two counties is reviewed in the Goehring and Rozencwajg section further down.
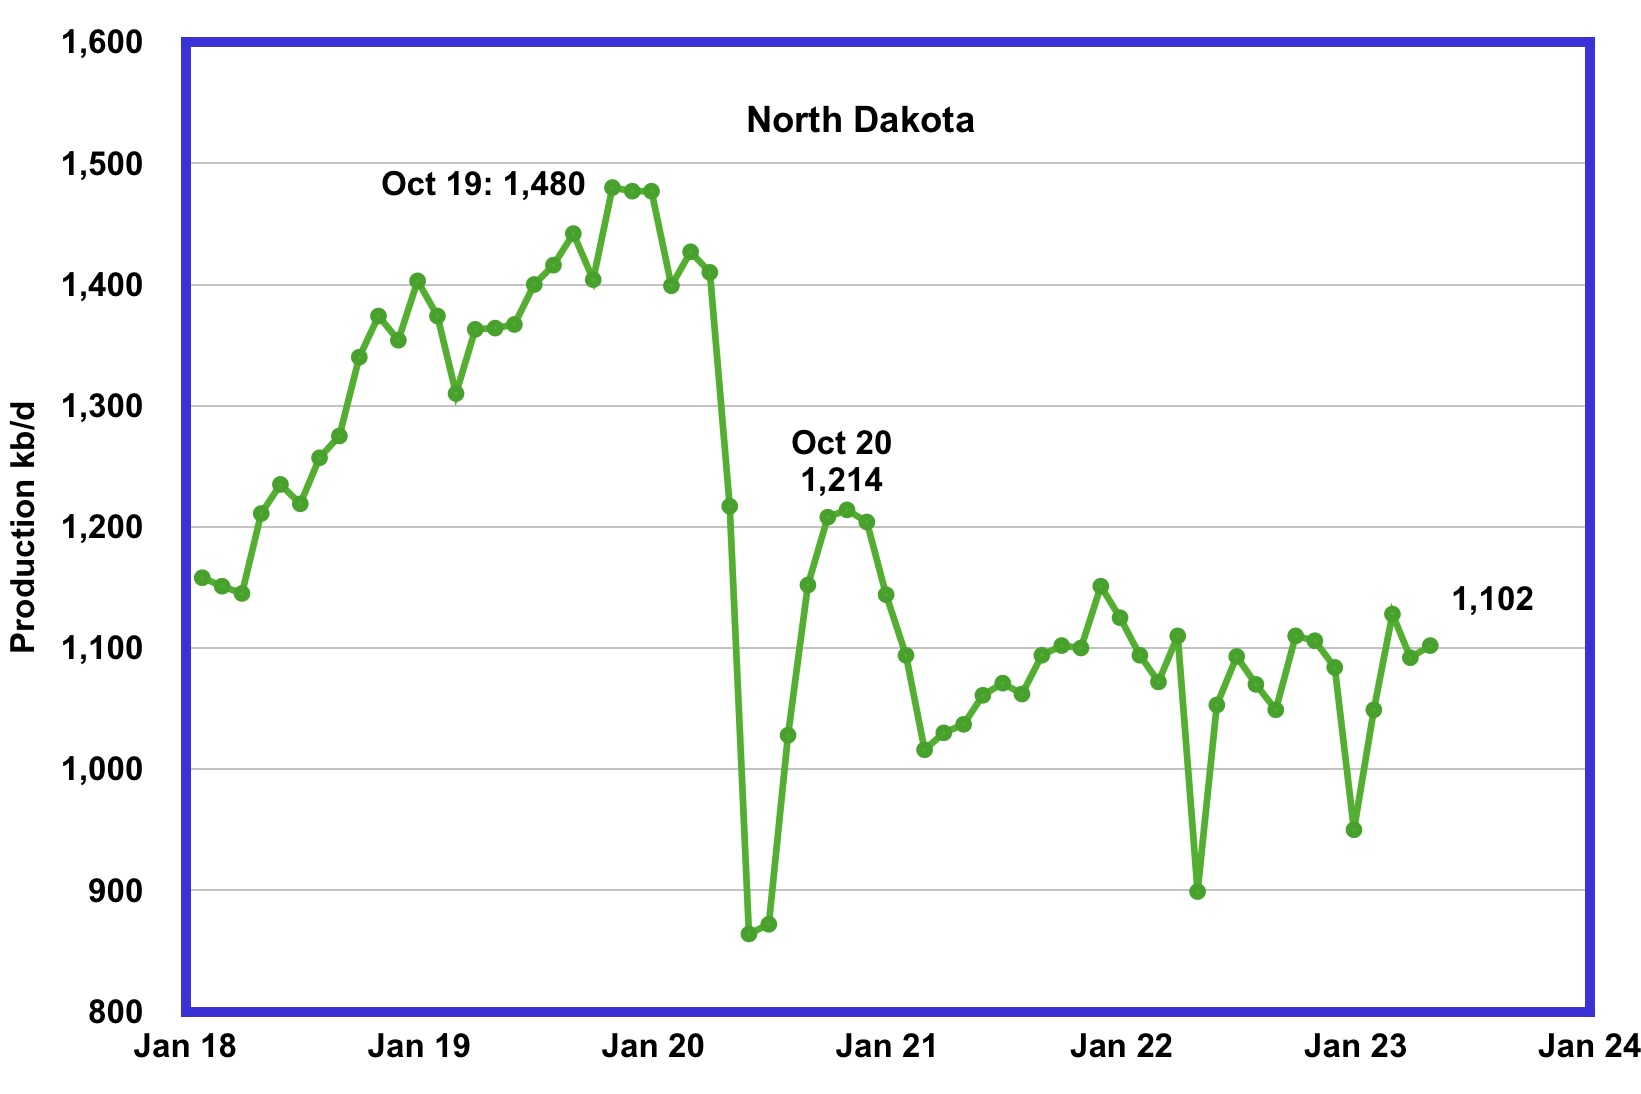
North Dakota’s April oil production has recovered from December’s extreme cold weather impacted production. However April’s increase was essentially flat. Output increased by 10 kb/d to 1,102 kb/d. Current production is unchanged from January 2021, 1,094 kb/d, and production over the past two years has been on a plateau.
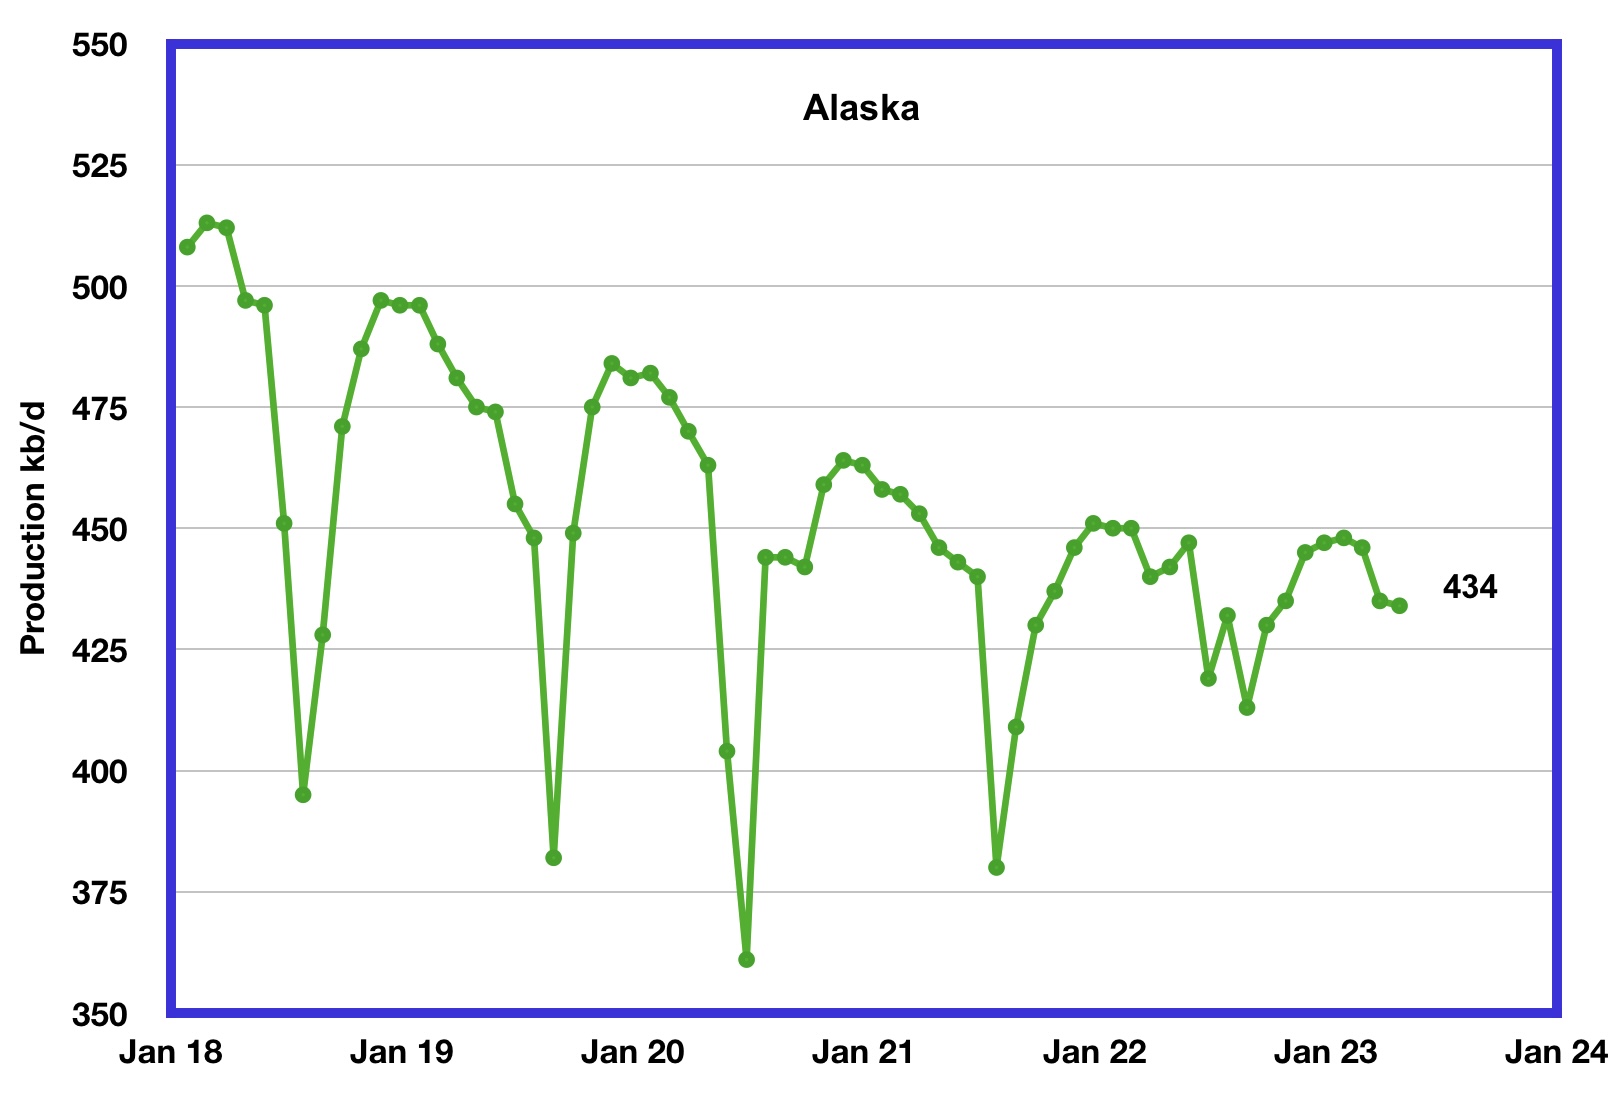
Alaskaʼs April output decreased by 1 kb/d to 434 kb/d. February/March is the beginning of Alaska’s annual production declining phase. However note how the low summer production points in the last two years have been rising.
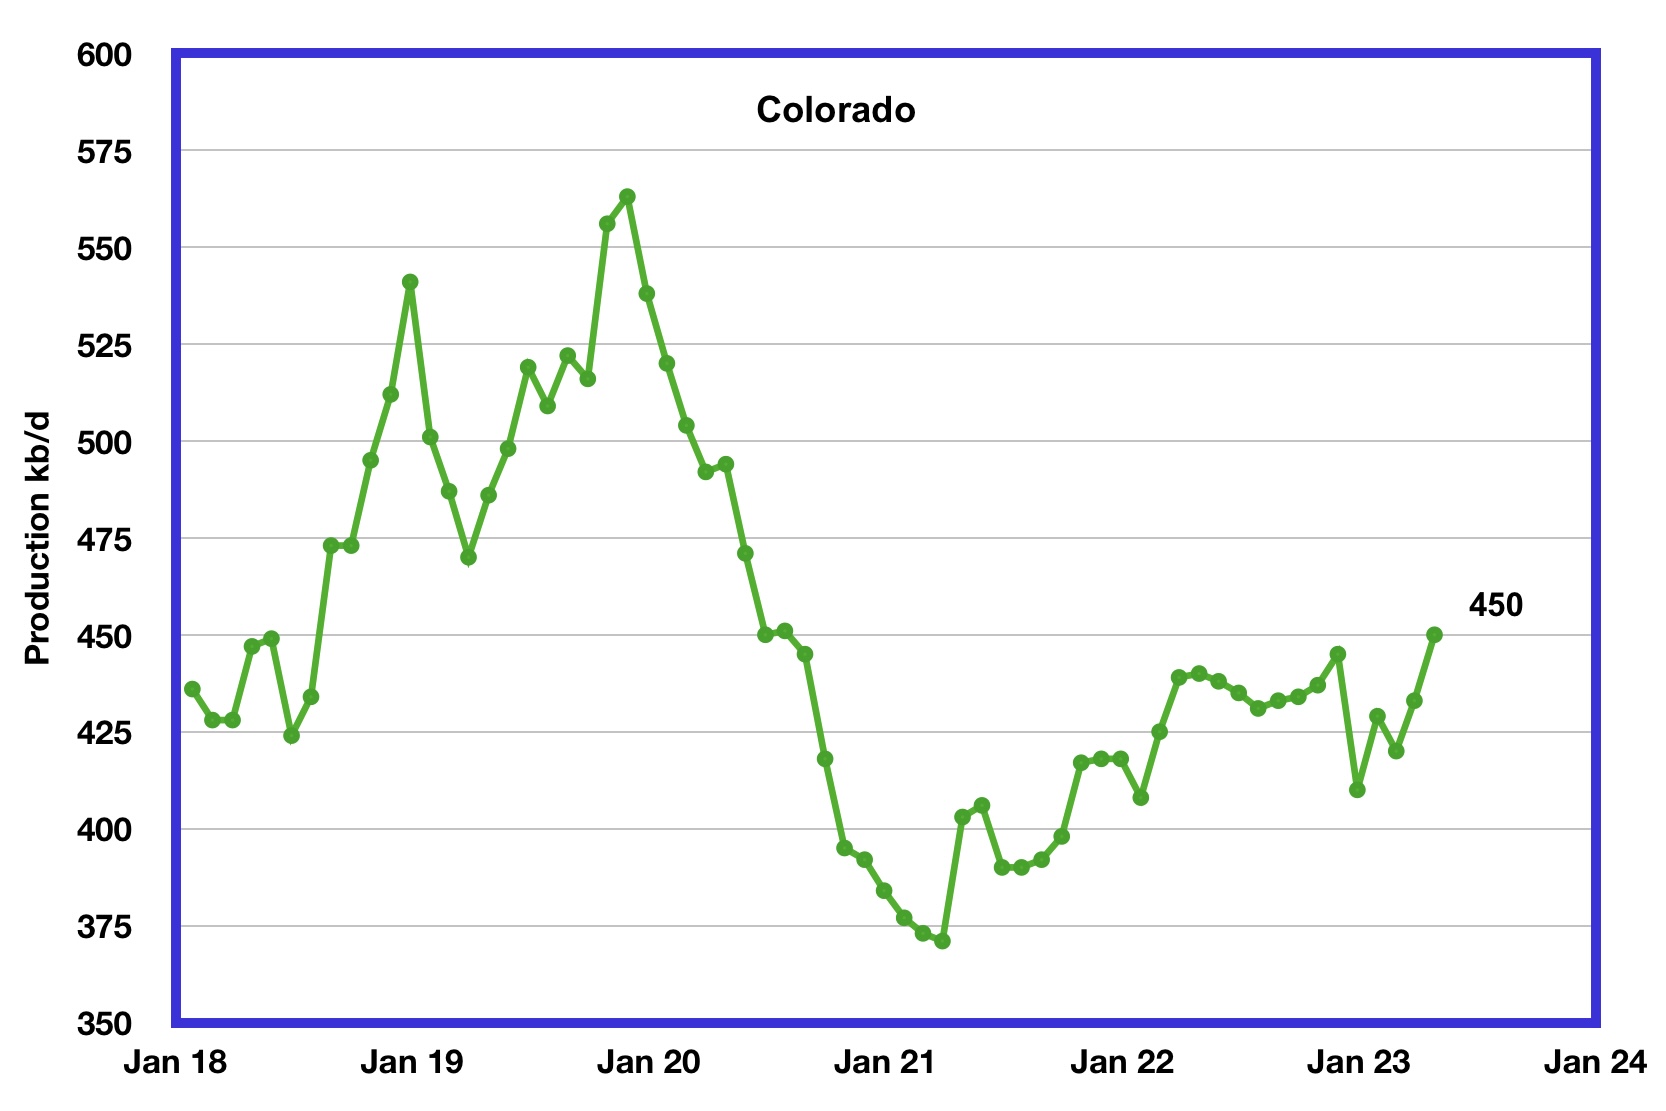
Coloradoʼs April production increased by 17 kb/d to 450 kb/d, a new post pandemic high.
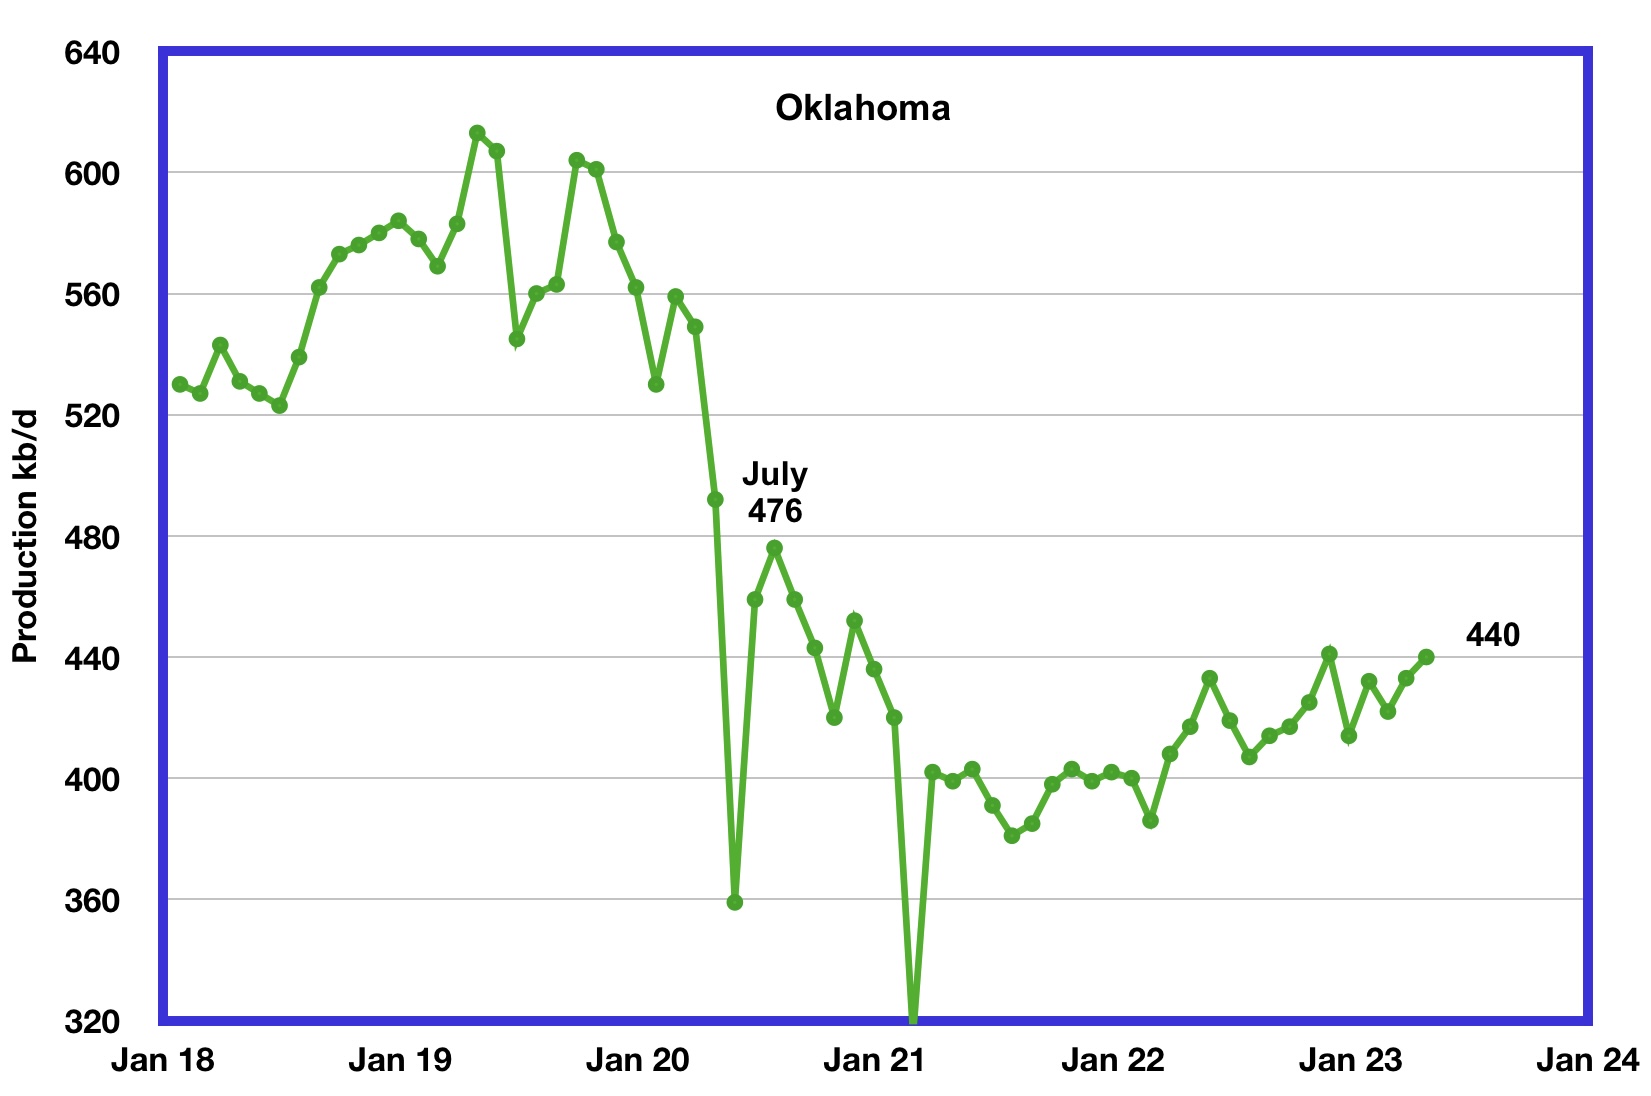
Oklahoma’s output in April rose by 7 kb/d to 440 kb/d. Production remains 36 kb/d below the post pandemic July 2020 high of 476 kb/d.
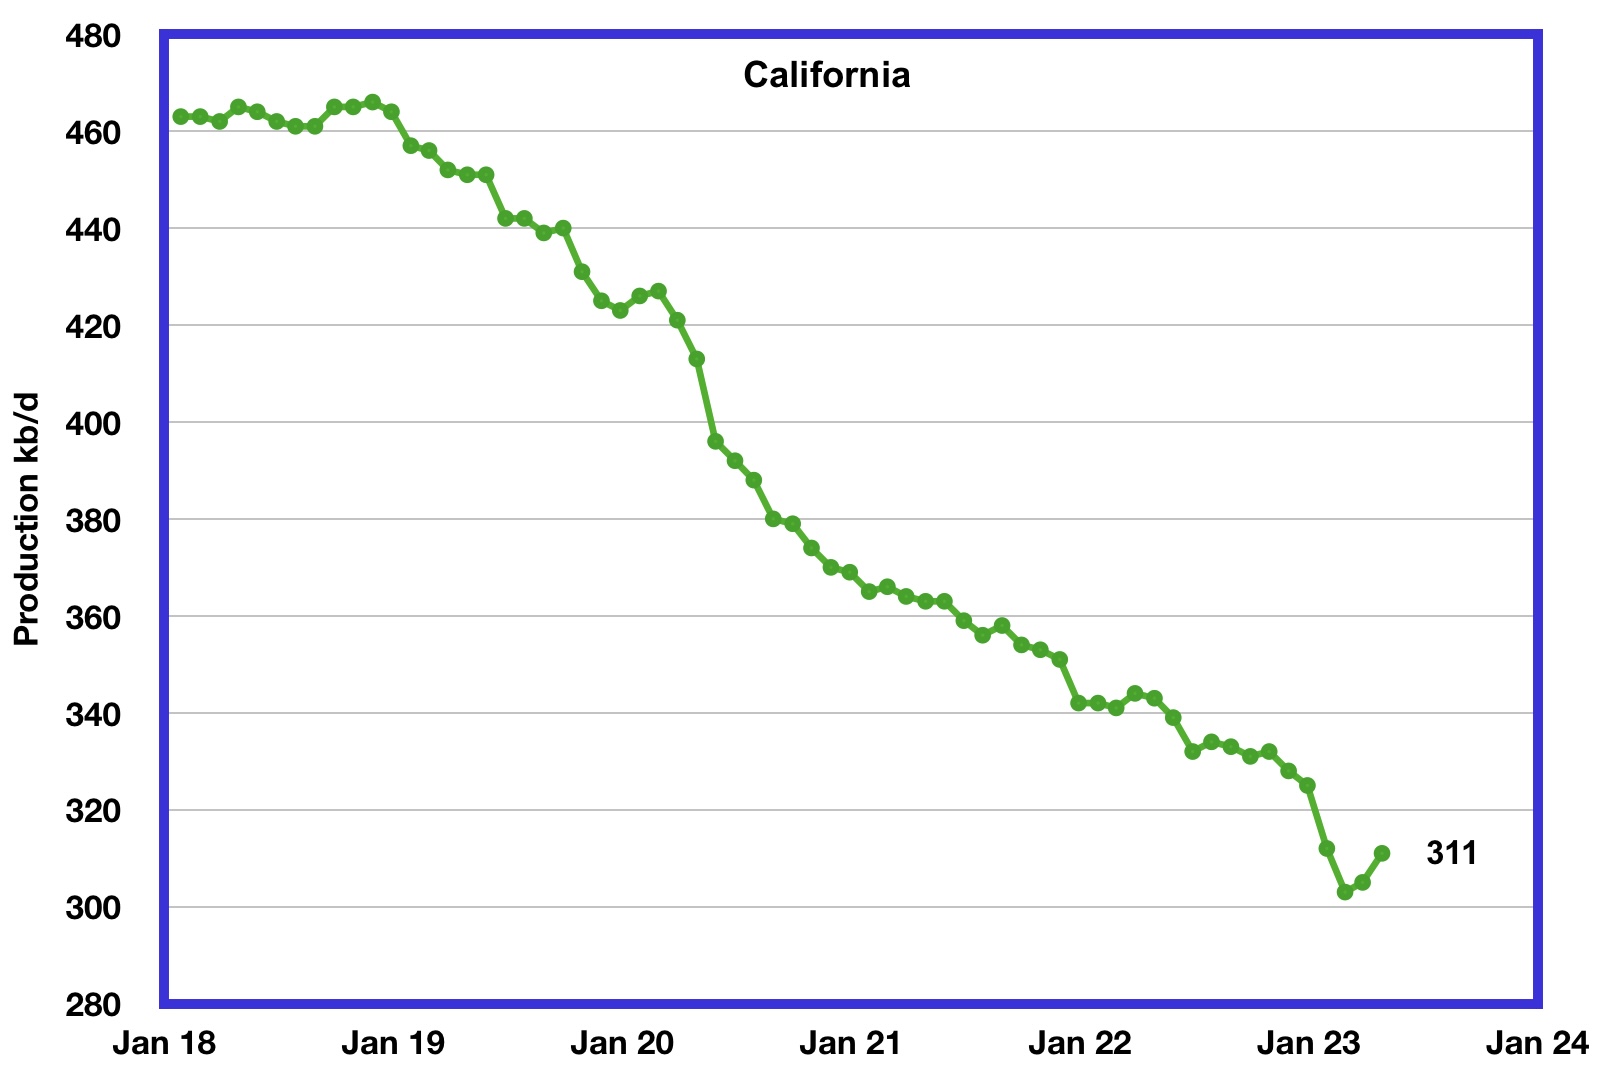
Californiaʼs overall slow output decline trend accelerated in January and February. However for March and April production rose. April output increased by 6 kb/d to 311 kb/d.
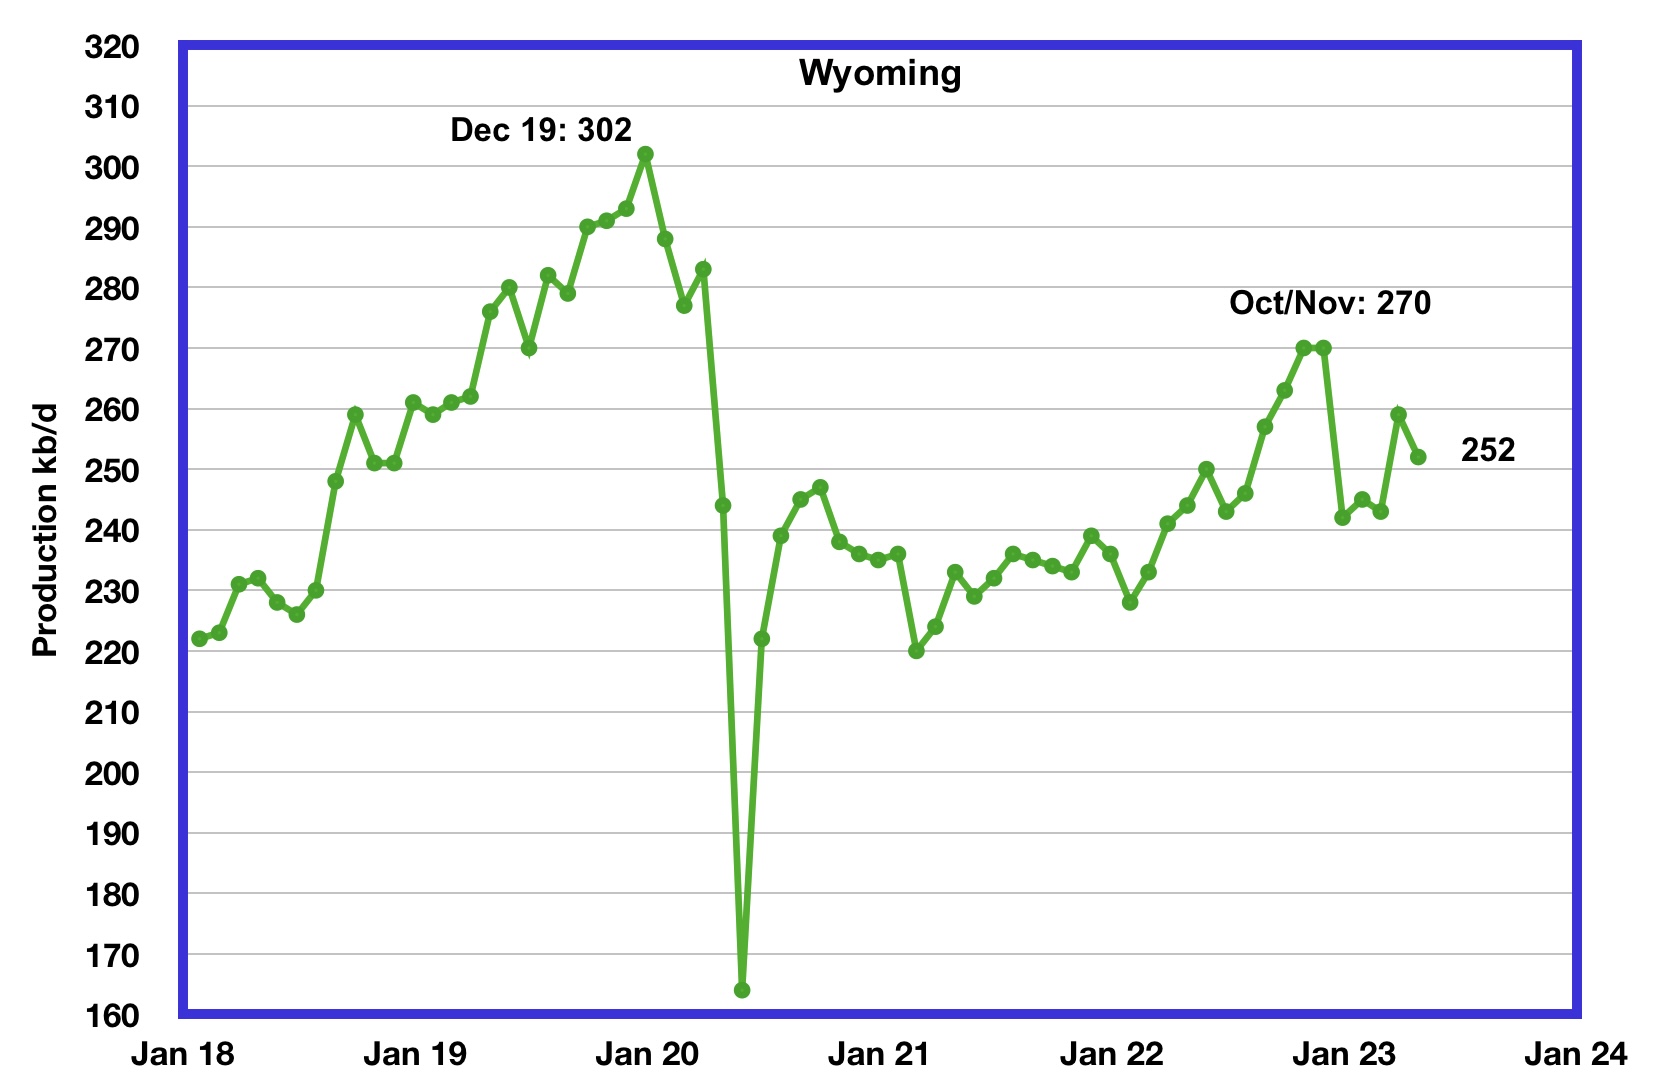
Wyoming’s oil production has been on a slow unsteady uptrend from the low of 220 kb/d in February 2021 due to increased drilling. In October and November 2022 output reached a post pandemic high of 270 kb/d. April’s oil production decreased by 7 kb/d to 252 kb/d.
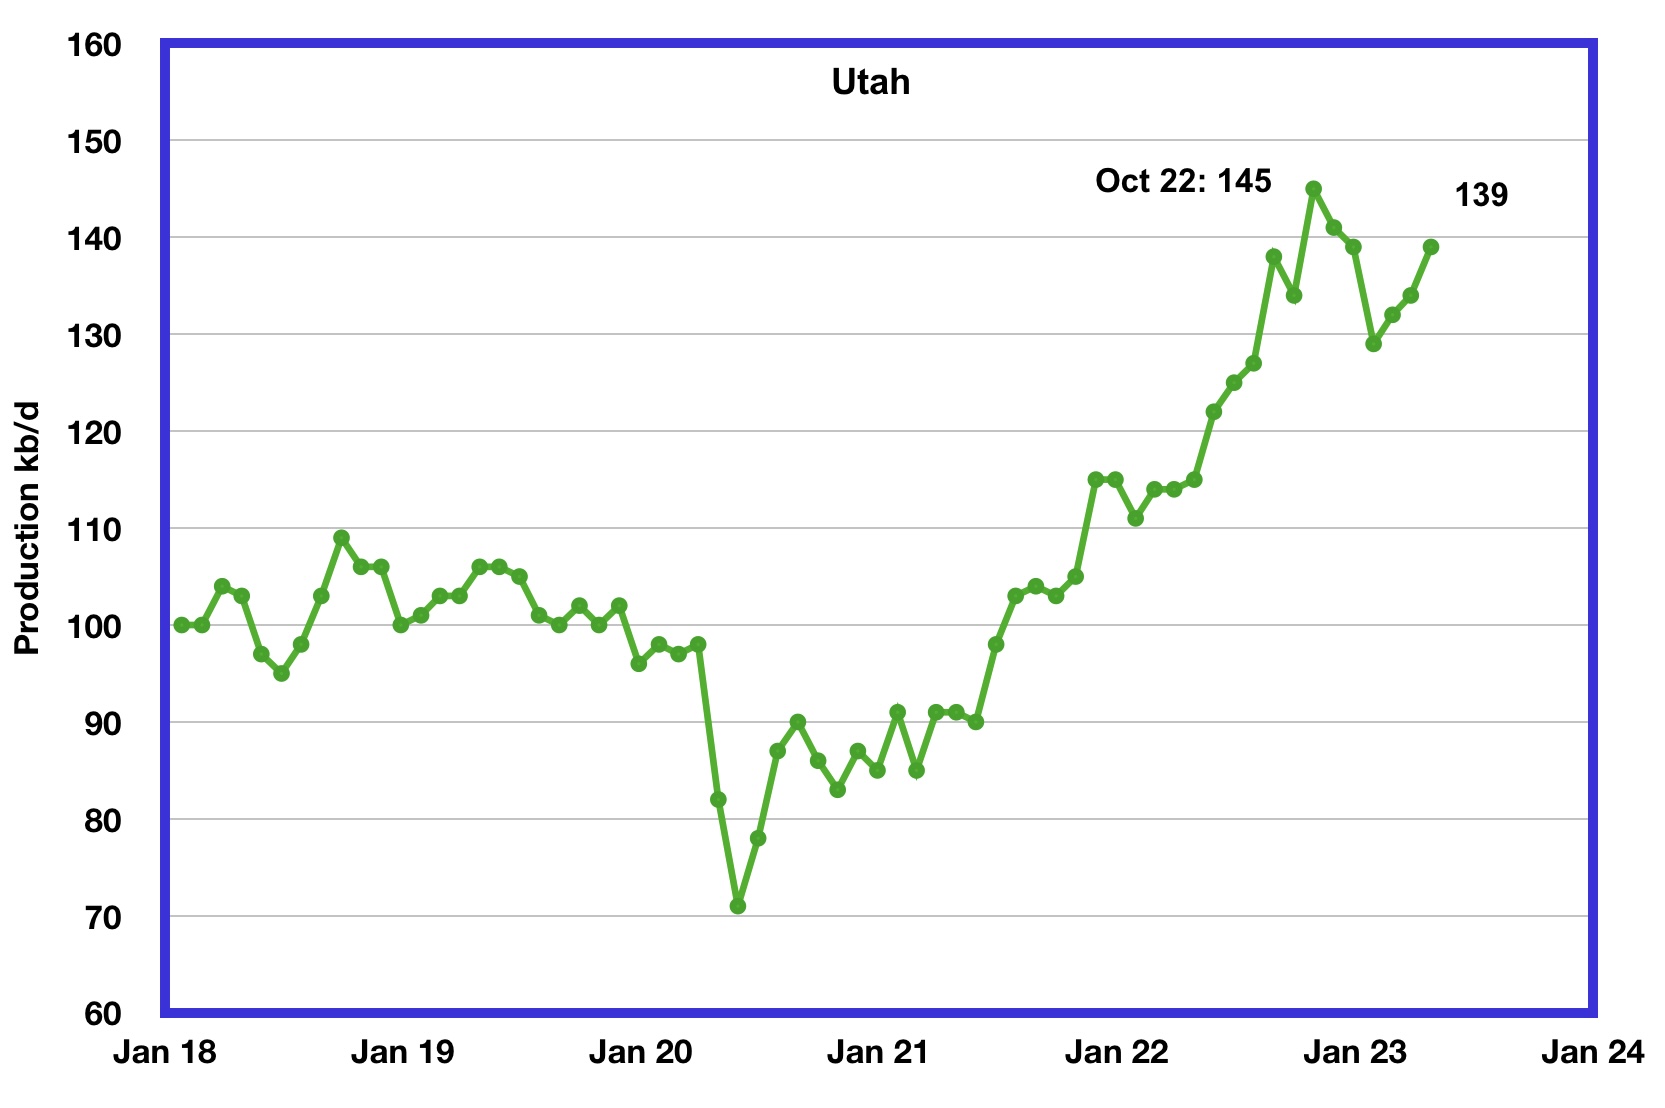
Utah’s oil production reversed its declining trend in February 2023. April’s production increased by 5 kb/d to 139 kb/d and is down 6 kb/d from the October high of 145 kb/d.
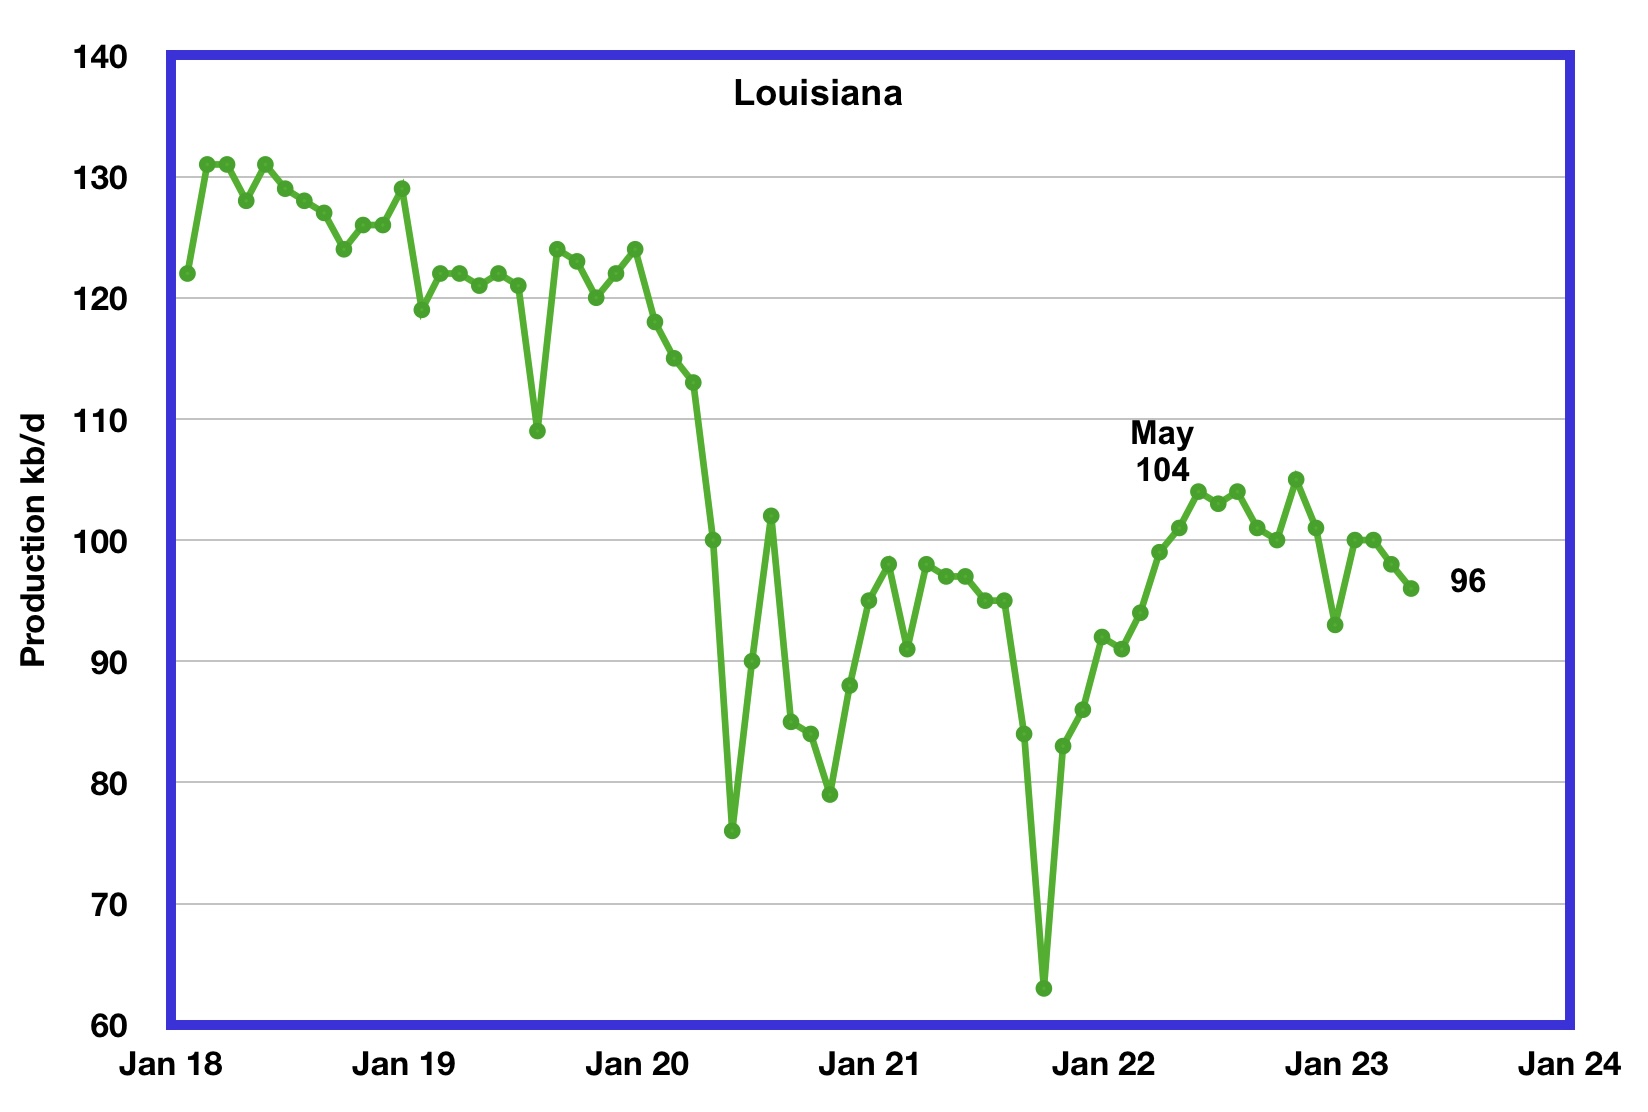
Louisiana’s output rose from the low of 63 kb/d in September 2021 to 104 kb/d in May 2022. Since then output has entered a slow declining phase. April’s production dropped by 2 kb/d to 96 kb/d and is 8 kb/d lower than May 2022.
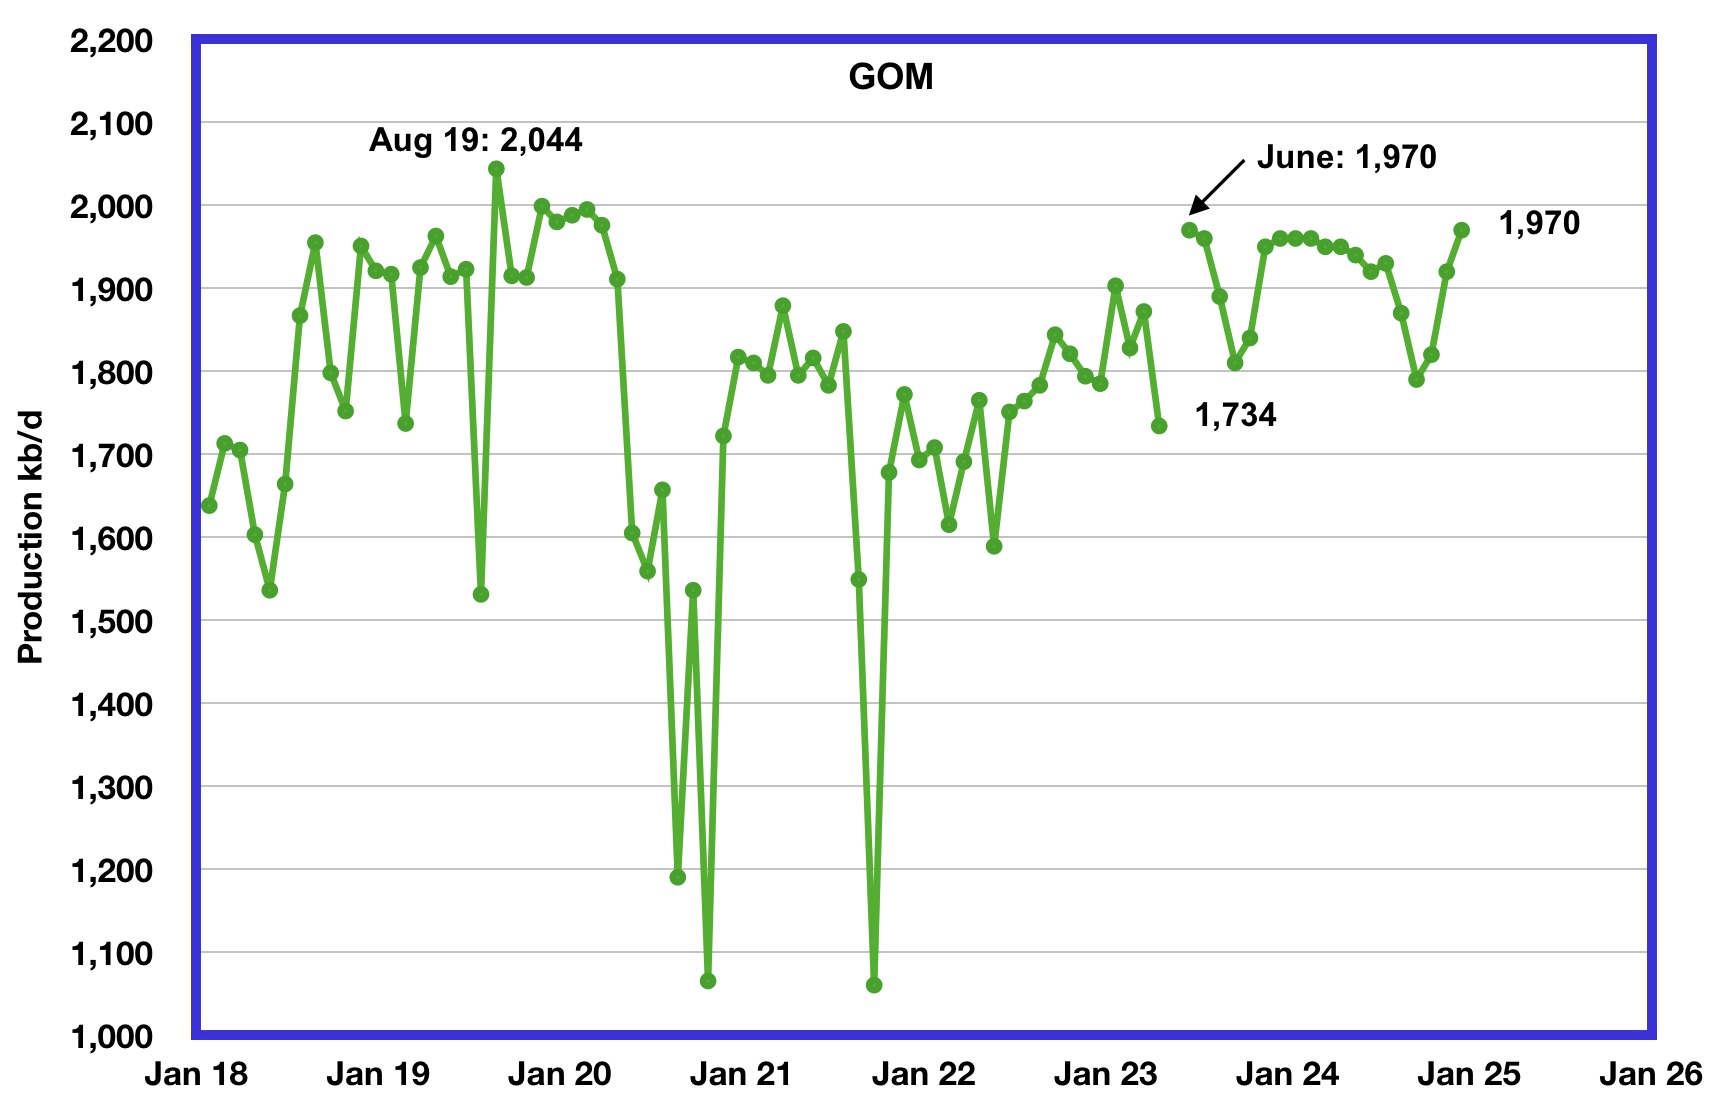
GOM production dropped by 138 kb/d in April to 1,734 kb/d.
The June 2023 STEO projection for the GOM output has been added to this chart and it projects that output in June 2023 will rise to 1,970 kb/d, down by 30 kb/d projected in the May STEO. This could be a reasonable estimate since Shell announced that the Vito platform had begun production on February 15, 2023.
According to this source, GOM production is expected to reach 2,000 kb/d in 2023. However since February , production has dropped and it could be related to problems bringing the Vito platform online.
It is not known if the GOM decline shown after June 2023 is related to extensive maintenance.
A Different Perspective on US Oil Production
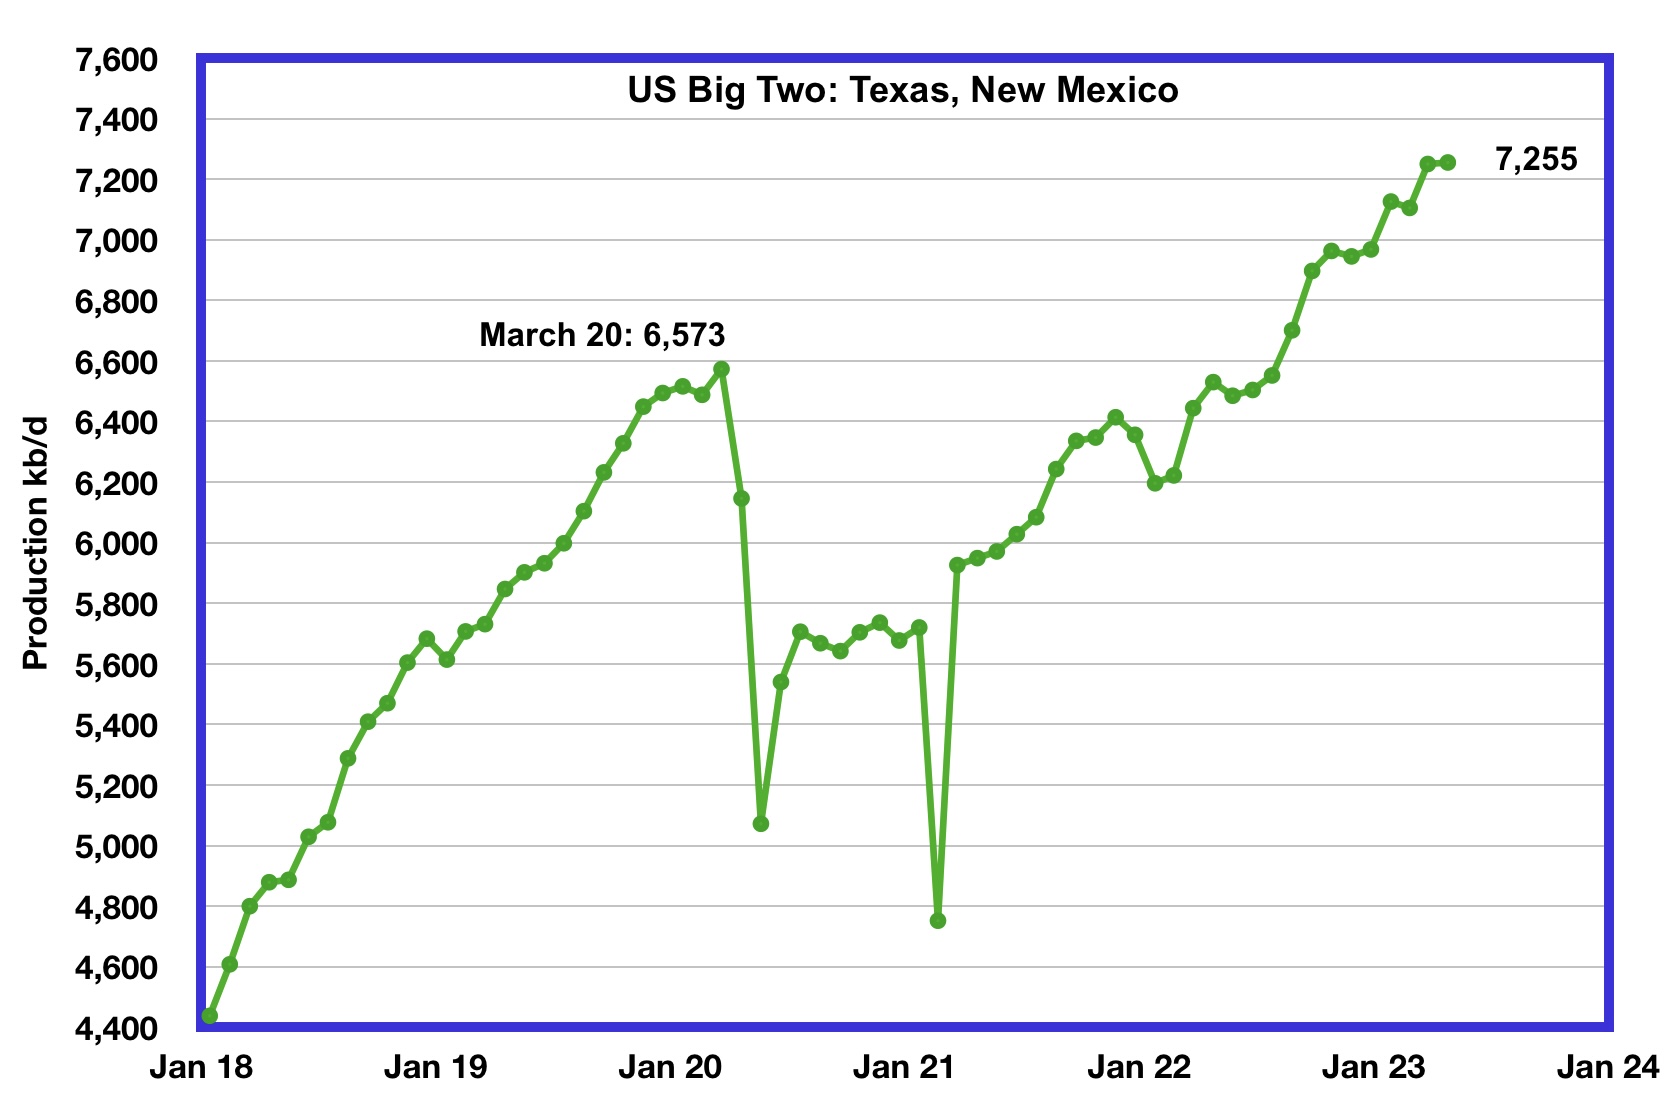
The Big Two states’ combined oil output for Texas and New Mexico.
April’s production in the Big Two states increased by a combined 5 kb/d to 7,255 kb/d with New Mexico contributing 19 kb/d while Texas dropped by 14 kb/d.
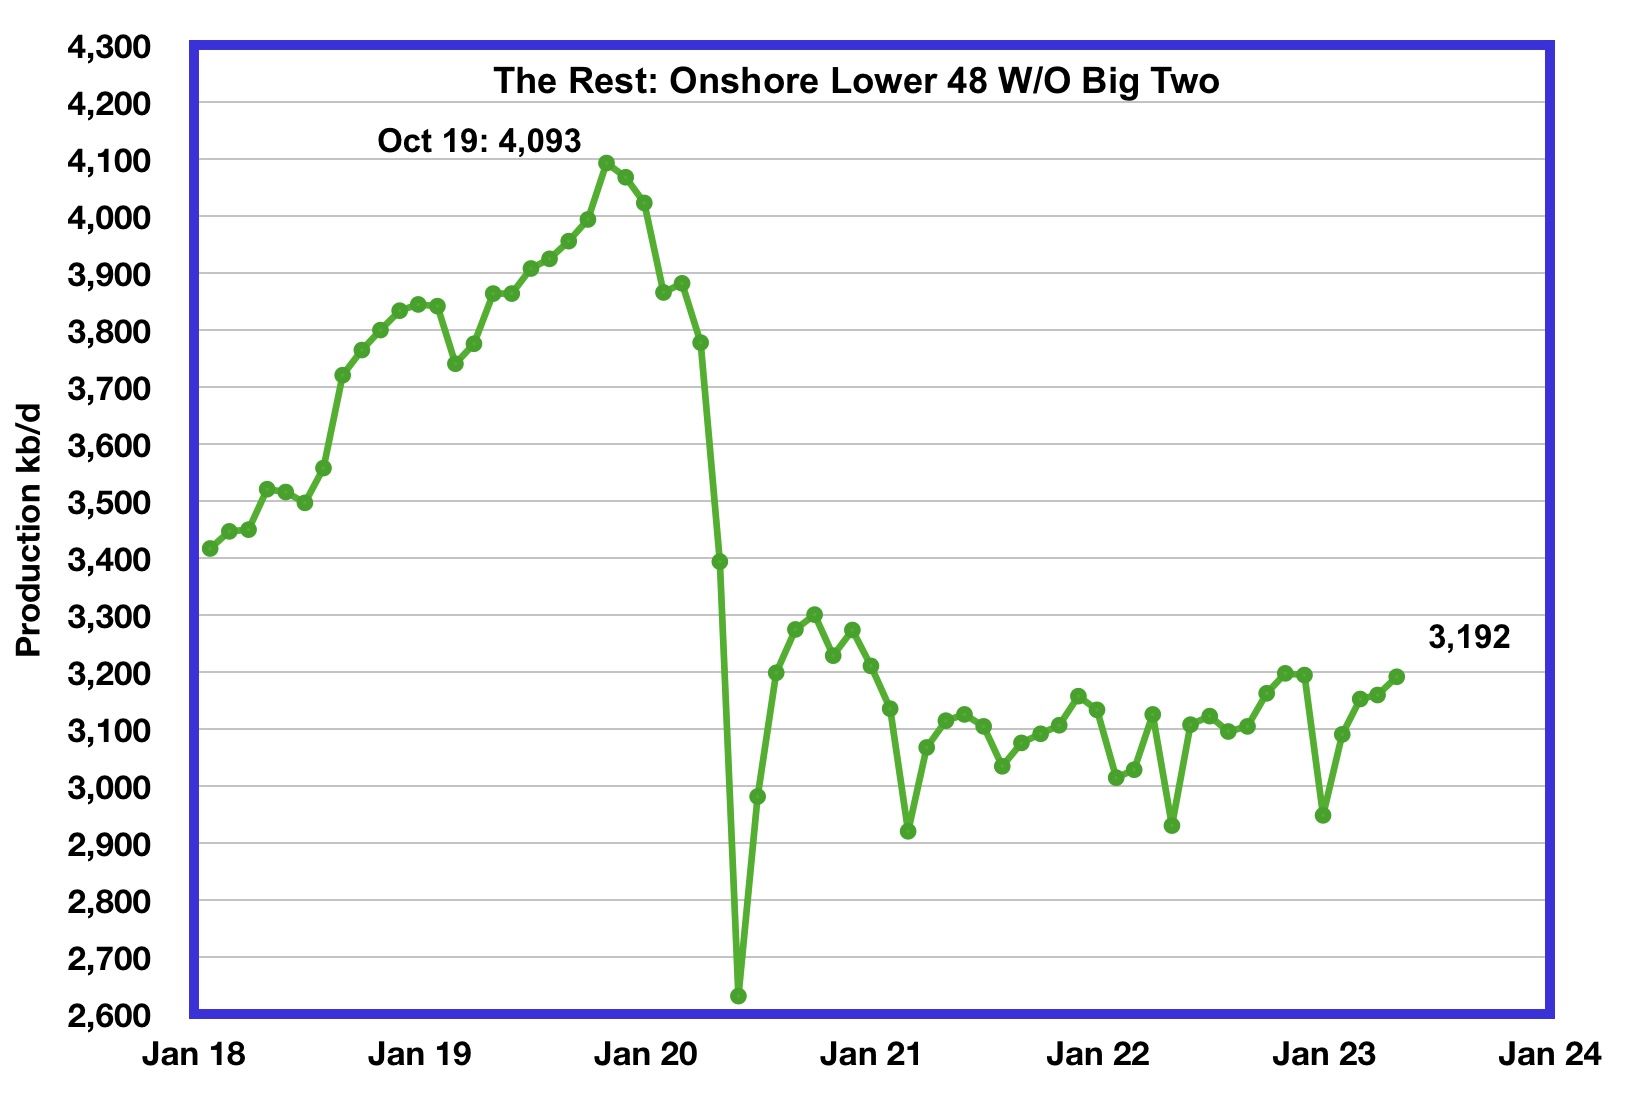
Oil production by The Rest
April production in The Rest rose by 32 kb/d to 3,192 kb/d. From May 2021, oil production in The Rest has been range bound between 3,000 kb/d and 3,200 kb/d and has not given any clear indication of being in decline or rising.
The main takeaway from The Rest chart is that current production is 901 kb/d below the high of October 2019. The question that needs answering is “Is this a permanent loss that will never be recovered?” All indications continue to be that this is a permanent loss.
Weekly Frac Spread Count
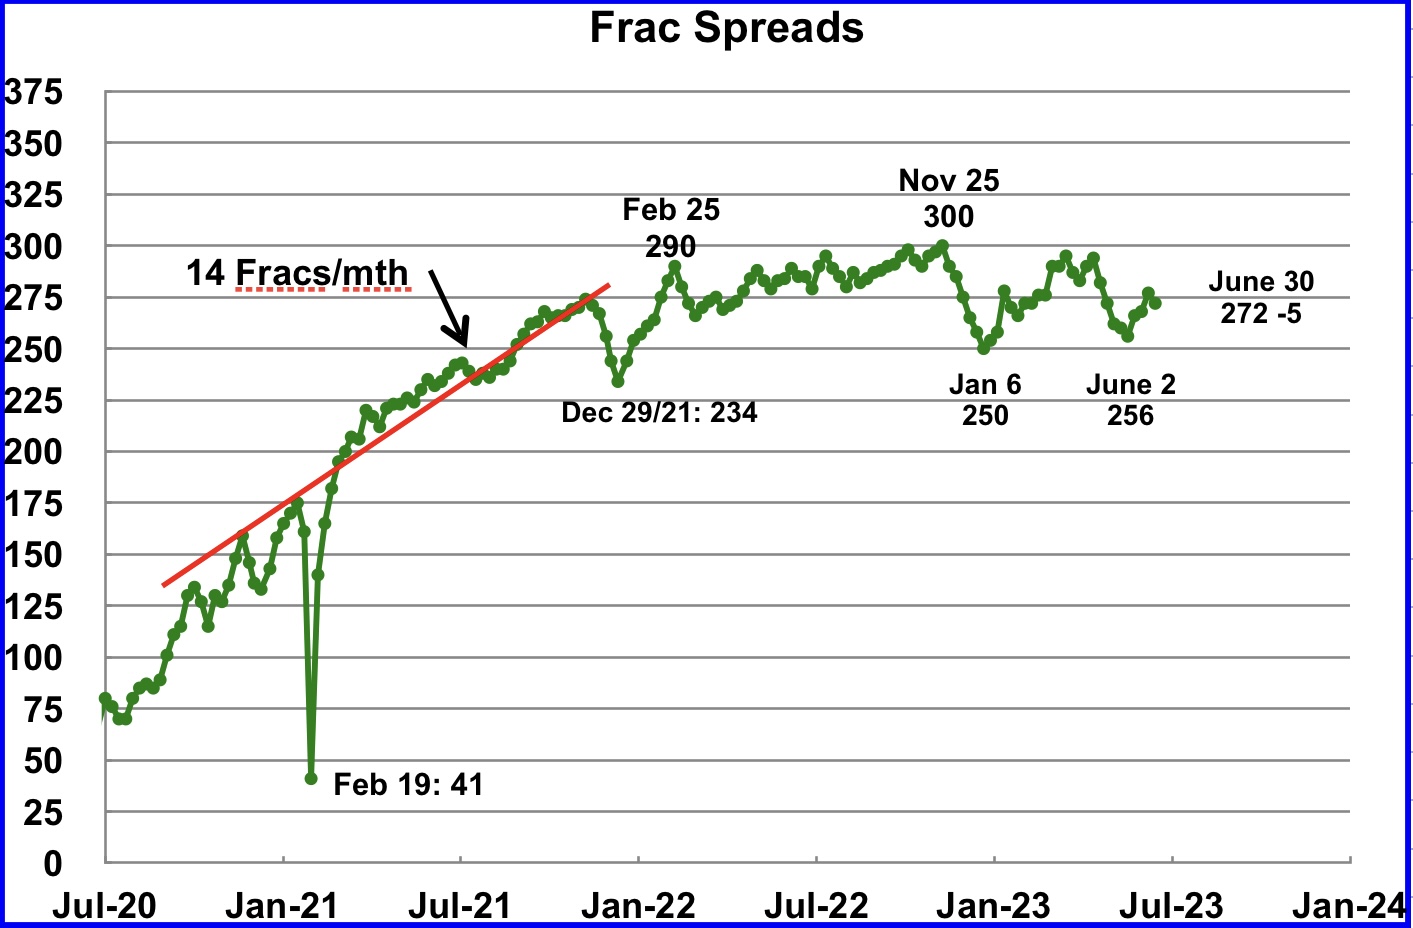
Since January 2022, the frac spread count has wandered between 250 and 300 fracs per week. For all of 2022 the average weekly frac count was 280.
Frac spreads have been rising from the low of 256 in the week ending June 2 and rose to 277 in the week ending June 23. For the week ending June 30, the frac count dropped by 5 to 272 and is down 28 from the high of 300 in November 2022. The current count is slightly lower than the 2022 average of 280 frac spreads per week.
Note that these 272 frac spreads include both gas and oil spreads.
Drilling Productivity Report
The Drilling Productivity Report (DPR) uses recent data on the total number of drilling rigs in operation along with estimates of drilling productivity and estimated changes in production from existing oil wells to provide estimated changes in oil production for the principal tight oil regions. The June DPR report forecasts production to July 2023 and the following charts are updated to July 2023. The DUC charts and Drilled Wells charts are updated to May 2023.
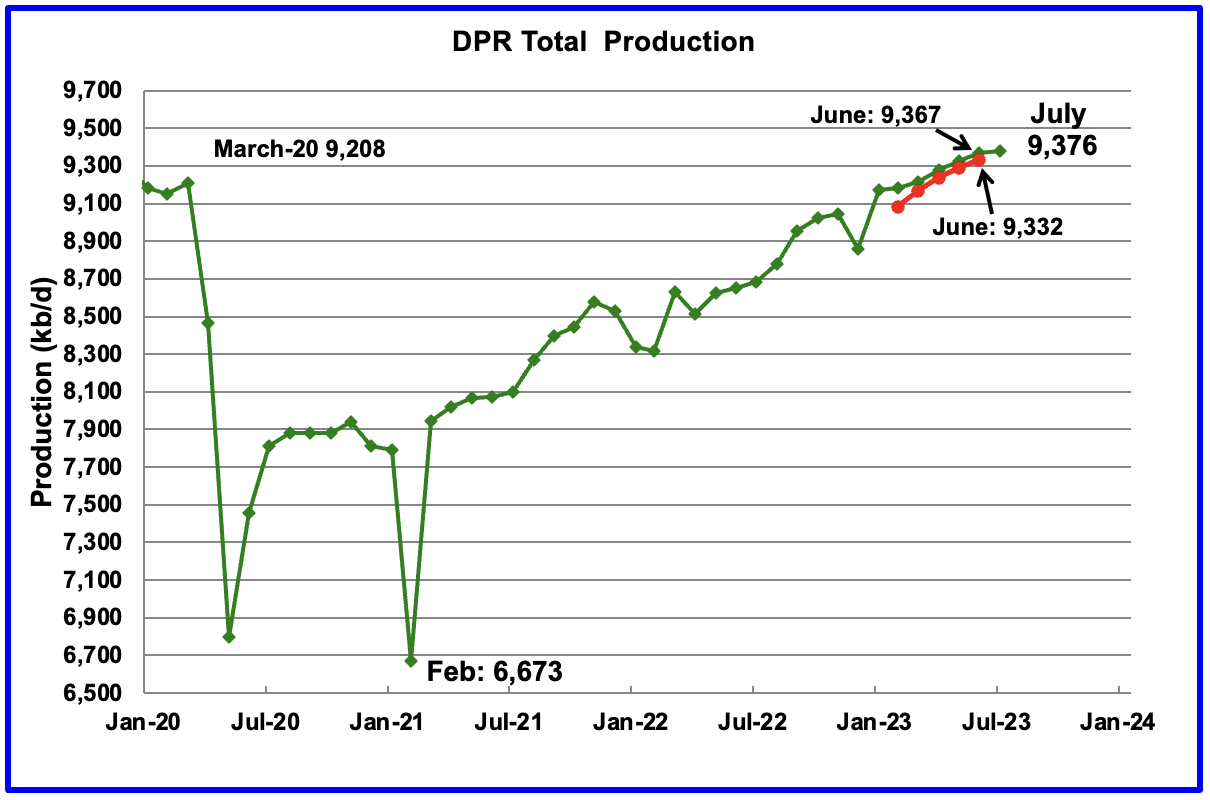
Above is the total oil production projected to July 2023 for the 7 DPR basins that the EIA tracks. Note that DPR production includes both LTO oil and oil from conventional wells.
The June DPR production report increased/revised production over the last few months by roughly 35 kb/d to 45 kb/d over the May report. For instance, June output in the May report, red markers, was revised up by 35 kb/d from 9,332 kb/d to 9,367 kb/d. The DPR is projecting that oil output for July 2023 will increase by 9 kb/d to 9,337 kb/d, a new all time high. However the monthly increase was the smallest since last February when production increased by 13 kb/d and continues the rolling over/plateauing production trend that began six months ago. Also see next chart.
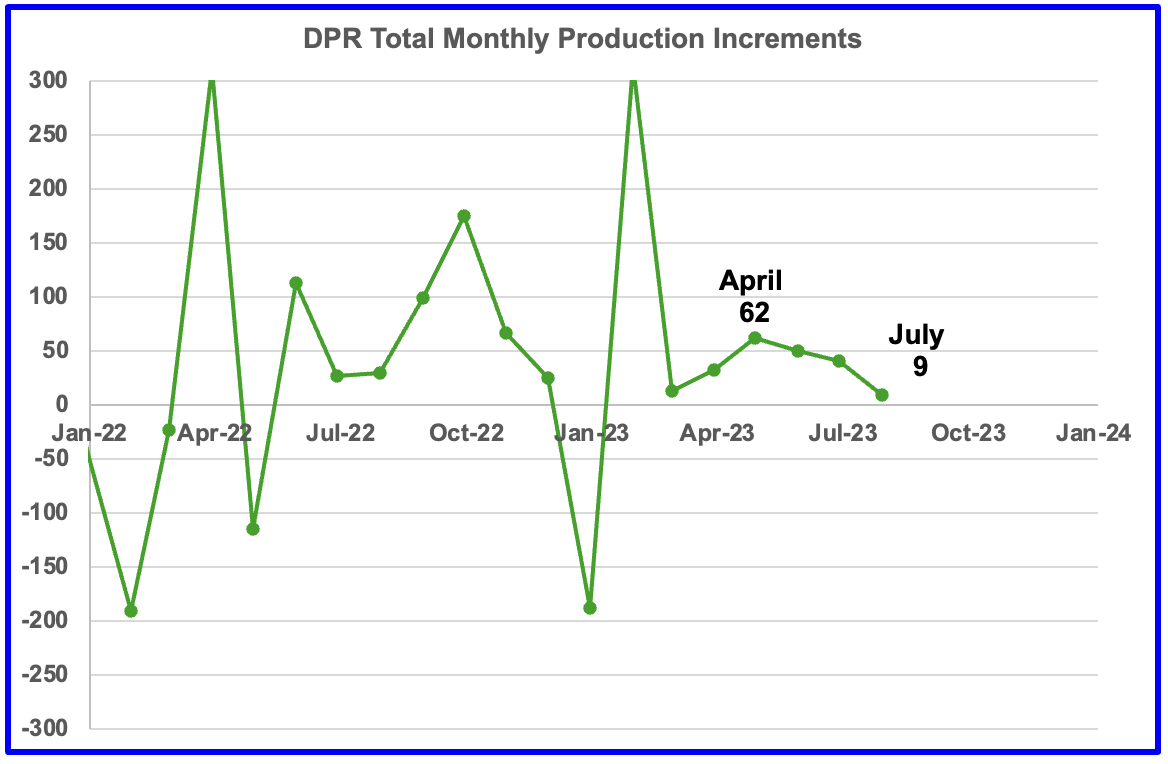
This chart shows the DPR total production increments tracked on a monthly basis. What is notable is the reduced month to month volatility since February 2023. The January 2023 spike is due to the weather related December oil production drop.
The more interesting trend to notice is the declining monthly changes in the production rate. April’s production increase was 62 kb/d while July’s increase dropped by 53 kb/d to 9 kb/d. This short term production rate trend is hinting at an upcoming plateau in Permian production, since it is the dominant producer.
The issue is whether this slowing trend is the result of management’s decision on how to deploy its revenue, investors vs production increase, or is it related to geology, fewer Tier 1 locations along with the Permian gassing out and last but not least the current price of WTI, bouncing around $70/b?
This source suggests that management has decided on how best to deploy its revenue, i.e. less drilling:
“Muted increases in U.S. oil production and cuts by the OPEC+ producing-nations group will limit crude supply in the months ahead, pushing up prices, an executive at U.S. shale producer EOG Resources (EOG.N) said on Wednesday.
U.S. energy firms have cut domestic oil and gas drilling activity to the lowest level since April 2022 with declines from Texas to Pennsylvania. Analysts expect further cuts this year with oil and gas prices off from last year’s strong levels.”
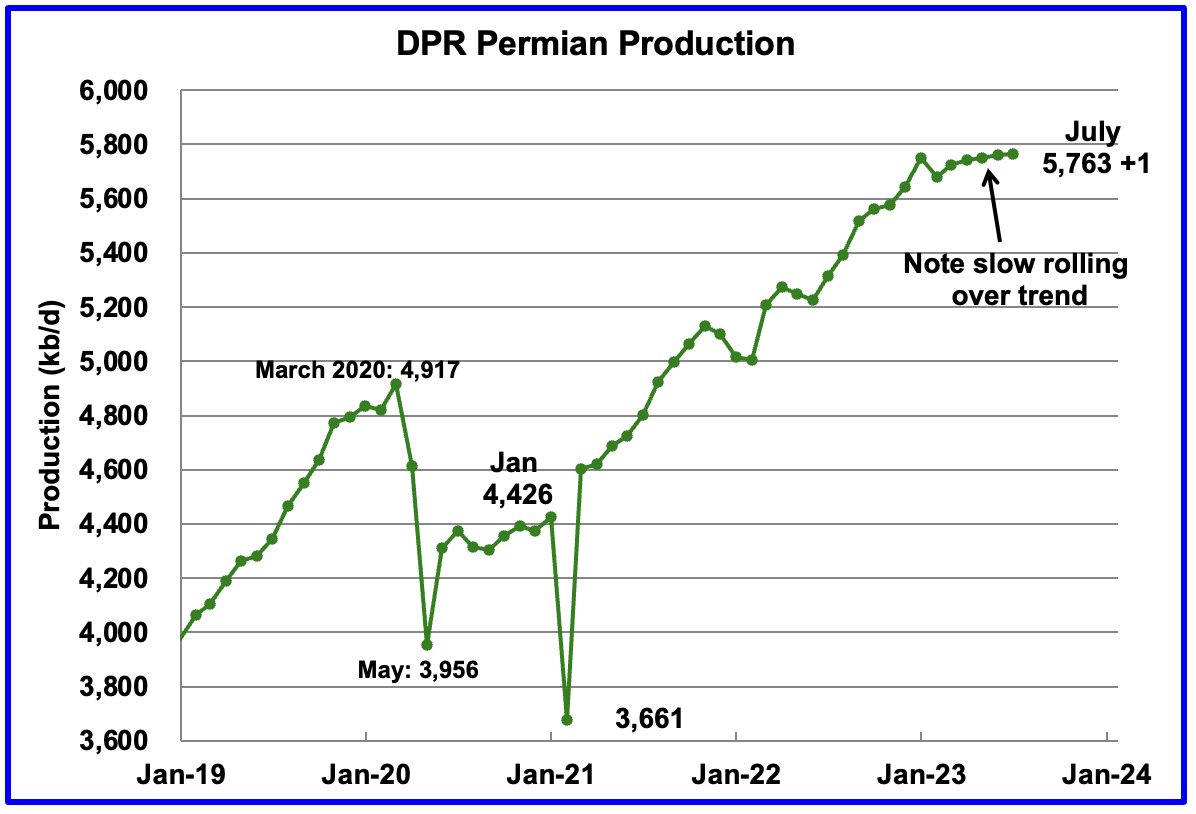
Permian output continues to rise in July. It is expected to increase by 1 kb/d to 5,763 kb/d. The last six months of production data clearly shows a slowing in monthly production increases, similar to the trend noted above for the total production for the DPR regions.
July’s output is 846 kb/d higher than the pre-pandemic high 4,917 kb/d.
During May, 466 wells were drilled and 495 were completed in the Permian. (Note that May is the latest month for DUC information). The completed wells added 368 kb/d to May’s output for an average of 744 b/d/well. The overall decline was 359 kb/d which resulted in a net increase for Permian output of 9 kb/d. Of the 495 completed wells, 483 were required to offset the decline.
Note: The additional 12 wells over those required to offset decline only added 9 kb/d to overall production in May, less than 1 kb/d per well.
A more detailed review of production in the Permian is included in the Goehring and Rozencwajg section further down.
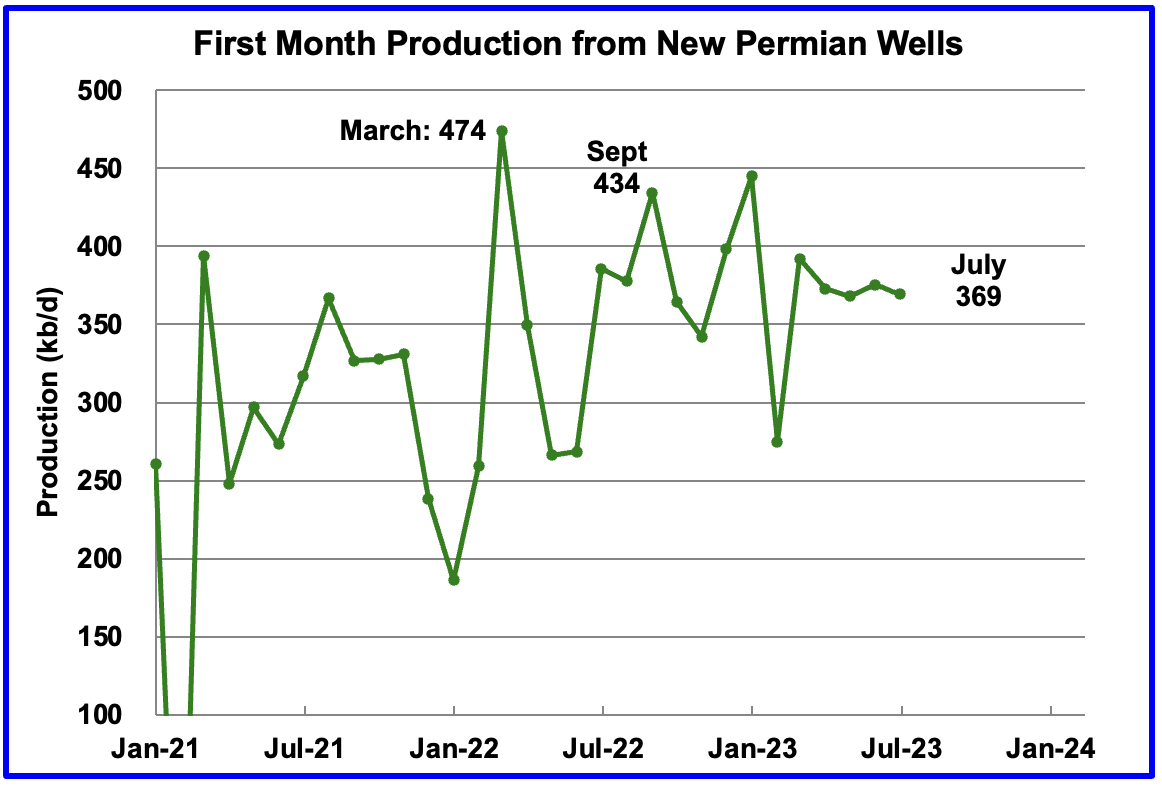
This chart shows the average first month total production from Permian wells tracked on a monthly basis. The total monthly production from the newest Permian wells in July continues to be at the 370 kb/d level. Production has bounced around 370 kb/d for the last four months. To achieve that production level in July, drillers probably completed a few more wells than were drilled, based on historical drilling and completion data up to May 2023.
The first month DPR production rate of 369 kb/d is very close to that published by Novi Labs in the April 2023 Permian production update. See next chart.
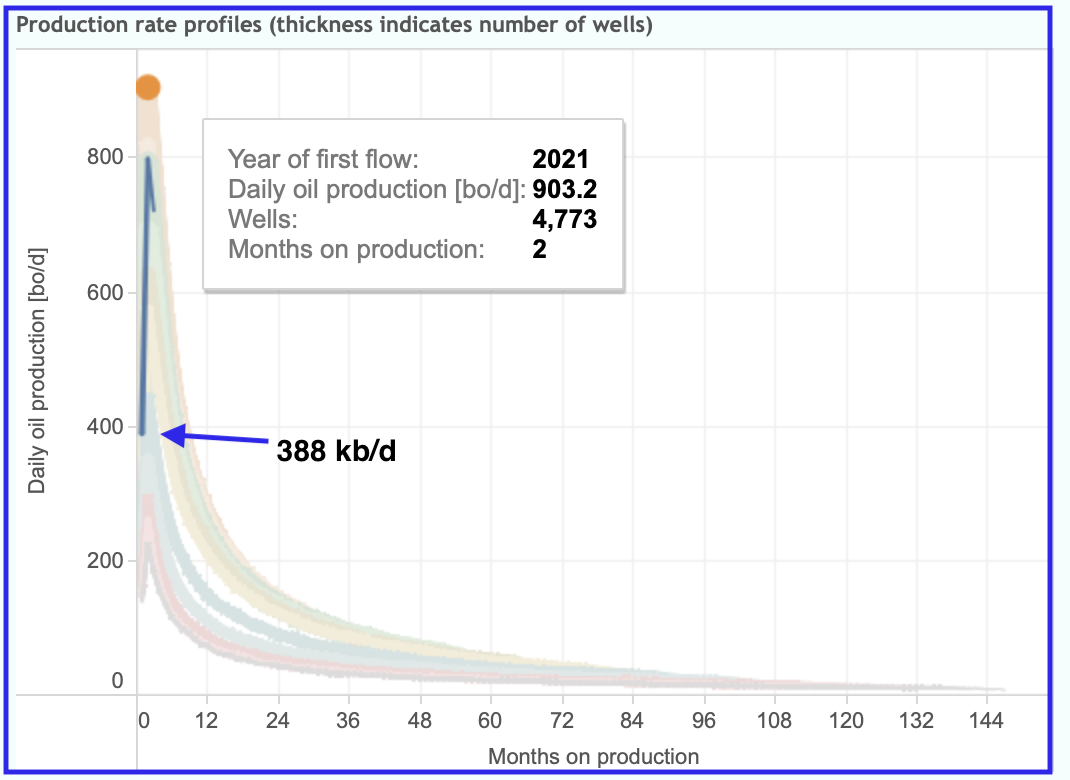
This chart taken from Novi Labs shows that the average first month flow rate of 2023 Permian wells is 388 kb/d, blue graph, which compares well with the DPR July estimate of 369 kb/d shown in the previous chart.
Of greater interest may be the peak production rate for the 2021 wells, 903.2 kb/d, orange marker, compared to the high point of the blue graph. Peak production in the second month for the 2023 wells is 797 kb/d vs 903 kb/d for the 2021 wells, a drop of 106 kb/d.
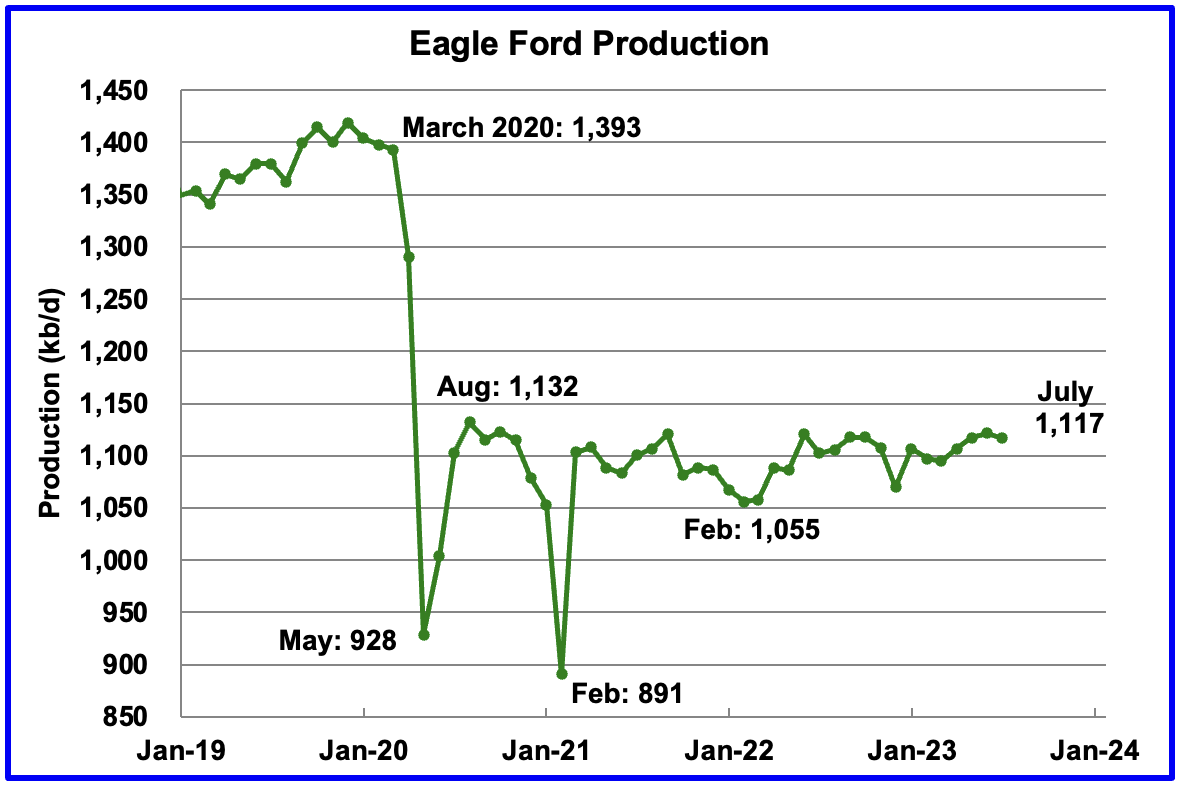
Output in the Eagle Ford basin has been in a generally flat trend since March 2021, fluctuating over a range of between 1,050 kb/d to 1,150 kb/d. July’s forecast output is little changed and is expected to decrease by 5 kb/d to 1,117 kb/d.
At the beginning of the year 2023, 68 rigs were operating in the Eagle Ford basin. The rig count began to drop in mid March to 60 and dropped further to 58 in Mid June.
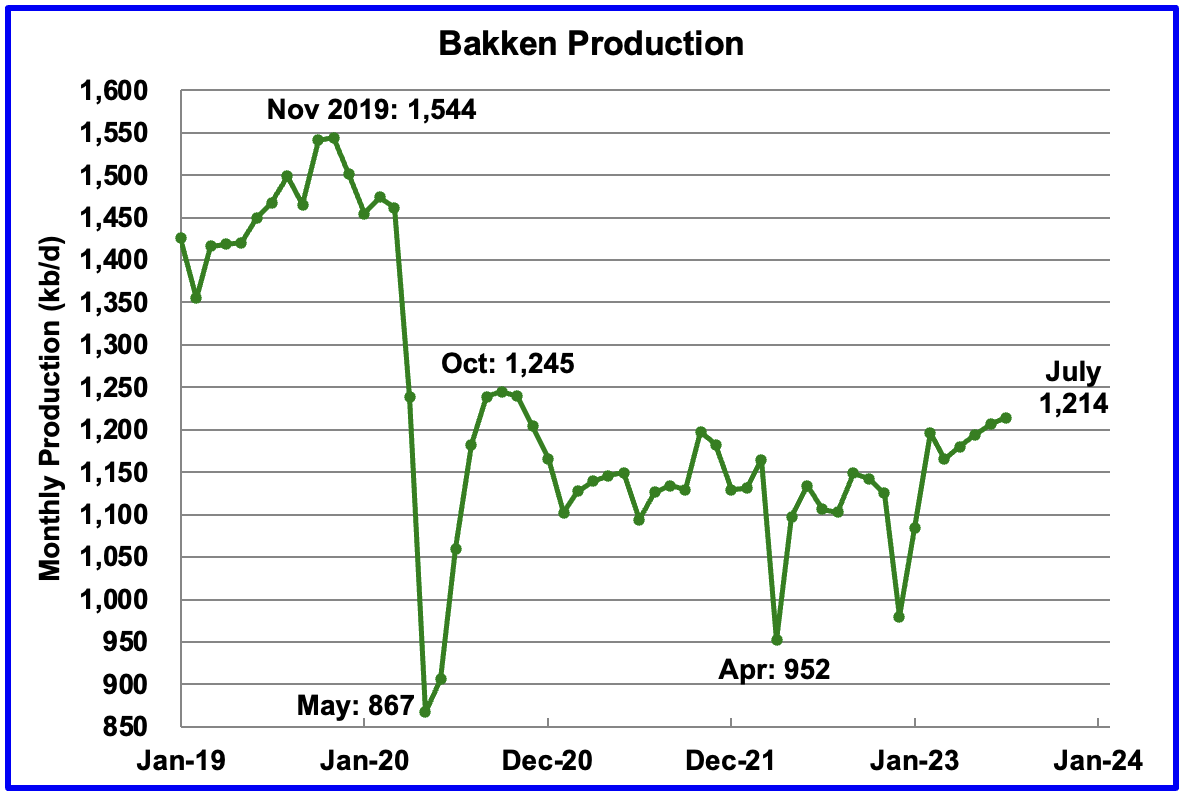
The DPR forecasts Bakken output in July will be 1,214 kb/d an increase of 7 kb/d over June.
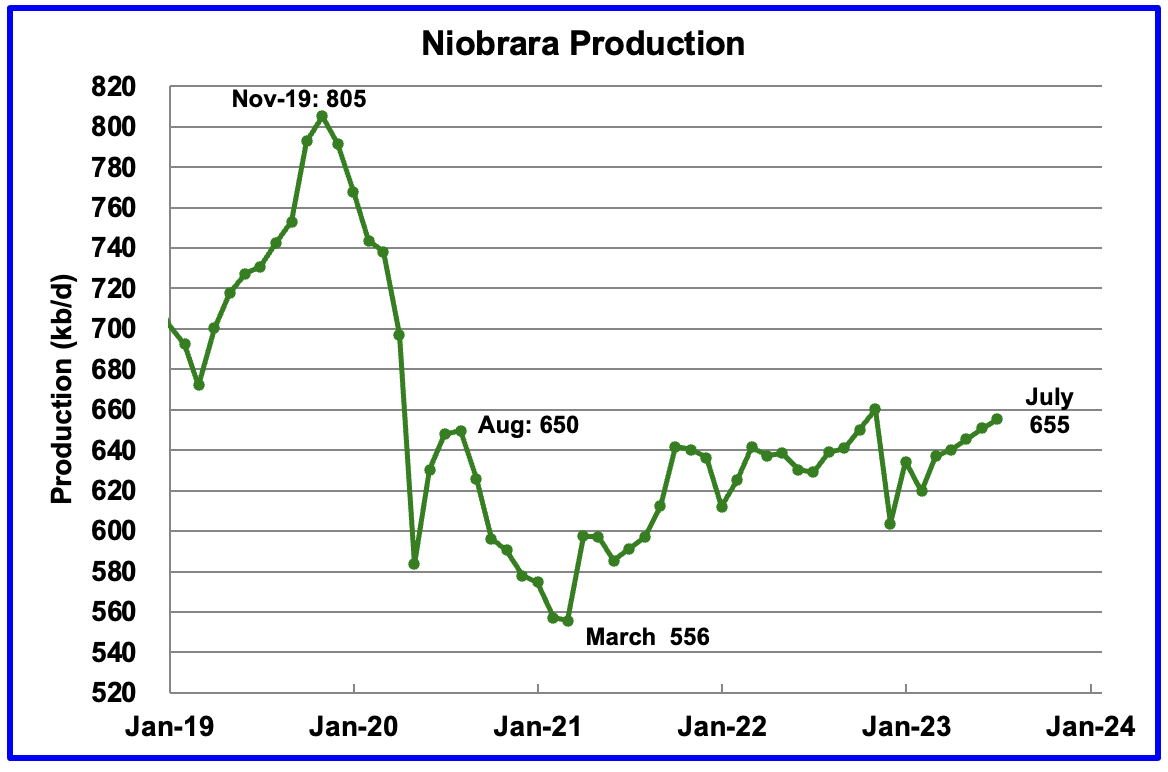
Output in the Niobrara continues to increase slowly. July’s output increased by 4 kb/d to 655 kb/d.
Production increased due to the addition of rigs into the basin but stabilized at 16 ± 1 rigs in March and April. However in May and June the rig count dropped to 13.
DUCs and Drilled Wells
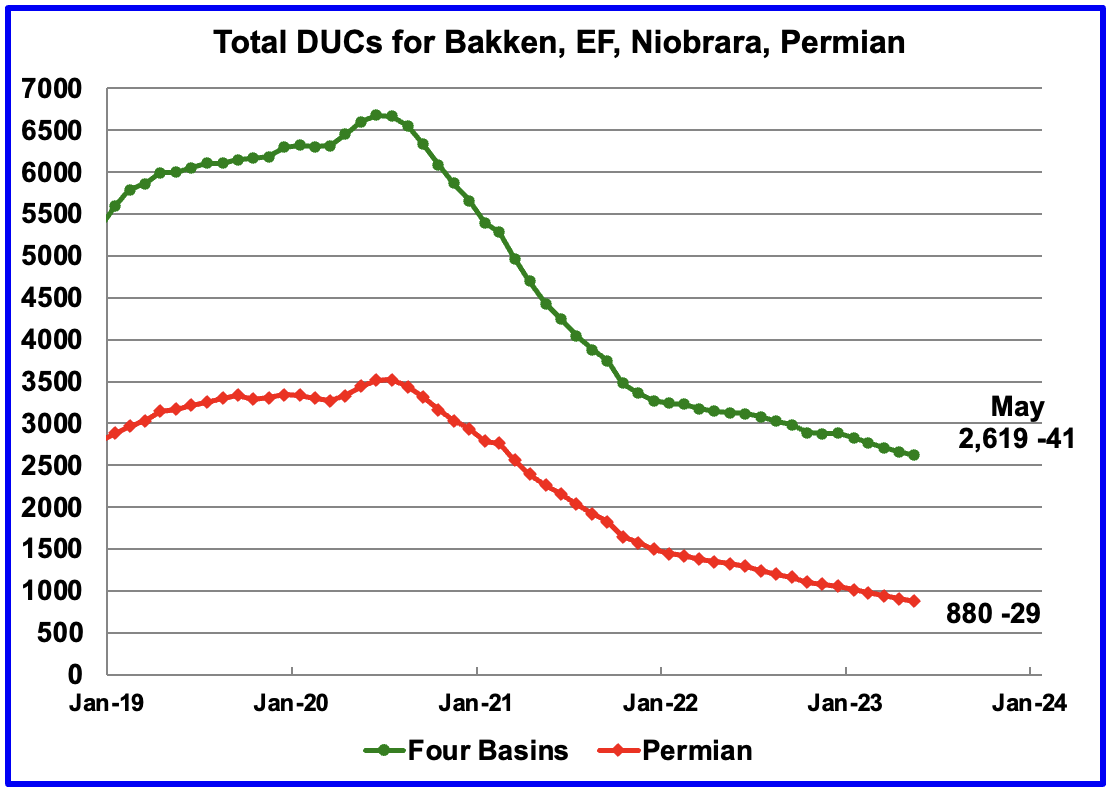
The number of DUCs available for completion in the Permian and the four major DPR oil basins has fallen every month since July 2020 and continued to decrease in May. May DUCs decreased by 41 to 2,619. The biggest decrease came from the Permian where DUCs decreased by 29 while Bakken DUCs dropped by 10, Eagle Ford by 8 and the Niobrara added 6.
May Permian DUCs decreased by 29 to 880 because 466 wells were drilled and 495 were completed.
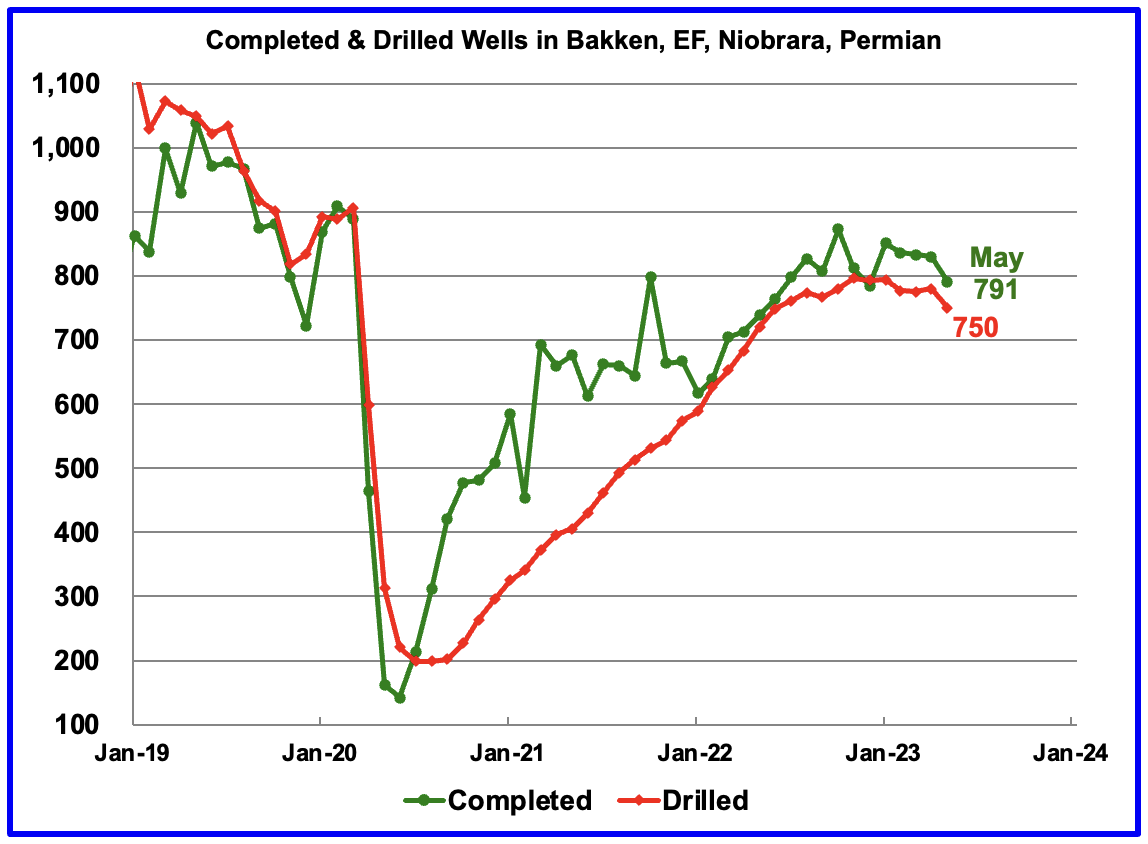
In these 4 basins, 750 wells were drilled while 791 were completed for a net decrease of 41 DUCs in May. Both drilled wells and completions are down from higher levels in late 2022.
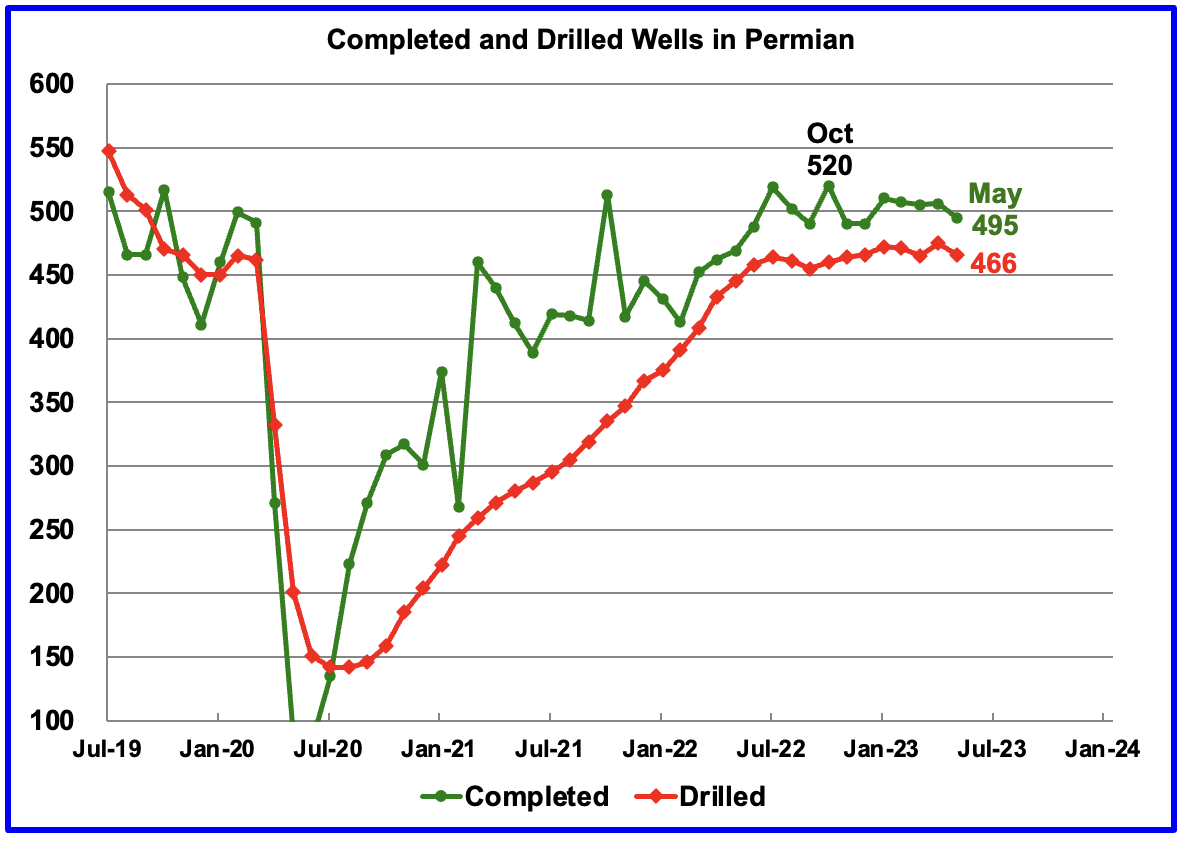
In the Permian, the monthly completion rate has been showing signs of slowing since the October high of 520 but May showed a large drop. This is consistent with the frac spread chart shown above where there has been slow growth in frac spreads since February 2022 and then a sharp drop starting in April. The number of wells drilled in the Permian is now showing signs of plateauing in the 465 to 470 range.
In May 495 wells were completed, a decrease of 11 since April. During May, 466 new wells were drilled, a decrease 9. The gap between completed and drilled wells in the Permian has now opened up by 29.
The Permian, as of May, had 880 DUCs remaining and the completion rate was 495 wells/mth. This means that the current cycle time between drilling and completions is 1.77 months or 54 days.
Comment on 2023.Q1 Goehring and Rozencwajg Report
This report starts with the following two paragraphs which is a summary of what the authors believe.
“Conventional oil production has now unequivocally rolled over. Unconventional production, the only source of growth in global oil supply over the last 12 years, has also significantly slowed. The only growing non-OPEC basin is the Permian in West Texas. Never before has oil supply growth been so geographically concentrated. Six counties in West Texas are now 100% responsible for all global production growth.
Conventional non-OPEC oil production peaked in 2007 at 46.2 mm b/d and now stands at 44.2 mm b/d – 4% below its peak. Including OPEC, conventional global output peaked in 2016 at 84.5 mm b/d and now stands at 81.3 m b/d – 5% below its peak. Even if OPEC has its alleged 4 mm b/d of unused production capacity (something we do not believe), conventional production would barely regain its 2016 peak.”
The authors of the G & R report clearly distinguish between the peaking of “Conventional oil” and the slowing in the growth of “Unconventional oil”, such as LTO and deep offshore, in the above two statements. Below are production charts for six counties that are powering production growth in the Permian and provide some insight on whether they are close to peaking/plateauing.
What is perplexing in the second paragraph is that the authors do not believe that OPEC has 4 Mb/d of unused capacity. They do not state what level of spare capacity OPEC has, 2Mb/d, maybe?
Permian Basin
The authors have a major section regarding the Permian in the report. Charts and data from another source are presented below to show the source and state of Permian production today.
“Our models tell us the Permian will ultimately recover 34 bn barrels of oil, of which 14 bn or 41% have already been produced. At current production levels, the Permian will have produced half its recoverable reserves sometime in late 2024; at this point, it will most likely stop growing, just like the other two basins.
The authors believe that Hubbert’s theory can be applied to the LTO basins and that once the Permian has produced half of its recoverable resources by late 2024, production will have peaked and begin to roll over.
Below are charts for six Permian counties which have the highest oil production along with strong gas production. Two are in New Mexico and the other four are in Texas .
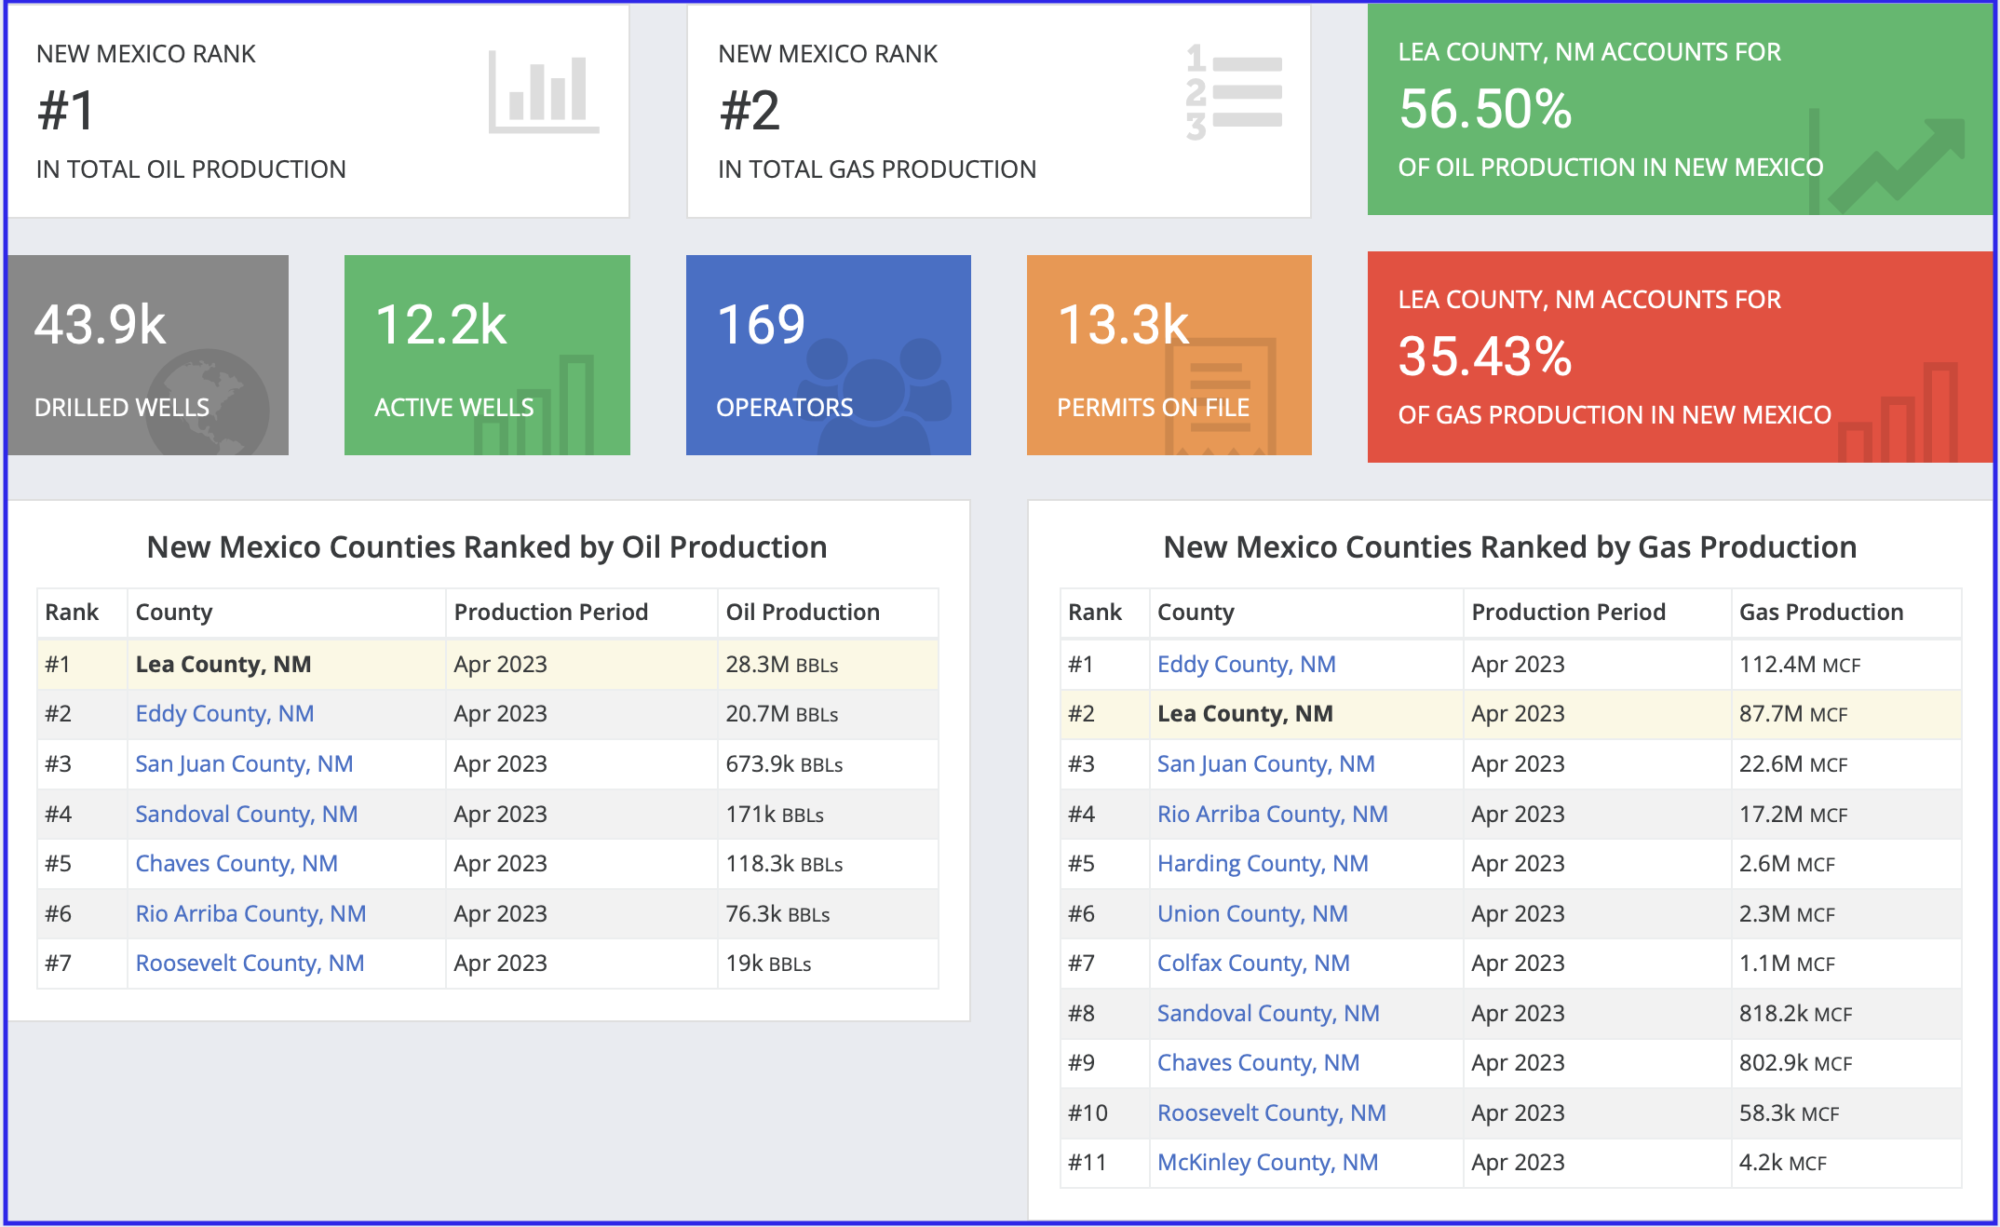
This table was taken from Shalexperts and it lists the top oil producing counties in New Mexico in April 2023. Lea and Eddy are the two largest oil producing counties in the Permian. According to the table, the daily production rate for Lea county in April was 943 kb/d. Novi Labs shows a production rate of 924 kb/d for March.
The combined production rate for the Lea and Eddy counties is 1,633 kb/d. As shown in the New Mexico production chart above, C + C production in April was 1,857 kb/d. It is not clear if the crude production numbers in this table include condensate, which may account for the difference of 224 kb/d between the two estimates. These two counties account for 98% of New Mexico’s oil production. Note the production gap between Eddy county, #2, and San Juan county, #3.
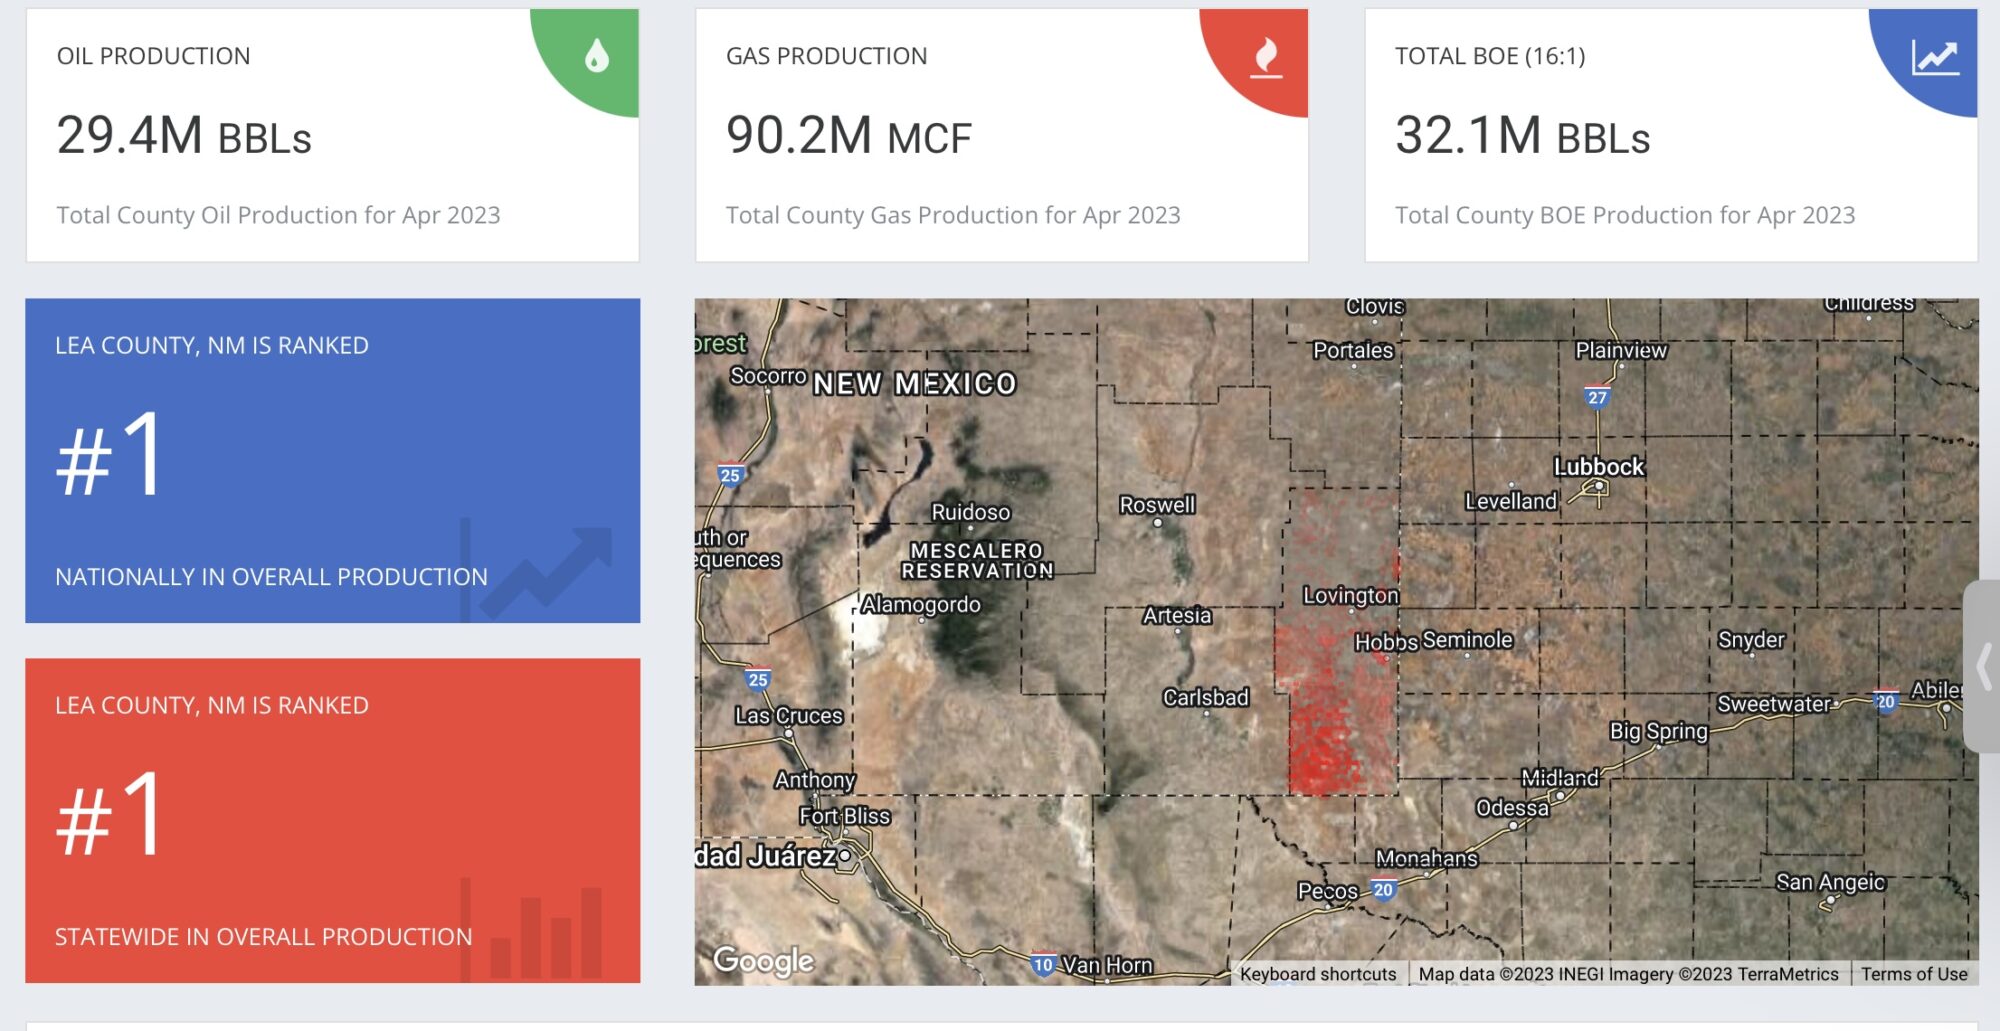
To clarify the condensate question, this picture from the same source above shows an equivalent BOE of 32.1 M barrels. The normal conversion for NG to BOEs is 6000 ft^3 equals 1 BOE. So the 90.2 MCF equals 1,500,000 barrel of oil for a total of 30.9 M barrels, which is 1.3 M barrels lower than shown above. Can someone clarify.
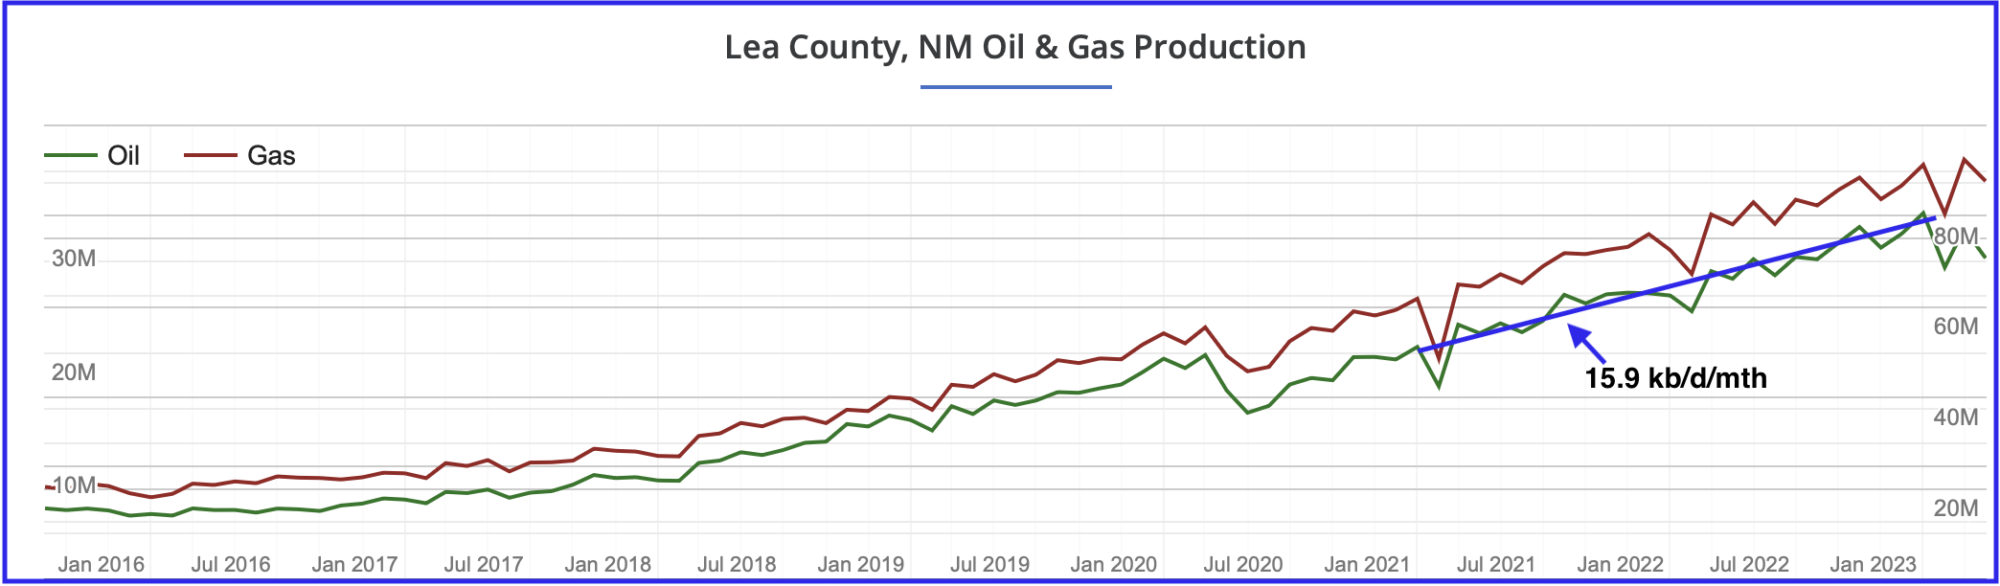
Lea County oil and NG production profile. No sign of peaking up to January 2023 and oil and NG production are rising in parallel. A two point analysis was used to estimate the rate of production increase from January 2021 to January 2023. Over that period production increased at an average rate of 15.9 kb/d/mth.
Comparing the last four oil and gas data points in the chart, January to April, there is a hint that Lea county oil production may have crossed into the bubble point phase because gas output made a new high while oil production dropped. A few more months of data will be required to confirm the production uptrend has stopped and production has entered the bubble point phase.
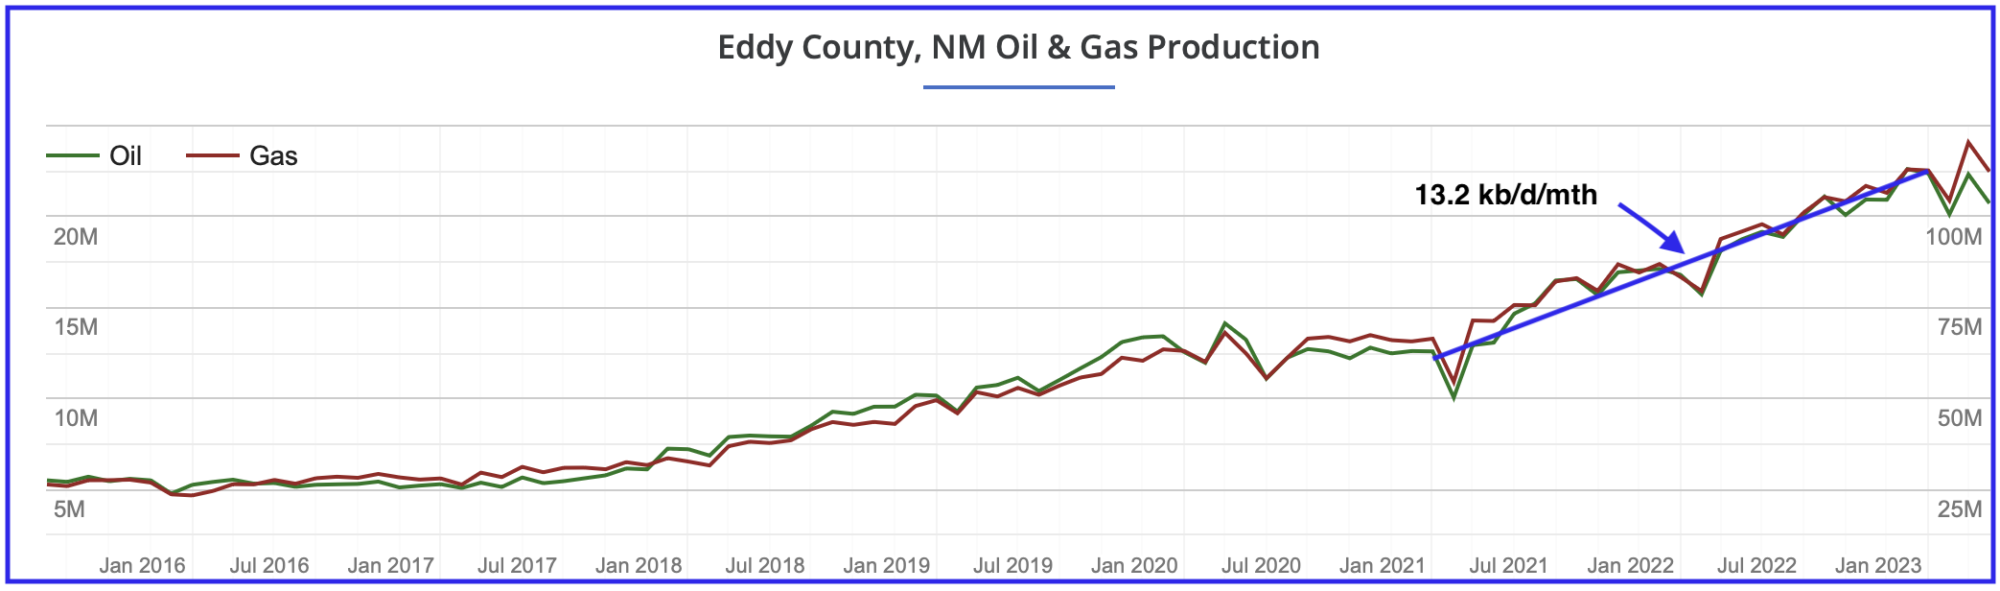
Eddy County oil and NG production profile. No sign of peaking up to January 2023 and oil and NG production are essentially overlapping. A two point analysis was used to estimate the rate of production increase from January 2021 to January 2023. Over that period production increased at an average rate of 13.2kb/d/mth.
As with Lea county, the last four data points in the Eddy chart, January to April, indicate that it may also have crossed into the bubble point phase because gas output made a new high while oil production dropped a bit.
Putting an OLS line through the same period, January 2021 to January 2023, for New Mexico production gives a slope of 29.4 kb/d/mth. Adding the two slopes for Lea county and Eddy county gives a slope 29.1 kb/d/mth. Essentially these two counties account for all of the production growth in New Mexico.
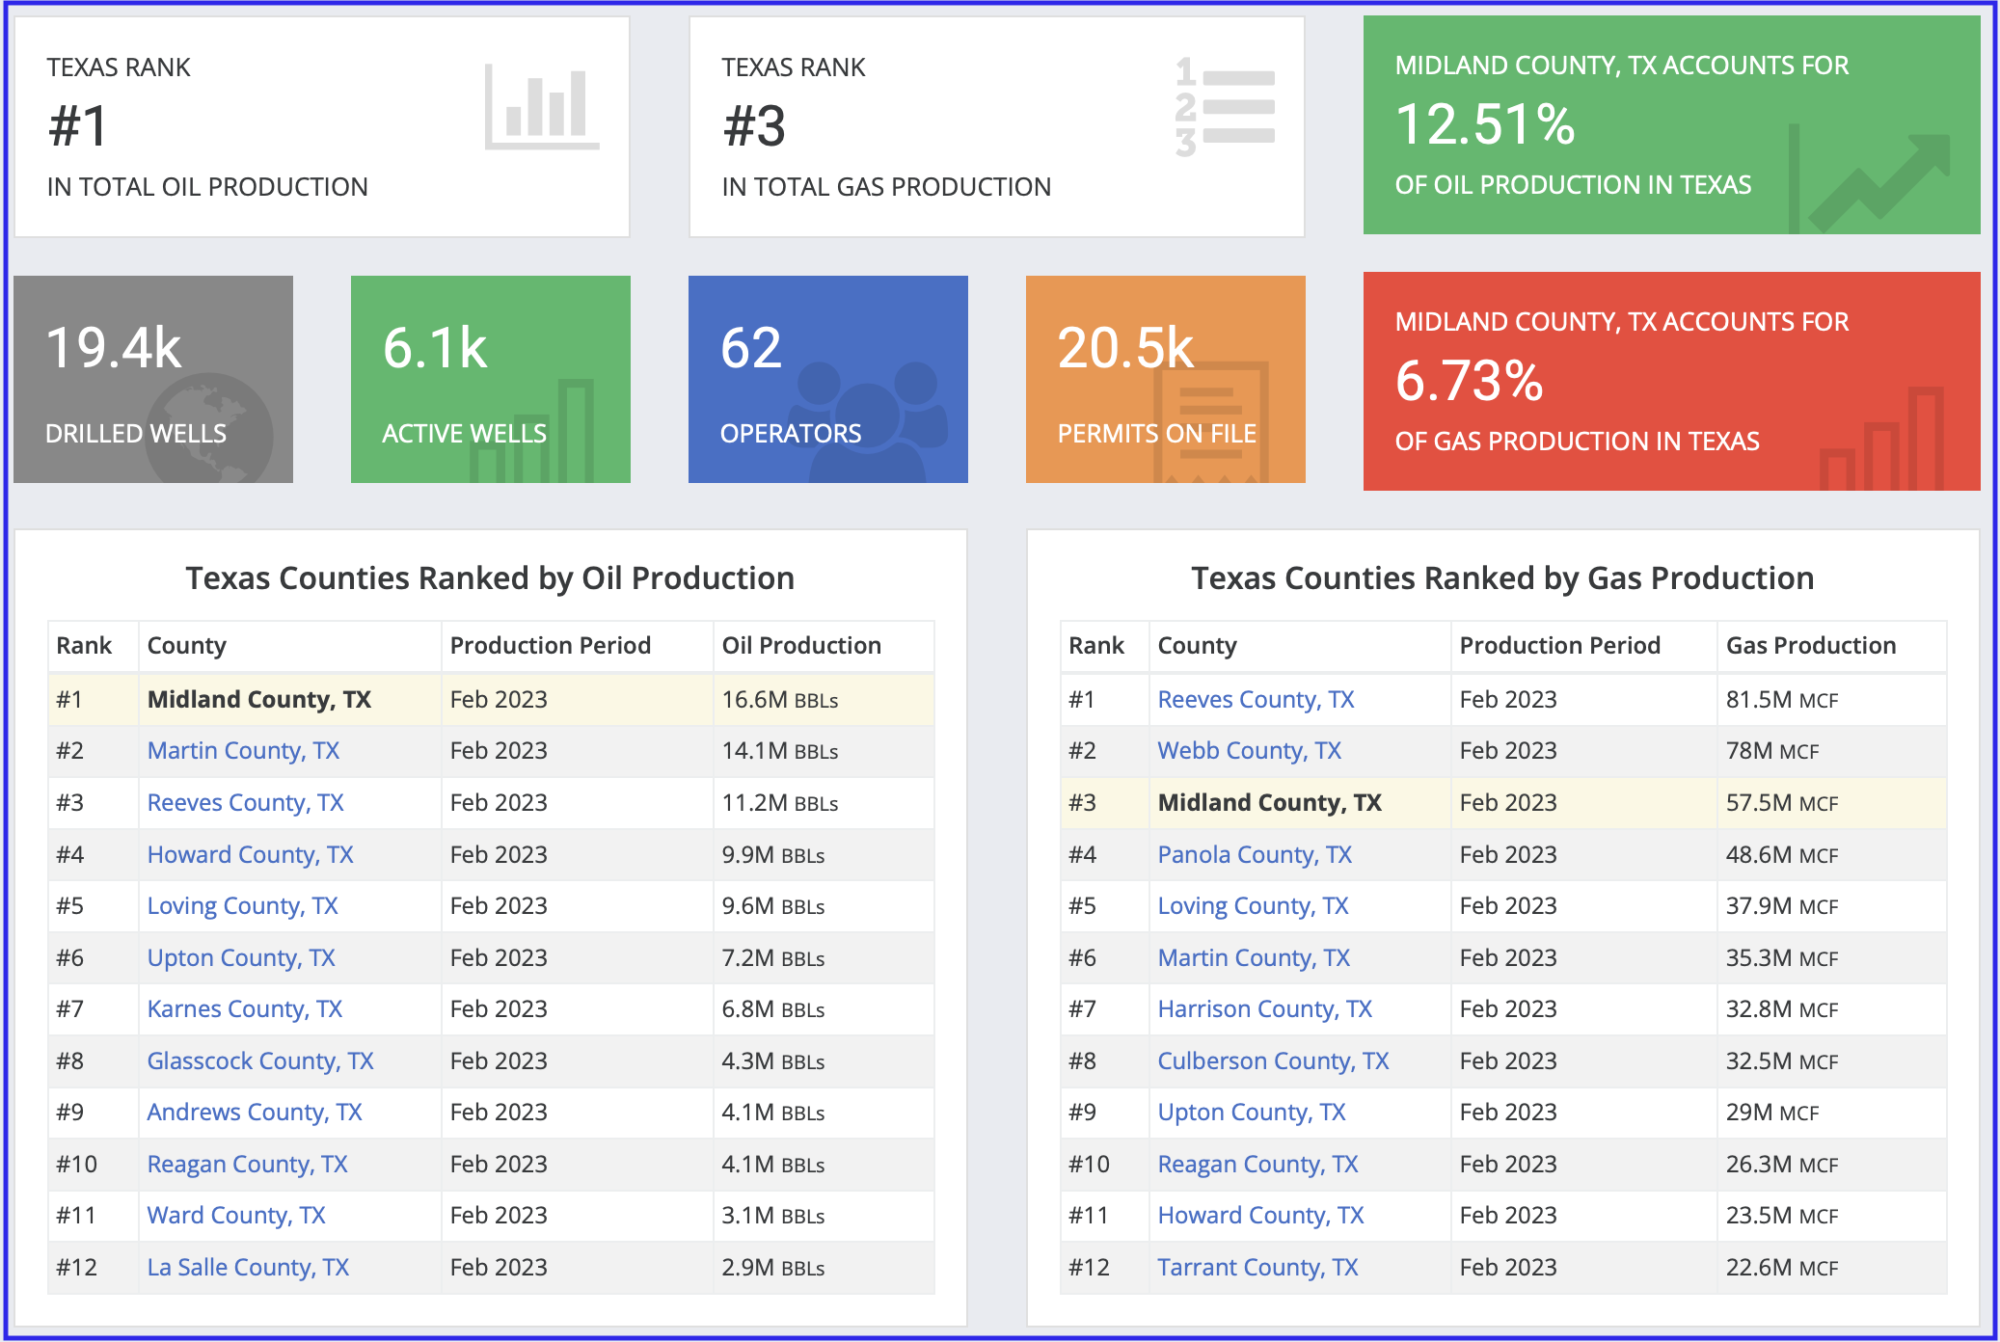
This table was taken from Shalexperts and it lists the top oil producing counties in Texas in February 2023. Midland is the largest producing county in the Texas Permian and is ranked number 3 nationally. According to the table, the daily production rate for Midland county in February was 593 kb/d. Cross checking this February production rate with Novi Labs yields a similar rate of 587 kb/d.
Comparing the production rates in the top two New Mexico counties with those in Texas, it is clear that the Lea and Eddy counties are the Ghawars of the tight oil fields. Essentially that means the first clue for Permian peaking will come from noticing when New Mexico’s oil production starts to slowly roll over.
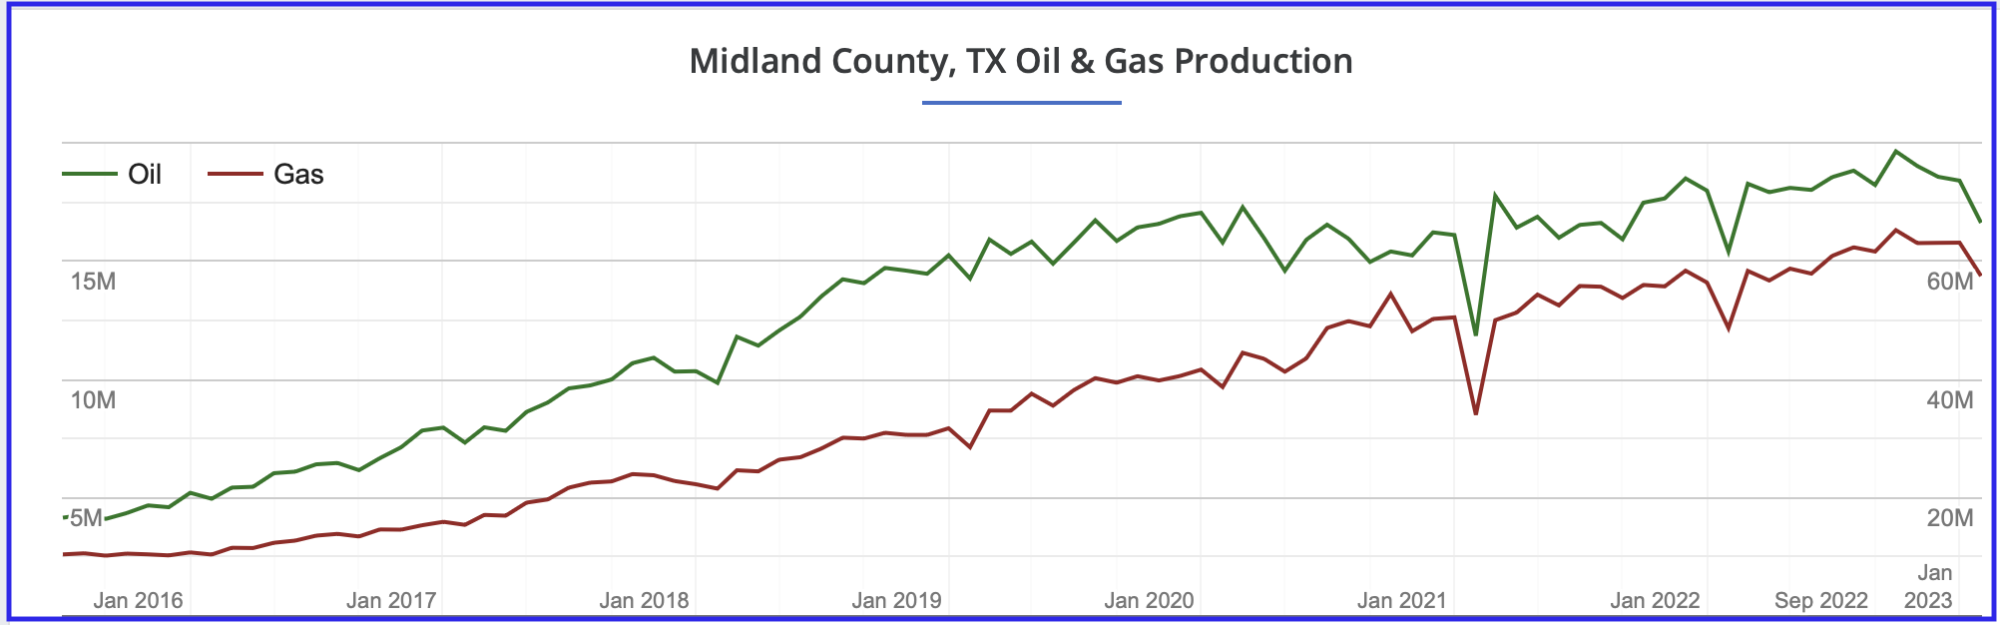
Midland county oil and NG production profile. Comparing the production increase before and after January 2020, it appears that Midland production may be entering a plateau phase starting in 2022. NG’s monthly production appears to increase linearly over the whole period shown.
Note the big drop in oil production over the last four months. This could be mostly due to slow reporting in Texas.
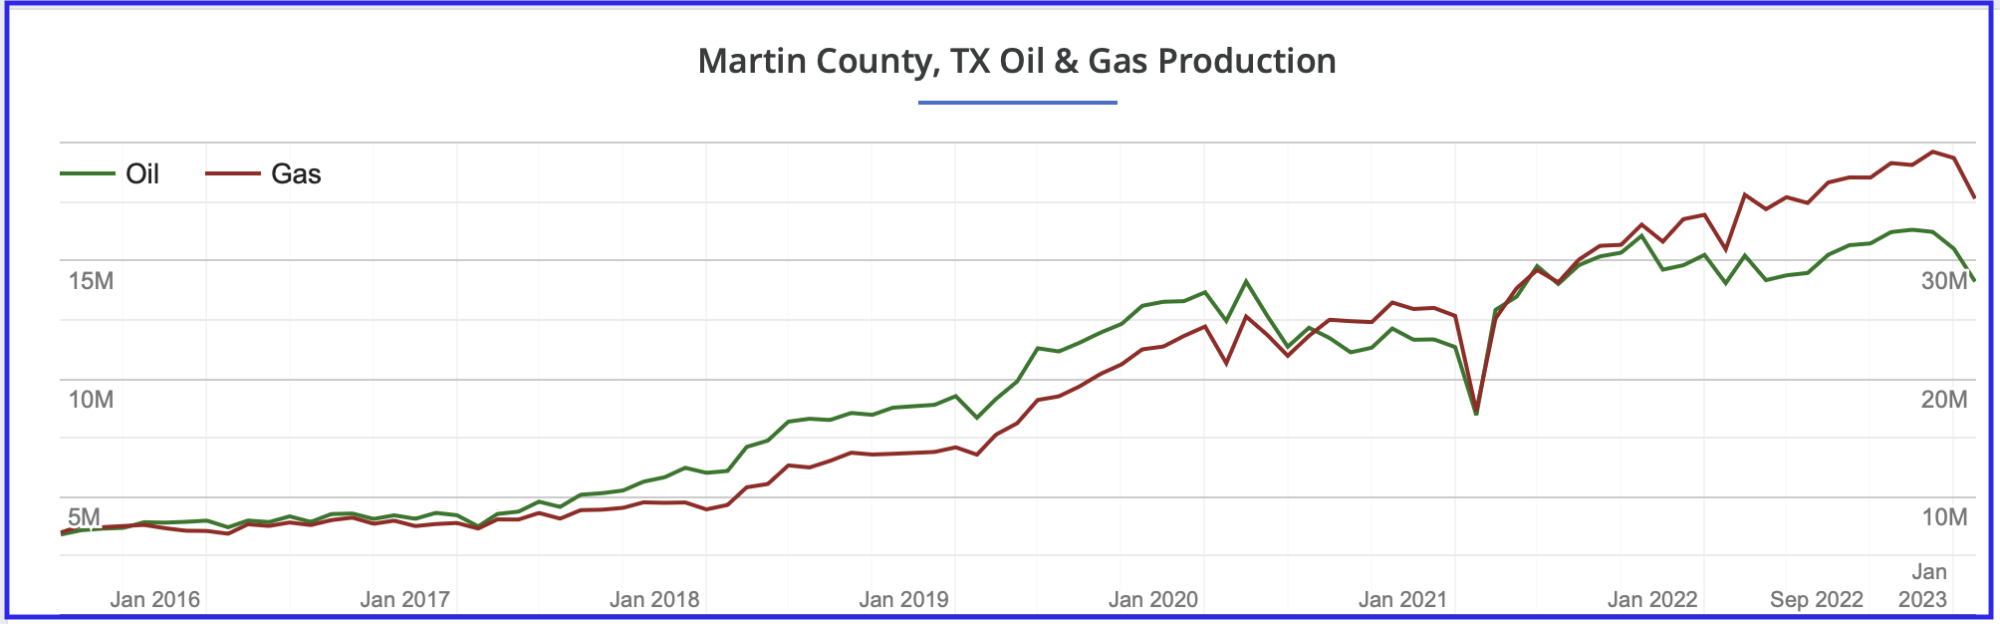
Martin county oil and NG production profile. Since January 2022, oil production has been flat while gas production continues to rise, a clear sign that Martin county is gassing out. Note that the oil graph crossed the NG graph in mid 2020.
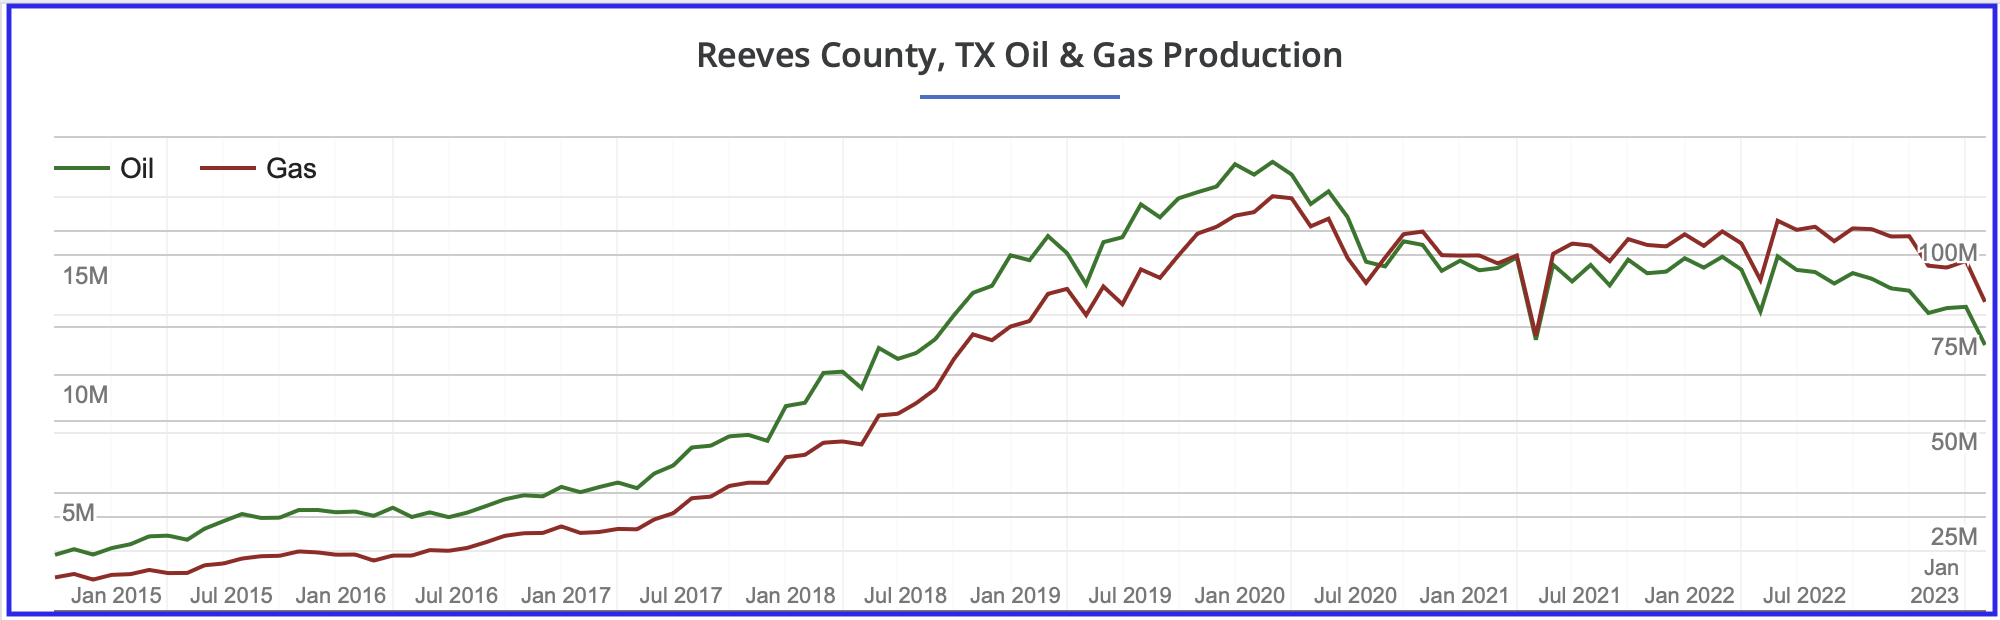
Reeves county oil and NG production profile. Reeves’ county oil production has been in decline since early 2020.
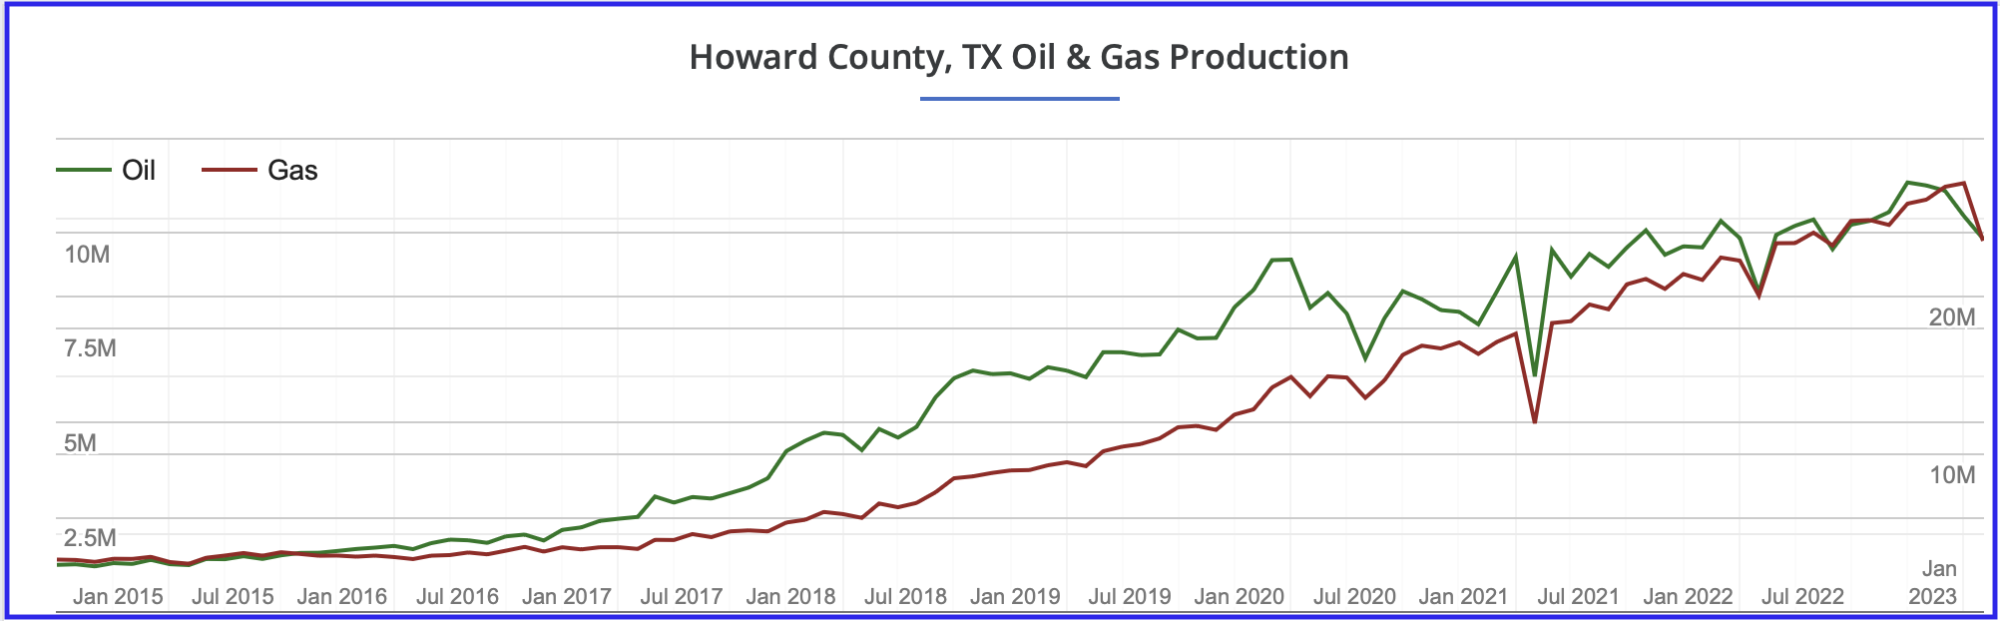
Howard county oil and NG production profile. Howard county’s oil production continues to be on a rising trend.
Permian Summary
The two largest producing counties in the Permian, Lea and Eddy, may be entering a production phase characterized by crossing into the bubble point of an oil field. In Texas, Midland production growth rate is slowing, Martin county is on a plateau, Reeves county is in decline and Howard county’s production continues to rise. Based on the production profile of these six counties, it appears that the Goehring and Rozencwajg report’s forecast that the Permian may peak in the next twelve months has merit.
In addition, it should be noted that in the DPR section above, Permian production growth is slowing and approaching no growth.
Bakken Basin
The G & R report focuses primarily on peaking in the Permian and comments that the Bakken has peaked. For comparison purposes, information similar to that posted above is presented for the Bakken.
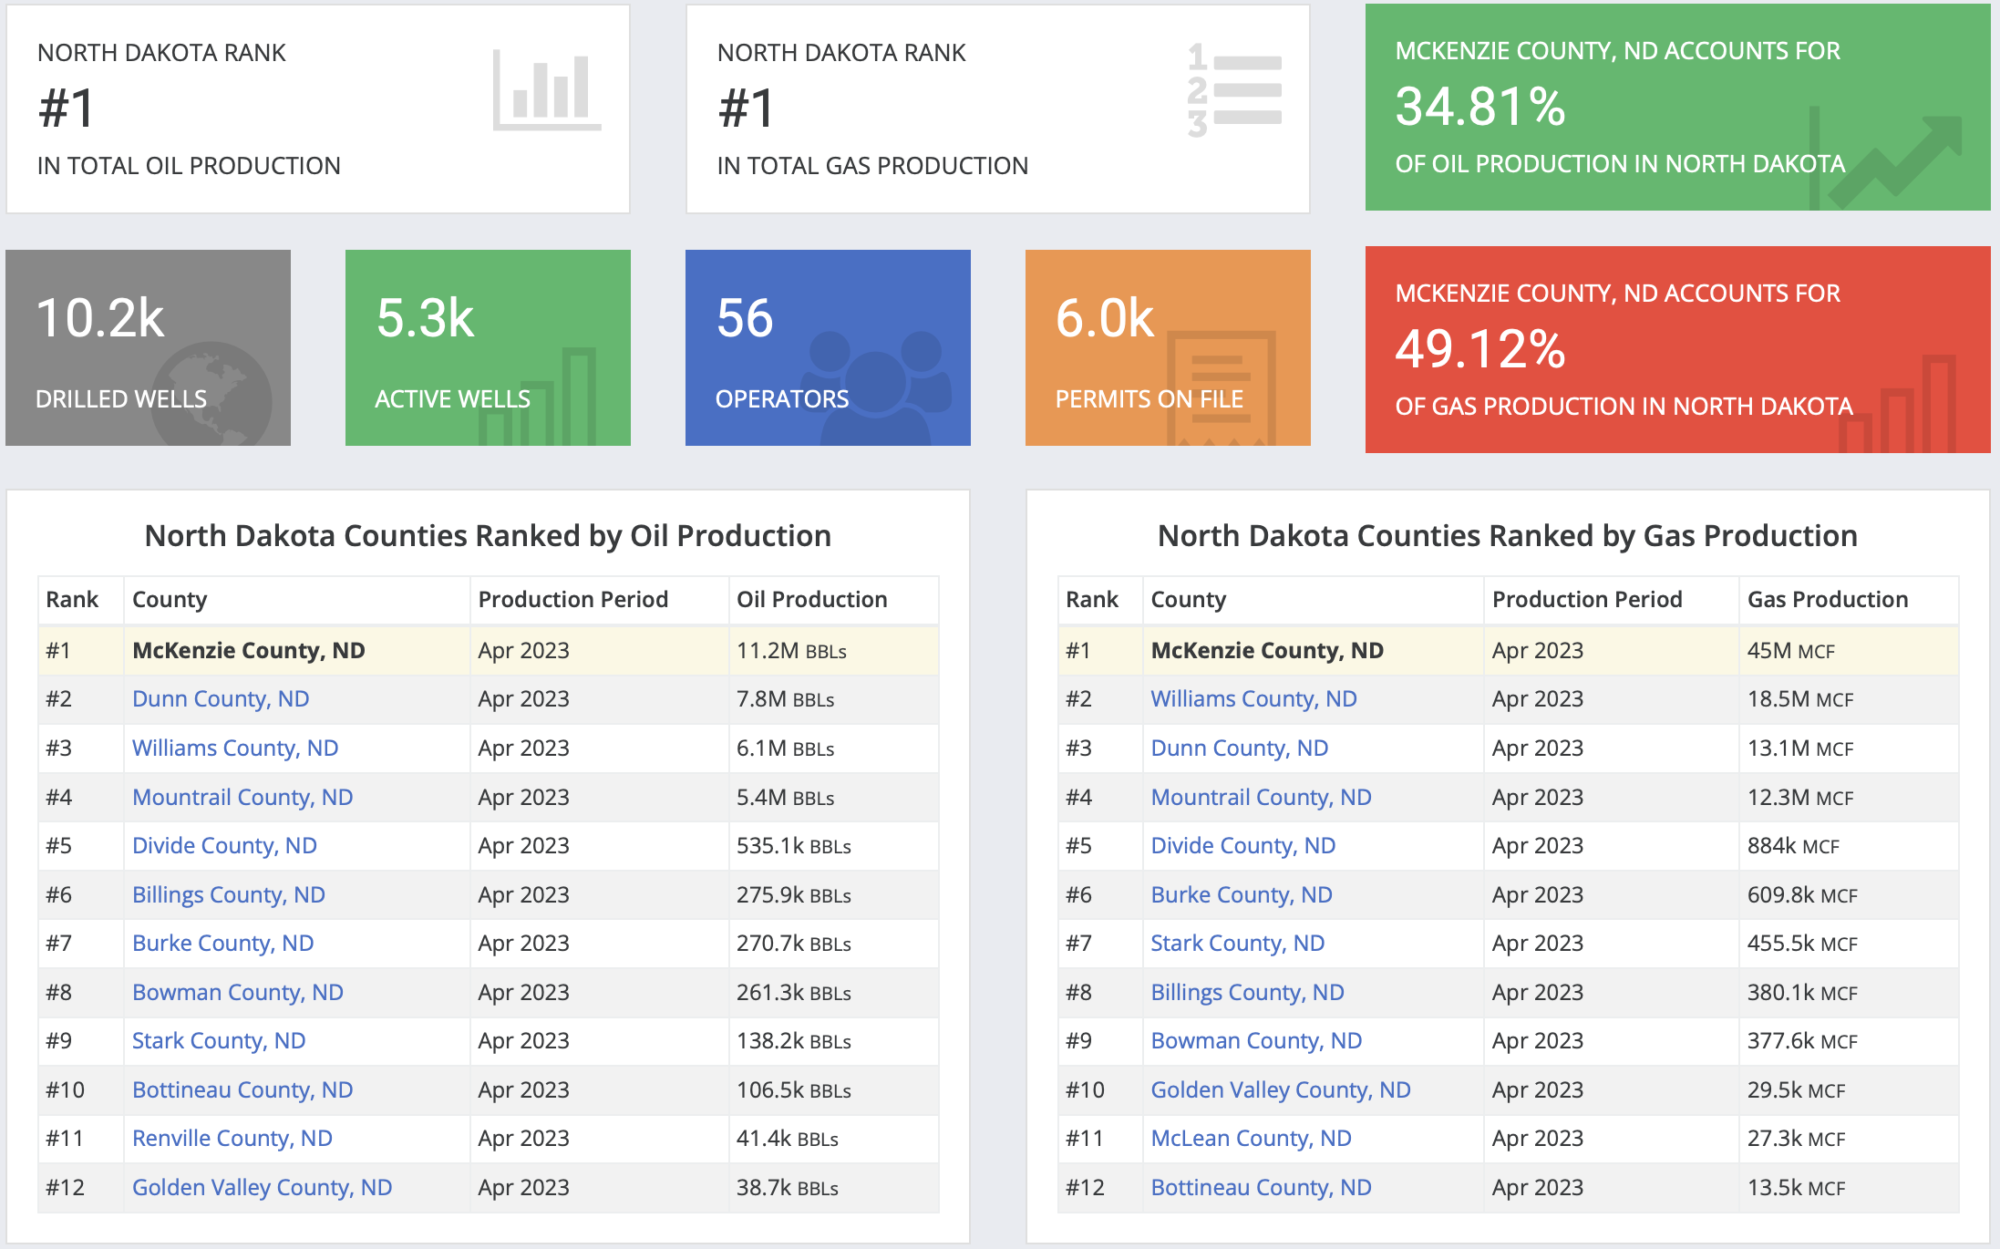
This table was taken from Shalexperts and it lists the top oil producing counties in North Dakota in April 2023. The top four counties account for 1,017 kb/d of North Dakota’s 1,102 kb/d production in April.
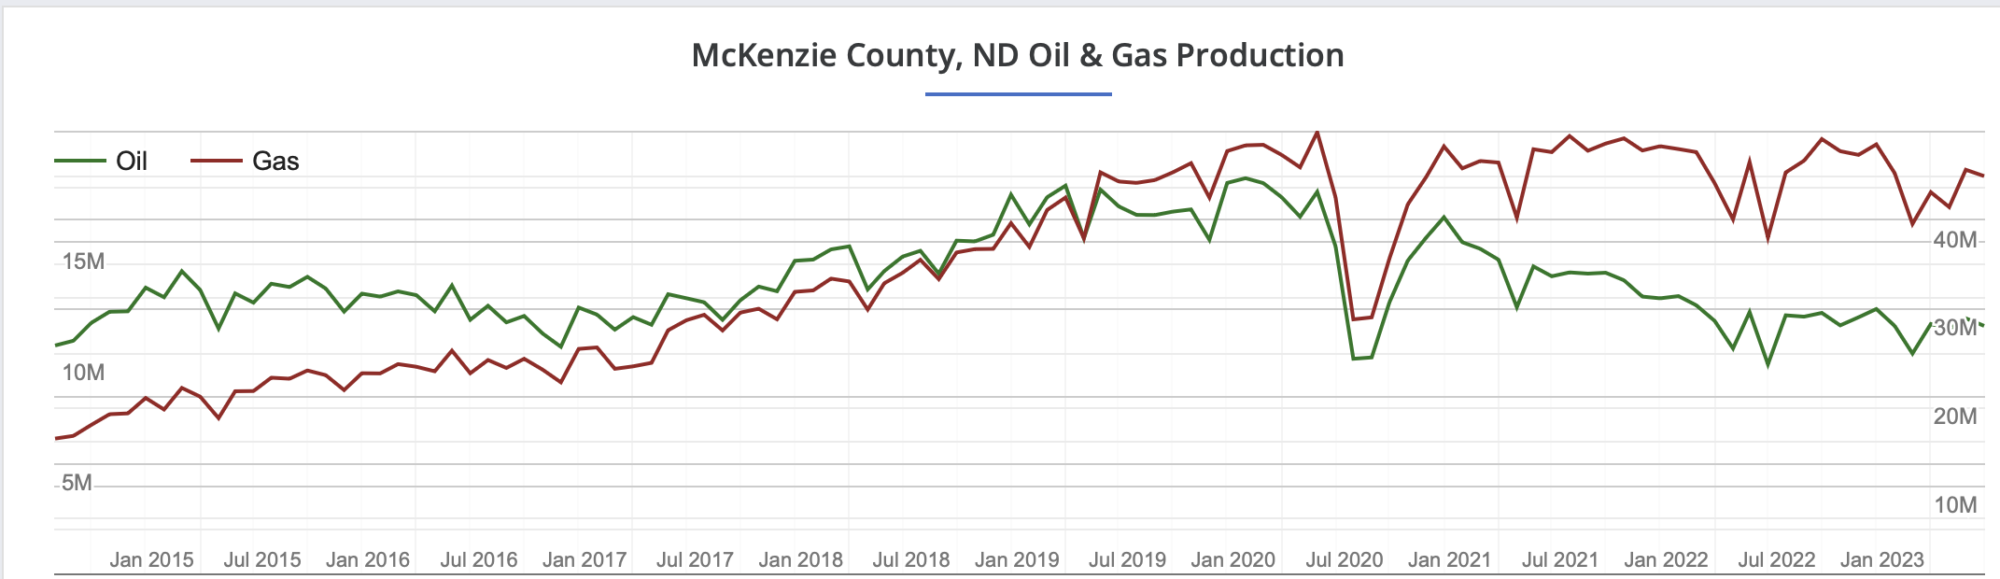
McKenzie county oil and NG production profile. McKenzie county, the number one county in North Dakota, is in decline and appears to be gassing out.
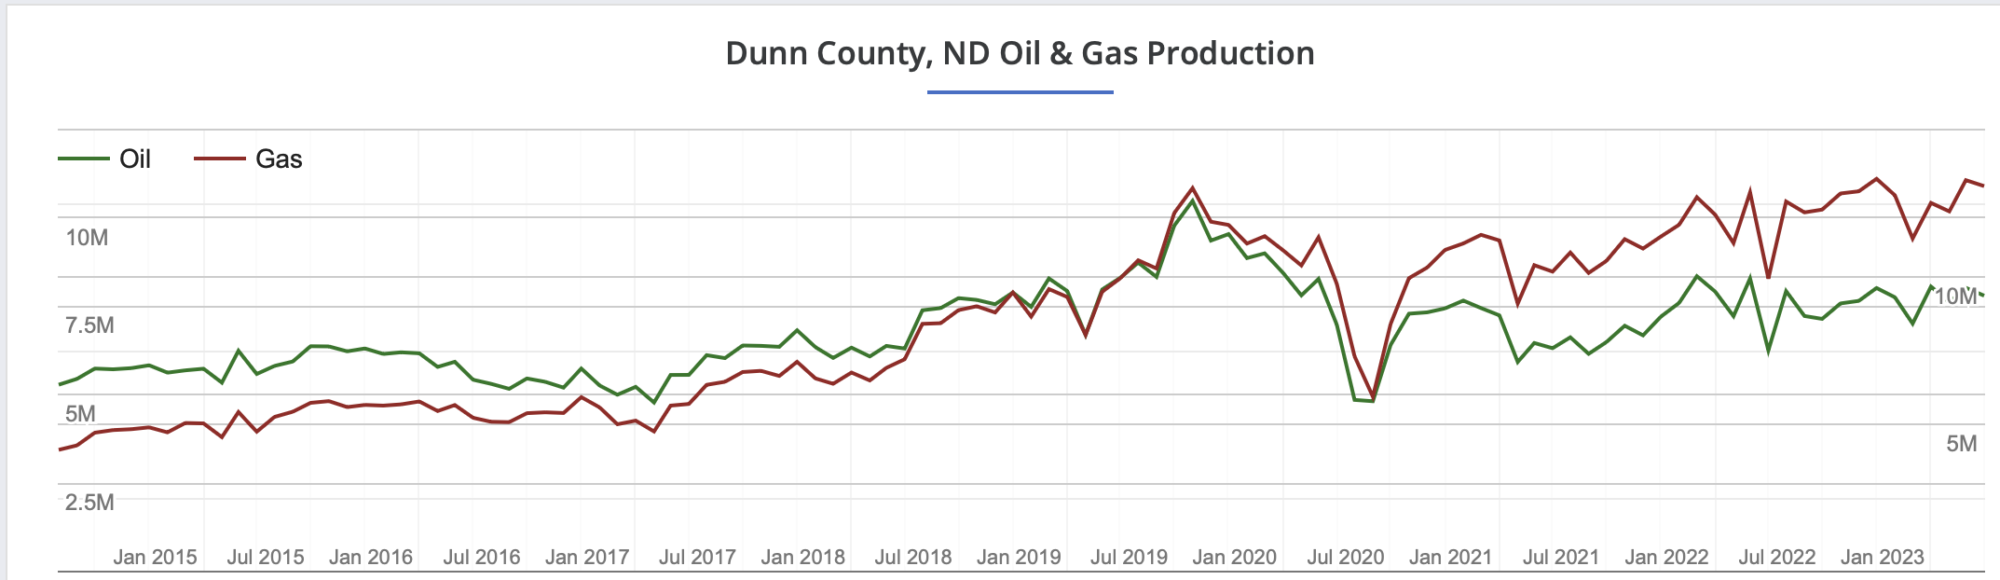
Dunn county oil and NG production profile. Dunn county’s oil production is down from its high in August 2019 and now appears to be on lower production plateau.
Frac Spread Count by State and County
Below is a breakdown of the frac spread count for the week May 13 to May 19 taken from this source. That is the most complete data set for that week. While information is provided up to the current week, it is incomplete and is updated in subsequent weeks.
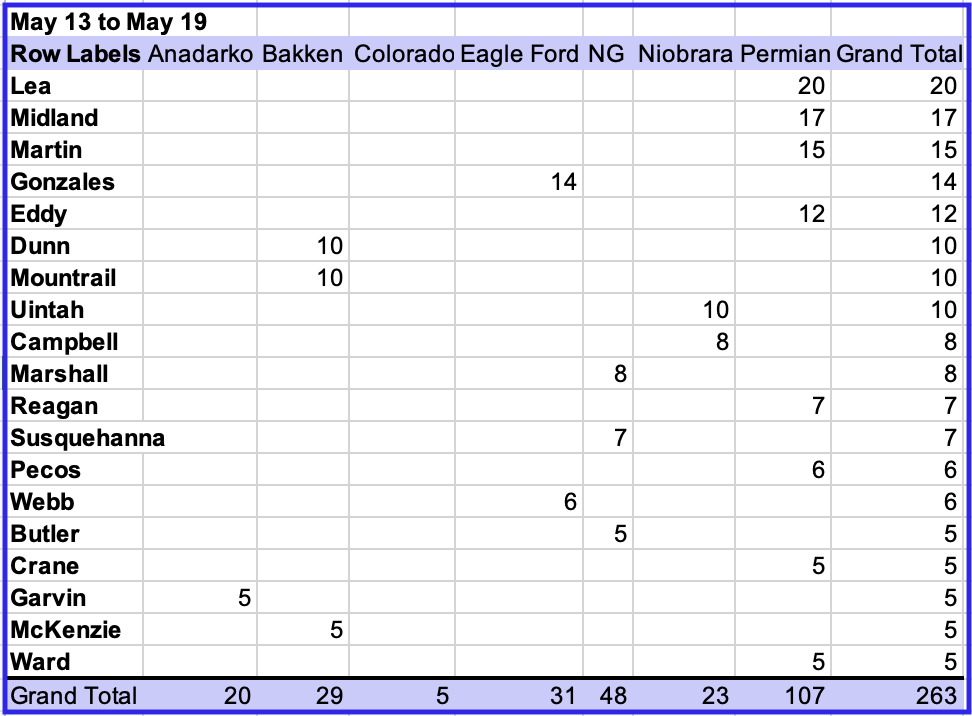
This table shows in which counties the most activity was taking place. The table was cut off at 5 frac spreads. The official frac spread count for the week May 13 to May 19 according to this source was 262, while the above table shows 263.
Four of the five top counties are in the Permian. What is different in this table vs a few months ago is that the Permian frac spread count is less than half of the total. Earlier it was more than half. This is another indicator that the production rate in the Permian may be slowing.
It is not clear if the drop in frac count is due to the $70/b price for WTI or the reduced number of Tier 1 sites or management decision to return more cash to investors.
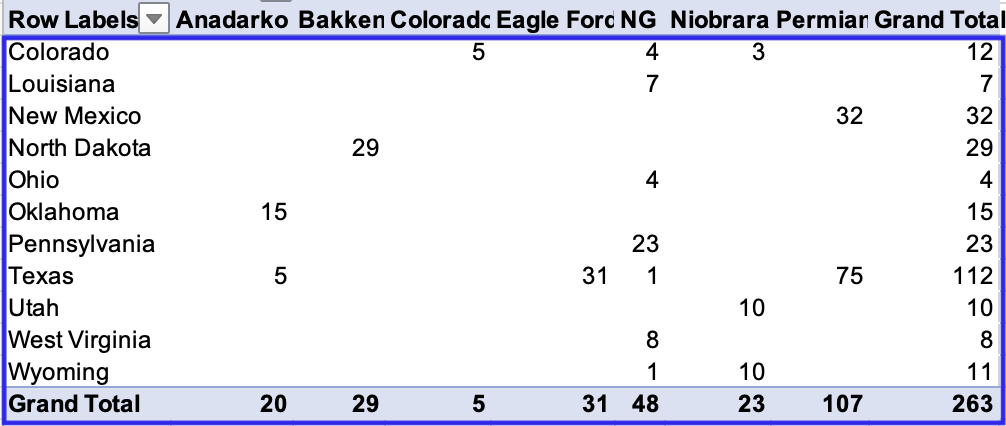
This table shows the distribution of frac spreads between basins and States. The most completion activity is happening in Texas, New Mexico and North Dakota.
298 responses to “GOM Drop Drops US April Oil Production”
As always, most excellent work!
My only, very minor, point would be to have the STEO projections in the first graph in another colour, to not confuse the ones not reading the details so they realize it´s an estimate/guess/projection.
But again, great work!
Laplander
Thanks. Much appreciated.
I agree with you on the colour issue. The problem is that for the last two posts, I have been away from home and have limited capability.
I will be home for the next post and will return to the format I used in the February report which will be consistent with your request.
https://peakoilbarrel.com/small-drop-in-us-february-oil-production/#more-42760
Agree – fantastic post. I particularly liked the link that you had where one can download the Goehring & Rozencwajg pdf
https://info.gorozen.com/2023-q1-hubberts-peak-is-here
Thanks for putting all of this together!
Rgds
WP
WeekendPeak
Thanks. Much appreciated.
Saudi Arabia and Russia to Extend Oil Cuts
Saudi Arabia said Monday that it would extend a cut in oil production of one million barrels a day that it announced in June through at least August, trying to push up what officials view as stubbornly weak oil prices. The Saudis were joined by Russia, whose deputy prime minister Alexander Novak said Moscow would cut supplies by 500,000 barrels in August.
Together, these trims could amount to 1.5 percent of global supplies. Oil prices initially jumped on news of the cuts but later faded.
Oil prices have been under pressure in recent months because of uncertainty about the strength of the global economy as many central banks continue to raise interest rates to stem inflation. There are also doubts about oil’s longer-term future as electric vehicles and other alternatives to consuming oil continue to grow. The Saudis and other members of the producers’ group known as OPEC Plus have been gradually dialing back production since last fall.
There is a lot more to this article. Plus, there are many other articles out there announcing this duel Saudi-Russian cut in production.
Great job Ovi.
The Recent Novilabs report on the Permian sees things a little differently.
https://novilabs.com/blog/permian-update-through-april-2023/
Some excerpts:
Permian tight oil production grew to just below 5.3 million b/d in April (after upcoming revisions, horizontal wells only). However, April production has only been reported for a little over 70% (this is about 85% on the Texas side), which explains the drop you’re seeing for that month.
This lack of data completeness seems to be worse for New Mexico than for Texas based on the comment above indicating the New Mexico data is less than 70% complete (as Texas data is 85% complete based on Enno’s comment).
Also:
This number of active rigs (333) is however more than sufficient to maintain current output, assuming no changes in rig & well productivity. The following overview, from our Supply Projection dashboard (available to subscribers), reveals that if one assumes a drop 100 rigs from now until September 1st (top chart), Permian production will plateau at the existing level (bottom chart).
This comment was followed by chart below with 233 rigs from Sept 2023 to Dec 2029, at April completion rates of about 500 wells, this would be 1.5 wells completed per rig and at 233 rigs this would be 350 wells per month (roughly a 30% drop in the completion rate from April’s level). Not clear we will see a 30% drop in the completion rate in the Permian basin.
My analysis has very similar results for a 350 well scenario. Also shown are scenarios with 450 wells, 500 wells (current completion rate) and 550 wells.
Ovi – you are too kind with Dennis …50 Gb of plateau??? Really? That’s a looooooooong shoooooot, Dennis – thought your best guess was for growth?
Kengeo
Most of us here have accepted peak oil Dennis is still at the bargaining stage.
There is peak oil as a faith based concept (the majority opinion) and then the analytic one. I believe Dennis falls on the analytic side, and his estimates are reasonable because of the information he uses for URR. If he had better resource estimates (not necessarily smaller mind you, but improved by better delineation of individual formation performance) his numbers might be more in line with what the more faith based side would agree with. Which is to say, smaller, and with sooner peaks. To the faithful, those are always the more correct answers.
Without higher resolution/quality resource estimates, Dennis is stuck with resource base size as is. He could use data similar to what NoviLabs provides to change the underlying USGS inputs parameters and plug that into their published monte carlo simulator, but I don’t know if he has explored that option yet.
Reservgrowthrulz,
I do reduce the USGS TRR estimates by considering only the highest productivity assessment units (Lower Spraberry, Wolfcamp A and B, and second and Third Bonespring Formations). I could do a better analysis that does separate well profiles for each of these formations (earlier iterations of shaleprofile data did not divide out the formations in as great detail, I only had access to Wolfcamp, Spraberry, and Bonespring formations and they were divided no further). I did an analysis utilizing separate well profiles for Wolfcamp Delaware, Wolfcamp Midland, Spraberry and Bonespring and the results were not significantly different from using a single well profile for the entire basin. Thus I have chosen to use a single well profile for entire basin for wells starting 2010-2012, 2013, …, 2018, 2019, and 2020. After 2020 I simply assume well profiles beyond that date are similar to the average 2020 wells, it is a bit early to fit a well profile for 2021 wells (only 16 months of complete data for the 4773 horizontal wells completed in the Permian in 2021 so the fit would be pretty rough).
I have not used the full Novi data suite and machine learning tools as I cannot afford the subscription.
World c+c production happened in Nov 2018 on Earth.
Don’t know about the planets you are living on?
It could be surpassed, if that is the argument, but that is an argument.
Hightrekker,
Reservegrowthrulz points out there have been many peaks in the past, whether 2018 will be the final peak is not known as the future is unknown. Seems a fairly logical argument from my perspective.
To Dennis:
Your level of resolution for particular formations wasn’t what I was referring to. Lowering the USGS estimates seems reasonable to me off the top of my head, but I can’t say by how much or where for another 2 weeks or so. I was referring to the way the USGS method works, and something I’ve bumped into over the past 6 months that might negate their method entirely. Doesn’t mean a change in method wouldn’t deliver similar answers, after all they still do area/productivity analysis, the issue is more how the productive areas are calculated.
For a entire sector of the oil industry (and its registered, professional reservoir engineers, sworn to tell the truth by moral obligations set forth in the Society of Petroleum Engineers) to NOT be able to get reasonable close to accurate EUR’s for INDIVIDUAL wells, it is ridiculous to focus on ultimate recoverable resource (URR) for an entire, vast basin like the Permian. URR is wild ass guesses of the worse kind. Check that, an E always goes before URR; there is nothing remotely ultimate about URR.
Most of the tight oil sectors EUR’s have been proven, beyond doubt, to be exaggerated by 30-40%. So we are now suppose to believe in EURR’s ?
You guys are nuts. And desperate, clearly.
But to be clear, and for the record…the analyst would be able to make better analysis if the EURR was better? So he could work DOWN using EURR, and certain oil prices, that would enable extraction of a probability percentage of EURR and make a better prediction of the future? Is that correct?
Well, no shit.
It’s dark down there and hard to see. Welcome to the real, non corporate, non home-basement world of the real oil business.
Over 60% of the areal extent of the USGS assessment of the Midland Basin has been tested, and abandoned, forever, short of $200 oil, or will NEVER be tested.
Analyse that.
“Sometimes what people believe is the truth is not the truth at all.”
Copy that.
Reservegrowthrulz,
The USGS estimate for the Bakken/Three Forks in North Dakota seemed to be pretty good with ERR about 80% of TRR which seems reasonable, was there something very different about the Midland Wolfcamp and Spraberry and Delaware basin assessments, it seemed the methodology was similar. Note that I throw out about 20 of 50 million prospective acres covered by these three assessments and reduce the TRR from about 75 Gb to about 50 Gb in the highest productivity assessment units. My 40 Gb scenario is in line with the ND Bakken/TF in that about 80% of the 50 Gb TRR that I utilize in my analysis is economically recoverable at $80/bo in 2022$ at current costs.
Mike,
The EUR I use is about 430 kbo for the average 2020 well over 157 months with the assumption that the well is shut in at 19 bopd.
The EUR is based on a fit to Novilabs data where exponential decline at 12.5%/year is assumed after the hyperbolic profile reaches an annual decline rate of 12.5%.
The low scenario with URR=37 Gb and a 350 well per month completion rate is consistent with the scenario presented by Enno Peters in his recent Permian post and not far from the G &R estimate of 34 Gb, in fact the scenario can easily be modified after 2030 to be consistent with a 34 Gb URR assumption. The 17 Gb cumulative output point is reached in Dec 2026 for the 350 well scenario, if one likes the assumption that peak occurs at cumualtive output that is 50% of URR. In this case the scenario is a plateau at about 5150 kb/d that starts in Jan 2023 and might end in Dec 2030 with the midpoint of the plateau occurring at cumulative output at 50% of 34 Gb (17 Gb).
Reservegrowthrulz,
It seems you are suggesting the TRR estimates by the USGS are far too large. Is that correct?
To Dennis:
I was not implying large or small as much as the particulars of the method itself. As just one example, without involving costs in a model, there is no explicit way to factor in price effects other than as guesswork. As opposed to how a resource cost curve based method would work, as just one example.
The USGS method is based on geologic area, and a distribution of productivity across that area, assuming they have wells drilled and production. They discount area for previously drilled wells, leaving area yet to be developed, and apply a productivity distribution. Relatively simple at the end of the day.
What happens when additional data at the play level demonstrates that the shape of those distributions are fundamentally different than those assumed by their method? We aren’t talking about new plays anymore, with small samples of wells to substantiate the productive, we are talking about manufacturing, one of those stages in that graphic I emailed you some time ago. And with manufacturing comes distributions that don’t match what the USGS assumes. Does that make their esimates high or low? I don’t know yet. But there is plenty of data to figure it out now.
Reservegrowthrulz,
It seems to me that by looking at actual well productivity data over time as I do, with a separate well profile for each year from 2013 to 2020, I capture much of the technological and geologic data over time. The model to data match is pretty good, future will always be unknown.
whether 2018 will be the final peak is not known as the future is unknown.
It is the peak, the highest production of c+c.
Reality over ideology.
It may be surpassed, but embrace reality.
Lightsout,
Perhaps peak oil will remain 2018, or it may be 2028 as I guess, it makes little difference we will roughly be on an undulating plateau between 79 and 84 Mb/d from 2015 to 2033 in my view, if there is a new peak it will be within 1 Mb/d of the 2018 peak, if not it matters not output will be in the 79 to 84 Mb/d range from 2023 to 2033. I will believe the future decline asserted by others when I see it. I don’t think we see annual decline rates for World C plus C over 2% until 2034 or later.
I agree, except for the decline rate. I think it will be greater than 2%. The decline rate will not be linear. It may start off at 2% or less but will then accelerate because of the export land model. Producing nations will start to hoard their production, just like the US is starting to do. The non-producing nations will be left in a world of shit.
Producers hoarding their residual production capacity is certainly to be expected, and/or directing the products to their ‘most favored nations’ list in the post peak/decline phase.
Also, there will very likely be an acceleration of decline in the economic prospects of marginal countries who find themselves on the outside of the declining oil trade market. Lack of basic oil products and derivatives will likely tip countries into failed state status and that will be an extremely tumultuous series of episodes for humanity.
When does an episode turn into the main story?
Its hard to imagine how a globalized interconnected world will continue to function on all cylinders as we have all come to expect over this long growth spurt, which added billions to both the overall population and to the rolls of those in world with purchasing power (demand). Globalization has depended on oil energy and products greasing the skids and powering the engines. In a world with a contraction in globalization, many previously prosperous countries, including your own, may have to undergo some earthshaking adjustments to settle at new and lower level of economic function. Think of supply chains that never recover from a one or two year wait, or hardware stores with shelves of goods and tools poorly stocked, for example. Many have no idea how dependent all the vehicles and the grid and the hospitals and the communication networks of the country and the world are on a smoothly functioning interconnected semiconductor industry. Or minerals industry, for example.
We are approaching the Global Peak Combustion Day [all fuels]. The decline rate will indeed be interesting to observe, from a safe place I hope for you.
” I don’t think we see annual decline rates for World C plus C over 2% until 2034 or later.”
And don’t forget nefarious characters realizing that world oil is declining.
And being excited to destroy oil infrastructure which is a sitting duck militarily.
A recent example is the Nordstream pipeline.
Pakistan (a borderline failed state) nuking the Strait of Hormuz to realize an apocalyptic prophecy may be another.
And if you think the US Navy is going sit back and watch Oil Tankers float by destined for other countries…
think again!
Ron,
I agree it will be more than 2%. As tight oil declines rapidly from 2032 to 2040 the World decline rate will be over 3% for a few years, but the average annual rate of decline for World C plus C over the 2034 to 2070 period will be about 2.8% for my best guess scenario.
Keep in mind that after 2035 supply will fall as fast as demand for oil, perhaps demand decline will accelerate, I hope that is the case, but I am not that optimistic.
I see little evidence that the US is hoarding its energy output.
Some advocate this approach including me, but I see zero evidence of this affecting anyone.
This is a hypothetical.
Back in 2005, there was a “Peak Oil” that petrogeologists more or less correctly predicted. Along came the fracking business, that extended the due date for another “Peak Oil”. Exxon seems to confirm that in their View to 2050 Annual Reports with a known peak in 2018 and a possible final peak around 2032.
USGS estimates we have 3 trillion barrels of oil equivalent in the Shale Oil basins of Colorado and Utah of which 1 trillion may be accessible but not easy to mine and process. To process any mineable ore, a Shell manager estimated they would need 2.5 barrels of water to create a barrel of “crude” that could be pumped through a pipeline. The manager was thinking that they could get the amount of water needed down to 2 barrels.
Niagara Falls has a flow rate of about 85,000 cu ft/sec. This equates to a little over 15,000 barrels of water/sec. If the USA needs, 15 million barrels of oil per day and we could mine that much from the above basins, we would need 30 million barrels of water for processing/day. We would need 2,000 seconds of water flow from Niagara Falls or about 33 minutes of that flow per day.
To divert that much water to that basin, we would need about 20 Alaskan Pipelines based on 1.5 million barrels/day/pipe and 10 Alaskan Pipelines to transport that “crude” to a refinery.
To me, it puts things into perspective about our energy situation.
Peterev,
Pretty sure that nobody is arguing that Kerogen from the Green River Shale is likely to ever be extracted, definitely not me in any case. I often refer to a 3 Tb resource estimate by the USGS, but that is for World Conventional Oil Resources (study was published in 2000). Possibly another 500 Gb of unconventional oil resources, but my guess is there won’t be enough demand and the the amount of unconventional oil extracted will be less than 200 Gb, likewise I expect less than 2500 Gb of conventional oil will be extracted also due to lack of oil demand.
Hi Dennis,
The USGS estimates there are 6 trillion BOE of shale oil worldwide; 3 trillion in the Colorado and Utah area.
The question comes down to whether we would be technologically able to try to extract that resources and would we be desperate enough to do so? I think the answer is no because of the difficulty in extracting the resource and the absence of political will to run up to 30 Alaskan Pipelines through the central part of the US. But I don’t have a good feel for what we can or would do when times get desperate.
Peterev,
I agree the kerogen is not likely to extracted as it is too expensive to produce and cannot compete with normal oil resouces (both conventional and unconventional. Coal or gas to liquids would probably be cheaper than using Kerogen. It is a resource that is unlikely to ever be exploited in my opinion, some of the very high oil resource estimates over 4 Tb include this as a viable resource which is a mistake.
https://www.reuters.com/business/energy/norway-oil-safety-regulator-warns-threats-unidentified-drones-2022-09-26/
“The warning came after the country’s largest oil and gas firm Equinor (EQNR.OL) recently said it had notified authorities of sightings of drones of unknown origin flying near some of its platforms.”
In returning to the 2% decline rate discussion.
I would like to point out that shortly after the explosion of the Nordstream pipeline.
An almost untalked about event occurred that does not bode well for the future oil security..
Unidentified Drones were caught buzzing Norway’s OIL rigs. Probably Russian…but who knows.
Drones allow organisation’s/terrorist groups other than National Governments to get into the oil infrastructure attack game as they are much cheaper than a Naval Vessel.
Kengeo,
My best guess is the 40 Gb scenario with a completion rate of 450 wells per month, that scenario has Permian output increasing from about 5300 kb/d in April 2023 to about 6300 kb/d in late 2029. The lower scenario was to compare with Enno Peters scenario and through Dec 2029 where Mr. Peters scenario ends the scenario is very similar to my scenario.
Kangeo
Eh! That’s Canadian.
An alternative 350 well scenario with about 68.9k wells completed after December 2015, roughly 20 million of 50 million prospective acres or 40% of prospective net acres covered by 3 USGS Permian assessments. URR is 32 Gb, slightly lower than the G&R recent estimate for Permian URR, my guess remains that there is at least a 90% probability that the URR for the Permian will be higher than this scenario.
Note that I believe G&R may be mistaken in their estimate of 14 Gb of tight oil extracted so far from Permian basin, the EIA data suggests about 10.7 Gb of tight oil extracted from Permian from Jan 2000 to April 2023. Not clear what the basis of their 14 Gb estimate is. Perhaps G&R are mistakenly using DPR data to estimate cumulative production, from Jan 2007 to April 2023 the cumulative Permian production for the DPR is about 14 Gb, but this includes about 4 Gb of conventional oil from the Permian region.
It occurs to me the G&R may believe there are only 20 Gb of remaining recoverable resources in the Permian and if we use the correct estimate for cumulative tight oil production for the Permian Basin (10.7 Gb), their URR estimate would be reduced to 30.7 Gb, slightly lower than my scenario above, I am skeptical of this estimate, it is likely about 9 to 10 Gb too low.
Mr Coyne , still dreaming of a white Christmas ?
Excess DUC wells, which were responsible for a significant portion of 🇺🇸 oil production rebound since 2021, are now at critically low levels!
With frac spread count ⬇️ 5% YoY and rigs dropping every week, all signs are pointing towards continued shale activity deceleration
Hole in head,
I will believe the dead DUC Meme when we see output start to decrease significantly, in the mean time I use the DUC count at Novilabs and focus on the Permian, about 2200 DUCs in Permian as of March 2023 with roughly 490 completions, about a 4.5 month supply.
https://novilabs.com/blog/permian-update-through-april-2023/
So Mr Coyne .
Decreasing DUC’s don’t matter ( they are a meme).
Increasing GOR don’t matter .
Exhausted Tier 1 locations don’t matter .
Increased OPEX don’t matter .
Higher interest ( financing costs) rates don’t matter .
Waste water removal and the cost don’t matter .
Earthquake’s don’t matter .
Plugging old oil wells and the cost involved don’t matter .
Question ? If the above don’t matter , what does ? Did you study economics under Prof Milton Friedman ? Your thinking is like his illustrious student Ben Bernanke . 🙂
Because of the time difference I get posts by Mike S when the American continent is asleep . Here is his latest .
https://www.oilystuffblog.com/single-post/map-of-the-month?postId=2d6426c7-6f03-4ebe-95be-43f5b91be507&utm_campaign=e6bdc598-e080-4d28-9a1d-c7a5ca8358cc&utm_source=so&utm_medium=mail&utm_content=f30d54ce-8ce0-4425-84b5-66371ca61d8f&cid=fa335351-37bb-44a6-9899-f8c34b4a0f81
Hole in head,
DUCs aren’t decreasing, profits matter, costs have been decreasing of late, I use OPEX and Capex levels that Mike Shellmen occasionally mentions, including costs for plugging wells in the analysis. My expectation is that as natural gas pipeline projects come online (there are several under construction) in West Texas that natural gas prices will rise at WAHA. Much of the financing can be done with cash flow so interest rates are not that important. I never said waste water removal is not a problem, that problem can be solved with waste water recycling (it also reduces water use and solves the shartage of water in West Texas). Many large producers in the Permian have said they have 10 years inventory of tier one locations, other producers may only have 3 to 4 years pf tier one locations, when I see a consistent decrease in average well productivity I will believe this is important. Only in 2022 did well productivity fall back to the 2020 level (the highest productivity year besides 2021).
GOR rising is expected, that is what happens to older tight oil wells and the proportion of output from older wells rises as completion rate stabilizes.
Hole in Head,
Chart below looks at Horizontal Wells drilled in Lea and Eddy Counties in Wolfcamp A and B formations and 2nd and 3rd Bonespring Formations (where most of the tight oil wells are drilled). The Data is from Novi Labs. GOR has been pretty steady since recovery from pandemic in June 2020 with average GOR about 3.73 from June 2020 to Jan 2023. Note that data beyond Jan 2023 is likely incomplete for now.
Another scenario that tries to maintain a plateau, Well completion rate in wells completed per month on right hand axis. This is an attempt to match a “rollover scenario” to a plateau. Well completion rate stabilizes around 360 wells per month from 2027 to 2029, URR=38 Gb.
Another set of scenarios for Permian Basin. The highest is my best guess with about 475 wells completed per month, URR=41.5 Gb. Other scenarios have URRs of 16, 28 and 38 Gb. The wells completed from Jan 2010 to December 2040 are 42k, 69k, 93k, and 105k wells. Note that 42k wells have been completed as of March 2023, so for future wells after March 2023 we have 0, 27k, 51k, or 63k wells completed for each of the 4 different scenarios.
A slight variation on 28 Gb scenario above (blue dashed line), in this case I show completion rate on right axis. My expectation is that the odds are low (1 in 25) that output will be this low or lower for the Permian Basin.
Dennis
Thanks. Much appreciated.
The G & R report makes reference to the work they have been doing in cooperation with Novi labs and I felt that they must have investigated the Permian in depth to come to their conclusions. See comment below.
I must admit that the G & R report caused me some conflict between the great work you do with your models, Permian and World, vs Novi Labs and G & R. It is that conflict that caused me to look into the production in the 6 biggest counties in the Permian and present it to the POB participants.
A couple of our participants have mentioned that the pressure in the Permian is dropping and how the GOR ratio is going up. It is the last 4 months of the Lea and Eddy counties that makes me think those counties may be close to rolling over and possibly moving into the bubble point phase. Will this cause production growth from these two counties to slow? As I mentioned in the post we will need information from a few more months of data to see if those two counties are moving into a plateau phase.
The initial data I retrieved from shale experts was for March. Last Wednesday when I checked for more info, their NM data had been updated to April. Interestingly, the data for January 2023 I used to get the two point production growth average had not changed. Next month I will check to see if their April data gets updated.
You note that the number of rigs, 333, is sufficient to maintain production in the Permian. Maybe the frac spread count is more critical than rigs. Recall that in the DPR section, July production, if correct, increased by 1 kb/d. It will be interesting to see how many DUCs they used to increase production by 1 kb/d.
Bottom line, based on what I found is that I think their projection has some merit but I do not consider it conclusive.
I will try to update the Permian section, possibly three months from now to see if some of observations made still have merit.
The big outlier continues to be the price of WTI.
“We have spent the last several months completing and updating our machine-learning models. We owe a debt of gratitude to both the data and analytical insights provided by NoviLabs (formerly ShaleProfile), our data providers. Since we first built our neural network in 2018, NoviLabs has dramatically enhanced its database. Whereas our original models relied upon geographical data (i.e., where a company drilled a well) and completion data (i.e., how a well was drilled and completed), our latest model incorporates actual subsurface geological data. Our original models inferred the best Tier 1 acreage based on nearby well results. Our new model adds geological parameters such as thickness, thermal maturity, organic content, oil in place, porosity, and permeability to make accurate well-quality predic- tions.”
That G & R report is excellent, they have access to far more data than I have. I would caution about reading too much into recent data as it often changes as it becomes more complete. Not sure about wells reaching bubble point, I think we need individual well data to make that determination which I do not have access to, I also do not have the knowledge to make that determination in any case. Enno Peters seems pretty knowlegable and has access to all of the Novilab data.
I would also note that G&R have an estimate for the North Dakota Bakken URR of about 9 Gb, which is very similar to my estimate. The USGS mean TRR estimate is about 11 Gb for the North Dakota Bakken/Three Forks. The F95 TRR estimate for ND Bakken/Three Forks is about 8 Gb. For the Permian Basin the USGS mean TRR estimate is 75 Gb witht the F95 TRR estimate about 44 Gb. My guess is that the G&R estimate of 34 Gb for the Permian is too low by at least 6 and more likely by 10 Gb, note that the ND Bakken/Three Forks URR is about 82 % of the mean TRR estimate. A similar level for the Permian would be a URR of 60 Gb, I don’t think it will be that high, but 34 Gb seems low to me. My guess is that Permian 2P reserves plus cumulative production at the end of 2021 were about 36 Gb, my expectation is that as reserves are developed there may be an increase in 2P reserves. From 2020 to 2021 Permian 2P reserves increased by about 6.4 Gb.
I don’t believe the DPR model is very reliable, I think the EIA official tight oil estimate is slightly better, but even those last few months of data are not all that good as they make a statistical estimate to fill in missing state data and these often need revision. I trust Enno Peter’s analysis, he does excellent work.
Dennis.
When there is discussion of conventional versus unconventional, I think about oil gravity.
I’m not in the camp that claims unconventional oil is junk, it all has a use or it wouldn’t be sold.
However, we continue to receive a strong price for our 31-36 API light sweet, even with its relatively high iron content. I feel we receive a strong price, despite being a very, very small producer in a very, very small field and basin, because there isn’t a lot of this grade of crude produced and it must be desirable compared to lighter shale and heavier tar sand.
Also, I have read Mike’s articles which I think point out the shale grades are becoming lighter. More 50+ API, which, in my uneducated mind is really more NGL than oil.
Do you ascribe any relevance to this issue?
Shallow sand,
The light oil may be less useful, though back in the day the ultra light oil say 45 to 50 API used to trade at a premium as it is easy to refine into diesel, gasoline, and jet fuel. Today most of the Gulf coast refineries are designed to refine heavy oil, it may be that your oil is perfect for any refinery, but I speculate, I know very little about the details of refineries.
The short answer, I don’t know how important the issue is, but it is the reason a lot of tight oil is exported. We would need to reduce tight oil output to 4.6 to 4.9 Mb/d in order not to export any crude from North America. I doubt we could find enough votes in Congress for such a policy, what do oil industry folks in your area think of such a policy? Would they be in support of a ban on crude exports outside of North America?
Percentage of Texas Crude with API Gravity from 40 to 50 degrees, EIA data 2016-2023
Shallow Sand,
There is not a lot of 50 API gravity liquids being produced. EIA data in chart below for
% US L48 Crude with API Gravity more than 50 degrees. Maybe this is a lot more than historically, we only have data from 2015 to 2023, over that period the percentage of US crude with high API gravity more than 50 degrees has actually decreased.
Sometimes what people think is true, isn’t.
I should note Mike’s gravity comments are in reference to the Permian Basin, and in particular Lea County and Eddy County, NM, where most of the oil produced is greater than 40 API gravity.
Shallow Sand,
For New Mexico the average % of crude with API Gravity more than 50 degrees from Jan 2018 to March 2023 was 3.97%. This is actually lower than the Nation as a whole and most of the crude produced is from Lea and Eddy Counties in New Mexico. So this chart is basically output from Lea and Eddy Counties.
Most of the output is indeed 40 to 50 degrees from New Mexico. from Jan 2018 to March 2023 about 84% and close to 90% over the past several months.
Oil from 40 to 50 is pretty good stuff for the right refinery.
Consider that Tapis Crude trades at a premium.
https://en.wikipedia.org/wiki/Tapis_crude
Ovi,
I was thinking about your comment on frack spreads being more important than rig counts. I agree.
Consider the EIA’s DUC spreadsheet which estimates about 495 Permian completions in May 2023 and your Frac Focus based estimate for about 107 frac spreads operating in the Permian Basin for week ending May 19, as a simplifying assumption I will assume 107 frac speads were operating for all of May. The wells competed per frack spread under that assumption would be 495/107=4.63 wells completed per frac spread for May. If that is a roughly accurate average in the future (not known), a scenario with 350 wells competed per month would require 350/4.63=76 frack spreads for the month. It will be interesting to see if the frack spread count in the Permian basin drops by that much.
If we look at the OLS trend for Permian completions from Oct 2022 to May 2023, the trend is decreasing at about 7.6 per year over that period, so if the trend does not get steeper, it will take 19 years for the completion rate to fall to 350 completions per month, even to fall to just 450 completions per month would take about 6 years at the average rate from October 2022 to May 2023. It will be interesting to see how things play out, trends often change.
Ovi, Mike S sheds a light on the GOR etc issue .
https://www.oilystuffblog.com/forumstuff/forum-stuff/wish-america-luck
Stephen Bowers has a comment on OSB regarding the GOR issue .
Mike,
I am not a fan of the drilling productivity report. Looking that the June report makes for an interesting view. Page 9 bottom. Permian oil and gas production Oil +1000 b/d Gas +60 million cu ft. That is a big gas increase, obviously not all from the 1000 b/d oil but a hint of what you have been saying- it is getting gassier.
Dividing the gas production by the oil production gives 3.95 thousand cu/ft per bbl oil. that is a lot of boe’s being produced. “
This is the link to Art Bergman’s critique of the Goehring and Rozencwajg Report.
Permian Production Will Not Peak Because of Depletion
https://www.artberman.com/2023/07/03/permian-production-will-not-peak-because-of-depletion/
You need to be registered to read it. Anybody registered?
Hole in head,
There have been roughly 10.7 Gb of tight oil extracted for the Permian basin as of April 2023. I have the URR of Permian between 37 Gb abd 47 Gb with a best guess of 40 to 43 Gb, call it 41.5 Gb, that would leave about 30.8 Gb of remaining resources that might be extracted, with the 50% cumulative mark at 20.75 Gb (this occurs in Dec 2027 for my 500 well scenario). Note that I don’t think the peak happens at the 50% cumulative mark, except by chance as output rarely follows a Hubbert type curve historically, I do not expect the future will be different.
Dennis –
Could you give a guess at future 1P growth over next 5 -10 years?
2023 – 285 Gb
Maybe you see it leveling off around 250 Gb?
Presumably 2P will level off too as reserves shift from 3P to 2P and so on? I imagine you see 1P growth from high oil price? Although one could argue that we should have seen high growth from prices 6 months ago?
Happy 4th to those who celebrate it!
Kengeo,
1P reserves for the World grew by about 17 Gb in 2022, based on Rystad estimates. 2P reseves fell by about 13 Gb. 2PC resources grew by about 95 Gb in 2022, the 2PC number most closely matches my URR estimate of 2600 Gb. The Rystad 2PC estimate plus cumulative production is about 2756 Gb. So my scenario, if correct would require 2PC resources to decrease by 144 Gb in future years, URR of my scenario is 2612 Gb.
HIH
Thanks. Good catch. I think he agrees with me.
He does, 100%.
HIH
I don’t do twitter. Apparently in Mike’s blog there is mention of Art Berman doing critic of the G & R report. Could someone do a summary.
Art states “less than half of commercial Permian locations have been drilled.” as well as “Permian weighted average EUR is 835 kboe & breakeven price is $37. How is that a dying play”
I feel Art is worth following on Twitter. There’s quite a few interesting talking heads on the platform. It’s worth a scan.
Dennis
Is there a way of comparing your info on the Permian with the above comment.
Further up you state: “There have been roughly 10.7 Gb of tight oil extracted for the Permian basin as of April 2023. I have the URR of Permian between 37 Gb abd 47 Gb with a best guess of 40 to 43 Gb, call it 41.5 Gb”
Based on Gb, the statement implies only a quarter of the Permian oil has been recovered. What about the average EUR per well?
Ovi,
Yes the 10.7 Gb extracted is based on the official EIA tight oil estimates from Jan 2000 to April 2023, if we take 41.5 Gb for URR as my best Permian basin guess, this would be about 26% of eventual URR has been extracted to date (I do not have an estimate of Permian tight oil extracted prior to Jan 2000). For the average 2020 well, my estimate of EUR is about 473 kbo per well. The 835 kboe from Art Berman includes natural gas and NGL, my estimate for that is about 964 kboe, which includes 328 kboe of natural gas (1967 MMCF) and 163 kboe of NGL.
I get a breakeven crude price (where discounted net revenue at an annual discount rate of 10% is equal to a CAPEX of 12.5 million for the well when the well is shut in at 159 months) at $65/bo at wellhead assuming Natural gas sells at 2.50/MCF and NGL sells at 30% of the crude price. The well pays out under these assumptions at 67 months. For a 60 month payout the wellhead crude price needs to be $66.50 (same NG and NGL price assumptions as above) and for a 36 month payout a wellhead crude price of $77/bo would be needed. So Art’s breakeven price is very different from my estimate. I think sometimes these “breakeven oil prices” just cover LOE and do not consider the price needed for a decent ROI. I believe Shallow Sand looks to have his wells payout in 60 months minimum and Mr Shellman aims for 36 months minimum.
Dennis
Thanks for the clarification. Sounds like we are all going to have to stand by and see how it plays out.
Dennis
I can’t comment on the reserve estimates since I have not tracked that data but appreciate that you need that info for your models to determine the peak.
As for the bubble point, I just looked at the charts and figured that when the oil chart falls below the gas chart that the GOR is getting bigger and that if the field is not at the bubble point it is getting closer. The Reeves county chart is interesting. After mid 2021, gas output is almost constant while oil production slowly declines. When the latest data is updated, I think that the currently reported GOR would not change that much after being updated.
Maybe some of our oil experts could say a few words on the bubble point. While it is temperature and pressure related, can one get a clue from the GOR.
Always something to look forward to.
Any comments on the rapidly falling DUC count?
Shallow sand,
As DUCs fall too low, I expect drilling rate will increase to stabilize the DUC count at the level considered best for the operators. Also note the DUC count at Novilabs is very different than what is reported by the EIA. I personally trust the Novilabs data more than the EIA data. For March 2023 Novi Labs has the DUC count at 2208, down from 3197 in March 2022. In October 2022 Novilabs has 529 first flow wells in Permian and the DUC count was 2901 that month. That would be over a 5 month inventory of DUCs. In Jan 2020 about 500 wells were competed and the DUC count was 3190, just over a 6 month inventory. The data after October 2022 may not be complete so DUC count might be inaccurate after October 2022.
Based on the Novilabs data DUCs are not an issue.
Chart below from Novi labs Permian report linked below
https://novilabs.com/blog/permian-update-through-april-2023/
Ovi,
No for the Permian model I do not use URR to determine the peak, I use the prospective area (about 30 million acres) and area per well (a 10k lateral well spaced at 1320 feet as suggested by LTO Survivor which is about 295 acres per well). That is about 100k wells. For the USGS scenario there are a total of 50 million prospective acres to be developed, I take the most productive 30 million acres which have a TRR of about 50 Gb. That is the basis of the model. I use well profiles developed with data from Novilabs. I am just pointing out reserves based on the assumption that 2P reserves are about 1.7 times 1P reserves as I found by looking at UK data. The 1P data for the Permian can be found at link below.
https://www.eia.gov/naturalgas/crudeoilreserves/excel/Table2.xlsx
Note that for recent Rystad estimate for World Reserves (June 2023) for Non-OPEC reserves the ratio of 2P to 1P reserves is 1.67, so the 1.7 I used is pretty close for non-OPEC reserves Worldwide if the Rystad estimate is correct.
If I use the 1.67 ratio for Permian 2P to 1P ratio, then cumulative output plus 2P reserves is 35 Gb and 2P reserves increased by 6.3 Gb from 2020 to 2021.
Most of the GoM drop came from maintenance at Appomattox (maybe including brownfield work for Dover and Rydberg tie-ins), Thunder Horse and Horn Mountain.
George
Thanks for explaining the GOM drop.
Wonderful work, with lot’s of important details and observations, thank you.
Although I would admit that Goehring and Rozencwajg maybe missed some – still ongoing – major growth outside Opec from Brazil (currently around 3,3m bpd, still adding FPSO’s) or Argentina (projected to reach 1m bpd from Vaca Muerta shale next year)
https://tradingeconomics.com/brazil/crude-oil-production
Envison
I have production data up to April. It is lower than January 2020. I keep reading that Brazil will be increasing production but so far it is slow and unsteady.
Happy Independence Day America
🎇🎇🎇🎇🎆🎆🎆🎆
Gerry – Thank you for this wisdom, fascinating too!
Don’t drink the water!
Mr Maddoux , you just hit the ball out of the park . Hopefully it will hit a zombie who has his eyes or ears glued to his smartphone . 🙂
Gerry,
Thanks for this information, I was not aware of the use of PFAS chemicals in fracking.
Large companies would simply declare bankruptcy to avoid litigation, the fracking would continue and they would stop using the PFAS chemicals. I am not a lawyer, but usually companies have lawyers that can find ways around these problems. As to Carlsbad formations, I imagine the geologists and geophysicists are well aware of this.
I agree models will often be incorrect as I will make assumptions that are incorrect. I do not know all, nor have I claimed omniscience, I do the best I can with the information I have, which is limited. My best guess scenario has roughly 60k more wells drilled in the Permian basin, with about 30 Gb more oil extracted (about 11 Gb has been extracted from Jan 2000 to April 2023). Care to make a more educated guess on future extraction of tight oil from the Permian basin?
Article on PFAS in fracking
https://www.ehn.org/pfas-fracking-2657471451/pfas-in-fracking-fluid
also see
https://psr.org/new-report-fracking-with-forever-chemicals/
INTERESTING…
What happened to Gerry Maddoux’s comment? I read it on another computer about an hour ago and now it’s gone.
Gerry… did you delete it?
steve
Steve,
He must have decided to delete it. People have about 3 hours to change their mind and delete a comment they have made, I respect their decision to do so.
I deleted my post because I have consistently found it impossible to articulate the fragility of the limestone karst underlying what is now known as the Delaware Basin. And also, Mr. Coyne, because I was sure that you would provide a couple of reassuring articles showing that my concerns were hysterical screeching of some old curmudgeon lost to the times.
The story here is not so much the use of polyfluoroalkyl substances in the fracking solution, but rather the fact that that particular area was gone over with a geological microscope during WIPP (the nuclear Waste Isolation Project), but somewhat after the fact, when Congress finally ordered a study that should have been done at the front. After a substantial deposit of uranium waste was interred there, with the thinking that salt creep would entomb it, a discovery was made that not only was there a high radioactive level in the area aboveground, but that there was a lot of oil nearby. This WIPP deposit is on the eastern edge of Eddy County, almost to the border with Lea County, the area that is written about as the future of American domestic oil known popularly as the Delaware Basin.
And lo and behold, into this limestone karst that was built long ago from carbonate evaporates like the Carlsbad Caverns, the area that has breccia pipes and moisture-seeking conduits that eventually hook into the largest underground aquifer in the U.S.–the Oglala–was apparently injected the forever chemicals that have a habit of getting through fissures and infiltrating the water supply. So now, this fragile area that appears so desolate but holds geologic hands with the water supply is not only contaminated with radioactive waste but these chemicals. And in a state with a Trade Secrets Act that allows a company not to divulge the chemicals they used until after the fact.
I find this alarming, that on arguably the biggest oil blog, everyone is so damn busy constructing charts on the “future growth” of the Permian Basin (which is, at this time, basically the Delaware because that’s the only part that’s growing) no one ever mentions the fact that this is also an area of unusual karstification, and that the Oglala Reservoir is nearby, and that this is a geological/chemical/nuclear disaster cleverly hidden by greed and oversight. I am not sparing New Mexico, which wears the ecology hat while raking in the money. I’m not even sparing myself–as I make a good portion of my income from unconventional oil. and gas.
What I was trying to do was bring attention to the VERY FRAGILE nature of the area. It is a karst unlike any in the world. When you go underground in Carlsbad Caverns, and notice that it’s sort of damp, and that evaporates have hollowed out the earth and that stalactites and stalactites have formed, this is what it is like on a smaller scale in much of the Delaware Basin. I deleted my post because I can’t transmit that concern without being whacked over the knuckles by the teacher who knows better. Well, the crack WIPP team knew better than the geologists from Sandia Labs too, until they had put a bunch of low level radioactive waste underground. The salt creep didn’t take care of the stuff, because that takes many years.
Color me crazy, just an old fart with too much worry in my head, but this was a piss-poor area to put radioactive waste and it’s also a piss-poor area to allow the injection of “trade secret” chemicals down holes. It might be okay if they stayed there, but like the uranium, they don’t. Instead, waste water is taken by truck into Texas, where it is deposited into deep, well-sequestered disposal wells, only now those are full, and the pressure is high, and Mother Nature is really pissed off, and there are almost daily earthquakes, and when a large enough earthquake hits, this crap is going to get into the fissures of the earth, and go wherever the fissure goes.
All I’m saying is there are some things that can’t be shared in a graph. Go look at the geology and the nature of these chemicals before you tell me that I worry too much, it’ll be okay. After my time, at some future date, this fragile, beaten-to-death place where wells are being spliced into the ground like a quilt, very close to the old WIPP site stands to put some very large oil and gas companies out of business. Because New Mexico gets almost 90% of its drinking water from the ground. And I fear that we’re contaminating it. Thank you for letting me take the space to scratch the surface of a topic that has been poorly exposed. I’m quite sure that I’ve lost my way, addled beyond help.
Gerry,
I for one appreciate your comments and your expertise. A few of us on this blog, live outside the U.S. And don’t know the details of whats going on in the Delaware basin.
I think i can speak on behalf of most other people on this blog that your views and knowledge in the field is invaluable and much appreciated.
Gerry, bravo for this.
MORAL: Apes will do ANYTHING to continue BAU.
Gerry, to quote Lyle Lovett, ‘your not from Texas but Texas loves you anyway.’
I often refer to the Delaware Basin as the Sacrifice Zone. What exactly do Texans and New Mexicans sacrifice so that over 85% of the tight oil extracted underneath them can be exported to foreign countries?
Pretty much everything. Groundwater and groundwater quality, mostly. A way of life. Family traditions of raising what scrawny cattle will live in this country, that the earth trembles under their feet constantly; 8 earthquakes today, Wednesday, alone. That the air reeks from H2S, particularly in the area you mention in New Mexico.
All of that. I drive thru this country frequently. My friend from Midland now calls it Waste Texas. He is IN the oil business, BTW, just like you and I are.
How does one predict the end of usable quality water in an arid part of the West? You don’t. And therefore ALL predictions of the future of oil from this region is a big ‘ol fat assumption, with total disregard for extenuating circumstances that negatively affect real people. It’s the Sacrifice Zone. No amount of lawyers, or pseudo increases in recycling produced water is going to fix this easily. No ifs, ands and buts apply to this problem. Its real.
And you are precisely correct. 1701 N. Congress Avenue in Austin now allows New Mexico, tired of fouling their water, to send it to Texas to ruin our groundwater. There is nothing we won’t do in Texas to ensure we are draining ourselves of fucking everything, for the sake of oil exports. Nothing.
Thanks again.
Mike,
Do the fracking fluids mix with the ground water? It seems the Ogallala Aquifier is generally between 50 and 500 feet from the surface on average, though there are a few places where the bottom of the Aquifier might be as deep as 1500 feet in parts of Nebraska. Are there a lot of problems with fracking chemicals mixing with groundwater? The Second Bonespring to Wolfcamp B formations are at around 4500 to 9000 feet below the surface.
Article below talks about PFAS chemical use in New Mexico Oil and Gas Operations.
https://www.currentargus.com/story/news/2023/04/12/toxic-forever-chemicals-found-new-mexico-oil-gas-wells-pfas-fossil-fuel-permian-san-juan-basin/70100118007/
Also see
https://www.nytimes.com/2021/07/12/climate/epa-pfas-fracking-forever-chemicals.html
Perhaps these chemical should be banned from use in fracking. I guess Colorado has already done so.
https://www.ehn.org/pfas-fracking-2657471451.html
On a short-term and superficial basis upon which we consider most things…hydraulic fracturing has been ‘safe’ to this date,
however groundwaters are not some simple uniform pocket of water. And diffusion of chemical in liquids is not a fast process.
Study Links Fracking, Drinking Water Pollution, and Infant Health-
Apr 11, 2022 — “Our research reveals that fracking increases regulated contaminants found in drinking water, but not enough to trigger regulatory violations.”
Univ of Rochester
Are you confident that regulations are strong enough, or enforced with enough vigor and extent to protect the groundwater? Nothing stands in the way of producing a field as big as the Marcellus or Permian. Lets be honest about that.
“Both flowback and produced water may contain (PDF) heavy metals such as barium and lead (PDF), hydrocarbons, naturally occurring radioactive material, and incredibly high levels of salinity. Flowback and produced wastewater can also include chemical additive formulas, with volatile organic compounds (VOCs) such as benzene, ethylene glycol, methanol, and toluene. Between 2005 and 2013, the EPA identified 1,084 chemicals reported in fracking formulas.”
To put it simply, I wouldn’t want my kids or other people I care about, drinking water or eating food produced with that groundwater or surface waters in the watershed.
Wouldn’t want to live anywhere near a refinery either.
Hickory,
It seems to me that PFAS chemicals should be outlawed. But I am no expert on these matters. Humans create lots of bad stuff with both intended and unintended consequences.
No I am not at all confident that these processes or chemicals are safe. People from the oil industry might have a different perspective.
Most of us have made the choice to look the other way on just about all of these issues.
Apparently its the the human method-
to Pretend/Pray that the repercussions come far behind you.
Rarely do frac fluids communicate with groundwater; almost never. In the Scoop/Stack those OK idiots could not keep a frac in zone if they wanted to and they WERE destroying shallower conventional production AND groundwater.
Shit happens. It happens a lot in the oilfield. Its NOT just about numbers.
The bigger issue, as Gerry lays forth, is injection of contaminated frac fluids/produced water into groundwater sources from SWD communication, poor cement, etc. THAT happens. In New Mexico it happens a lot. You have to understand the geology of that region to understand.
It’s not something you can fix, Dennis Coyne. You can’t dismiss the impact of this on real people in the Sacrifice Zone. Your comment about lawsuits being resolved, no big deal, is callous; it pissed me off, and, clearly, Gerry. You can’t make real life problems go away with a click of your mouse.
EURR is bull shit in analyzing tight oil plays unless you understand the extenuating circumstances that affect extraction. Water going into the Permian and particularly water coming out, is a disaster.
You seem to think that this will all sort itself out some day. Well, that is not rational. The Permian has been dealing with water issues for 8 years now because of the tight oil play and the tight oil sector has basically done nothing, or not much, not near fast enough.
If they had, why are we even discussing this? They’ve run the spectrum of oil and gas prices, they KNOW what the problems are. They had the money to begin resolving this issue, they didn’t. Now, they’re running out of water. They are causing earthquakes, man. Ever felt one?
What makes you think somethings is going to change so your models work?
Mike,
Often big companies get away with doing the wrong thing. I don’t support that, I was trying to state things as they are, production of oil and gas seems likely to continue in New Mexico and in Texas.
Perhaps all extraction of oil and gas in the Delaware basin will cease. This seems unlikely to me. As to my models being correct, you may not have gotten the memo.
They won’t be. The chance that anyone predicts the future correctly has a probability of exactly zero. I say this over and over. The model makes many assumptions about the future such as wells being completed at about 450 per month in the Permian basin (or 350 per month, 500 per month etc). If no wells at all are completed in the Permian basin after March 2023 we get the scenario below. The correlation coefficient between Jan 2010 and March 2023 from Model to data is 0.9982. I doubt this is what we see, but it is what we get if we assume no wells are completed in the Permian basin in the future.
My point on the lawsuits was that oil and gas are likely to be produced in the future in the Delaware basin. Will this cause problems? Yes. It is up to the citizens of Texas and New Mexico and the people they elect to represent them in government to make any changes needed. Not a lot I can do about it.
As to pissing you off Mike, anything I say does that, you would take a complement as an insult as long as I was saying it.
Should PFAS chemicals be banned in Texas? Should fracking not be allowed at all? What is your position? If recycling of frac water were mandated by the RRC and the equivalent regulatory body in New Mexico, would that help the water situation?
Bad stuff can always happen, oil and natural gas production could be stopped altogether, but I imagine you would think that’s a bad idea. I certainly think so.
Thank you Gerry Maddoux. Much I did not know.
Gerry,
Did the articles I linked say this was not a problem? Quite the opposite imo. Did you read them?
My point on the lawyers and bankruptcy was that oil and gas production seems likely to continue. Unfortunately, corporations seem to be able to get away with murder in the US.
The biggest recent addition to GoM production has been from Kings Quay, which had a very smooth start up and has been producing well above expectations (90 to 100kbpd, which is close to 100% availability). However some decline might be about to set in as water has started to be produced quite early and the cut is increasing fast in Marmont and Khaleesi fields.
Mad Dog phase I water cut has been increasing steadily and looks to have started to be impacting oil production in the last six months (i.e. total liquids may be hitting design limits) so BP will be to get Argos (Mad Dog II) ramped up. It was reported as starting in April (after over a year’s delay because some equipment had to be rebuilt) but there hasn’t been much news yet.There are a couple of qualified Mad Dog leases that have not reported production and these may be hiding the data. Argos has a significantly higher nameplate capacity than Vito (100 to 140 versus 70kbpd) so will have a bigger influence on any maximum production for the rest of this year. Most fields are in decline and on average around 15kbpd is lost each month from mature wells, but this gets a bit lost in the noise of maintenance issues and new well start ups, plus hurricane shut downs may soon start to have an impact, though this is usually in late summer and autumn.
Checking the well report from BOEM two wells were started up in Mad Dog in the second week of April at 13 and 14 kbpd (total 19 net average), one in a newly opened lease. These weren’t reported in they lease or area numbers so may not have been included in EIA numbers.
When people talk about average decline rates of global production being 10 or 20% in a certain time frame it superficially doesn’t sound too tough. A few percent decline/yr, on average. You can picture gradual adjustments.
But keep in mind that the average doesn’t happen at very many locations.
Some places will experience little decline in supply, while others will experience a big decline.
There will be instability, more than due to the uneven supplies on the way up.
Link to Permian discussion in G&R report
https://blog.gorozen.com/blog/the-permian-basin
For the G&R report they make a mistake on cumulative Permian tight oil output which is 10.7 Gb, not 14 Gb as they claim. If we use their 34 Gb URR estimate and the correct cumulative output with my 450 well per month scenario, then 50% of cumulative output is reached in May 2026, and for my 40 Gb URR estimate 50% cumulative output is reached in September 2027.
I came across this older projection for the Permian from October 2021 at http://www.shaleprofile.com and it has a similar profile to my 450 well scenario with URR=40 Gb.
Excellent remark Dennis.
Rystad: Underinvestment Claims In Oil & Gas Are Exaggerated Bold mine.
Persistent claims of chronic underinvestment in the global oil and gas industry are overblown, Rystad Energy research and analysis shows. Investments in the upstream sector have tumbled since spending peaked at $887 billion in 2014, with about $580 billion expected to be invested this year. The number of completed wells has also fallen, from 88,000 in 2014 to 59,000 this year.
As a result, many market participants predict that this trend will continue and lead to chronic underinvestment and an oil supply shortage in the coming years. However, our modeling and analysis tell a different story. Lower unit prices, efficiency gains, productivity gains, and evolving portfolio strategies have significantly increased the upstream industry’s efficiency. In other words: the industry can do the same as before, but at a much lower cost. Although investments have shrunk, activity and production remain healthy and on par with the levels seen from 2010 to 2014.
50 minutes video . Tainted —yes but still interesting from POV of DUC’s , falling rig count , fracking crew availability etc .
https://www.youtube.com/watch?v=4mfZjkD6nsc&t=29s
HIH
The interesting comment I heard there was that the Saudi’s need to rest their fields.
The water flood does break through the water oil interface in a lot of places and the water heads for the well bore faster than the oil.
UAE crude capacity reaches 4.5mn b/d
This is 1.5mn b/d that they are currently producing.
Vienna, 5 July (Argus) — The UAE’s crude production capacity has risen to 4.5mn b/d, a source with knowledge of the matter told Argus today on the sidelines of the Opec seminar in Vienna.
Previous guidance from UAE sources last year put capacity at 4.2mn-4.3mn b/d. The new figure — which is 1.6mn b/d higher than Argus’ estimate of UAE output in May — puts the country on track to hit its 5mn b/d capacity target by 2027.
Abu Dhabi’s state-owned Adnoc set the 5mn b/d target back in 2018 when the UAE’s capacity was just 3.5mn b/d. At the time, it said it aimed to reach the milestone by 2030, but last year it brought the timeline forward by three years.
Adnoc has a $150bn capital investment budget for 2023-27 to help it meet the capacity growth target.
By Bachar Halabi
https://www.argusmedia.com/pages/NewsBody.aspx?frame=yes&id=2466153&menu=yes
Iran’s crude output edges past 3mn b/d
Vienna, 5 July (Argus) — Iran’s crude production has passed the 3mn b/d mark, according to the country’s oil minister Javad Owji.
Speaking on the sidelines of the Opec seminar in Vienna today, Owji said Iran’s total oil output is currently 3.8mn b/d, of which 3.07mn b/d is crude and the rest condensate. Last month he put crude production at 3mn b/d. Argus’ most recent assessment of Iran’s crude output was 2.78mn b/d in May, the highest monthly level since January 2019.
These production numbers are higher than the OPEC numbers in the MOMR and higher than the EIA’s C + C numbers.
Tehran’s success in growing its crude output this year is notable, given talks to revive the 2015 Iran nuclear deal have hit a brick wall and there has been no movement on sanctions relief. Iran has been active on the diplomatic front in recent weeks, engaging in a flurry of activity with Mideast Gulf states and EU officials. This has renewed hopes that some form of de-escalatory arrangement, if not a fully fledged deal, can be reached between Iran and the US.
Iran is satisfied with the trend of negotiations, Owji said, while another high level Iranian source said his “hunch” is that negotiations “will lead somewhere, some sort of small understandings”.
Capacity boost
Looking further ahead, Iran hopes to increase its crude production capacity in the coming years. This includes a target to ramp up capacity at the South Azadegan oil field to 540,000 b/d, up from 190,000 b/d now and 165,000 b/d in May last year.
“We have really good offers from the Chinese and the Russian companies. They submitted proposals,” Owji told Argus.
I noticed this from last year, which indicated OPEC+ ran out of spare capacity last November (since then new developments may have added some capacity, e.g. in UAE). I’m not sure what the block marked “Projected” is supposed to show.
https://bisoninterests.com/content/f/2023-outlook-buying-the-seasonal-sale-in-oil-gas-equities
Oil supply is strained both in OPEC+ and non-OPEC countries. OPEC+ is nearly out of spare capacity, as we first predicted in September 2021. Many smaller OPEC+ producers have been struggling to meet production quotas for some time now, while output from the few producers who have some spare capacity may also be on the decline. In aggregate, OPEC+ has repeatedly missed its quotas for more than 2 years now—even after a 2MM bbl/d cut—and total OPEC+ total production levels may be topping out for now:
In consideration of these quota misses and lower global oil prices, OPEC+ may be incentivized to cut production further here—a move which could reverse the negative momentum in oil prices entirely on its own, absent a significant global economic downturn. And even if OPEC+ maintains its production quota, it is likely it will continue to struggle to meet it, which may result in a 3.9MM bbl/d market shortfall from pre-cut expectations:
George
I find the article to be a bit strange. Maybe because it was published in December 2022. Based on all of the post 2022 cuts, there appears to be a lot of spare capacity.
What was more interesting to me was the two recent article on the right regarding consolidation in the Permian and the price being paid.
I guess the buyers are betting on better future oil prices while the sellers are taking some of that future price today.
https://bisoninterests.com/content/f/civi-acquires-permian-assets-at-a-healthy-valuation
https://bisoninterests.com/content/f/este-buys-novo-for-a-modest-price-upside-for-vtle
Oil giant Shell warns cutting production ‘dangerous’
Six years ago, Shell was promising to cut oil production. The new CEO Sawan has overturned that decision.
https://www.edie.net/new-shell-ceo-drops-targets-to-reduce-oil-production/#:~:text=Under previous chief executive Ben,these commitments null and void.
https://www.nytimes.com/2017/11/28/business/energy-environment/shell-carbon-oil.html
On BBC this morning: Wael Sawan insisted that the world still “desperately needs oil and gas” as moves to renewable energy were not happening fast enough to replace it.
He warned increased demand from China and a cold winter in Europe could push energy prices and bills higher again.
Mr Sawan angered climate scientists who said Shell’s plan to continue current oil production until 2030 was wrong
https://www.bbc.com/news/business-66108553
I am in the process of expanding the work in the post regarding some of the most productive counties in the Permian and need to start to build a database. Before going too far I would like to present three charts and see if the information is correct and if the units make sense. If not please let me know what the industry standard is, in particular for the notation.
The first chart is for Midland county oil and natural gas production, similar to the one in the post. The chart will be digitized and converted to production per day, as opposed to a month in the original chart, and is shown the second chart below.
https://www.shalexp.com/texas/midland-county
The oil part of the chart is straight forward. It is the NG graph that needs a check from some industry experts since the numbers are huge. I know things in Texas are huge so I would like to confirm that these gas numbers are really huge.
The 67,478,006 number, shown on the right side, in words is 67.5 million mcfs of natural gas produced in the month of March. In the second oil and gas chart, that turns out to be 2,177 Million ft^3 of natural gas produced each day in March 2023, on average. The MM on the right NG axis denotes millions of ft^3/d. A huge number.
The third chart plots the GOR. I could not find a consistent definition for this Ratio. Some used a non-dimensional number of NG BOEs/oil. Others used a mix of NG volume and oil barrels. I have started with
k (MM ft^3/d)/(kb/d). In words this is thousands of Million ft^3 NG per day divided by kb/d of oil. Using the numbers from the oil and NG chart for March 2023, the GOR is 2,177/594 = 3.67.
Improvements, suggestions and corrections would be appreciated.
Oil and NG Chart
GOR
Ovi,
For Texas you can get this data directly from the Texas RRC at link below
https://webapps.rrc.texas.gov/PDQ/home.do
This is the source for most Texas data, there is much more information available besides this, at
https://www.rrc.state.tx.us/resource-center/research/research-queries/
Ovi,
New Mexico data can be found at link below
https://www.emnrd.nm.gov/ocd/ocd-data/statistics/
Dennis
Thanks for the two links above.
Ovi,
You’re welcome. I did a quick check on your chart using Texas RRC data for Midland County and it looks the same. I would note that the final 6 months of data are incomplete so the chart might change a bit as more data comes in. You can also get county level data at the New Mexico State Site.
Lea County has a GOR around 3 MCF/bo.
Data from
https://wwwapps.emnrd.nm.gov/ocd/ocdpermitting/Reporting/Production/CountyProductionInjectionSummary.aspx
The GOR for Eddy County is much higher than Lea County, an average of 5.1 MCF/bo over the April 2022 to March 2023 period.
Lea and Eddy GOR compared on same chart, Jan 2015 to March 2023.
Dennis
Thanks for taking the time to do the check. Good to know that the ratio is around 3. I can now drop the k and d in the numerator and denominator in my GOR units and simplify the units to Mcf/b.
No Problem. I was interested in seeing how Eddy and Lea Counties were doing on GOR, I was not aware there was such a large difference in GOR between the two counties, I expected them to be similar.
Ovi, you’re onto something grand. Those who understand me know that I’ve always been of the opinion that NG was the anatomic killer of shale oil basins: the black eye because of violations of venting and flaring, and the Achilles heel because there’s so much NG that it has to be vented or flared. In the past, we got a gestalt of the magnitude of flaring from videos showing Midland and London at night. It became obvious that the reported NG production measured at the wellhead grotesquely underestimated total production. Now it’s measurable.
NASA tricked up the International Space Station with devices to measure methane emissions around the world. This methane program (EMIT) has detected many more super-emitters than was anticipated (over 50). Not surprisingly, the largest were in China, but the Turkmenistan oil infrastructure is a mess, and the Baltic Sea has methane blowing out the water. Also not surprisingly, the Permian Basin–specifically, the Delaware sub-basin–produces torrid methane plumes. Just before Christmas last, the EMIT picked up a total invisible (to the naked eye) super-emitter that appeared to be coming straight out of the Pecos River near Carlsbad. It was not clear (to me at least) whether that was from a nearby well, or an accidentally-opened-up fissure in the karst.
My point? Methane gas production in the Delaware Basin is the sum of methane venting and flaring, accidental fissures in the earth blowing out nature’s compost, and of course, what is reported as captured production. I think NASA is going to be able to report volumes of methane in the troposphere. That sum has never been reported anywhere. And since New Mexico is a progressive state run by a Democrat governor and legislature, and since the Secretary of Interior is a Native American woman from New Mexico, I would be damn surprised if that sum–plumes + recorded production–didn’t roll some heads. I’m not out to trash the shale oil, or Delaware production, but rather to slow it down, induce some head-scratching, implement some programs to have near-zero methane emission while producing captured methane.
I mean, someone smart has to be in charge of looking at environmental damage: fresh water, fracking materials, measurement of toxins, methane plumes. And also be atuned to the fact that drilling is occurring very close to the old WIPP site. I get the feeling that NM is conveniently ignoring these things, or even more devious from a conspiracy theory, collating the data to use after the fact.
I hope this wasn’t too convoluted. I cannot over-emphasize that the measurement of NG production in a shale basin has to be the SUM of that which went into a pipeline and that which was blown into or burned in the air. I hope. this is helpful. Thank you for doing your work in a thoughtful way.
someone smart has to be in charge of looking at environmental damage:
I’m just going to leave that there for its spectacular historical irony.
Watch it happening live, here:
https://viirs.skytruth.org/apps/heatmap/flaringmap.html#lat=32.80848&lon=-103.37361&zoom=5&offset=15
Gerry
Thanks for the update. I am assuming/hoping that more is being captured now.
These charts show proved reserves and production of crude, condensate and NGLs for IOCs and larger independents as listed. Reserves have dropped by about 25% over the period shown, a large part was BP’s sale of Russian assets last year. Until the big, forced Russian sales, trades had been slightly negative for the group over the period shown (i.e. the majors have generally not been “exploring on Wall Street”). The was a bump in reserves in 2018/2019 which might have been thought from USA LTO, but probably wasn’t (total USA holdings are shown for comparison, but are slightly low as some non-US companies report US production combined with “other international” and have not been included). Organic reservoir replacement has been just under 100%, hence the gradual decline. Undeveloped reserves were keeping to around 40% until the 2015 price crash, but have fallen to 34% now, if the recent decline trend continues then there will be no more new projects sometime in the 40s. Discoveries and revision rates are quite volatile but both appear to be falling off since 2015 and recent running average for revisions is tending towards zero, implying probable reserves are running low (again, however, the Russia effect may be significant here).
Production has fallen in step with reserves so that R/P has been maintained at around 9.5 to 10, but the proportion of production from the USA has risen significantly (i.e. the R/P there has been falling).
Natural gas reserves have fallen 25% since 2006, but 30% since a 2010 maximum. Organic reserve replacement. has been clearly declining. The ratio of undeveloped reserves has dropped steadily from 30% to 20%. The ratio of reserves in the USA has remained fairly constant, when I would have expected it to rise. Average discoveries and revisions have been trending down steadily, but remain fairly positive. Given that natural gas production peak is expected to be some years in the future whereas crude’s is likely in the past the relatively rapid recent decline in gas reserves shown here was a bit unexpected.
Gas production has been kept high so R/P has fallen, although is still above ten years.
Dennis
Your often quoted stat that cars consume half of global oil consumption is not correct.
https://www.bp.com/en/global/corporate/news-and-insights/reimagining-energy/spencer-dale-on-electric-vehicles-and-future-energy-demand.html#
Cars consume around 20million barrels each day and HGV consume the same.
This changes considerably when oil consumption will start to fall due to electric car sales.
Charles,
I define “oil” as C plus C, I do not include biofuels or NGL from ethane, propane or butane. I expect both light and heavy duty transport will move to electricity, reducing demand for oil by 40 Mb/d or more over the next 25 to 30 years. So it is not cars, it is all road transport that consumes roughly half of C plus C, some long haul heavy duty transport will move to electric rail, short haul and some long haul heavy duty trucks will use batteries.
D Coyne,
The metals aren’t there to go electric. See Simon Michaux.
Also Shell’s CEO says oil demand dropping doesn’t look realistic:
https://www.bbc.com/news/business-66108553
Anon,
There are different opinions on resources to accomplish transition to electric transport. Also there are different opinions on demand dropping. The future is not known, we can only guess.
Consider
https://insideevs.com/news/675163/norway-plugin-car-sales-june2023/
Norway seems to be leading the way (90% plugin light duty vehicles with 82% BEV in June 2023), maybe they will be the first to transition to heavy duty vehicle EVs as well.
Volvo is working on this
https://electrek.co/2023/06/29/volvos-heavy-electric-truck-runs-12hrs-a-day-one-charge-break/
Smoke and mirrors Dennis
565kwh battery travels 275 miles on a charge power is equivalent to 13gallons of diesel and even if you factor 33% efficiency so 40gallons of diesel equivalent burn at 7mpg is 280 miles. Retail price of electricity is approximately .20kwh so $113.00 dollars to charge the batteries unless you’re lucky enough to live in Germany who are early renewables adopters, there a fill up is more like $192.00. Diesel at $3.50 is $140.00 and takes 10 minutes. Not hours charging.
Here’s the real rub most electricity is still coal and gas. So once you figure in generating and distribution losses you’re only at 30% efficiency at the charging station.
So guess what no reduction in CO2 and no savings.
https://www.volvogroup.com/en/news-and-media/news/2022/jan/news-4158927.html
Would you like to include initial cost of an EV semi vs ICE and life cycle? And the fact that presently EVs are not paying their fair share of road tax which will have to change as more are used?
And 90 % adoption in Norway is a meaningless answer (66,000 cars) to the issue that there aren’t enough mineral resources globally to make a shift to EVs .
Maybe smart money would say how about the global electric system prove they can produce electricity without any fossil fuels 24/7 before we build a bunch of coal and NG powered EVs. Unless of course you’re selling something or have your head in the stimulus feeding trough. It’s kinda a cart before the horse scenario but there isn’t a horse in sight🤦♂️
JT,
For light duty vehicles total cost of ownership is lower for EV vs ICEV, this will be true for Heavy Duty Vehicles as well in time. The point is to reduce oil use, in time the grid can transition to non-fossil fuel, this will accelerate over time.
keep in mind – money and therefore “prices” are not real. they are imaginary.
https://www.project-syndicate.org/commentary/marginal-cost-pricing-for-electricity-disastrous-in-europe-by-yanis-varoufakis-2022-08
JT,
Diesel costs a lot more than $3.50/ gallon in Germany, it is about $6.68/gallon as of Junly 3 , 2023. Current elecricity prices in Germany are about 11 cents per Kwh. The average 18 wheel truck gets about 6 miles per gallon, so 275 miles requires about 46 gallons of diesel fuel at $6.68/gallon or about $307. 575 kwh times 11 cents is $63 about one fifth the cost, also the EV has lower maintenance cost than an ICEV. Over time they will become less expensive as battery manufacturing expands and batteries become cheaper over time. TCO will be cheaper for EV heavy duty trucks. For long haul transport charging may be a problem, but they will work for short haul applications. Long haul would be better served with electric trains.
Dennis
Read the BP article.
Cars use 19 million barrels per day.
That is only a quarter.
Globally If all 70 million new cars were fully electric they would not keep up with decline rates.
When you add in increasing use from aviation and marine transport and an additional 80 million extra people each year there is no chance demand will fall faster than peak decline.
Charles,
Heavy duty trucks use another 20 million barrels per day, that demand can also be reduced with electric trains and short haul trucks.
Dennis
How many rail lines have been electrified in the States or Africa?
Then you have to scrap all the locomotives.
How many of the 400 million hgv vehicles are electric? At the moment they run just a short distance. If peak oil is in 2028 we are in serious trouble.
Charles—
Peak Oil so far is Nov 2018 globally.
We must embrace reality.
Will it be surpassed?
We will see, but reality needs to be embraced.
Charles,
First light duty vehicles will transition to electric, then heavy duty vehicles. Not a lot of electric trains in North America, except public transit in cities, that can change.
One of the big reasons why electric vehicles are important is not road transport, it’s building the battery expertise and resource base to make electric storage systems cheap enough to store intermittent renewable electricity. That appears to be happening as battery prices continue to drop and efficiencies improve. People are willing to spend a lot of money on cars and this is what’s needed to get the battery industry off its feet.
Pemex are having some terrible problems, hope the loss of life is minimal.
https://twitter.com/oilmutt/status/1677394447720390668?t=BKlfAE8pJadDzcJSfIZ4Cw&s=19
I thought World (International) Data would be out yesterday. It did not happen. But surely it would be out today. It did not happen. What the hell is going on at the EIA? This is the most important data of them all. Why are they so damn slow in getting it out? Perhaps the Department of Energy is shutting down.
Ron have you ever worked for the government?
The only guy that knows how to run the software and has worked there for 20 years
may be off sick.
It happens.
Late stage capitalism was always going to be messy.
Weekend Rig, Frac, and WTI report for week ending July 7, 2023
Hz oil Rigs are down by 6 and down to a new recent low of 489.
The biggest drop occurred in New Mexico 4, back down to 97 where they were in April 14, 2023. It is amazing how NM production continues to rise with 97 rigs. NM rigs have been bouncing around 100 since last June. See last chart.
Permian is down 5 to 320, lower than Sept 16 2022 when it was 321.
Texas rigs are down 2 to 285, lower than April 8, 2022 when there were 287 operating.
Hz NG rigs were up 11.
Frac spreads dropped by 12. Can Texas heat be a factor in the drop?
WTI
WTI broke through the 50 day moving average today and just as important, WTI moved into backwardation. This implies increasing demand and maybe the Saudi cut of 1 Mb/d for July is taking hold.
two counter points to that:
1) demand – https://www.reuters.com/markets/asia/taiwan-june-exports-mark-worst-fall-14-years-weak-china-us-demand-2023-07-07/
2) speculative net long oil positions are very low – https://www.investing.com/economic-calendar/cftc-crude-oil-speculative-positions-1653 – in fact, this is the lowest since July 2012. counter-counter: even if oil prices just hold steady, the shorts would be pressured to unwind. unwinding these positions would lead to a brief but significant price spike. not a good time to pile in with the crowd.
support for your point: international opec meeting was this past week with Saudi Arabia rattling the sabre. October, April, June, July were cut announcements. It has actually kept oil prices about level – On September 26th, a day before the cut news cycle started – oil was $76.25. It is now $73.86. That’s actually really good price management on the side of the Saudis. (Maybe we should let them run price controls for everything /sarc?) what I mean to say is – to borrow a phrase they used to say during the QE days, “Don’t Fight the Fed(ayeen)”.
TwoCats
Good points but the articles reflect the past. I think WTI price action reflects the future, say 3 to 6 months. I was surprised that the July Saudi cut announcement did nothing. I was further surprised when nothing happened to WTI prices on July 3rd. However July 5 was the first signal that there was a shortage in the market as WTI jumped $2/b. Same on Friday, another $1.87.
The issue is how far will WTI before Saudi adds back in 500 kb/d. My guess is somewhere around $85/b since they do not want to induce a recession. When they make that announcement, how much will WTI drop ~$3/b.
Last month Saudi extended the 500 kbpd cut until December 2024, it might have some leeway in how long it maintains the 1000 kbpd July cut, but that depends a bit on how “voluntary” it really is. With most members failing to reach target and with production patterns that looks exactly like standard decline curves Saudi still felt the need to cut further. Somethings (many things) don’t add up, especially the difference between what OPEC says and what its members do, and still no sign of the Statistical Bulletin that normally comes out in mid June.
Ovi,
I think the Saudis and oil producers in general will do what they have to do to keep supply and demand in check. I wouldn’t be surprised if they continued to cut production to squeeze the shit out of the shorts.
Iron Mike
I think the shorts started to leave on Friday and the Saudi’s have finally stopped the price erosion. Russia and Iran have confounded the supply side for the past year. I think that Iran is close to capacity, at around 3 Mb/d and Russia has exhausted its inventory and the sanctions are finally hurting production.
WTI in backwardation. Another bullish indicator for WTI.
Bearish indicator. Only reason it’s back in backwardation is because Saudi’s extended their cuts. Demand is falling not rising. And it will continue to fall. And Saudis will have to continue cutting production.
Saudi’s are just confirming global recession is taking hold.
All it’s going to take to get oil into the $50’s is a handful of new US bank failures or more excessive depreciation of the Chinese yuan will also do.
Both of which are on the way. BTW
Again, it’s a global dollar shortage. Eurodollar market crushing Asian currency and Russia Ruble also.
Russia is currently selling Chinese yuan they get from oil and natural gas sells to China for US dollars. Think about that for a minute. China has a lot further to fall and that will directly impact demand for oil and oil prices.
Japan is going down with China. So you can mark that down as demand destruction as their currency implodes.
And again these are not problems that central banks can fix. Bank reserves created at central banks don’t matter in the Eurodollar world.
HHH
You may know this but I will state it again. Backwardation is telling the oil markets that refiners are saying I want crude and I want it NOW. That is why the front month is more expensive than the following month.
On the other hand Contango is telling the opposite story. Refiners are telling drillers, keep the oil in the ground or in your tanks, I will pay you more for your oil in a month from now, I dont need it now.
Bottom line $85/b before $60/b.
Granted Saudi is the cause of the price increase. At the same time Iran and Russia were over producing and the analysts weren’t aware of this. Saudi cannot stop them so they cut.
As for bank failures. Forget it. That crisis has passed. The Fed knew those banks were in possible trouble and were too timid. That timid time has passed and they are on the back of banks that are close to being in trouble.
New Mexico rig count. Bouncing around 100 since late June 2022.
These are great graphs, Ovi. My takeaway is that the great price spike of 1H22 had little real impact on rig or frac spread numbers. What type of pricing event would be necessary to change the current holding pattern? Probably no movement until at least a full year of prices above $100 for WTI…
Stephen Hren
Clearly $70/b is not making many drillers happy. Also there is a lot of pressure to return more cash to investors. So cutting back on drilling and completions is a way of doing that.
I think the consolidations in the Permian are sending another message. The big companies are running out of good acreage and investors expect increasing production. A difficult position. The answer seems to be buy up the smaller producers’ land. Drill a little of the new land to keep production flat for another 3 or 4 years to keep the stock price at current levels, reduce debt and maintain the divy.
Let’s watch the Permian for the next six months. I think geology takes a back seat to land management going forward. Companies new focus, I think is, let’s manage the acreage we have to maximize profits and protect their share price.
Thanks Ovi,
Great stuff.
Dennis
There are so much counter flowing information these days, it is difficult to know which one is on the right track. I am really curious to see how your Permian model works out over the next year. If the Permian continues according to your model, it will imply BAU. If production starts to drop below your model, something will have changed.
In the mean time here is some updated info on OPEC
Opec output rises offset Russian fall in June
London, 7 July (Argus) — Opec production edged up in June ahead of planned cuts this month, as increased output from Opec members offset a fall in Russian supply.
Russian production fell for a third consecutive month to its lowest since May 2022, Argus estimates. This helped push output by the group’s non-Opec members down by around 20,000 b/d on the month. But production by the 10 Opec members subject to targets was 60,000 b/d higher, leaving combined output up marginally at 36.76mn b/d (see table).
The eight Opec members that agreed to make additional cuts of 1.16mn b/d from May achieved a combined reduction of 1.06mn b/d in June, falling nearly 100,000 b/d short of their effective target. Algerian output dipped below its ceiling following a drop in exports, while the continued absence of seaborne Kirkuk exports kept Iraqi production below target for a second month. Saudi production fell below its implied target but most other producers were still pumping above their effective quotas, Argus estimates.
Output by Opec producers without targets has mostly been on the up. Iranian crude production has passed the 3mn b/d mark, according to oil minister Javad Owji. Argus assessed the country’s output at 2.91mn b/d in June, the highest since November 2018. Tehran’s success in boosting output this year has been notable, given that talks to revive the 2015 nuclear deal have hit a brick wall and there has been no movement on sanctions relief.
Note that the OPEC MOMR has Iran May production at 2,679 kb/d
As I noted above, I think that Iran and Russia were over producing, forcing Saudi to cut. The article has a more complete table.
https://www.argusmedia.com/pages/NewsBody.aspx?frame=yes&id=2466990&menu=yes
Ovi,
50/50 chance output will be above or below my best guess, so odds are pretty good (100%) my model will be wrong. Could be we see a plateau or lower scenario output, but my guess is there is about a 3 in 10 chance that will be the case (Plateau scenario or lower.)
OPEC and OPEC plus (minus 3 OPEC nations without quotas) from the Argus piece linked by Ovi.
Note that for all of OPEC plus output was up by 140 kb/d in June from revised May levels. due to a 100 kb/d increase from 3 OPEC nations without quotas.
A recent June 30th discussion on peak oil. It is a 1 hour 8 minute YouTube video.
Roundtable Discussion on Peak Oil: Robert Bryce, Chris Martenson, and Robert Hirsch
June 30, 2023 – In a special weekend edition of the Financial Sense Newshour, Jim Puplava speaks with three different energy experts about the topic of peak oil, which was delayed by a decade due to America’s utilization of its rich shale oil deposits through fracking, but are now showing clear signs of peaking. Bryce, Martenson, and Hirsch draw on their extensive experience and research on the current situation and the outlook for higher oil prices moving forward, including their investment thoughts on energy, the oil sector, uranium, nuclear, and much, much more. Listen in!
This is interesting but infuriating. Lots of excoriating (rightfully) of ESG, but few answers. We all know about Michaux, the limits to materials to transition to “green” energy. So if the resources don’t exist, and hydrocarbons will be going into decline, what should we be doing?
Not much said, really, about peak oil.
I wanted to scream when Robert Hirsch started going off about “geoengineering” to combat climate change. Just like Mt Pinatubo. Just spew some particulate matter into the atmosphere. And yes, jokes about Kerry and Al Gore. Tired shit, if you ask me. I lasted thirty minutes.
Mike I agree
What can’t be done won’t be done. My only conclusion is willful ignorance. If you choose to ignore reality then everything is possible.
Here’s what Dennis and many others choose to ignore.
1 mineral reserves are not enough to build out the first generation of renewables.
2 present rates of mining will never provide the minerals necessary for even the first generation of renewables.
3 the rate of mining would have to be sustained in perpetuity because you can’t recycle solar and wind
4 renewable energy systems required fossil fuels in their manufacture and has never been demonstrated even in a small scale the development without fossil fuels
5 low hanging fruit says electrified rail could be should be a first step approach to energy transition but it’s not why?
6 renewable power doesn’t provide the heat required to make steel concrete silicon and a host of other processes that are needed to make renewables.
7 asphalt and plastic and carbon fiber windmills come from fossil fuels
8 never ever anywhere on this planet has it ever been demonstrated that an electrical grid can be powered 24/7 by intermittent generation except in South Africa who average 9hrs of electricity per day
9 you can’t run industrial economies on intermittent power
10 to actually run the transportation system in EV would double the heavy trucks on the road or double the weight of said trucks and in any event our present road system can’t take that pressure and no one is talking about what that costs to replace
I’ll leave it at 10 but the standard response will be that the facts don’t matter because we have no choice it’s an imperative!! We’re running out of fossil fuels and we must stop global warming. It was also an imperative that Rome kept the barbarians out. Historically it has been an imperative that small mining towns keep the mine open.
What can’t be done won’t be done. The future city’s will look more like refugee camps where 100million now live. Present city’s will look like midwestern ghost towns because without 24/7 power they’ll be uninhabitable.
JT,
Michaux is wrong in my opinion on resource availability. Things will change, they always have and always will. Lots of new things were never a reality in the past until they became so in the future.
So claims that it can’t be done because it never has been done, have historically been wrong, and the future will also prove such claims as being incorrect.
For heat processes, fossil fuel, biofuel, or synthetic fuels can be used. Intermittancy can be solved with pumped hydro, batteries, biofuels, and synthetic fuels.
The only thing that Michaux is likely wrong on is that reserves are based on energy costs that have been estimated too low. Most likely the present stated recoverable reserves are far less. Or expressed another way the cost of renewables is vastly underestimated. Considering that China is now banning the export of rare earth minerals we about to see a real spike in production costs. Which is already a problem Ford loses $60,000.00 per EV, VW is slowing production. GE and Siemens wind divisions are money pits. Paying more for the materials that are needed for manufacturing them isn’t going to improve their performance.
But in a fake it till you make it mentally I don’t expect anyone to understand.
BTW why does China produce most of the rare earths? Because they do it so cheap by ignoring the environmental destruction it causes. Destroying Mongolian villagers who are riddled with cancer from radioactive waste in tailing ponds. A real question is unless those abuses are maintained is renewable based energy anywhere near affordable? I say no nor is cobalt without child slave labor.
However if you ignore enough facts everything is possible.
Ignorance is Strength
Michaux assumes need for batteries will be far larger than what is actually necessary. Also there are many battery chemistries that do not require lithium or cobalt even if we needed all the battery backup that he assumes. A widely dispersed wind and solar power system tied together with an HVDC grid requires very little backup, some can be done with natural gas and eventually there will be enough excess power that a combination of pumped hydro and synthetic fuels can be used for backup of wind, solar and hydro power. The amount of copper being used in EVs can be reduced by moving to 48 Volt or higher electrical systems and also in some cases aluminum can be used as a substitute for copper as a conductor.
The reserve estimates historically have tended to grow as prices change and technology improves, that is a fact.
@JT,
I will not use an EV for the reasons you elaborate. Having children working as slave labour in contaminated pits in DRC, with the minerals exported to China, is abhorrent to me. They haven’t the decency even to pay a proper rate for their dangerous and life-shortening drudgery.
Ok, I do have an old mobile phone. But I try to minimise handling Coltan-containing devices.
@Jonathan Madden
Just remember that not all batteries are made with Cobalt. There are Lithium Iron Phosphate (LFP) batteries that have long cycle lives and are actually cheaper to produce than their Colbalt based brethren. The downside is that their energy density is less. I would not give up on the tech just because of a few “bad elements”.
When I was in Thailand during the Vietnam War, Our house girl thought it was terrific starting off as a “grass whip” girl working for a baht 99 stang an hour. Her job was to grass whip the sides of the banks of the drainage canals and ditches. A baht was worth about a US nickel so she was working for $0.0599 / hour and thought it was wonderful. Best pay she thought she ever had. Meanwhile, I was pulling in about $12K/year or $6.00/hour (before taxes, SS, and whatever else).
When we arrive in Thailand, we were told that there are 44 varieties of snakes, 42 are poisonous and the other 2 will eat you. Was she safer grass whipping areas where the snakes might be hiding or me flying into combat? Not sure who had the more hazardous job.
A number of GI’s lost their lives to fanged “two steppers”. One of them was on the base where I was stationed. Second, while watching a movie at the base theater, the show was interrupted to inform us of a brush fire across the street. Snakes were coming out of the brushes. Third, my pilot ran over a small snake with his bicycle. He put his sandal down right on top of the snake, The snake reared up and repeatedly struck his sandal strap. He was lucky. We watched our step over there.
Sometimes, it is a matter of perspective and what the media feeds us as bad versus someone who thinks a “shitty” job is the cat’s meow. No, I would not like to mine Cobalt.
Spoken like a true economist.
HT , the job of the economist is to make look astrology respectable . 🙂
Hightrekker,
Maybe you have not seen any change in your lifetime, my perspective is that there have been significant changes in the past 50 years, perhaps that has ended, but I am skeptical.
One of the few social constants is that nothing is constant, any social theory that is well accepted causes changes in society which reduces the applicability of the theory, it makes social science a particular challenge. Also controlled experiments that are easy to reproduce are pretty much impossible.
One of the few social constants is that nothing is constant
Ah yes, Dialectical Materialism
https://en.wikipedia.org/wiki/Dialectical_materialism
Even you free market beings sometime get a hint of reality.
(Marx had some issues with Hegel)
JT- you keep forgetting that option #1 is no option at all
Option 1- keep on with combustion as if the supplies of combustibles are unlimited
Hickory
The tooth fairy isn’t coming.
And fossil fuels are leaving
Mike B,
People remain hopeful and propose stupid things when they aren’t used to thinking in terms of depletion, scarcity and limits. The nature of the conversation was instead characterric of a mentality that assumed abundance, availability, optionality and choice, i.e. business as usual.
Martenson really surprised me when he said he owns stocks in some of these companies. Completely out of tune with the song he’s been singing.
Martenson is a master of the glib speechifying of the know-it-all. I usually turn him right off. The shit he said during the pandemic was disgusting. He persists because he has the shamelessness of Trump.
It seems we’re surrounded by vague intimations of doom interspersed with even vaguer reassurances of success. All of it is tiresome, doomer and cornucopian alike.
The smart ones possess modesty, tact, and the ability to know when to keep their mouths shut.
Things can turn to shit real fast, and we can never predict when. I just sit back and listen now and pretend to others that I know nothing.
Where did I say anything about what would occur? I said, in fact, the opposite.
Things can turn to shit real fast, and we can never predict when.
And, by the way, I believe you are a brilliant analyst, else I wouldn’t come here. Perhaps you just read comments too fast.
Mike B, your opinion of Martenson matches mine exactly. You just said it more eloquently than I might have. Thanks.
And I agree with your opinion that things can turn to shit really fast. And I believe they will. But I have no idea when that will happen. But, unlike almost everyone else on this blog, I can be cavalier about it. I will, very likely, be safely dead when the shit hits the fan. But I do fear for my kids and grandkids. However, I gain some comfort in the fact that they don’t believe a damn word of it.
Thanks, Ron. I think a lot about the horrible pickle we are in with peak oil: It is impossible to predict, as has been obvious for some time now. You cannot even say that it is “here,” because you have to wait to see if there is a decline. Furthermore, if there is a decline, you still cannot say it ‘has happened’, because there have been declines and recoveries in the past. You can only know for sure when you’re already in free-fall–that is, after it is too late.
To my mind, the wisest thing ever said about peak oil was said by Hubbert himself, way back in 1976, in a lecture to health care facilities. After showing his chart of the approximate world date, he shrugged it off. He showed off his little solar device instead, and said, “We know how to do it now.” Meaning, switch to alternate resources, before the peak even mattered. Every time I watch him, I shudder thinking of the future.
Mike,
I’m in the doomer camp. I agree things can (and I believe will) go to shit real fast. I respect Dennis for being unwaveringly committed to impartiality. I just think it’s too anemic or even paralyzing of a position to take. Most of us are more like Kirk and he’s like Spock. Nothing wrong with that. Its just Spock hesitates more and Kirk takes more risk. The risk here is credibility. Dennis has discipline and humility. The rest of us are brash and want to jump the gun on making a prediction. I believe shale’s declines are coming in relatively short order. I think Dennis underestimates the heavy thermodynamic losses that are embedded in renewables and EVs as do many politicians and even engineers. (It’s an extremely fragile way to do things.) Any contraction in oil production any where from here on out will be more destabilizing than what we’ve seen historically.
The Martenson discussion above was beneficial in that it revealed the thermodynamic and engineering oblivion of our decision makers. There are going to be black swans/blind spots that are going to challenge and break the current way of doing things and I don’t think our infrastructure is prepared to deal with these shocks.
/2c
Dennis has discipline and humility.
He is indeed a formidable counter-balance to those of us less sanguine about the future.
Thanks Mike B an Anon,
Note that I expect it will be very difficult to accomplish a transition. Also I expect we will need to reduce energy use, recycle more, and build quality products that last, can be repaired or upgraded as needed, fewer throw away products and mandatory cradle to grave manufacturing required by governments.
I think we can transition away from fossil fuels with great effort, sacrifice and ingenuity, success is by no means guaranteed, but in my view remains a possibility, maybe 50/50 odds at best.
Note that I also envision World population contracting by 2050 die to the demographic transition as population declines there will be less energy and material requirements for society. We may also learn to do with less, though I am less confident this will be a choice, it will be by necessity.
The world is not going to voluntarily reduce energy use, or recycle more, Dennis, except maybe spent nuclear rods. The country that reduces energy use is dead in the water. China controls the rare earth elements. When they constrain exportation of those ingredients, the mud fight is on.
At that point, it’s going to once again be a good thing to drive a pickup with an internal combustion engine. Drive it down to the workplace to figure out how to build the most efficient SMR that produces the least amount of nuclear waste.
At some point, things will turn on a dime. Populism on steroids may start with China hoarding rare earth elements, but it will end with oil-producing countries reacting to that. This is the end game. We have been marching toward this spot for over a hundred years.
At that point in time, I most definitely want to be a citizen of the USA, driving a big-assed GMC Sierra all-wheel drive pickup with my fly rod in the back, not darting around Beijing in a little car the size of an Alka-Seltzer box. And I don’t want any more damn wind turbines or solar panels messing up my view on the highway. I’m perfectly fine with a moderate sized SMR providing energy for the small village where I live. I’m okay with about six of them–the bigger sizes–supplying clean electricity to Denver.
With very little additional work, the big excavation up in Lithium Valley Nevada would make a damn good WIPP site. Let salt creep build a casket around the spent baby fuel rods.
Love your posts Gerry, Keep ’em coming!!!
Australia has rare earths (including COBALT which is currently dominated by the Congo ) and was just given Nuclear Submarines by the USA and the UK (AUKUS Treaty).
That being said I am not sure how long to ramp up production, if ever.
Australian’s won’t be shoving kids down COBALT mines for bread and water to mine the stuff like in the CONGO.
Not only do we need a ton of new mine development.
We need existing mines to ramp like crazy.
“Approximately 500 cobalt, copper, lithium and nickel mines operating today will need to increase by between 40% and 80% to meet demand for batteries” – McKinsey
Chinese cars beside the luxury category are LiFePO now, as the small 50 Kwh Teslas.
And sodium batteries are already ramping up, they sell the first cars now. They eliminate copper connectors for these batteries, too.
As a side effect it’s much cheaper and more fire proof.
So no cobalt apocalypse, sorry for it.
Gerry,
Resources are not unlimited, they will need to be conserved out of necessity. It will not be a choice, any more than eating or drinking or breathing is not really a choice. It just is.
Dennis, I agree wholeheartedly with conservation of resources. The point was against the reduction of energy use. I’m not opposed to new sources of energy. In fact, I love nuclear in the form of SMR’s; there is uranium all over the place. And there are plenty of places to bury the waste–just not within a karst near the Carlsbad Caverns and Ogallala Reservoir.
My point–perhaps badly made–was that tensions between countries are ratcheting up, mainly over new technology. The green energy push has quintupled the need for hard-to-get elements, minerals and metals. China has tried to corner the market. That’s bound to create conflict. And this is not the time to go weak in the knees.
It is patently obvious by now that to get the energy we need from wind and solar we’d have to paper our land and oceans with wind turbines and solar farms. And the mining that all that would require would very likely make this a breakeven deal on carbon footprint. My point is why not use a technology that provides clean energy for thermal protection and to power factories and plants, say nuclear in a manageable form. If people want to drive electric cars, let them. But don’t keep pushing this false narrative about wind and solar because it just doesn’t pencil out. We’re going to be laughing at this in a few years, decommissioning all this nonsense. Taking down giant wind turbines with blades missing will become a cottage industry: quarter of a million a pop.
I don’t want to drive an electric car, nor do I plan on it. If by some measure of stupidity, the government tells me I must, I’ll quit driving. But at that point there will be civil unrest and I’ll have plenty of company.
I don’t want my country, or my allies, to reduce energy consumption, because that is death spelled another way. China really wants global hegemony, and they’ll stop at nothing to get it. While we’re pissing and moaning about the climate, they’re building several hundred brown coal-fired power plants, and while our country is trying to get rid of cook stoves that run on natural gas and banning pizza ovens, China is storing great masses of NG in their cave importation site in the northernmost province. They’ve even brokered a deal between Iran and Saudi Arabia–mortal enemies since the beginning of Islam–in order to keep themselves in crude oil.
If the United States of America turns into a wimp and reduces energy production and consumption, China will go after us with more than a balloon floating over our homeland. You think climate change is a danger now, let China run the world for a few years. It is imperative for any self-preserving country to grow its energy production and use. In fact, it’s existential, and always has been.
Gerry,
Not clear that Nuclear would be the cheaper option, I would prefer Wind and Solar in my backyard (especially solar, wind can be a bit noisier so I would want a bigger backyard for Wind). Nuclear is not particularly cost competitive with Wind and Solar, not sure if smaller reactors have enough history to be proven safe. I would want a reactor design that does not depend on power for cooling and would see a self shutdown in a no power situation to avoid another Fukishima type event.
I think part of conservation is reducing energy and material use as far as is practical to reduce damage to the planet. We only have one.
So my point is we need to do two things. Reduce, reuse, and recycle, and cradle to grave manufacturing as well as develop viable energy sources to replace current fossil fuel energy uses.
I don’t think there is a single solution to current environmental problems, a multi-faceted approach will be needed in my view.
Oh No!! Gerry, you took the wrong pill! Quick, turn off all your media-connected devices, they’re taking over your brain!
Gerry, I refer you to the World Nuclear Industry Status Report 2022
with particular attention to the Key Insights and Executive Summary beginning on pg 16
https://www.worldnuclearreport.org/IMG/pdf/wnisr2022-v3-hr.pdf
The industry is running hard just to stay in place.
Fuel for SMR’s is made almost exclusively in Russia, and hard to ramp up alternative production.
It takes big government involvement for any country to have a viable industry…no company in the world is doing nuclear development successfully on their own.
Its been 70 years and the US still has no high-level waste repository…just temporary holding ponds. Will your state make one?
Currently solar and wind are blowing nuclear global deployments out of the water on speed, magnitude, and cost.
Just a few points to consider. Don’t hold your breathe on it, I suggest.
Also here is an interesting podcast interviewing a nuclear industry proponent/insider with important insights into the state of the global industry and supply chains.
https://www.thegreatsimplification.com/episode/74-james-fleay
Hickory, I get it, we don’t have good capacity for manufacturing SMR’s. The thesis of my comments has been that we’re overwhelmingly dependent on China for the things that make our country run: rare earth elements for iPhones, computers, magnets and batteries; even copper and spun steel. That extends over into the pharmaceutical industry and disease testing and reagents business. Despite the pandemic, a full two-thirds of our drugs, tests and protection gear are still manufactured in China. And in nuclear, Rosatom has the best SMR’s–with an incredible backlog. Rosatom is Russian-controlled, maybe even state-owned. I’ve noticed that the countries that have SMR orders pending haven’t condemned Russia for invading Ukraine. interesting. the way that goes.
And you’re right of course: wind and solar are running away with it. And where do you suppose most of the photovoltaic panels are made? Well, China, of course. About 75%. And while Denmark’s Orsted manufactures the wind turbine of choice for America, China arguably develops the best turbine, because they have the best wind.
My argument seems hollow against all the studied remarks and references, but it is, in essence, that we have relied on China way too long for the manufacture of lots of our essential gear for living. And even Russia, for Pete’s sake. I haven’t even touched on potash fertilizer. Russia, again; the U.S. doesn’t make much fertilizer anymore.
Am I the only warmonger in this group? I’m not looking for war but I find it almost certainly unavoidable. For a chuckle, read “Thucydides’ Trap,” by Graham Allison. He has asked the question of the inevitability of war between the United States and China. Right now, if China attacks Taiwan and the U.S. sides militarily with Taiwan, China would automatically shut us out of the solar panels and wind turbine supply chain, not to mention stop our iPhone construction and exportation of all rare earth elements. About 75% of our pharmaceuticals would be frozen. The Pfizer, Microsoft and Tesla plants would be taken over.
It is so comfortable to say solar and wind are kicking ass, pass the Cipro, take the old Tesla out for a spin. But anyone who doesn’t think a day of reckoning is coming hasn’t studied history, much less read the Art of War.
“China arguably develops the best turbine, because they have the best wind. ”
No, they have great dependency on imported energy along with industrial policy and action.
There is great wind in a great many places.
btw- as of 2022 there are no SMR’s under operation…there are 4 under construction in the whole world, according to the IAEA. It remains to be seen if they can be built and operated on a cost viable basis.
Don’t get me wrong, just as most others I recognize that a safe,functional and cost effective SMR industry would be an excellent compliment to the other generating sources. But for now its a concept awaiting validation. And it will be a long slow road. I’ve been following NuScale since 2007…the only US SMR design to gain design approval thus far and hoping to have a prototype up by the end of the decade- https://www.utilitydive.com/news/NuScale-small-modular-reactor-nuclear-NRC/641012/
Three SMR’s were operational in 2022: China, Russia, India.
Since Rosatom has a large backorder, I’d have to presume that they worked, but it is indeed a presumption.
I get your point–all the way around. I’m simply not very enthusiastic about wind and solar energy and I think this has to be worked out pretty damn quick or a whole bunch of people are going to suffer for want of electricity.
And you’re right in your probable assumption of me: I am no expert on nuclear energy. I was so poor in physics that I thought the Wheatstone bridge was a suspension bridge over the north fork of the Red River until I was thirty years old.
My solar array can be producing energy 2 weeks after installation begins. A nuke takes 30 years to construct! You are unhinged from reality when you say this has to be worked out quick, and then promote something that either doesn’t exist, or takes 30 years and HUGE amounts of energy to construct. Do you see that??
The World Nuclear Industry Status Report is a piece of s… of antinuclear propaganda lead by a professional lier, Mycle Schneider. I have seen this one telling without hesitation that no EPR was working while two were working in China.
Just because you don’t like the facts doesn’t mean they are not true.
The information presented is not an opinion piece…some of my comments were.
You sir, seem extremely biased on this subject over the years. Vested interest can do that to a person.
Global oil production did not peak in 2018.
If global oil production peaked in 2018 and was falling for the last 4 years and the oil price had been increasing steadly over that time. I.E. demonstating that demand was not being met and therfore demand destruction was occuring. Then one could safely say peak oil production probably happened in 2018.
This however is not the case. Oil price has fallen and is lower than any time in the last year and a half.
https://tradingeconomics.com/commodity/crude-oil
This clearly shows that demand is not there to test global oil production maximum, hence why OPEC have cut prouction by a million barrels per day. ON top of that India is buying as much cheap Russian oil as it needs.
https://www.reuters.com/business/energy/indias-russian-oil-buying-scales-new-highs-may-trade-2023-06-21/
Not only is production meeting demand but production is being scaled back because of overproduction.
https://www.aljazeera.com/economy/2023/3/20/russia-overtakes-saudi-arabia-as-chinas-top-oil-supplier
4 years after supposed peak oil there is loads of oil and it $30-$40 cheaper it was in 2012/13
It will be obvious when we are past peak oil production.
Oil prices will have been rising for a year or two and production will be flat to falling.
Both of those have to be in place. ofcourse we could have another pandemic or global recession to muddy the waters again.
This is an example of 20th century thinking. In the 20th century people believed the law of supply and demand actually had implications. It does not (I will continue to repeat this for the rest of my life). The law of supply and demand does not meet Karl Poppers principle of empirical falsification. It is not a law it is a tautology.
Example: Europe consumed 10% less gas in 2022 than in 2021. Gas prices spiked to 20 times 2019 levels. The high gas prices caused Europe to shut in 15% of industrial production (talk of a mild winter is simply wrong). This year volumes of gas are probably the same as in 2022, the price of gas is back to 2019 levels but industrial production has not come back. It has not come back because orders have not come back to 2019 levels. My guess is that European industrial production will not get back to 2019 levels unless gas availability recovers to 2019 levels.
You are correct Schinzy
Supply and demand don’t drive development. Classical thinking as Charles has outlined believes that prices will infinitely increase to meet demand without considering that prices might already be too high. Why has the US released so much oil from its SPR? Are we at war? In a way we are.
The US is and has been at war with depletion for decades. Starting with the 70s once domestic oil peaked the US recognized the problem not just in oil but in mining. So it offshored production to maintain growth. Why? Price. If supply and demand is true why didn’t the US simply pay more for oil and material costs and just raise prices? Right? Jobs would have been preserved.
Affordability is what makes markets not demand. Ford’s success wasn’t because everyone wanted a tractor and truck. It was because they were cheaper to own than horses that could do the same work. Partially because gasoline was a waste byproduct of kerosene refining.
Oil at $70.00 per barrel is two to three times more expensive than it was during growth periods. But it’s still not expensive enough to facilitate upstream investment. What we are seeing is demand destruction in discretionary spending particularly in lower income communities. These include home goods like Bed Bath and Beyond, Christmas Tree Shop, and similar segments within big box retailers like Walmart and Target. One 1million sqft warehouse I’m familiar with has seen a 400 container per month reduction coming into their yard that started last December. All those containers were the stock for the above retailers and the warehouse is still full.
For the majority of the US who are living below the poverty line, which includes retirees, they’re already making the hard decisions to buy food fuel and pay rent. Their wardrobe home furnishings and vacations can wait.
So to reason that oil has not peaked because prices aren’t peaking and they have more room to grow is foolish reasoning.
JT,
I disagree, a relatively low price for a product indicates supply is not short.
The World economy grew at about 3% per year from 2011 to 2014 in real terms.
For data see
https://data.worldbank.org/indicator/NY.GDP.MKTP.KD?most_recent_value_desc=false
Chart below has World Real GDP in 2015 $ from 1984 to 2022, no drop in growth rate when oil prices were high from 2011 to 2014 (average of about 115 $/b in 2022$). Oil prices are currently low because oil supply is able to meet demand for oil at the current price level, in fact OPEC is cutting output because there would be excess supply if they did not which would drive oil prices lower.
JT
Oil price in 2006/07 was around $70 which equates to $105 today.
I do get your point about affordability, but cars are more efficient today. You can buy a second hand small car that gets 10 or 20 miles more to the gallon and save hundreds of dollars per year.
Charles, crude oil production did peak in 2018. Even a damn fool can look at the data and figure that out. Whether or not November 2018 remains the peak remains to be seen. Your argument should be whether 2018 will remain the peak or not. That would make sense. As it is, it is just stupid.
Schinzy wrote: The law of supply and demand does not meet Karl Poppers principle of empirical falsification. It is not a law it is a tautology.
Karl Popper’s Falsification Principle is about science, not economics. If it cannot be falsified, then it’s not science. Or at least that is what Poppes stated. You are just trying to look smart and wind up just looking silly.
JT wrote: Supply and demand don’t drive development.
Now just who was the guy that claimed supply and demand drove development? Give that guy the Nobel Prize in Economics. JT, no one has claimed that supply and demand drive development. Obviously, a lack of supply can impede development. If you do not have supplies, or the money to buy them, you cannot develop a damn thing. That is just common sense.
Supply and demand drive prices! Price is always the arbitrator between supply and demand. If you deny that, then it would behoove you to explain why not. Just try explaining why supply and demand do not drive prices. And do not mention Carl Popper. This is about economics, not theoretical science.
Ron
My point is that it is demand that has peaked in 2018 and oil companies have reduced supply to match.
You can see this everywhere.
https://rigcount.bakerhughes.com/na-rig-count
During highest growth rate of US oil there were 1,800 to 1,900 rigs working.
Today due to weak demand there are only 800 to 900 rigs working, this clearly tells us that oil companies are reducing production. OPEC has also cut production by 1 million barrels per day.
I am sure demand will increase and in the next couple of years we will see what the world can produce.
When oil prices are around the 2011/13 level and 1,800 rigs are working we will know.
At the moment the demand is not there to test supply max
Charles, there can be only one peak. When oil production reaches its highest peak and declines forever after that, that will be peak oil. End of Story!
For the years 2011 through 2013, WTI averaged $95.64. (I did the math.) For the months of March through July 2022, WTI averaged $107.38. Oil production averaged about 4 million barrels per day below the November 2018 peak for those four months.
Of course, the price of oil will affect how much money producers will put into producing oil. It always has and always will. But to say, “November 2018 was a demand peak, not a production peak,” is just absurd. November 2018 was the peak in production regardless of what caused it.
World oil production peaked, so far, in November 2018, four years and eight months ago.
Ron
What is the point of cherry picking data? You are only convincing yourself an no one else.
The oil industry takes a long time to respond to high oil prices, gradually takiing on more people and getting new drilling rights. The world needs sustained high oil prices for over a year for drilling to ramp up.
Also most people when they talk about Peak Oil are describing a geological peak.
The world had COVID in 2020, 2021 and much of 2022.
You have no idea how much oil can be produced again once oil prices are over $100 for a year and more.
You have claimed peak oil so many times. Claiming one country or another has peaked.
” Right now they are, in my opinion, producing flat out.” (producing 9.5 at the time)
http://theoildrum.com/node/9360
Saudi Arabia produced 11 million barrels per day 10 Years after your statement on The Oil Drum. Plenty more example of the fact you really are simply guessing about future production.
Saudi Arabia says it is increasing capacity to 12 million barrels per day and there are independent experts who are checking this fact on behalf of the share holders.
Can you prove this is not correct if so take you evidence to the authorities.
Charles, you really talk stupidly. You “cherry” picked the dates, (2011/13), not me. I just showed that the average price for that period was not that high at all.
You wrote: Also most people when they talk about Peak Oil are describing a geological peak.
Charles, you quite obviously, do not understand a damn thing about supply and demand. There will never be a demand peak then a geological peak, or vise versa. There can be only one peak. That peak will be, or was, both a geological peak and a demand. That is all the oil that can be produced at the price the economy is able to pay.
November 2018 may, or may not, have been the world peak in crude oil. Not a geological peak and not a demand peak, just the goddamn peak.
Ron,
You have to look at real oil prices not nominal prices. In 2022 $ the oil price (Brent) averaged about $136/b from Jan 2011 to Dec 2014, Oil prices were high in 2022 for only 7 months (where high is defined as over $90/bo in 2022$), not enough time for the oil industry to respond to high oil prices. There have been many cases where there has been a big interval between peaks, especially when the downturn was very large as was the case in 2018 to 2020.
Dennis, I was just replying to Charles’ stupid post. I did not really mean to imply that prices at that time were high enough for long enough to cause oil companies to bring out a few hundred rigs in an attempt to increase production.
We all know now that new oil is a lot harder to produce and a lot more expensive to produce than it was thirty years ago. That can only be the product of dwindling oil reserves in the ground. I think it insane to expect oil production to continue onward and upward as it did in the past as if absolutely nothing has happened to the supply of oil in the ground.
But Dennis, that is exactly what you, Charles, and a couple of others are doing when you point to past production and imply that we will see those very same patterns in the future. I don’t give a damn how many peaks we have had in the past. What we are talking about now is what will happen in the future as a result of dwindling oil reserves.
Ron,
I don’t expect the future to look like the past. From 2000 to 2018 World C plus C grew at an average annual rate of about 1% per year. For my scenario from 2022 to 2028 the rate of growth averages about 0.6% per year. Also the URR is about 2650 Gb which is about 850 Gb less than the 3500 Gb estimate by Laherrere et al in 2022. A pretty conservative scenario,
Dennis –
“There have been many cases where there has been a big interval between peaks, especially when the downturn was very large as was the case in 2018 to 2020.”
– Any examples of this?????
I only see 2 cases: 1979-1983 and 2009-2011…
I see 3 phases of oil production growth between 1960 and 2016:
1- Extreme growth from 1960 to 1979, 6.5-7% annual growth.
2- 25 years of moderate growth from 1983 to 2008, 2% annual growth.
3- the final phase of 8 years of low growth due to shale and past peak large/super-large oil fields, <1% growth.
Production (tonnes) in 2022 (3647.7 G.tonnes) was roughly the same level as 2010 (3645). Mid-point being 2016…
Please take a look at the Statistical Review (production peaked in 2016 at 3834.2 G.tonnes, in 2022 it was only 3647.7, more than 5% lower):
1966-~1248 G.tonnes
1979-~2761 G.tonnes
1983-~2279 G.tonnes
2008-~3698 G.tonnes
2009-~3578 G.tonnes
2016-~3834 G.tonnes
Please educate everyone on this, as best I can tell we are in a 6 year (never seen before) slump…annual production losses of ~1.2%
Even if you could use magic and could get production growth back to 2009-2016 levels, it would take at least 5 years to reach the 2016 level…
A more realistic view of future decline:
Kengeo, we will see. I would note that for conventional C plus C the Hubbert Linearization gives a 2500 Gb result. These estimates have been growing over time. I expect unconventional oil will have a URR of 170 Gb, my scenario is extremely conservative. A plateau of 82 Mb/d plus or minus 2 Mb/d from 2023 to 2030 is far more likely than the scenario you propose as you severely underestimate oil resources.
The recent (2022) estimate by Laherrere for World C plus C is a URR of 3500 Gb, about 850 Gb higher than my scenario and 1300 Gb above your best guess (which I estimate as the average of your high and low scenarios).
It will be clear in a few years who’s best guess is more accurate.
Notice the extraction rate for conventional resources for my scenario, I could have assumed they increase to the level of 1985 or 1980 in response to higher oil prices, that ould result in higher output in the near term with steeper decline in later years.
I doubt that happens because demand for oil will decrease as the transition to electric transport proceeds. If self driving robotaxis see widespread approval in the future demand for oil falls even faster (I discount this possibility in my scenario).
Let’s assume the World reverses course on the transition to electric transport and oil demand continues to increase at the 2000 to 2018 level (about 1% per year). I assume extraction rates rise in such a scenario to increase oil supply. I doubt this occurs (probability less than 20%), URR increases to 2725 Gb, peak moves to 2031/2032 at 88 Mb/d.
Dennis,
Is your URR starting from 1980 or from the 30s ?
Iron Mike,
I start in 1870, you seem to have data back to about 1935, at the end of 1934 I have World cumulative output of crude plus condensate at 23.4 Gb, at the end of 1972 I have cumulative output of C plus C at 270.5 Gb and at the end of 1999 I have cumulative output for World C plus C at 838 Gb.
Karl Popper’s falsification principle apply also on ideologies like communism and nazism or pseudosciences like astrology or psychoanalysis. There is no point to say it cannot apply to liberalism. Liberalism is not ”economy”, it is a way of thinking to describe the economy and this way of thinking is unfalsifable.
I agree with Charles. Peak oil level will be proven to be in the past, or in the future, once there is a sustained higher price level for at least several years. High price to provide bigger incentive for higher cost oil source production.
Nothing complicated here.
Hickory,
Higher prices ≠ more oil. More money doesn’t mean you get to cheat thermodynamics and get free EROI. Declining “disposable” energy is inherently unprofitable (it boggles my mind to use this word (“unprofitable”); it just sounds so stupid and tone deaf). Think about all of the energy you’re gonna need just to get less and less energy out. Because GDP is a function of energy, more and more of GDP will be tied up with getting energy. There’s just going to be the unbelievably pervasive phenomenon of diminishing returns on almost everything.
The modern international USD based financial system has never gone up against the hard limit of energy scarcity, rather energy declines. Because GDP is a function of energy, central banks face a daunting decision: hyperinflate or permanent, crippling austerity / depression through money supply contraction.
Because GDP is a function of energy, growth is going to hit a brick ceiling.
Anon,
EROI does not determine oil output, the oil industry can see energy input from coal, natural gas, nuclear, hydro, wind, and solar power.
Primary energy may continue to grow and EROI may be better than you believe, the scenario below is a guess based on a power law fit to World real GDP and Primary Energy data from 1982 to 2022 and an assumed average future growth rate in World real GDP 2.5% per year for the World and a continuation of the real GDP vs Primary Energy trend of the past 40 years. Likely to be incorrect as trends could change.
Dennis,
I admire your tenacity. I don’t consider renewables as a serious solution (EROI is too low). One way or another, any decline in EROI anywhere in a complex energy mix is a decline EVERYWHERE. The energy losses get absorbed through the energy chain. The decline in oil’s EROI eventually shows up in the very energy intensive activities of mining and enrichment and in the increased maintenance costs of nuclear power plants and the increased costs of the coal used to melt the ores into metal all because of lower EROI of oil (oil transports coal). Everything is so interconnected that the rule is simple: any decline in EROI or increase in energy to get energy is a decline in the overall EROI of the entire system. But yes, maybe through some clever management we might be able to buffer or soften the impact of declining EROI in some ways.
I just think its way too fragile of a combination: NatGas + Renewables + Ailing Grid.
Joseph Tainter, if you haven’t, watch him. There are hard limits to ingenuity too. You can’t take innovation for granted and assume it will keep coming like it did in the past. There’s nothing realistically available on the horizon – unless the gov has been hiding some tech from the public.
Anon,
See https://www.mdpi.com/2071-1050/14/12/7098
to see why eroi is not as low as you think. Keep in mind it is EROI at the point of use that is important, when we look at the entire chain from mine to point of use, wind and solar actually have a better EROI than oil and natural gas. We only get about 35% to 40% of useful work from the energy in fossil fuel, much of the energy simply produces waste heat, losses are much lower for wind and solar power.
I agree falling eroi of one source will reduce overall system eroi. It does not affect the viability of any individual product, most businesses are not aware of the eroi of what they produce they are focused on revenue and cost.
Nothing complicated here.
Absolutely, peak oil was in Nov of 2018.
Reality
It may be surpassed, but that is speculation.
Best to embrace reality rather than ideology.
Hightrekker,
Yes 2018 was the peak, there have been many previous peaks all of which have later been surpassed, it is highly speculative that 2018 will be the final peak, especially considering that we have not seen sustained high oil prices since late 2018. In October, 1979 World C plus C output peaked at 63033 kb/d for the centered 12 month average output, this peak was only surpassed in January 1996, some 16 years later, since then there have been 10 different 12 month average peaks since the 1979 peak, with the last being in September 2018. Perhaps 2018 will be the final peak, time will tell. With about 11 peaks in the past 44 years, that is about one every 4 years on average. It takes more time to recover from a deeper trough in output as we saw in 1981 and in 2020.
In October, 1979 World C plus C output peaked at 63033 kb/d for the centered 12 month average output, this peak was only surpassed in January 1996, some 16 years later.
Just wondering, would you say that world reserves have dwindled just a tad since 1979? 🤣
Ron,
Reserves and resources are not the same thing.
See
https://www.eia.gov/todayinenergy/detail.php?id=17151
Proved reserves were reported as being 683 Gb in 1980 and in 2022 conventional proved reserves were about 1309 Gb, according to the statistical review of World Energy. Resources are certainly smaller than 1979.
People point to 2018 as being the peak, it is the most recent peak, whether it will be the last remains to be seen, I would put the odds at 1 in 4, that it is the final peak.
Reserves and resources are not the same thing.
True, but you are nitpicking. They are only basically the same thing. The below is from the net, from the question asks: “Natural resources, what is the difference between reserves and resources.” bold mine.
A resource and a reserve are two terms used to describe a geologic commodity, such as oil, gas, coal, or minerals. A resource is the total amount of a commodity that exists, both discovered and undiscovered1. A reserve is a subset of a resource that has been discovered, has a known size, and can be extracted at a profit12. A resource is a “best guess” while a reserve is a more certain estimate.
Oh? Really? That is the difference? I rest my case. They are basically the same thing. The only thing is one is supposed to be more certain than the other.
I rest my case. They are they same thing.
Ron,
No they are not the same thing, reserves are a subset of resources, if we look at remaining recoverable resources Rystad has about 1624 Gb of 2PCX resources for the World (that is their best guess of what is likely to be recovered. The best guess for remaining reserves (2P reserves) is 505 Gb.
Perhaps 505 Gb are basically the same thing as 1624 Gb to you, but many would consider these as basically different things (with one being more than 3 times the other.)
Perhaps a picture makes it clearer
Dennis-
Don’t hold you breath.
Would hate to lose you
Hightrekker,
I call it like I see it. The future is unknown of course, but many of my past scenarios have proven to be too low, they tend to be quite conservative despite what people at peakoilbarrel believe.
Keep in mind that because of ESG concerns the USA, along some other ‘western’ nations, has forced about 5 Mbpd off the current global production rolls through its direct actions
-Venezuela via sanctions/trade restrictions regarding socialism it is said
-Libya and Iraq via nation destabilization regarding dictatorship it is said
-Russia regarding invasion of neighboring nation Ukraine
-Iran regarding Theocratic and Militant Islam
For the record I generally support these ESG actions, although the Venez story is much more complex than can be said in a short format communique.
Secondly, Anon says “Higher prices ≠ more oil”
And in response I say….lets see the test of that. Then we’ll know for sure.
Hickory,
Let me explain myself. Perhaps in the near term, maybe for another year or two High Prices = More oil gets pumped to maximize profits. BUT, eventually, once we start the descent down the production curve (I think shale starts declining after a year or two), high prices won’t matter because by definition we are going into decline. Money does not alter physics and material reality. Prices could go to $1000 bbl and it wouldn’t help even a drop more get pumped from a well that is giving out.
Anon,
More resources become viable at higher oil prices, yes it might not help with wells that are already depleted, but sometimes high prices make areas that were not profitable to develop in the past (due to lower prices) now feasible to develop. Also there are secondary and tertiary techniques for depleted wells that sometimes become viable at higher prices so that recovery factors go from 30% to 40 or 50% for conventional oil. Obviously the physics doesn’t change, it is the economics that changes with price.
anon – I would be more likely to believe that if we didn’t have the example of the LTO industry absolutely skyrocketing after the start of QE in the wake of the GFC, just coincidentally all timed near Peak Cheap Oil. I know there were some technological advancements, but my understanding is that fracking techniques had existed for decades prior to 2010. But slot in high oil prices, waning supply, and tons of cash at zero interest and you get the Bakken and Permian. I still remember trying to get lunch in North Dakota one afternoon in a town so small it didn’t even have it’s name on the exit signs. Four or five hotels were under construction. I spent an hour in traffic to just get off and then back on the freeway again, lunch wasn’t even an option. Money can do strange things. Can some semblance of this process be repeated, enough to get one more 12-month trailing pop in production world wide? I think so.
“Massive” explosion on Pemex production platform leaves two dead, cuts output by 700,000 bbl
Amy Stillman, Bloomberg July 10, 2023
(Bloomberg) – Petroleos Mexicanos said it lost production capacity for about 700,000 bbl of oil, more than a third of its daily output, after a massive platform explosion on Friday that left at least two people dead.
The company is working to recover production, Pemex Chief Executive Officer Octavio Romero confirmed in a video late Saturday, adding that output has already recovered to 600,000 bbl.
Bloomberg News reported earlier that some 450,000 bbl of oil and more than 560 MMcfg, roughly 11% of Pemex’s total natural gas output, were lost on Saturday only at the Ku Maloob Zaap production asset as the company shut production as a contingency measure, according to a person with knowledge of the situation.
While the one-day loss is significant, it’s likely to be temporary as Pemex resumes some of its operations following the deadly blaze, the person said, asking not to be identified as the information isn’t public. A Pemex representative didn’t immediately respond to requests for comment on the loss or its current production capacity outside of normal office hours.
Two people died and one remains missing after Pemex reported an explosion at the Nohoch Alfa platform gas processing center in the Cantarell field early Friday. Romero said late Friday that the platform’s connection module was destroyed, but that firefighting efforts helped stop the blaze from spreading to other modules.
Pemex’s head of exploration and production Angel Cid said the explosion “substantially impacted” production at the platform.
Mexico’s Cotemar, which provides oil field services, confirmed in a statement Saturday that the two workers who died in the blast were its employees and that another one is still missing.
I’m just sitting here with a bag of pop corn…the stupid comments flying around are entertaining as hell…Does everyone have short term memory? With the exception of the past 4-5 months oil price has been high. Another high price spike is coming soon due to market being under supplied? Do you also forget the SPR is at 40-plus year low? I think even Dennis is coming to terms with the peak remaining as 2018, his future peak is at best matching the 2018 peak…just who exactly can afford the $120-150 barrel price tag anyways?
Kengeo
Most people can afford $120/$140 barrel oil.
Most people eat too much and that is why global obesity rates are the highest ever.
Costing a staggering $2 trillion is sickness, days off work and shorter lives. If trends continue it will hit $4.2 trillion in 2035.
https://www.bmj.com/content/380/bmj.p523
That is more than what the world pays to buy all the oil it uses.
Charles , ” Most people eat too much ” . Did you ask the 800 million surviving on 5kg of free wheat / rice per month per person in India or the 1.12 billion living in Africa ‘ do you eat too much ” ? Kengeo , pass me the popcorn . 😉
Hole in the head
I said most people can afford $140 barrel oil. The people you are talking about do not use any oil.
The people who use the oil are in America.
https://www.healthline.com/health/obesity-facts
Thats 60% who are overweight or obese.
75% of Mexican are obese or overweight
https://www.dialogueseconomiques.fr/en/article/has-united-states-exported-its-obesity-rate-mexico
https://ec.europa.eu/eurostat/statistics-explained/index.php?title=Overweight_and_obesity_-_BMI_statistics
Obesity destroys lives and $2.2 trillion of money that could be used for great benefit. Such as building reservoirs and desalination plants in Africa to ensure the people you have mentioned have a regular harvest.
Diabetes costs the world another $800 billion per year. The soft drinks industry, pushers of highly sugared flavoured water sells $1 trillion worth of their junk. But they do not pick up the tab for the sickness they cause.
There is plenty of money in the world to fix all the major issues. Plenty of greed and stupidy that destroys any chance of fixing any of them and plenty of ignorance that defends the status quo.
Kengeo,
My best guess is about 1 Mb/d higher output in 2028 than in 2018, oil prices were high for a short time in 2022 due to the Russian invasion of Ukraine. For 7 months from Feb 2022 to August 2022 real Brent Prices in 2022$ were over $90/bo, outside of that 7 month period oil prices have been low since December 2014 except 2 months in the fall of 2018. You may have a different definition of “high oil prices” than most who would probably consider oil prices over $90/bo in 2022 $ as high oil prices.
The SPR won’t have a big effect on oil prices, the market is currently well supplied, if oil prices rise, output is likely to increase while demand will decrease to balance the market at some new higher price level. OPEC is likely aiming for $90/bo, demand for oil has been pretty sluggish, so OPEC may not get their wish.
Interesting, you should show that info to the all the starving people in the world who earn on average $2 per day…nearly 10% of all people.
Mexico is an example with 33% below $5.50 per day.
Historically speaking, oil price between $10-$50 has produced positive GDP, much above $70-80 has caused stagnation.
High oil prices are mostly a way to destroy the demand, not to bring new supplies (unless they stay high for a long time, more than 1-2 years).
If we take the most recent 2P reserves that Rystad published, ~500 Gb, add another couple hundred for future discoveries, we get a Estimated URR of 2,200 Gb. Midpoint for the Hubbert Curve is 2010 plus/minus a couple years…
Even if you’d like to pad the living hell out of the estimate…say 33% for the fun of it, a URR of 3,000 still means a midpoint of 2023…
It’s all simple math, and it all points to a midpoint (and peak) somewhere between ~2005 and ~2020, 2018 is the peak and will remain so…too many big fields in decline, no amount of hopium will fix it…
Save for 5 or fewer folks here, this is the consensus
Kengeo,
The real Brent price in 2022$ from Jan 2011 to Dec 2014 was about $136.50/bo. World real GDP grew at an average rate over those years of around 3% per year which is about the average rate from 1984 to 2022.
The “high oil prices cause low growth” hypothesis is disproven by this 4 year period of history.
Midpoint of URR does not always coincide with the peak, in fact this is the exception rather than the rule. Also a cursory look at the history of oil production shows that the Hubbert Curve is a poor estimate of past production and it is likely to also be a poor estimate of future production.
I will note that Laherrere et al 2022 have the URR for World C plus C at 3500 Gb, so if you want to assume midpoint for peak that would be at 1750 Gb for World C plus C. At the end of 2022 we were at about 1470 Gb for cumulative C plus C, at about 30 Gb of output per year the peak would occur in about 9 years in 2031.
https://www.sciencedirect.com/science/article/pii/S2666049022000524
The URR estimates are in Section 5.1 of paper linked above, figure 6 and Table 1.
https://www.sciencedirect.com/science/article/pii/S2666049022000524
Dennis – Do you forget quantitative easing?
Reminder:
“… 14-year money-printing policy which flooded the world with liquidity.”
That was likely the last ditch effort to make it look like the show can go on…
Kengeo,
A response to the Global Financial Crisis, QE does not create goods, only money, Real GDP is inflation adjusted and QE would have little effect on the real economy. The excess liquidity simply resulted in a decrease in the velocity of money, it had no real effect on the economy.
Also QE went on for many years, but we see little difference in World real GDP from a high oil price period to a low oil price period. If high oil prices have an important effect on real GDP there should have been a difference in real GDP growth between 2011-2014 (average oil price $136/b in 2022$) and 2015 to 2019 (average oil price $68/b in 2022$). The difference was an average growth of 2.9% from 2011 to 2014 and 3% from 2015 to 2019, not a statistically significant difference considering that oil prices were half the level in 2015 to 2019 compared to 2011 to 2014.
Keep in mind that HHH might claim the central banks have no influence on the economy, I would not go quite that far, but the effect of QE is much more limited than many understand. Once interest rates fall to zero QE is a bit like pushing on a string, not very effective.
Dennis –
News flash, QE results in low/zero interest rates (free money!)…this in turn pushes spending up, this directly increases GDP…if that doesn’t make sense to you then I’m sorry!
Looking at the bible (former BP annual report):
Americas production 2022 vs 2019: 31.65 vs 30.75 (+2.8%)
Middle East Plus Africa production 2018 vs 2022: 39.83 vs 37.79 (-5.4%)
Russia Plus Asia production 2018 vs 2022: 22.39 vs 21.28 (-5.2%)
Total of above regions 2018/2019 vs 2022: 92.97 vs 89.83 (-3.5%)
That sure as hell looks like a peak over the past 5 years…
Reserves are flat line as well:
Middle East Plus Africa 961 in 2017 (same in 2020). + 0%
Americas 562 in 2014 (566 in 2020). +0.7%
Russia Plus Asia 190 in 2008 (191 in 2020). +0.5%
All-in-all, reserves grew by 0.3% between 2017 and 2020…
With regard to interest rates, it appears we can expect major contraction, but not sure exactly when it will hit, my guess is a massive recession towards the end of this year, oil will most likely be ~$100 to boot and may drop as a result of the recession…this though I’m less confident about…
But I’ll say there’s a 99% chance that Nov 2018 production will be more than Nov 2023 production…
Regardless of the amount of shale oil, it sounds like the growth phase is over…
Sadly New Mexico is not only a mess environmentally, it’s one the top 3 states for worst poverty in US (almost 20%!)….
Kengeo,
Low interest rates are intended to help the economy, but the effect in minimal. Fiscal policy has much more of an effect on the economy. As I pointed out, interest rates were low for a long time, but oil prices changed over that time with little change in the growth rate of the World economy. Oil prices and interest rates are less important than you believe in their effect on economic output in real terms (constant 2015 US dollars).
I focus on annual output rather than any single month, I do not expect the 2018 peak will be surpassed in 2023 or 2024, perhaps in 2025 and more likely by 2026 we will see a new peak, with the final peak in 2027-2029. At minimum we will see a plateau at 82 Mb/d plus or minus 2 Mb/d from 2022 to 2030, in my view.
Kengeo,
Only the people that already have plenty of money tend to get those low interest loans, there is little incentive to lend when rates are so low, so only those with very good credit ratings get a loan, the amount of lending that actually occurs probably decreases because although everyone wants to get a low interest loan, very few lenders are willing to approve those loans. The US economy grew more slowly during the period of QE than before the GFC, so the big boost in growth that you believe must have occurred, didn’t happen, US real GDP growth was relatively modest from 2010 to 2018.
Dennis,
Who cares about GDP when you have a housing and equities bubble all over the world due to central bank QE policies, which divide the gap between rich and poor and also create intergeneration wealth gaps. Those low interest loans have created asset bubbles all over the world. Shelter the basic necessity of shelter is out of touch to so many people now (in the bloody west). It is perpetuated on purpose and central banks have a pivotal role in terms of monetary policy they have set for the past decade.
You old timers are so out of touch with whats going on to the younger generations due to greed oriented monetary and fiscal/tax policies. Ridiculous.
Iron Mike,
I agree, my point is that QE does not create a lot of GDP growth, I was not suggesting it is good policy. I would like to see a progressive income tax, much like what existed before 1970 in the US (with tax brackets adjusted for inflation). I would also like to eliminate special treatment for capital gains and dividends which favors the wealthy (they are taxed at lower rates than wage or salary income in the US). Fiscal spending programs on infrastucture are a wise policy in my view as it creates jobs and in the US is much needed.
US tax brackets in 1969 at link below
https://www.tax-brackets.org/federaltaxtable/1969
The 1955 US income tax brackets are even better.
https://www.tax-brackets.org/federaltaxtable/1954
QE doesn’t inject liquidity. Interest rates go low due to high demand for safe and liquid assets meaning shit is bad in real economy. Low interest rates mean cheap but not very plentiful money. High interest rates equals expensive but plentiful money.
We are heading for a deflationary bust with China leading the way. USA and Germany go down the toilet right behind China.
Central banks can do all the QE they want. If large commercial banks and medium and small regional banks don’t make loans. There is no money in the economy. There is no demand.
Credit crunch is just beginning.
All the yield curves have been warning us for almost a year that a deflationary bust is coming. People just tend to ignore it because it doesn’t fit their high price oil narrative.
Low interest rates in China sure as hell ain’t stimulating the economy.
Sorry under QE low interrest rates everyone here got a cheap loan to buy or build real estate or buy a car. A million for a small home, here you go for 1.5 % fixed for 20 years with a medium income. Companies the same, everyone was building on credit.
There was no scarity of credit, we have declining indigen population here so deflation comes natural. Immigrantes are mostly on social security or low wage jobs here so no grow impulse from this side – high potential migrants are mostly deterred by the tax system.
Eurozone bank credit is in contraction which I’m sure you’re aware of. Is that because the ECB is raising interest rates? Or is it because wages didn’t keep up with the pace of inflation and borrowers are unable to push credit higher?
Now the backside of the supply side shock is here.Which is demand destruction. Leading to credit contraction.
Within a year interest rates will be back at zero. Or back negative in Europe. And oil prices sure as hell won’t be $120. Interest will be back at zero because economy is imploding.
HHH – You keep trying to compare 2023 to 2008. It is weird. We are talking about the economic cycle that brought us to this point, not this point going forward. The reason you are right is the reason I’m right.
That is absurd. A huge percentage of our entire economy as it stands right now was built on QE since 2008. Over $2 trillion just from Covid. We wouldn’t have Bezos, Musk or Zuck without it. We wouldn’t have Permian or Bakken. We wouldn’t have housing prices at 1/2 million average. We wouldn’t have AI bubble. There is so much money in the world it is beyond reason. And with egg prices at $5 an egg, they finally had to stop. And they have. The Fed is not going to cut. They’ve briefly paused on the fastest rate hike regime in, what? forever? half a century? Pushing on a string is very Zerohedge, who thought the QE experiment wouldn’t last past 2011. Well, it lasted and lasted and lasted.
We will never know, but I bet that if Powell reversed course and even HINTED at a POSSIBLE rate cut, we would see oil above $120 within a week and it would not go down until he said otherwise.
Twocats,
A lot of the liquidity just sits idle. Look at the velocity of M2 money at link below
https://fred.stlouisfed.org/series/M2V
It dropped by a factor of 2 from 2008 to 2021. The QE had little effect on the real economy, the real M2 money stock doubled while velocity was cut in half.
The US economy grew at about 2.2% per year from 2010 to 2019 and at about 2.8% per year from mid 1997 to mid 2008, so all of the QE after the GFC didn’t get us back to pre GFC rates of growth. What was needed was robust fiscal policy to recover from the GFC, we didn’t get it and saw a slow recovery because Monetary policy does not get the job done.
QT doesn’t matter either. It doesn’t matter how much bank reserves are on the balance sheet of the FED.
REPO market doesn’t require bank reserves. It requires collateral. To create money. Bank reserves don’t have same collateral usage as T-bills. The money that chases stocks higher is created in the REPO market not the FED.
Only way oil can get to $120 is if banks are not only willing but able to create the leverage and loans necessary to get it there.
That’s why a shortage of collateral leads to a shortage of dollars. What we’ve been seeing over in China is a shortage of collateral at Japanese Eurodollar banks that lend dollars heavily into China.
Give me a trillion dollars, and then your schedule for bond purchases and I absolutely guarantee, with 1000% certainty, that I will be able to inject liquidity into my investment account. It’s not even a question and the fact you are arguing this is beyond insane. It’s the easiest scalp on the planet.
No, that’s not how QE works. The FED “buys” if you want to call it that. Buys treasury bonds and bills and MBS off the large primary banks. These banks don’t get cash. They get bank reserves. They get an account entry on the balance sheet of the FED that they receive a small interest payment on.
Bank reserves are useless in real economy. You can’t buy anything with them. This is all done with the hope that these banks will then lend new money into the economy. That’s where people get confused. And it’s repeatedly said over and over that the FED is printing money so people don’t question it.
The injection of money comes from banks making new loans. Not the FED.
Well what happens when collateral is in short supply or banks just become risk adverse? They don’t make loans. QE is smoke and mirrors and doesn’t matter. QT is the same.
I will say this though. If everyone believes QE is what they say it is then they can manipulate stock markets higher. Because hey FED is printing money. Treasury market knows better and that is why the curves are inverted. Massively inverted.
@Dennis
See this:
https://www.sciencedirect.com/science/article/abs/pii/S0306261921011673?via%3Dihub
Renewables are losers until they break even in energy terms (and not all of them do). There’s loss in transmission, downtime, wear and tear, and the energy required to maintain them. They’re not as good as you might have come to believe about them. They’re hydrocarbon derivatives one way or another. Windmills fail before breaking even, and that’s big loss of EROI.
When windmills and solar panels could produce enough net energy to produce more windmills and solar panels indefinitely without any inputs from other sources, then I’ll believe these things are sustainable.
Anon,
That is an excellent paper, but it does not say that renewables are net energy losers. In fact it has the net energy of oil as about 6.7, with wind and solar doing better than this in the Murphy et al, 2022 paper. (Murphy is an author of both papers). For Wind and Solar the EROI are about 40 and 25 respectively, better than fossil fuel.
Dennis,
My mistake. It’s my disjointed thinking. I linked the paper for your consideration and then just went off on a screed about renewables.
Again for your consideration, Dennis, are David Hughes’s assessments of the shale basins. All available for free: https://www.postcarbon.org/publications/shale-bubble-report-series/
As Hickory excerpted from the previous paper, peak net energy is probably next year.
I think the disruptions coming from all of the Ukraine War and deglobalization chaos and emerging market debt crises (e.g. Sri Lanka), we might be able to stretch out oil supplies as alot of countries are just going to shut down industrially, which in turn will disrupt supply chains for alot of energy systems in other parts of the world, which means we might not be able to stretch out supplies at all. Our energy systems are too convoluted and interdependent. Very fragile.
There’s no telling how this plays out for any place. Like I said: Any unintended and involuntary decline in oil production is going to be more disruptive and deadly than anything we have seen in history.
I see a Seneca cliff coming. Newer sources of oil made it cheap to aggressively pump declining wells. Lots of declining wells have not experienced Hubbert like curves because they were forced into an unnatural plateau from cheap energy one way or another. Any proper energy chain analysis will show some kind of “cheaper” energy was used to get out more of the harder to get energy like oil. At any rate, the piper is coming to collect his due.
Anon,
Hickory’s quote refers to peak net energy for liquid fuel only, that is not the only form of energy that society uses. This energy will be gradually replaced with outher forms of energy with higher net energy. Note that due to thermal losses of roughly 65% for fossil fuel (and most forms of thermal energy) using energy inputs that produce electricity directly often leads to higher net energy on a society wide level.
Anon,
I have read the series by David Hughes. In his 2021 report he has the EIA’s AEO 2021 with about 101 Gb of tight oil extracted from 2020-2050 and believes these estimates are extremely optimistic.
I agree.
My model has about 55 Gb of tight oil extracted in the US from 2020 to 2050, roughly half of the EIA’s estimate in AEO 2021 for tight oil.
Dennis, this statement of yours and the authors that you read to believe it is absolute rubbish….
“For Wind and Solar the EROI are about 40 and 25 respectively, better than fossil fuel.”
If the EROI was that much better than fossil fuels, then every industry would be applying it, no need for any subsidies. In fact governments could tax them heavily like they do fossil fuels with royalties for wind and sun used. Governments don’t for the simple reason they need subsidies to be built, including the subsidy of going first on the grid..
If you can find a single paper that shows an honest appraisal of the “energy invested” bit of “energy return on energy invested”, I’d really like to read it. None of the papers bother with energy calculations, or they leave out the biggest energy costs because they are too hard to calculate (they claim). The energy invested is not just the glass, aluminium, silicon, silver and tiny bits of copper in the solar panels themselves. It should include the cost of building the factories that make the panels, the glass, the aluminium etc. It should also include the cost of education of all the workers in all the mines and factories that exist along the path to production and installation, but NONE of them do!!
The background system ongoing cost is part of the energy invested in every form of energy, yet not included in fossil fuels EROEI either.
The best measure we have to count the “energy invested” part is the capital and operating cost of all energy types, treating them all equally. However using these costs clearly shows that oil, gas and coal are magnitudes ahead of solar, wind, and nuclear, which means a dark future. Therefore analysis on EROEI or EROI comes up with a magic story of how great renewables and nuclear are by leaving out the majority of the energy invested bit in the calculation.
Fossil fuels are clearly bad for the planet, I’m not an advocate that there use can be continued, plus we will be hitting resource limits on all of them, so it’s a dead end path anyway. My point is that current civilization is not even close to possible in the near future, even though only a small part of humanity enjoy modern civilization and all it’s benefits (possibly only 15%?). Those in the developing world want to experience a western style civilization, so they build more coal plants, use more oil and gas when possible.
The Murphy paper you keep referring to, includes numbers for EROEI all over the place, so do the papers they refer to. So do the papers the secondary papers refer to. No-one in their links of papers/references bother to include the “energy invested” bit, ie how they worked out how much energy was invested to build a solar installation or wind farm to include in their calculations. You have to go back over a decade to find any papers that actually try and include the “energy invested” bit, when wind and solar were much more expensive to build.
Every assumption people make about the future, when they include a minor part of it (like renewables), makes the assumption that the background system of civilization continues as normal. The background system of civilization includes continued increases in fossil fuel use, just like we have had for the last 250 years. That’s what’s normal for people, and their parents and grandparents, so no-one questions it when working out their little bit of the future.
If you could find a single paper that works out the “energy invested” cost in Mwh, or Gj, or BTu’s or whatever energy unit they want to use, for a solar farm built using exclusively electricity, I’m all ears. They simply don’t exist because no-one is doing that. All renewables built and all calculations about this are based on more oil, coal and gas being available to do it, plus the fudging of numbers by not counting the “energy invested ” bit properly to make it look good.
The EROEI of the so-called renewable energies must also take into account the energy expenditure for the provision of fossil energy for the times when the sun is not shining and the wind is not blowing.
It’s so effing simple, renewables have no eroi, they rely on fossil fuels…send someone to the year 1500 and ask them to make a solar panel, wind turbine, nuclear power…I believe the average EV requires 500,000 lbs of material to be mined and refined, how does that happen without cheap diesel? We’ve built an incredibly complex and fragile system…
Best explanation I have heard regarding renewables and non renewables . It is like having a running taxi outside your house because their is a good chance your car’s battery won’t turn .
Nice analogy!!!
Hideaway,
The subsidies are used to accelerate the transition, much of the subsidies for the oil industry took the form of government subsidies for improved roads and taxes on fuel (in the US) that do not fully cover the cost of maintenance for roadways.
Dennis, it’s interesting you completely avoided the important part of my post, being that none of the papers talking about EROEI, that show great numbers for that measure ever talk about the “energy invested” part. They just quote other papers that ‘talk’ EROEI.
When you go back far enough, some papers do mention the “energy invested” bit, but the realistic ones are all showing very low EROEI numbers, but still miss the background system having to work ‘normally’, that provides a lot of the embedded energy.
Hideaway,
David Murphy knows his stuff, they reviewed many papers on this, your assumption that only the papers that give very low EROEI numbers for renewables are correct may be incorrect. The point is that all of the analyses must be done in the same way to account for the energy invested in order to be comparable. Accounting for all energy inputs in full for different types of energy is difficult, that’s why we get very different answers from different analyses. I simply assume the average of many different studies is more likely to reflect reality than an assumption that the lowest result is necessarily correct.
From the paper-
“According to GlobalShift [248], the oil liquids production for energy purposes should peak in 2034 with a magnitude of 551 PJ/d. Removing the energy necessary for the liquids extraction and production (including direct plus indirect energy and material costs), we find that the net-energy reaches a peak in 2024 of 415 PJ/d, “
Ron
You forget to reply about the more important point I made. Which is what information do you have about future production. Considering you were so wrong 10 years ago.
I shall repost
” Right now they are, in my opinion, producing flat out.” (producing 9.5 at the time)
http://theoildrum.com/node/9360
Saudi Arabia produced 11 million barrels per day 10 Years after your statement on The Oil Drum. Plenty more example of the fact you really are simply guessing about future production.
Saudi Arabia says it is increasing capacity to 12 million barrels per day and there are independent experts who are checking this fact on behalf of the share holders.
Can you prove this is not correct if so take you evidence to the authorities.
Charles, either post your correct predictions from 10 years ago or shut the fuck up.
Charles gibbers on exactly like another single named British man from the past (might have been Owen) who spent his time trying to show how much cleverer he was than the rest of us but succeeded only in doing the exact opposite, and eventually got banned when he forgot himself one day and his unpleasant racism was let off the leash. Maybe he’s found out about VPNs or got a new ISP.
Well said Ron.
Horizontal well technology for light arabian oil means 2P is recoverable…. heavy oil not true…2P means 10 million barrels a day for 12 years is doable… If you think 1P… like over elsewhere in a 2P light oil environment…you miss the boat… It is a easy thing to do..technology depends on economy..most of us are RUFF folks and depression is real..so no investment.. no investment no technology… only thing that did work is Global free trade and a open China policy..free slave labor… again a gold mine for funding technology.
Ron – Don’t mind Charles, he’s travelled from the future to show us the way, although he cannot complete legible thoughts, he is right by simply saying so…Although I rarely agree with Dennis of future peak likelihood, at least he provides backup and rationale (maybe flawed sometimes), but alas Dennis is not a time traveler…
Kengeo
Why do you think world food consumption is so uneven?
https://en.wikipedia.org/wiki/List_of_countries_by_food_energy_intake
Let’s see how well you understand what powerful forces remove food from countries where people are hungry to go to countries where obesity is having such devastating consequences
U.S. expects tightening global oil market, reverses production forecast
(Bloomberg) – The U.S. expects the global oil market to tighten this year as it reverses its forecast in a move that more closely aligns with bullish estimates by OPEC and the International Energy Agency.
A small drop in production growth from the Organization of Petroleum Exporting Countries alliance, as well as those outside of them, will trim global supply to 101.1 MMbpd, just short of demand, according to July’s monthly report from the U.S. Energy Information Administration.
At the same time, China’s stimulus plan aimed at accelerating the country’s lagging economic recovery will boost oil consumption a tad more than previously thought.
This supply deficit will see global oil inventories transition from builds in the first half of 2023 to draws through 2024, putting upward pressure on prices, according to the report.
The U.S. is set to make less oil than previously expected while its demand is seen stable, with higher gasoline and jet fuel use offsetting a decline in diesel.
Swinging Saudis? Summer Silliness, or Seriousness?
Now that Saudi Arabia has extended its extra 1 million barrel per day production cut from July into August, it may be time to take this “lollipop” — and what it could become — more seriously. Could this supposedly one-off treat morph into a long-term strategy for the Kingdom to manage global oil markets in unpredictable times? Could monthly production adjustments help stabilize prices as oil consumption and non-Saudi supply go into decline? Could Saudi Arabia act as a “swing producer-in-chief,” an oil market impresario who pulls the strings to balance price versus volume to suit its own aims, aided at times by other Opec-plus members with robust capacity — as Russia is doing with its 500,000 b/d August reduction — but relying on declines in peripheral Opec and non-Opec flows as the foundational offset for declining demand? Much would depend on how fast demand declines after it peaks, and on the US shale patch and Western majors’ post-peak upstream investment appetite. It’s a long shot — but one worth at least contemplating.
SNIP
China was supposed to take up the slack, but its economy is stumbling and may do so indefinitely. Such growth as oil consumption has shown so far this year mainly reflects the extremely low base levels of a year-ago, when the zero-Covid-19 policy was in effect. Add electric vehicles’ soaring 33% share of the country’s new car sales, and betting is that China’s oil demand will peak by 2030. My betting is for even earlier.
SNIP
The oil world may look different again once peak demand is past. Investors already are insisting on high near-term payouts on equity and rapid positive returns on spending from Western oil companies. Finding employees is increasingly difficult, as overall tight labor markets interact with hesitancy among younger people to enlist in an industry perceived to have no long-term growth prospects. Oil-field service companies, under similar investor and labor-cost pressures, are charging more. All these pressures are likely to worsen once the declaration is made that global oil consumption is falling — leading to the quicker decline in production that solo Saudi market management would require.
Another material uncertainty is the rate at which oil consumption will fall after the peak. Most forecasts show a long plateau for oil. If so, smooth post-peak market management looks plausible.
Russia’s Crude Oil Exports Start To Show Signs Of Decline
After months of high crude oil exports by sea, Russian shipments have started to show the first signs of a decline as they dropped below the levels from February, the baseline for Russia’s oil production cut of 500,000 barrels per day (bpd) that Moscow says began in March.
Russian crude oil exports by sea dropped by 205,000 bpd to 3.21 million bpd on a four-week average basis in the four weeks to July 9, tanker-tracking data monitored by Bloomberg showed on Tuesday.
The latest four-week average export volumes fell below the 3.38 million bpd in the four weeks to February 26, after holding up above that level for months, according to the data reported by Bloomberg’s Julian Lee.
The main reason for the lower seaborne exports was significantly reduced shipments from Russia’s western ports, the data showed.
In the week to July 9, seaborne crude exports out of Russia dipped to 2.86 million bpd, which was 1 million bpd lower than in the previous week, and with no signs of maintenance at ports that had dragged shipments down two weeks ago. Most of the weekly decline in shipments – 80% — was due to lower volumes leaving Russia’s western ports, which used to ship crude to Europe before the embargo.
The observed decline in Russian crude oil exports on a four-week average basis comes just as Russia said last week that it would cut its crude oil exports by 500,000 bpd in August in a bid to ensure a balanced market.
OPEC Says World’s Proven Oil Reserves Rose To 1.56 Trillion Barrels
OPEC member states hold most of the global proven crude oil reserves. OPEC’s reserves stood at 1.243 trillion barrels at the end of 2022, up by 0.1% compared to the 2021 reserves. In 2021, OPEC’s crude oil reserves had declined marginally from 2020.
OPEC’s share of the global proven crude oil reserves was 79.5% last year, down from 80.3% in 2021, the statistical bulletin showed.
The number of wells completed in OPEC member states rose by 203 year-over-year to 1,791 in 2022, while the total number of completed wells globally jumped by 8,105 to 60,029 last year.
The world’s oil cost curve continues to steepen as poor exploration success rate and massive shale reserves writedowns further impact future supply outlook!
Significantly less volumes available to develop + materially higher breakevens across the curve. —Shubham Garg
As costs of oil production gets higher on a consistent basis,
then people will
-drill for even higher priced oil than they do now
-pay more for oil products
-look more seriously at deploying energy supplies that replace some oil consumption
And eventually learn to do with much less oil,
and less coal and less nat gas. Its not a choice.
Its a matter of time.
One way or another.
I, for example, will gladly give up air travel before giving up food purchases. And I will give up ICE vehicle travel before giving up access to cargo delivery.
Collectively, we select our energy priorities with our purchase choices.
Collectively, we are pretending there is no looming problem on energy supply.
That makes sense in the context that excluding US, world has been dropping production since 2016:
From Million tonnes of oil perspective (excl. US), peak was 2016, never higher since and currently 5% below that level.
Based on the peak of 2016 we can estimate a URR of 2,500 Gb (not far from Dennis’ estimates, right?).
If there’s more than 2,500 Gb then why is production >5% lower than 2016?
There are simply too many lines of evidence to think that oil production on a global scale can climb at 1% annually when it in fact is doing the opposite…
Kengeo,
As to why conventional output has fallen 5% in 6 years (about 0.85% per year) part of it is OPEC cuts due to an oversupplied oil market and some of it is due to the pandemic.
To exclude a single nation’s output especially when that nation is one of the 3 largest oil producing nations in the World is silly. Demand for oil is a Worldwide phenomenon as is supply to meet that demand.
Why has output fallen since 2018? In 2019 it was due to OPEC cuts in output, then in 2020 we had a Worldwide pandemic, since the fall in 2019-2020 much of output has recovered.
There are two models that comprise my model, a conventional oil model and an unconventional oil model. The peak of the conventional scenario is 2016 at close to 50% of URR for cumulative output. For the unconventional model with URR=168 Gb, the peak is 2029 at about 50% of URR for cumulative output. The cumulative output of the two models below.
Global output has been climbing since 2020, pretty rapidly, the reason for the fall is pretty obvious, lack of demand due to pandemic. Chart below has World output in Mto per year. About an average rate of increase (using endpoints from 2020 to 2022) of 200 Mto/a for 2 years, growth in future years will be more modest.
Then why was 22 only higher than 2014?
Kengeo,
It was lower because demand for oil was lower in 2022 than in 2014.
It’s fine to exclude US, we don’t export (NET) anything really, so it’s removing noise from the matter.
Your own data shows you the impossibility of future growth, yet somehow you ploy production growing!
Kengeo,
No my model shows that growth is possible. You miss the fact that we have not reached the peak for unconventional oil output which is likely to be in 2029.
I hope you realize that some of your base positions are based on faulty assumptions.
WTI punched above the $75/b level. Next target $80/b.
July Non-OPEC report later tonight. 10 ish.
A new thread on March Non-OPEC and World oil production has been posted.
https://peakoilbarrel.com/march-2023-non-opec-oil-production-drops/
A new open thread Non-Petroleum has been posted.
https://peakoilbarrel.com/open-thread-non-petroleum-july-12/