A guest post by Ovi
All of the Crude plus Condensate (C + C) production data for the US state charts comes from the EIAʼs Petroleum Supply monthly PSM which provides updated information up to February 2023.
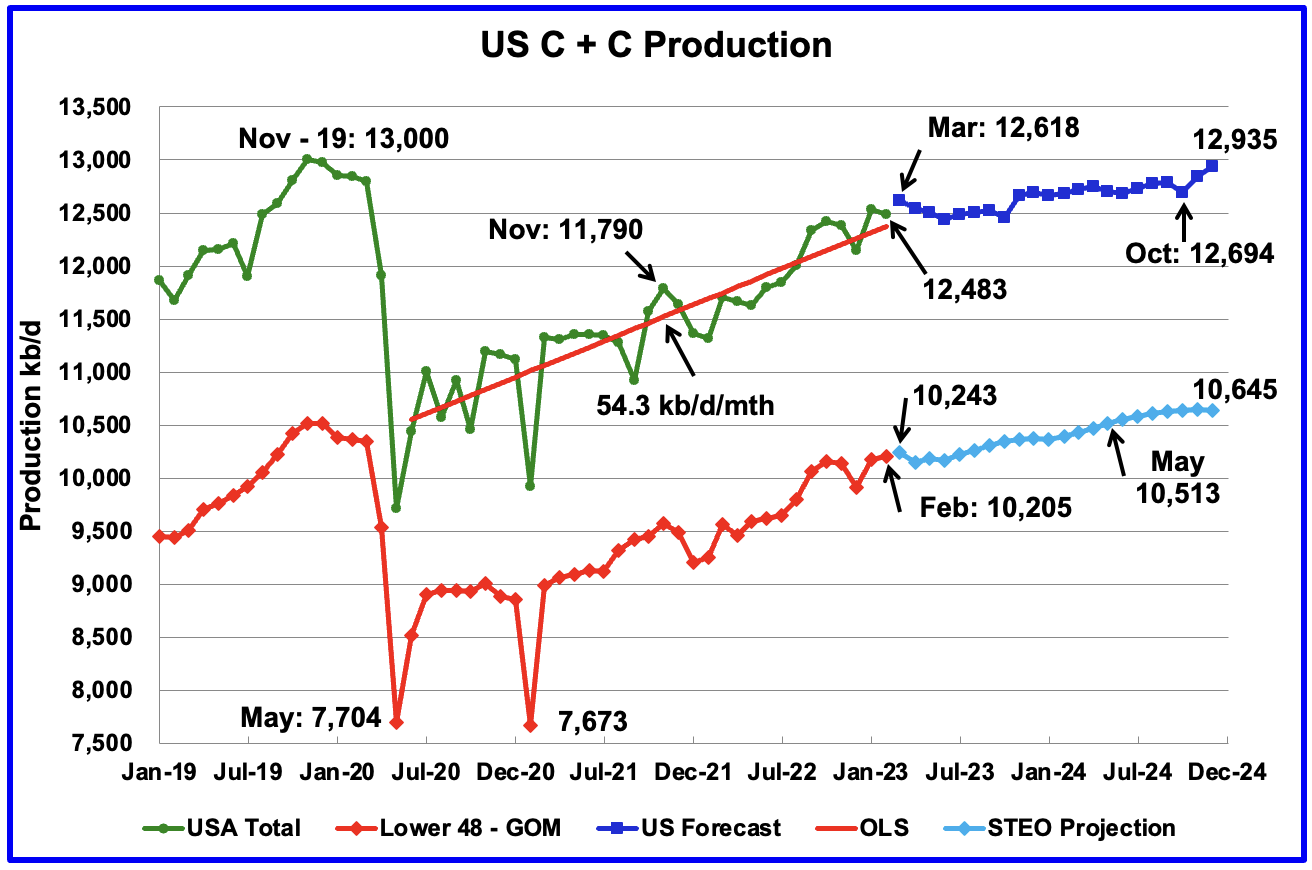
U.S. February oil production decreased by 53 kb/d to 12,483 kb/d. Of the 53 kb/d drop, part of it is due to the upward revision of January production from 12,462 kb/d to 12,536 kb/d, an increase of 74 kb/d.
Most of the states had a small drop except North Dakota which increased production by 77 kb/d.
The dark blue graph, taken from the April 2023 STEO, is the forecast for U.S. oil production from March 2023 to December 2024. Output for December 2024 is expected to be 12,935 kb/d which is 65 kb/d lower than the November 2019 peak of 13,000 kb/d. From March 2023 to October 2024, production is forecast to increase by 76 kb/d.
The red OLS line from June 2020 to February 2023 indicates a monthly production growth rate of 54.3 kb/d/mth, unchanged from last month. Clearly the growth rate going forward into 2023 and 2024, shown in the dark blue graph, is projected to be lower than the 54.3 kb/d/mth seen in the previous July 2020 to February 2023 period.
While overall US oil production decreased by 53 kb/d, the Onshore L48 had a production increase of 28 kb/d to 10,205 kb/d in February. The light blue graph is the STEO projection for output to December 2024 for the Onshore L48. From March 2023, to December 2024, output is expected to increase by 402 kb/d. Note that the last six months of 2024 are showing a hint of plateauing. From May 2024 to December 2024, production increases by just 132 kb/d.
Oil Production Ranked by State
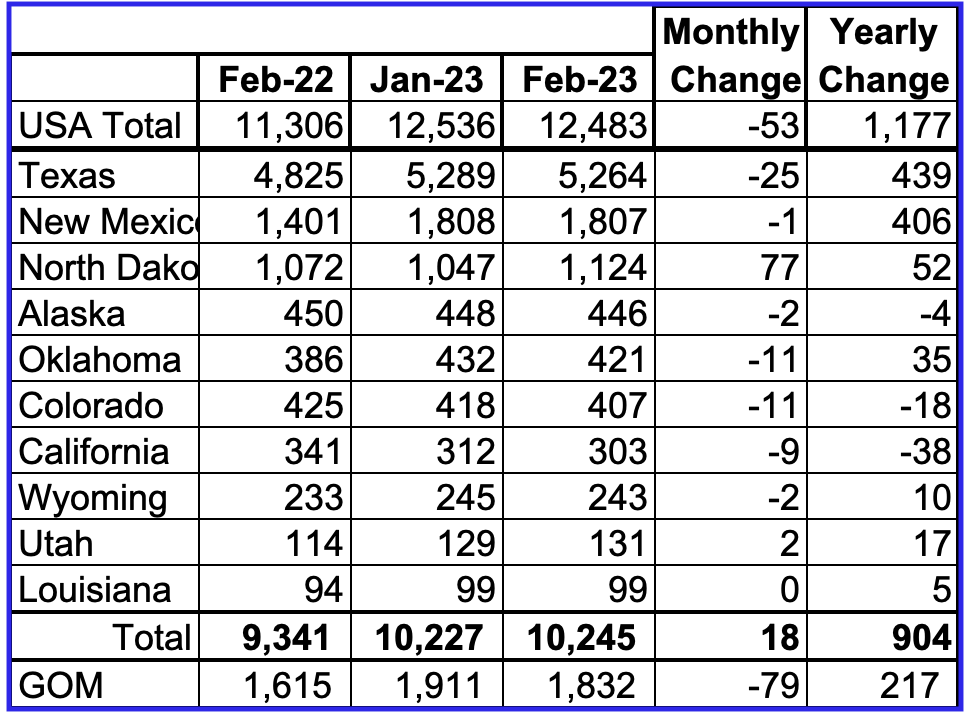
Listed above are the 10 states with the largest US oil production along with the Gulf of Mexico. These 10 states accounted for 82.1% of all U.S. oil production out of a total production of 12,483 kb/d in February 2023. Note that New Mexico production, if it keeps increasing as it did over this past year, could surpass the GOM in the near future.
On a YoY basis, US production increased by 1,177 kb/d with the majority, 845 kb/d having come from Texas and New Mexico.
State Oil Production Charts
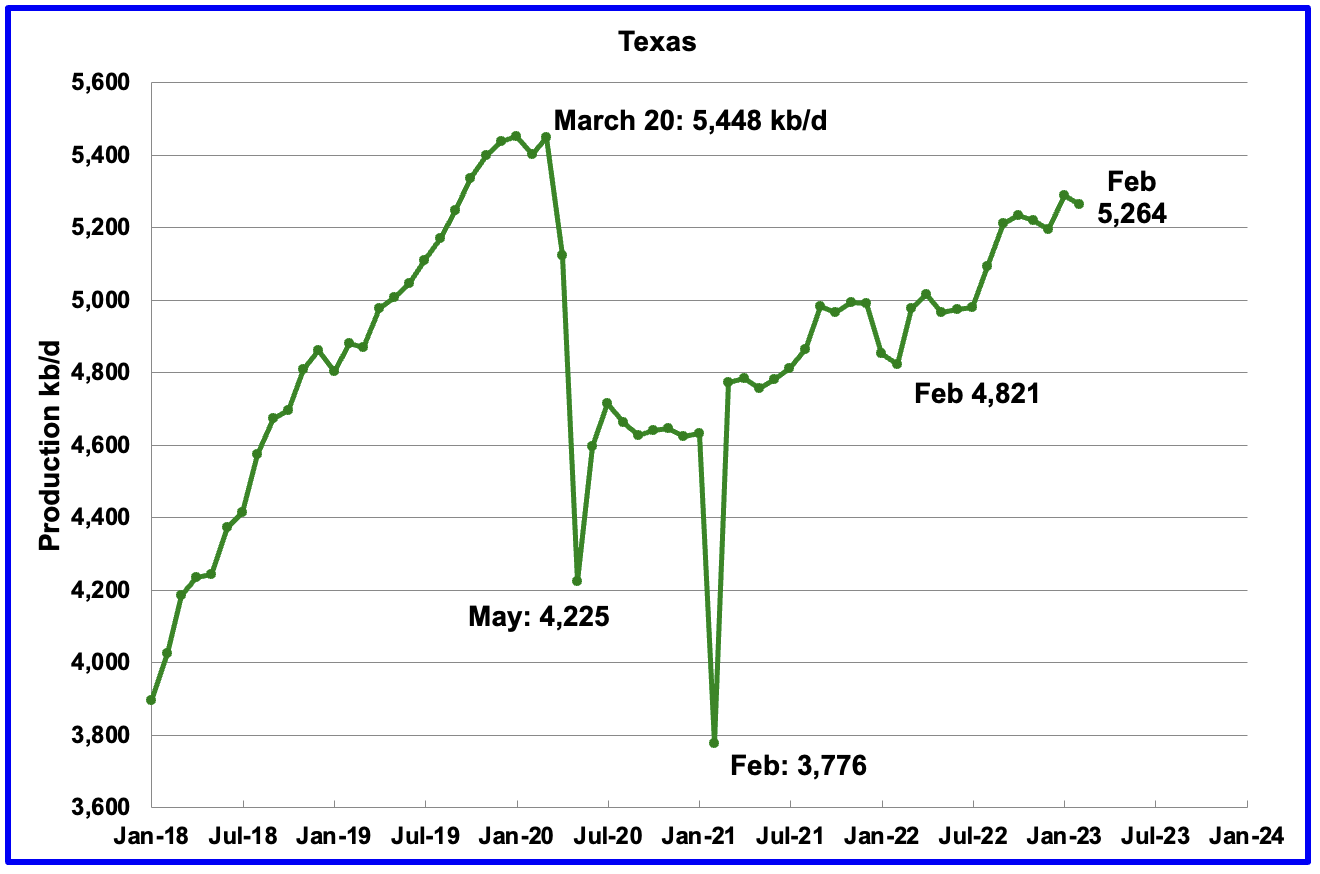
Texas production decreased by 25 kb/d in February to 5,264 kb/d, a drop from January’s post pandemic high of 5,289 kb/d.
In January 2023 there were 324 Hz oil rigs operating in Texas. By late April 2023, the rig count had fallen to 311 Hz oil rigs, a drop 13 rigs. Will this drop in rigs manifest itself in a slowing or flat oil production rate going forward?
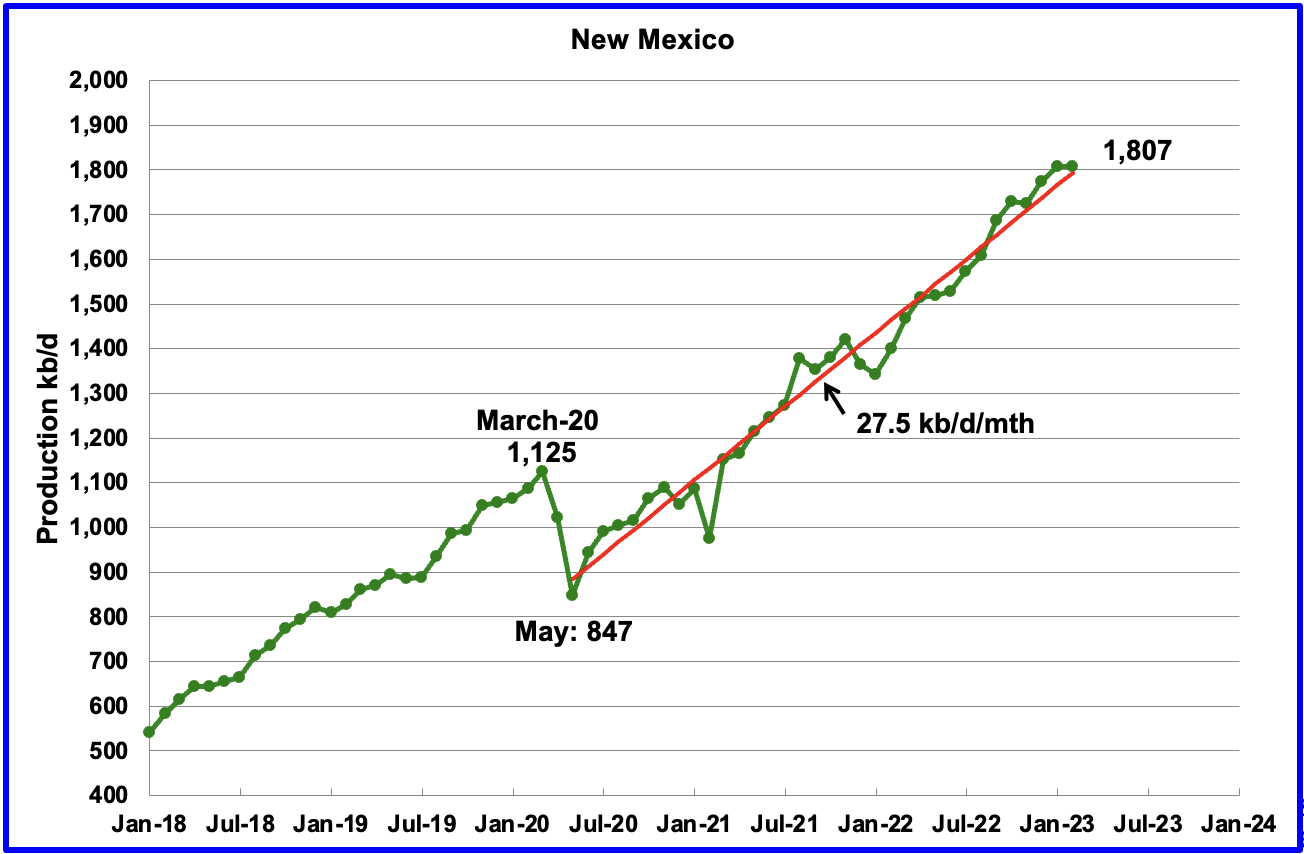
New Mexico’s February production continues at a high level but was little changed from January. February’s production dropped by 1 kb/d to 1,807 kb/d, close to the January record high of, 1,808 kb/d
The red OLS line from May 2020 to January 2022 indicates a production growth rate of 27.4 kb/d/mth and shows no sign of rolling over. However in the DPR section below, production in the Permian basin in April and May is showing sign of starting to roll over.
Since August 2022, the rig count has been steady in the high 90s, 97 ±4.
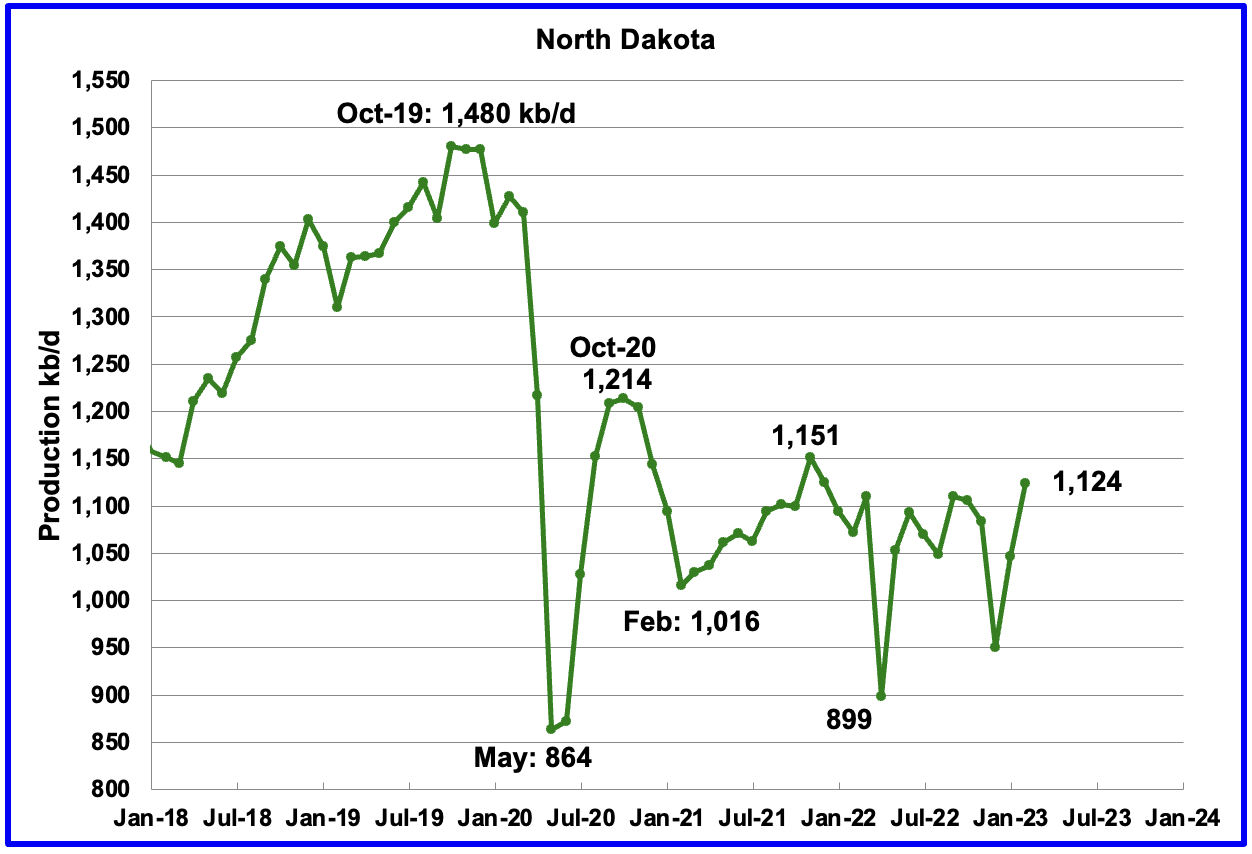
North Dakota’s February’s oil production has recovered from December’s extreme cold weather impacted production. Output increased to 1,124 kb/d, an increase of 77 kb/d over January.
The rig count in North Dakota has been holding steady at 40 since the beginning of the year.
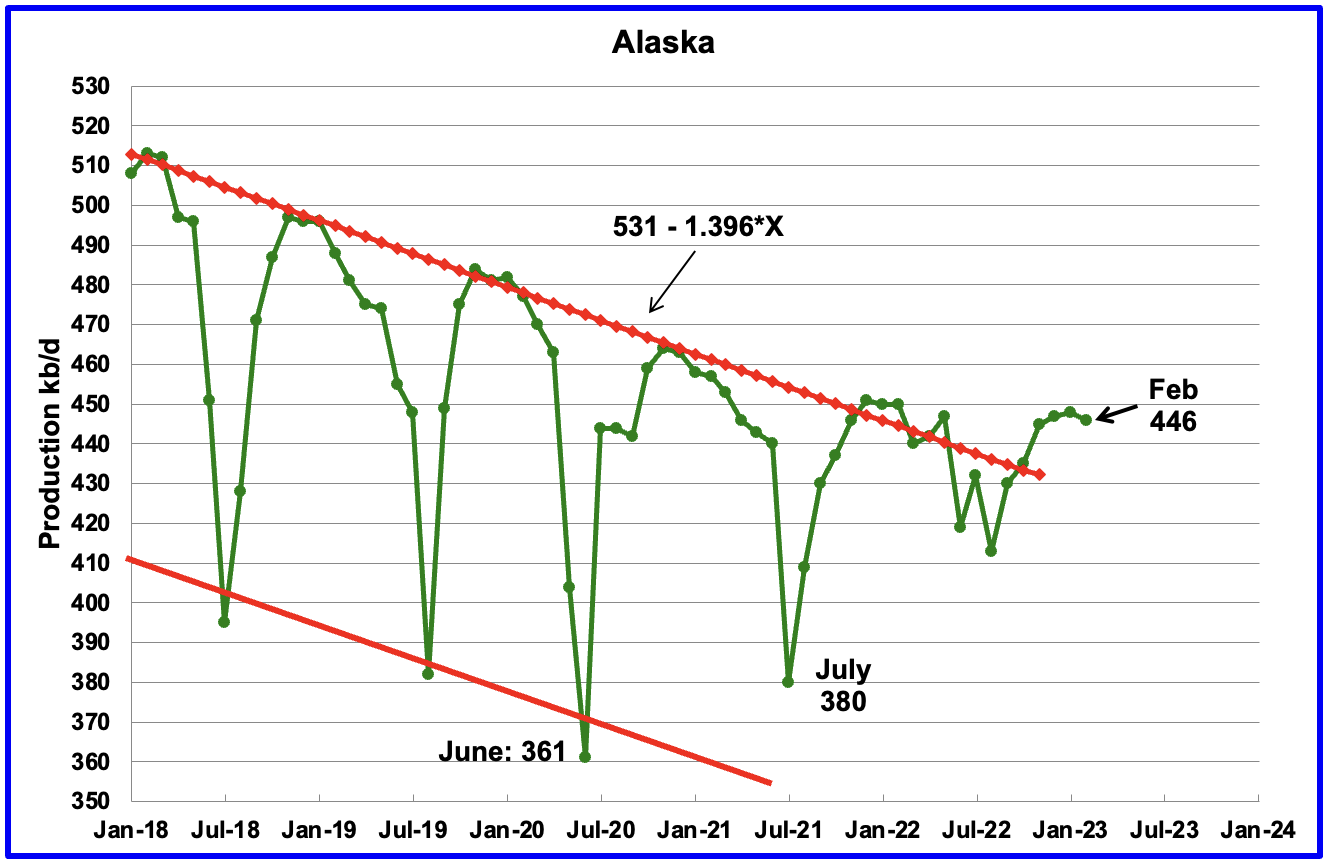
Alaskaʼs February output decreased by 2 kb/d to 446 kb/d and was 4 kb/d lower than January 2022. February is the beginning of Alaska’s annual production declining phase.
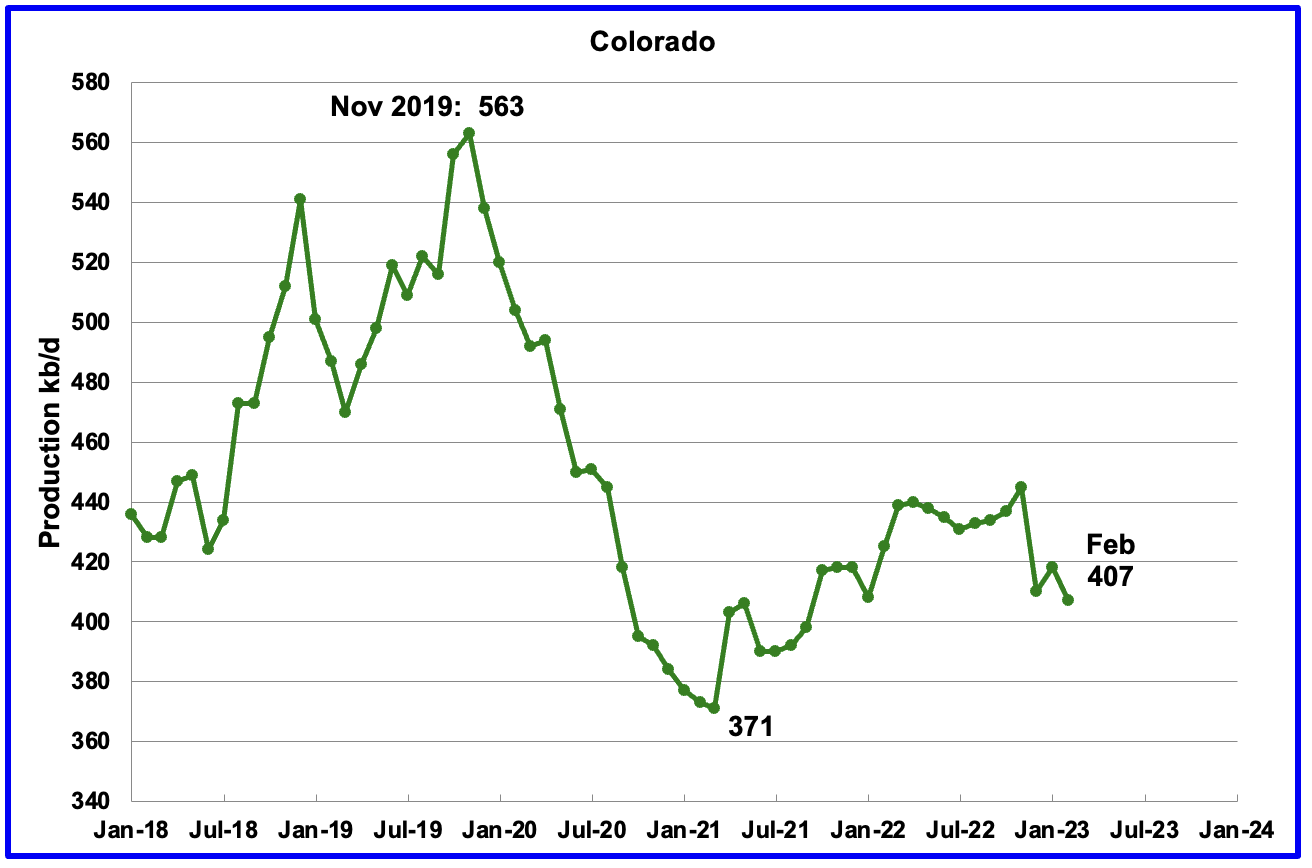
Coloradoʼs February production decreased by 11 kb/d to 407 kb/d.
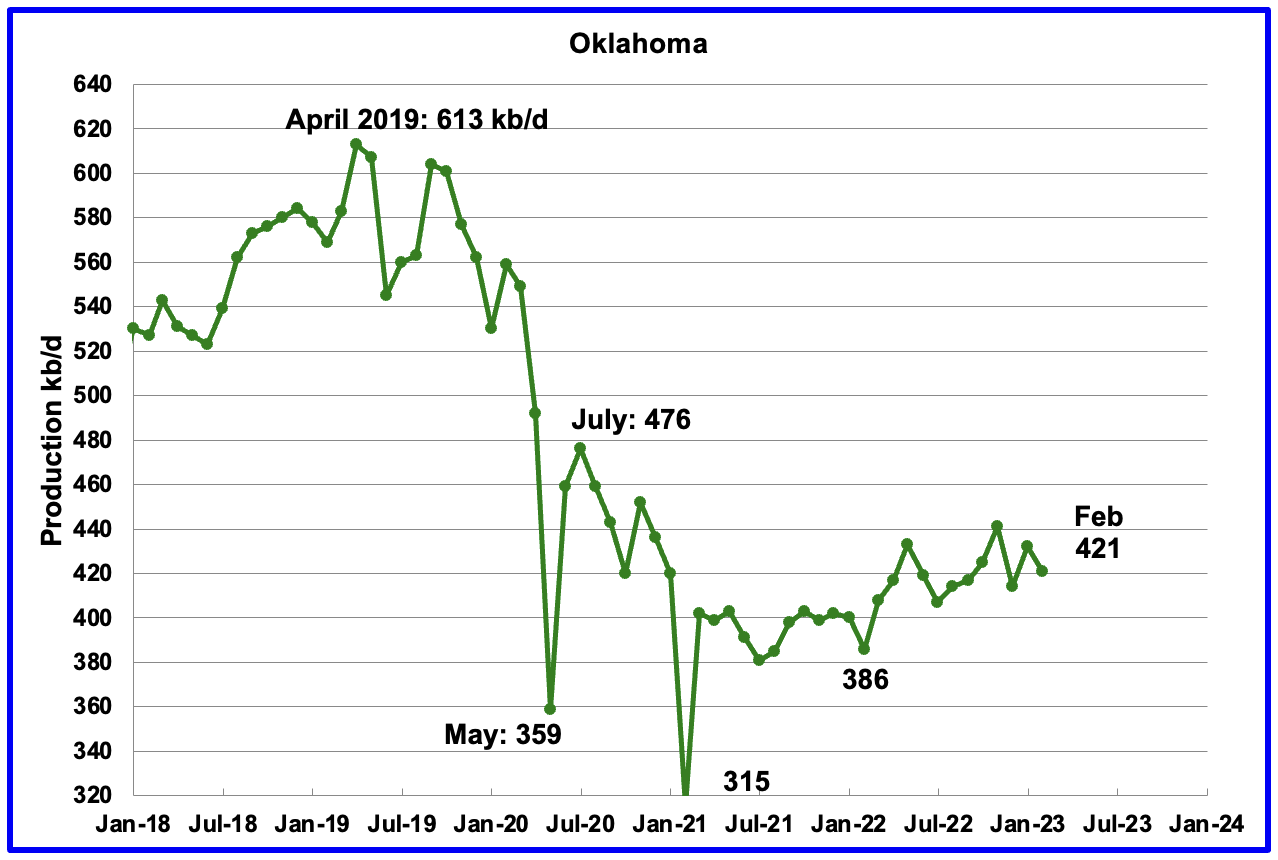
Oklahoma’s output in February dropped by 11 kb/d to 421 kb/d. Production remains 55 kb/d below the post pandemic July 2020 high of 476 kb/d.
From January 2023 to March 2023 close to 60 rigs were in operation in Oklahoma. During April 2023 the average rig count fell to 53.
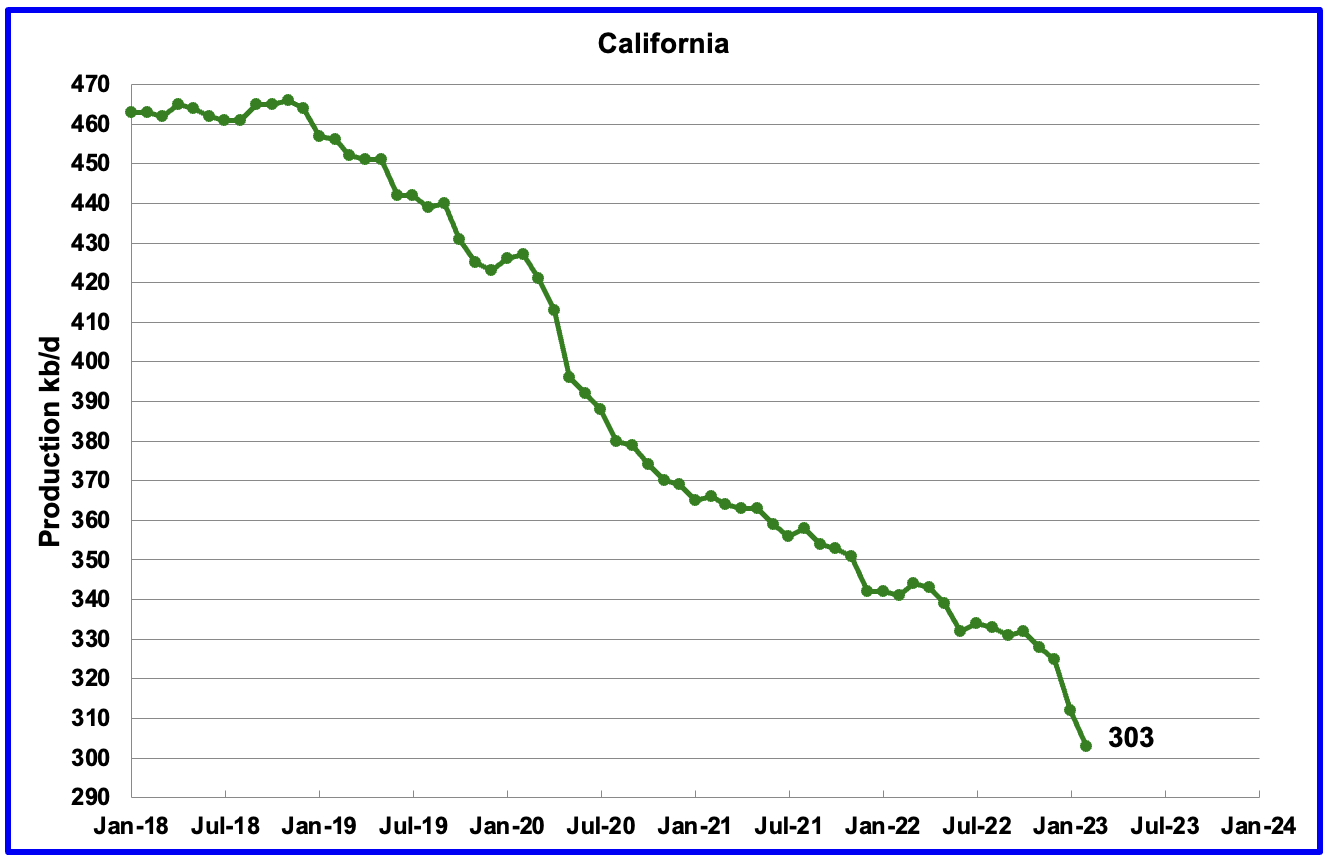
Californiaʼs overall slow output decline trend continues but appears to have accelerated in the last two months. February, along with January, also had a larger than normal drop. February dropped by 9 kb/d to 303 kb/d while January dropped by 11 kb/d.
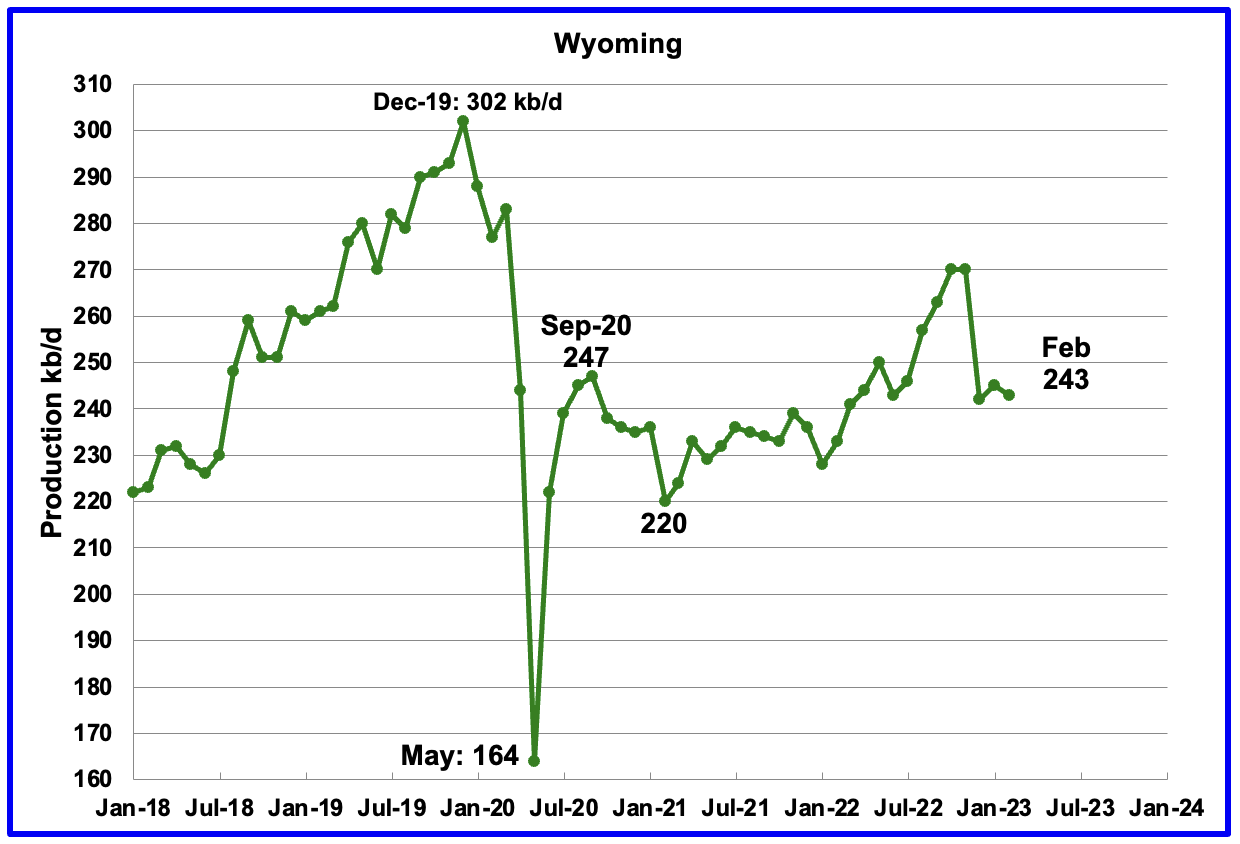
Wyoming’s oil production has been on a slow unsteady uptrend from the low of 220 kb/d in February 2021 due to increased drilling. October and November 2022 output reached a post pandemic high of 270 kb/d. Weather affected December production and February’s production is largely unchanged from January. February’s oil production dropped by 2 kb/d to 243 kb/d.
In late 2022, Wyoming had 18 rigs operating which dropped to 15 in January and dropped further to 12 in February.
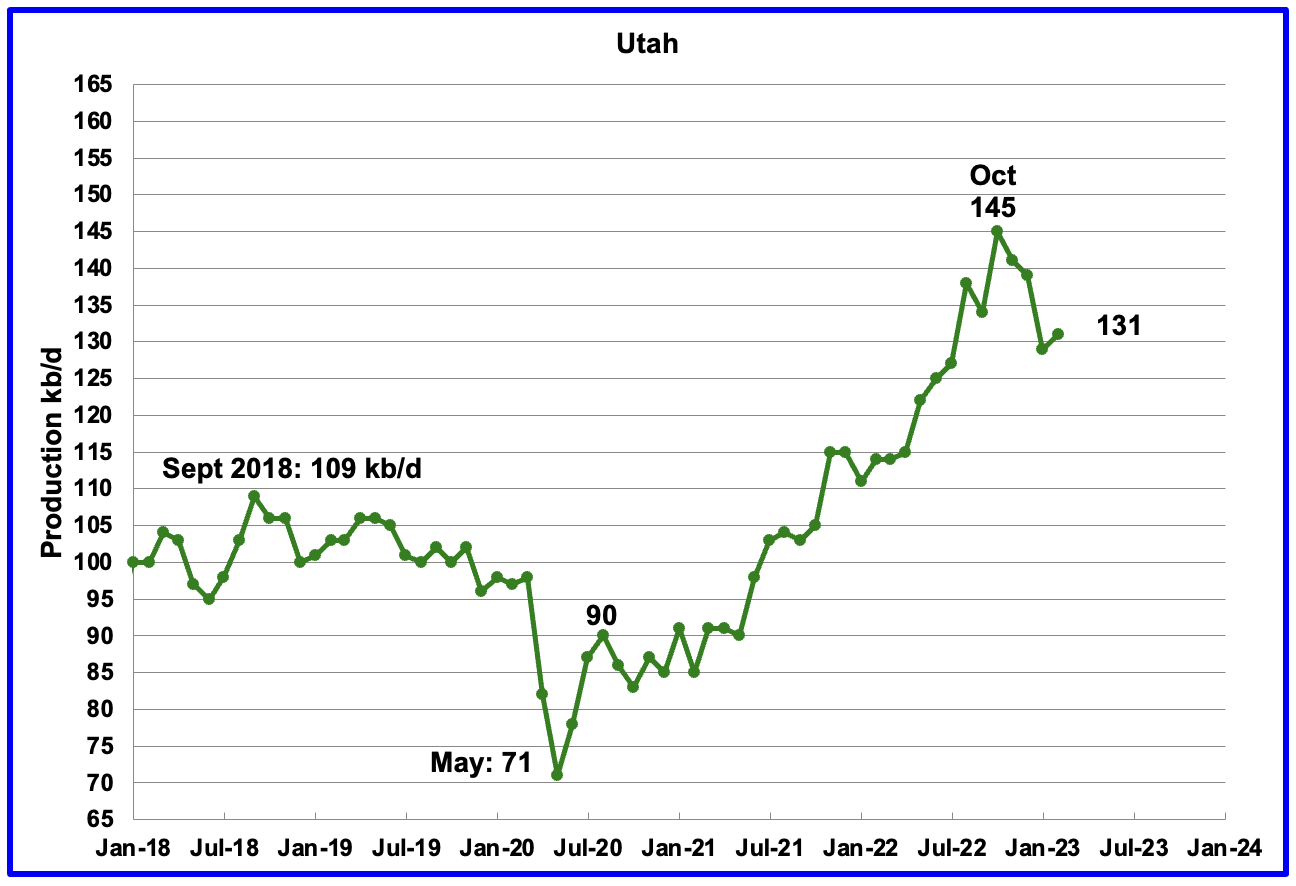
Utah’s oil production increased steadily since early 2021 and reached a new high of 145 kb/d in October 2022. However since then, production has declined by 14 kb/d to 131 kb/d in February.
Utah had 7 Hz rigs operating in January and February 2023, up from 5 in January 2022.
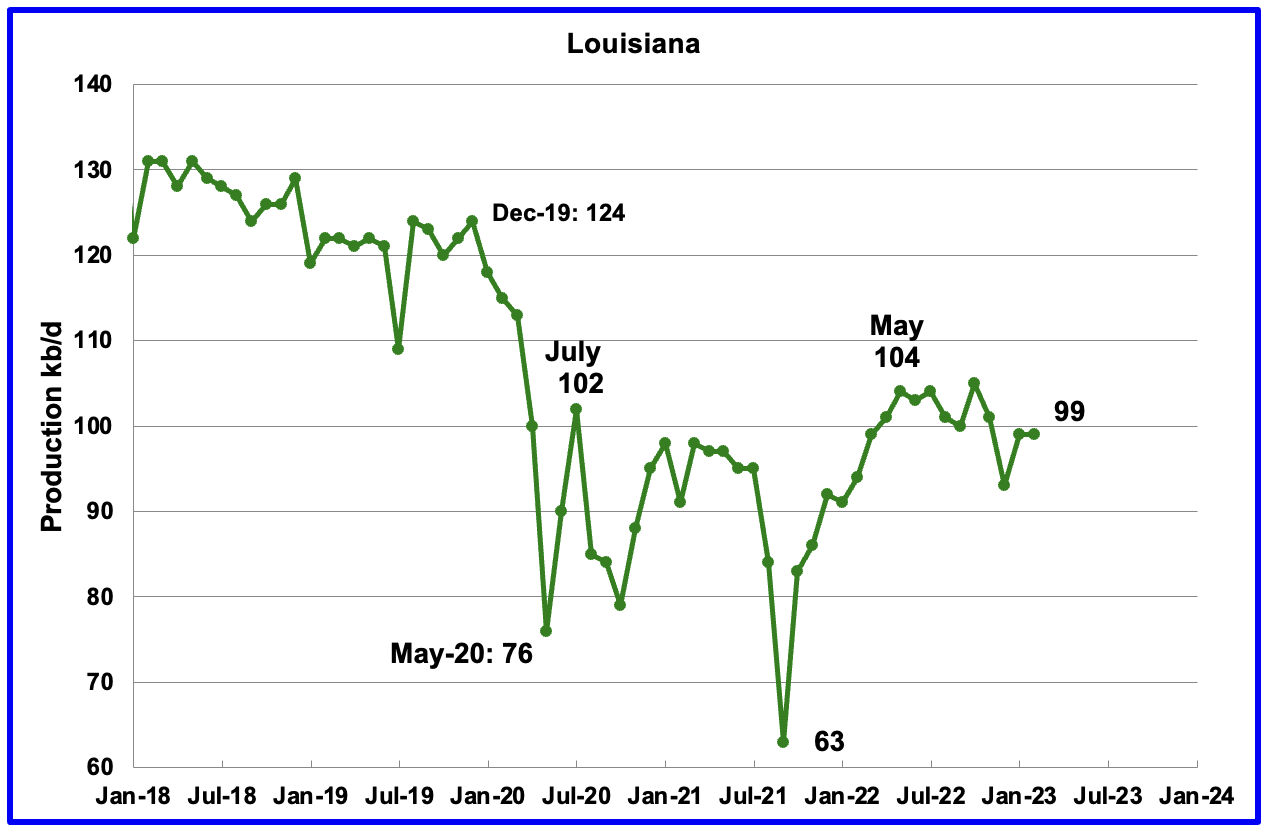
Louisiana’s output rose from the low of 63 kb/d in September 2021 to 104 kb/d in May 2022. Since then output has plateaued. February’s production was unchanged at 99 kb/d and is 5 kb/d lower than May 2022.
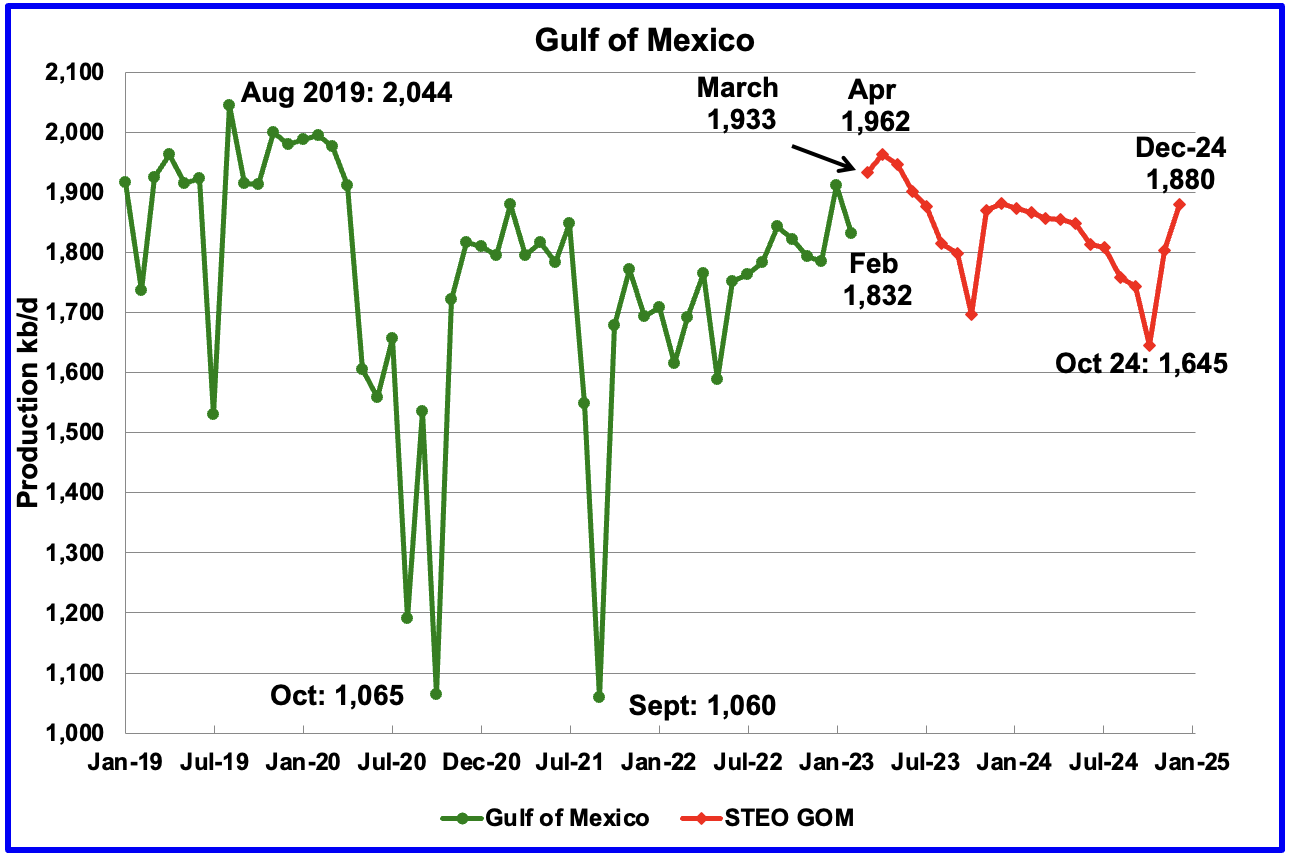
GOM production decreased by 79 kb/d in February to 1,832 kb/d. If the GOM was a state, its production would normally rank second behind Texas.
The March 2023 STEO projected GOM output for February 2023 would drop to 1,828 kb/d. Amazingly, it just missed by 4 kb/d.
The April 2023 STEO projection for the GOM output has been added to this chart and projects that output in March 2023 will rise to 1,933 kb/d.
This could be a reasonable estimate since Shell announced that the Vito platform had begun production on February 15, 2023.
It is not known if the GOM decline after March 2023 is related to extensive maintenance.
A Different Perspective on US Oil Production
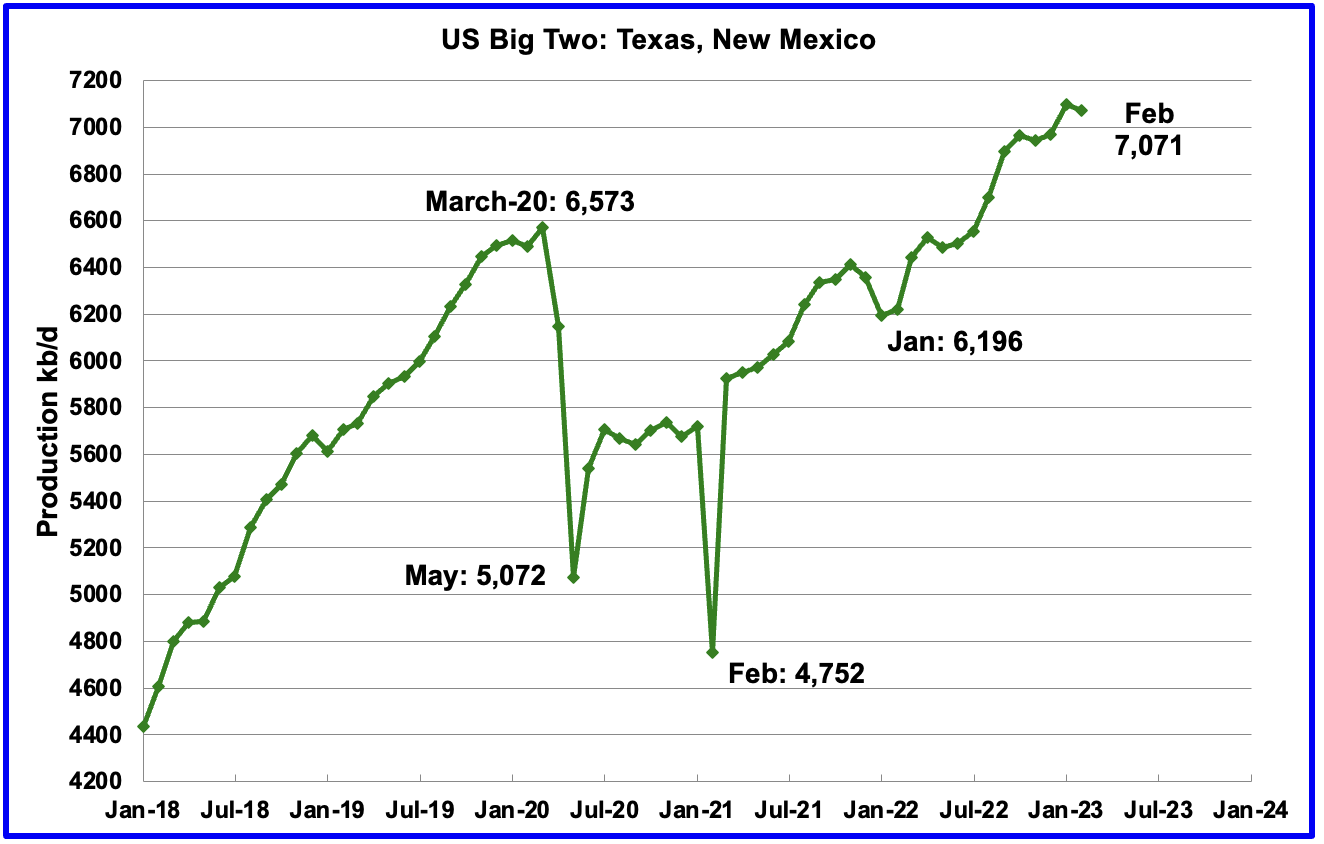
The Big Two states’ combined oil output for Texas and New Mexico.
February’s production in the Big Two states decreased by a combined 26 kb/d to 7,071 kb/d with Texas contributing 25 kb/d while New Mexico dropped 1 kb/d.
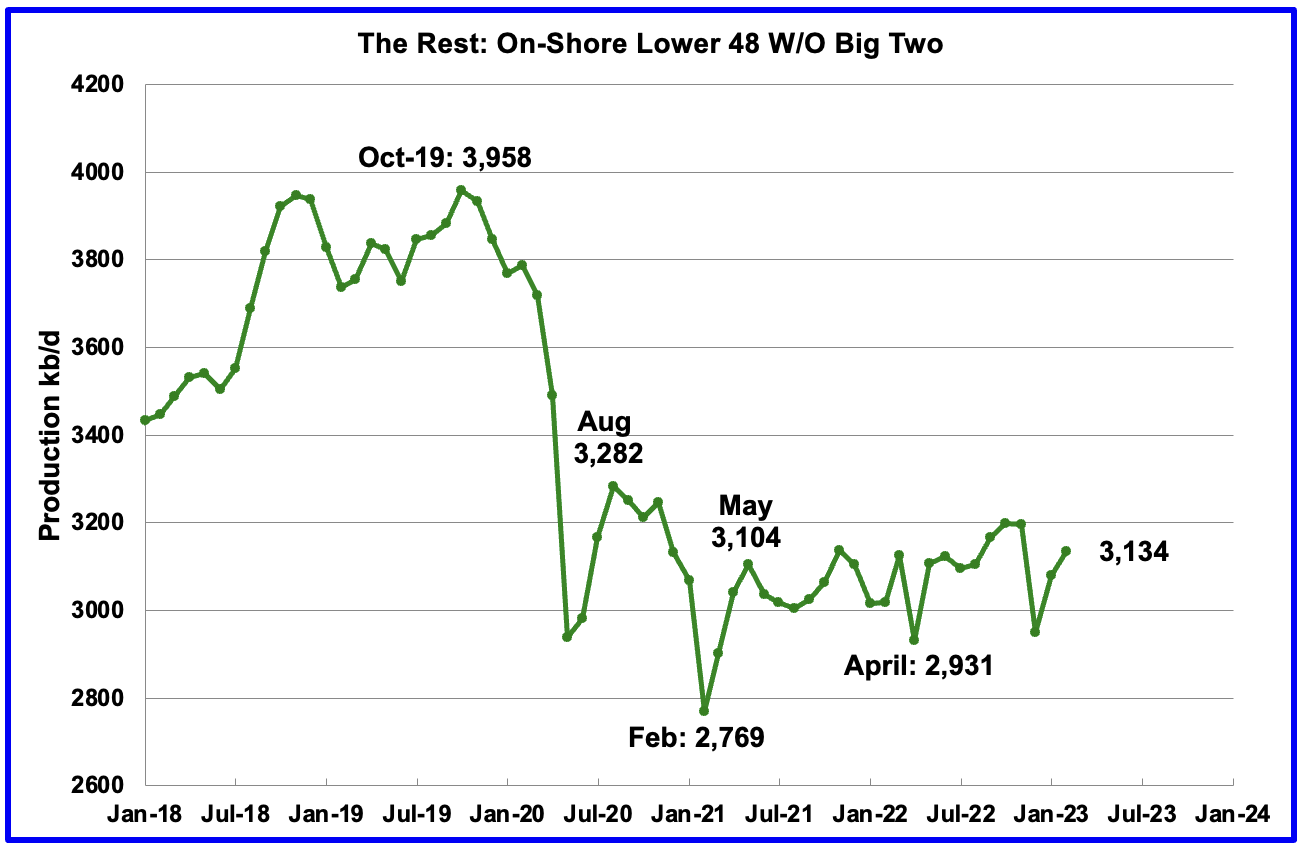
Oil production by The Rest
In February production in The Rest rose by 54 kb/d to 3,134 kb/d. From May 2021, oil production in The Rest has been range bound between 3,000 kb/d and 3,200 kb/d and has not given any clear indication of being in decline or rising.
The main takeaway from The Rest chart is that current production is 824 kb/d below the high of October 2019. The question we need answered is “Is this a permanent loss that will never be recovered?” All indications continue to be that this is a permanent loss.
Rigs and Fracs
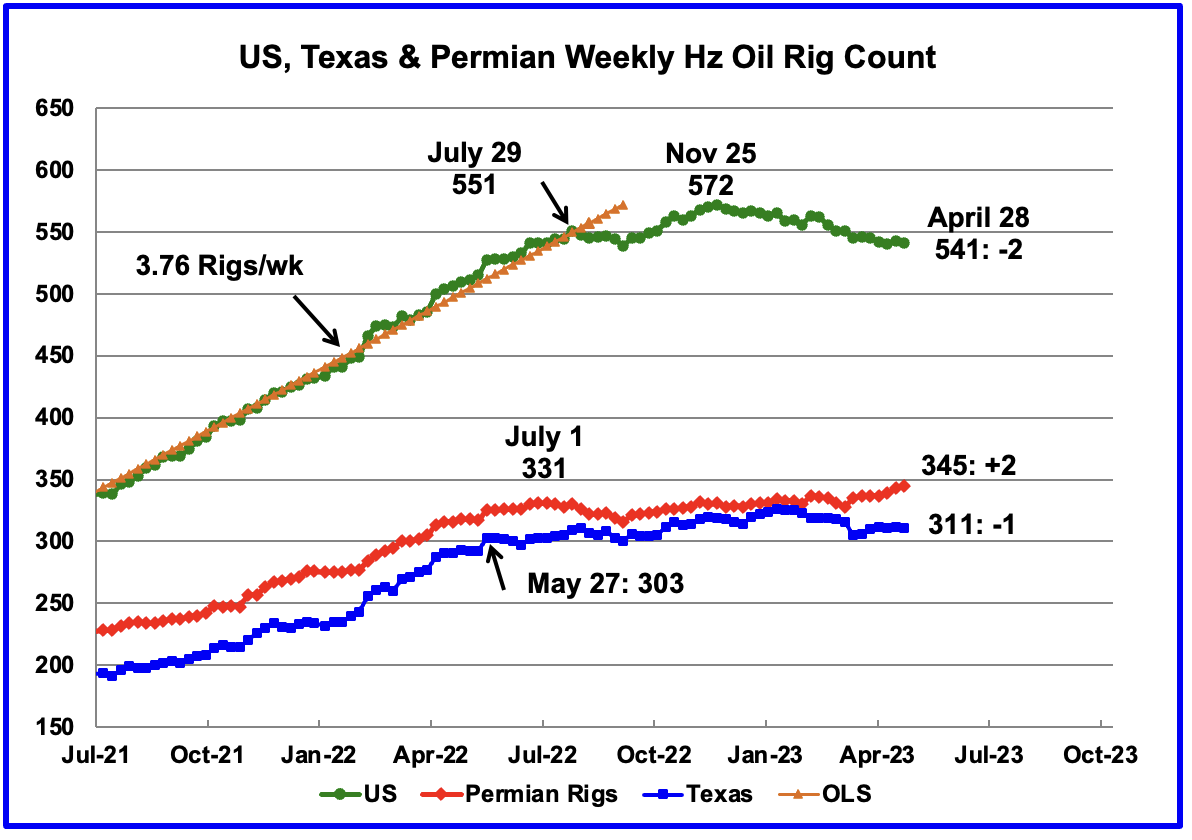
Since the beginning of April 2021 through to the week ending July 29, 2022, the US added horizontal oil rigs at a rate of close to 3.76 rigs/wk, orange OLS line, and peaked at 551 rigs in the week ending July 29. However since then the number of operational rigs has wondered primarily sideways.
A high of 572 rigs was reached in the week ending November 25, 2022. In the week ending April 28, 2023 the number of rigs decreased by 2 to 541 and are down 31 from the recent high of 572.
In the week ending April 28, Permian rigs increased by 2 to 345 and Texas rigs dropped by 1 to 311. Note that the trend for rigs in the Permian is showing a slow increase from September 2022 and is currently 14 above the high of 331 on July 1, 2022.
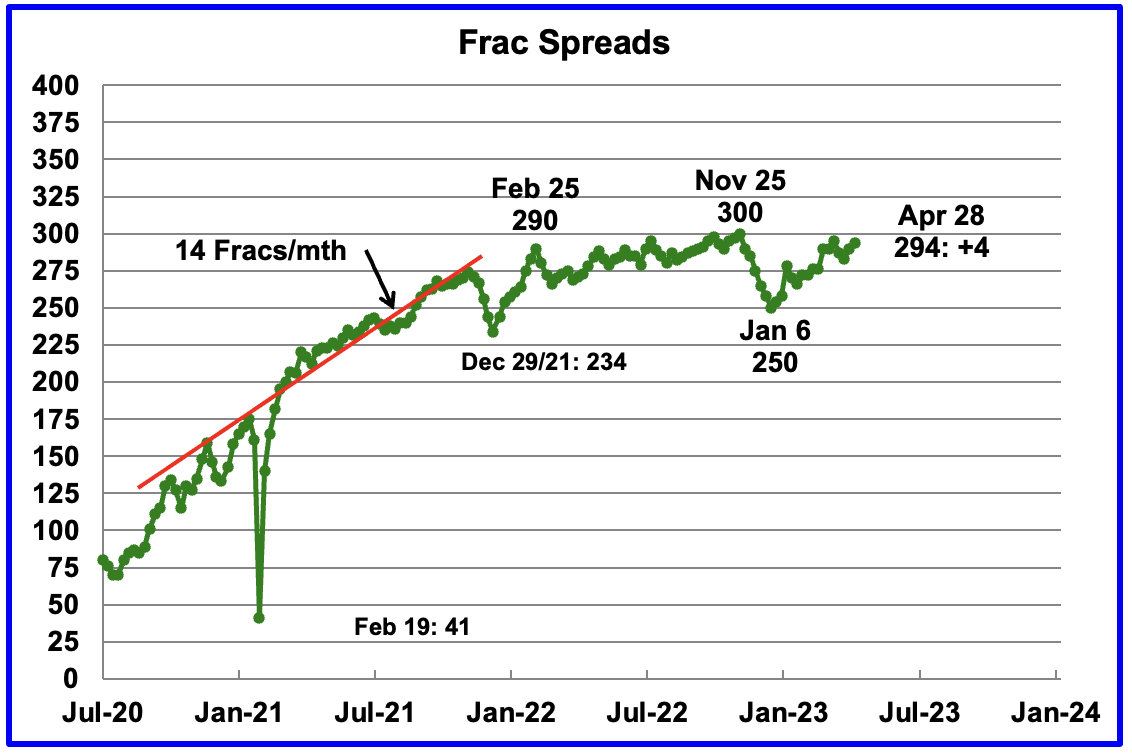
For frac spreads, the general trend since the week of January 6, 2023 can best be described as recovering from the slow down associated with the 2022 Thanksgiving and Christmas holidays. This trend is a repeat of what happened last year. However there is one difference. Last year the recovery took place over 9 weeks while this year it has taken 13 weeks so far.
For the week ending April 28, the Frac count increased by 4 to 294. How far above 300 will the Frac count get in 2023?
Note that these 294 frac spreads include both gas and oil spreads.
This interesting comment appeared in this North Dakota source regarding the availability of Frac crews: “Well completions rose in February and dropped in March due to volatility in the availability of fracking crews, Helms added.” Is this a North Dakota issue or does it also apply in the Permian?
Frac Spread Count Detail
The Frac Spread Count, provided by energy consultancy Primary Vision, measures how many crews across the U.S. are drilling wells in preparation for hydraulic fracturing of shale, and serves as a simultaneous indicator of the number of wells being drilled, as well as a leading indicator of crude oil production.
I have been working recently with the Frac Spread count database to try to understand how to use it. Some progress has been made and some initial results are provided. This is some of the typical information provided in their database, OperatorName, WellName, the vertical distance from a point in the well (usually the current or final depth) to a point at the surface, the total oil volume.
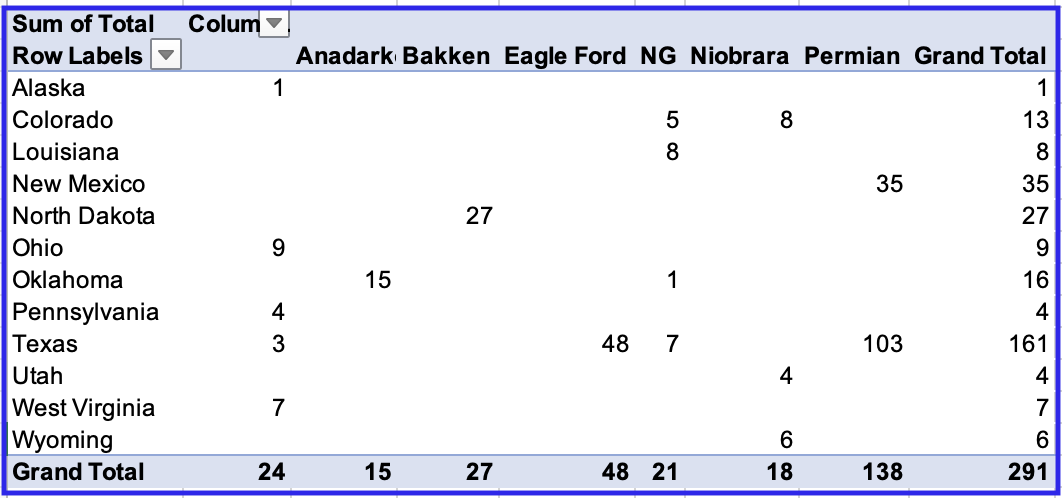
This above table shows the distribution of Frac spreads by Basin and State. The column NG was added to indicate which counties were primarily NG producers in places such as Texas and Colorado. Note that Pennsylvania and Ohio have no Frac spreads because they were left “Blank” in the spreadsheet since I think they are mostly natural gas plays.
The above results are for the week March 25 to March 31. According to the official Frac Spread site that week had 290 frac spreads operating. The table is showing 291. Of the 270 oil Frac Spreads, 138 or 51% are located in the Permian.
That date was chosen since the Frac data file is not fully up to date for later weeks.

This table shows the distribution of Frac spreads by State and County. Lea and Eddy counties are the hot spots in New Mexico while Howard, Midland, Loving, Martin, Midland and Reeves are the most active counties in Texas.
I would be interested in hearing whether there are any Gems in the two pivot tables or any additional info I should look at.
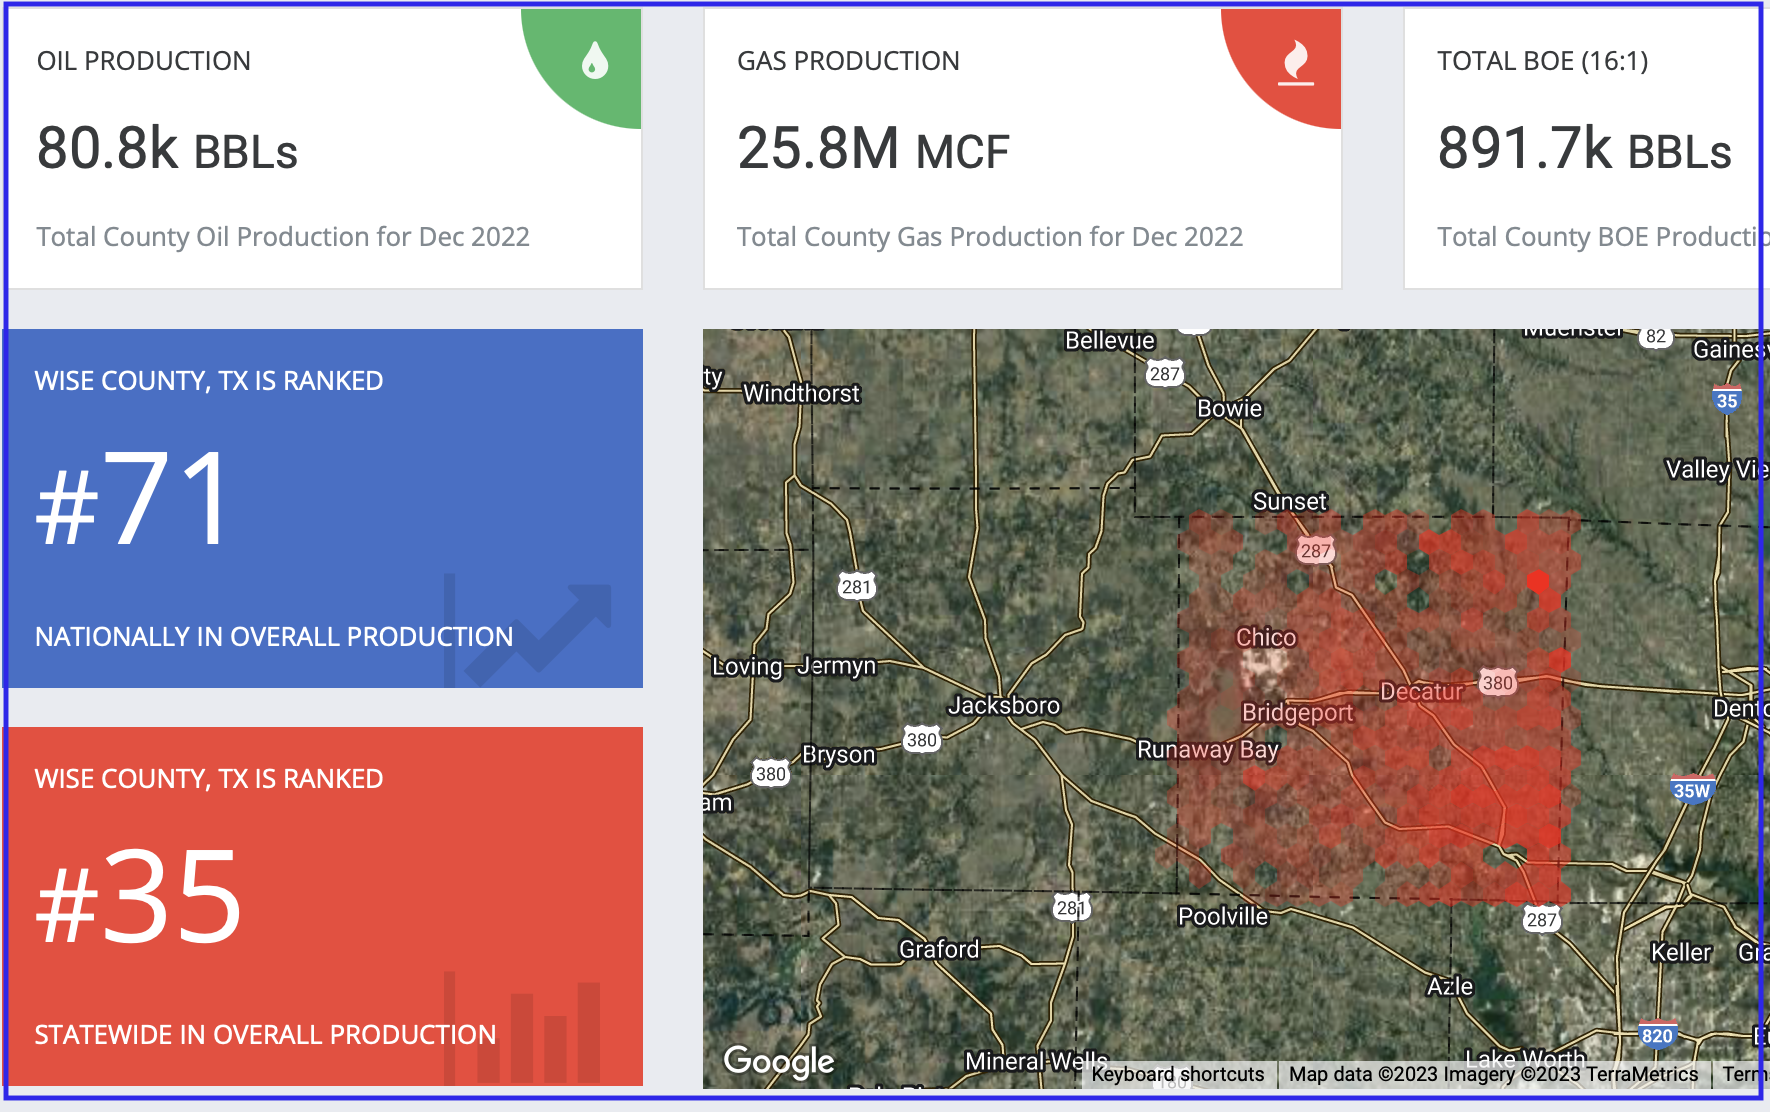
The info for many the lesser known counties came from this source. Information at this site and other similar ones indicate whether it is primarily an oil county or gas county.
Drilling Productivity Report
The Drilling Productivity Report (DPR) uses recent data on the total number of drilling rigs in operation along with estimates of drilling productivity and estimated changes in production from existing oil wells to provide estimated changes in oil production for the principal tight oil regions. The April DPR forecasts production to May 2023 and the following charts are updated to May 2023. The DUC charts are updated to March.
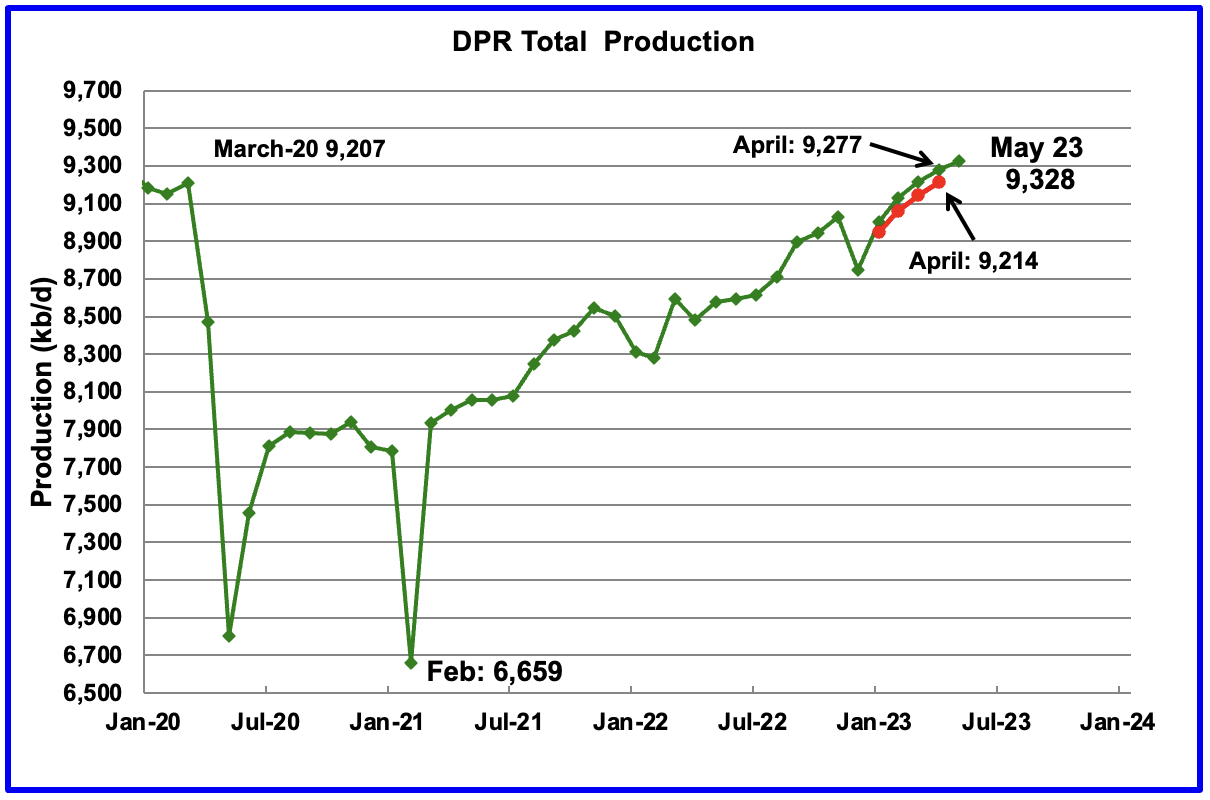
Above is the total oil production projected to May 2023 for the 7 DPR basins that the EIA tracks. Note that DPR production includes both LTO oil and oil from conventional wells.
The April DPR report made a modest upward revision to the March report. For instance, April output was revised up by 63 kb/d from 9,214 kb/d to 9,277 kb/d. The DPR is projecting that oil output for May 2023 will increase by 50 kb/d to 9,328 kb/d, a new all time high. The pre-pandemic high was 9,288 kb/d in December 2019.
Note the rolling over production trend over the past five months. See next chart.
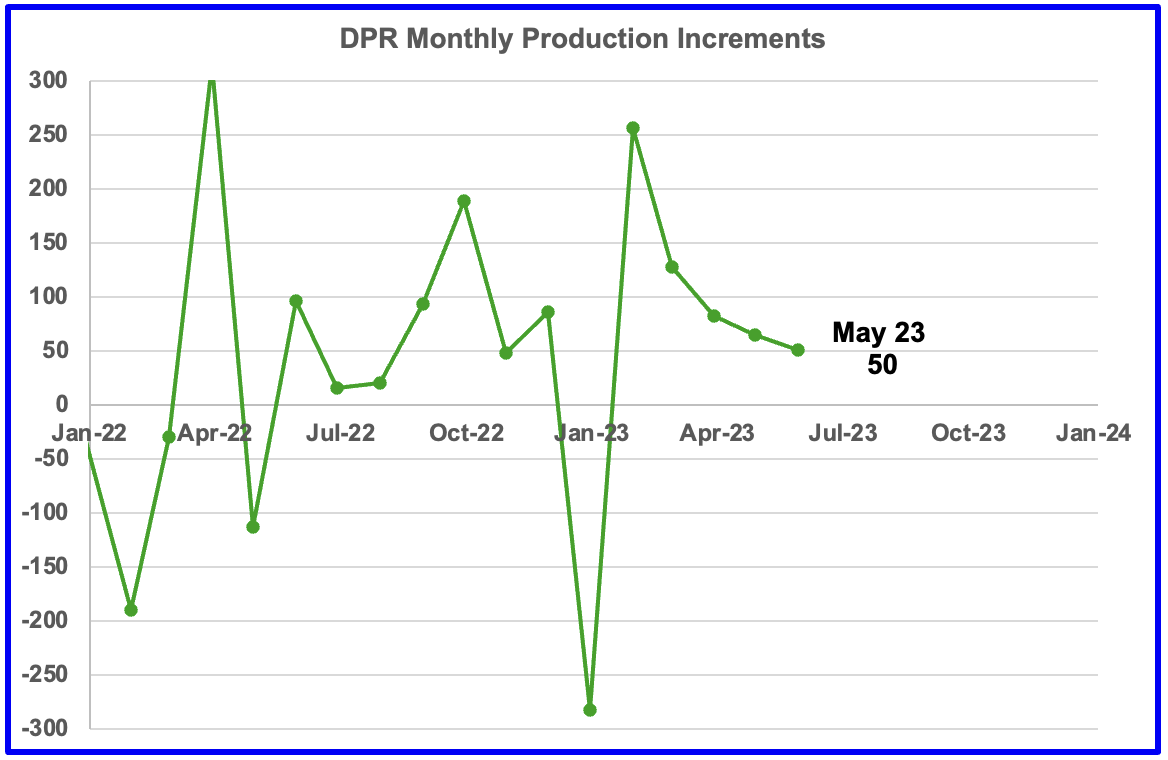
This chart shows the monthly DPR production increments. What is notable is the reduced month to month volatility since January 2023. The January 2023 spike is due to the weather related December oil production drop.
The more interesting trend to notice is the declining monthly changes in the production rate. March’s production increase was 82 kb/d while May’s increase dropped by 32 to 50 kb/d. This short term trend is hinting at an upcoming plateau in Permian production, since it is the dominant producer.
The issue is whether this trend is the result of management’s decision on how to deploy its revenue, investors vs production, or is it related to geology, fewer Tier 1 locations along with the Permian gassing out?
However this source‘s longer term forecast is that the Permian will continue to grow till 2030 and peak at close to 7,860 kb/d in 2030. See next chart.
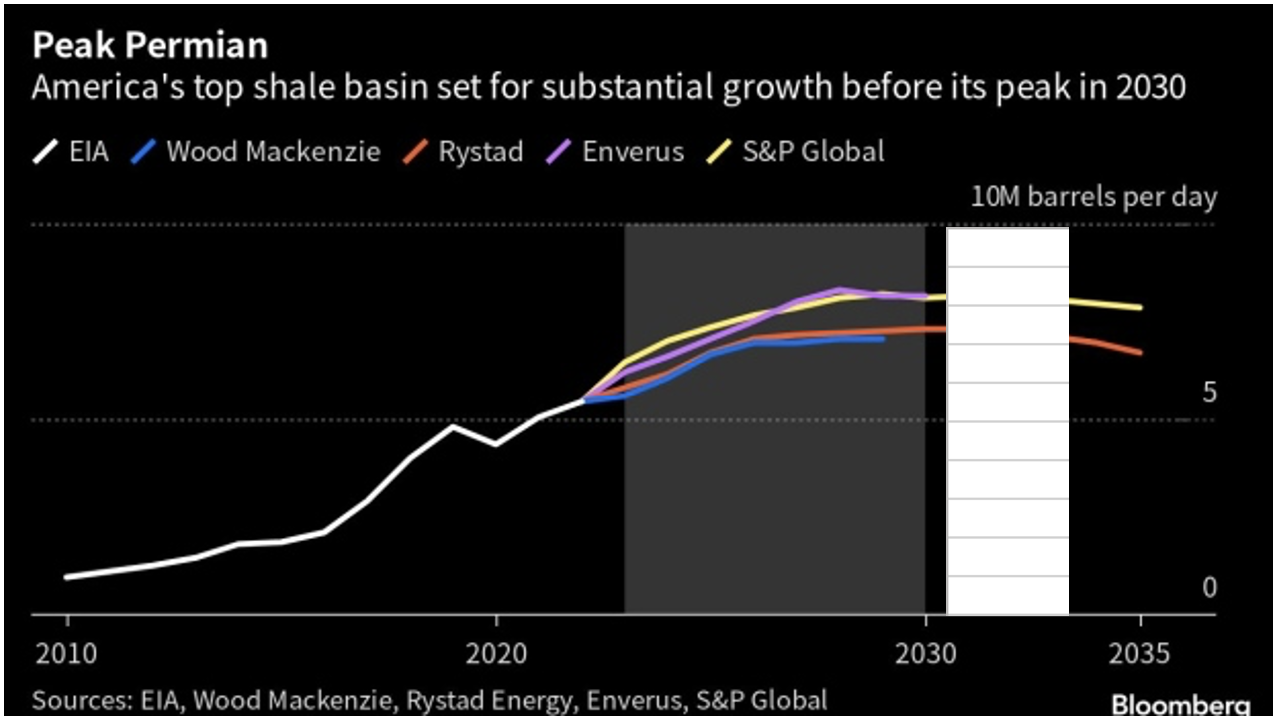
In this chart, Rystad and Wood Mackenzie are forecasting peak production in 2030 of 7,000 kb/d to 7,200 kb/d. On the other hand Enverus and S & P Global are forecasting peak production of 8,100 kb/d in 2030. The white graph is the EIA Permian projection showing close to 5,500 kb/d in early 2023. The white scale has been added to read the chart for 2030.
In January 2025, Rystad and Wood Mackenzie are indicating production of 7,100 kb/d to 7,250 kb/d while Enverus and S & P Global are showing production at 6,900 kb/d.
Looking at the lower estimate of 6,900 kb/d in January 2025 and current production of 5,700 kb/d (See next chart), and the slowing production in the Permian, it is difficult to see 1,200 kb/d being added over the next 19 months, based on the latest DPR info.
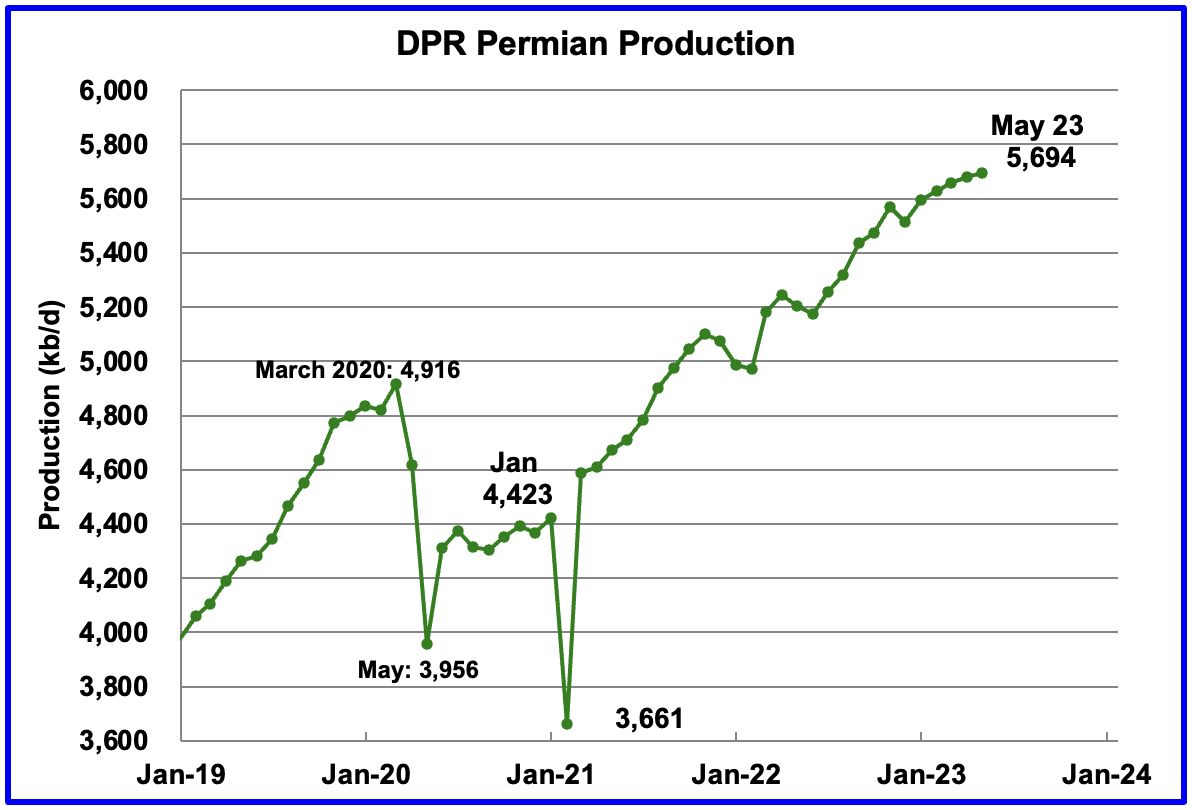
Permian output continues to rise in May. It is expected to increase by 13 kb/d to 5,694 kb/d.
If the Permian were part of OPEC, at 5,694 kb/d it would be the second largest producer after Saudi Arabia. April’s output is 778 kb/d higher than the pre-pandemic high 4,916 kb/d.
In February, the monthly production increase was 32 kb/d. In May it drops to 13 kb/d. This plateauing trend in the chart is very visible over the last four months, which is similar to the overall trend for the combined production in all of the LTO basins.
During March, 432 wells were drilled and 464 were completed in the Permian. (Note that March is the latest month for DUC information). The completed wells added 376 kb/d to March’s output for an average of 809 b/d/well. The overall decline was 345 kb/d which resulted in a net increase for Permian output of 31 kb/d. Of the 464 completed wells, 425 were required to offset the decline.
Note that the increased use of DUCs is a reversal of what occurred in the previous months where drilled and completed wells were essentially the same. For May, well competitions exceeded drilled wells by 32.
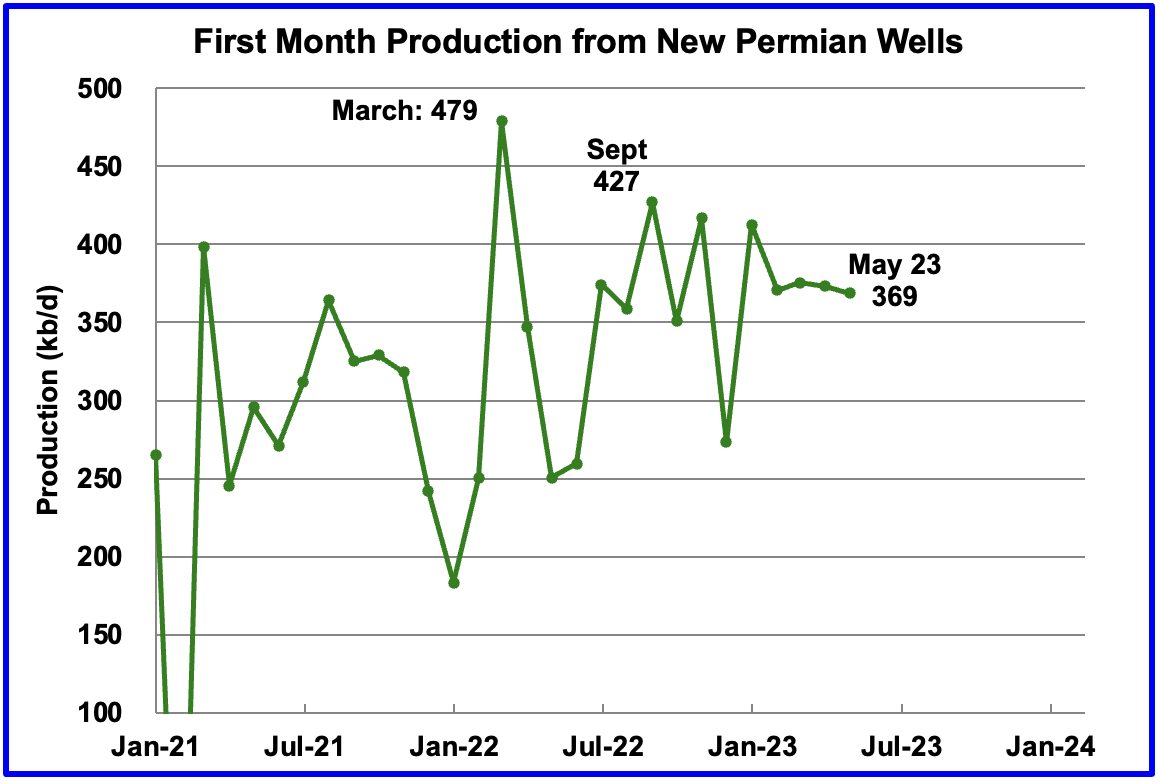
This chart shows the average first month total production from Permian wells tracked on a monthly basis. The total monthly production from the newest Permian wells in May continues to be at the 370 kb/d level. To achieve that production level in May, drillers completed 32 more wells than were drilled. In other words the Permian DUC count dropped by 32.
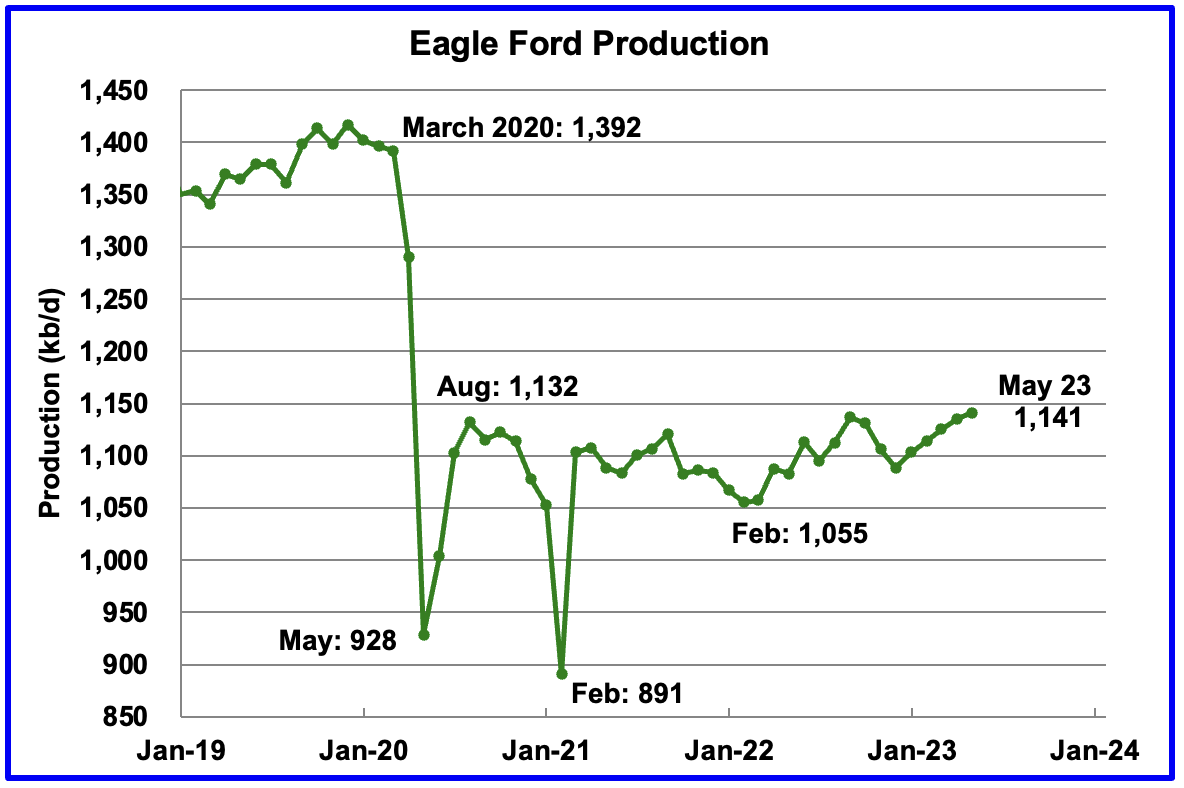
Output in the Eagle Ford basin has been in a generally flat trend since March 2021. However since the December 2022 weather induced production drop, production has been increasing. May’s output is expected to increase by 6 kb/d to 1,141 kb/d and now exceeds the August 2020 output of 1,132 kb/d.
At the beginning of the year 2023, 68 rigs were operating in the Eagle Ford basin. The rig count began to drop in mid March to 60 and dropped further to 57 in the last week of April.
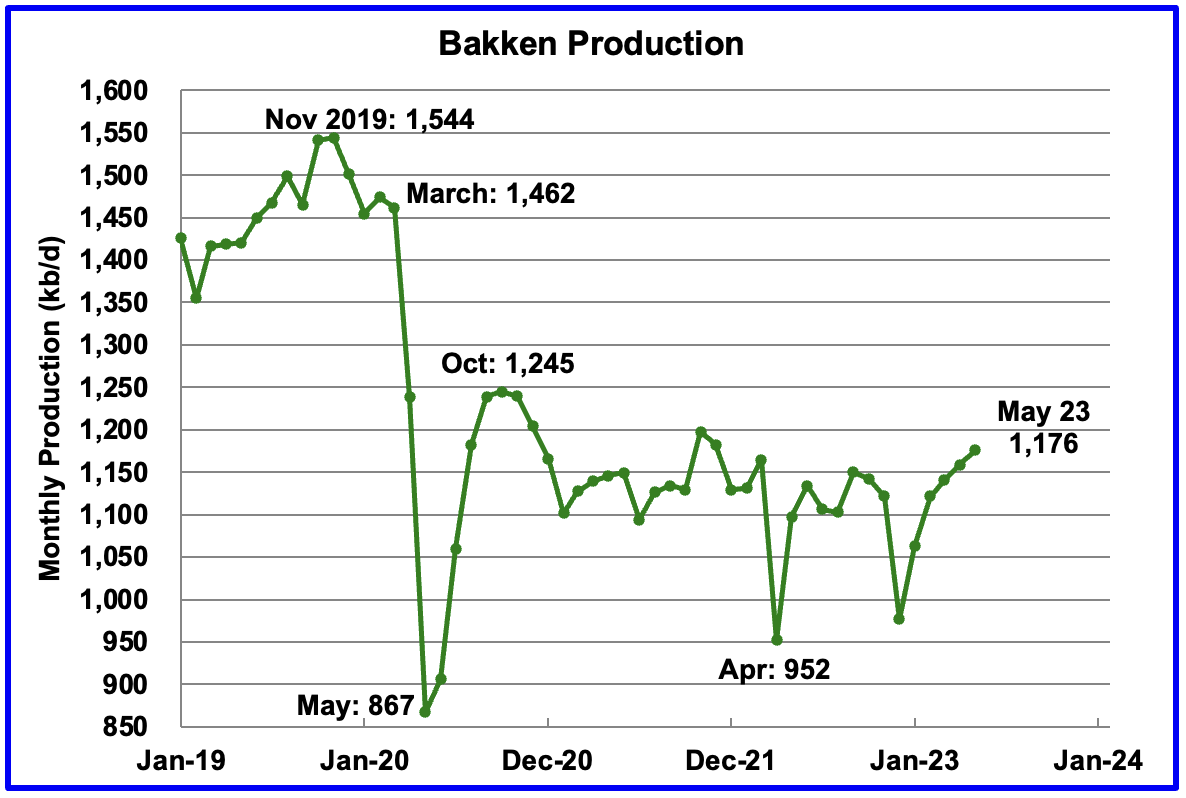
The DPR forecasts Bakken output in May will be 1,176 kb/d an increase of 17 kb/d over April.
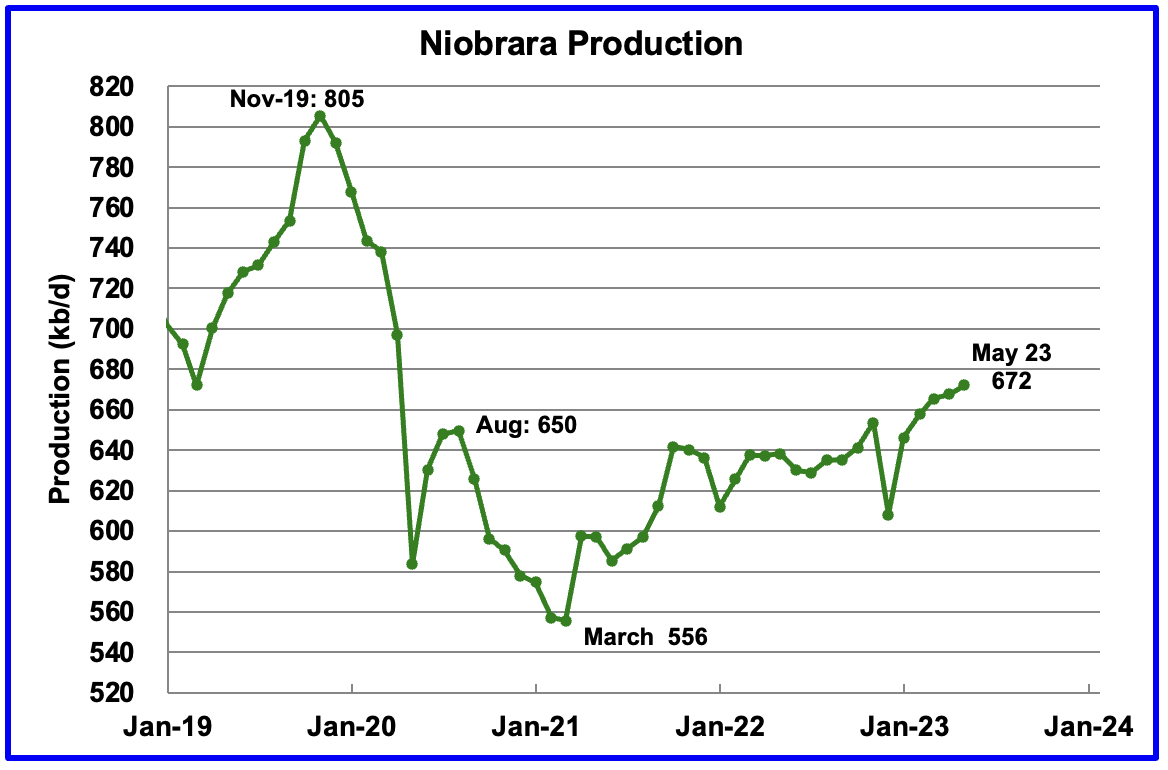
Output in the Niobrara continues to increase slowly. May’s output increased by 4 kb/d and set a post pandemic high of 672 kb/d.
Production increased due to the addition of more rigs into the basin. The Niobrara had 16 ± 1 rigs operating from January 2023 to April 2023.
DUCs and Drilled Wells
There has been a significant revision to the DUC data in the April report. First the total number of DUCs over the last five months has been reduced by approximately 200. Secondly the trend has changed from increasing back to decreasing.
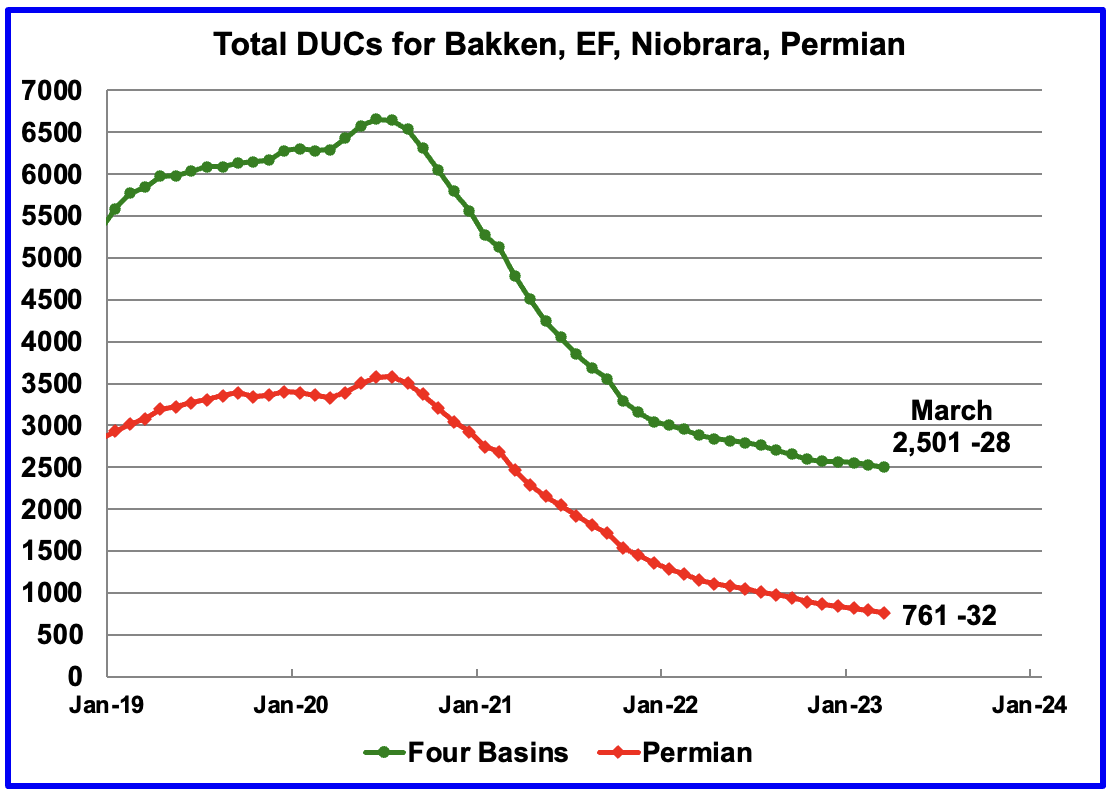
The number of DUCs available for completion in the Permian and the four major DPR oil basins has fallen every month since July 2020 and continued to decrease in March. March DUCs decreased by 28. The biggest decrease came from the Permian where DUCs decreased by 32 while Eagle Ford DUCs dropped by 10 and the Niobrara added 15, for a net of 27. The Bakken DUCs decreased by 1.
The Permian basinalso had the same revisions as the four basins. Permian DUCs were revised down by over 300 and the trend reverted to decreasing. May Permian DUCs decreased by 32 to 761 because 432 wells were drilled and 464 were completed.
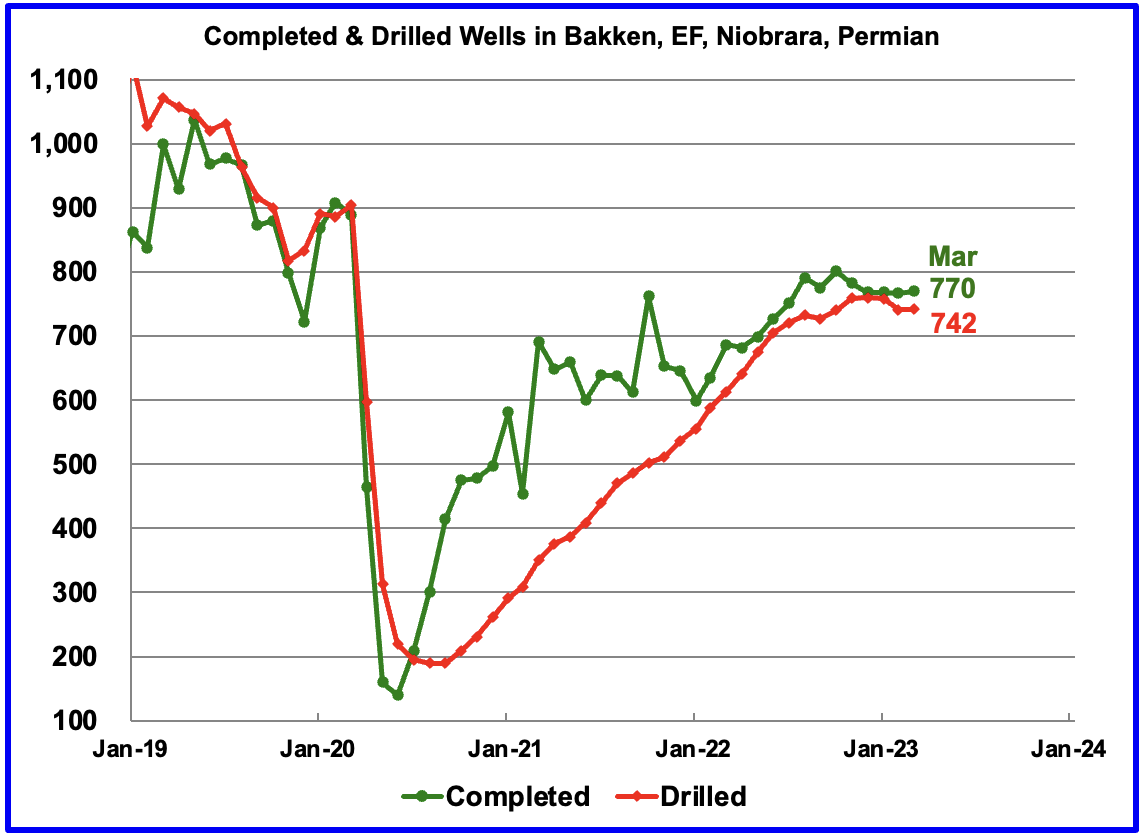
In these 4 basins, 742 wells were drilled while 770 were completed for a net decrease of 28 DUCs in March.
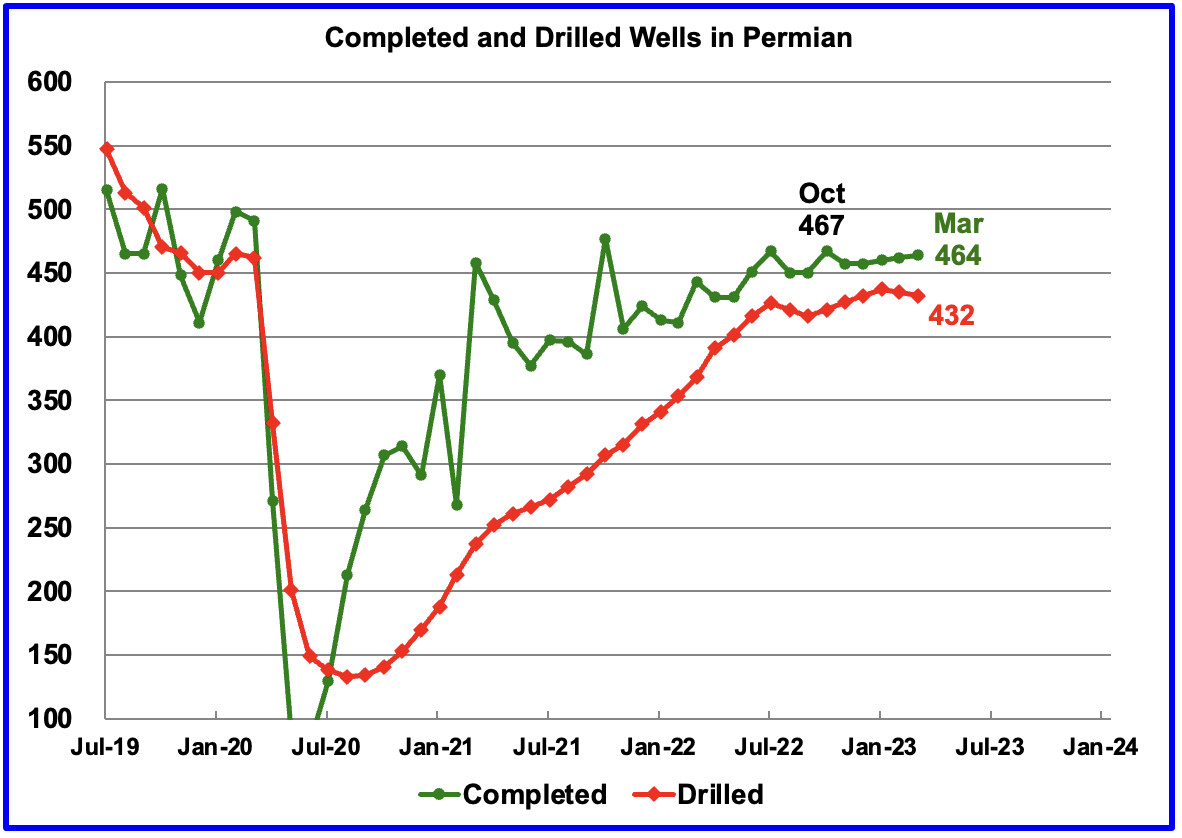
In the Permian, the monthly completion rate has been showing signs of stabilizing since the October high of 467. This is consistent with the frac spread chart shown above where there has been slow growth in frac spreads since February 2022. The number of wells drilled in the Permian is now showing signs of plateauing at the 435 level.
In March 464 wells were completed, an increase of 2 over February. During March, 432 new wells were drilled, a decrease 3 from February. The gap between completed and drilled wells in the Permian has now opened up to 32.
The Permian, as of March has 761 DUCs and the current completion rate is 464 wells/mth. This means that the current cycle time between drilling and completions is 1.64 months or 50 days.
176 responses to “Small Drop in US February Oil Production”
The Peak Permian graph with all of the future projections is interesting. I suspect it’s not too different from Dennis’s? Is Permian production going to rise from the current 5+ to 7-8 mmbopd in the 2026-2028 timeframe?
Bob,
I agree, that chart was interesting. My best guess is a Permian peak at about 6600 kb/d in late 2028, this scenario assumes a maximum completion rate of 500 wells per month, recent EIA estimates have the Permian completion rate at about 464 wells completed in March 2023. My scenario assumed 429 wells completed from August 2022 to July 2023 with the completion rate increasing at about 4 wells per month on average from July 2023 to Jan 2025 when a completion rate of 500 wells per month is reached (464 wells/month is reached in April 2024 for the scenario). Below the data points called out are for December of 2021 to 2029 in kb/d. Note that it is assumed that completion rate starts to fall after July 2027 and reaches 472 wells per month in August 2028 (at peak monthly output for the scenario). By Jan 2034 (end of the part of the scenario shown), the completion rate has fallen to 150 wells per month and reaches zero in April 2035. Also note the URR for the scenario is 38.5 Gb with cumulative production from Jan 2010 to March 2023 at 10 Gb. At peak in mid 2028 cumulative output is about 22 Gb for the scenario.
Obviously if the completion rate were higher or lower than I have assumed output would be higher or lower. I also have not accounted for future decreases in new well EUR, though higher completion rates could compensate for falling productivity as long as prices are high enough to ensure profitability.
An alternative Permian scenario with completion rate reaching 500 wells per month by 2024 and growing slowly to 550 wells per month by late 2026 and then gradually decreasing from late 2027 to Nov 2035 by one well per month (550, 549,…,453,452.) In Jan 2036 the completion rate starts to fall more rapidly by 10 wells per month and reaches zero in August 2039. Peak is about 7350 kb/d in late 2030, URR is 54 Gb. This scenario is similar to the lower scenario in the chart in Ovi’s post.
I seriously doubt there are that many viable locations left to drill.
Lightsout,
About 41699 horizontal wells have been drilled in the Permian basin as of March 2023. You may be correct that there are not that many viable locations left to drill, it depends in part on optimal spacing as well as the price of oil and natural gas. The scenario below assumes a faster decrease in the completion rate than the earlier scenario. URR is reduced to 44 Gb (this is close the the USGS low TRR estimate, 95% probability the TRR is higher) and 22k fewer wells are completed than the 54 GB scenario above. This may also be incorrect.
See
https://www.mdpi.com/1996-1073/15/1/43
In that paper they project 155k well locations after 2021, at the end of 2021 for my scenario about 35k wells had been drilled, so this paper implies that there are about 190k potential well locations. The URR for the scenario in that paper was about 54 Gb.
A final scenario below that assumes 464 wells are completed at most after March 2023 (same as EIA estimate for March 2023). Completion rate starts to fall in Jan 2030 by 5 wells per month up to Jan 2034, and then by 10 wells per month.
Is that in line with refinery capacity (~18 MBpD currently and nearly 100% utilized)?
As others have mentioned, it’s a shame we are trying to burn thru the Permian so quickly, would be better if we kept it for reserves and imported more oil…specially at these relatively low prices (today’s prices are equivalent to $50 per barrel in 2009 pricing)…
Thanks both Ovi and Dennis for taking time out of your day to post these great updates, much appreciated!
Kengeo,
Much of the tight oil would be exported, US refineries can process about 4 kbpd of of tight oil the rest is exported.
I agree that exporting oil from the US is a bad idea, many do not agree which is why the crude export ban ended in 2015.
Exporting oil from America is an excellent idea, for several reasons:
First, America is a huge cumulative net importer of oil since 1945, so net exports would help pay off our vast foreign debt, whether measured in dollar or gallons.
Second, America waste oil more flagrantly than almost all out trading partners. So exporting oil would mean a net reduction in waste.
Third, the bast way to do it would be to tax oil at the pump to cut domestic consumption. that would send a signal to markets that demand is set to fall in America, which would push down prices. That would also discourage drillers in the Permian from drilling too fast. After all, shale oil is expensive oil, so keeping oil prices low is the best way to conserve it.
Alimbiquated,
I do not agree that exporting US resources is a good idea. I do agree that a carbon tax on all fossil fuel is an excellent idea, but in the US that is a minority position, so no action is likely. The inflation reduction act is the best we can do for now.
typo, rax should be tax in comment above.
Fixed it for you Dennis. You should learn how to do this. 🤣
For wide-ranging discussions, I’m finding that GitHub and Gist for GitHub is very nice. You can drop an image into a comment just by doing a screengrab copy&paste. Anyone that has a GitHub account can contribute with equivalent privileges. Check it out: https://gist.github.com/pukpr/
Paul,
Very cool stuff you have been working on of late. For those interested in a sample see
https://geoenergymath.com/2023/04/26/wobble-perturbation/
and
https://geoenergymath.com/2023/03/26/does-gpt-understand-geophysics/
Dennis, thanks. If you have any ideas for neural net analysis of data I could try it out. Noticed some research applied to fracking production.
https://seekingalpha.com/article/4584624-goehring-and-rozencwajg-q4-2022-natural-resource-market-commentary
Russia’s oil and gas budget revenue drops sharply in April
MOSCOW, May 4 (Reuters) – Russia’s federal budget revenues from oil and gas, the lifeblood of its economy, fell 64% in April from the year-earlier period and declined by 5.9% from March, the finance ministry said on Thursday, as a result of higher subsidies to oil refineries.
Budget income from oil and gas sales reached 647.5 billion roubles ($8.3 billion) last month, compared to 688.2 billion in March and 1.798 trillion roubles in April 2022, it said.
April, while the same payments to oil refineries under the “damping mechanism” rose to 107.2 billion roubles from 96.7 billion roubles in March.
At the same time, profit-based tax revenues from oil producers fell last month to 185.4 billion roubles, from 220.6 billion roubles in March.
The Russian finance ministry plans to halve subsidies to oil refiners from July 2023, and is aiming to cut payments from the budget under the damping mechanism by 30 billion roubles.
Any projection on crude oil production growth in the Permian is pure speculation at this point. This has to do with the fact that the GOR in new wells is higher than in the past, but also the older wells–say from 2016 to 2020–are now at higher GOR too. Each day, another dozen or so wells drop below the bubble point, with gas coming out of the rock and longer-chain hydrocarbons remaining trapped in the rock. Basin-wide, that amounts to massive amounts of gas in the future.
And it’s not the greatest gas in the world. The Western Haynesville/Eastern Woodbine NG is “certified” of low methane density, whereas the Permian is medium to high. This is very important going forward–in terms of ESG concerns. In fact, there is likely going to be a special trade for certified NG.
With increasing NG production in the Permian, it is entirely possible that greater than expected natural gas production might outstrip takeaway. And when a high-production field “gasses out,” it is no easy thing to convert crude oil pipelines to NG pipelines, because crude pipes are generally of lower diameter and not designed for higher tangential wall stresses.
This was not a concern when there were seemingly no guidelines for flaring or venting. But now, that’s mostly in the past, thank God. Personally, I suspect this fear was one of the reasons Scott Sheffield didn’t want Pioneer to “grow” production. If you look at comparison studies (Mike Shellman has a nice chart on his website), Pioneer’s gas production has gone ballistic. Enough that they might overwhelm their pipeline reservation.
Parenthetically, this issue is going to limit every shale oil basin. Texas is lucky; they are “on the water,” and can build pipelines without violating interstate pipeline regulations. North Dakota, not so much. They have no significant takeaway, and NG production has kept the rig count down fully as much as a scarcity of drilling sites.
Gerry,
As gas production increases, more pipelines will be built. I agree all scenarios of the future are guesses. There are no future facts.
I would note that my scenario, which is about 6 months old has been repeatedly called too optimistic, but current reported output is more than the model by about 200 kbpd.
Twilight in the sunset. The beginning of the end of Permian Dominance.
Gerry Maddoux,
I have been looking at Pioneer’s Natgas production and the PROOF is in the pudding.
By looking only at Pioneer’s 2021 and 2022 Oil & Gas Production… SEPARATELY:
When we compare Pioneer’s Permian Q1 2022 Oil to Natgas production to Feb 2023, oil has declined 65% while Natgas is up 1%.
This is a RED FLAG because when we compare Pioneer Q1 2021 to Feb 2022 production, Natgas actually declined 27% over the same period.
Thus, completing (100) 3-mile laterals will only make this situation worse in 2023.
steve
Not necessarily. The 100 new 3-mile laterals may target a separate, independent shale zone that is relatively underdeveloped and thus not exhibiting increasing GOR. Overall GOR may actually stabilize or decrease depending on the pace of development of a low GOR reservoir.
How many horizontal shale wells in the Permian Basin completed since 2006 produced 25 BOPD (not BOEPD) or less in the most recently reported month? Same with Bakken?
Also, if the above can be answered, what percentage are those wells of the total drilled and completed?
Shallow Sand,
Info available at Novilabs.
About 14k of 42k Permian wells at 25 bopd or less as of Jan 2023 based on Novilabs data. Roughly 33%. This number includes inactive and plugged wells from Jan 2007 to Jan 2023 only horizontal wells are included.
For North Dakota Bakken, 53% of 17775 horizontal oil wells completed since 2001produced less than 25 bopd as of December 2022 (data from Novi labs). Of these 13.34% were either plugged or inactive wells (zero output in Jan 2023).
Shallow sand,
The last report from shaleprofile for all of the US (that is available for free) was in April 2022 and had data through December 2021. For December 2021 at that time (data has likely been revised since then, but I do not have access) for all US horizontal tight oil wells covered by shaleprofile.com, 68.9% of completed wells had output of less than 25 bopd, this includes 37.3% of wells that had zero output. Of this 37.3% of wells with zero output about 15.7% were either plugged or inactive. About 5.5% of all completed wells from 2001 to 2021 had been plugged by December 2021. The total horizontal wells completed (in the areas covered by shaleprofile in April 2022) was 153,659 (includes both tight oil and shale gas wells) as of December 2021.
https://novilabs.com/blog/us-update-through-december-2021/
Is Russia Really Cutting Oil Production? Please read the last paragraph, bolded by me. That is exactly what I think is happening.
Earlier this year, Russia said it would reduce its oil production rate by half a million barrels daily in response to Western sanctions and as part of OPEC+ efforts to prop up international oil prices.
Yet export data is creating confusion: based on that data, Russia is producing as much oil as before. At the same time, the number of idled wells in the country has gone up, Bloomberg reported this week. And Russia has stopped reporting official production figures. The situation has all the markings of a good mystery.
A mystery is the one thing this isn’t. According to Bloomberg, the number of idled oil wells in Russia rose to 18.1% of the total in March. This, according to the report, suggests that Russian producers are indeed cutting production.
What seems to be tripping some observers is the fact that while production is declining—at least in terms of the number of wells—exports remain strong. In fact, they even returned to levels before the invasion of Ukraine.
It appears that there is no space for suggesting that Russia can produce less but export more, perhaps because there is uncertainty about its local demand and storage capacity to do so. Whether this is the case or not remains unclear because of the limited availability of production information.
Still, Bloomberg notes, Russian refineries—and there are a lot of these—are currently in maintenance season, which means lower domestic demand for crude, which could provide a possible explanation for the seemingly conflicting information from export data and official idled wells figures.
In its report, Bloomberg also notes that the portion of oil wells idled carries limited information because it does not tell us anything about changes in the productivity of the ones that remain pumping.
But then, there was an argument being made in Western news outlets that Russia would be forced to curtail production because it cannot handle the technology of oil production without Western experts on call. Given the history of oil production in Russia, not everyone with knowledge in the energy industry field supported this argument, but it made the rounds repeatedly.
Some have suggested Russia is hiding the worst: the author of this GIS Reports article argues that Russia is suffering more damage to its oil industry than officially disclosed and is simply not talking about it. As evidence, Carole Nakhle, CEO of energy advisory Crystol Energy, points to the sharp drop in oil revenues during the first quarter: it declined by as much as 40% from last year.
Bear in mind a lot of oil is sold at a decent discount to India, where it is refined and sold to the EU (mainly).
Also, as Russia now owns almost all the oil companies at 51% or 50% plus 1 share, it has upped the ‘social contribution’ required to be paid to public development projects. This might perhaps affect ‘nett’ revenue, depending how it is accounted.
Loz , from where I belong we have a saying ” income is 50 cents and expenditure is a dollar you are in trouble and vice versa then nothing to worry ” . Russia does not have this problem . Russians live within their means . The Russian budget calculates that the minimum receipt for their oil will be $ 40 . They get about $ 60 so no worry . Does this look like an economy or people under stress ?
https://www.youtube.com/watch?v=94KPrOpXzto
https://www.youtube.com/watch?v=YseIsUAYLic
Loz, the article was not about what Russia can sell. It is known that Russia can find buyers for about all the oil they can produce. The article was about the fact that Russia is trying to hide the destruction to their production ability.
Some have suggested Russia is hiding the worst: the author of this GIS Reports article argues that Russia is suffering more damage to its oil industry than officially disclosed and is simply not talking about it.
Let’s see, Russia operated a technically proficient and highly respected oil industry totally independent of the West for 70 years in the Soviet era, but now we are supposed to believe they have suddenly become incapable of doing so without western technology? Sorry, that doesn’t even pass the smell test. I don’t understand why so many people are determined to believe that Russia is a technologically backward basket case that can’t function without the West. As the late but not missed John McCain described Russia, “Spain with a gas station.” The evidence does not support that stereotype and people need to stop deluding themselves. Perhaps this is all just war propaganda from the same people who brought us previous misadventures in Kosovo, Afghanistan, Iraq, Syria, and Libya. The media have certainly been “all in” on the war messaging just as they were in those other interventions until they were deemed “mission accomplished.”
https://www.abc.net.au/news/2023-05-03/nt-government-fracking-decision-beetaloo-basin-gas/102295762
Fracking in Australia’s Beetaloo Basin gets the go ahead!
Gosh Golly, where is Australia going to get workers and technology to Frac (USA! USA! USA!)
Look for six figure salaries, free lodging and citizenship/visa offers for those with the appropriate skills….I would reckon.
“The Beetaloo Basin is an enormous shale gas reserve about 500 kilimetres sout-east of Darwin. (Supplied: Empire Energy)”
https://www.abc.net.au/news/2022-05-06/beetaloo-basin-potential-katherine-oil-gas-conference-fracking/101043884
Beetaloo Basin’s ‘absolutely immense’ potential spruiked at oil and gas conference, but big fracking tests loom.
https://www.youtube.com/watch?v=PsY9ZWjKxQc
This is quite a technical review of the Beetaloo (well if you are a couch potato interested in energy like me).
They are trying to fill the gap for Europe natural gas insecurity.
Before I get flambasted…I realize that this is an Energy CEO pumping his company on Australian Media.
However, do any of the oil pros have any thoughts?
Calling Matt Mushalik . He is the real pro on Australian oil and gas matters .
Andre – thank you for posting on this. Anyone who would quickly dismiss fracking in another country (especially a somewhat developed one) after the past 15 years in the US and how it blew apart old-school pre-2008 peak oil estimates is really playing fast and loose with their credibility.
Twocats,
In addition to the US, Canada, Argentina, China, and Russia (Gazprom Neft’s Bazhenov output) currently producing ‘shale’ oil and gas, several other countries are tentatively engaging in unconventional hydrocarbon development, India being just one.
A UK company – IGas – had somewhat flamboyantly claimed that it could produce desperately needed ‘shale’ gas in under 2 years if the British government lifted restrictions.
(Several decades of gaseous hydrocarbons lie within the Bowland and Weald Basins alone).
The decade-old (2013) EIA report declared 137 formations in 41 countries contained Technically Recoverable Resources of oil and gas hydrocarbons.
While that 76 page report may be TMI, the 20 page Executive Summary is a fascinating read for anyone interested in this stuff, especially newbies).
Political/economic/social constraints are the biggest impediments to an expanded embrace of a global ‘shale’ program.
Andre,
The Beetaloo has enormous potential if the topside obstacles – specifically the political – do not curtail development.
The productive area is large, multi layered, and the initial flow rates project to be about 15 Million cubic feet per day for a 10,000 foot lateral. (About a dozen horizontals have been drilled/frac’d at ~2,000/4,500 foot lengths.) This is very promising so early on in the programs.
A Super Flex rig has arrived in country and should lower drilling time/costs dramatically. (Antero just drilled a world record 12,340 foot lateral feet in 24 hours).
While some American shale veterans are involved – particularly in the completion phase – Australia actually has quite a robust oil/gas industry. In fact, this site had a great Aussie commentator- Toolpush – who once supervised operations at Sakhalin … absolutely global top tier expertise.
Should the Beetaloo operators continue, they will benefit from the ~25 year history of American and Canadian unconventional hydrocarbon production – recycling water being but one prominent aspect.
Right after the announcement that Australia is training on US Nuclear submarines and buying Virginia Class Nuke Subs….hmmmmmm…..
This is gas not oil right?
What is the oil potential?
I am guessing this is not good news if you are a natural gas producer? Its going to flood the market
I am obviously not an oil pro.
Andre,
There was a highly detailed, yet concise, article on the Beetaloo posted on the Seeking Alpha site a few weeks back. (Laurentian Research author?).
The basin is huge, stacked, ~6,000′ to 10,000′ depth and largely natgas.
The remoteness and – currently – lack of pipelines are some of the challenges.
That said, Australia – particularly in the populated southeast, is actully very short of natgas.
Much more to the Beetaloo/Australia story, but a global abundance of natgas is a given, even as wildly disparate circumstances (largely political, including infrastructure availability) continue to manifest on the global stage.
Increasing pressure on Russia’s oil industry
he West’s attempts to curtail the Kremlin’s ability to finance its war on Ukraine are starting to bear fruit. Russia’s oil and gas revenues are dropping, along with its overall economy, while its budget deficits are growing. The early results of 2023 show that a combination of price caps, import bans and lower market prices is working even as Russia’s energy exports flow.
The EU embargo on refined products of Russian origin, with associated price caps, came into force on February 5, 2023. The measures are aligned with those adopted by the Group of Seven (G7) nations and Australia. They follow sanctions on crude oil, which went into effect on December 5, 2022. Together they ban the sale within the EU of seaborne Russian crude oil and oil products, except for pipeline oil, and a temporary exemption given to Hungary, Bulgaria and Croatia because of their limited alternatives.
Any third party willing to buy such products using enabling services provided by an EU entity – such as insurance and shipping – can only do so if the price they pay for the Russian products is at or below the price cap imposed by the EU. The price cap is set at $60 per barrel for crude oil and $45 per barrel for discounted petroleum products (such as fuel oil and naphtha) and $100 per barrel for premium petroleum products (such as diesel, kerosene and gasoline).
Recently, the market has been doing a better job than the price cap, with Russian crude oil selling below the $60 per barrel cap, at least before the 1.1 million barrels per day production cut that was announced on April 2 by OPEC+ nations, including Saudi Arabia and Russia.
The upshot is that Russia’s revenues from oil and gas exports tumbled by nearly 40 percent in January 2023 ($18.5 billion) compared to January 2022 ($30 billion). The revenue decline will be even steeper in the coming months, the International Energy Agency (IEA) has predicted.
Targeting Russian energy makes sense because it accounts for roughly 18 percent of Russia’s gross domestic product (GDP) and at least a third of its state budget revenues. Yet despite the loss of revenue, the damage to the overall economy remains surprisingly slight, at least according to official numbers, which some question.
Russia’s GDP shrank to an estimated $1.5 trillion, or 2.1 percent, in 2022. The 2023 forecast ranges from no growth (+0.3 percent), according to International Monetary Fund projections, to a 5.6 percent decline, based on the estimate from the Organisation for Economic Co-operation and Development. But some critics say that the Russian government’s concealment of official data is masking deeper problems.
The big problem with stories like this is that we have been supplied a never ending river of them since Feb 2022, and most of them have been lies, distortions, and selective reporting. We can’t trust any mainstream media source for the duration of the conflict. I have taken to relying exclusively on a number of independent investigative sources, some of them independent journalists and some persons with expertise in relevant fields, who have been getting the factual information largely correct since the commencement of hostilities. “Mainstream” media sources might as well be NATO employees, or worse, Zelensky’s employees! (You know, the new Churchill who always dresses like he just flew in from the front in Bakhmut. That is bound to be a CIA/State Dept. idea after conferring with some Hollywood or Madison Avenue consultants. No one does Narrative Control like America, at that we have no peer!) This has been the most shameless, one sided narrative spinning by the media that I have ever seen.
D Coyne: “As gas production increases, more pipelines will be built. I agree all scenarios of the future are guesses. There are no future facts.”
Very true, and I didn’t mean my comment as an attack on your projections. There is a certain nonchalance about the capacity of the Permian to go on for several more years, growing all the while–and it could. But Pioneer is probably the canary in the coal mine. If Pioneer’s oil production is falling, and its gas production rising, it’s time to look behind to see what’s coming.
If the price of natural gas rebounds strongly, then everything will probably be okay for awhile. But if the price for NG bifurcates–with a strong preference for third-party “certified” gas–then the higher quality product from the Haynesville-Woodbine might well bring a premium price and Permian gas a low market price. I guess I didn’t make that clear: there is a difference in the “methane density” in natural gas, and that difference is quickly being differentiated and commoditized. Where is Coffeeguyzz when you need him?–he’d know about this.
Additionally, when the GOR goes up for an entire basin, it doesn’t mean that the basin is just “gassing out.” It might equally mean that gas production is static and oil production is waning. In the Permian, unfortunately, both are happening. Not at warp speed, because only because about 500 new wells are coming on line each month. Still, there are thousands of wells on the same trajectory, and it’s going to be hard to outrun them.
I don’t think that trajectory is what we’ve been told. I’ve participated in enough of them to know that when the pressure falls, the longer-chain hydrocarbons disappear from the mix. That’s because the pressure isn’t capable of flowing those complex molecules out. That’s roughly at the bubble point.
I never would have thought to construct a graph with the entire basin on a bubble point, but Mr. Shellman did, and I’m telling you, when a well hits the bubble point, church is very close to being out. As a basin, that bubble point was some ways back.
Mr. Maddoux,
As always, great to read your comments/contributions.
Regarding Permian natgas takeaway … within 18 months, there should be an additional 4 Billion plus cubic feet capacity by way of one newbuild and 3 expansions.
In addition, the Puerto Libertad LNG plant seems to be a go.
That should consume over 1 1/2 Billion cubic feet more.
Amazing just how prodigious is the Permian.
Re ‘certified’ natgas … yeah, it is comical at how several players are engaging in the chest thumping, touting that their gas is just so much more pristine than the other guys’.
Like many other marketing approaches (think ‘organic’ foods), various ‘certifying’ companies have sprung up with wildly varying criteria on just what ‘good/’clean’ natgas actually is. The European LNG market seems especially sensitive to not wanting to be consuming that ebil natty.
Regarding bubble point, I am still confident that effective field repressurization will take hold.
Indeed, every nearby frac must be handled so as to not cause blowouts in nearby producers (like Oasis experienced in the Bakken a few years back).
Bruce Oksol has – for years – routinely been reporting increased production from older wells subsequent to newer, nearby wells being fractured. He has called this the ‘halo’ effect.
Combined with purposeful solvent/dilutent, controlled injected water and natgas might just provide the increased formation pressure by which the liquids – especially the ‘big’ molecules – may flow to the surface.
We shall see.
Today’s Rig and Frac Report.
Something is changing. Maybe $70 WTI just is not profitable or are there fewer profitable wells?
Rig count down 6. Permian rigs down 4
I know that lending standards are tightening in the wake of the developing banking crises. I would imagine some of these companies are borrowing at high-yield rates. High yield bonds fell about 16% in value last year. I’m assuming most of those yield rates would not come even CLOSE to making up the difference. So why would anyone be piling into high yield bonds? Could it be a funding issue? I’m honestly asking, I don’t actually know the answer.
Another, I think less likely, reason could be that these oil companies are actually seeing the slowdown in demand and are adjusting accordingly. I say unlikely because I was working in the housing industry in 2006 & 2007 in California and had family working housing in Ohio and NO ONE was discussing the housing bubble as something that could ever actually end.
But I think Gerry Maddoux talking about Natural Gas prices are probably the real answer. If Natural Gas is a large fraction of the end product, drilling just isn’t worth it.
Twocats
Yes, funding costs are rising.
Calgary, Alberta–(Newsfile Corp. – April 27, 2023) – Baytex Energy Corp. (TSX: BTE) (NYSE: BTE) (“Baytex”) announced today the closing of its private offering (the “offering”) of US$800 million aggregate principal amount of senior unsecured notes due 2030 (the “Notes”). The Notes bear interest at a rate of 8.5% per annum and mature on April 30, 2030. The Notes were priced at 98.709% of par to yield 8.75% per annum.
The gross proceeds of the offering have been deposited into escrow pending satisfaction of certain escrow release conditions, including the consummation of the previously announced merger (the “Merger”) with Ranger Oil Corporation (“Ranger”). Upon satisfaction of the escrow release conditions, Baytex intends to use the net proceeds from the offering, together with borrowings under its credit facilities, to fund the cash portion of the consideration for the Merger, to repay certain outstanding indebtedness of Ranger and Baytex and to pay fees and expenses in connection with the Merger. The Merger is expected to close in the second quarter of 2023, subject to the satisfaction of customary closing conditions. Closing of the Merger is not conditioned upon completion of the offering.
if Baytex wants to start reducing its debt in a few years and rates fall, they will have to buy them back above par.
An analyst report I read made the following comments on their EF buy; “Thereafter, activity could increasingly shift south (into the Eagle Ford) given: 1) ample runway (741 net drilling locations/12-15 years sustaining development) and 2) competitive asset economics (second only to Peavine and non-operated Eagle Ford in Karnes County).
Peavine is a Clearwater play in Alberta. The analyst stated the following: “The 12 wells produced at an average 30-day IP rate of 661bbl/d, and BTE now holds 19/20 top wells in the play.”
Fracs DOWN 12
I don’t have to tell anyone who does this for a living that there is a major difference between $90 oil and $10 gas as compared to $70 oil and $2 gas.
The sea change was in the price of gas, not oil.
As these new wells came in with a higher GOR, the high price of NG covered a multitude of sins–like a falling per well oil production.
But now that NG is selling for $1.50 at the wellhead, many of these new wells won’t break even.
That’s to be compared to NG in the Bakken, which is bringing exactly zero.
The Haynesville needs $2 gas to break even. The Marcellus needs $3 gas.
Like the point I tried to make earlier, it’s the gas that is the Achilles heel in the Permian.
PIONEER NATURAL RESOURCES COMPANY- FORM 10-Q
Oil and Gas Industry Considerations
Demand for oil throughout the world remains volatile since improving from the COVID-19 pandemic in mid-2020. Worldwide oil inventories have consistently been lower due to limited capital investments directed towards developing incremental oil supplies over the past few years. Sanctions, import bans and price caps on Russian crude oil and petroleum products have been implemented by various countries in response to the war in Ukraine, further impacting global oil supply. In addition, the lingering impacts from the pandemic, combined with the Russia/Ukraine conflict, have resulted in global supply chain disruptions, which have led to significant cost inflation and the potential for a global recession. This uncertainty led OPEC to reduce its oil demand outlook, which led to multiple cuts to its production quotas. As a result of the current global supply and demand uncertainties, average NYMEX oil and NYMEX gas prices for the three months ended March 31, 2023 were $76.21 per Bbl and $3.44 per Mcf, respectively, as compared to $94.29 per Bbl and $4.96 per Mcf, respectively, for the same period in 2022.
Global oil price levels and inflationary pressures will ultimately depend on various factors that are beyond the Company’s control, such as (i) the ability of OPEC and other oil producing nations to manage the global oil supply, (ii) the impact of sanctions and import bans on production from Russia, (iii) the timing and supply impact of any Iranian sanction relief on their ability to export oil, (iv) the global supply chain constraints associated with manufacturing and distribution delays, (v) oilfield service demand and cost inflation, (vi) political stability of oil consuming countries and (vii) increasing expectations that the world may be heading into a global recession. The Company continues to assess and monitor the impact of these factors and consequences on the Company and its operations.
Financial and Operating Performance
The Company’s financial and operating performance for the three months ended March 31, 2023 included the following highlights:
•Net income attributable to common stockholders for the three months ended March 31, 2023 was $1.2 billion ($5.00 per diluted share), as compared to net income of $2.0 billion ($7.85 per diluted share) for the same period in 2022. The primary components of the decrease in earnings attributable to common stockholders include:
•a $764 million decrease in oil and gas revenues, primarily due to a 25 percent decrease in average realized commodity prices per BOE in 2023 due to the aforementioned instability in worldwide oil, NGL and gas demand, partially offset by a seven percent increase in daily sales volumes due to the Company’s successful Spraberry/Wolfcamp horizontal drilling program;
•a $163 million decrease in net interest and other income primarily due to a decrease in the fair value of the Company’s investment in affiliate; and
•a $119 million decrease in net sales of purchased commodities due to a decline in margins on the Company’s downstream Gulf Coast refinery and export oil sales.
partially offset by:
•a $217 million decrease in income taxes, primarily due to the decrease in earnings in 2023 compared to 2022; and
•a $91 million decrease in derivative losses, primarily due to a reduction in the Company’s commodity derivative positions.
•During the three months ended March 31, 2023, average daily sales volumes increased on a BOE basis by seven percent to 680,440 BOEPD, as compared to 637,756 BOEPD during the same period in 2022.
•Average oil and NGL prices per Bbl and average gas prices per Mcf decreased to $75.15, $27.30 and $3.79, respectively, during the three months ended March 31, 2023, as compared to $94.60, $41.37 and $4.81, respectively, for the same period in 2022.
•Net cash provided by operating activities decreased during the three months ended March 31, 2023 to $2.3 billion, as compared to $2.6 billion for the same period in 2022. The decrease in net cash provided by operating activities during the three months ended March 31, 2023, as compared to the same period in 2022, is primarily due to (i) the aforementioned decrease in oil and gas revenues and (ii) an increase in the current income tax provision, partially offset by a decrease in cash used in derivative activities.
•During the three months ended March 31, 2023, the Company declared a base and variable dividend of $1.10 per share and $4.48 per share, respectively, and paid dividends of $1.3 billion, as compared to a declared base and variable dividend of $0.78 per share and $3.00 per share, respectively, and dividend payments of $1.1 billion during the same period in 2022.
•During the three months ended March 31, 2023, the Company repurchased 2.4 million shares for $500 million under the Company’s stock repurchase program, as compared to repurchases of 1.1 million shares for $250 million during the same period in 2022.
•As of March 31, 2023 and December 31, 2022, the Company’s net debt to book capitalization was 18 percent and 15 percent, respectively.
I haven’t been following this for awhile, but did skim PXD’s earnings release. LOE nearing $12 per BOE and DD&A also nearing $12.
680k BOEPD, with 361k being oil.
I suspect that DD&A more than likely will wind up being $20-25 per BOE, based on the graphs I have recently seen here comparing projections against actual well performance.
When gas is selling for $6-12 per BOE, $32-37 per BOE to drill and produce it doesn’t compute. It really drags down the oil profitability.
Anyone have a chart on PXD’s oil, gas and NGL production over time? I assume it shows oil flattening, with gas and NGL’s increasing.
And as I asked above, wonder how many and what percentage of PXD’s wells produce under 25 BOPD (not BOEPD).
SS – Correct, I think. The increase in 2020 was the purchase of Parsley Engineering.
Shallow sand,
Info at https://novilabs.com/blog/permian-update-through-january-2023-1/
You can select Pioneer only for Permian and show output by production level see
https://public.tableau.com/shared/467K85NP4?:toolbar=n&:display_count=n&:origin=viz_share_link&:embed=y
Of 3624 horizontal wells completed as of Jan 2023, 238 wells were producing less than 10 bopd and 439 wells were between 10 and 25 bopd, so a total of 677 wells of 3624 total at 25 bopd or less or 18.7%. Total crude output was 486 kbopd in Jan 2023, natural gas output was 1697 BCF/d in Jan 2023 so the overall GOR was 3.49 MCF/bo based on preliminary data for Jan 2023. If we go back to April 2022 (where the data is likely more complete) the GOR for April 2022 was about 3.26 MCF/bo. In Jan 2022 the GOR was 2.97 MCF/bo and in April 2021 the GOR was 2.67. So GOR seems to be rising fairly steeply for Pioneer.
When we compare to all producers in the Midland subbasin of the Permian the GOR was 3.17 in April 2021 and 3.28 in April 2022, so less of a GOR increase in the rest of the producers over the April 2021 to April 2022 period compared to Pioneer.
I absolutely LOVE this line:
•a $91 million decrease in derivative losses, primarily due to a reduction in the Company’s commodity derivative positions.
jeez, I guess if you’re pulling in 1.2 billion, what’s 100 million amongst friends.
John at Mike S website has an excellent post on PXD . The hustle and the shuffle . Smell the coffee .
https://www.oilystuffblog.com/forumstuff/forum-stuff/the-crude-chronicles-and-the-history-of-pioneer?origin=notification
Oil and gas producers use derivative instruments as a form of insurance to lock in prices for their future output.
“I absolutely LOVE this line”
Speaking of LOVE sharing friends. Pioneer will be sharing those 91 million love buddies thanks to and with Joe Biden in taxes. If the federal government wants to buy 200 million barrels to fill the SPR at around $65 to $70. Who needs to buy crude oil options to protect the down side ? Right HHH, you know. Just in case oil goes to $25 in March (of what 2040).
Yield curves are indicating that FED will be cutting interest rates aggressively somewhere around July or August of this year.
How bad do things have to get for FED to do a complete 180 in other direction?
$25 might be too high. Bank reserves from the FED are no substitute for bank deposits at the small and mid size regional banks. There is no mechanism that will bailout all these banks. So regardless of what FED does these banks will have to fire sale assets to meet customer withdrawals.
We aren’t heading into a global recession. We are heading into a global depression.
BlackRock and Blackstone aren’t banks but their exposure to commercial real estate is huge. What’s the FED going to do? Bail them out? They aren’t banks. Even if they were bank reserves don’t solve the problem.
Charles Schwab, many might think of them as an investment firm. But they are also like the 8th or 9th largest bank in the US. They are also in trouble.
We are in a systemic banking crisis that the FED and government won’t even acknowledge is happening.
When collateral gets repriced things break.
Oil price just happens to be one of the many things that are going to break.
FDIC insurance can’t cover all these bank deposits without a government bailout. Things are really going to get messy.
“FED will be cutting interest rates aggressively somewhere around July or August of this year”
I will not argue that the FED is not out in front of it’s skis on rates. But you and your choice to continue to pick future dates only discounts your voice. You don’t seem to learn. Most people don’t stick their finger in the light socket twice. You like to play hero ball.
HHH , “We are in a systemic banking crisis that the FED and government won’t even acknowledge is happening. ” This is the problem . I mentioned the risk of a Synchronized System Failure as defined by David Korowitz in an earlier post .
https://peakoilbarrel.com/short-term-energy-outlook-april-2023/#comment-756593
HHH , “BlackRock and Blackstone aren’t banks but their exposure to commercial real estate is huge. What’s the FED going to do? Bail them out? They aren’t banks. Even if they were bank reserves don’t solve the problem. ”
Well the FED could give them a banking license and convert them into commercial banks instead of investment banks . Heck they could even designate them as GSIB ( Globally System Important Banks) then we have bailouts to infinity . Problem solved . 🙂
“The fundamental cause of the trouble is that in the modern world the stupid are cocksure while the intelligent are full of doubt”
HB – 4 of the top 8 biggest bank failures in US history happened within the past two months. I thought you said you were in Finance? That is genuinely terrifying if you were.
HB, again bank reserves aren’t the problem. FED can create all the bank reserves they want. There is no shortage of bank reserves.
Bank reserves are no substitute for bank deposits. Customer withdrawals can’t be met with bank reserves. There would be no bank failures if bank reserves created by FED were actual money.
FED doesn’t have the power or tools to bailout banks. I know we are all told they have a printing press.
No money was printed over the duration of Covid. March 2020 to present day.
Government borrowed trillions not from the FED though. Government borrowing is money redistribution not money printing.Which created bank deposits in a massive amount. Which banks are required by law to back those deposits with assets. Mainly US treasuries.
Well the value of those treasuries fell as FED raised rates. Banks don’t have enough collateral to sell to service customers withdrawals.
You can put money in a money market fund and earn 4.8 % while banks are paying 0.5% on deposits.
Over 80% of commercial mortgages are on the balance sheets of these small and mid sized regional banks. They are illiquid as crap. $14 trillion in illiquid mortgages.
So bank deposits are leaving these banks to get better returns. And FED has no tools that matter.
The real credit spigot. These banks. Are going to turn the taps off. Not because the necessarily want to but because they are balance sheet constrained.
Again the yield curves have been warning us for over a year. The probability of a deflationary monetary outbreak is extremely high.
And it will spill over into real economy in the form massive job cuts in a relatively short amount of time.
Oil prices are agreeing with yield curves. That’s why oil prices are tanking.
HHH, again if you want respect- it’s a problem
Doctor, my eyes have seen the years
And the slow parade of fears without crying
Now I want to understand
I have done all that I could
To see the evil and the good without hiding
You must help me if you can
Doctor, my eyes
Tell me what is wrong
Was I unwise to leave them open for so long?
‘Cause I have wandered through this world
And as each moment has unfurled
I’ve been waiting to awaken from these dreams
People go just where they will
I never noticed them until I got this feeling
That it’s later than it seems
Doctor, my eyes
Tell me what you see
I hear their cries
Just say if it’s too late for me
Doctor, my eyes
They cannot see the sky
Is this the prize
For having learned how not to cry?
https://www.youtube.com/watch?v=qKGTaplzmV4&list=RDEMdsEJJDdz8w4itU1r_Sxp_Q&start_radio=1&rv=SqRvJLH_-vU
Lyrics are for HIckory and Mac
HHH,
Care to speculate on when the World economy goes into a Depression and how does one distinquish between a Recession and Depression?
At link below there is a discussion of Recessions and Depressions. Often a peak to trough change in real GDP of 10% or more is considered a depression. Even the severe recession in 2020 due to the pandemic only saw World real GDP fall by 3.2%.
So am I correct in thinking you expect to see World real GDP decrease by 10% or more at some point in the medium term (next 5 years)?
I think a recession is likely, but a Depression is not likely.
https://www.imf.org/external/pubs/ft/fandd/basics/recess.htm
A bear will always be right eventually as long as they consistently predict bad times ahead.
Dennis , your question to HHH on recession and depression . Who will decide ? The data or the referees ? What do you do if the referees are paid up ? No referees were needed that Vietnam , Iraq and Afghanistan were lost causes in spite of what was reported by Westmoreland . Petraeus etc and company , Data ,physics and math’s prevail . See my post on the German situation ( as goes Germany , so goes Europe) . There is no comeback in China and US is all paper shuffling GDP . Recession is already here . Just because no referee ( paid up ) said so is immaterial . OPEC keeps on cutting production to maintain a high price . Pull up your socks for the depression . KSA has a deficit they need high prices and they will cut to oblivion . Don’t wait for an official announcement .
https://english.alarabiya.net/News/saudi-arabia/2023/05/07/Saudi-Arabia-budget-slips-into-deficit-as-spending-accelerates
Just
Hole in head,
The question is what does HHH consider a Depression, it is mostly not defined very well. What is your definition? Without a definition, we don’t know. Which data do we look at, in the US the NBER looks at real GDP, employment, and consumption to assess the business cycle.
https://www.nber.org/research/business-cycle-dating
Dennis , read the link below . This is what happens when the referees go AWOL . ” Prolonged global recession ” = a depression , but no one will announce it . This revolution will not be televised . The language is the medium . Participants here are all intelligent and can arrive at the conclusions without the referees .
https://www.japantimes.co.jp/opinion/2023/05/08/commentary/world-commentary/sleepwalking-prolonged-global-recession/
The China story is over .
https://www.reuters.com/markets/asia/chinas-imports-shrink-april-exports-grow-slower-pace-2023-05-09/
The Chinese also know that globalization is over . There is no cure for denial .
https://www.sinification.com/p/yan-xuetong-warns-chinese-businesses
M2 is negative year over year for the first time since the start of the Great Depression. Private bank lending, the real source of money growth, not the Fed, has virtually dried up. Penn State’s less lagging ACY version of the CPI shows inflation down to zero and poised to go negative. So, yeah, I will not be surprised at all if the Fed starts slashing rates like mad, but they will probably need a Lehman Brothers moment to get them moving. Once prices (and employment) start falling, even zero rates will be positive in real terms.
“Oil and gas producers use derivative instruments as a form of insurance to lock in prices for their future output.”
wow HB you’re so smart – I want to be YOUR friend.
Pioneer is down 18% over 6 months. I know you like your love rough, but that’s gotta hurt. And I know its tough to type while holding all those bags, so don’t bother.
“wow HB you’re so smart – I want to be YOUR friend”
If you want to play with the Big Dogs. You need to toughen-up and grow a pair. PXD is up 120 percent over the last three years. Cherry pickers earn minimum wage.
If You Can’t Take It, You Sure Can’t Make It
https://www.youtube.com/watch?v=ziDsVm-3k9s
Think HB is on drugs lol. I’m here trying to educate. I don’t need or care for respect. But people are clearly in the dark. If you don’t want to listen to or agree with what I’m saying I’m fine with that.
Oil is going $25 if not lower. And that has major implications on the oil industry. Also has major implications on the so called energy transition.
Energy might be the economy but without monetary liquidity which central banks can’t provide. We don’t have an economy or energy.
WTI futures has been experiencing illiquidity. Price basically crashed last week all the down to $63. Not because oil markets aren’t tight on supply but because there is no liquidity.
“Think HB is on drugs”
The lyrics were not intended for yourself because I expected you wouldn’t understand. Clearly I was right again.
“Oil is going $25 if not lower” “but without monetary liquidity which central banks can’t provide”
You do realize the only real end user of oil are refineries, right ? It’s the reason WTI went negative three years ago. All you paper guys had no place to take delivery. Refineries are swimming in profits and liquidity for the last 18 months. Their currently doing buy backs, debt reduction and increasing dividends. Their capex needs are only regular maintenance turnarounds during tight times. Their a money machine.
James Taylor – Money Machine
When I was just a child (hey baby)
My life seemed oh, so simple
And the ways of the great world
Seemed strange and funny
Then when I was a young man
Babe I learned of that machine
Turns out all those bails of precious money
Money, money money, money, money
Money, money money, money, money, money
Now you can measure your manhood by it
You can get your little children to try it
You can bring your enemies to their knees
With the possible exception of the North Vietnamese
It takes a strong a hit from the money machine
Feelin’ on top, on top of the goddamn world
Strong hit, baby from the money machine
Feelin’ on top, on top of the world
Oh, General Motors and IBM
AFL-CIO and all the king’s men
When I began the game
See me singing about fire and rain
Let me just say it again
I’ve seen fives and I’ve seen tens
It was strong hit from the money machine
Sitting on top, on top of goddamn world
Strong hit baby from that money machine
Sitting on top, on top of the world
https://www.youtube.com/watch?v=DFe8flSEzBk
HHH – agreed – he thinks because he picked a stock that’s up from after the Covid collapse he’s smart. literally every small cap stock went up, some more some less. why don’t we just say that the US economy has gone up since the 1950’s. It’s unintelligible gibberish. I actually preferred Texas Two Teas and I think a lot of other posters do as well. I’m pretty sure HB is considered the “special needs” addition on the thread.
Once bubble point is reached in boundary defined, solution gas driven shale containers, like those found in the Permian, ultimately GOR goes down and associated gas is depleted, same as liquids. More takeaway, or LNG exports for associated gas will become expensive (leveraged) overbuilds left with no product to handle.
Exporting US tight oil and tight associated gas at current, and proposed levels, will make money for people who put money before country and long term energy security, but when we start drilling the flank stuff for 250K BOE EUR’w will ultimately prove to be the worse hydrocarbon policy in American history. We banned exports in 1975 for a reason; today the same reasons exist x 10.
Gerry is correct …when 50 % of ones revenue stream in a tight oil basin is related to associated gas and NGL’s, and both are down 40-50%, economics are in the toilet.
Past results have NEVER in the history of the oil and gas business been indicative of future performance.
Shallow, nationwide over 50% of tight oil wells make less than 25 BOPD; don’t know about the Permian but I’d guess over 30%. Decline rates at <50 BOPD are still accelerating. Economic limits are being reached much sooner than 10-12 BOPD because of declining gas/NGL prices, increased WOR, rising lift costs and ever increasing PA&D costs.
Gerry,
Much depends on price, if oil and natural gas prices are low, less than 70 per bo and less than 2 per MCF NG, profits will be low and few wells will be completed in Permian basin. I assume 80 per bo and 3 per MCF or higher for my scenario. This is likely incorrect, future unknown.
JUST IN – German factory orders slump 10.7% month-on-month in March — one of the largest declines in history.
. Energy is the economy .
Retail sales just had a YoY decline of -8.6%, largest decline since 1954. But all of Europe has been in a recession since January, more or less. Not sure what it has to do with “energy” but its certainly a policy mistake that ECB is tightening into a slowdown. But the ECB has done that 100% of the time since 2008, so they aren’t very good at capitalism.
Chinese demand for German machinery just isn’t there. South Korean trade with China is also way down.
4 week T-bills yields went from about 4.5 to 5.5 in one day. Money markets selling T-bills due to debt ceiling. 100 basis point move.
Which means borrowers will need more collateral to borrow via REPO. When the leveraged longs are forced to sell due to lack of collateral. Prices take the elevator down.
Oil prices take the elevator down.
Goldman’s CTA’s are also starting to take profits on their longs because nobody is coming behind them to bid prices higher.
Twocats , Germany used 20% less energy to avoid blackouts . 15 % was industrial only 5% was domestic .
https://cepr.org/voxeu/columns/energy-crisis-and-german-manufacturing-sector-structural-change-no-broad
good responses from both HHH and HiH – thank you. There is such a swirl here of peak oil and an economic downturn at the same time, with each feeding into each other or mitigating each other at various points. I believe economics (as I believe HHH does as well) will “take over” here and drive economic activity so low that supply issues won’t be a factor for the next year or so. we’ve seen this a couple of times – 2008, 2020, where oil demand plummets and gives production a reprieve and a chance to develop new sources. at some point depletion and lack of new sources will short circuit this cycle – though coffeeguyzz et al would disagree – you have to imagine the global economy will be able to develop shale resources in at least a few countries before the global economy completely unravels. so unfortunately I’m betting we get another decade of this slowly decaying pile of dog-poo.
Twocats , an excerpt from Tim Morgan’s latest post . You can read the whole at the link provided . EcoE cannot be ignored .
” The really big problem, though, isn’t the volumetric supply of energy, but its cost. The Energy Cost of Energy – that proportion of accessed energy which is consumed in the access process – has been rising relentlessly, climbing from 2% in 1980, and 6% in 2010, to over 10% now. This, of course, has largely reflected depletion effects in the supply of oil, natural gas and coal, but there are no solid reasons to believe that the less dense energy alternatives offered by renewables can do much to blunt the rise in ECoEs, let alone start pushing them back down again.
If economic output stagnates or declines, whilst ECoEs continue to rise, prosperity decreases. This isn’t necessarily going to happen rapidly, and might, in that limited sense, be manageable. But there are two huge complicating factors.
Meanwhile, the financial system can’t, for much longer, cope with the invalidation of its core predicate of infinite economic expansion. It is, in a way, surprising that it has survived for as long as it has. As of 2022, the underlying ‘real’ or material economy of products and services was already 43% smaller than the ‘financial’, representational or proxy economy of money and credit.
Third, of course, we need to have plans in place for the moment when the penny drops – the moment, that is, at which it becomes clear, beyond the possibility of further self-deception, that the financial system of assets and commitments comprises a body of monetary claims that cannot be honoured ‘for value’ by a contracting material economy. ”
https://surplusenergyeconomics.wordpress.com/2023/04/12/253-how-has-it-come-to-this/
That last paragraph of Morgans that you quote bears rereading 10 or 20 times.
‘we need to have plans in place’….hah. Good luck with that. It will be like swimming upstream in a mile wide whirlpool
The EcoE is just too high for EU . Tweet from Art Berman
Gas cost Europe more than 3x the cost in 2021
$390 bn vs $120 bn & that’s just for electric power generation.
And Russian gas was a big part of Europe’s supply in 2022–only 10% less than in 2021.
The issue of the dying wells . Hope the US taxpayer has deep pockets of course they can buy gas masks .
https://www.oilystuffblog.com/news-stuff
Hole in head,
Great piece. Thank you Mr Shellman.
https://www.bloomberg.com/features/diversified-energy-natural-gas-wells-methane-leaks-2021/
HIH/Dennis,
I simply could not avoid commenting on these hit pieces on a company that I admire greatly – Diversified Energy – and its founder/CEO, 4th generation West Virginian energy worker Rusty Hutson. (His ~75 year old father still works every day).
These calumnies COULD offer an outstanding example of just how you good folks have been bullshitted for years, continuously being fed half truths (at best) from which you all consistently draw erroneous conclusions.
“Great piece”, sez Dennis. Indeed.
Did you carefully read that 2 year old tripe, Dennis?
Shellman’s post linked by HIH is 3 years old.
The part where notorious short seller Loughrey poo poos wells throwing off 15,000 cubic feet per day.
Using his own math, at $3/mmbtu (Diversified is heavily hedged), those 18,000 ‘dogs” throw off over $24 million Per. Month.
And the remaining ~23,000 wells (at that time, now about 50,000 additional) are, by clown Loughrey’s own admission, far better.
Did that ‘great piece’ say how many are Coal Bed Methane wells?
Do you have any idea how low maintenance – and long lived – conventional gas wells can be? (Hint, some are nearing 100 years old and still producing). If you were truly interested, you could find out how incredibly low cost these wells can be.
Did you notice that ‘journalist’ Rachel Adams-Heard wrote both the Bloomberg knee capper as well as the linked FLOW article in HIH’s link extolling clown Loughrey’s ‘model’ that is a blatant attempt to destroy DEG? (Blackrock took a 5% ownership stake in Diversified just after Adams-Heard’s wildly defamatory article was published. Hmmm.)
Rather than smugly applauding slander since it reinforces your prejudiced ignorance, one could learn about DEG’s spending millions of dollars on cutting edge methane detectors – both drone operated and hand held – as they continue to implement the most effective emission controls available today.
Did you know, HIH and Dennis, that Diversified is likely now that largest ‘plugger’ of wells in the country as they have acquired several ‘little guy’ plugging operations and are way ahead of state-regulated programs on well restoration?
No, you all have – in good faith and ignorance – regurgitated just more vile, erroneous bullshit rather than spending a bit of time doing your own research which could actually show a completely different picture than what the detractors and reputaion/business destroyers would have you believe.
Sheesh.
Coffee , ” Shellman’s post linked by HIH is 3 years old. ” Are you implying that things are better in 2023 ? I can assure you they are only worse and will continue to accumulate . The issue is as relevant today as it was when the article was written . Ignore at peril .
HIH,
I am not implying anything.
I am factually stating that DEG continues to track and eliminate the miniscule emissions that they inherited from the tens of thousands of old wells via acquisitions.
If you had a sincere interest in Truth, HIH, you might have read DEG’s response to Bloomberg’s (Adams-Heard’s) hit piece wherein they promptly remedied the small leaks identified and made it clear that this ‘reporter’ had set out on an agenda to paint this company in a bad light.
In actuality, these competent, high integrity outfits should be praised.
It is the Blackrocks of the world whose cunning nefariousness continues to sway well intentioned people to the great detriment of us all.
Diversified once laid claim to 90,000 wells, it looks like they only have 40,000 wells on proration schedules, unless they have acquired more junk in the past two years. Only half of those wells produce. 150,000 cubic feet per day equates to $15.00 at one dollar per MCF, not enough to buy a cheeseburger and a class of sweet tea.
MY reference to this issue was not methane leaks but plugging liability; whether the article is three years old or thirty, plugging all of these abandoned wells is still relevant. I suggest the interested reader go to Diversified SEC filings to see how much money they have rat holed to cover this plugging. Future plugging liability all across America should be a major concern to everyone, even the staunchest of narrow minded cheerleaders, the ones that never put their money where their mouths are.
Free cash flow is not free when that revenue is burdened by debt and the interest meter never stops. If a company has NO debt and has ALL of its plugging liability covered, in the bank, including the costs of decommissioning and putting the land back to its original state, then and only then is it profitable. For insight into dirt bags that defer P,A&D please see Fieldwood Energy and Taylor Energy in the GOM.
https://flowoilwell.substack.com/p/the-machines-reveal-diversified-gas
Loughry is not a “clown,” and the Bloomberg article was not a hit piece. Thats dog dookey.
Mr. Roughneck,
Once again, your bombast offers ‘learning moments’ for any genuine Truth seeker.
1.) “… unless they acquired more junk in the past 2 years.” Seems like you are unaware that Diversified has expanded into your neck of the woods (Texas, Oklahoma and Looeezeeana) via several acquisitions and now operate ~70,000 wells and almost 18,000 miles of pipeline in 8 states.
2.) With 85% of 2023 production hedged at $3.83 floor, those ‘ dogs’ average almost 60 bucks per day, near $2,000 each month, and – as per clown Loughrey’s 18,000 well count of ‘lousy’ producers – over 30 million bucks per month. The balance of then-23,000 wells were – by Loughrey’s own parameters – better producers. I can get lottsa burgers and tea with that.
3.) “… go to Diversified’s SEC filings …”. Love to. You, um, DO know that Diversified is listed on the London Stock Exchange, amirite? (Diversified has a 23 page PDF on their site that outlines their Asset Retirement Obligation program. With 15 rigs and a newly created ‘plugging’ subsidiary, Diversified is able to plug/restore 450 wells per year).
4.) ” … revenue is burdened by debt and the interest meter never stops.” Ahh … here we see that the depths of your familiarity with Diversified extends far behind drive by articles of reputaion assassination. Even clown Loughrey admiringly acknowledges that the debt Hutson has accumulated for the company’s acquisitions is funded by Asset Based Securities! These are amortized, 9/10 year notes that are paid down somewhat similar to a home owner’s mortgage, a unique – to my knowledge – situation in the upstream hydrocarbon world.
Shame that such misguided vitriol continues to be fanned by the likes of agenda-driven pukes such as Bloomberg, Blackrock, et al, and their knowing and unknowing minions who are unable to recognize the ongoing discord that continues to be sown, the ensuing social fragmentation creating a more manipulable society through which their own ends are served.
Oh well.
Coffee:
I know very little about stripper gas wells. Looks like they are having pumpers just check them once a month? We check oil wells and injection wells daily. Our larger plants are checked twice daily, plus we now have both video and audio on all of them, plus call boxes which alert pumpers in the event of issues.
I know a little about stripper oil wells. Most cannot support the overhead required of a publicly traded company.
For example, when oil and gas prices were high 15 or so years ago, a bunch of public companies were formed to operate stripper wells in the US. This was before shale really took off.
All of those public stripper well firms went BK.
Why is this company listed on a foreign exchange being based in the US and owning all US assets?
I don’t know what these gas wells will cost to P&A. I do know what they cost here. $5-10k for a 900-1.000’ wellbore.
Hopefully this company will continue to make a go of it. I wonder if they’d been better staying private, like Merit and Citation.
Shallow,
The ongoing recovery operations for conventional gas wells are generally less daunting than what you oil guys have to face.
Essentially, plunger lifts – increasingly aided by automatic soap stick injections – allow the natgas to economically flow for years/decades.
In addition, the Coal Bed Methane wells routinely produce less water and more gas as time goes by.
Diversified claims plugging operations run from 20 to 25 thousand dollars per well. Their now in-house, dedicated teams are expected to increase efficiency going forward.
Likewise, remote/drone monitoring is increasingly being implemented and refined.
As an aside (and recognizing the ‘third rail’ nature of this comment) … next time you all drive/walk by a swamp (now reverentially labeled wetlands), some hot summer afternoon, note well the stinky smell.
That is largely methane being released into the atmosphere … fully one third of the global total.
Just sayin’.
Coffeeguyzz,
I am not an industry booster like you, if you don’t like what an article has to say, you resort to name calling. On the other hand, Mr Shellman knows what he is talking about, it would be nice if some state agency required wells that have been abandoned to be tested for leaks and to be properly plugged. There are no doubt many responsible operators like Mr Shellman and Shallow sand that properly plug any wells that are no longer profitable, apparently not every operator is so responsible and this seems to become a taxpayer liability when companies go bankrupt and there is no money for properly plugging abandoned wells. It seems this liability should be moved to first in line, in front of bond holders and all other liabilities in a bankruptcy. That might be the way it works, I am not a lawyer.
This outfit does in fact have to make SEC filings, regardless of what exchange it trades on. Hedges cost money (try getting 3.85/ MMBTU next time around), there are royalty burdens, taxes, G&A, debt costs and incremental lift costs per MMBTU to use in estimating well economics. Sheesh! Even the use of BOE for marginal stripper wells is slimy. The link below and one other source suggests liabilities exceed assets for this company and it is, in fact, indirectly drawing on Federal plugging funds.
https://www.ehn.org/abandoned-oil-and-gas-wells-2659296731.html
In the half century I operated, PA&D costs increased 300% and become more onerous every year with increased groundwater awareness.
Let others decide what the “truth” is and if in the end the American taxpayer won’t foot the bill for a lot of this shit. Hang on to your knickers when tens of thousands of shale wells have to be plugged.
Mike,
For a 10 thousand foot tight oil or shale gas well at typical depths in Texas, what would the cost be to plug the well properly? Would 300k be enough at today’s costs for the average well?
I found this web page, it suggests the rules tend to favor walking away from the well, seems we may need different rules, this is for Pennsylvannia, Texas may be different.
http://vpasec.org/wells/owplugging.html
The web page above suggests 100k for a shale gas well, but that might be a 2012 estimate when lateral lengths were typically 5000 feet (this my not matter for plugging as the focus may be on the vertical section of the well), with inflation I imagine the current cost would be at least 200k.
Coffeeguyzz,
So they have about 40000 to 50000 thousand wells to plug/restore and can do 450 per year, so they will be finished in about 100 years at the current rate, they will be bankrupt long before that, sounds very Enron-like.
Dennis,
I do not know to what you are referring.
Diversified owns/operates about 70,000 wells which produce almost a billion cfe per day. (850 Million cfed?), of which about 90% is natgas, balance NGLs and oil.
That buys a lot of cheeseburgers and sweet tea.
They are committed – as per several state programs – to plug ~200 wells per year, but they are on track to do more (capacity is 450 with the newly created subsidiary). This will include third party wells.
Tens of thousands of these wells will produce for 30/50 years or longer.
Why anyone would attack this company absent total ignorance or purposeful malice (cough, Adams-Heard, cough) boggles the mind.
Diversified is producing some of the most fugitive emission free natgas on the planet, doing it after acquiring aging infrastructure from other operators, and are plugging/restoring wellsites at an unsurpassed pace. (Hilcorp has also recently gotten into the well plugging business).
Attacking these guys seems to be a manifestation of the most visceral, logic-free loathing that one might ever display.
Coffeeguyzz,
Diversified assumes decline rates of 5% for their wells for 50 years, a more realistic decline rate would be 10 to 12% per year. Also their long run scenario assumes natural gas at $4.60/ MCF, rising to 4.90 after 10 years. Not clear that natural gas prices will be that high.
Note that in 2022 when the environment was very favorable for prices Diversified lost money. They claim to have 5.1 TCF of PDP reserves, but if we use a more realistic decline rate (11% per year rather than 5.5% per year) the real PDP reserves would be about 3 TCF.
There is a reason the stock trades in London rather than New York, this means they do not have to file a 10K and meet US accounting standards.
Coffeeguyzz,
70,000 wells times 30,000 per well is about 2.1 billion for plugging costs. Last year diversified energy lost money, each year the output decreases by about 10 to 12% (not 5.5% as they claim) at minimum. This is not a profitable model, it is a kick the can down the road model and leave taxpayers holding the bag for the 70,000 well plugging liability.
Thank you Mr Shellman, that is another excellent piece. Tom Loughry does excellent analysis, it is only a clown that thinks otherwise.
There is an old adage that if something seems to good to be true, it is.
Look, this Diversified Energy debate has become, once again, a pissing match between internet experts, a life long insurance salesman, no less, and actual oil men and women who spend their own money trying to scratch out a living in it… and know the ramifications of deferring plugging liability.
I hate his stupid shit. It is precisely what is wrong with social media and why nobody can learn from it anymore. Who, exactly, holds the moral high ground over people IN the industry concerned about plugging liability?
Well, here you go. Somebody who likely has never paid a working interest bill in in his/her easy life but spends day and night on the internet reading self-serving dribble.
Shall we admire these Diversified people because they had the courage (stupidity) to buy all these abandoned, shit wells?
Or, I know, let’s instead admire good, responsible stripper well operators like Shallow Sand, whose family operates wells in the IB that were drilled in 1905, and is up to date on his plugging liability.
Yeah.,..let’s do that. Let’s give Diversified and Coffeeguyzz the single digit salute and give a shout out to Shallow Sand and his family, and thousands of families like theirs who are doing the right thing. They represent the American oil and gas industry, the real one, that did it on their own. Without OPM and bankruptcies up the quazoo. Thank him. Say it. He deserves it.
70,000 wells. Think about that for a moment. A company traded on the London stock exchange has THAT liability to the American people and does NOT have the assets to cover that liability at <$5 gas.
Kiss my Texas ass if they ever live up to their billing, as I said, without the use of Federal funds, taxpayer money to plug all those shit wells.
Who defends this sorta business model?
Y'all decide, but before you go, these 14.000 wells in the marsh are a drop in the bucket. This, THIS, is a real problem.
https://oilprice.com/Latest-Energy-News/World-News/14000-Inactive-Oil-Gas-Wells-In-US-Unplugged.html
When you gotta plug the damn thing, plug it!
https://vimeo.com/216559862?share=copy
Thanks Mike,
I agree. Does 200k to 300k sound roughly right for plugging a 10k horizontal well in the Permian? I realize there are no average wells, each is unique, just looking for a ballpark figure in today’s dollars.
Kudos to both you and Shallow sand for doing things the right way. Unfortunately not everyone does and the result is a lot of abandoned wells that were never properly plugged.
It is impossible to estimate plugging costs across 10-12 tight oil and gas basins, DC. I plugged several EF wells for way less than 100K per well long ago. Helms, or Nelms, whatever his name is, quoted 150K in his Basin; every regulatory body within a state has different things to protect and different agendas.
Its not simply plugging that matters, its decommissioning costs and that is a Lessor, Lessee issue. In other words, what must be resorted to its original state before a lease can be abandoned. In West Texas, they don’t seem to give a shit…then when it’s over they will become immigrants trying to move to better places to live, with water, which there is none anymore. Not in the West, anyway. The Permian will look like a waste land, all for fucking exports…it already does in the Delaware Basin.
There is enough production pipe in US tight oil and gas basins stuffed in the ground to go around the world over 20 times. Half of that will never be pulled. Who gives a shit about that if they are living in San Francisco, or Orange County? Or Seattle? Or Maine?
That’s the thing; internet experts, they never put their money where their mouths are and they don’t often live within a 1000 miles of the country they don’t care about destroying to make a dividend, or royalty check. Right, Guga?
Like that HB wanker. You think he cares about anything other than having somebody else make money FOR him, because he can’t make it himself? He’s clearly got asparagus syndrome, by the way.
Just for the record, I lay a wake late at night worried about who is going to pull those lines
Thanks Mike,
I was asking about an “average well” in the Permian basin, but EF will do, so maybe 150k at today’s costs in Eagle Ford to plug a horizontal tight oil well with a 10k lateral?
EU gas risk: False comforts => complacency => weakness
Opec output down despite Russian rebound
More evidence that Russia is not reducing its production as advertised.
Recall the numbers in the table are Crude
Opec production fell in April as a rebound in Russian supply was not enough to offset disruptions affecting Iraqi and Nigerian output.
Russian production rose by about 130,000 b/d last month, following a 200,000 b/d fall in March, according to Argus’ latest estimate. Crude supply to Russian refineries was lower in April but exports were higher, as seaborne Urals and ESPO Blend loadings, as well as Druzhba pipeline deliveries, all increased compared with March.
The April data contain little to suggest Russia is making good on its pledge to cut production by 500,000 b/d compared with February levels, although deputy prime minister Alexander Novak on 4 Mayinsisted that the country is implementing the announced reductions.
The higher Russian supply and steady output by other non-Opec members of the coalition coincided with a 350,000 b/d fall in production from the 10 Opec members subject to targets. Output from the Opec contingent was down to 24.1mn b/d in April, the lowest since January 2022, leaving it 1.3mn b/d below target (see table). Combined Opec production undershot the group’s collective quota by about 2.4mn b/d.
Iraq’s production declined by 200,000 b/d in April after Turkey halted piped Kirkuk deliveries from the Kurdistan Regional Government’s (KRG) part of northern Iraq to the Mediterranean port of Ceyhan on 25 March. The decision was triggered by an international arbitration court ruling that Turkey had breached a 1973 pipeline agreement by allowing KRG oil to be exported without Baghdad’s consent in 2014-18.
https://www.argusmedia.com/en/news/2446484-opec-output-down-despite-russian-rebound
Regardless of Russia’s ability to sell its oil, their oil and gas revenue has collapsed shown in my graph above and in this article below.
Increasing pressure on Russia’s oil industry
Ron
It would be nice to know that Western sanction are working in reducing Russian production because they don’t have access to US expertise.
I also read that India is having difficulties in how to pay for Russian oil.
https://theprint.in/economy/supply-of-cheap-oil-from-russia-could-be-at-risk-as-india-searches-for-payment-options/1547364/
Ovi, you have to ask yourself, “why would Russia decide to make their production level a secret.” That just doesn’t make any sense. They have to have a reason. Just a guess but I believe that reason is they don’t want anyone to know just how much the loss of foreign expertise is costing them. I think it is costing them dearly.
We have no idea what their production level is. We don’t know what they are exporting via pipeline, and we don’t know what their domestic consumption is.
Ron
We need an answer from a US expert. Every so often I read about oil wells being choked to optimize production. Is it possible that Russia has unchoked a number of its wells to increase production temporarily? Is unchoking a well a relatively simple procedure?
Since they announced a production cut, typical misinformation, they would want to hide that they are able to maintain production or possibly increase it. However within six months or so, that short term gain may result in increased decline rates.
Just speculating.
April 10, 2023
“Schlumberger NV (SLB), however, the world’s largest oilfield contractor, with headquarters in the US and Europe, is still operating in Russia. ”
https://www.globalwitness.org/en/campaigns/stop-russian-oil/slb-isnt-going-anywhere/
Who else? Many companies said they were suspending new investments/operations.
That does not mean they pulled out.
Natural Gas
This simplistic fossil fuel (CH4) is about to get more complex. While the sources are variable, the molecule is the same. But the way it’s extracted and transported isn’t. Therein lies the rub, so bear with me.
Embedded in the Inflation Reduction Act is a thing called the Methane Emissions Reduction Program, which is to go into effect the first part of 2024. This will in effect put a charge on oil and gas facilities that emit more than 25,000 metric tons of carbon dioxide equivalent, which won’t take a lot of methane because as a GHG it is 72X more potent than the index gas (CO2). This charge is a direct offshoot from Norway, which is Europe’s biggest supplier of NG and already has in place a methane tax.
This may seem like governmental overreach, but it is a self-inflicted wound. During the mad years when the Permian was just getting into its frenzy, there was profligate venting and flaring of methane due to inadequate NG takeaway. This was incredibly widespread, and in direct violation of Statewide Rule 32, which states that you can vent for 24 hours and flare for ten days, at the end of which you have to either shut in the well or hook up to a pipeline. This is a rule that was written into the books of the TRRC long ago. NG became an unwanted byproduct, so cheap it was worthless–a pain in the ass.
But by turning a blind eye, the TRRC did no one any favors. Their disregard for their own rule resulted in grotesque flooding of the NG market, keeping the price miserably suppressed, giving the oil and gas industry a horrible black eye. Of greater importance, all that CH4 caused irreparable damage to the environment. Not that other basins get a pass; the Bakken was fully as bad. But all those satellite images of the Permian–“looking like London at night”–is when the world truly learned to hate fossil fuels.
Enter the Canary Project, which is quickly working to take advantage of this coming act. It was an idea born in the Appalachian Basin, then spread to the Haynesville, and even the old Wattenberg Field in Weld County Colorado. These are dry gas fields, of course, and they’re running a propaganda campaign, of course, but the differentiation of NG that has been extracted and transported without methane emissions is coming very fast, and there will not only be a tax on fugitive emissions but the “Low Intensity” NG is going to bring a premium.
This isn’t all bad. Fossil fuel extraction has–in the age of accurate detection and measurement–routinely caused about a third of global methane emissions. This was Venting and Flaring, mostly. Now we’re down to leaks. And that brings us, inevitably, to the mind and machinations of one Rusty Huston–the topic of dispute.
Even if Mr. Huston’s intentions are pure, and he plans to methodically tend to the great number of leaking, unproductive wells under his tutelage, the methane gas fine is likely going to overtake him. If his intentions are pure, that’s a shame, but the problem is a bigger one than just plugging the requisite number of wells each year. With all the talk about carbon capture–which is the capture of CO2–we should be talking about methane capture, which is a 72X bigger problem. In lieu of that, we should shut down as best we can the anthropogenic release of methane.
Gerry
It seems the potency of CH4 vs CO2 according to the EIA is 25.
“Methane is more than 25 times as potent as carbon dioxide at trapping heat in the atmosphere.”
https://www.epa.gov/gmi/importance-methane#:~:text=Methane%20is%20more%20than%2025,trapping%20heat%20in%20the%20atmosphere.
I didn’t look it up as I’ve always thought 72, but I’m eager to accept 25–I like methane a great deal.
Now you talk about wasting something valuable; venting and flaring for months on end was the dumbest thing I’ve ever seen.
I get why a man would do it. I am part owner of what appears to be a strong well inside a certain city limits–so no flaring, period. We had to bring in a closed environment collector from Oklahoma, just to test the well. Why from Oklahoma I don’t know. It was so frustrating that I wondered if we couldn’t vent it just for 24 hours, but the pressure was high and it would be hard to hold the noise down.
I also get that it was the small operators like my group that benefited from the regulators turning a deaf eye (another “intentional” mistake). But it didn’t. It allowed them to vent and flare, then leapfrog to another site to drill another well just for the crude. Who knows how much high-quality natural gas went into the troposphere. And from there, after the weather blew it around, into the higher reaches of the atmosphere.
So at only 25X the potency of CO2 (thank you for the correction), it still didn’t do any good for the earth or those of us still using it. And did I say it was dumb?
For new fields started in 2022/23, Vito started in mid February but hasn’t reported any production yet, Taggart (re)started at the end of March and will give 10 or so, Argos started in mid March and will add 100 or more. PowerNap, Dome Patrol and Spruance have peaked and will decline (typical single well decline rate is around 16%), the Kings Quay development (Samurai/Khaleesi/Mormont} also looks to have peaked already but the decline is likely to be slow for the first couple of years if there are in-fill well slots available.
On recession/depression discussion above. If we do go into a general recession or depression is it likely, or even desirable that we come out of it? Infinite growth on a finite planet is impossible, overshoot and collapse are the end results of thinking otherwise. Growth has to stop sometime, why not now. GDP growth has been falling for years, and the ten year trailing average trend (a lagging indicator) worldwide was heading for zero sometime around 2030-35 (earlier for OECD countries alone). All the signs that we are reaching real limits to growth are starting to show, compounded by societies and politicians generally making the exact wrong decisions as stresses start to build, especially now with smart phones and social media having taken away a lot of the remaining individual agency we might have had. An early collapse is likely to produce less overall suffering in the long run. Maybe it will force some new behaviours that will leave some functioning biosystems for our descendants, like finding new ways to status signal other than consumerism, deciding our fellow travellers aren’t so scary after all and using public transport rather than EVs, learning to garden and sow, recognise the FIRE and advertising industries as bloated and mostly unnecessary in a contracting economy, reduce defence spending, overcome death phobia and give people control over end of life choices, reduce food waste with more community based food provision, etc. (but probably not – more likely are responses such as a slow rise in birthrates as people realise pensions won’t be coming their way and they’ll need someone around to take care of their old age).
George,
I agree. I expect growth to slow as population peaks and then declines. Real GDP per capita for the World has grown at about 1.5% per year for the past 50 years or so and it may well grow more slowly as the World becomes more developed, perhaps slowing to 1% or less. Some scenarios have World population peaking in 2070 or so and then declining and this will reduce overall real GDP growth to zero if real GDP per capita falls to 1% and population is declining at 1% per year. The sooner we either reach steady state or preferably reduce real GDP at the World level the sooner human population becomes sustainable. Not an easy task and humans usually do the opposite of what is required, we are generally not smarter than yeast.
Its an important and profound issue that you raise George. But regardless of what a thoughtful person or group may conclude about this issue, I expect humanity on the whole to just continue on…seeking growth at all and any cost, including at the expense of other people and the very earth itself.
Very few volunteers for a lifestyle of restraint and conservation, and no sucessful politic platform based on restraint, and no business plan or economic system to handle contraction as a base condition.
Hickory
Nice summation of how I see events unfolding. And when growth is no longer possible the efforts will be to just maintain the status quo, and after that , to minimize the rate of decline.
I monitor carbon emissions as a proxy for GDP ,something that evades the gaming of economic numbers.
I am optimistic that when the dust settles ( maybe in a couple of hundred years) new civilizations will develop, without a significant addiction to non-renewable resources. The Romans, Greeks, Chinese and Egyptians have shown what is possible.
I really wonder how much of our scientific knowledge will be preserved into that time. I doubt that electronic storage will be up to the task.
Thats a good point about carbon emissions being a rough proxy for Gdp.
I expect Peak Global Combustion Day to be in mid 2030’s.
Also, perhaps we have already entered that phase of trying to ‘just maintain the status quo’
Hickory,
I think the peak in CO2 emissions will be between 2025 an 2030, potentially we could see fairly steep decline with good policy choices to advance the use of wind, solar, and batteries, building out an HVDC grid would help.
Dennis,
You think CO2 will decline after 2030 ? You do realise there is a massive lag effect with GHGs right. The pollyanna in you is shining brightly i see 😀
Iron Mike,
I expect emissions of CO2 from burning fossil fuel to decrease, this is different from atmospheric CO2 levels, I agree the atmospheric CO2 level will not decrease for a long time as there is a significant lag of perhaps 50 to 100 years between peak emissions and peak atmospheric CO2 levels, it depends in part on how fast emissions of CO2 from fossil fuel combustion decreases.
The scenario below uses a modified Bern Model with an emissions scenario that has CO2 emissions fall from 37 Gt CO2 in 2020 to about half that level by 2070, total anthropogenic emissions from 1850 to 2100 is about 1078 Pg of Carbon or scenario, peak atmospheric CO2 is about 507 ppm in 2082 (about 62 years after peak CO2 emissions for the scenario) at peak emissions in 2020 for the scenario atmospheric CO2 was at 415.5 ppm for the model (this was model was done in 2017).
So I am well aware of the lag between emissions of CO2 and the atmospheric concentration of CO2.
Old chemist,
Using per capita CO2 emissions data for fossil fuels from BP stats and real GDP per capita data from World bank, it does not look like emissions and real GDP are well correlated over the 1965-2021 period.
https://data.worldbank.org/indicator/NY.GDP.PCAP.KD
https://data.worldbank.org/indicator/NY.GDP.MKTP.KD
I used the data sets above to estimate population and used the real GDP/person data from first link.
BP data from
https://www.bp.com/en/global/corporate/energy-economics/statistical-review-of-world-energy.html
As I said the correlation is true, but rough.
One reason is that not all energy comes from combustion of fossil sunlight. There is also nucs, hydro, biofuel, solar, wind. Cumulatively, these do have significant impact of the chart correlation.
Secondly, GDP is a fairly poor measure of ‘what matters’. It includes all sorts of paperwork or digital activities, and all sorts of optional activities like fashion, luxury goods, entertainment or leisure travel.
These sectors add up to a lot of GDP, but mean very little to the survival of the species or the base viability of an economy, which I remind all…is comprised of living humans beings who are a form of animal life. Energy requiring animal life.
To that last point, I think the most likely point of departure of hominids from evolution (survival of the fittest) was when ‘we’ acquired the skill to control and harness fire (extra energy).
Hickory,
Yes real GDP is not an ideal measure, but at the World level we don’t really have an alternative measure. As to what part of GDP is necessary, that would vary person to person, GDP basically boils down to income and pretty much everyone thinks the income they get is necessary. How resources are allocated is left mostly to private markets, though governments also have an influence, we can influence that part by who we elect and could increase the share with higher taxes, if we want more public investment.
In many cases in the US as you know, many would prefer less government spending, I think there is a lot of room for increased infrastructure investment which is mostly done by government entities or large entities heavily regulated by government.
If we simply look at real GDP vs CO2 emissions from fossil fuel the correlation looks better, but there is a hint that we may be near the peak, whether we remain on plateau or the rate of decline in emissions depends on the collective policies chosen by governments.
Iron Mike…Dennis said CO2 emissions…not CO2 concentration.
Dennis- I don’t think that the sum total of humanity is on a path to achieve peak CO2 emissions this decade. Would it be possible..yes, but highly improbable in my view. I would be glad to be wrong on it.
Policies to curtail combustion are pretty limp, and humanity has not made it a priority. Also, it takes economic prosperity and great credit to make the big investments that can curtail combustion on a voluntary basis.
Hickory,
We will see what happens as population growth slows, as fossil fuel resources deplete and become more expensive, and as wind, solar, and battery output increases. I expect coal and oil consumption will peak before 2030 and natural gas before 2035. If wind and solar continue their rapid growth and EV uptake continues to grow rapidly (maintaining the growth of the past decade) demand for fossil fuel may begin to fall before 2030.
My guess on the odds of a peak in CO2 emissions from fossil fuel combustion reaching a peak before or after 2030 are about 50/50.
Difficult to foresee how things will play out.
Dennis and Hickory,
Thanks for that. Essentially Dennis, you are saying CO2 emissions will peak around the same time as your peak oil curve.
I still think we could be past a positive feedback loop where even though human emissions may reduce in your model, natural geological activity may continue to keep emissions higher than expected.
Just my 2 cents. I honestly don’t know what will happen.
Iron Mike,
You may be correct, but my claim was specifically CO2 emissions from fossil fuel combustion. There may be increased emissions from natural sources due to wild fire and forest dieoff, I agree. I also don’t know what will happen, nobody does.
a very nice thought GK. unfortunately there is not a single ounce of political will behind this idea. I, along with Aliquat blame the Soviets. They are clearly to blame for the situation we are in today. Beyond that I wouldn’t hold your breath.
I know that I get accused of being a perma-economy bear, but that is simply not true. For the past 14 months, yes. And we are teetering on the brink of a serious credit crises that will most likely rival 2008. But what happened after 2008? Fracking, free money, and 15 years of insane bull markets and growth. I will believe we don’t have “another one” of those when it actually happens. We’ve got to learn at least one applicable lesson from following this issue for 20 years.
After 2008 we also got a step change to falling GDP growth, which happened pretty uniformly across the world. The World Bank thinks this will continue through the 20s (it has to come up with some hopium, i.e. suddenly back to lots of growth, after that, but I think we wiill be well and truly banjaxed by then). Note it is talking about “potential”, i.e. best case, I doubt if we’ll get any where close to that, and may well average negative (see: Falling Long-Term Growth Prospects, https://www.worldbank.org/en/research/publication/long-term-growth-prospects). Asset price bubbles were a consequence of the way debt was created and distributed in response to the 2008 problems and might well disappear faster than they were created once it becomes clear there isn’t enough global EROI to keep them inflated. It may be that the rise in putative assets contributed to the fall in growth in real economic activity, but I haven’t seen any studies on that.
very well articulated. although a tremendous amount of people would suffer that really didn’t contribute to or benefit from our current state, I think ending this current arrangement (political, social, economic), at least here in the US would be preferred to limping along for another 40 years. The US has been a series of speculative bubbles – land grabs, railroads, gold, trusts, small business ownership, franchises, real estate, stock markets, internet, crypto, AI. And there isn’t much to the whole deal if that can’t be perpetuated.
World real GDP per capita using World bank data for 2015 constant dollars from 1975 to 2021.
Average rate of growth for that 46 year period was about 1.59% per year based on OLS trend for exponential function fit to data.
@george kaplan
“If we do go into a general recession or depression is it likely, or even desirable that we come out of it? Infinite growth on a finite planet is impossible,” — Therefore, the problem is self correcting – not painlessly self correcting, yet self correcting nonetheless. “If something cannot go on forever, it will stop.” (Stein’s Law) My question is, how long until we have a recession that we cannot fully recover from simply because we no longer have enough energy? Whatever benefit there may (or may not) have been (yes, this is very much debatable contra some narrow minded green activists) to deliberately capping economic growth via some central planning scheme, 99% of the benefit would have come through early intervention. At this late date, the question is purely academic since the ability to grow is rapidly winding down as net energy supplies approach the point of decline.
(North By Northwest is one of my favorite films, BTW.)
https://www.houstonchronicle.com/business/energy/article/alaska-lng-exxon-conoco-pipeline-planning-18079041.php
Can’t read it, paywalled.
Orphan wells are much more common than reported, and many of them are pre-war (in many cases I’m referring to WWI). The first oil well drilled in Oklahoma was about 1860. Shallow wells were drilled all over eastern Oklahoma after the Glenn Pool was discovered. They mostly petered out after a few months to years. They were not capped meaningfully.
Where I grew up, the first well near Elk City was a dry hole for oil but made a lot of water. That became the municipal water source for early Elk City. Later on, someone drilled nearby, but just a bit deeper, and hit oil and gas. That area became known as the greatest reservoir for gas condensates, but there was almost no market so gas was considered a nuisance. Before long, about 150 producers were drilling in a small area. Only a few survived long enough to become names that you’d know. The rest pulled up stakes and moved on. None of those wells prior to about 1950 were plugged.
My grandfather hit a gusher in 1952. It lasted six months. They waited until the pressure bled off, then filled the hole with heavy drilling mud and topped it off with a load of cement. They did that of their own free will; there was nothing requiring them to plug the hole–and that well had been a blowout.
In fact, the idea of requiring a surety bond (performance bond) didn’t materialize until about the sixties or seventies. I looked it up: Pennsylvania (which also has a huge number of orphan wells) first required a surety bond to drill in 1985. It was for a paltry sum. And that’s a huge part of the problem: as wells were drilled deeper and using more sophisticated techniques, the surety bond sum remained low, not keeping up with inflation or a raging increase in P&A costs.
A lot of those old abandoned wells leak methane. Quite a few got reworked, using everything in the world to make them productive, and many were. In Oklahoma, that rework business was poorly regulated. An early oilman named Glen Peale, who designed the Peale derrick, reworked hundreds of those wells. Glen was not a dishonest man (I knew him), but he was the first out of the box thinker I’d come across. He used toilet paper down one well, which cranked out a considerable amount of oil in surrender.
Okay, thanks for bearing with me–there’s a lot of trickery that can be used. Hypothetically, say you buy a thousand dead wells. Most states require you to plug a certain percentage of your nonproductive wells each year. Usually the minimum for that is $25,000 per well. Hypothetically let’s say of those thousand wells, one-hundred were nonproductive, and because the seller was about to experience the liability of plugging them at a 2.5 million-dollar cost, he basically sold you the thousand wells for exactly what they were producing each year–say $500,000. But then, if you find any meaningful production–even just $50 per day–the buyer could retool these with new standpipes and gauges and declare them productive wells and therefore drastically reduce his dead well count. This bookkeeping manipulation could easily take 100 dead wells down to 25, and the proration downward to plugging only 2-3 wells per year. These wells join the mix of “productive” wells, and immediately look like they’re much more valuable than they are (if you’re marketing this in a stock offering). Instantly, instead of having 900 productive wells and 100 dead wells, you have 975 productive wells and 25 dead wells.
I’m not accusing Mr. Huston of doing this. But others are. I am highly suspicious that anyone could buy 100,000 end-of-life wells from savvy operators and actually make a profit, considering the sky-high prices for P&A.
The clean-up of these methane-emitters, a lot of which exist in my ancestral state, will go to the taxpayer. The producers are mostly long gone, and in many cases, not even traceable. In my state, a lot of them were dug in Indian Territory, or Oklahoma Territory, or the Big Pasture, or the Cherokee Outlet. After the fabled 2020 Supreme Court decision, most of that part of Oklahoma technically belongs to the Creek Nation. I like the First People, but I have serious doubts that they’re going to pay for plugging those holes (which were drilled by the white men anyway). We’d have as much luck plugging the hole in the ozone as plugging those thousands of holes.
Plugging and restoring land to its original state is a very, very serious issue. There is, for instance, enough rotten, corroded pipe in the ground from flowlines that run from wells, to tank batteries and gas taps to circle the earth 40 times. Underground, in Waste Texas, it looks like the Matrix.
Do the math on HZ wells alone and all the 5 1/2 inch OD 23 to 32 pound per foot casing that is stuffed from the surface down to the toe of a lateral. It will floor you. Most of that pipe will be planted in the earth forever.
I am not picking on anybody, or any company. Its a problem. An ignorant public, and the ignorant politicians it elects, always wanted cheap, inexpensive oil and gas. They turned the other cheek to get that, for YOU.
Now, EVERYBODY is going to pay the price. YOU elected these people. YOU standby and demand cheap gasoline, or high dividends from your investment portfolio…now you, or your kids, are going to have to give up all the money you’ve made or live with the consequences.
Let’s call what I do, or write, or publish, simply oil, “wokeness.” Reparation is on the way.
Have a nice day.
One point too, if we really are going to be done with most oil and natural gas wells in the US in the next 10-30 years, it’s going to physically take many years to plug all of the wells.
We identified 3 last year that we felt would no longer be economic. We arranged for them to be plugged and they were plugged 9 months later, earlier this year. We waited to have the work performed at a good time weather wise, to minimize surface damage (and expense) that would be caused by trying to plug the wells in the mud.
But the primary delay was waiting on the contractor. His company does a good job, and he is in high demand. He also does other kinds of service work besides plugging with his crew. He also owns and operates his own wells. So his company isn’t plugging wells only.
All told there are about 4K total wells in our small field. There are 3 companies that plug wells, each can only plug one at a time. It can take anywhere from one day to a week or more to plug one of the field’s very shallow wells. The other two that plug wells also do other work and operate their own wells too.
It also can range from extremely easy to very difficult to decide when to plug a well in our field. Oil prices are so volatile, a well or lease can be economic one year, and not the next. Expenses are highly volatile too.
In 2020, many of our leases were uneconomic. I’m 2022, they all were very economic. In 2020 oil averaged $36. In 2022 $91.
This year, almost all are economic, but there are a small number that are struggling due to a major expense being incurred, such as major electrical repairs from a lightning strike, replacement of a pumping unit, and workover of an injection well that developed a casing hole.
Reading more about the gas company with the most well bores in the USA. Its thesis is that natural gas prices will be high for a long time.
Personally we don’t feel like we can count on a thesis like that. We have zero desire to grow, due to the volatility. Also, we aren’t getting any younger and have no succession plan.
So we will continue to do the best we can, keep all the wells active, and plug what we feel needs to be plugged when we can. We keep trying to build our plugging fund. We also own a decent amount of fee acreage that we could sell to fund plugging, if it comes to that.
We plug about 1-2% of our wells every year. No idea if that’s enough or not going forward. Tell me what oil prices will average over the next 5-20 years and I could give you a better answer.
The wells we operate will keep producing oil for decades. Everything is dependent on oil price and future expenses.
After being shut in 2020 for about 4 weeks, we had higher production in 2021, and higher again year over year in 2022. Strange stuff, right? No new wells. Actually plugged 2 in 2021 and 3 in 2022! So a few less wells!
Weird things can happen in a water flood. Just this year, we noticed the pound going up on a well (actually, the pumper did). He sped the well up a little. Raised the electric bill about $40 per month. But the well is producing almost 1 BOPD more than it was. A 1.7 BOPD well 1,000’ deep with an electric bill of $220 per month and chemical expense of $600 annually can generate some decent cash at current oil prices.
This well was drilled in 1957 with a cable tool rig. It was shut down by a prior operator in 1998 when oil prices dropped to $8.
We took it over, spent $18k on it in 2012, and have produced it since. It’s worked out well. Will generate $25-30k net annually at current oil prices. Plus, it’s generating over $5k per year for the royalty owners at current prices. They seem happy about that.
The well was idle from 1998 to 2012. It should have been plugged. But for whatever reason it wasn’t. We took a risk when we took it over, in 2012, no doubt. At that time oil was $100, and we didn’t anticipate what happened with the oil price 2015-2020. Needless to say, we won’t be doing anymore reclamation projects. A lot has changed in 11 years. This one did work out. Some don’t.
Hopefully giving some anecdotal examples can help the others here an idea as to why it’s not always an easy to know what to do in oil and gas upstream. Not for weak stomachs.
Also, we aren’t perfect. We try very hard to do things the right way. But we are in a very old field. We have old equipment. Things break and have to be repaired. Leaks happen, and have to be cleaned up. That is why everything has to be monitored closely.
I suspect anti-oil activists could make us, or any other operator look bad. I see how they report their findings.
For example, I notice all leaks are reported in the media in gallons, and not barrels. Makes for a larger number.
I’m sure if anti-oil activists went to all of our wells with a FLIR camera, they would not report the average of the emissions. They would report the well with the highest. That is how these stories always read.
I don’t see any activists quoting the recent DOE methane emissions study. That’s because it showed that stripper oil wells in our Basin were very, very low methane emitters.
No anti-oil activist is going to report on “good news.” Just like no industry advocate is going to go out and find the worst emitting well in a field and report on it, or even properly criticize the industry when the criticism is due.
Pretty much everyone has an axe to grind. Look no further than this blog, of course. Even I have one, lol.
I still see a lot of gasoline and diesel being used. I don’t see the consumer’s being run down for that. Why shouldn’t they be?
The anti-oil activists still use petroleum products and will complain when oil prices go up. Gas prices still matter. That’s why we have a lot less oil in the SPR than we did.
Thanks for the information Shallow Sand.
Can you clarify who the anti-oil activists are who comment frequently here?
The stories on methane were pointed out by Mike Shellman. I thought they were interesting stories.
I agree with Mike that the plugging liability could be a problem, particularly for old wells that have been abandoned.
Dennis.
I didn’t mean on here.
I mean as far as when I read a story about an anti-oil group going out to monitor wells.
We always hear about the worst well, not the overall results.
I have seen very little about the DOE study, which was performed in order to determine what level of monitoring is required regarding methane emissions from stripper wells.
Which is unfortunate. .
Shallow sand,
I agree. I imagine many of the leaking wells may be abandoned wells that were not properly plugged, but that is speculation on my part.
Dennis.
Also, it seems the gas stripper wells are more of the problem than the oil stripper wells, which makes sense.
None of our wells produce enough gas to be capable of burning a flare.
I also suspect that it is abandoned wells that are more of an issue, which is why it does make sense to plug them all.
I also hope you understand Mike’s point about bonding. If actual amounts to plug were required posted, it would have greatly reduced development, leading to less production.
That’s part of our conundrum. Right now, the down hole equipment, pumping units and tank batteries (including injection pumps) are worth more than it would cost to plug our wells. However, they likely won’t be worth much when that day comes.
Also, plugging costs are very uncertain given the ever dwindling number of companies doing that work in our field. Who knows how much it will cost when that time comes, or if we will even be able to find companies to do the work timely.
Thanks for taking the time to explain all this. Its a topic that 99% of people know nothing about.
Beautifully said!
500 shale wells are coming online each month in the Permian alone. In ten years, they’re going to be dead. At $250,000 now, double that for inflation, that’s a cost of $125,000,000 to $250,000,000 per month to plug them.
There aren’t enough surety bonds to cover a week’s worth of new production, much less this wild bunch. This is a mammoth problem that absolutely no one is addressing.
The obvious solution is to demand purchase of a performance bond to cover future P&A for each new well as it comes online. That would not only solve the looming fate of every well ever drilled, but it would slow down production, raise the price of oil, give the renewables gambit a shot in the arm.
Gerry,
A great idea, but not likely to be implemented in most oil producing states, the EPA could try to do it but the Supreme court would likely intervene and legislation in Congress is not very likely.
Not to belabor the point, but anyone drilling for oil or gas has to purchase a surety bond–at least in any of the states I’m involved in.
The point I was trying to get across–and the reason for the orphan wells after the surety bond requirement came into play–is that the sum is very inadequate and doesn’t keep pace with inflation.
In 2022 BOEM issued a forecast for future production, as shown below. “Reserves” comprised all the wells then on-line and modelled as fitted decline curves. “Contingency” comprises all discoveries not yet on-line (some post FID, some not yet in conceptual design) modelled as typical production profiles. “Undiscovered” is what it says and modelled based on known geology and expected development timing.
The total shown for “Undiscovered” is just under one billion barrels, but it is shown as still growing after 2031. Announced discoveries since the report have only been in the tens of millions. There are a couple of high profile exploration wells planned (targeting greater than 100mmbbls) but the BOEM numbers look optimistic. Even if the final total might be up to 1-2 billion the timing is going to be much longer, and therefore the peak lower, than shown.
For “Contingency” the total shown to 2031 is 2.8 billion, but the final amount will be around 4 or more, which also seems a bit high and/or with earlier development than possible now. It would have included North Platte (now Sparta), which was put on hiatus with an FID now planned for later this year and, therefore, first oil at best around 2028; Tiber and Guadalupe, which may contain plenty of oil but without a profitable way of development; and various fields around Appomattox, which will likely be tie-backs and depend on production capacity becoming available (and it’s worth noting that the Appomattox reserves were significantly downgraded).
The already planned developments (several of which have since come on line) probably total only 1.7 to 2.0 billion for greenfield (Argos, Vito, Kings Quay, Anchor, Whale, Shenandoah, Leon, Castile) and around 0.7 for brownfield (Ballymore, PowerNap – which has been significantly downgraded since start-up, Shenzi North, Thunder Horse South, Spruance and some other small, single well tie-backs). So again the forecast looks optimistic for overall recoverable reserves and for maximum production. Saying that however, it is still lower than the EIA 2021 reference case.
https://www.reuters.com/world/uk/british-wind-power-overtakes-gas-first-time-q1-2023-report-2023-05-10/
The countries that are faced with importing gas and oil are going to be going with electric vehicles, heat pumps, etc, a good bit faster than most people in the ff industries expect.
How big an impact this sea change is going to have on the prices of gas and oil is one hell of a question.
My guess is that both demand and price of both oil and gas will on average continue to go up indefinitely, maybe not from one year to the next, but over intervals of three to five years or so.
Everybody here is pretty much focused on the production end.
If renewable electricity cuts into the demand for oil and gas by say twenty percent within the decade, what will this mean for gas and oil prices?
Don’t forget that even with renewable electricity gaining market share, the market can potentially grow fast enough that gas and oil never the less sell in larger amounts from one year to the next.
OFM,
Natural gas demand will drop and prices will fall, but once the wind and solar has gained ground the demand never returns, supply simply falls due to fewer natural gas resources being profitable to produce at the lower price. The same is true for oil and coal. Before long the question will be how fast does fossil fuel output decline as consumption of fossil fuels becomes less important.
Dennis,
You say, “how fast does fossil fuel output decline as consumption of fossil fuels becomes less important.”
This is an interesting notion put forth by many in the GREEN ENERGY MOVEMENT. While I understand the reasons to try and move away from fossil fuels, the idea that we can and have our CAKE & EAT it too is just delusional thinking.
Furthermore, Wind Turbines, Blades, & Solar Panel equipment aren’t made from large STAR TREK REPLICATORS. They are manufactured the old fashion way with Gobs of Fossil fuels.
We know this is the case because China is by far the largest manufacturer of Wind & Solar Power Units. Why? Because China has cheap coal and labor as a source.
Moreover… since 2005, here is the growth of GREEN vs FOSSIL FUELS
2005-2021 Net Change:
Wind & Solar = 7,262 TWh
Coal & Natgas = 21,241 TWh
Not only has coal and natgas growth surpassed Wind & Solar growth by a factor of THREE, I can assure you if coal and natgas power declined during this period, so would have Wind & Solar Power.
When the GREEN ENERGY movement finally pulls its HEAD out of its AZZ, and realize there is no CAKE & EAT it too without Fossil Fuels, then we can face the world as adults rather than acting as delusional children to understand GROWTH IS DEAD in a Peak OIL ENERGY CLIFF environment.
steve
The crazies have taken over the asylum with the ” Nett Zero ” narrative .
https://notalotofpeopleknowthat.wordpress.com/2023/05/09/the-price-of-virtue-signalling/
https://notalotofpeopleknowthat.wordpress.com/2023/05/10/ev-illusions/
Mr Lower Case steve,
You can make your false “CAKE & EAT” claim with your strawman argument. But the people who are going to be caught with their head up their ass, will be the one’s unprepared addicted to fossil fuel.
He who laughs last, laughs best
Shellman says when your done, “plug it” !
HUNT,
Where the Hades have you been? Gosh, I miss that sunny positive mug of yours.
Regardless… there are two types of people in the world.
1) Those who believe in the ENERGY TOOTH FAIRY
2) Those who don’t believe in the ENERGY TOOTH FAIRY.
I can assure you, not only do 99% of Economic professors and Economists believe in the ENERGY TOOTH FAIRY, most people do because they have no idea where the energy comes from, or much less, their food.
Years ago, I asked an employee where did food come from, he said the Supermarket. So, with that sort of mentality, I say… go forth and be prosperous… ENERGY TOOTH FAIRY.
GOD HATH A SENSE OF HUMOR…
steve
Easy Money,
I was here last week calling out your ignorance and you were nowhere to be found. You must have been busy plowing the back 40 with your mule or milking the cow.
https://peakoilbarrel.com/short-term-energy-outlook-april-2023/#comment-756442
I enjoy shorting your advice. I made enough last time to put solar panels on the roof. I figure your next call should earn me a new Lyriq.
A simpleton view- “Regardless… there are two types of people in the world”
“GOD”, Now there’s your “TOOTH FAIRY”
Steve,
From BP Stats data, primary energy consumption increased by 12.77 EJ from 2018 to 2021, of this increase11.38 EJ came from non-hydro renewables, with about 1 EJ from nuclear and hydro. About 0.34 EJ of the increase came from fossil fuel. Clearly fossil fuel will be needed to build out renewable power, but over time less and less will be needed. Wind and solar have been growing at 14.4% over the past 5 years. If that growth rate continues (I believe this estimate is conservative) about half of the primary energy output would be produced by wind, solar, nuclear, and hydro by 2038 and fossil fuel output would fall by 166 EJ to 323 EJ from the 2021 output level of 489 EJ.
By 2045 fossil fuel energy use could be reduced to nearly zero, though the last 10 to 20% may be more difficult to achieve and might take until 2050 to 2060.
No replicators needed, just continued progress in producing and installing wind and solar power, building batteries and EVs, producing and installing heat pumps, refitting existing buildings for greater energy efficiency and building new buildings that utilize Passivehaus design, upgrading the grid, building synthetic fuel plants and pumped hydro facilities to utilize excess power produced on windy days and summer days.
Steve,
In 2021 combined coal and natural gas power plants produced 16762 TWh and in 2005 they produced 11120 TWh Worldwide, the difference is 5642 TWh.
For Wind and solar only 2894 TWh was produced in 2021 and in 2005 there were 109 TWh of power produced by wind and solar, the difference is 2786 TWh, roughly half of the increase for coal and natural gas.
Note that the year chosen makes a difference, if we compare 2012 and 2021 we find coal and natural gas power production was 2411 TWh higher in 2021 than in 2012 and for wind and solar over the same time period output was 2514 TWh higher in 2021 than in 2012.
We could also compare 2018 to 2021 where wind and solar power output increased by 1605 TWh and coal and natural gas electric power output increased by 458 TWh or by about 3.5 times less than wind and solar power.
DENNIS,
While I appreciate you providing the Coal & Natgas power generation data, the world uses GOBS of Natgas other than electric generation. I thought you knew this.
While we can use Wind & Solar to generate electricity, you can’t pump that into the Farm Soils in the world or the Natgas used to make Fertilizer.
And then there is the NGLs that makes all the Plastic we put into EVs. So… there’s that LIL TIDBIT as well.
steve
Srsrocco,
There will be plenty of natural gas for fertilizer production and plastic, especially if we don’t burn so much for electricity and heat, it is the burning of fossil fuel that causes much of the environmental damage, though reducing wasteful plastic use in packaging and throwaway bags and bottles and increased recycling of plastic where actually necessary would be an improvement.
Every unit of energy produced with wind and solar replaces a unit of energy which would have been burned in a natural gas or coal fired power plant. Much of the heating use of natural gas for buildings and water could be replaced with heat pumps powered by electricity produced with wind and solar.
Dennis, while your 2,894Twh is the correct total of wind and solar output for 2021, according to official sources, Steve has used the adjusted output to equal efficiency losses attributed to fossil fuels that give a much higher number.
The actual World output of solar and wind is only 1.6% of World primary energy output. All the other increases in use of fossil fuels 21,241Twh since 2005 are what has made building all those solar and wind plants possible, because it’s all built with fossil fuels.
This is something you and many others don’t seem to want to understand. There are no plans to build it without fossil fuels, nor is there any energy accounting for what the EROEI would be in a ‘renewables’ world that is built from just electricity.
You quote a high growth rate of 14.5%, and then indicate what would happen if that growth rate continued into the future. This is nonsense as both solar and wind growth rates have been falling over the last decade when looked at via a 5 year moving average growth rate for both. For just solar these are the absolute numbers for world installed capacity for each year from 2005-21 in Gw…. 4.55, 6.09, 8.51, 14.73, 22.84, 40.34, 72.22, 101.57, 136.23, 175.62, 223.2, 295.23, 390.21, 483.01, 584.69, 710.28, 843.09.
The total 5 year growth rate from 05-10 787%, from 07-12 1096%, 09-14 669%, 11-16 309%, 13-18 252%, 15-20 218%, 16-21 186%.
The 5 year average rate of growth has massively declined as we would expect, as an industry gets to a large size, it takes massive amounts of energy to keep a growth rate constant and the world just doesn’t have the net available energy to keep the growth rate high and constant.
You’re into trends Dennis, so plot the declining rate of growth projected forward please, just like you do with all your other graphs to show a possible future outcome.
Everyone promoting renewables wants to plot a constant rate of growth, not the actual declining rate of growth, because the reality of what’s happening doesn’t meld with the wishful thinking.
All numbers above from “our world in data”
https://ourworldindata.org/grapher/installed-solar-PV-capacity?tab=table&time=2016..2021
Hideaway,
If Steve wanted to talk about primary energy he should have used exajoules and it would be clearer. For wind and solar there are no thermal losses and I am using consumption in exajoules or net generation in TWh not capacity for wind and solar.
You do understand that only 40% of the energy from natural gas and about 35% of the energy from coal used in power plants gets converted to electric power, I hope.
From 2017 to 2021 there was an increase in consumption of primary energy of 24 EJ for wind and solar. For coal and natural gas the increase from 2017 to 2021 was about 16.4 EJ, about 2/3 that of wind and solar. If we include all fossil fuel (oil, coal, and natural gas) the increase in primary energy consumption from 2017 to 2021 was only 11.6 EJ, less thn half the increase from wind and solar power.
For the past decade wind and solar have grown at an average rate of 16.9% per year. It may slow down, but the very rapid growth of solar power may keep the overall rate high.
My expectation is a future growth rate of about 16.5% per year for wind and solar from 2022 to 2032. If we assume electricity output grows at 2.5% per year after 2021, then by 2032 about 70% of total World electricity generation will come from non-fossil fuel (renewables including hydro and nuclear power) if we assume no growth in hydro or nuclear power output from 2021 level.
Chart for wind and solar in TWh using natural log to look at average annual growth rate.
Dennis you were asked for a graph of the growth rate over time, projected forward according to your constant 14% per annum increase not the natural log of growth rate of the past, just the simple growth rate.
Yes, the natural log of the past with a declining growth rate will show a straight line, but you were talking about a constant growth rate projected forward, which will turn up as an exponential line on a natural log chart.
How about you show the future of you own prediction on a natural log going forward at a standard 14% as you stated?? It will look very different to what has happened in the past, then explain why you think it will be so different, and how it can be so different, given the limits of energy and debt to build all the new mines and factories needed to build it all..
Coal and gas are used for a lot more than just electricity production. We have an entire system that could not have grown to build the factories that make the solar panels if coal and gas production had not grown.
You can’t just wish all the new mines and factories into existence that make all the new growth expected for solar, wind or nuclear. It all has to be built with fossil fuels first, so the correct comparison is the absolute increase in renewables compared to the absolute increase in fossil fuels during the same period. You are only duping yourself to believe otherwise..
The simple fact that renewables and nuclear all need subsidies (including in the market rules of going first) and tax incentives to build and grow, while fossil fuels pay royalties and get taxed heavily tells those paying attention the EROEI is much better for fossil fuels overall.
Hideaway,
No the EROI needs to be compared at point of use, when that is done the EROI of wind and solar is better than that of fossil fuel, when we look at the total social cost including externalities the social cost of wind and solar are much lower than that of fossil fuel, fossil fuels should pay a carbon tax when they are consumed and if they did the subsidies would not be necessary, this would be the best policy, but in many nations this is not the path chosen and direct subsidies are chosen instead for EVs, wind and solar.
A carbon fee and dividend policy might be even better than a simple carbon tax.
For recent work on EROI see
https://www.mdpi.com/2071-1050/14/12/7098
Note that Murphy has published several papers with Charles Hall such as
https://www.mdpi.com/2071-1050/3/10/1888
OFM , ” The countries that are faced with importing gas and oil are going to be going with electric vehicles, heat pumps, etc, a good bit faster than most people in the ff industries expect. ”
Yeah , how about India ? 800 million ( 75% of the population ) living on 5Kg ( 10 lbs) of free wheat / rice per month . India is importing gas and oil and they will switch to EV’s ? Hold my beer . ROFL
Will be interesting to see developments in Pakistan since they´ve now also mentioned bying crude in Yuan. (But at least it gives us a hint of Vicky´s current location)
https://www.zerohedge.com/geopolitical/pakistan-wants-pay-chinese-yuan-russias-crude-oil
So yes, I read ZH once in a while to balance the main MSM stories and then try to make a personal assessment of what´s actually going on. You should all try it.
Found the following on plugging costs
https://legacy-assets.eenews.net/open_files/assets/2020/06/22/document_ew_03.pdf
Seems to suggest at least 300k per well for horizontal shale oil and gas wells, deeper wells will be more expensive and costs rise exponentially with depth.
Gerry,
You’re welcome, I agree Mike and Shallow sand would know better than me how accurate the article might be, as Mr. Shellman correctly points out, I know very little about these matters.
A new thread reporting on Non-OPEC and World oil production has been posted
https://peakoilbarrel.com/january-non-opec-oil-production-drops/
A new open thread Non-Petroleum has been posted.
https://peakoilbarrel.com/open-thread-non-petroleum-may-11-2023/