A guest post by Ovi
Below are a number of Crude plus Condensate (C + C) production charts, usually shortened to “oil”, for Non-OPEC countries. The charts are created from data provided by the EIA’s International Energy Statistics and are updated to January 2023. This is the latest and most detailed world oil production information available. Information from other sources such as OPEC, the STEO and country specific sites such as Russia, Brazil, Norway and China is used to provide a short term outlook for future output and direction for a few of these countries and the world. The US report has an expanded view beyond production by adding rig and frac spread charts.
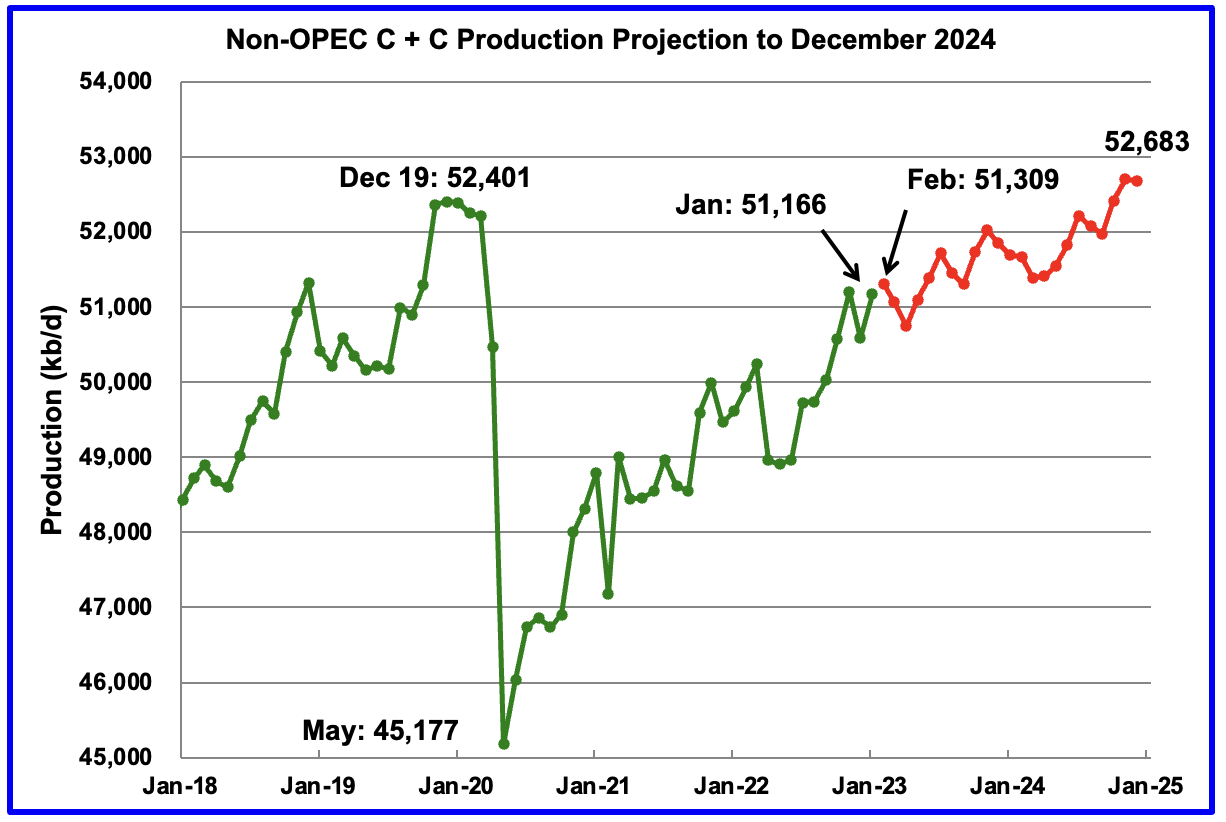
January Non-OPEC oil production increased by 583 kb/d to 51,166 kb/d. The largest increase came from the US, 347 kb/d.
Using data from the May 2023 STEO, a projection for Non-OPEC oil output was made for the period February 2023 to December 2024. (Red graph). Output is expected to reach 52,683 kb/d in December 2024, which is 282 kb/d higher than the December 2019 peak of 52,401 kb/d.
From February 2023 to December 2024, oil production in Non-OPEC countries is expected to increase by 1,374 kb/d. The major contributors are expected to be US, Canada, Norway and Guyana. Russia is expected to provide the largest drop.
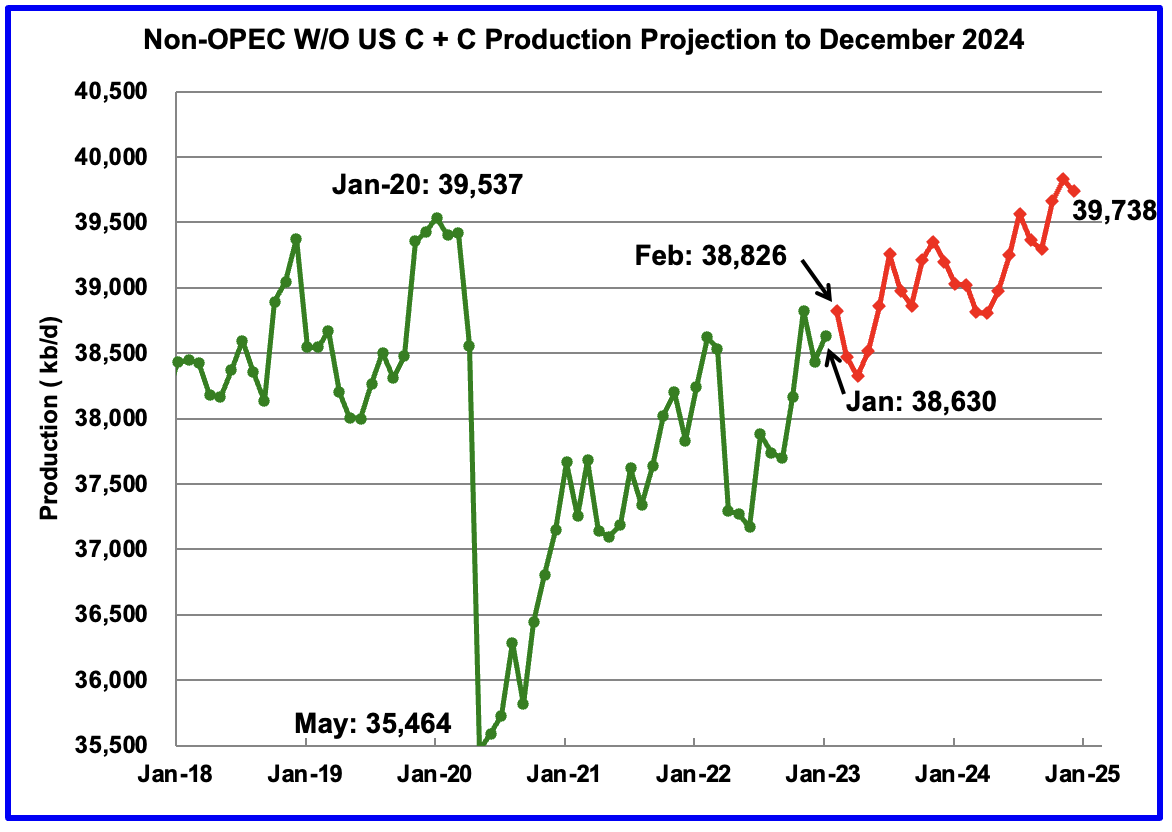
From February 2023 to December 2024, production in Non-OPEC countries W/O the US is expected to increase by 912 kb/d. This implies that 462 kb/d of the output increase seen from February 2023 to December 2024 in the previous chart is expected to come from the US.
Note that December 2024 output exceeds the pre-covid high of 39,537 kb/d in January 2020.
Non-OPEC Oil Production Ranked by Country
Listed above are the World’s 10 largest Non-OPEC producers. The criteria for inclusion in the table is that all of the countries produce more than 1,000 kb/d.
January saw a reversal of the previous months’ decrease. The January production increase for these ten Non-OPEC countries was 773 kb/d while as a whole the Non-OPEC countries saw a production increase of 583 kb/d. The trend change from decreasing supply to increasing supply is largely due to a rebound in US production along with increases from China and Brazil. The US had the largest production increase in January, 347 kb/d.
In December 2022, these 10 countries produced 83.6% of Non-OPEC oil production.
OPEC C + C production dropped by 487 kb/d in January while it increased YoY by 477 kb/d. World MoM production increased by 96 kb/d primarily due to a 202 kb/d downward revision of the previous December output from 81,775 kb/d to 81,573 kb/d. YoY output increased by 2,034 kb/d.
Non-OPEC Oil Production Charts
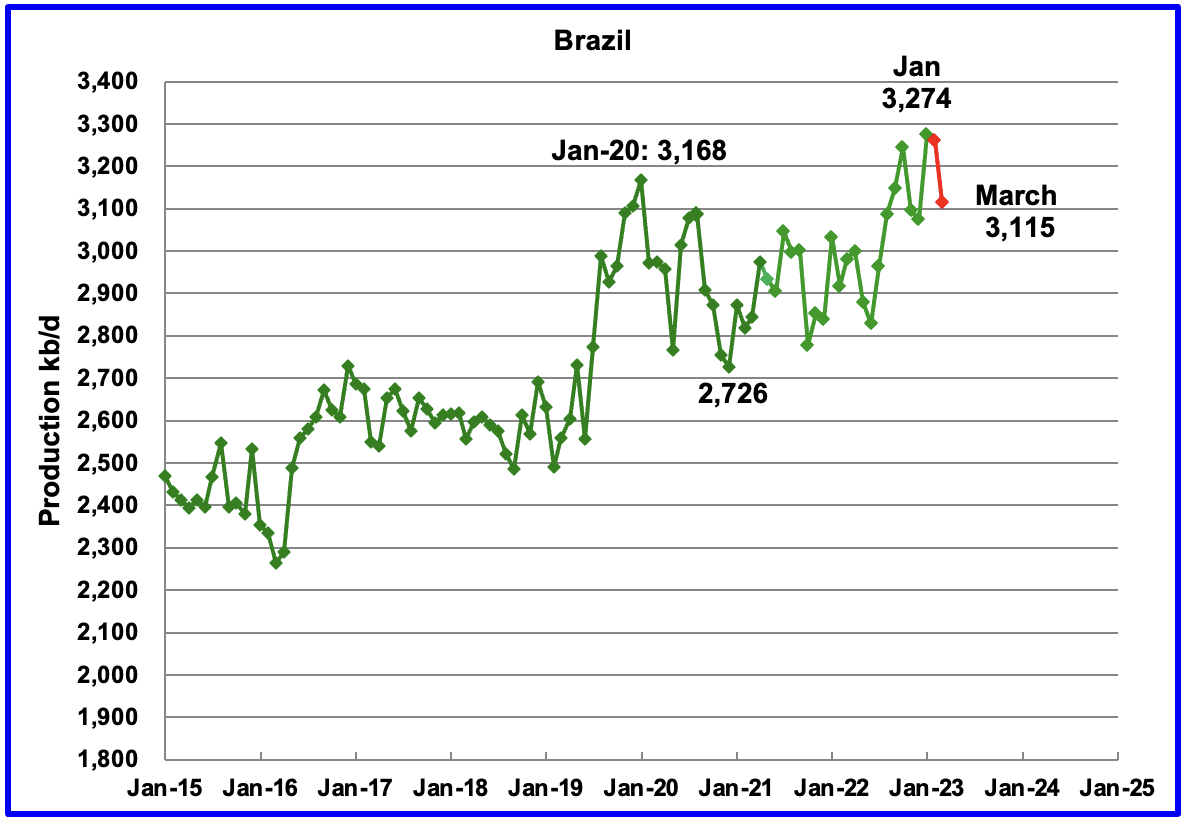
The EIA reported Brazil’s January production increased by 201 kb/d to 3,274 kb/d.
Brazil’s National Petroleum Association (BNPA) reported that February’s output decreased by 12 kb/d and March dropped further by 147 kb/d to 3,115 kb/d, red markers.
Much of Brazil’s upcoming 2023 production growth of close to 100 kb/d will be from the highly productive pre-salt fields. From Jan 2022 to January 2023, production from the pre-salt fields increased by 197 kb/d.
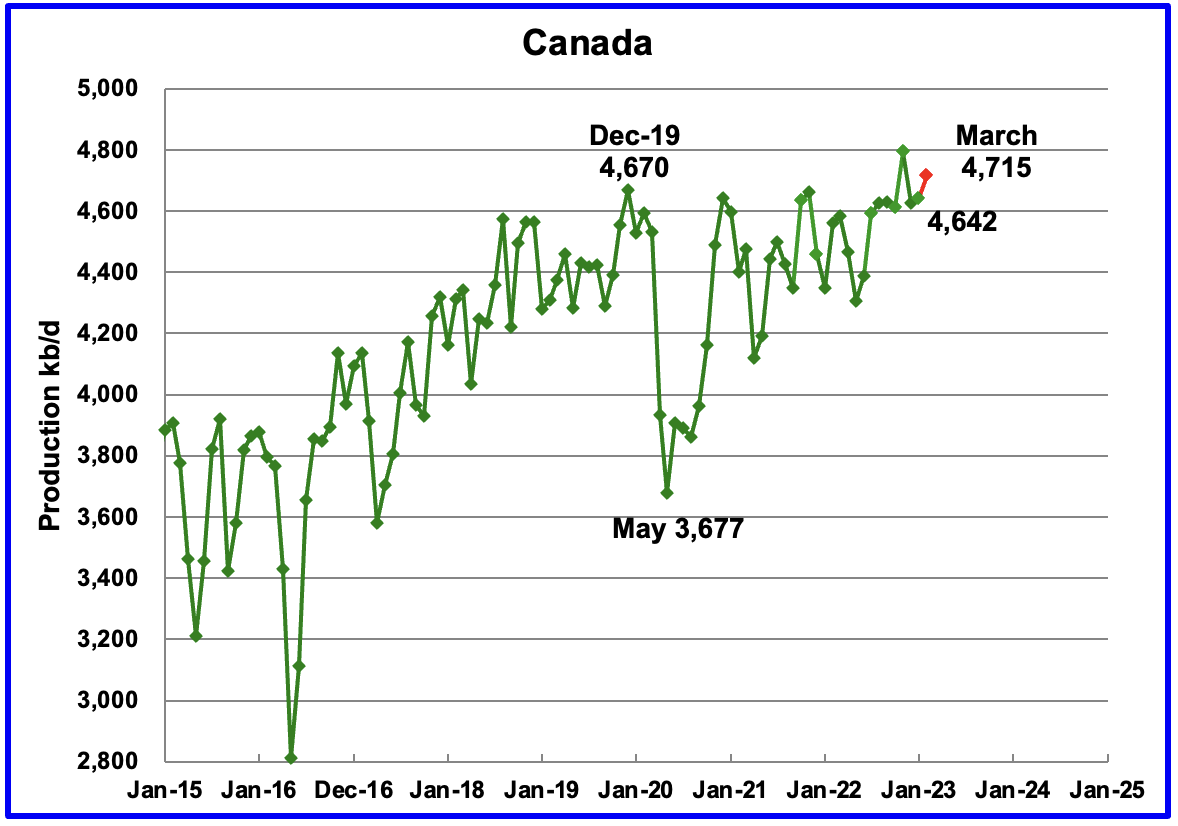
According to the EIA, Canada’s January output increased by 15 kb/d to 4,642 kb/d. Using information from the Canada Energy Regulator, February production is expected to rise by close to 73 kb/d to 4,715 kb/d, red marker. The rebound in March production is related to the extreme cold weather that affected Alberta production in December.
Rail shipments to the US in February decreased by 21 kb/d to 99 kb/d. This is the lowest rate since November 2020.
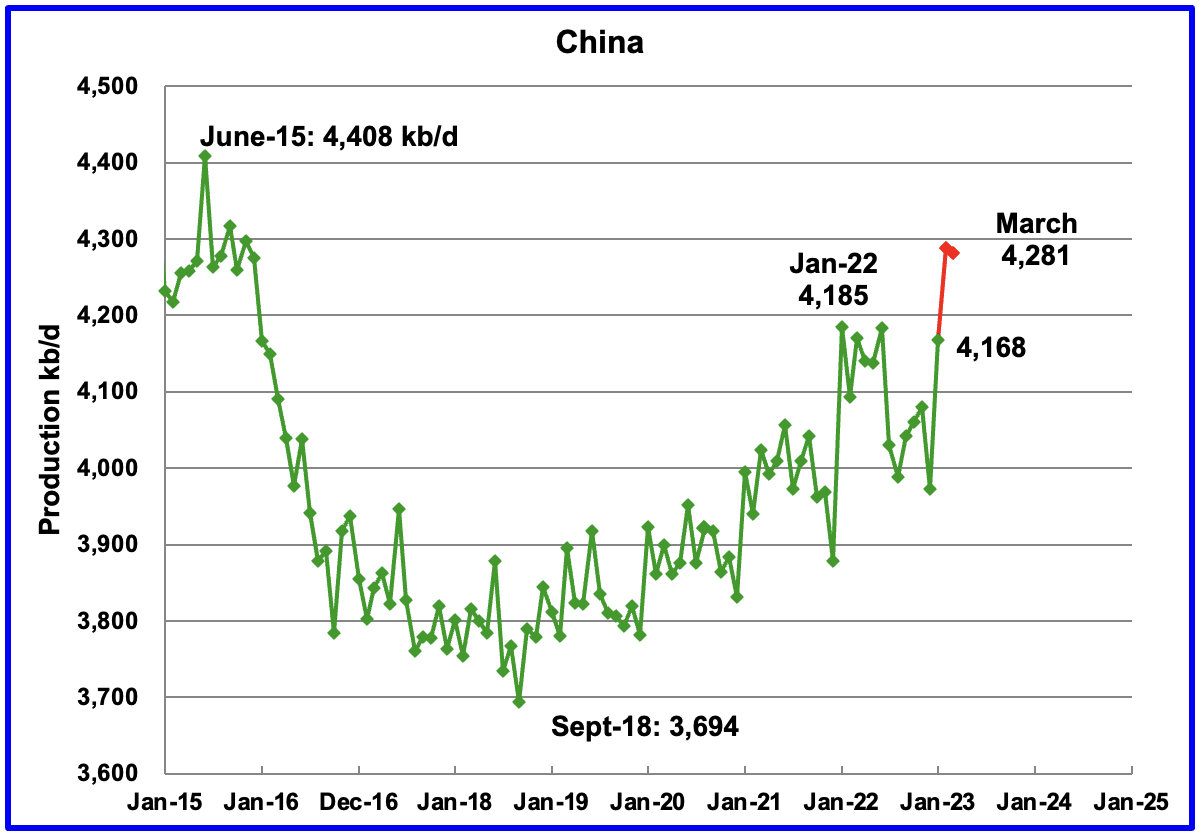
The EIA reported China’s oil output increased by 195 kb/d to 4,168 kb/d in January. The China National Bureau of Statistics reported that the average production during January and February was 4,228 kb/d, a significant increase over December.
Since the April EIA report shows that January output is 60 kb/d below the average, February’s output has been increased by 60 kb/d to 4,288 kb/d. The China National Bureau of Statistics reported that March production was 4,281 kb/d, red marker, which is consistent with February production.
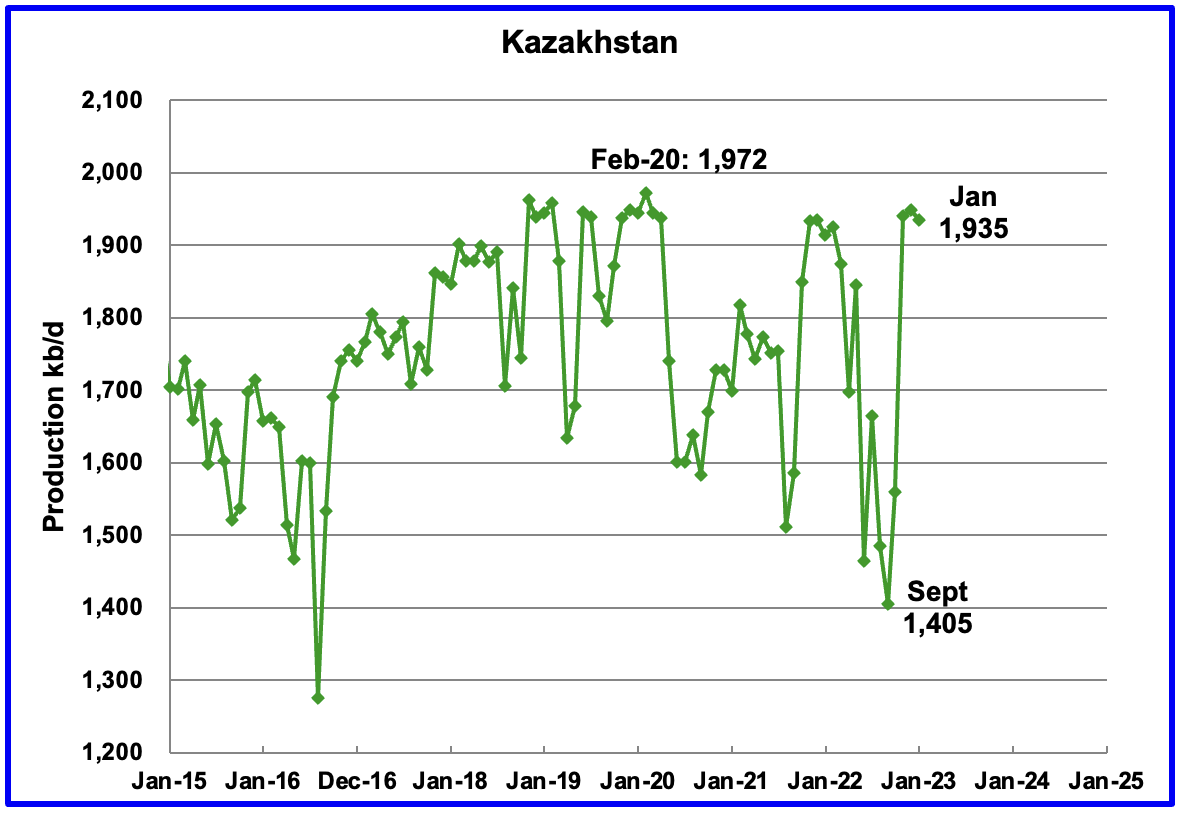
Kazakhstan’s output decreased by 13 kb/d in January to 1,935 kb/d.
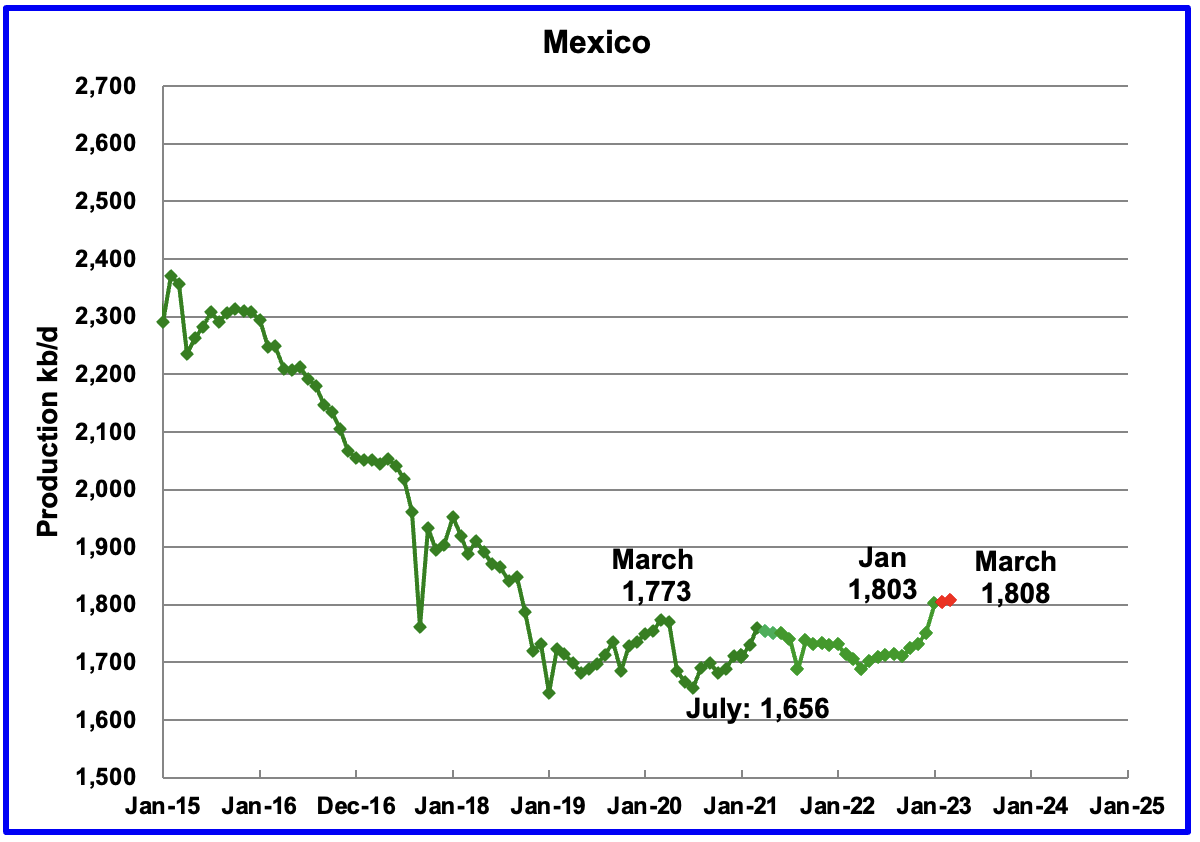
Mexico’s production as reported by the EIA for January was 1,803 kb/d an increase of 52 kb/d over December.
The February and March estimates, red markers, were obtained by using the Pemex increments over January production and adding those to the EIA’s January output because Pemex reports higher production than the EIA due to a different definition for condensate. March production increased by 5 kb/d over January.
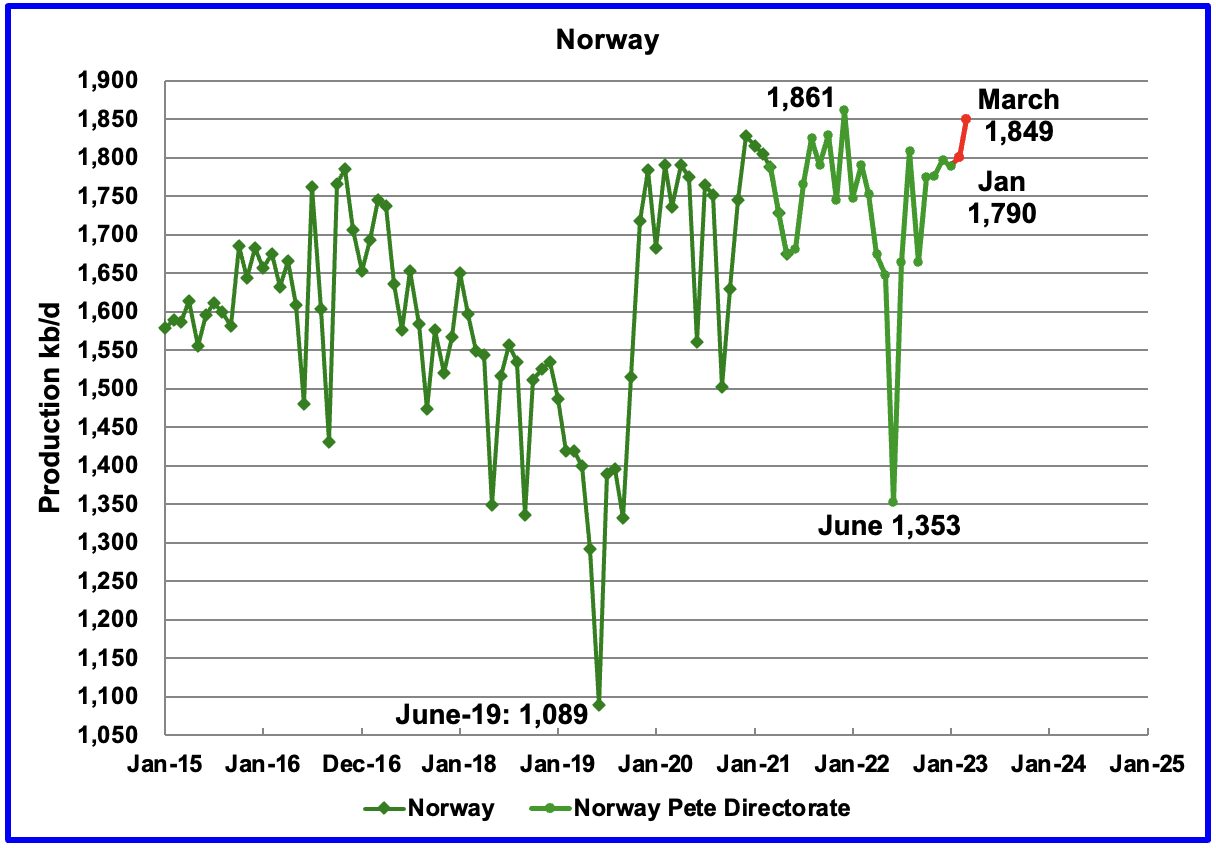
The EIA reported that Norway’s January production decreased by 7 kb/d to 1,790 kb/d.
The Norway Petroleum Directorate (NPD) reported that production in February increased by 10 kb/d to 1,800 kb/d and then increased by 49 kb/d to 1,849 kb/d in March. (Red markers).
Now that the entire Johan Sverdrup field is on stream it will be interesting to see if the December 2021 post pandemic production high of 1,861 kb/d will be exceeded in the next few months.
According to the NPD : “Oil production in March was 0.1 percent higher than the NPD’s forecast and 1.7 percent lower than the forecast so far this year.”
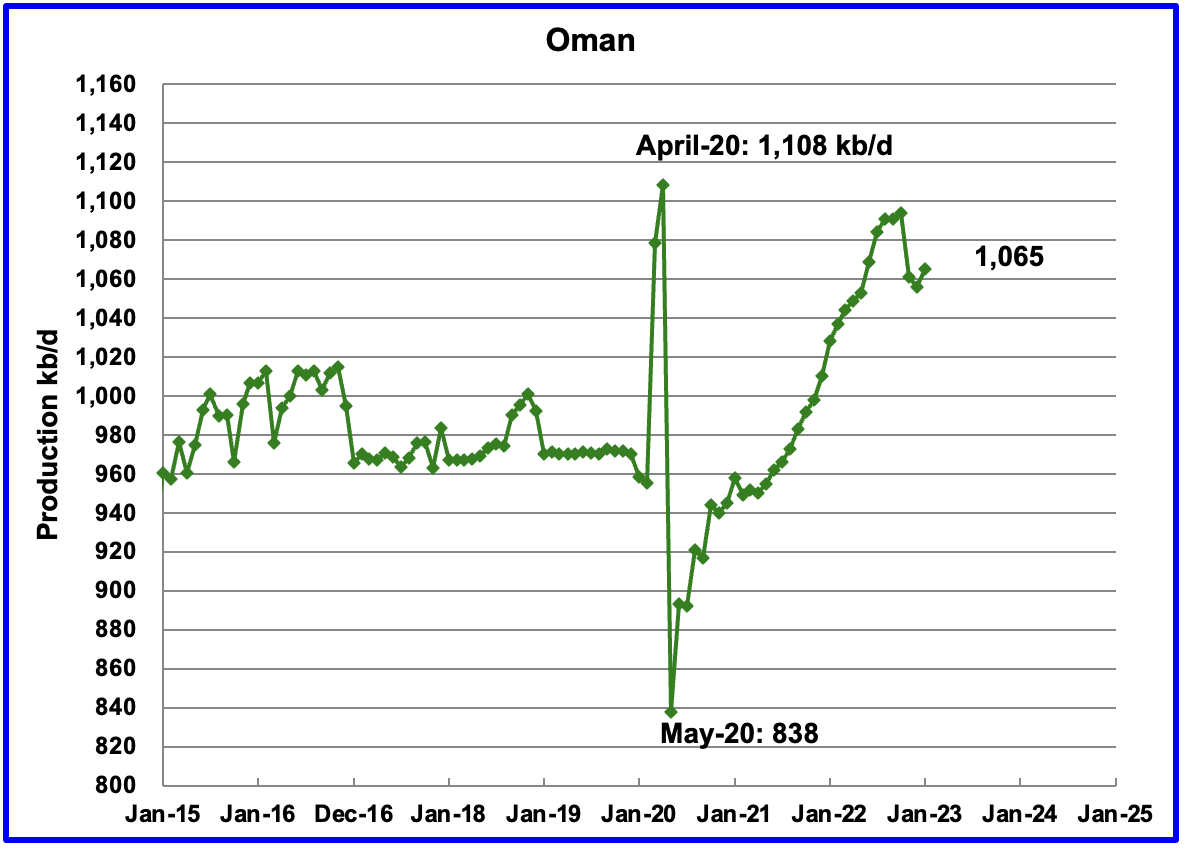
Oman’s production has risen very consistently since the low of May 2020. However Oman’s November and December production decreased by 38 kb/d to 1,056 kb/d. January may have reversed that falling trend by adding 9 kb/d to 1,065 kb/d.

January’s output was unchanged at 1,322 kb/d. I assume the EIA is not getting monthly updated production information. I also note that the OPEC MOMR shows no change in production.
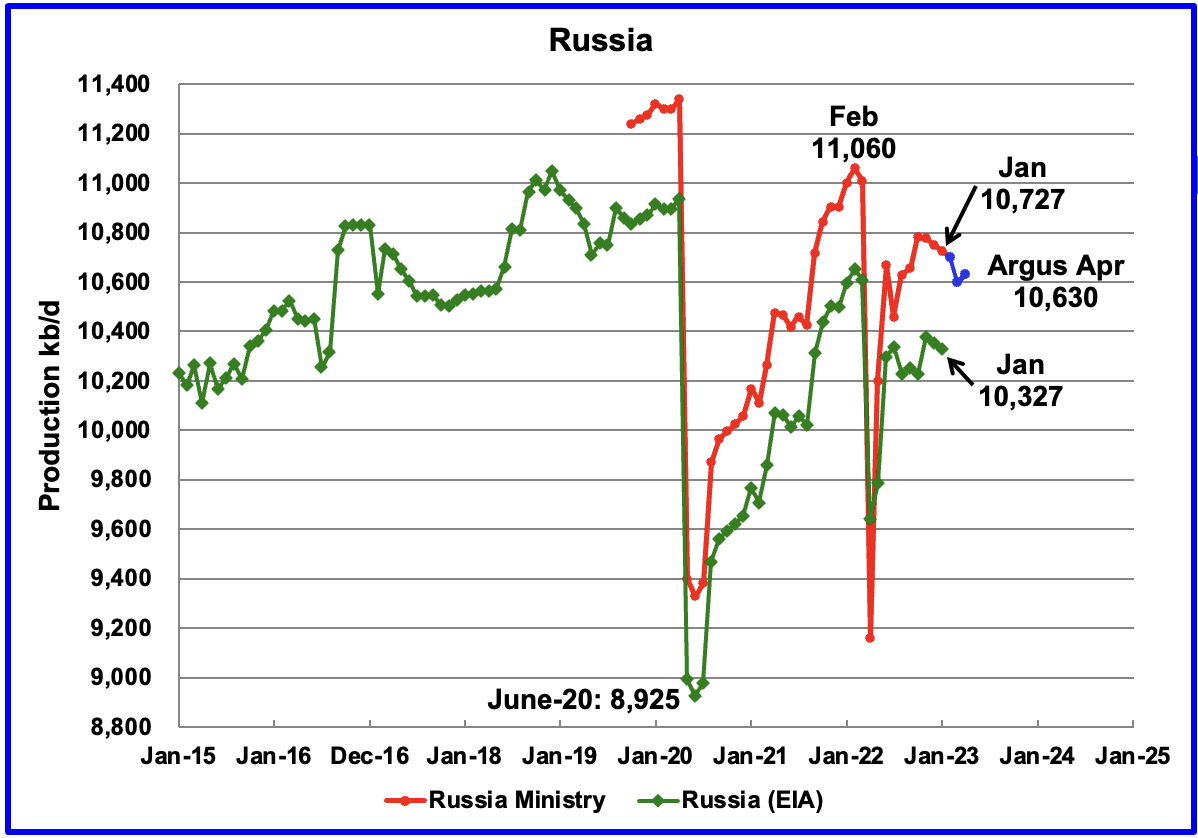
The EIA reported that Russian output decreased by 25 kb/d in January to 10,327 kb/d.
January Russia Ministry production is shown to be 10,727 kb/d based on previous Ministry data that showed Russian production as reported by Russia Energy Ministry was 400 kb/d higher than reported by the EIA.
Argus Media reported that Russian crude production in March 2023 was 9,700 kb/d, 500 kb/d lower than February. If the typical Russian monthly condensate output of 900 kb/d is added to the crude production, Russian C + C in March would be close to 10,600 kb/d, blue markers. This production level is also being reported by TASS. Note the last line “We had 10.2 mln barrels per day in February,” Novak said.”
The Argus Media May report shows that Russian April production increased by 30 kb/d to 10,630 kb/d, after allowing for 900 kb/d of condensate, blue markers.
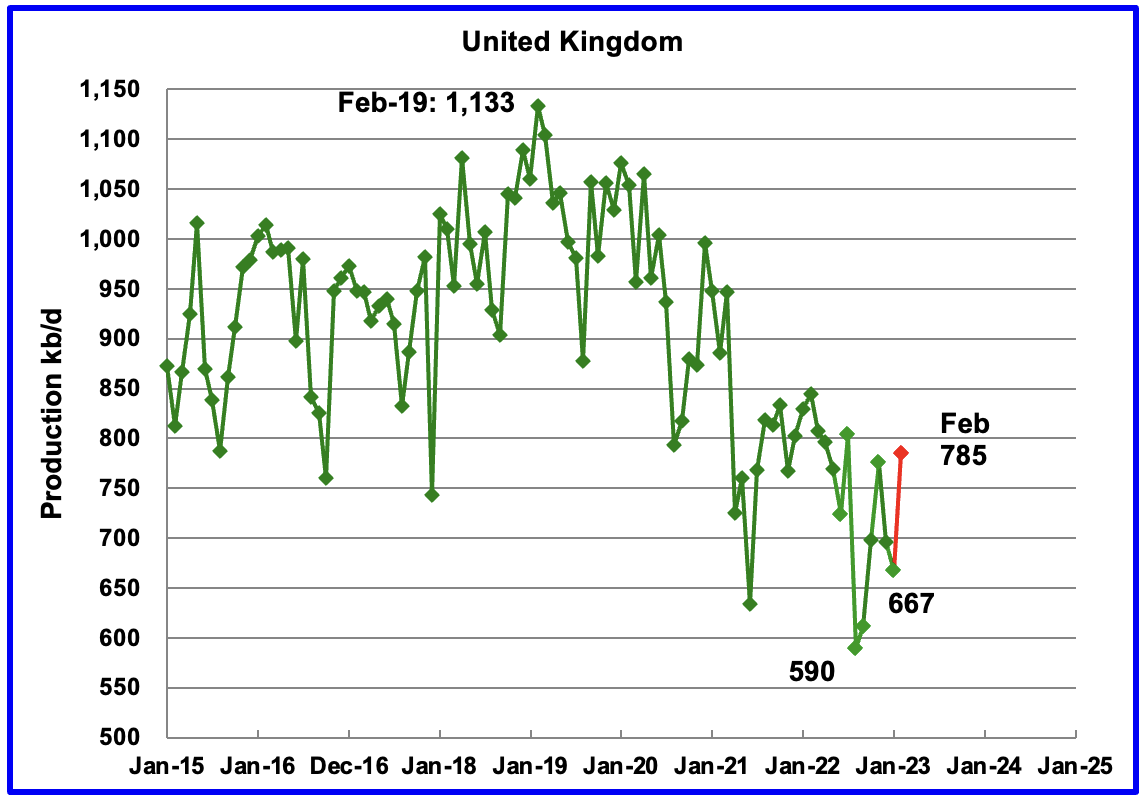
The EIA reported UK’s production decreased by 30 kb/d in January to 667 kb/d.
According to this source, February’s production rebounded to 785 kb/d, red marker.
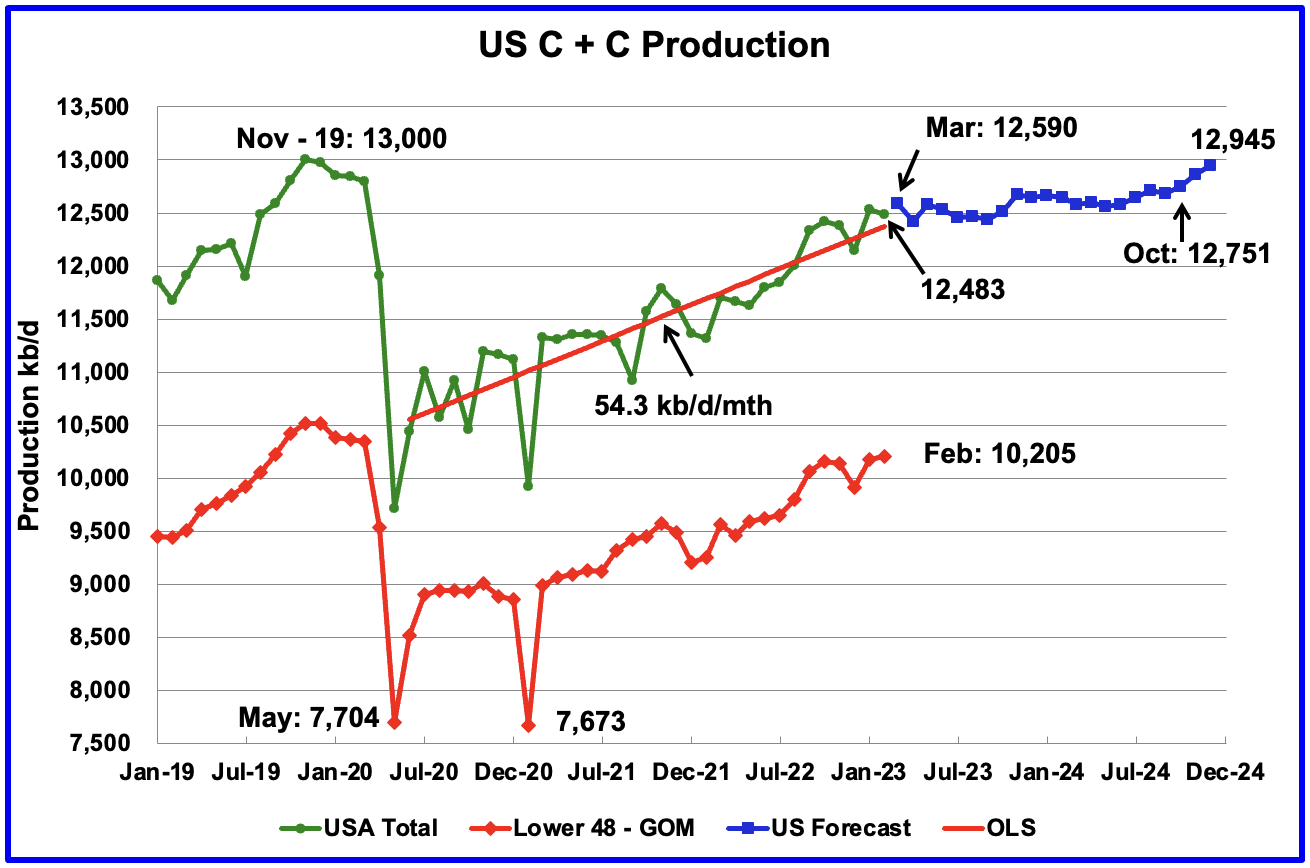
U.S. oil production in February decreased by 53 kb/d to 12,483 kb/d. The 53 kb/d drop, is due to the upward revision of January production from 12,462 kb/d to 12,536 kb/d, an increase of 74 kb/d. Output in December 2024 is expected to reach 12,945 kb/d.
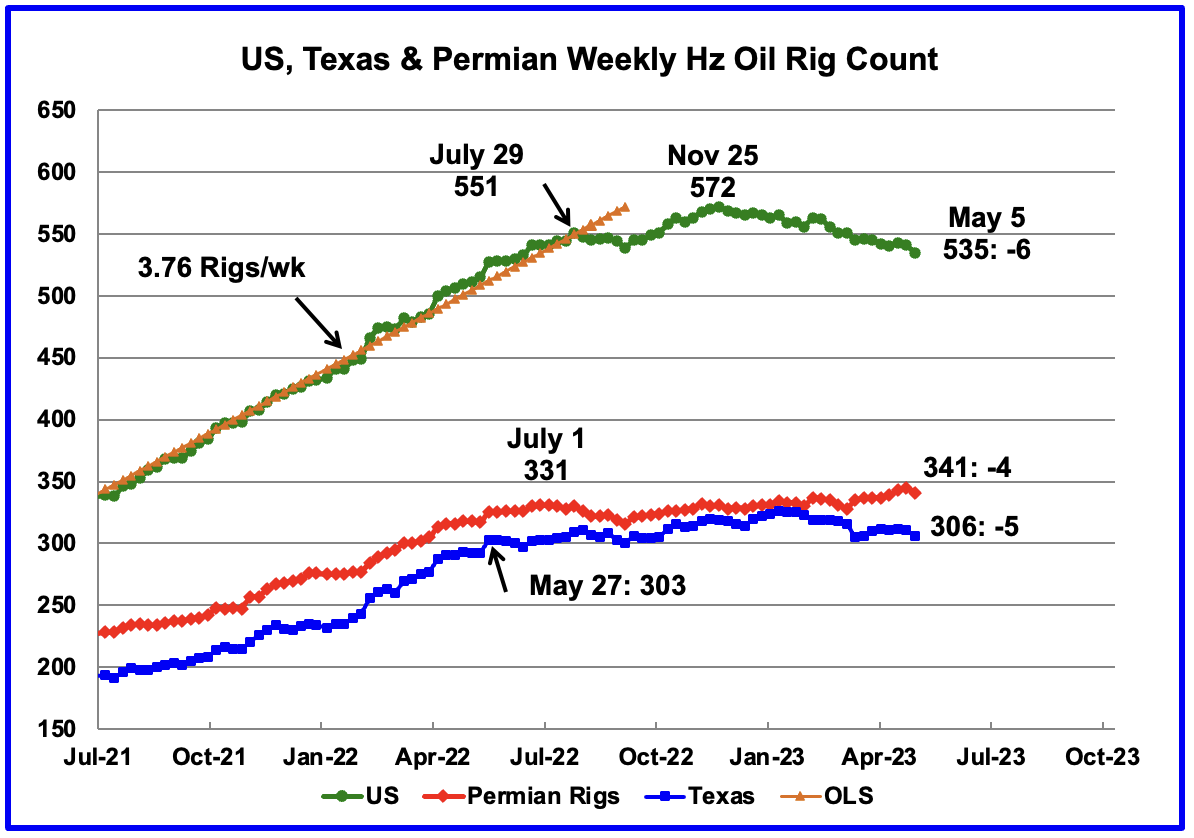
Since the beginning of April 2021 through to the week ending July 29, 2022, the US added horizontal oil rigs at a rate of close to 3.76 rigs/wk, orange OLS line, and peaked at 551 rigs in the week ending July 29. However since then the number of operational rigs has wondered primarily sideways.
A high of 572 rigs was reached in the week ending November 25, 2022. In the week ending May 5, 2023 the number of rigs decreased by 6 to 535 and are down 37 from the recent high of 572.
In the week ending May 5, Permian rigs decreased by 4 to 341 and Texas rigs dropped by 5 to 306. Note that the general trend for rigs in the Permian is a slow increase from September 2022 and is currently 10 higher than the 331 rigs on July 1, 2022.
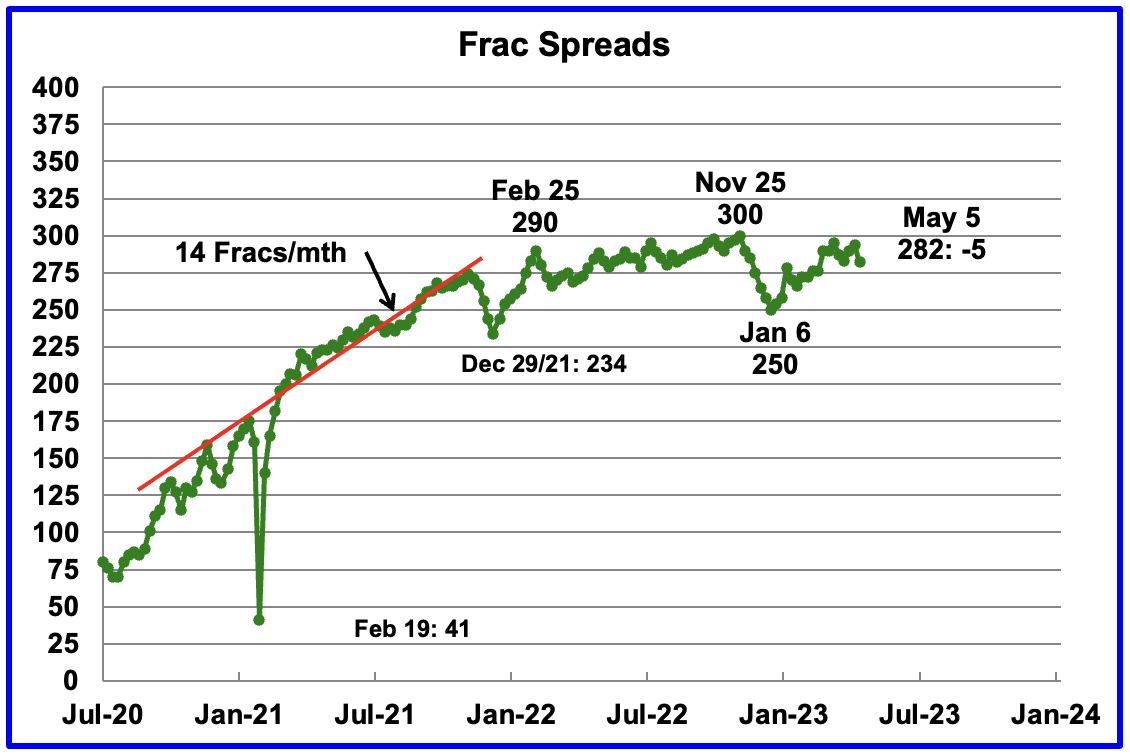
For frac spreads, the general trend since the week of January 6, 2023 can best be described as recovering from the slow down associated with the 2022 Thanksgiving and Christmas holidays. This trend is a repeat of what happened last year. However there is one difference. Last year the recovery took place over 9 weeks while this year it has taken 17 weeks so far and has still not fully recovered to 300 frac spreads.
For the week ending May 5, the Frac count decreased by 5 to 282. Note that these 282 frac spreads include both gas and oil spreads.
This interesting comment appeared in this North Dakota source regarding the availability of Frac crews: “Well completions rose in February and dropped in March due to volatility in the availability of fracking crews, Helms added.” Is this shortage a North Dakota issue or does it also apply in the Permian?
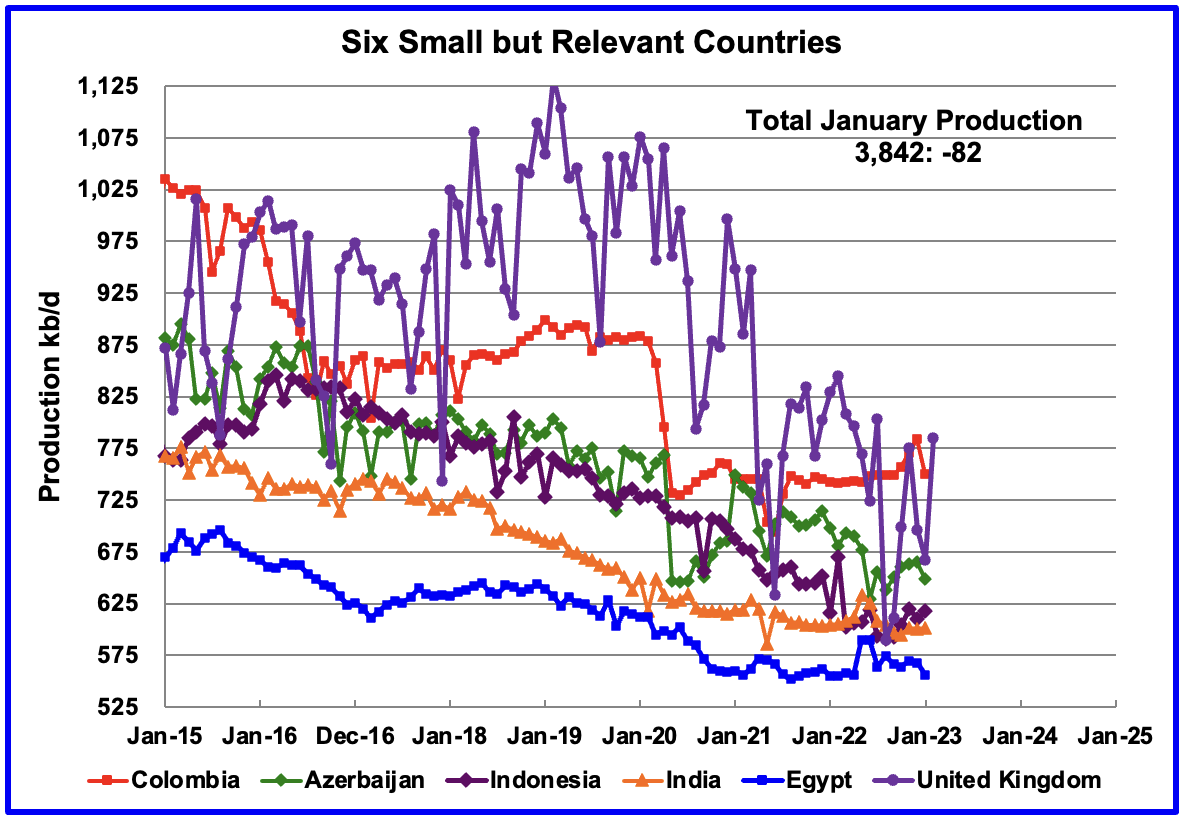
These six countries complete the list of Non-OPEC countries with annual production between 500 kb/d and 1,000 kb/d. Note that the UK has been added to this list since its production has been below 1,000 kb/d since 2020.
Their combined January production was 3,842 kb/d, down 82 kb/d from December.
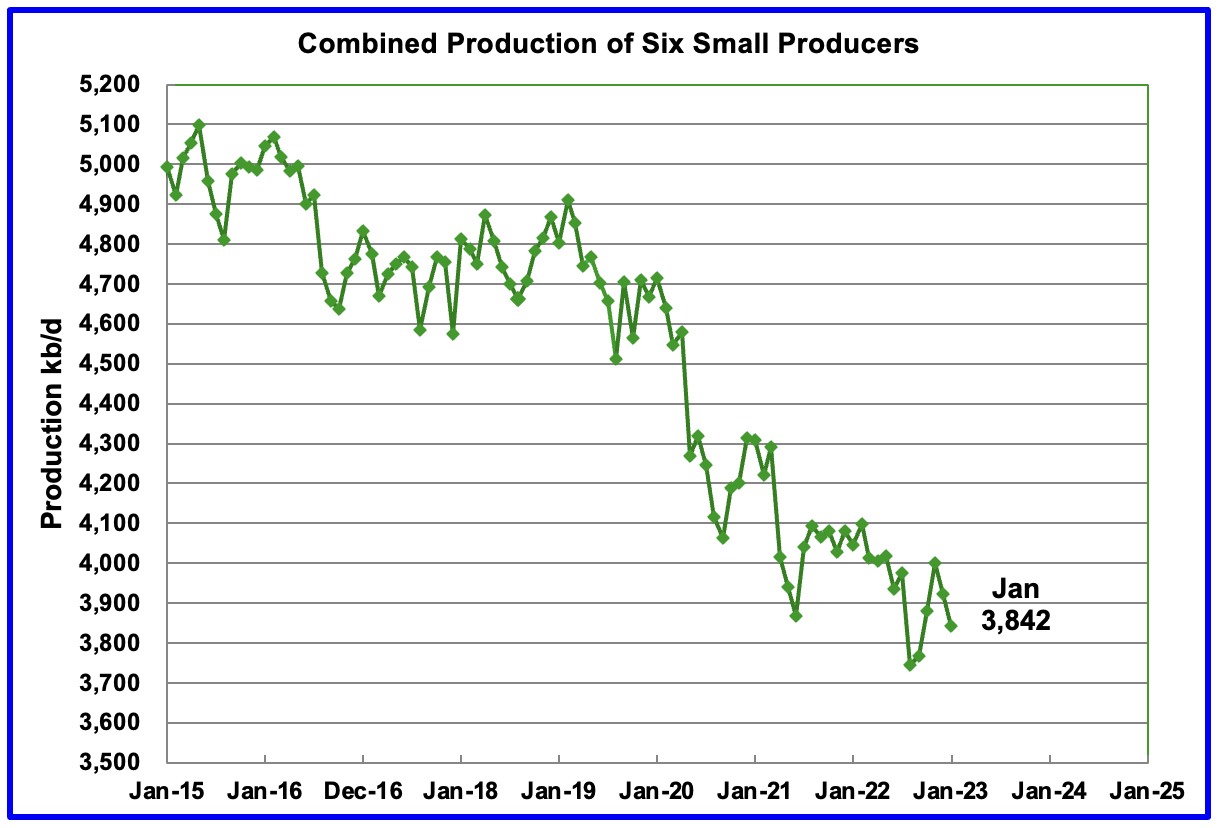
The overall output from the above six countries has been in a slow steady decline since 2014 and appears to have accelerated after 2019.
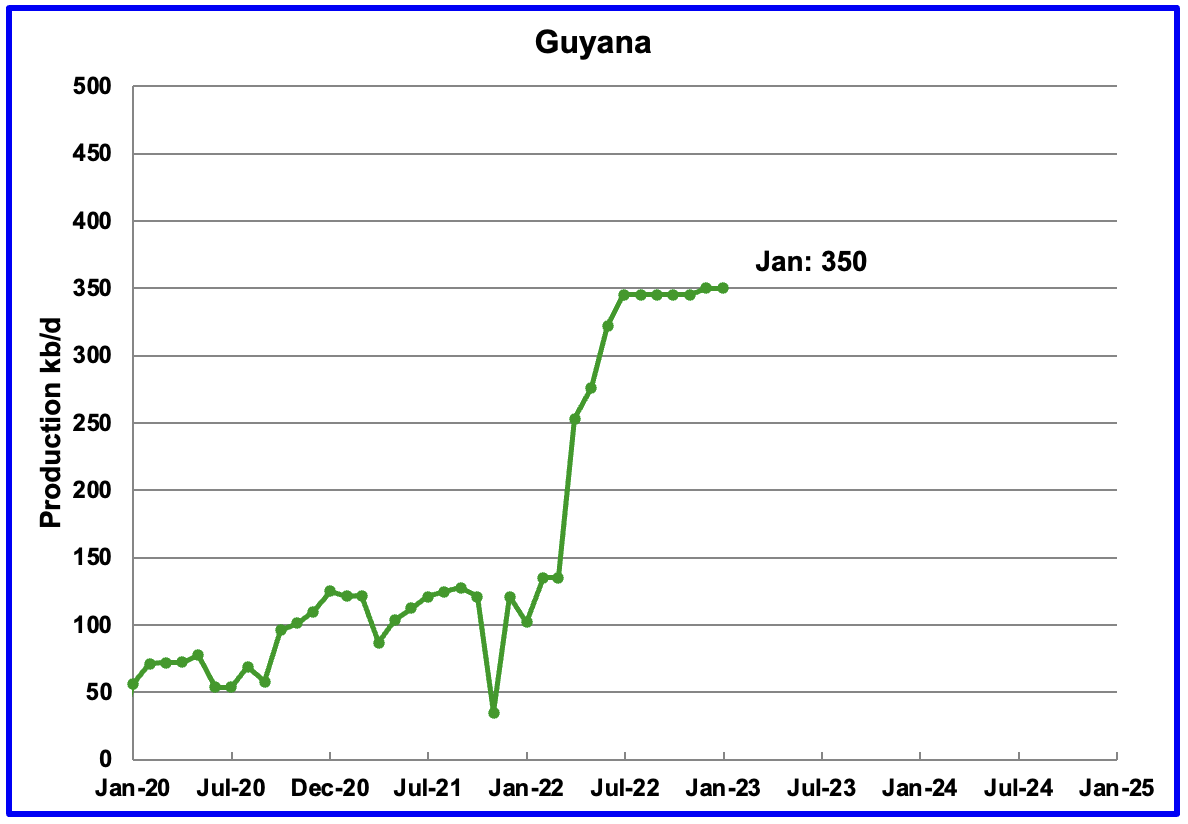
Normally the Non-OPEC post does not track Guyana on a monthly basis because its production is less than 500 kb/d. However in the comments under the first chart, Guyana is mentioned as one country that will contribute to the increase in Non-OPEC production over the next few years.
This chart provides an update on where Guyana’s current oil production is on its expected production goal of 1,200 kb/d by 2027.
The EIA reports that Guyana was producing 350 kb/d of oil in January 2023 and it has been flat since July 2022. The Guyana Ministry of Natural Resources is reporting that as of March 31, 2023 production had reached a daily rate 395 kb/d, see next chart. This production was coming from two currently operational Floating Production Storage and Offloading (FPSOs) vessels. More FPSOs are being built to increase production.
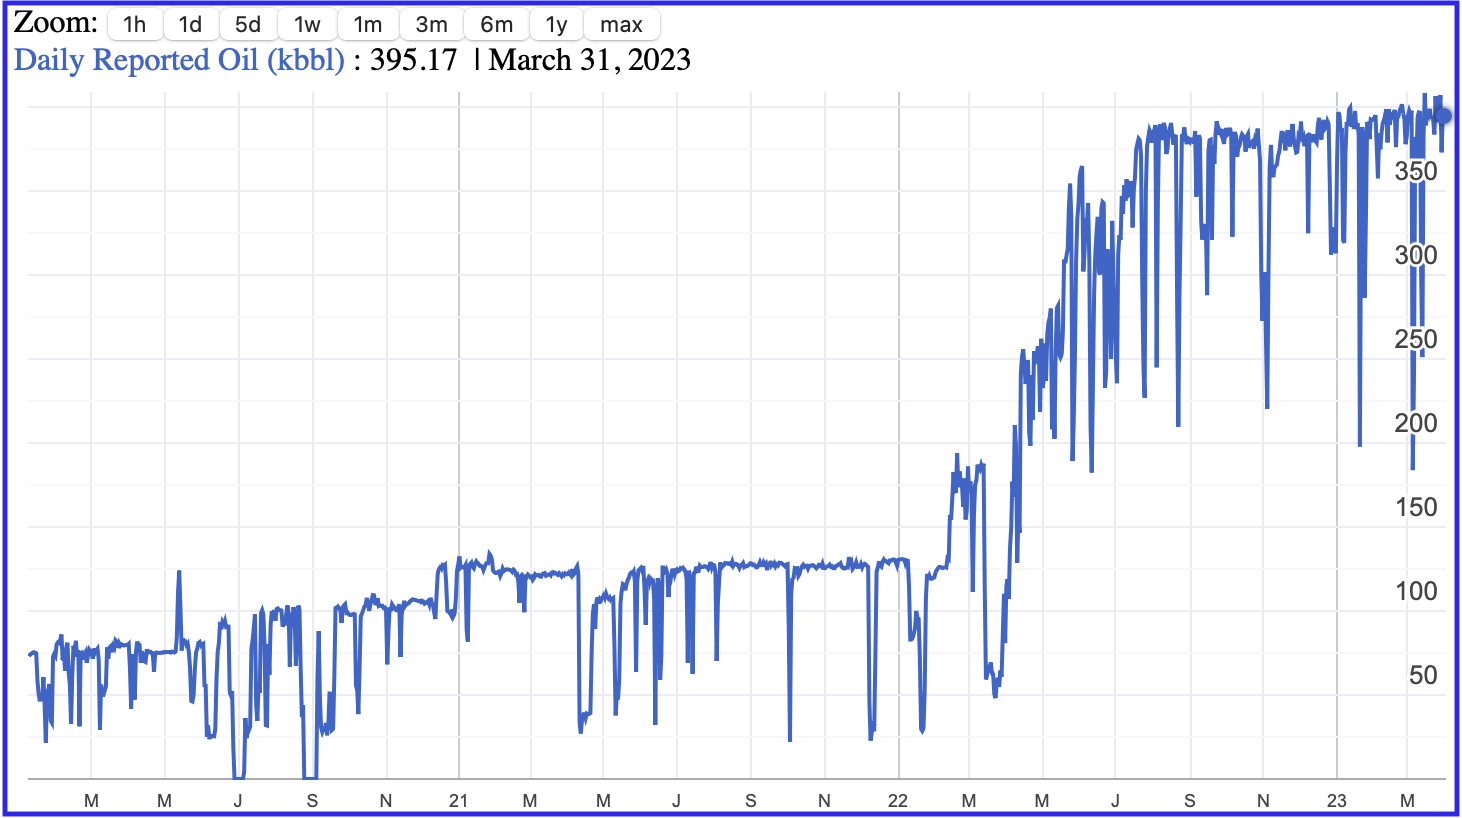
This is a one year chart from the Guyana Ministry of Natural Resources which shows how oil production has been ramping up since early 2022. Production on March 31 was 395.2 kb/d.
Can someone provide an explanation for what causes the temporary sharp drops in oil production?
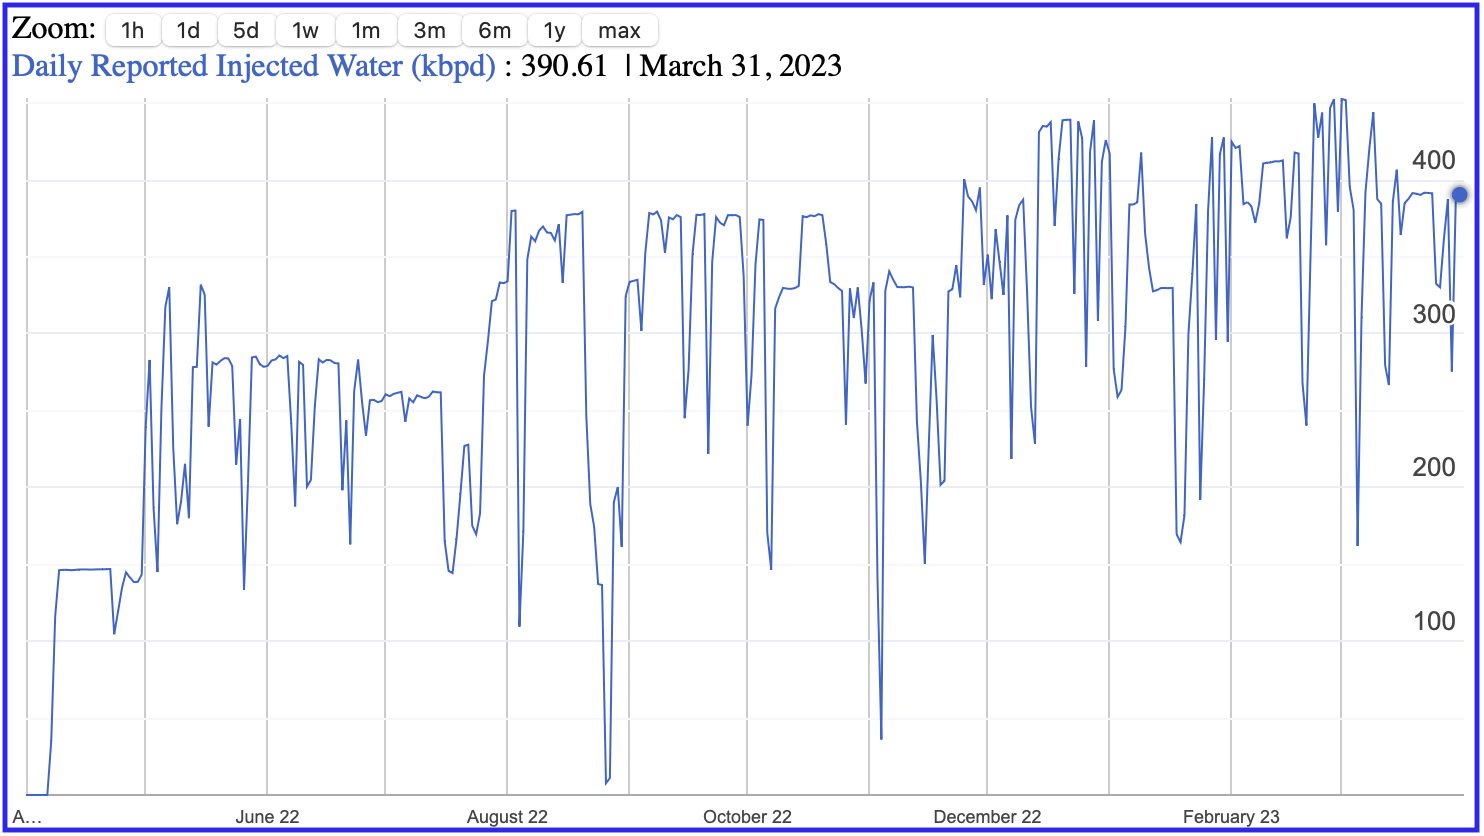
This is a one year chart from the Guyana Ministry of Natural Resources which shows how water injection is being used to pump oil and maintain reservoir pressure. On March 31, 2023, 390.6 kb/d of water were being injected to produce 395.2 kb/d of oil.
World Oil Production Ranked by Country
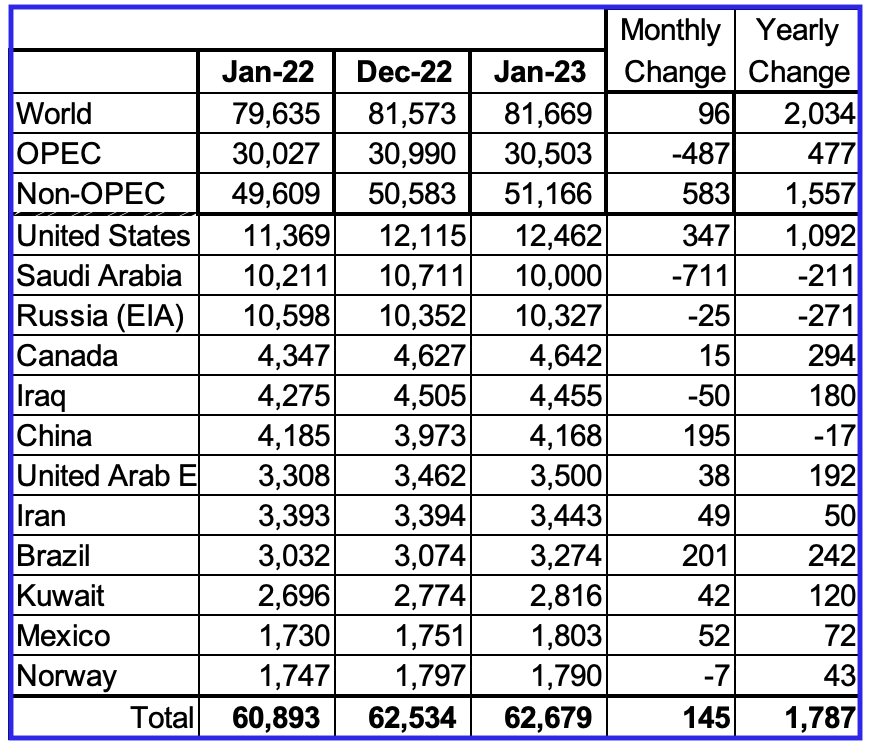
Above are listed the World’s 12th largest oil producers. In January 2022, these 12 countries produced 76.7% of the world’s oil. On a MoM basis, production increased by 145 kb/d while on a YoY basis, production increased by 1,787 kb/d.
World oil production increased by 96 kb/d in January. The largest increases came from the US, 347 kb/d while China and Brazil added a combined increase of 396 kb/d. These two combined increases of 743 kb/d were offset by Saudi Arabia’s 711 kb/d drop.
World Oil Production Projection
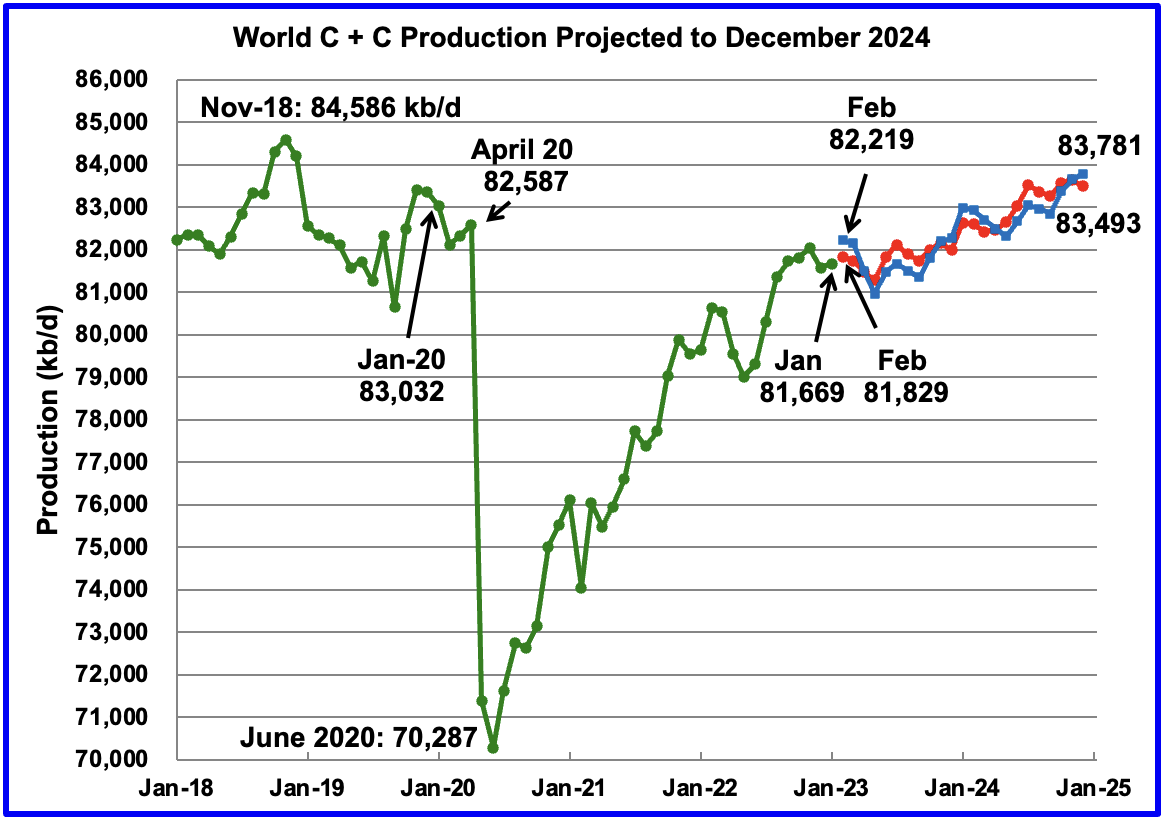
World oil production in January increased by 96 kb/d to 81,669 kb/d according to the EIA (Green graph). However, the increase was primarily due to a 202 kb/d downward revision of the previous December’s output from 81,775 kb/d to 81,573 kb/d. February output is expected to add 160 kb/d to 81,829 kb/d.
This chart also projects World C + C production out to December 2024. It uses the May 2023 STEO report along with the International Energy Statistics to make the projection. (Red markers).
The red graph forecasts that World crude production in December 2024 will be 83,493 kb/d. The Blue graph adds another correction factor into the red forecast.
In Brazil, the months from May to October report high ethanol production, which adds to Brazil’s all liquids output. The blue graph reflects the additional correction factor required to correct for the high ethanol output. As can be seen, the blue graph is projecting additional production of 290 kb/d for February output over the red graph. This will be checked in the next post to see which one is more accurate.
Note that the December 2024 production is getting closer to the November 2018 high of 84,586 kb/d.
Also note the production spike between December 2023 and January 2024 is OPEC’s re-introduction of a production increase of 1,000 kb/d to partially reverse some of the previous production cuts.
The big drop in the blue graph from March to May may be due to the second round of OPEC + cuts.
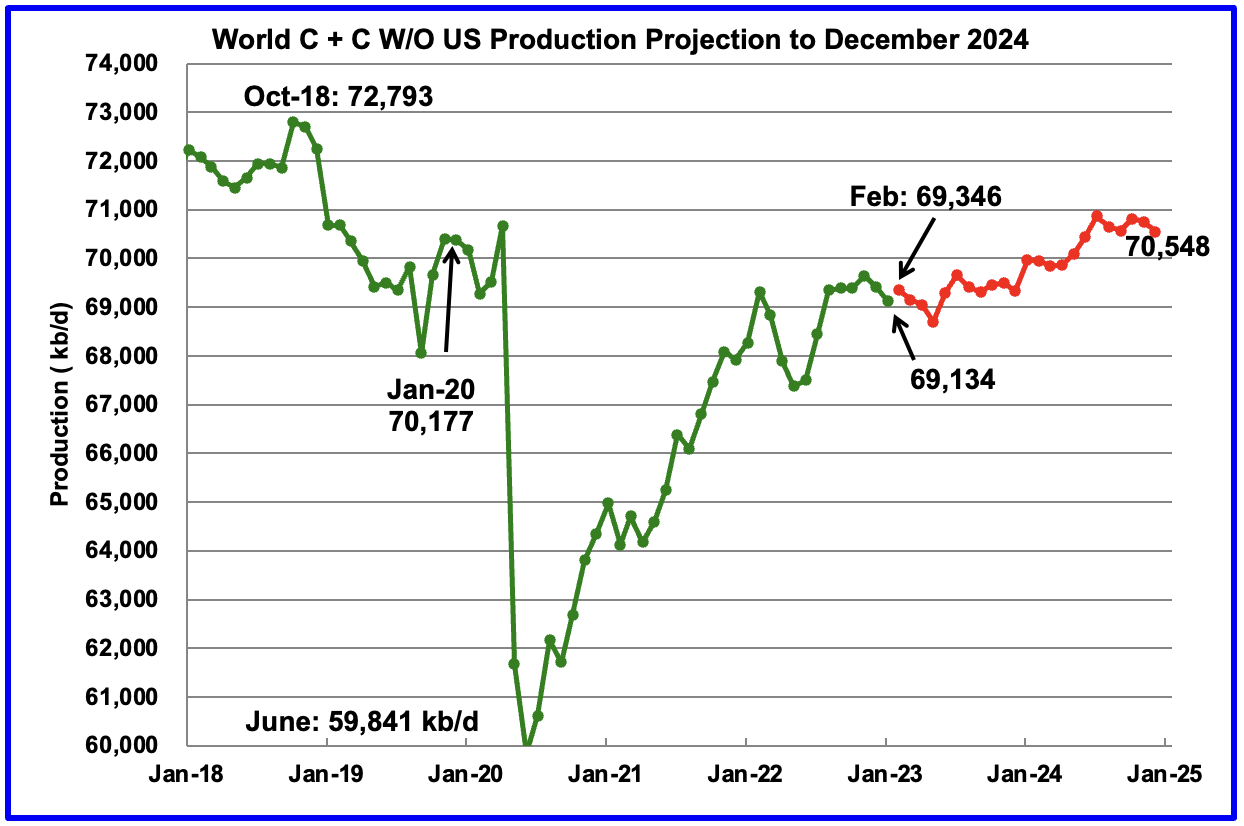
World without the US oil output in January decreased by 291 kb/d to 69,134 kb/d. February’s output is expected to increase by 212 kb/d to 69,346 kb/d. December 2024 output of 70,548 kb/d is 2,245 kb/d lower than October 2018 output of 72,793 kb/d.
World oil production W/O the U.S. from January 2022 to December 2024 is forecast to increase by a total of 1,202 kb/d. In January 2024, OPEC is expected to add 1,000 kb/d.
143 responses to “January Non-OPEC Oil Production Drops”
thanks Ovi
2 reasons I can think of for the short-term production drops at the Guyana FPSOs : either some facility related glitch (these are new facilities, and there can be a lot of kinks to work out, and also they are doing water injection and there can be a lot of issues with that), or maybe they are shutting in individual wells to get pressure build-up data. I suspect all their wells have down hole pressure gauges, and when they shut in a well, they analyze the pressure data response during the shut-in to observes how quickly the reservoir pressure builds up. This can tell them a lot about well connectivity, and how well connected their producers are to their injectors.
Great analysis, Mr. Meltz. Thank you!
Bob Metz
Thanks for the possible explanations.
Here is some other background info. that may be relevant. Mature FPSOs typically have availabilities of only around 93% so would be offline for a couple of days a month on average, but most of tat would be during long turn arounds of a few weeks every few years. However for new start-ups it’s usual to plan for around 60-80% or so in the first few months, e.g. in scheduling cargo transfers and sales, to allow for unplanned maintenance as failures of components follow bathtub curves. For a new province like Guyana with unproven supply chains and newly trained operators it might be at the lower end. I seem to remember ExxonMobil took over operating one FPSO from SBM at some point, which may indicate it wasn’t happy with the performance (e.g. too many shutdowns). In addition there are usually regulatory requirements to check well safety systems once a month or so that would cause some disruption in production. In early operation there may also be a need to shutdown to tie in new wells (but I have no idea if that applies here).
Thanks Forbin
Much appreciated.
Adding one month to these eight year charts is almost the equivalent of watching grass grow. Regardless it is a topic that requires watching.
Here is what the World’s top 11 C+C producers have done since 2013. They are down by 454,000 barrels per day since the world peak in November 2018.
Here is what the World’s bottom 78 C+C producers have done since 2013. They are down by 2,540,000 barrels per day since the world peak in November 2018.
I guess that’s why output is less in Jan 2023 than in Nov 2018. If we look at 12 month average output and the EIA’s STEO forecast, they expect the 12 month average will reach a new peak in 2024. They may be too optimistic, my guess would be 2025.
Maybe Ovi can let us know what the 12 month average is for his estimates based on the STEO and International data for World C plus C are in 2024, we know the 12 month average peak for World C plus C was around 83008 kb/d in July 2018 for the centered average peak or Jan 2019 for the trailing 12 month average peak.
Dennis, the STEO, like the Drilling Productivity Report, is not worth a bucket of warm spit.
That being said, the two charts I posted does not make a prediction. They just state what the date of the peak was so far. That peak may be surpassed but I seriously doubt it. The bottom 78 will continue to decline so the top 11 must make up that difference, plus the almost half a million bp/d they are down. That don’t look like a promising scenario.
Dennis
Attached is what you were requesting, along with a bonus. I have used the trailing twelve month average to provide data right up to December 2024.
I did not realize the STEO was higher in December 2024 than November 2018. I think it is due to the growth rate in liquids production being greater than crude plus condensate.
The month to month real gap, December 2024 to November 2018 is 1092 kb/d. The twelve month trailing gap December 2024 to January 2019 is -43 kb/d. In other words the December 2024 trailing month average is 43 kb/d higher than January 2019.
So now the discussion begins, which is more relevant, yearly average or monthly.
I have added an OLS from August 2022 to December 2024. The slope is 927 kb/d/yr. IMHO I think that is a bit high for beyond 2024. I think the slope will shallow after 2024.
Ovi,
For me the yearly average has always been more important than a single month’s output. Thanks for the chart.
I agree output will increase more slowly after 2024.
Dennis
The monthly data reflects surge capacity while the yearly average reflects sustainable long term production.
Ovi,
I agree, it is the second that is of greater importance in my opinion.
Reading the STEO prediction, the bottom line is that further production growth requires OPEC to raise its production.
Were OPEC to maintain its cuts, 2018 record would remain unbeaten.
Ovi,
My guess for World output below. Change in output in kb/d YOY from 2023 to 2028 is 959, 698, 1074, 601, 445, 168.
I need to revise this though, the tight oil part of the model has not been updated lately.
Updated scenario, peak in 2030 vs 2028 in previous scenario.
Dennis, you have 2023 at 81.64. January production was 81.67. So are you expecting world production to pretty much flatline for the rest of the year?
Ron,
You may be right, the 2023 number might be too conservative, but we have OPEC cuts and perhaps a recession or depression coming soon, so I will stick with my current guess for now.
Dennis
Why is U so low?
Ovi,
The URR is low because I assume demand will fall after 2035 so extraction rates for conventional oil falls.
Ovi,
Extraction rates for conventional oil shown below.
Alternative shock model with extraction rates for conventional oil decreasing more slowly than previous scenario due to slow transition to electric transport. World URR for C plus C is 2980 Gb.
Permian scenario used in tight oil model for recent shock model below.
Dennis, skipping the usefulness of a model that requires seeing the future in order to predict it (Paul’s amusing explanation for it predicting peaks that didn’t happen), do your domestic scenarios (I believe utilizing USGS TRR estimates for various resources in the Permian) include any type of adjustment for the varying costs of development of that resource? Because the USGS numbers are regardless of cost, have you developed some other mechanism, analysis or assumptions to differentiate between the less costly, and the more costly, and the volumes to go with those costs? I believe we have discussed this before, and you hadn’t, was just checking in to see if your information availability has improved.
Reservegrowthrulz,
No I do not have detailed information on the costs in various subbasins or benches within the Permian basin. I simply utilize an average well cost, average operating cost, royalty and tax, and price assumptions for oil, NGL, and natural gas in my model (all in constant 2022 US$). Currently for the previous list, I use 14 million/well, $24.9/bo, 28.5%, $77/bo at wellhead, $26.95/b, and $2.5/Mcf. NGL price is 35% of wellhead oil price and I assume oil prices start to fall from $77/bo in Dec 2035 to $30/bo in Nov 2039.
For well profile I simply use basinwide averages for 2010-2012, 2013, 2014, 2015, 2016, 2017, 2018, 2019, and 2020. Beyond 2020 I assume no change in average well profile as a simplifying assumption, but obviously this will not be correct any decrease in productivity could be offset with a higher completion rate (if productivity decreases by 10% we could 10% more completions to offset, obviously profits would decrease unless oil, NGL, and natural gas prices rose to offset higher costs.
All of these future changes are impossible to predict. In the scenario above the completion rate increases from 464 wells per month in March 2023 to 560 wells per month in March 2026 the rate increases by 2 per month for 12 months and than by 3 per month until reaching 560, EUR is 436 kbo, 1994 MMcf natural gas, and 24 kb NGL for average 2020 well for model.
The model is a rough approximation, USGS mean TRR is 75 Gb for Permian basin, for ND Bakken/TF it is about 11 Gb with a likely ERR there of about 8 Gb (72.7%), for the Permian 72.7% of mean TRR would be about 54 Gb, the F95 USGS TRR estimate is about 44 Gb.
I also look at the details of the USGS estimates for various benches and assuming a 9000 foot lateral and 1320 spacing between laterals for wells completed after December 2017, I get potential well completions of 126000 total wells from Jan 2010 until end of development in Permian basin, this assumes only the most productive benches are developed (about 30 million of 50 million prospective acres are developed in this 126k well scenario), I assume the less productive benches will not be developed.
All models of the future need to make assumptions about the future which will be wrong 100% of the time.
I have never seen any models by you, obviously you know exactly what will happen, its proprietary.
See comment below with several different Permian scenarios I have presented recently.
To Dennis:
“I have never seen any models by you, obviously you know exactly what will happen, its proprietary.”
There are no facts in the future, be it models using the best independent variable or not. As far as you not having seen at the very least the results of my models…..says who?
Reservegrowthrulz,
Says me, I have never seen any model of future output by you, or if they are out there somewhere, maybe you could provide a link. I agree there are no future facts.
Reservegrowthrulz,
Perhaps you meant the different productivity of different basins? This will affect profits and recently there has been improved reporting from Novilabs. Earlier I only had data on Spraberry, Wolfcamp and Bonespring, now the formations are divided into Wolfcamp A(XY), A, B, C, and C, and First, Second and Third Bonespring and Upper and Lower Spraberry. See chart linked below. I had earlier done some analysis with Wolfcamp, Bonespring, and Spraberry (where each was lumped together) and it was not significantly different from just taking avergae of entire basin, and didn’t seem worht the effort. Dividing further would be yet more effort, not sure how much it would affect the analysis, essentially I limit wells drilled to the better formations, fewer wells are drilled in the low productivity formations due to the oil, NGL, and natural gas price assumptions I make.
https://public.tableau.com/shared/54HP8M777?:toolbar=n&:display_count=n&:origin=viz_share_link&:embed=y
Several Permian basin scenarios with different completion rate assumptions for April 2023 to December 2040. URR range from 44 Gb (550 well low scenario) to 59 Gb (600 well) and total wells range from 107000 (44 Gb URR) to 141000 wells (59 Gb URR).
The 464 wells to 600 wells labels refers to the maximum completion rate in each scenario, the rates of increase from 464 to 550, 560, or 600 wells in the scenarios ranges from a low of 0 well per month increase to as much as 3 wells per month (560 and 550 wells, low scenarios) the 550 and 600 well per month scenarios increase at 1 well per month. The rate of decrease in completion rates varies in the various scenarios, steeper decline in output occurs when completion rate decreases more rapidly (this varies from as little as 1 per month to as much as 10 per month.)
Who will plug all this ?
https://gizmodo.com/14-000-abandoned-oil-and-gas-wells-in-the-gulf-of-mexic-1850416009
https://www.dailymail.co.uk/news/article-12062649/Fossil-fuel-fields-Turkmenistan-responsible-mind-boggling-methane-emissions.html
Digging into that 14,000 wells in the GOM – 90% or so are in shallow waters, either state waters or federal waters. Most of those are probably associated with old fields that Shell, Chevron, Exxon and others initially discovered and produced, and then sold to smaller companies. Some of the initial discoveries go back to the 1940s.
I’m very sure the majors did everything they could at the time to ensure that the small companies they sold to would be able to properly abandon those wells. But, unfortunately, to often the small companies go out of business, and the responsibility may go back to the original operators. These are called “boomerang” fields, and can be a big pain for the majors to deal with.
Oops .
For federal lands in the GOM I think P&A activity is going pretty well, with a steady decline in inactive wells. But there is probably less methane leak from these because of the safety issues, cold venting on unmanned platforms might be a bigger source.I don’t know what happened around the end of 2020, maybe some new legislation, but things picked up around then, although the trends a complicated by the Covid lockdowns and high hurricane seasons, which increased shut-ins, reduced maintenance work and led to a bump in off-line wells.
Inflation vs Deflation vs stagflation .
https://www.zerohedge.com/economics/us-import-export-prices-signal-massive-deflationary-impulse
https://www.zerohedge.com/markets/verge-deflation-china-cpi-ppi-surprise-downside-confirm-two-speed-recovery
https://www.reuters.com/markets/asia/chinas-consumer-inflation-slows-over-2-year-low-factory-gate-deflation-deepens-2023-05-11/
I’m solidly in the deflationary camp. As I know no money was printed by central banks. And interest rates don’t matter. Central banks can raise or cut all they want and it just doesn’t matter.
What matters is do you have collateral. Do you have enough collateral to roll your debts. If not we are going into major crisis. Which yield curves have been saying for over a year as collateral gets repriced.
4 week t-bills at 5.68% while 10 year bonds at 3.46%. 220 basis points of inversion.
All is well though says Jamie Diamond and Jerome Powell. Where in the hell is Texas tea when I need to make fun of him?
HHH,
The 4 week yield has spiked because the market is not convinced a deal will be reached on the debt ceiling.
I tend to agree with the market in this case, and if the default on US debt occurs your depression scenario seems pretty likely, recovery from that shock to the global finacial system may take several years.
Deflation would be the default case for such a scenario. I didn’t think this would have happened, but the difficulty McCarthy had securing the Speaker of the House should have been a clear signal that the inmates were running the asylum.
inmates were running the asylum.
Let’s not put down inmates by comparing them to Republicans.
That is a low blow.
Ron,
Yes the Bakken and North Dakota numbers are the same from March 2022 to March 2023, so they messed up the data.
ND Monthly Oil Production Statistics
The Correct North Dakota data is finally up. North Dakota production was down 36,144 bp/d in March.
Today’s Rig and Frac Report.
Something is changing. $70 WTI just is not work or are there fewer profitable wells?
Rig count down 3. Permian rigs down 2, Texas down 2. EF up 2.
It’s surely just a typical two month delay between price drop in March, to below a marginal level for many LTO wells I’d guess, and drop in rigs (i.e. the time it takes between signing contracts and starting work, and rigs can be dropped faster than they can be added), on top of what was already a very slight downward trend. In my experience IOCs don’t respond to relatively small price fluctuations like this so I’d expect the rigs lost to be coming from small operators, maybe those which can only afford to operate one or two rigs. I’d say the only growth potential now is Bone Spring in New Mexico, everywhere else is going to see slow but accelerating decline unless there is a big price increase, which doesn’t look likely this year.
Fracs down 10 to 272. What is happening? Maybe it is fewer NG fracs because the price of NG has dropped.
I have no idea what’s going on but completions are dropping in North Dakota.
The below is from the North Dakota Director’s Cut.
Ron
I wonder if that is the result of that bad weather.
Ovi
It could be for February and March, but their weather in April was just fine.
Ron,
In the North we get mud season in Spring with the snow melt, this might not be familiar to a Southerner, but sometimes in the North the mud slows things down, sometimes moreso than snow and ice (normal levels). The high number in Feb was probably recovery from blizzard in Dec. Novilabs may have better data.
Dennis,
North Dakota actually has stringent weight restrictions (both for hauling and vehicle weight) on their unpaved roads during the spring thaw, aka mud season.
Well, we will find out when the production data for April comes in next month. Historically , February, March, and April have been just average production months in North Dakota, Sometimes up a little and sometimes down a little but nothing indicating weather related except April of 22 when they had that late season blizzard.
Ron,
You said the weather was fine, now you say there was a late season blizzard, that may be fine weather in Alabama, not so much where I live (unless I happen to be at a ski area, then blizzards are fun.)
Dennis, I said they had a late season blizzare in April of 22. Their weather in April 23 was just fine.
Sorry Ron,
Missed that.
U.S. Shale Gas Industry OPEC Type Cut For DUMMIES…
Well, if the data is accurate, the U.S. Shale Gas Industry just cut 10% of its Drilling Rigs in one week.
This should do wonders for the Natgas price in 2-4 weeks.
OPEC… Eat Ya Heart Out…
steve
Steve
The NG Hz rig count has been pretty flat since the beginning of the year. The left column is the first week in March. Hz rigs dropped by 13 last week,
This may also account for the drop in frac spreads over the past few weeks.
Data hounds rely too much on data without knowing what it means. They scoff and ridicule anecdotal evidence from the field and what today’s data means, tomorrow. Data hounds tend to ignore perception, and insight, or what the past shows us the future will be. They ignore instinct because they have no experience. Data hounds are narrow minded, but bless ’em, that’s all they got. And, I hope everybody is sitting down, data is skewed, manipulated, faked, delayed, accelerated and deeply distorted for political reasons.
The definition of gas wells v. oil wells have been altered in the past decade or so for US tax reasons. Betcha didn’t know that, did you? HZ rig counts v. oil rig counts is meaningless unless you are very basin specific, even bench specific.
One of the many fallacies in suggesting, then modeling, that higher oil prices will result in more oil supply is where this supply will come from. In boundary defined, tight oil shale container’s, GOR matters way more than people predicted. Because they didn’t know any better. We started with 80% liquids in tight oil plays, now we’re down to less than 50% liquids. And those liquids don’t even meet the definition of oil, or condensate. If you have to model and predict future oil production from tight oil basins you should be focusing on associated gas prices, and NGL prices, not WTI. Thats dumb.
Rigs will be going to the barn all summer, or should be, save OPM and bonds, because Waha is in the toilet and NGL’s are down 55%. Nobody needs that shit, they need OIL!!!!! Oil is where the money is. You data hounds are focused on the wrong thing.
Past results are not indicative of future performance.
I ordered meat and potato’s . Got served mostly potato’s . Where is the meat ?
Mike “One of the many fallacies in suggesting, then modeling, that higher oil prices will result in more oil supply is where this supply will come from. ” True , you cannot bring onto market what does not exist . Rice prices are up 20% but no supplies ,
Thanks Mike,
I use oil, NGL, and natural gas prices in my models, of course we don’t know what future prices will be, we can only guess. The future will always be different from the past, that’s a given.
I agree any model of the future will always be wrong, 100% of the time. One possible future out of an infinite set of possibilities will always have that result. Yes data can be manipulated and only industry insiders would know about all the ways and reasons why.
Any discussion would probably be best in the non petroleum thread………
But some oil and gas people who follow this site don’t read that.
https://pv-magazine-usa.com/2023/05/12/wind-and-solar-energy-saved-texans-11-billion-in-2022/
So far as I can tell, the numbers given are at least in the ballpark, and might be more or less on the money.
Two cents or so saved per kilowatt hour across the entire state adds up to one hell of a lot of money, proving the argument that wind and solar power are no brainer investments on the basis of dollars and cents alone.
From article
The base calculation for these conclusions hinges on the idea that wind and solar energy, requiring no additional operating costs, induce high-priced power plants to shut down.
Sure strip away manufacturing installation and replacement cost very rosy indeed.
JT,
Compare electricity cost in Florida and Texas, you will find it is cheaper in Texas, most electric power in FL comes from natural gas and in Texas they have much higher share of power output from wind and solar.
If the Texas legislators are successful in increasing the share of power provided by natural gas, it will mean higher power prices for Texans.
Dennis
The only way Solar and Wind are cheaper is ignoring the subsidies which make every other generation more expensive. Which includes prioritizing renewable generation. On top of that the renewable crowd refuses to include manufacturing installations maintenance and replacement in their numbers because if they did it would blow a hole in their narrative.
Art Explains it
https://m.youtube.com/watch?v=B-3i5qDVN1E&pp=ygUKYXJ0IEJlcm1hbg%3D%3D
Back atcha JT
At first they told us we could never have over ten percent wind and solar on the grid. Then fifteen, then twenty, and now that it’s forty or fifty percent , OR MORE, in a lot of places, we don’t hear that old argument anymore.
And then we were told we couldn’t save anything on fuel, because the ff plant operators had to maintain a hot spinning reserve equal to wind and solar input. That was true at one time, very early on, but we kept hearing it as a lie, for at least a decade after that……. but now we don’t hear that old lie anymore.
And now you’re telling us that wind and solar power only work because of subsidies. That was true a couple of decades back, and maybe even a decade back in a lot of cases.
It’s not true anymore. We still hear it, but not even half as often as we did three or four years ago, and within another two or three years…… it will generally be recognized as a lie by the public, and FF shills will have to come up with another talking point.
What you are conveniently avoiding is discussing HOW MUCH MONEY the electricity industry SAVEs by not buying natural gas to generate the fourteen percent or so of ALL THE ELECTRICITY USED IN THE USA as of this year.
Or ….. to give you the benefit of the doubt….. maybe you’ve never given this any thought at all.
And another thing you are NOT TELLING us ( maybe because you don’t know about it )is that when the gas industry sells less gas, everything else held equal, the lower the price of gas.
So….. everybody in the country who uses gas, directly or indirectly, saves some money because the industries that use gas sell their products cheaper…. because of competition.
I’m a farmer, retired now. A typical American farmer spends thousands of dollars per year on nitrate fertilizers.
The price of nitrates goes up and down right along with the price of natural gas.
The less gas we use, the better for EVERYBODY….. except of course the people who own the gas industry, lol.
When fertilizer is cheap, food is cheaper too. I pass along my savings on fertilizer,not because I want to, but because I have to, in order to sell my production.
Now IT IS TRUE that for now and for quite some time to come, we will HAVE to maintain a certain minimum mostly idle fossil fuel generating capacity to make sure the lights stay on as we add more and more wind and solar power to the grid.
We call this peaker capacity, and it’s pretty much adequate to get the job done, and the people who own it make enough money on it to stay in business. I don’t hear about any of them selling out.
If more is needed, more will be built.
The grid regulatory authorities in various localities are totally cognizant of this obvious fact, and will make sure this capacity is available.
But there IS a catch in Texas right now. The regulators in Texas are in bed with the gas industry, and are doing all they can to make it hard to add more wind and solar power while LEGALLY MANDATING THAT NEW CAPACITY has to be dispatchable……. meaning it’s either gas or nuke.
The USUAL idea is that the regulators make sure the public gets good service at a reasonable rate, while the industry generates a steady modest but GUARANTEED profit.
Unfortunately………..
The regulators in Texas are in the vest pocket of the fossil fuel industry, peeking out like little doggies in a woman’s purse.
The Texas regulators, and Texas politicians lied their asses off about why the grid went down in Texas during the last big storm. Blamed it on wind of course.
But it went down mostly because the gas lines froze up, because they were NEVER WINTERIZED.
How do I know this is true?
The biggest newspapers in Texas told us so.
Plus the storm was even worse farther north, where there’s as much or more wind on the grid…… I didn’t hear anything about the grid going down in Oklahoma or points north because of wind farms shutting down, lol.
JT,
There are externalities to fossil fuel use, pollution and climate change being the obvious ones. Fossil fuel use gets a free ride by not paying for their damage to the environment. The subsidies for wind , solar, and EVs are simply a substitute for the carbon taxes that fossil fuels should pay to balance the damage that they do. A carbon tax would be a better policy based on neoclassical economic theory, governments choose not to implement this policy (which according to theory should be the most efficient approach) and instead choose to subsidize EVs, wind, and solar.
When looking at the cost of a good the true social cost is determined by both internal costs and external costs. Markets do not handle external costs or benefits well, only government intervention can address these to increase goods with external benefits (public roads and public health) or goods with external costs (fossil fuel combustion, etc).
https://en.wikipedia.org/wiki/Externality
JT , ” Sure strip away manufacturing installation and replacement cost very rosy indeed. ”
Reminds me of Prof. Milton Friedman economics > strip away every element that does not meet the end result .
One of his student was Ben Bernanke . Now you know why we are in an economic mess .
Let’s say I own a 1000 MW fossil fueled power plant that due to the law is in the pecking order after wind and solar. As the owner, I know that I will be running the plant throughout the year but I have no idea how much. I also know the fixed cost to staff and keep the plant in good running order. Since I have no idea how much run time the plant will have, I have no idea of the revenue will be made therefore I have no idea if I will make a profit let alone cover my costs. What a horrible business model. Rest assured this type of power delivery system adds costs the renewable camp ignor.
Ervin,
In a capitalist system there is always a risk that there will not be enough demand to sell all that is produced at a profit. Under those circumstances producers may reduce output or shut down the business entirely. This is what has been happening with many older coal fired and nuclear power plants in the US, for some older peaker natural gas plants there have also been many that have been shut down, this will continue, it is the way capitalism works. A better solution than the subsidy approach for renewables and EVs would be to institute either a carbon tax or a fee and dividend type system so that market forces could allocate resources in an efficient manner. Politicians refuse to take this approach even though nearly all economists recommend it. Not clear why.
An even better approach is a Soviet style command economy. Let the politicians pick the winners. 🤦♂️
JT,
I disagree, I prefer a market based approach with government intervention to try to solve the problem of externalities. Government planning does not work well.
Coal, wind, solar, nat gas electrical generating stations have all been subject to times of curtailment when the local is saturated with supply.
It is not the optimal condition for any of these generators, but it sure beats the alternative of simply relying on a declining (depleting) system.
Its a juggling act, to manage the grid. In the us we are very fortunate to have more than one ball.
Like stripping away the cost of having to plug your 10’s of 1,000’s of oil and gas wells from FF prices?
That is a good point,this is a form of subsidy to the fossil fuel industry, likewise the cost of roads and bridges which are not covered by fuel taxes is another subsidy for the fossil fuel industry, the climate change damages caused by fossil fuel are yet another form of subsidy for fossil fuel.
Higher fuel taxes for roads, or for fairness a tax on registered vehicles based on weight and miles travelled so that EVs don’t get a free ride along with a carbon tax on fossil fuel based on CO2 emissions per unit sold. Once these are implemented we could eliminate subsidies for PV, wind, and EVs.
“Peaking Dynamics of the Production Cycle of a Nonrenewable Resource”
https://www.mdpi.com/2071-1050/15/8/6920
An excellent post by John at OSB on the rising GOR , cost / benefit ratio and profitability .
https://www.oilystuffblog.com/forumstuff/forum-stuff/according-to-heinrich
Thank you Hole in Head/ But I want to make it clear that I was merely re-posting messages from Heinrich Leopold to me on Oily Stuff Blog.
john
Another “Limits to Growth” with some adders. Current views 785. Surprised this slipped by the goalie, but something for everyone.
https://www.youtube.com/watch?v=40AS208AkXY
Thanks Peakaboo, fantastic video. Unfortunately few people on this blog will watch it because it is too long. Most people have a very short attention span and have not the patients to watch such a long video. But this video tells it like it is even though most people simply don’t want to hear it.
Note: The video only lasts 30 minutes. The rest is question and answer.
Thanks Ron, I watched it. The energy slaves argument is compelling – fossil fuels are incredibly energy dense. But what if Dennis is right and the EROEI of renewables (solar, wind , hydro) is better than crude oil? See also Lazard’s latest LCOE analysis where nukes, coal and peaker nat gas are losers, even when RE is *unsubsidized*.
https://www.lazard.com/research-insights/2023-levelized-cost-of-energyplus/
I desperately hope Dennis is right. But not an ounce of faith that he is right. Green energy is an illusion. But I will not argue that point here. I have read books on the subject, pro and con. Read at least 100 articles on the subject, pro and con. As a result of all that reading, I come down squarely on the con side.
But for the sake of humanity, I desperately hope I am wrong.
Most people believe what they desire to believe. I cannot. I can only believe what the facts support.
But for the sake of humanity, I desperately hope I am wrong.
I couldn’t give a fuck to be honest. By in large we are one of the most vile and ignorant species that have walked on earth. Just look at our history, it isn’t anything to be proud of.
By in large every other flora and fauna will benefit from human extinction.
Whether it will happen the way Jack or other doomsters are saying, i doubt it, seriously. It too complex to predict the time and mechanics of the collapse of civilisation. Other collapses might give us a little insight but not enough.
Guy Mcpherson is calling for the end of the world in 2026, 3 years away lol. I give him credit for putting his neck on the line but come on, he is going to look quite stupid come 2027.
On a sidenote regarding the video, one of the guys asks Jack why he had kids, but got interrupted. I think it is a great question. If Jack believes all the stuff he has come up with, why did he have kids. Either he is a charlatan or an uncaring ignoramus.
For starters, humans will not go extinct. People who say humans will go extinct just don’t understand what causes a species to go extinct.
The five great extinctions were cause by natural disasters. But normal species extinction is caused by one or more other species driving them into extinction by taking over their territory and/or food supply. No other species will ever take from us what we took from them. Yes, our numbers will be greatly diminished but we will not go extinct. But our plight will cause many other species to go extinct. We will eat the songbirds out of the trees.
As to our vileness, I just don’t buy it. We are the simply the product of our heredity and environment. Children are innocent. They do not deserve to starve to death. We kill off other species because it is just our nature to do so. Our instincts evolved when we were hunter-gatherers. We evolved to survive by killing other species and taking over their territory. It’s just human nature.
Guy Mcpherson is a nut case.
Hint:
It is estimated that over 99.9% of all species that ever lived are extinct.
https://en.wikipedia.org/wiki/Extinction#:~:text=As long as species have,this varies widely between taxa.
But us humans are the exception I guess
But agree “Guy Mcpherson is a nut case”
The argument is when we go extinct, not if.
We had a close call 65000 years ago.
https://www.npr.org/sections/krulwich/2012/10/22/163397584/how-human-beings-almost-vanished-from-earth-in-70-000-b-c
Of course all species will go extinct one day. The sun will expand burn everything to a crisp.
But humans are the most adaptable species of megafauna that ever existed. But not all specis, just megafauna. Cockroaches are more adaptable to different enviornments and climates than humans. They will out survive us.
Ron-
We have only been around for 250000 years, and are vastly over populated in very stressed ecosystem, during a mass extinction (the last one was 65 million years ago).
See any problems?
Hightrekker, the last mass extinction was caused by a meteorite. This one, the sixth mass extinction, is being caused by humans. Yes, that is definitely a problem. And another problem is, no one seems to be aware of it. No one seems to care.
But humans cannot be blamed for that, it’s just in our nature. Our evolution did not condition us to look after the welfare of any species other than our own.
Well, actually evolution did not condition us to even care for the welfare of our own species, just our own tribe.
Ron,
Have you read the Murphy et all, 2022 paper? Perhaps your thinking is based on research that is out of date. On an EROI basis at point of use, wind, solar, hydro, and geothermal all have better EROI than natural gas, coal, and oil, the myth of low EROI is based on ignoring the processing and disrtibution of oil to the end user and once a comparison of oil in an ICEV to wind, solar or hydro used to power an EV the oil falls further.
No Dennis, I don’t remember any Murphey paper. Send me the link and I will read it. However my opinion is not based on any EROEI or even peak oil.
I am a little surprised that you don’t seem to remember the one thing I have been harping on ever since I started this blog in 2013. That is what humanity is doing to the ecosystem of this planet. I have posted, in perhaps a hundred posts, what is happening to the forest, seas, land, rivers, lakes, animals, and everything else. And the destruction is speeding up, not slowing down.
And the argument is, by you and all the others who things are going just fine, that renewable energy will fix things. That is totally absurd. Even if all that renewable energy is the panacea you think it is, that will just allow the destruction to continue.
Just one tiny example. 10,000 years ago, humans and their domestic animals made up less than 0.1% of the land and air vertebrate biomass of the earth. Today, humans and their domestic animals make up less than 97% of the land and air vertebrate biomass of the earth. That was what Vaclav Smil calculated around the year 2000. Our numbers have likely risen by another 1% since then.
Ron,
Yes things have changed in the past 10,000 years, and over the next 10,000 years things will also change.
https://www.mdpi.com/2071-1050/14/12/7098
I misunderstood your comment because you seemed to be responding to a comment about EROI.
I do not think things will be just fine, I believe some of the problems that will be caused by climate change can be mitigated by reducing our reliance on fossil fuel by using other sources of energy they emit fewer greenhouse gases. Human population will decrease as people choose to have fewer children, which is already occurring in much of the World, better education for girls and women and more equal rights for women increases the rate at which this occurs.
“Most people believe what they desire to believe. I cannot. I can only believe what the facts support.”
You want/desire to believe the facts.
I am the same way. Your brain rewards you with dopamine (or some other neurotransmitter) when you learn something about the world or ponder the mysteries of it.
I get rewarded when I think about evolution by natural selection, some of my friends look at me with horror if I bring it up.
The other personality types don’t get the dopamine hit from the facts. They get the dopamine hit from superstition, or relationships or fashion or status.
Everyone is just doing the same thing.
What their brain more or less requires/rewards them to do.
“For most people, all this talk of conflict with China creates concerns about the availability of cheap goods. In reality it’s the availability of cheap debt, which funds their daily life, which is far less secure as the BRICS nations opt out of the Western economic system – and which, ultimately, will redefine the lifestyle of Western citizens as their historic hegemonic control of world trade and finance collapses.”
We shall see, won’t we?
John Norris,
It is David Murphy et al (2022) that says at point of use (where the consumer uses the product) is where EROI should be measured.
Chart for thermal fuels from page 13 of 20 from link below
https://www.mdpi.com/2071-1050/14/12/7098
John Norris,
From the Murphy et al 2022 paper, EROI for different types of electricity. Note that for today’s energy mix PT eta=0.3 is most appropriate, as renewable power becomes a bigger part of the mix the PT eta moves to 0.7, details in paper.
click on chart for clear view or see section 3.2.2 from link below
https://www.mdpi.com/2071-1050/14/12/7098
Thanks for posting. Jack Alpert seems like a really sharp dude. Not sure how his predictions will turn out though, we’ll have to wait and see.
But ill bet he’ll be shocked that we’ve now made it to 8 billion+ and even though the growth rate is decreasing we are still adding about 70ish million people a year.
The Canadian Club of Rome talks keep getting doomier and gloomier, which is not surprising as virtually every new piece of relevant research is producing results that are worse than expected. Even if depletion of accessible energy doesn’t get us then the limits on mining of necessary metals and minerals will, and if not those then we’ll have exceeded eight planetary boundaries, at least four of which could end civilisation this century on their own.
Rough estimate of Permian basin GOR using Texas Railroad Commission data for Districts 7C, 8, and 8A. Data range is Jan 2016 to February 2023, last 12 months of data will likely be revised as it becomes more fully reported over time. Units for GOR are Mcf/bo. GOR=gas oil ratio.
About the price of renewables — This chart shows how high solar & wind output (green field) pushes down prices (red and blue lines) in Germany. The price even dipped below zero on May 7.
https://energy-charts.info/charts/price_spot_market/chart.htm?l=de&c=DE&interval=month
Note especially the spikes in intraday prices (blue) when solar shuts down in the evening.
ALIMBIQUATED
That’s the poster child for the disfunctional role of renewable energy. Because it operates through subsidies and carbon tax credits it can bid the market to zero. That is no strength that’s crazy town. However it’s good PR for the masses who need to hope all this investment is going to payoff when they open their electricity bill and see that they’re paying the highest rates globally for their power. The world should take notice of Germany’s wildly successful energy transition because that’s what they’re buying into.
https://www.electricrate.com/data-center/electricity-prices-by-country/
Any guesses which countries have the lowest rates and why?
JT,
One of the lowest electricity rates in the US is in Iowa, they get over 60% of their net generation of electricity from wind power. The subsidies have nothing to do with prices going to zero, the supply is high and drives prices lower, just like April 2020 in the US when oil prices fell to less than zero due to over supply.
Send your reference
JT
Electricity prices US was 12.49 cents/kWh and Iowa 9.55 cents/Kwh
https://www.eia.gov/electricity/data/browser/#/topic/7?agg=1,0&geo=g0010gh002&endsec=g&freq=A&start=2001&end=2022&ctype=linechart<ype=pin&rtype=s&maptype=0&rse=0&pin=
Net generation Iowa, all electric and wind, wind 62% of total in 2022
https://www.eia.gov/electricity/data/browser/#/topic/0?agg=2,0,1&fuel=g08&geo=00000g&sec=g&linechart=ELEC.GEN.ALL-IA-99.A&columnchart=ELEC.GEN.ALL-IA-99.A&map=ELEC.GEN.ALL-IA-99.A&freq=A&ctype=linechart<ype=pin&rtype=s&pin=&rse=0&maptype=0
Oil prices for WTI were negative on April 20, 2020
https://www.eia.gov/dnav/pet/hist/RWTCD.htm
Interesting to realize that Iowa has only built out a fraction of its wind energy potential, and close zero of the solar- reserves of which are much greater in magnitude.
JT —
Solar can bid the price of electricity to zero because it has zero marginal costs. That is independent of the “true cost” of energy.
The reason retail electricity prices are high is that the government doesn’t see any reason to reduce them. Electricity is heavily taxed, for example with a 16% VAT, 7% electricity tax, 24% local land use tax. All that comes in addition to the cost shifting to solar and wind.
Because electricity is so expensive, households and companies have invested a lot on energy conservation. As a result, Germans use a lot less electricity and thus spend a lot less on it as a percent of income than some other countries. The ideology that electricity should be cheap is just a pro-consumption, anti-investment ideology. The United States in particular is drowning in foreign debt because of this consumerist ideology.
At the wholesale level, electricity is very cheap in Germany, sometimes negative. If you make your money selling fuel, you might instinctively dislike government intervention to discourage consumption and keep wholesale prices low . But it has the net effect of shifting outlays from consumption to investment, and makes lots of sense in a country that is a net importer of energy.
Some time ago I had posted this graph on copper inventory as per GS . Mr B has a new post ” The copper conundrum .” 10 min read . Many issues seldom thought of .
https://thehonestsorcerer.medium.com/the-copper-conundrum-3b98704602c8
From HiH’s ref: Simon Michaux, who has a degree in physics, geology and mining engineering says: “We are not mining with solar panels and wind turbines… and when we do, shit’s gonna get real.”
We are still pumping oil from wells that were dug in the 1860’s. When the peak hit in 2019 or is going to hit again in 2032, the world is not immediately going to run out of diesel. Crude oil is going to be around for at least another 2 centuries or more. It will not be in the quantities we have today but someone will be able to refine oil from stripper wells.
I generally agree with The Honest Sorcerer “B”, as he appears to be someone that has been coming to grips with the predicament of civilization over the last couple of years.
Unfortunately the figures he uses for the USGS copper reserves are way out of kilter with reality. It’s not B’s fault, it is the USGS that keeps giving false reserve numbers, which is easily provable. In Australia for example they include 89Mt, 10% of world reserves. The little number 7 next to this claim leads to a statement that JORC compliant reserves for Australia are 23Mt. In other words 75% of Australia’s reserves don’t exist.
So where did the USGS get the 89Mt number from? This I followed down the rabbit hole. They include all the resources of the giant BHP owned Olympic Dam deposit as reserves, even though most are just known resources that will never be mined. BHP currently mine around 200,000t/a from an underground mine at Olympic Dam, using around a 2% grade of copper. They have been losing money on the operation for the last 15 years. The capital expenditures to maintain the mine have been greater than the cashflows from operation over the last 15 years by close to $A2B in total.
BHP back in the 2005-7 period came up with a plan to turn the underground mine into an open pit. They would have to dig the largest hole in the world to do so. The ore body lies from 350m to over 1300m deep and covers an area of 5KM X 3km in size. They would have to remove something like 16 Billion tonnes of waste and cart it several kilometers just to get to the top of the ore body. When fuel prices spiked in 2006-8 the plan was shelved. The average grade of the ore resources is 0.6%, of which they have over 60Mt of copper in the 10B tonnes of resource.
Considering they can’t make money on the 2% grade, the 0.6% grade is never going to be mined, yet the USGS counts this low grade resource, from 350m to 1300m deep as reserves. Reserves by definition are the economic part of resources, yet the USGS didn’t bother to look at what is economic.
A similar example resides in Chile, with the giant Escondida mine (BHP 57% ownership), though Escondida is profitable. They mined an average grade of 0.8% in 2022, the 27 Billion tonnes of remaining resources grades at 0.52%. The actual reserves are about 5Bt at 0.7%, yet the USGS counts the entire low grade stuff as reserves.
Take the 5Bt of reserves out of the 27Bt of resources and the remaining resources falls below 0.5% and probably not mineable.
We can take the USGS reserves numbers as fake hopium, because they do not reflect reality. In both Olympic Dam and Escondida all the heavy lifting and moving of rock is done with fossil fuels, from the explosives to break up the rock to the giant excavators and mining trucks. There are no plans to change any of this.
The only way to turn most of the low grade resources into reserves, is with sustained much higher prices for copper, relative to everything else, which of course would scuttle the thought of cheap renewables that take massive amounts of copper to build.
Hideaway,
USGS gives resources not reserves, only the EIA and BOEM for GOM gives reserve estimates.
Dennis, have a look for yourself, the 890Mt number from USGS is reserves, as quoted by “B”….
https://pubs.usgs.gov/periodicals/mcs2023/mcs2023-copper.pdf
on pg 2…
Hideway,
You are correct these are reserve estimates, my mistake.
See following document Appendix C, part B where they explain the Australian estimate.
https://pubs.usgs.gov/periodicals/mcs2023/mcs2023-appendixes.pdf
From that document:
Accessible Economic Demonstrated Resources represent the resources within the EDR category that are accessible for mining. Reserves for Australia in the Mineral Commodity Summaries 2023 are Accessible EDR. For more information, see table 3 in “Australia’s Identified Mineral Resources 2021” (https://doi.org/10.11636/1327-1466.2021).
And if the price of copper doubles, the world economy will still purchase it. Its very useful.
But I do not want to belittle a critical point that this copper story exemplifies-
Affordability of the the important factors that enabled global population growth, such as energy and food and minerals/materials, will be the limiting factor. Affordability rather than actual physical resource or supply.
For example, the world has an immense PV resource, and at current economic conditions it is an immense reserve. But how much deployment will be achieved in what I see as possibly a short window of opportunity.
We very may look back with great regret that the purchases (mechanisms of electrification) were not made with great imperative while the sale was on and the gears of civilization were still lubricated.
Purchasing power of humanity (excluding the thinnest upper crust) may have already peaked.
For example, look at food supply- arable land/capita peaked long ago and the correlation between the global food price index and oil barrel price is very tight (thank you Dennis for the excellent chart on this last year).
Hickory
Great work depletion affects more than fossil fuels. I didn’t think USGS was that far off.
JT, even with the demand for copper from EVs, the price is up only 23% in 5 years ( from ~$3 to $3.7). This is a CAGR of 4.2% per year. Not great, but surely not a huge problem either?
In Q2 the numbers are coming in at flat or downturn for most of the world but esp. US, Eurozone and China. Plus fed is tightening money supply. Once the economy starts humming again all these supply issues will resurface.
True John, but covid recession and central bank attempts to make credit more expensive have put some dampers on demand for the past 3 years. It will be interesting to watch over the 5-10 years.
HOLE IN HEAD, read it, think all of us here deep down inside know it. The ride down is going to be rough.
We are on the same page , Peakaboo . No disagreement whatsoever . This is why we are on POB trying to get answers to the ride down . What ,how, why ,where and when . The best friends . Keep engaged .
Dennis , the referee has gone AWOL , who will call the recession ? Next we will see the ” R ” word and the “D ” word deleted . Instead will be ” downturn ” for “R” and ” Prolonged global recession ” for ” D ” .
https://www.thestreet.com/investing/bankruptcies-are-up-216-and-we-arent-even-halfway-through-2023
https://www.bloomberg.com/news/articles/2023-05-13/recession-corporate-america-s-earnings-say-it-s-already-arrived?leadSource=uverify wall
https://www.business-standard.com/world-news/as-global-recession-looms-china-unlikely-to-rescue-economy-again-report-123051400548_1.html
Peak China , peak everything .
Hole in head,
There has never been a referee for determining the start of a Global recession.
Dennis ,for the US “Recessions are officially declared by the obscure-sounding National Bureau of Economic Research, a group of economists whose Business Cycle Dating Committee defines a recession as “a significant decline in economic activity that is spread across the economy and lasts more than a few months.”27 Jan 2023 . For the world it is the IMF or WB ( Unofficially ) .
Hole in head,
Yes for the US it is the NBER, but not clear that the IMF or World Bank make that estimate.
https://www.imf.org/en/Publications/fandd/issues/Series/Back-to-Basics/Recession
https://www.worldbank.org/en/news/press-release/2023/01/10/global-economic-prospects
They also tend to give annual estimates of real GDP, so far they are not predicting a down turn in World real GDP, though the rate of increas in real GDP is expected to be low, about 1.7% in 2023 vs typical 3%.
Dennis , that is why I said ” we must apply our mind and logic ” . Everyone here is well informed . We must come to our own conclusions and not wait for XYZ in an official capacity to make an announcement . The revolution will not be televised . Put on your thinking cap .
Hole in head,
I don’t have data at the World level to even make a random guess. I will leave that to others.
Looks like Peak Permian Shale. C’mon Dennis, where is the beef? Show us some of those famous Permian Shale will peak in 2027 pictures again.
The DPR is not very good, I use link below from EIA. Permian is sum of Spraberry, Wolfcamp. and Bonespring columns in spreadsheet.
https://www.eia.gov/energyexplained/oil-and-petroleum-products/data/US-tight-oil-production.xlsx
See recent future scenario at https://peakoilbarrel.com/january-non-opec-oil-production-drops/#comment-757191
The equation on chart is for the OLS trend for data on chart.
Permian scenarios shown in earlier chart (thin lines on chart below). The “avg” scenario is the average of the 5 scenarios presented and the “low” and “high” scenarios are plus or minus 10% of the average scenario around the peak in 2031, then a 20% window in 2035 and a 30% window in 2040, in 2023 the window is zero with a gradual increase in the size of the window over time. My subjective probability estimate for a World where my guess that oil prices start to fall in 2035 after being relatively flat from 2023 to 2035 at about $77/bo for WTI, NGL at 35% of oil price and natural gas at $2.50/Mcf is that there is a 50:50 chance that Permian output will be between the low and high scenarios with an equal probability (about 25% in each case) that output will be either above or below the high and low scenarios. Higher oil and natural gas prices would favor the high side and lower oil and natural gas prices would favor lower scenarios.
More information on the 464 wells to 600 wells scenarios at comment linked below
https://peakoilbarrel.com/january-non-opec-oil-production-drops/#comment-757285
Also URR for average scenario is 52.5 Gb, low scenario 47 Gb and high scenario 59 Gb. Peak for average scenario is about 7200 kb/d in 2031.
The Permian growth is just high grade drilling. It will likely peak in 12-18 months and then follow the same declines as its little brothers. Well productivity has already started to decline even with longer laterals. And with the end of Permian so goes Saudi America.
https://m.youtube.com/watch?v=iHzWGnbI9nw
JT,
People have been saying that since 2018, here is an estimate I did in Dec 2018 see link below
https://peakoilbarrel.com/open-thread-petroleum-december-6-2018/#comment-660549
Note that I did not anticipate the Global pandemic in 2020-2021. The comments disagreeing with my analysis, many of which suggest it is too optimistic follow that linked comment.
Also another Permian scenario at link below from Dec 2018.
https://peakoilbarrel.com/open-thread-petroleum-december-6-2018/#comment-660930
Note again I missed the future pandemic which delayed things by a few years, also I expected new well EUR would start to decrease starting in Jan 2023 and be flat from 2017 to 2022, instead EUR of new wells increased over the 2017 to 2021 period, in part due to increased average lateral length.
We will see in 12 to 18 months, (say Sept 2024 or so,) if Permian output has peaked. I doubt it.
Dennis your model is starting to look like what I was telling you two years ago. Good work.
LTO Survivor,
Thanks. Has your opinion changed? Yes I thought 2 years ago we would see a faster economic recovery and higher oil and natural gas prices so I was overestimating how fast the completion rate would rise.
Though looking back at a scenario for the Permian I did in June 2021 (23 months ago), it was a bit lower than my recent work. Chart below was from June 29, 2021, it has a forecast of 4868 kb/d for March 2023 (current EIA estimate is 5179 kb/d), the peak for the 2021 scenario was 6614 kb/d in June 2030, about 600 kb/d less than my recent scenario. This may have been done after you had suggested a 5% rise in output annually might be reasonable.
Here is an older set of models from Jan 2021. The number after T and E is Gb of TRR or ERR, respectively. The W stands for Wells completed in thousands and the P is for maximum Brent oil Price in 2020 $. Average of the 9 scenarios also shown. A three by 3 matrix with TRR 44, 75, and 114 Gb and Oil Price at maximum of $56/b, $75/b, and $100/b. ERR changes with price for any given TRR assumption.
Also see
https://peakoilbarrel.com/permian-basin-the-death-of-tight-oil-has-been-greatly-exaggerated/#more-29970
Russian oil cuts ? IEA says there were none .
https://twitter.com/ed_fin/status/1658857612610240522/photo/1
The 3 million barrels refilling of SPR is BS .
https://twitter.com/energy_blogger/status/1658313183679881217/photo/1
If we go to electrics, will we need to refill the SPR? If not, how long would that take to reach a break even point of ice vs an ice/ev mix?
PETEREV,
We won’t need to refill the SPR because we are going to manufacture EVs, Wind Turbines, and Solar panels with LARGE STAR TREK REPLICATORS.
Who needs fossil fuels when we can employ Energy Tooth Fairies & Star Trek Replicators?
steve
steve,
Nobody but you talks about “Tooth Fairies & Star Trek Replicators”. Wind turbines are real, Ev’s are real, solar panels are real, depletion is real, climate change is real.
What are you selling now ? Flip phones
SPR refilling only from oil producers and oil produced in USA . Replace 25-35 API with 50 API ? Genius .
https://twitter.com/Rory_Johnston/status/1658306186288963586/photo/1
Denier sites starting to see the light:
https://cliscep.com/2023/03/28/podcast-report-peak-shale/#comment-139295
Great summary of Permian basin at link below
https://www.enverus.com/permian-basin/
Shale Drillers Are Auctioning Off Rigs at Bargain Basement Prices
The much-touted second shale boom has lately been getting a reality check as equipment demand declines sharply, a worrying sign that drilling in U.S. shale energy regions is leveling off.
The Financial Times has reported that next week, Texas auctioneer Kruse Asset Management will auction off two unused, top-of-the-line drilling rigs valued at $40 million and $30 million when built in 2019 at starting bids of just $12.9M and $2.3M, respectively.
“There’s no reason for them to be so cheap, but there’s just no demand,” Dan Kruse, chief executive of Kruse Asset Management, has told the Financial Times.
According to Baker Hughes data, U.S. oil and natural gas rig count has declined 6% in the year-to-date to 731 last week, reversing a steady climb since the depths of the pandemic. The current tally is a far cry from the nearly 2,000 rigs that were running around mid-2014 at the peak of the shale boom. Last week, rig count for gas-directed rigs dropped by 16, or 10 per cent–the steepest weekly fall since 2016. Expectations for another shale boom are getting tamped down due to rising costs as well as limited supplies of labor and equipment that continue to hamstring efforts by U.S. shale producers to quickly ramp up production.
Good post on Mike’s blog from a guest about NG and NGL pricing in the Permian Basin.
NG has been below $1, and even negative. NGL’s are selling for just 1/4 of oil.
The point being, as the Permian gets gassier, high oil prices might not help so much. Depressed NG and NGL are a big problem.
https://twitter.com/WhiteTundraSG/status/1659333130569015297/photo/1
Lea + Eddy county, responsible for 50% of Permian’s production increase over the last 2 years, look to be suffering from an almost comedic well productivity degradation!
Longer and longer laterals + overcapitalization meet the laws of physics and reservoir fluid dynamics. 🛢💰
https://twitter.com/staunovo/status/1659217631688400896
https://www.oilystuffblog.com/forumstuff/forum-stuff/the-dam-has-flat-busted-in-the-delaware-basin
Where to put all the wastewater from the shale drilling .?
Are we glued to crude ? Nate Hagens talks it out .
https://www.youtube.com/watch?v=kenYwfu92f8
New posts are up
https://peakoilbarrel.com/opec-update-may-2023/
and
https://peakoilbarrel.com/open-thread-non-petroleum-may-19-2023/