The OPEC Monthly Oil Market Report (MOMR) for May 2023 was published recently. The last month reported in most of the OPEC charts that follow is April 2023 and output reported for OPEC nations is crude oil output in thousands of barrels per day (kb/d). In many of the OPEC charts that follow the blue line with markers is monthly output and the thin red line is the centered twelve month average (CTMA) output.
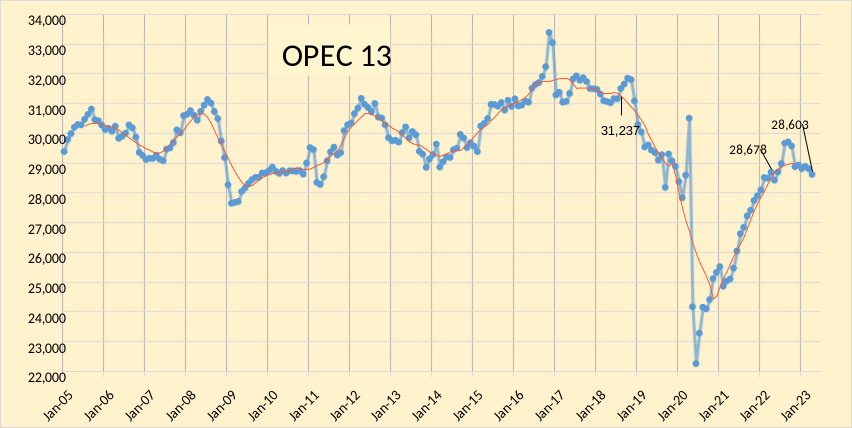
OPEC crude output was revised lower in February 2023 by 10 kb/d compared to last month’s report and March 2023 OPEC crude output was revised lower by 3 kb/d. When the World was at its centered twelve month average peak for C+C output in August 2018, OPEC crude output was 31237 kb/d (as shown in Figure 1), April 2023 OPEC crude output was 2634 kb/d below that level.
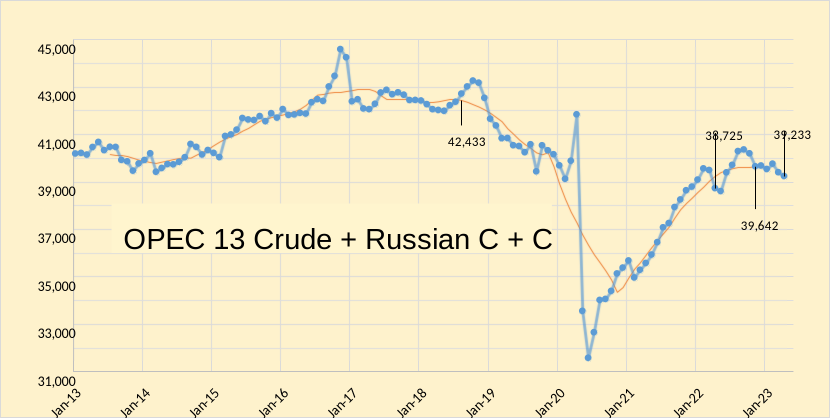
In the chart below we have Russian C + C and OPEC crude oil output. The centered 12 month average (CTMA) of output for OPEC13 crude and Russian C+C was 42443 kb/d in August 2018 when World C+C output was at its centered 12 month average peak. Output for Russian C+C and OPEC crude was 3200 kb/d below the August 2018 CTMA at 39233 kb/d in April 2023 and the most recent CTMA was 39642 kb/d which is 2791 kb/d below the Aug 2018 level. In the past 12 months OPEC and Russian output has increased by 508 kb/d from 38725 kb/d in April 2022.
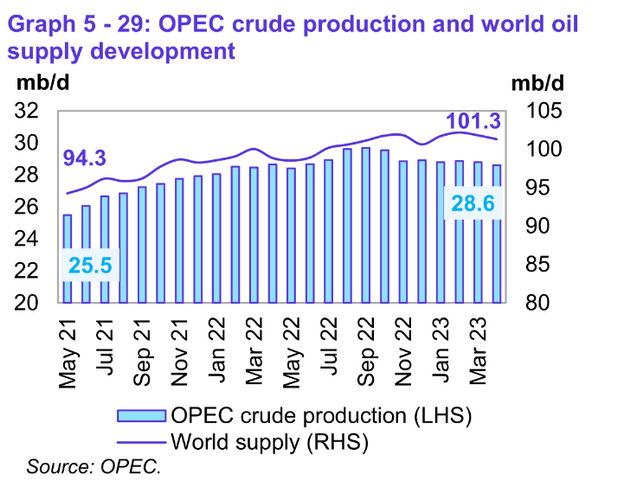
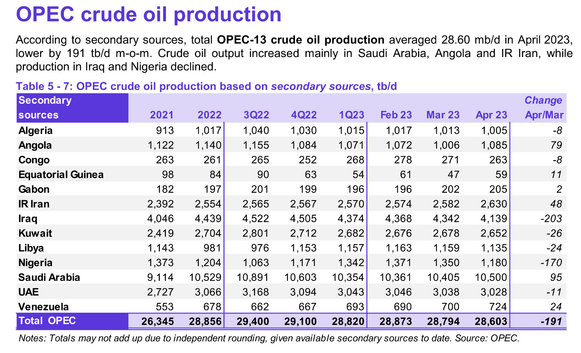
World All Liquids Supply fell to 101.3 Mb/d in April 2023, a decrease of 0.5 Mb/d from last month. OPEC crude output increased by 3.2 Mb/d over the past 23 months to 28.6 Mb/d in April 2023.
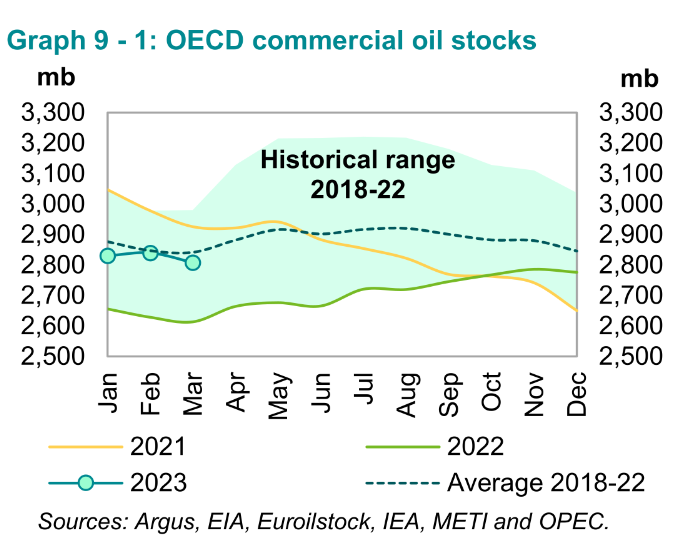
OECD stocks fell in March 2023 by 31.7 Mb to 34 Mb below the 5 year average. Through March 2023 the World oil market looks fairly balanced with supply matching demand fairly closely if OPEC estimates are correct.
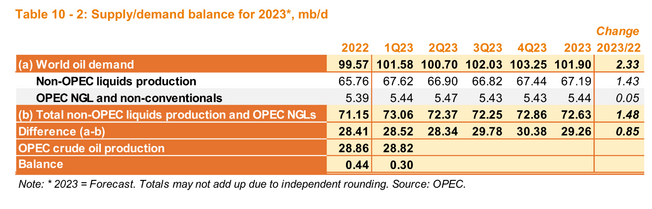
Based on OPEC estimates for supply and demand in Figure 6 and 7, it looks like OPEC will be able to meet supply for the remainder of 2023, economic headwinds may lead to over supply and a fall in oil prices, especially if the US defaults on its debt.
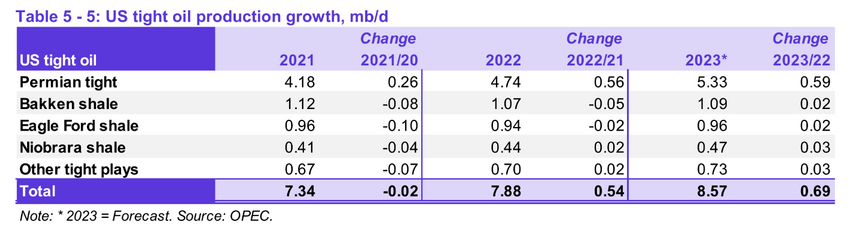
OPEC expects Permian output to grow by 590 kb/d from 2022 to 2023 (annual average output change), my estimate for Permian annual average output in 2023 is similar to the OPEC estimate (5320 kb/d vs 5330 kb/d for OPEC estimate), but I expect no increase from other tight oil plays in the US in 2023, so my overall estimate for tight oil output in 2023 is 100 kb/d less than the OPEC estimate (8470 kb/d vs OPEC’s 8570 kb/d estimate for US tight oil average annual output in 2023).
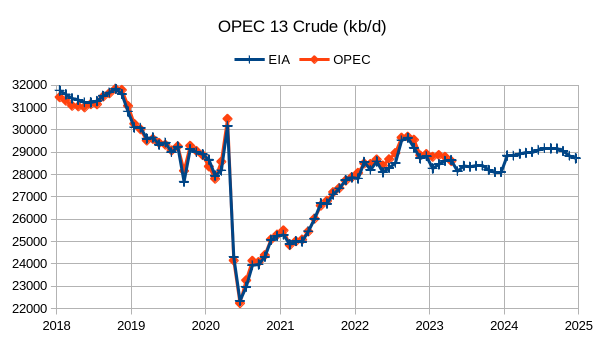
Figure 9 above compares the EIA estimate of OPEC 13 crude output from the Short Term Energy Outlook with the estimate in OPEC’s MOMR using secondary sources from January 2018 to March 2023, EIA data after March 2023 is a forecast of future OPEC crude oil output. The annual average for the EIA estimate for 2022 OPEC crude output was 28670 kb/d and the forecast for 2023 is annual average output of 28341 kb/d (329 kb/d less than 2022). In 2024 the EIA estimates annual average OPEC 13 crude output will increase by 645 kb/d from the 2023 level to 28986 kb/d. Note also that the MOMR estimate for the call on OPEC in 2023 is 29260 kb/d, 919 kb/d higher than the EIA’s forecast for OPEC crude output in 2023.
160 responses to “OPEC Update, May 2023”
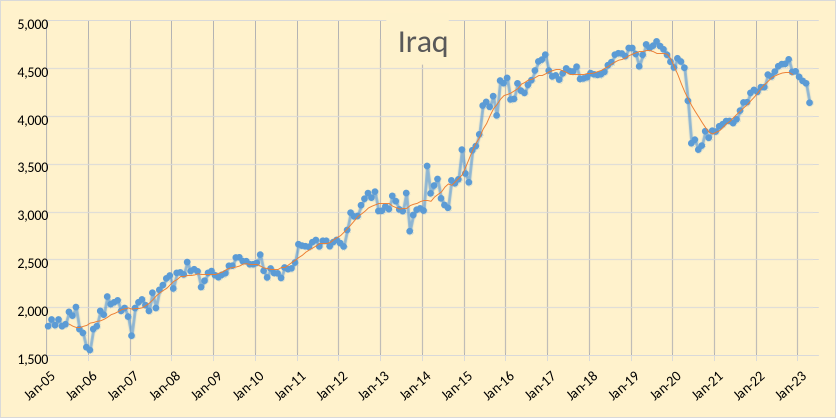
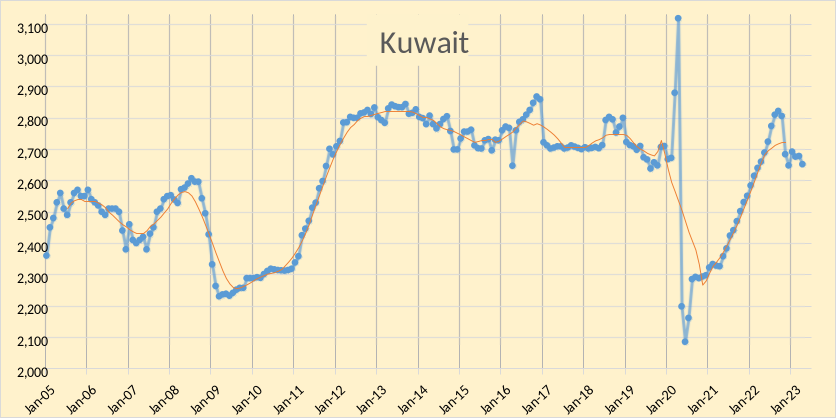
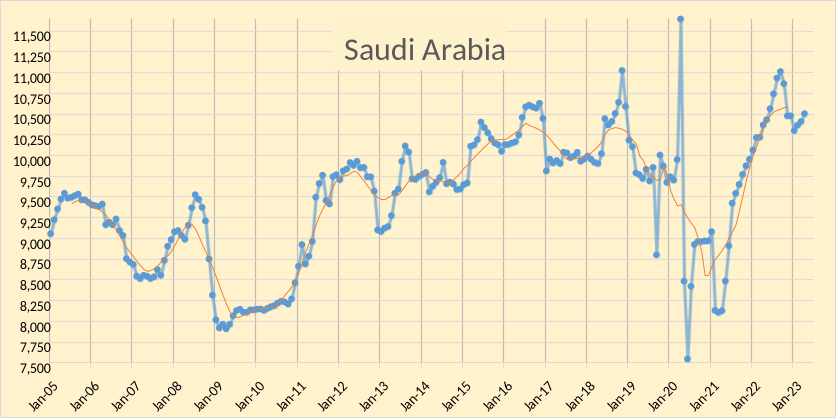
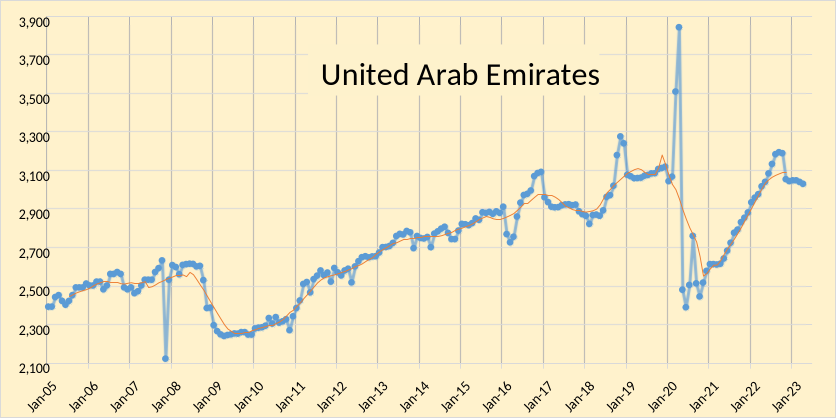
OPEC Big 5, Saudi, Kuwait, Iran, Iraq, and UAE. The last data point is April 2023.
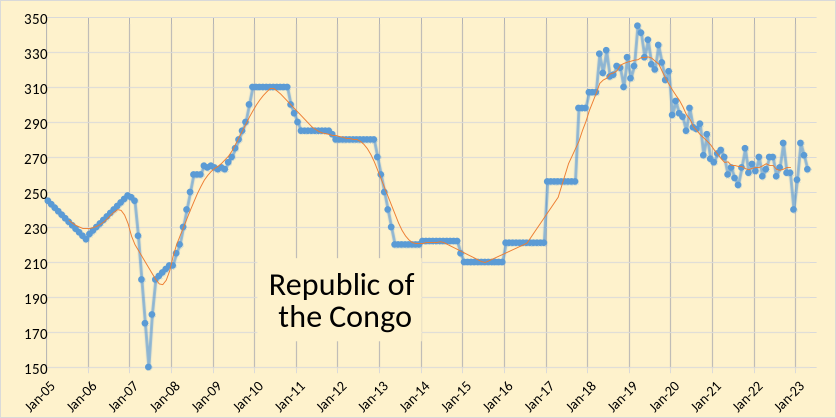
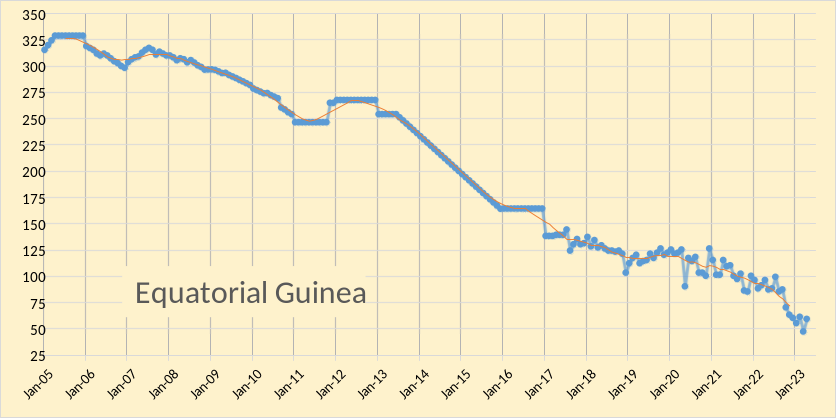
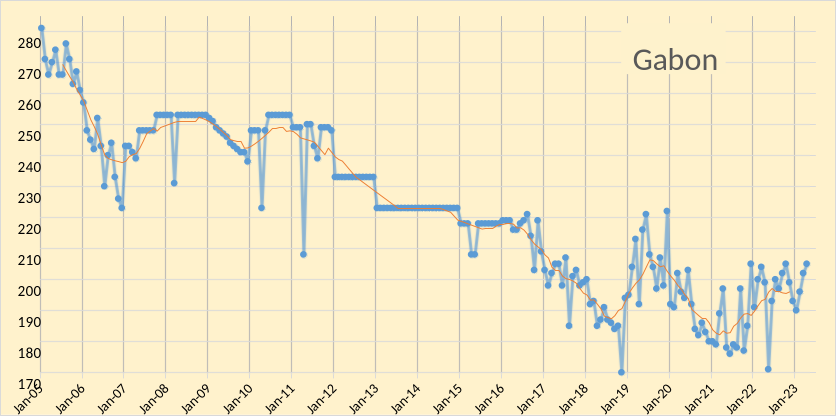
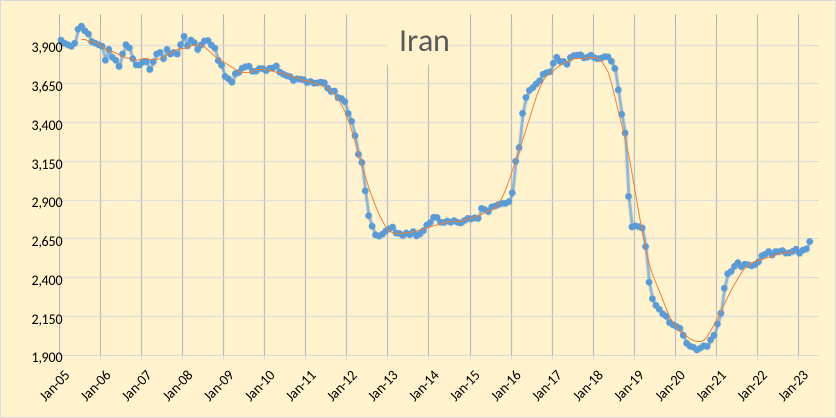
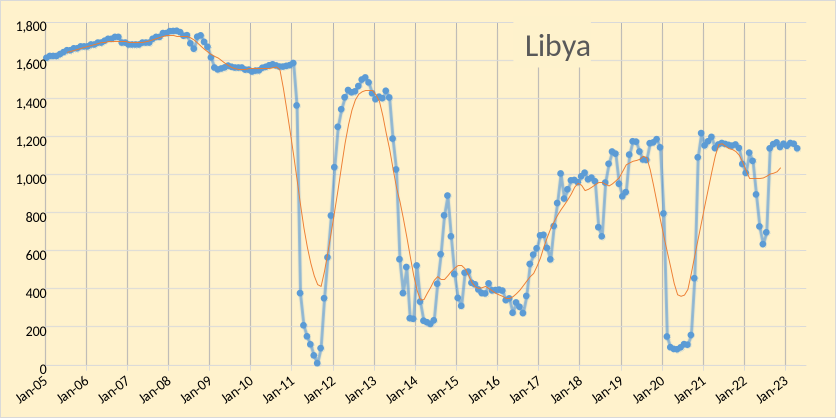
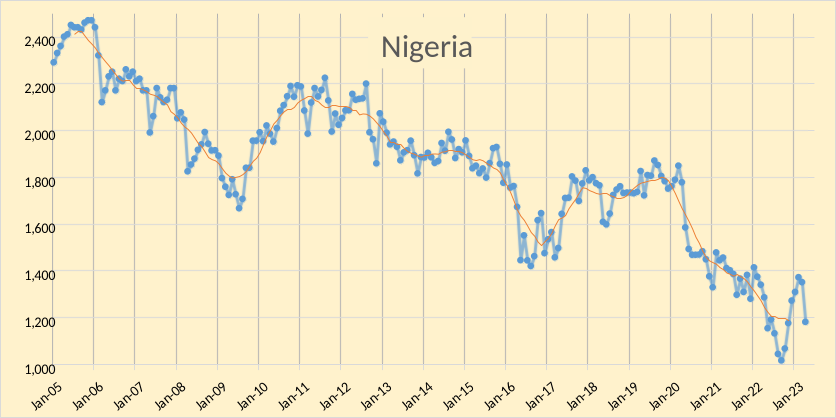
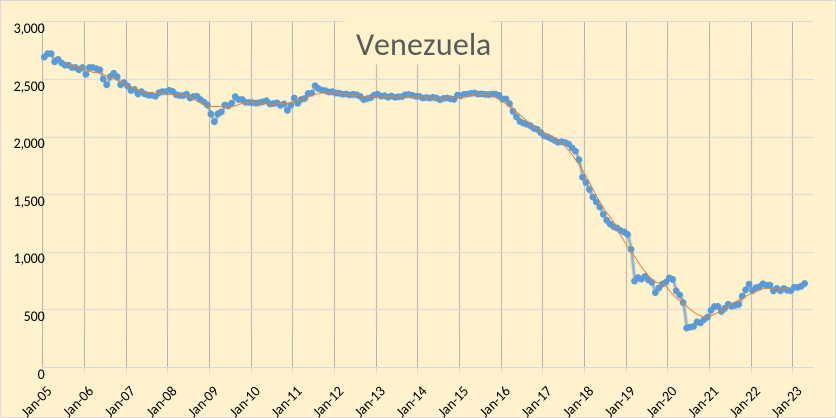
The rest of OPEC, the Other 8. The last data point is April 2023.
Looking at the chart for Venezuela we find that from Jan 2017 to April 2023 the TTM average for Venezuela decreased by about 1700 kb/d which accounts for roughly 81% of the decrease in the TTM average for OPEC Other 8. Since the World TTM average peak in Jan 2019, the Other 8 output has decreased by about 1600 kb/d and big 5 by about 500 kb/d. It is doubtful OPEC will return to its previous 12 month average peak in 2017.
As you’ve pointed out in the past Dennis – many of these oil declines are political. And in my experience studying history, whenever a strong ideological stance meets material interests – material interests win almost every time. So when the world can no longer fund its maintenance with existing reserves, Venezuela will somehow be rehabilitated. This may not prevent peak, but will certainly extend that bumpy plateau another decade or so.
“Venezuela’s oil industry continues to suffer under Washington’s unilateral coercive measures as well as years of brain drain and mismanagement. Following the 2017 financial sanctions against PDVSA, the US Treasury Department imposed an oil embargo in 2019 followed by secondary sanctions and other threats. The measures drove production from 1.9 million bpd in 2017 to 350,000 bpd in 2020, shrinking the country’s main source of income.
Since late 2021, crude output has slowly recovered hovering around 700,000 bpd with Iran’s assistance. In early April, the Iranian supertanker Sea Star III arrived in Venezuelan waters carrying 2.1 million barrels of condensate to dilute PDVSA’s heavy oil as part of an ongoing swap deal that sees Caracas provide crude in exchange for diluents, machinery parts, and technical support.”
https://venezuelanalysis.com/news/15744
And good old wonderful, saintly, kind and caring Hugo had absolutely nothing to do with the countries collapse. If it wasn’t for Washington, Venezuela would be a paradise.
Well, Venezuela had completed its collapse by December 2019. Let’s look at post covid production. That will tell us what is happening today rather than Peak to Covid collapse. After all, what’s happening today is really all that matters.
Production numbers below are in thousand barrels per day.
………Venezuela on:
735 December 2019
724 April 2023
-11 Change
………..Other 8 on:
6,749 December 2019
5,579 April 2023
-1,170 Change
As far as OPEC goes, it’s all over but the crying.
Thanks for the fantastic work Dennis.
Couldn’t agree more!
Thanks Schinzy and Andre.
https://www.oilystuffblog.com/forumstuff/forum-stuff/surprise-surprise-lea-and-eddy-going-flat-this-year
Must read MIke S blog post (written by Anne).
This looks scary if I am reading things correctly in conjunction with Dennis and Ron’s charts.
don’t forget they can play the “oops, global recession” card at pretty much any point. During GFC this stunted oil consumption for years. Covid was another four year extension. somebody somewhere knows how much oil there is, and they aren’t going to let “not enough oil” be the narrative this time around. They can always starve and un-employ a few hundred million globally to stifle demand.
now, will this arrangement last forever. certainly not, but I’d say they can get us to 2027 in la-la land.
OPEC expects Permian output to grow by 590 kb/d from 2022 to 2023 (annual average output change), my estimate for Permian annual average output in 2023 is similar to the OPEC estimate
Great charts, but I am surprised that you seem to ignore the twin factors of the growth portion of the Permian gassing out and also producing so much salt water. This, along with lower EURs, is eroding profits going forward, especially at current prices. My presumption is that you feel that a) these are temporary aberrations or b) higher prices will take care of it. Or maybe c) you don’t believe that is occurring. I am also keenly interested in why OPEC would make these same predictions, as they are the very best at putting the global situation in perspective. In fact, OPEC doesn’t get enough respect for its adroit analysis. And Warren Buffett is buying more Occidental. I must be missing something very important because this doesn’t add up to me—you can’t drill $15M wells with the hopes of generating a $22M production revenue. Eventually, the frenzy submits to reality. I am eager to be educated.
Gerry,
I expect natural gas prices will rise, and Permian output will increase modestly for the rest of 2023. The guess could be wrong.
So far Permian output continues to increase each month according to official EIA estimates.
The model uses an EUR estimate for the average 2020 well and assumes a very gradual increase in the completion rate.
In March the Permian completion rate was 464 wells.
Even a constant completion rate at this level results in increased output.
Note that EUR increased in 2021 and then decreased to the 2020 level in 2022, too early to tell for 2023. I assume EUR remains constant, but if it decreases more wells could be completed, a 10% drop in EUR could be offset by a 10%increase in completions.
Prices for oil , NGL, and natural gas would need to increase.
Gerry,
I recently presented 5 scenarios for Permian and and average of those 5 scenarios see link below and a few comments down see LTO Survivor’s comment (he knows a lot and I pay attention to what he reveals).
https://peakoilbarrel.com/january-non-opec-oil-production-drops/#comment-757315
Below is a chart of the Permian Average scenario zoomed in on Jan 2022 to Dec 2023. This seems pretty reasonable to me, current Permian output in March 2023 is 5179 kb/d, I am predicting average annual output in 2023 of 5314 kb/d, about 135 kb/d above March 2023 output, this is not a huge increase.
Attempting to predict the future of oil and natural gas production based on “trend lines” from the past is not to be taken seriously, nor is using a top-down prediction of the future based on URR estimates and “hope” for higher product prices.
Every data point in the above chart up to 2023.25 occurred in the field six months ago and has just now come to fruition in the form of “data.” The oilfield is a fluid environment and changes rapidly, and significantly, in short periods of time. Only the most novice of analysts ignore that.
Short of a stunning influx of borrowed capital, from where I do not know, rig counts will continue to go down. The same number of rigs cannot drill and complete the same number of wells; that is a ridiculous assumption. Well productivity is declining; gassy oil wells are now becoming oily gas wells and the rate of decline, post IP24 months, then terminal decline rates below 50 BOPD, are accelerating. Pressure depletion in core areas matters WAY more than USGS TRR estimates.
Associated natural gas prices is killing the tight oil sector; economics suck. Source frac water for frac’ing in an arid West Texas is an enormous problem. almost, but not quite, as enormous as disposing of produced water. I predict that one thing, disposal of produced water, will end the Delaware Basin in just a few years.
This stuff is not a “hobby” to men like Gerry, or Shallow, or LTO; it’s pretty much life or death. It’s hard to listen to the horse shit. We suggest you ignore it. If the pseudo analyst keeps making the same predictions based on the past, over and over again, they are going to be very wrong, very soon.
https://oilprice.com/Energy/Crude-Oil/US-Shale-Production-Is-Set-For-A-Rapid-Decline.html
Mike
I can’t agree more the past is not the future. It’s like driving looking through the rear view mirror. It works fine on a straight road but once you hit a turn it’s over.
Mike- you are spot on. I saw your post of EOG in Loving County and it is so drilled up with no white space left. As a matter of interest, XOM has a big Haynesville package on the market. Interesting that they are selling this big gas package while at the same time building a huge LNG facility at Golden Pass. Perhaps they are more interested in the LNG economics instead of the E&P shit show the domestic industry faces most of the time.
Here is Mike’s post on EOG . Looks like a pin cushion .
https://www.oilystuffblog.com/single-post/there-goes-the-neighborhood?postId=30ca6a61-2642-4b02-96ca-f4becd72a215&utm_campaign=dbf1384a-2c81-4f8f-bc7d-08042310082c&utm_source=so&utm_medium=mail&utm_content=f16bfb09-c04e-4ef0-9ca2-e26e64bf4045&cid=fa335351-37bb-44a6-9899-f8c34b4a0f81
Mike,
I might be wrong, we will see. LTO Survivor recently commented on my scenarios from May 2023:
Dennis your model is starting to look like what I was telling you two years ago. Good work.
Forecast at link below
https://peakoilbarrel.com/january-non-opec-oil-production-drops/#comment-757315
LTO Survivor comment at
https://peakoilbarrel.com/january-non-opec-oil-production-drops/#comment-757347
The scenarios are top down in the sense that they use Permian basin data from Enno Peters for the average 2020 well and utilized USGS estimates for prospective acres for Spraberry (Upper and Lower), Wolfcamp A and Wolfcamp B, Second Bonespring, and Third Bonespring. The scenario does not use trendlines, it assumes completion rate increases at about one well per month for the “average scenario”. In chart below I show low, average and high scenarios for 2023, including EIA data for 2023 through March. The low scenario assumes no increase in completion rate.
If we se a US default and possibly a major World recession or depression as a result, then output will be lower due to falling oil, NGL, and natural gas prices. The scenarios are optimistic as they do not factor the current US debt crisis.
Mike,
Of course things will change in the future, I say that all the time, including the fact that my future scenarios will be wrong.
Interesting that LTO Survivor has a very different perspective than you. Makes things interesting. Care to give us your more informed opinion on Permian output for 2023?
I notice that aside from saying my predictions are “horseshit”, I have NEVER seen you venture a guess. No batting average if you never step to the plate.
LTO Surviovor suggested a couple of years ago that a 5% annual rate of increase in the Permian might be a reasonable guess for the future. He might have a different opinion today. Note that in the past two years Permian output has increased at about 13% per year. My average scenario has about a 7.4% per year increase for the next two years (April 2023 to March 2025 and 3.8% per year for the following two years from April 2025 to March 2027. The average annual rate of increase over the next 4 years for my average scenario is 6.3% per year.
Chevron predicts 50% increase in Venezuelan oil production in 2023
They are talking about what they are producing, which is 100,000 bp/d.
(Bloomberg) – Chevron Corp’s oil production in Venezuela has reached 100,000 bpd and could rise 50% this year, Chief Executive Officer Mike Wirth said in an earnings call Friday.
The U.S. oil major operates three projects in the country along with state-run Petroleos de Venezuela SA. Since U.S. President Joe Biden eased sanctions on Venezuela last year, Chevron has started lifting so much crude from the country that it’s had to put 600,000 bbl of it in storage in the Bahamas this month. Chevron is also shipping some of the oil to its U.S. refineries.
But Wirth cautioned that the company’s operations in the sanctions-hit nation depend on waivers from the U.S. government. “It’s not really a negotiation,” he said. “It’s their decision.”
Ron , I love the percentage argument by the corporations . A company manufactures 1 tractor and then the next year it makes 2 tractors . 100 % increase . A company makes 1 million tractors and the next year it makes 1,1 million tractors . 10% increase . Where will you put your money ? Rubber hits the road . BS .
New Mexico Accounted For 50% Of U.S. Oil Production Growth In 2022
New Mexico, home to part of the Permian basin, saw the highest crude oil production growth of any U.S. state last year, with output gains of 300,000 barrels per day (bpd) accounting for half of America’s oil production increase, the Energy Information Administration (EIA) said in a report on Thursday.
Total U.S. crude oil production increased by 600,000 bpd in 2022 compared with 2021, averaging 11.9 million bpd, per EIA’s Monthly Crude Oil and Natural Gas Production report.
For the third year in a row, New Mexico’s oil production growth eclipsed the growth of crude output in any other U.S. state, including Texas, the biggest U.S. oil-producing state and also home to part of the Permian shale basin.
Crude oil production in New Mexico jumped by 300,000 bpd to 1.6 million bpd in 2022, a record for the state, the EIA has estimated.
New Mexico and Texas contributed the most growth to U.S. crude oil production in 2022, while oil output in the rest of the United States grew by just 0.6% last year, or by 33,000 bpd.
Crude oil production in California fell for the eighth consecutive year, and production in Alaska declined for the fifth consecutive year. North Dakota, which had been one of the leading states in oil production growth in the past decade, saw oil production fall for the third consecutive year in 2022, the EIA noted.
All here at POB know it is not OPEC that counts but the OPEC 5 ( KSA , Iran , Iraq , Kuwait , UAE ) , Iraq and Iran are overtly anti West and now the new deal done by China between KSA and Iran shifts KSA in the same camp ( covertly ) . That leaves Kuwait and UAE . Understand the royal families in the Middle East are interconnected by marriage . The Eastern culture is ” Me against my brother , but my brother and me against the infidels ( invaders ) ” . There is a change in the wind while the stupid G7 hold a meeting in Hiroshima doubling down on failed sanctions . Smell the coffee .
https://journal-neo.org/2023/05/18/israel-and-the-new-middle-east/
And……….,,:China just inked and oil exploration deal with Yemen. China has outplayed the US in the fourth quarter. While the PRC does deals with two Middle Eastern countries warring with each other, President Biden and John Kerry spend their days cheering for green energy and spouting climate change as the number one issue in the world today. Today abundant sustainable green energy is an illusion serving as a replacement for fossil fuel.
You couldn’t make this story up if you tried. It’s truly stunning how ignorant we have become as a country. I am not opposed to alternative sustainable energy at all but I am opposed to the impact it will have on our energy starved country. Natural gas which is the cleanest burning of all fossil fuels is being banned all over the blue states which is ludicrous and disastrous on so many levels when it could truly help us become more energy independent. The amount of self loathing we have in our country for the industries that create true wealth is truly stunning. Maybe Facebook or TikTok will replace the energy needed to sustain our current way of life.
November 29, 2022
Editorials, Letters, and Articles
By: Allen Zhong
The Biden administration authorized on Nov. 26 Chevron Corp.’s joint venture to resume oil pumping in Venezuela.
“The Department of the Treasury’s Office of Foreign Assets Control (OFAC) issued Venezuela General License (GL) 41, authorizing Chevron Corporation to resume limited natural resource extraction operations in Venezuela,” the Treasury Department said in a statement.
The goal of the authorization is to “alleviate the suffering of the Venezuelan people and support the restoration of democracy,” according to the statement.
The Biden administration’s decision comes after the Nicolás Maduro regime and opposition political alliance Unitary Platform resumed talks in Mexico City.
******
Exxon Joins EV Race For Lithium. That Isn’t as Big a Deal as It Might Appear. — Barrons.com
8:20 am ET May 22, 2023 (Dow Jones) Print
Al Root
Big oil is getting into lithium. That’s major news, but there is a catch: Lithium isn’t all that big.
Exxon Mobil (ticker: XOM) spent about $100 million buying land in the Smackover formation of southern Arkansas from an exploration company called Galvanic Energy, The Wall Street Journal reported Sunday. Exxon didn’t immediately respond to a request for comment.
The move, on some levels, looks like an acknowledgement the the future of cars is battery-powered than gasoline-powered. Checking out lithium appears like a smart move after all the International Energy Agency estimates that there will be 350 million electric vehicles on global roads by the end of the decade, up roughly tenfold from today EV population. What’s more, if the IEA is right, EVs will account for roughly 15% of all vehicles on roads, up from less than 2% today.
Exxon will need to replace some of the demand for gasoline. The Arkansas land might have as much as 4 million tons of so-called lithium carbonate equivalent, or LCE. Lithium carbonate is one of the actual products that gets used by battery makers in lithium ion battery production.
******
Biden approves Willow oil-drilling permit in Alaska. It’s a ‘carbon bomb,’ one group says.
7:18 pm ET March 13, 2023 (MarketWatch)
Print
By Rachel Koning Beals
The approval for ConocoPhillips comes with some conditions but is still one of President Joe Biden’s most consequential climate choices thus far, opponents say
The Biden administration approved ConocoPhillips’ large-scale and controversial Willow drilling project on Alaska’s oil-rich North Slope on Monday.
****
Albermarle stock rallies after 5-year lithium supply deal with Ford
6:59 am ET May 22, 2023 (MarketWatch)
Print
Shares of Albermarle Corp. (ALB) rallied 1.4% in premarket trading Monday, after the specialty chemicals company announced a 5-year agreement to supply more than 100,000 tons of battery-grade lithium hydroxide to Ford Motor Co. (F), that will be used to make about 3 million electric-vehicle (EV) batteries. Albermarle said the 5-year agreement starts in 2026.
*****
Global climate change is not a future problem. Changes to Earth’s climate driven by increased human emissions of heat-trapping greenhouse gases are already having widespread effects on the environment: glaciers and ice sheets are shrinking, river and lake ice is breaking up earlier, plant and animal geographic ranges are shifting, and plants and trees are blooming sooner.
https://climate.nasa.gov/effects/
****
New York is the first state in the country to ban natural gas and other fossil fuels in most new buildings – a major win for climate advocates, but a move that could spark pushback from fossil fuel interests.
Facing mounting pressure from environmental advocates and climate-minded voters, Gov. Kathy Hochul and Democratic lawmakers, who control the New York Senate and Assembly, approved the new $229 billion state budget containing the provision late Tuesday night.
The law bans gas-powered stoves, furnaces and propane heating and effectively encourages the use of climate-friendly appliances such as heat pumps and induction stoves in most new residential buildings across the state. It requires all-electric heating and cooking in new buildings shorter than seven stories by 2026, and for taller buildings by 2029.
https://www.cnn.com/2023/05/03/us/new-york-natural-gas-ban-climate/index.html#:~:text=New York’s new law will,by as early as 2026.&text=New York is the first,pushback from fossil fuel interests.
*****
13 battery gigafactories coming to the US by 2025 – ushering new era of US battery production
https://electrek.co/2021/12/27/13-battery-gigafactories-coming-us-2025-ushering-new-era/
If the US wanted to improve its oil supply situation it would ignore the internal politics of Venezuela and negotiate a long-term investment and purchase deal with that country.
That would require the US to act with confidence about poorly regulated capitalism (us), and accept that other countries (such as Venezuela) may choose to lean towards heavier regulation of sequestered wealth among the uppermost crust of their country.
Most Americans aren’t threatened by better regulation of capitalism, rather its the couple thousand at the very top who fear this possibility. In fact, most Americans would feel just fine if mortgage interest tax writeoff was available only for the first 3000 sq ft of a home (and not for any second homes), and if the tax rate for income and cap gains for owners of rental properties was at rates equal to the highest income tax rate, for example.
The paranoia about ‘socialism’ is at the level of a mental illness in the US. Not too surprising given the misinformation campaign of the past 100 years.
Correct me if I’m wrong, but Venezuela broke it’s contracts with American major oil companies when it nationalized it’s oil industry as it turned away from capitalism.
***
After Hugo Chávez officially took office in February 1999, several policy changes involving the country’s oil industry were made to explicitly tie it to the state under his Bolivarian Revolution. Since then, PDVSA has not demonstrated any capability to bring new oil fields onstream since nationalizing heavy oil projects in the Orinoco Petroleum Belt formerly operated by international oil companies ExxonMobil, ConocoPhillips, Chevron.
https://en.wikipedia.org/wiki/History_of_the_Venezuelan_oil_industry#:~:text=Well before 1976, Venezuela had,the country’s natural gas industry.
Yes, and they’ve paid a pretty big price in retaliatory sanctions.
Might be time for a reset on the relationship.
Hickory,
I agree, it is too bad that Biden has refused to reverse some of the stupid policies implemented by Trump.
The contentious relationship and sanctions do go back far before Trump.
Nonetheless…
LTO
Looks like the Yemen deal is off.
https://thecradle.co/article-view/25168/chinese-firm-cancels-oil-agreement-with-yemen
LTO.
China might be talking with Yemen about oil, but they see the global depletion of oil with clear eyes.
And that is why about 1/2 of the worlds solar and wind energy capacity is deployed in China.
The US is foolish to not be matching or exceeding their effort.
Again Hickory, I agree. US could also restrict export of oil and natural gas except to Canada and Mexico and the EPA could impose huge fines for venting or flaring of natural gas to conserve resources. Also recycling of frack water should either be required or a huge fine for not doing so should be imposed.
Doubtful that this happens.
“Today abundant sustainable green energy is an illusion serving as a replacement for fossil fuel.”
Moving away from wording that has a culture war slant to it
“As long as the US moves along at a feeble pace at tapping into its massive solar and wind energy reserves,
it will be in a poor position to weather the inevitable fossil fuel depletion. And it will further lag China as the dominant industrial source in these industries.”
Walking and chewing gum at the same time is required to have a resilient energy system.
LTO Survivor
. I am not opposed to alternative sustainable energy at all but I am opposed to the impact it will have on our energy starved country.
The United States wastes immense amounts of energy. It isn’t starved it’s dying of overeating.
https://www.youtube.com/watch?v=uPRlQ2HXPgI
I posted this in the last thread but I am posting again.
Canada wants to join the AUKUS (Australia UK USA) treaty because of its ageing submarine fleet and no plans to replace.
I think military strategists are seeing Resource Wars approaching fast (Hell, Ukraine is a Resource War)
Military for Resources.
Australia and the USA would control 40% of the worlds coal reserves and god knows how much natural gas.
Add in Canada and AUKUS is looking like a “Military for Resources” agreement (handshake under the table).
AUKUS currently won’t let Canada in until “they contribute more to the agreement”
The Arctic and Antarctica are in play here as well.
Andre , AUKUS and QUAD are dead in the water . IF you have a long time memory there was a SEATO ( South East Asia Treaty Organization ) composed of Japan , Philippines , Indonesia , Thailand , Burma , Laos , Cambodia , Australia and New Zealand . This was formed at the peak of Vietnam war . Where is it today ? Dead . G 7 is a “past expiry date ” organisation . It can only bark . Here is an example , barking at China .
https://www.theepochtimes.com/g-7-to-issue-candid-response-to-chinas-economic-bullying-at-hiroshima-summit_5279713.html?utm_source=partner&utm_campaign=ZeroHedge&src_src=partner&src_cmp=ZeroHedge
Japan lends an enormous amount of dollars into China. Eurodollars that is. What does China look like when the exchange rate hits 8 or 9 because that’s where things are headed.
China has an enormous dollar problem. Asia as a whole has an enormous dollar problem. Leaders of countries can talk moving away from dollar all they want. The banks don’t care.
So China internally is experiencing deflation in RMB terms. But in dollar terms on a global stage their currency is depreciating.
India’s central bank has been selling dollars to buy rupees to support the local currency. How long can they do it before they run out of dollars? What happens when they run out of dollars?
Like it or not all currencies are priced in US dollars.
Does it really matter if some oil is paid for using Chinese RMB or some other currency? No it doesn’t matter one bit. Not even sure why it’s even talked about other than it’s talked about by people that don’t understand the global monetary system. Which the US absolutely has no control of btw.
Global trade demands Eurodollars. Oil is bought and sold globally with Eurodollars.
When there is a dollar shortage globally foreign buying of US debt goes down because they simply don’t have the excess dollars to buy treasuries.
Looks like de dollarization but in reality it’s just a dollar shortage.
Asia currencies particularly the Japanese yen and Chinese yuan are going to resume getting crushed by the dollar. And it has absolutely nothing to do with interest rates in US.
It has everything to do with collateral or lack of collateral that leads to lack of lending in Eurodollar market. Banks are unwilling to except collateral that they might usually would.
HHH , ” India’s central bank has been selling dollars to buy rupees to support the local currency. How long can they do it before they run out of dollars? What happens when they run out of dollars? ”
They also demonetized the highest INR 2000 currency note yesterday . Second demonetization in 6 years .
Yeah its tough for the average person to follow. ignoring eurodollars for a second and just looking at “the dollar”. it went bearish a couple weeks back and looked to be on the ropes (back when Texas two teas and HHH were sparring). Well, even though it was bearish it was still strong against a lot of currencies (mexico, argentina, yen, canada). And wouldn’t you know it, it’s back to bullish (though I’m not long dollar right now). The only currency US dollar is weak against right now is the Pound and even that has stagnated over the past 6 weeks.
although I agree with Dennis that the debt ceiling issue is extremely dangerous and destabilizing, we have to remember the economy is not doing well even past debt ceiling or potential fed rate pauses (hint: fed fund rates is pricing in ANOTHER rate hike).
I think Andre’s post is on the wrong thread but I’m replying to it because HHH’s comment will relate directly to Oil Price and therefore production. debt levels, inflation and interest rates are high and liquidity is not good (M2 is -4% YoY negative – it hasn’t been negative YoY since at least 1960).
“I think Andre’s post is on the wrong thread”
Who Canada allies with is pretty important for future oil supply.
Especially who gives them submarines (quid pro quo)
Also the Arctic may have oil it.
After debt ceiling is resolved which it will be even if it’s just pushing it out another year before being dealt with. Doesn’t really change anything.
It’s not the debt ceiling that yield curves are worried about. It’s collateral and willingness of banks to lend.
SVB didn’t have to go under. Banks, large banks in particular looked at their potential collateral and seen a bunch of illiquid commercial real estate loans and thought better of loaning the money needed.
Banks accessing FED’s discount widows haven’t even attempted to pay any of the loans back. Banking crisis is in 1st inning and already larger than 2008.
So all the yield curves point to aggressive central bank interest rate cuts. Basically back to zero in a hurry once the cutting starts.
But we both know interest rates cuts and QE don’t fix the problem. Neither do FED’s swap lines. Bank reserves aren’t the problem. No shortage of bank reserves.
Dollar will take off to the upside when the rate cuts and QE are implemented. Exactly the opposite of what we are told.
And the reason why interest rate cuts and QE are reimplemented are the exact same reasons why the dollar goes higher and oil and a lot of other stuff in real economy implode.
There will come a time where shale oil and gas is completely cut off from OPM. Due to an unwillingness to lend.
Where is shale oil and gas production after 12-24 months of not being able to borrow money?
It will require higher oil prices to keep production steady or a single digit % increase here in the us. The cost inflation producers encountered over the last 18 months have yet to be mitigated. Some areas like steel casing are now coming down, and with rigs being let go left and right longer term contracts may be negotiated at more favorable terms. I will be back in a month or two to check back in, so far you still be wrong and the demand backdrop say I will be right, that of course can change but till it does, its a boring discussion. oil and gas are going up in price from here,
https://www.zerohedge.com/markets/hedge-fund-oil-shorts-hit-record-high-just-physical-demand-surges
Demand backdrop? Last I checked WTI futures, the front two contracts went from being a nickel in contango to a dime in contango.
Amazing how you ignore all the data that’s telling you the economy is in serious trouble.
I’m guessing you believed Jerome Powell and Janet Yellen when they said all is fine?
Did it ever occur to you that maybe, just maybe, current oil and gas production just doesn’t get maintained?
texastwotea – glad to know you’re okay.
1) yes I agree with you, this debate has gotten stale and only time will tell. I think I mentioned that about a month ago. 2) the specific call of “$25 oil in march”, (I think giving a two month window to either side is fair) is essentially mud. great, we can move on. 3) although the dynamics haven’t change much – it’s possible you and HHH might BOTH end up being right if the goldilocks theory holds this time:
the economy might go down (including energy equities) but oil price might not go down “that much.” I guess I’m not qualified to say what the price level would be. Over the past 20 years – $60/barrel has been a level only breached during quantitative TIGHTENING phases.
Of course, inflation continues apace, so maybe that level has raised. But I would say, for the sake of the “argument” you will be right if oil price doesn’t even go below $50/barrel (average) over a 6 month period. That might be cold comfort if the businesses you are attached to require $75/barrel oil to prosper. And for that, you have my condolences if prices go down from here.
“I think Andre’s post is on the wrong thread”
Canada is pretty important to America’s oil future.
” AUKUS and QUAD are dead in the water”
Australia is building a new submarine base and the USA is sending submarines there on a regular basis.
Australia is currently training on the submarines.
Giving another country access to your nuclear technology is pretty meaningful to me.
How is that dead in the water?
Kuwait and Iraq look like they are past peak and in noticeable decline, or are they just getting an early start on the agreed “voluntary” May OPEC+ cuts?. Iraq may just need some more investment to arrest it, such as TotalEnergie is going to provide over the next ten years through the recently signed contract (presumably including some new water injection) but it may find the security, corruption and remuneration problems as difficult to handle as those who have tried previously.
I wonder if, other than Saudi and UAE, any choking of wells will happen in May to achieve the stated cuts or wether they were just the expected decline (maybe with maintenance losses) expected in the next few months – especially if they have been looking at the US drilling and fracking rig figures and will be expecting some production drop to follow (https://oilprice.com/Energy/Crude-Oil/US-Drilling-Rigs-Swing-To-Annual-Loss-For-First-Time-In-Years.html).
Equatorial Guinea’s profile looks like it has started gas cap blowdown (just a guess). At what point does it have to leave OPEC because it stops being an exporter?
U.S. Rig Count
Big drop in rigs and frac spreads was reported Friday. I was hoping Ovi would post the charts. Anyway, oil rigs down 11, 10 below same date last year. Frac spreads down 10, 26 below year ago date.
Permian, Eagle Ford lead double-digit rig decline
Drilling activity continued its decline for a third consecutive week as commodity prices continue to waver amid uncertainty about the economy and demand. The decline was led by Texas, the Permian Basin and Eagle Ford.
Oilfield services firm Baker Hughes said its US rig count, which it has issued weekly since 1944, fell 11 rigs, the second consecutive weekly double-digit decline, to 720 rigs. That’s the steepest weekly decline since September 2021 and the lowest level since May 2022. The decline also marked the first time the rig count has fallen below year-ago levels – it’s eight fewer than the 728 counted last May – since April 2021.
The number of rigs seeking crude oil fell by 11 to 575 rigs, the lowest since June 2022 and one fewer than the 576 drilling for oil last year. The number of rigs drilling for natural gas was unchanged at 141, nine fewer than 150 last year.
Texas saw its rig count sink nine rigs to 357, the same level as last year. New Mexico added a rig for 109 rigs at work across the state. California (1), Colorado (2) and Louisiana (1) joined Texas as producing states to see declines while Wyoming (1) joined New Mexico in seeing a decrease.
The Permian Basin rig count fell by four rigs to 349 – still six more than the 343 rigs active in the region last year. It was the steepest drop among the nation’s major producing basins, followed closely by the Eagle Ford, down three rigs.
Ron Permian horizontal oil rigs decreased by 4 this past week to 335, same level as March 2023. Note I focus on horizontal oil rigs as those are what is used for tight oil wells.
Well, frac spreads were down 10 this past week, down another 10 the week before, and down 12 the week before that. That’s down 32 frac spreads in the last three weeks. I think frac spreads are what are used in tight oil wells. Do you have a chart for those?
Ron
I try to post those charts on the weekend and in the US and world posts. See below.
Ron,
We do not have good data on the split between frack spreads for oil and natural gas. Horizontal oil rigs are down by about 50 from 572 to 522 rigs since Nov 23, 2022. No chart on frac spreads, Ovi did one in last post, we do not know the nature of the frac spreads, where they are and if they are fracking oil or gas wells. Possible that most of the frack spreads dropped are in shale gas basins.
Mike posted this link yesterday. It got only one comment. It deserves more. Oil production is down and going further down. Peak oil was November 2018. Learn to live with that fact.
U.S. Shale Production Is Set For A Rapid Decline
Enno Peters’ 4/21/23 Permian post on Novilabs blog has likely been discussed here already.
However, couple of points I noted.
1. Average 6 month oil production dropped from 140k BO to 130k BO, despite increasing lateral length.
2. 2022 well completions were back over 5K, which was at 2018-19 levels. It took $90 WTI and strong natural gas prices to return there. Now we see rig counts and frac spreads falling at $70 WTI, prices much stronger than 2018-19.
I know these matters have been cussed and discussed here a lot.
Not sure how these shale companies can keep paying dividends AND maintain production at $70 WTI, sub 20% NGL’s and sub $2 natural gas. Especially with water disposal costs through the roof.
Shallow sand,
Yes the 2022 wells were not very good (though data may be revised over time, so it may be too early to make a judgment.)
For Average Permian well at 6 months cumulative output was 90.5 kbo in 2018, 100.8 kbo in 2019, 106.9 kbo in 2020, 115.5 kbo in 2021, and 110.5 kbo in 2022. The sample size for wells with 6 months of data for 2022 wells is small (only 3703 wells have the full 6 months of data for the April 2023 post of 5474 wells completed in 2022 as data fills in for the rest of the wells the 6 month cumulative will change.) I do not have the data for average lateral length. The Novilabs Permian post from December 2022 suggests relatively flat cumulative output at 12 months when normalized for lateral length over the 2017 to 2021 period (see link below). Also possible that some of the older DUCs that may have been completed in 2022 may not have had optimal spacing or other attributes that might have reduced productivity.
https://novilabs.com/blog/permian-update-through-august-2022/
Do the math . Mike S exposes the lies about the Permian by simple arithmetic . Layman language .
https://www.oilystuffblog.com/forumstuff/forum-stuff/dung-heap
China is changing all oil outlooks:
Another 3 year warning on Australia’s fuel imports vulnerability
http://crudeoilpeak.info/another-3-year-warning-on-australias-fuel-imports-vulnerability
Very interesting posting Matt. All of it.
Seeing the China situation through Australian eyes is an education.
As Marles said- this is not just a three year window problem, rather its a decade and beyond.
With that in mind, I’d be going ‘whole hog’ on electrification of transport.
The Weekly Rig and Frac Report for the week ending May 19.
Hz oil rigs are down 50 from the November high of 572, to 522.
Permian rigs have been increasing since September 2022, but the trend reversed at the end of April when they peaked at 345. For the week ending May 19, Permian rigs are down 4 to 335. Texas was down 8 to 296 and are at the same number as a year ago.
Hz NG rigs have been added to this chart. A sharp drop of 10 rigs occurred in the week ending May 12. A high of 152 NG rigs were in operation in September 2022.
Frac Spreads
Frac spreads have dropped by 10 for the last two weeks to 262 and are down 26 from a year ago and down 38 fro the high of 300 in November 2022. Note that both Hz oil rigs and frac spreads hit high in November 2022.
Ovi, thanks a million for these great charts. It looks bad for the shale patch. I think there are two reasons for the decline in rigs and frac spreads, as well as the coming decline in production. The first is that the world expects a coming recession. Actually, I think it has already begun as the price of oil points to low demand.
The second is returns on investment are not what they used to be from new wells.
Thanks again for the great charts.
Much appreciated Ron
Attached is another chart that shows Permian production may be in trouble. It is similar to the chart posted by David Messier in your comment above.
This chart focuses on the Permian. The DPR monthly increments for the Permian have been very volatile over the past year and a half but have settled down over the past 4 months and indicate that Permian production appears to be slowly rolling over. As usual, there will be a DPR update in the next US report.
As can be seen in March, Permian production increased by 32 kb/d. In June it is expected to increase by 15 kb/d, 1/2 the March rate. May’s rate was 13 kb/d.
My Grand-Daughter’s Permian Oil Production Scenario ….No Comment Necessary
steve
Thanks Steve,
I didn’t realize she as doing the analysis for you, that explains much.
Wow, 12 million barrels per day!
That 1000 kb/d spike in 2029 is a new super bench that will be discovered in Lea county in 2027 and is going to make headlines like: “Permian output to surge in 2029 and beyond.”
The below chart represents two different fields of data. The blue is All North Dakota, Bakken + conventional wells.
The red is Bakken shale only but includes the Montana portion of the Bakken.
Combined, they usually are pretty much a wash. In the All North Dakota data, what is left out of Montana production is pretty much made up by adding conventional production in North Dakota.
I show them both in order to show the piss-poor prediction ability of the EIA. The March production of the North Dakota Director’s data is the actual March production. The March DPR data is just an estimate of what they think North Dakota will produce in March. But North Dakota’s actual production was actually over 50,000 barrels per day less than what the EIA DPR estimated.
I have said it many times before. The EIA’s DPR predictions, whether it be for the Bakken, Permian, or total shale is not worth a bucket of warm spit.
Ron,
I agree the DPR is not very good. Note that the DPR includes all production from the counties that encompass the tight oil area and includes some conventional oil. The EIA’s “official” tight oil estimate for the Bakken (includes both North Dakota and Montana) are compared with the NDIC’s “Bakken” estimate in the chart below. Notice that the EIA estimate is below the NDIC estimate for February and March and if the Montana output was subtracted from the EIA estimate (typically this is about 40 kbo/d) it would have been 68 kbo/d too low in March 2023 (assuming the NDIC estimate is perfect).
Destroying Permian Well Productivity For DUMMIES…
While we can draw up all the nice Permian oil production scenarios until the COWS COME HOME… there’s a little dirty secret taking place in the BOWELS of the PERMIAN.
What is it?
It’s called the DESTROYING WELL PRODUCIVITY… ONE 3 MILE LATERAL AT A TIME…
The wonderful folks at Pioneer’s Investor Relations Dept put out a colorful Presentation suggesting the (100) 3-mile laterals in 2023 were an extension of their Version 3 Optimized Over & Under Wells with superior returns from extended lateral development.
As Legendary short trader Jim Chanos rightly says, “THE GOLDEN AGE OF FRAUD” is everywhere and there are new SUCKERS born every minute.
Unfortunately, if we are KEEN enough and look at the REAL DATA, Pioneer Resources is SO DESPERATE to keep production from collapsing, it is being forced to move to a higher number 3 mile laterals, which destroys productivity even more.
GOD HATH A SENSE OF HUMOR…
steve
Steve
Can you clarify the charts the resolution is hard to read. Are your calculations based on leveliziing well laterals?
JT,
Figures from 2019-2022 are based on averaging quarterly cumulative production for First 12-months per 10,000 feet of lateral.
Why should Pioneer move to longer Laterals if the average oil production per 10,000 feet of lateral is declining?
Simple… Reservoir Depletion.
steve
SRS,
In general, the longer the lateral per surface location, the less per foot drilling cost. That’s why they move to longer laterals. Not sure why you think a three-mile lateral will destroy productivity. I am under several 3-mile laterals, and they have worked well.
Also, remember that declining per well performance averages could simply be a result of dilution from peripheral wells exploring the extents of Tier 1 vs Tier 2. Not necessarily reflecting a declining tier 1 reservoir. However, all petroleum reservoirs decline, this is no surprise…. so why beat up the “Permian” for behaving as it should…. no “dirty little secret” from my perspective.
That is a very stark assessment. The well performance is declining exponentially. Year over year the numbers are roughly 6% 8% 12% the cumulative from 2019-2022 is 23% . If that trend continues 2023 could be 16-18% worse than 2022. Combined with rig and frac spreads falling it seems likely that growth has ended and production will start falling very soon. Or maybe 3 miles turns into 4 miles.
There is no reliable data available that would suggest longer laterals result in anything but higher liquids IP’s and more upfront cash flow. It IS clear these type of wells decline much faster. My observation is that liquids EUR’s (the ONLY metric that should matter for people worried about the future) are going down in the Permian and part of the reason for that might be longer laterals. If stages toward the toe of a longer lateral are not effectively stimulated (SPE/JPT/Woodmac) then RR of OIP is reduced and that rock is essentially condemned, yet another example of why RR’s struggle to be only 12%. Optimum lateral lengths are pretty well established and they ain’t 15,000 feet.
Permian core counties and sweet spots in those counties are stuffed with wells. It’s tough to find ‘slots” for longer laterals in all that maze of 6K ft. laterals and when it can happen they are mostly illegal allocation wells the TRRC allows, but that the Texas Supreme Court has yet to rule on with regard to Texas mineral law. Nobody drilling those allocation wells thinks that’s a risk. We’ll see.
The Permian Basin is America’s last hope for our country’s long term energy security. Folks keep lying about it its long term sustainability, wanting more investment money, less government/regulatory intervention, more export outlets, and the way the last of these valuable resources are being managed, and why, requires beating up on. Big time. With regard to flaring associated gas, and only 15% of produced water re-use as frac source water, most guilty of that ought to have their corporate asses kicked.
Mike,
Speaking of water in Texas, I found the following piece, which suggests recycling of produced water may increase, though some government intervention either by the State government or the EPA may be needed. To me the article seemed pretty good. Your thoughts would be appreciated because you know far more than me about this subject.
https://www.texastribune.org/2022/12/19/texas-permian-basin-fracking-oil-wastewater-recycling/
Dennis, this was a good article and the Tribune, thought to be a radical environmental outlet by anybody in the oilfield, is absolutely correct: water going IN to tight oil wells in a very arid West Texas, and OUT, is serious, always has been, and WILL affect the future of Permian tight oil production.
The sector has had eight years to act on this issue and its voluntarily, with few exceptions, done little. MSM stuff about 30% re-use is spoon fed by the tight oil sector itself, its less than half that.
The EPA essentially stays out of Texas business and allows the State to regulate issues pertaining to the Clean Air and Clean Water Acts. Water is owned privately in Texas and sold for big, big dollars. The TRRC won’t lift a finger to slow down the mighty tight oil sector; neither sadly will the Texas Commission on Environmental Quality. Bills will have to be created to make laws, but then will be fought vigorously by politicians in West Texas whose votes depend on jobs.
It’s all very short sighted, and self serving, and in Texas, just like America, nothing is a problem until its a disaster.
I agree with you 100% about tight oil exports, BTW; that too will someday prove to have been a disaster and the worst blunder in US energy policy history. We’re going to wish we has every bucket of that oil back, for our own needs.
Lastly, total gas to total oil produced basinwide is NOT how GOR is used as a measurement of basin performance. It is a well metric, or a sweet spot, core performance metric and what is happening with the largest producers in their core areas… matters.
Thanks Mike.
I guess the best one can hope for is that the free market takes care of the problem on its own. I doubt this will be the case, maybe government incentives for more water recycling infrastucture? I am unfamiliar with Texas politics, it seems there has been willingness to subsidize natural gas power plants, maybe the same can be done with tax incentives for water recycling for the fracking industry? Just a thought.
People in Texas would be more likely to listen to a Texas businessman like you than a Yankee.
My family, originally three generations removed from Georgia, used the word Yankee a lot. My grandfather would always say he was 14 years old before he learned that damn Yankee was actually two words.
Mike,
Yeah I forgot the Damn. My grandparents were immigrants.
The honest sorcerer — Mr B has a post . The final countdown . 9 min read .
https://thehonestsorcerer.substack.com/p/the-final-countdown
Mr B again . The future will be renewables — just not the way you were told . 6 min read .
https://thehonestsorcerer.medium.com/the-futures-going-to-be-renewable-1b41bf5c0372
If demand eclipses supply by 2 million barrels per day, this should drive prices to over $100 per barrel. This will be required to drive demand down to meet supply. This is assuming we do not have a default. That would drive demand down with no increase in prices.
Oil futures steady as US default risk offsets supply decline Bold mine.
U.S. President Joe Biden and top congressional Republican Speaker Kevin McCarthy will meet on Monday to discuss raising the federal government’s debt ceiling, just 10 days before the U.S. could face an unprecedented default.
“I expect plenty of volatility in the coming days and a bounce upward in crude prices as and when a deal is reached to raise the debt ceiling,” said Vandana Hari, founder of oil market analysis provider Vanda Insights.
The U.S. dollar, meanwhile, rose against a basket of other currencies, holding just below a two-month high, as investors waited on fresh signals on whether the U.S. Federal Reserve is likely to continue hiking interest rates and watched for news on the U.S. debt ceiling.
A stronger dollar can weigh on oil demand by making the fuel more expensive for holders of other currencies.
U.S. Minneapolis Fed President Neel Kashkari said it was a “close call” whether he would vote to raise interest rates or pause the central bank’s tightening cycle when it meets next month.
Higher interest rates boost borrowing costs, which can slow the economy and reduce oil demand.
Still, the International Energy Agency (IEA) warned of a looming shortage in the second half of the year when oil demand is expected to eclipse supply by almost 2 million barrels per day (bpd), the Paris-based agency said in its latest monthly report.
Asia will lead oil demand growth of around 2 million bpd in the second half of the year, a senior executive at Vitol(VITOLV.UL) said, an increase that could potentially lead to a shortage of supply and drive up prices.
Permian set for M&A frenzy as cash-rich producers seek reserve boost
Big companies do not want to report declining production. I presume the game plan will be to carefully control production on the new properties.
May 22 (Reuters) – Dealmaking is picking up in the Permian basin, the largest U.S. oil patch, as drillers look to quickly rebuild their depleting assets.
Permian is a prime target for producers looking to increase their inventory. The shale patch, which lies between Texas and New Mexico, has the necessary infrastructure and is known for high productivity and large undeveloped reserves.P
https://www.reuters.com/article/usa-oil-permian-basin/factbox-permian-set-for-ma-frenzy-as-cash-rich-producers-seek-reserve-boost-idUKL4N37J3F8
just a drive by to update on Texas’s path forward to affordable reliable energy. (as opposed to the unreliable expensive green energy alternative)
https://www.texastribune.org/2023/05/17/texas-electricity-market-bill-natural-gas-renewables/
“reliable”
Each fracked well reliable for a good 2 years ! (not a drive-by)
Texas tea,
If you want higher electricity costs, go with natural gas. Florida has more use of natural gas for electricity than Texas (in percentage terms) and higher electricity prices. Iowa on the other hand has a higher percentage of wind plus solar power net generation than Texas and has lower electricity prices.
A better use of money to reduce the risk of power outages would be to increase the interconnection of the Texas Grid with other US grids and/or to beef up regulations and fines for not having proper winterization of critical infrastructure.
See also Ercot report from link below and especially slide 16 which gives the most accurate representation of lost wind and solar output from the storm. The take home message is that natural gas is the problem, not the solution. Chart below from that ERCOT Report.
https://www.ercot.com/files/docs/2021/04/28/ERCOT_Winter_Storm_Generator_Outages_By_Cause_Updated_Report_4.27.21.pdf
This article is far too long to quote all of it. So I have selected parts of it to show you. It’s all about lower oil production in the coming months.
Are We Nearing An Inflection Point For Oil? Bold mine.
SNIP
The market has already priced in lower-than-expected Chinese economic growth figures, and the combination of reduced OPEC production and a slowdown in Canadian oil production is anticipated to support crude prices in the coming months.
SNIP
These concerns arise from a combination of factors, including potential interest rate hikes by the Federal Reserve, slower-than-anticipated economic growth in China, and the looming possibility of a US default. Furthermore, hedge funds are concerned that OPEC+ may not fulfill their commitments regarding oil production output.
SNIP
In the coming weeks, there is a potential for a significant shift in market sentiment towards a more bullish outlook. The continuous decline in inventories is likely to awaken the majority of market participants. Producers, with their current strategies, may even consider further production cuts if prices drop below $75 per barrel, signaling a strong bullish signal. Additionally, a resolution to the political farce surrounding Washington’s debt ceiling, coupled with robust demand during the holiday season worldwide, could further bolster the bullish sentiment.
SNIP
The ongoing curtailment of Russian oil production due to Western sanctions poses significant risks to the market. Analysts estimate that 2-2.5 million barrels per day (bpd) of Russian oil production, out of the current 11 million bpd, could be at risk. The latest monthly report from the IEA suggests a potential shortage of 2 million bpd in crude oil supply in the second half of 2023. However, this estimate may already be optimistic considering the statements made by the G7 over the weekend, indicating their intent to strengthen efforts to counter Russia’s evasion of price caps on its oil and fuel exports.
For a long time we referred to it here as the goldilocks problem: if oil (and other inputs) are too expensive it creates inflation and forces economy to slow. if the economy is slowed too much, it doesn’t create enough money flow to increase oil production. i think we all agree US shale delayed that for a decade plus. might be there now.
On a lighter note .
So Saudi’s energy minister is going after short sellers. Sounds a lot like Jamie Dimon talking about the evil short sellers when it comes to banks.
Oil prices aren’t down because of the evil short sellers.
It’s just laughable. Oil prices are down because global economy isn’t doing well. Last thing economy needs is elevated oil prices. Particularly when fundamentals call for lower oil prices.
Artificially trying to keep prices higher just puts more strain on a weak economy.
Saudi warns speculators of more pain as OPEC meeting looms
https://www.brecorder.com/news/40243721/saudi-warns-speculators-of-more-pain-as-opec-meeting-looms
“Speculators, like in any market they are there to stay, I keep advising them that they will be ouching, they did ouch in April, I don’t have to show my cards I’m not a poker player… but I would just tell them watch out,”
Sounds like fighting words to me.
OPEC exports down by 2mbpd in April . HFI research ,
https://twitter.com/HFI_Research/status/1660699813489545216/photo/1
Below are two tables that show the distribution of frac spreads across basins, counties and states. The results are for the week ending April 14. Weeks after that do not have complete and up to date info.
I have been able to track some primarily NG states and counties. If a county is in the Permian, no attempt has been made to determine if the county is primarily a producer of oil or NG.
The Permian and Texas account for 50% of the frac spreads.
NG fracs account for a minimum of 16% of the total. There may be more not accounted for in the Permian.
The official Frac site states there were 283 spreads operating that week. Cannot account for the extra 16.
Basins vs Counties.
Ovi: Thanks for this!
Just 4 in Midland.
Shallow Sand
The week previous to the one above was showing 15 frac crews. Not sure of the reporting delay. Here we are in late May and that number does appear low. Will check Midland again near end of week to see if the frac count increases.
From Zero Hedge
Crude -6.799mm (+700k exp)
Cushing +1.711mm
Gasoline -6.398mm (-1.3mm exp) – biggest draw since Sept 2021
Distillates -1.771mm (+300k exp)
After two weeks of builds, API report crude stocks fell 6.8mm barrels last week – the biggest draw since March. Additionally, gasoline stocks plunged.
Using EIA data for tight oil
https://www.eia.gov/energyexplained/oil-and-petroleum-products/data/US-tight-oil-production.xlsx
and shale gas
https://www.eia.gov/naturalgas/weekly/img/shale_gas_202303.xlsx
For Permian, Bakken, Eagle Ford, and Niobrara plays we have the following for US tight oil gas oil ratio (GOR) in MCF per barrel of oil for 2000 to 2023. Recently (past 12 months) the GOR has been around 3.42 MCF/bo.
Dennis, gas to oil ration is the ratio of the gas that comes up with the oil in oil wells. Sometimes it is captured and sometimes it is just flared. It is also known as associated gas. That is gas associated with oil wells.
The Texas Railroad Commission calls it casinghead gas.
Ron,
At Novi labs they find all gas produced in a basin from horizontal wells and divide by all oil produced by horizontal wells in that basin, in the tight oil basins most of the wells produce both oil and natural gas.
We don’t have a way of identifying oil vs natural gas wells basinwide without doing a well by well analysis on 100s of thousands of wells, I don’t have either the time, or money to do that so rolling up big sets of data is the best I can do. Not perfect, but its what I have.
Dennis, that is all fine and dandy, and you are justified in doing that. What you are not justified in doing is calling it gas-to-oil ratio, or GOR. That is not what GOR means when drillers talk about the rising of GOR. They are talking about the increase in gas that comes up with the oil. They say the well is “gassing out” when the GOR is rising.
Of course, you have no way of knowing what that ratio is for the entire Permian Basin. That is because it varies from well to well. The really sweet spots probably gas out a lot slower than those on the fringes.
My point is the term “GOR” is part of the vernacular of the oil industry. And what you are calling GOR is not what they call GOR.
Gas/oil ratio
When oil is produced to surface temperature and pressure it is usual for some natural gas to come out of solution. The gas/oil ratio (GOR) is the ratio of the volume of gas (“scf”) that comes out of solution to the volume of oil — at standard conditions.
A point to check is whether the volume of oil is measured before or after the gas comes out of solution, since the remaining oil volume will decrease when the gas comes out.
In fact, gas dissolution and oil volume shrinkage will happen at many stages during the path of the hydrocarbon stream from reservoir through the wellbore and processing plant to export. For light oils and rich gas condensates the ultimate GOR of export streams is strongly influenced by the efficiency with which the processing plant strips liquids from the gas phase. Reported GORs may be calculated from export volumes, which may not be at standard conditions.
The GOR is a dimensionless ratio (volume per volume) in metric units, but in field units, it is usually measured in cubic feet of gas per barrel of oil or condensate.
EIA give annual numbers for associated gas and crude only by production area – below shows GOR for the four districts covering the Permian. There is enough data to calculate condensate to gas ratio for the districts as well but I haven’t done that yet.
Thanks, George. It looks like RRC District 7C has a rising GOR problem. But they all are rising. I would think that is just what happens as a reservoir depletes.
For context this shows the relative production of crude from each district, 7C is a minor actor. For all solution drive reservoirs the GOR increases with age, in conventional reservoirs enough sampling and lab analysis is done to fairly well predict an accurate production profile. It seems for tight oil the rising GOR is a bit more of a surprise, which maybe because the way the multi-phase processes, gas evolution and transport etc., occur in the tight rock fractures isn’t fully understood (probably because the actual state of the fractures can’t really be known rather than because the physical processes aren’t understood).
Thanks George,
For Texas Permian I get a GOR of 3.88 MCF/bo for 2021 (4942/1272). For New Mexico East I get a GOR of 3.98 MCF/bo in 2021.
Solution gas driven, boundary-defined shale oil reservoirs reach bubble point, GOR keeps increasing and liquids productivity declines. The poor way in which tight oil wells are frac’ed, then produced (gutted), is why recovery rates of oil in place are only 10-12% The rest of that OIP is pretty much stranded, forever. That is what happens when one puts cash flow before EUR. Not good for the country, uh?
But old tight oil wells don’t keep getting gassier and gassier, and stay that way. When the last stages of depletion set in, GOR goes down. The large percentage of mature tight oil wells in both sub basins that have 75-80% water cuts, make less gas, not more gas. That is why total gas over total oil in the Permian Basin, or even its two sub basins, is meaningless. Sweet spots in core counties are getting gassier and gassier and oil productivity, (excluding NGL’s) is declining. Again, GOR is a well, trend and sweet spot specific performance metric.
The western half of District 7C is the Midland Basin, the heart of Saudi America. District 8 is the Delaware Basin.
Got it. Thanks, Mike. The water cuts keep getting higher, even in shale wells. I wish we had some indication of what’s happening with water cuts in the Permian.
These comments are going to be viewed by historians as LEGENDARY!!!
Why aren’t we getting Mike S, Shallow, LTO, Ron, Dennis, Ovi, OFM, Andre the Giant (LOL), all the specialists to have this discussion on strategic policy????
In hindsight…it was so obvious!!!
I don’t detect much “grifting” in the room (maybe some shale bugs outside of the names listed)
Who is “we” of course?
Andre, I hate to break it to you, but we are just observers. We can discuss strategic policy until the cows come home, but it will not make one iota of difference. We do not make policy Andre; our strategy is just a lot of words with no effect whatsoever on actual policy.
I started to say we are but bit players, but we are not even that. We do not have a bit to play in this grand scheme of things. We are but observers, nothing more.
For those with the impression that GOR must be much worse for the Permian basin which produces about 68% of US tight oil as of March 2023, the chart below has Permian basin GOR based on EIA data. Last 12 month average GOR was 3.27 MCF/bo for Permian basin vs 3.42 MCF/bo for 4 major tight oil basins.
Dennis, I don’t think anyone who has been watching believes that the Permian is any gassier than the other shale basins. All shale oil basins will eventually reach a Bubble Point Death, where oil production falls precipitously and gas comes rippling out of the rock. Until it doesn’t.
Your charts are misleading regarding the Permian because the only GROWTH zone, the Delaware Sub Basin, has a much higher IP GOR, especially those in the shallower eastern benches of SE New Mexico, and therefore a lower EUR, as well as a higher water cut. Since New Mexico doesn’t want the wastewater, about 50% has to be transported to Texas, where the mother of all fault line extrinsic pressure experiments is being run. Compare the GOR in the Delaware, CURRENTLY, to the GOR in the entire Permian. THAT is some meaningful data. And when you do that, you’ll understand why people are getting so damn nervous. And why your prospective models may be a bit off.
The new wells in the Bakken are sterling, and they balance out the thousands of old wells that have hit the Bubble Point Death. Gas is worthless in the Bakken because to get it out of there means new interstate pipelines, and under this administration, in this environment, that’s not going to happen. That’s why the rig count is so low.
The heart of the Niobrara is Weld County, which is the worldwide showcase for how to do it right. A large pipeline infrastructure was built prior to drilling so water for fracking is piped in and wastewater is piped out. Chevron bought PDC for the Niobrara, where PDC owns 300,000 acres w 1,000 new permits, as opposed to the Delaware, where PDC has 30,000 acres in a zone w deteriorating well dynamics. The grand old Wattenburg field was predominantly gas, and it is part of the Niobrara. The GOR in the Wattenburg is sky high, but the new wells just south of Cheyenne are big oil wells. So it balances out.
On our little ranch we had a good horse who cleverly figured out how to move a snaffle bit around until it didn’t hurt. He’d set the bit and go where he wanted to go, which wasn’t necessarily the best place for him to go.
You, sir, are that horse.
Gerry,
Just using the data I have easily accessible. The EIA does not break out shale gas to various Permian sub-basins so the data that exists is Permian shale gas and for tight oil it is broken into Spraberry, Wolfcamp, and Bonespring.
Note that any chart can be broken down further, if I gave you Delaware, you’d say, no good you need Delaware Wolfcamp, if I provided that, you say it should be Wolfcamp A XY.
The EUR in the New Mexico part of the Permian is higher than that in Texas. If we compare the average 2018 to 2021 Midland county well with the average Lea county well (2018-2021) we find at 24 months the average cumulative output is 224 kbo for Midland and 287 kbo for Lea. Data from Novilabs link below
https://public.tableau.com/shared/KJJQ256YQ?:toolbar=n&:display_count=n&:origin=viz_share_link&:embed=y
In Dec 2021 GOR for Lea and Eddy counties was 4.57 and for all Permian was 3.82 based on Novilabs data, for Midland and Martin counties the GOR in Dec 2021 was 2.73, so much lower GOR in Midland basin core vs Delaware basin core. The Novi labs data is not very accessible, I cannot simply download a spreadsheet, too much work to pull up county by county GOR data.
No, I’m not looking to criticize you. I’m saying that your charts showing comparisons of large basins—all long in the tooth—are near meaningless in looking at what is currently happening in the growth areas.
In order to make realistic projections about shale, a person needs to home in on the large growth zone, and that’s the Delaware. And it doesn’t look that great to me. Maybe I’m wrong. Maybe what all the cheerleaders say is correct and we’re going to see a bounty of riches.
Gerry,
Perhaps you are correct. I just don’t have access to data to produce the charts you would like to see. For comparison to Permian, Niobrara and Eagle Ford are included below, same problem you pointed out earlier with all this data, it is far from ideal, it is what I have. Recent GOR for Niobrara around 5.7 and for Eagle Ford around 4.6 with Permian at 3.3 (with Delaware basin is likely higher at 4.5 or so). Not clear at what point the high GOR becomes a problem, water is also an issue in dry West Texas, though potentially more water recycling might reduce that problem.
“Recent GOR for Niobrara around 5.7 and for Eagle Ford around 4.6 with Permian at 3.3 (with Delaware basin is likely higher at 4.5 or so). Not clear at what point the high GOR becomes a problem”
Dennis, the comparison of the GOR in the Niobrara to that in the Permian is meaningless. Furthermore, it is misleading. There is a geothermal anomaly in the Niobrara, and it created the giant Wattenburg field, which is VERY high in NG. This dramatically skews the GOR for the basin. To my knowledge there is no such hot spot in the Permian. You can’t take the Niobrara with a GOR of 5.7 and compare it to the lower GOR of the Delaware and say, well gee, the Delaware must be okay. It’s like comparing apples to oranges. It’s valid to compare the higher GOR of the Delaware over time, or to its contiguous neighbor, but not to another basin that is very different in character. There’s predominant NG pockets all throughout the Niobrara.
Any guesses for the peak 2023 oil price this June?
Mine is $95/brrl (WTI) by mid to late June…It’s up almost 10% in May already, seems like that would continue for another month at least…if economy is too soft maybe it only hits the low 80’s…
Return to 90’s this summer seems inevitable…
I know HHH is still calling for $25 oil but hasn’t happened yet…
Kangeo
Last January I think Ron put out a challenge for the average price of oil for 2023. Attached are those guesses, yours included.
Ovi – Thanks and I recall this, but I’m wondering more about what the near term peak will be in next ~30 days…seems like there’s a bull run on oil right now, question is how high? Would make sense that it moves back to the average of ~$90, but I could see an argument to go a bit higher, like ~$95-100…curious what others think…
why does it “seem” like a bull run? the cycle low was may 3rd, so that’s a bullish trade, sure. BUT this is a low not seen since January 2022. That’s a 1.5 year LOW!! that doesn’t scream bull to me.
Meanwhile the trend (3 months, AND six month AND one year btw) is still negative. Oil Volatility also went up today (OVX^) and volumes have been down except on down price days. You really trying to pick the bottom here?
On the other side you’ve got the surprise inventory drawdown (though from chart above OECD stocks are right at 5 year average) and the OPEC threat of cuts. “summer driving season” is also thrown around a lot, though with covid having ended over the past year and a mild winter, I’m wondering how much of that travel demand has been pulled forward.
Oil is the only industrial commodity that has this kind of cartel help. Copper was down 2.5%, Steel down 1.6%, Tin down 2.5%.
full disclosure: I am short oil related equities.
if I were looking seriously at going long oil I would study the history of OPEC cuts – how frequently have they done successive cutting regimes and what was their effect on prices. In the past I think the US had some influence to prevent OPEC cuts, it seems like that has reduced. And they will at least THREATEN to cut about 10 more times which will definitely boost oil prices. So the bull case is: don’t fight OPEC?
Inventories are still low, so price would tend to move upwards to balance supply. US is supplying products to Europe, so that could be part of the issue. Oil price could be artificially low due to sanctions placed on Russian oil prices ($60 per barrel).
Just looking at the chart, bottom hit $65 in mid March, now trading off that basis and next stop appears to be $85 within 2-3 weeks (by June 14), which is only a $10 move from current levels.
As far as drilling in US goes, breakeven of at least $70 per barrel also would support pricing at least $70-$80.
Big difference today versus a year ago are interest rates, cutting into ability to borrow and likely driving inventories lower (less $ to pay for storage). Could be a feedback loop that ultimately causes a big spike in oil price at some point (a year ago oil hit $122 in early June).
So sounds like your guess for June is a 10% drop from current levels, maybe $65-$70?
As far as OPEC goes, sounds like they have no interest selling oil for <$75, which likely means support moves up to $75 this week. A peak to $100 per barrel sometime in June should surpise anyone.
We'll find out pretty soon which way things are headed…I'm long oil related Options
If I had to take an oil position – yes I would go long Puts ITM maybe expiring 14 days from now if price opens above $74.30. Yes.
Germany in recession – but they’re not a big economy so I’m sure oil demand will be fine.
“Gross domestic product fell by 0.3% in the first quarter of the year when adjusted for price and calendar effects, a second estimate from the statistics office showed on Thursday. This follows a decline of 0.5% in the fourth quarter of 2022. A recession is commonly defined as two successive quarters of contraction.”
https://www.reuters.com/markets/europe/germany-enters-recession-2023-05-25/
China – also, not a factor at all for industrial growth and consumption.
And copper not a critical industrial component, but it is sometimes called something… can’t remember… Teacher Copper? no that’s not it. Police Officer Copper? ugh I’m an idiot what is it? Lawyer Copper? I can’t remember. I’m losing it, maybe I should go see a Doctor.
“The metal has tumbled about seven per cent this month in the face of disappointing economic data from the world’s top consumer, after the end of China’s COVID-19 lockdowns spurred sharp gains earlier in the year. Instead, poor domestic demand has seen Chinese smelters ramp up exports, helping replenish exchange inventories.”
https://financialpost.com/commodities/mining/copper-price-plunge-china-economic-growth
My guess is China is really going to need lower oil prices and soon. Or else 😅
Kengeo,
For WTI my guess would be $75/bo, if OPEC cuts again at next meeting we might see $80/bo in June.
The market seems well supplied at present and we might be heading into a recession, so even with OPEC cuts we might stay at $75/bo. If I were to make my guess now it would be a $70/bo for 2023 average price for WTI, best guess range would be 60 to 80 per barrel.
Oh yes, very well supplied while dumping the SPR. I wonder what would happen if that ever ended?
My prediction isn’t doing too well at moment. Hoping for a big price jump in the second half.
For the price discussion . Art Berman does a post ” Bear Market Maths ” .
https://www.artberman.com/2023/05/23/bear-market-math/
Shale with a 45 % decline rate . Trust the data .
https://twitter.com/WhiteTundraSG/status/1661098076168404995/photo/1
Hole in head,
The Novilabs data is not complete, those charts rely on RRC data which is incomplete for 12 to 18 months.
The recent RRC data has always been bad, that’s why the Novilabs posts always say:
Permian tight oil production topped 5 million b/d at the end of last year and came in at around 5.2 million b/d in January (after upcoming revisions, horizontal wells only).
Note the “after upcoming revisions”. The chart in the post has output at 4.9 Mb/d in Jan 2023, about 300 kb/d lower than the estimate in the post. The EIA estimate for the Permian in Jan 2021 was about 5.1 Mb/d, slightly less than Enno Peter’s estimate (I expect the EIA estimate will be revised higher later, Enno Peter’s does a better job on this). The chart in the twitter post may come from someone with a subscription to Novilabs data tht does not realize the most recent 6 to 12 months of data is not very good and will be revised up. Note that Enno peters in April 2023 only reported data through Jan 2023, dropping the most recent few months of data and noting that even data from Jan would need to be revised higher by about 6%.
Short answer, 45% decline rate is bunk. It might occur if all completions in the Permian basin stopped, but last I checked about 460 or so wells were being completed each month. Output is likely to continue increasing unless we see a big drop in the rate that new wells are completed in the Permian basin.
Also not all “data” is correct, often it is revised, especially RRC data from the past 12 to 18 months.
The average 2019 well decreased at an annual rate of 44% per year from Dec 2019 to Dec 2022, but 14 k wells were completed from Dec 2019 to Jan 2023 and Permian basin output increased from 4.1 to 5.2 Mb/d. The recent annual rate of completion (at about 460 wells per month is about 5500 wells per year) will likely see Permian output increase at about 350 kb/d per year.
Tks Dennis for the clarification . Let us see if Steve can shed some light on this . It is his POV , but thanks for pointing this out . Data is a bitch and Mike S has something to say on this .
https://www.oilystuffblog.com/single-post/bad-estimates-cause-problems?postId=a3621165-ae11-4c08-8723-5f0e9c5bb424&utm_campaign=bbaddf3b-a875-4df4-8136-6fa7d870e479&utm_source=so&utm_medium=mail&utm_content=b824b7a1-156a-48b4-b6ed-3902bfc9ee17&cid=fa335351-37bb-44a6-9899-f8c34b4a0f81
No signs of cut in seaborne crude from Russia .
Pipeline exports don’t look so good anymore. Since February, Poland has stopped importing Russian oil.
https://www.reuters.com/business/energy/how-eu-ban-russian-crude-affects-oil-flows-2023-02-27/
https://www.bruegel.org/dataset/russian-crude-oil-tracker
The situation is similar for natural gas.
https://www.spglobal.com/commodityinsights/en/market-insights/latest-news/natural-gas/020223-russian-pipeline-gas-flows-to-europe-drop-to-new-low-in-january
Also Russian government is considering a possible gasoline export ban.
https://www.reuters.com/business/energy/russia-considers-gasoline-export-ban-sources-say-2023-05-23/
Tweet from Steve on the Permian and New Mexico .
https://twitter.com/SRSroccoReport/status/1661097316311515136/photo/1
https://twitter.com/SRSroccoReport/status/1661097316311515136/photo/2
Canadian oil sands output expected to reach 3.7 mln bpd by 2030 – S&P Global
May 25 (Reuters) – Canadian oil sands production is expected to reach 3.7 million barrels per day by 2030, S&P Global said on Thursday, raising the analytics firm’s 2030 production outlook for the country for the first time in half a decade.
S&P Global raised its output estimate for 2030 by 140,000 barrels per day from last year’s outlook.
“The Canadian oil sands have entered an ‘era of optimization’,” said Kevin Birn of S&P Global Commodity Insights, adding that moving production to high-potential areas adjacent to existing development is the most significant contributor to output growth.
Canada is expected to continue to post record production and export levels in the future, according to S&P Global. However, growth is expected to slow in the mid-2020s and decline in the early 2030s. This is due to the long flat production profile of Canadian oil sands assets.
Imperial Oil Ltd, Cenovus Energy Inc, Canadian Natural Resources Ltd, ConocoPhillips and Suncor Energy Inc are major producers of crude from the oil sands, which hold the third-largest proven oil reserves in the world, according to the Canadian government. (Reporting by Arshreet Singh; Editing by Maju Samuel)
Ovi,
Do you know what the current production from the Canada oil sands is? I came across data saying in 2021 it was about 2.8 mmbopd. This would seem to be one place in the world where production could increase over the next 5-7 years. The resource is there, as long as they are allowed to produce it.
Bob
The Canada Energy Regulator reports the following for February.
Raw Mined Bitumen Raw In Situ Bitumen (b/d)
1,713,282 1,775,892
This is close to 3,500 kb/d. If S & P is correct, it appears there is only about 200 kb/d increase from current production. In going from bitumen to SCO, there is a 17.5% loss in volume. Canadian Oil Sands in the mid twenties in their quarterly updates reported the loss in going from Bitumen to SCO. Attached is a snip I took from an old report.
Bob
Attached is a yearly chart of Bitumen production. This chart indicates that the oil sands are close to peak production and will be trying to eke out small gains every year.
Total oil sands production in Canada from 1967 to 2021
Oil sands production in Canada amounted to nearly 180 million cubic meters in 2021, reaching a peak in production. Since 1967, the production of this unconventional crude oil type has grown significantly. Oil sands are also known as crude bitumen and today account for the majority of Canadian crude oil production.
Doing the math. One cubic meter =
264.172052 Gallons or
6.6043013 Barrels at 40 gallons to the barrel
180,000,000 Multiplied by 180 million
1,188,774,234 Divided by 365 to get barrels per day
3,256,916 Barrels per day in 2021
3,700,000 By 2030
443,084 or an increase this much by 2030 or in nine years.
49,232 Means an increase of just under 50,000 barrels per day per year over the next nine years.
That ain’t that much to brag about.
Ron
It could be even less than 10 kb/d/yr.
Ovi, looking at your data, I think you are right.
Ron, Ovi:
Bitumen mining is stabilizing as the major extraction plants reach capacity, the data you show indicates no more major facilities will be added in the future ( probably realistic). My question is this – For the 70% of the tar sands that are not economically viable for the mining approach due to overburden, SAGD is utilized, is this component of oil sands production lumped in with the bitumen guys, or is it lumped in with traditional oil production? Given the right pricing environment, SAGD is certainly able to expand incrementally in relatively modest capital investment chunks.
Many here also follow Dr. Tim Morgan’s blog — Surplus Energy Economics and his theory of EcoE ( Economic cost of Energy ) . I found this article that makes an effort to connect our current state of affairs to Dr Morgan’s theory .
An interesting angle to our predicament .
https://nakedemperor.substack.com/p/the-everything-bubble-the-end-of
The Monthly Energy Review is just out. They have March production down by over a quarter of million barrels per day and April up by 51,000 bp/d. However, these last two months are subject to revision.
Shallow Sand
I have looked at today’s updated Frac data and it shows only 2 frac crews operating in Midland in the week April 15 to 21. Based on the data supplied, no spreads were added between March 24 and April 6.
Below are fracs by county, Basin and State
Fracs by Basin and county
Ovi, thanks!
The majority of Midland Basin frac crews are in two counties, Howard and Martin. Those counties are each approximately 30 miles by 30 miles, about 900 square miles. As I recall, not all locations in either county are considered Tier 1.
When you look at how many wells are already there, and do a little math using two mile laterals on 330’ spacing (which has to be about as tight as they can go) can see the end is near, unless there truly are multiple Tier 1 benches.
Midland County is maybe close to over regarding new wells? Same with Upton? I’m under the impression the wells in Reagan aren’t great, and that wells in counties such as Crane and Andrews may be wells trying to hit residual oil zones in the mature waterflood and CO2 flood projects, and not shale wells.
Looks like it’s went from being “all on the Permian” to “all on the Delaware Basin.”
Given Pioneer is so heavily Midland Basin focused, any surprise it is trying to be bought?
The Delaware Basin essentially means Lea County, New Mexico. It’s now rolling over. Gassy oil wells are becoming very watery, oily gas wells. Watch EOG in Lea County; it can carpet bomb the Bone Springs two more years, maybe. When it’s done, Devon and COP will not be far behind and that’s all she wrote.
Don’t be fooled by how big the Delaware Basin is, it’s actually getting smaller and smaller. And its getting the shakes, big time. In the Delaware life cycle bubble point is followed by increasing WOR…New Mexico doesn not like earthquakes so it sends all of its produced water to Texas for re-injection, and Texas in now getting a belly full. 3’s and 4’s don’t even make the news anymore but they are still happening.
LOES in high WOR Delaware wells, Shallow, make 20-25 BOPD wells at, or near economic limits, even at $70. Natty prices is killing those guys out there. It’s Friday Night Lights again in Waste Texas.
Mike:
With EOG, I’m always reminded of the almighty Parshall field they operate in the Bakken.
Lots of “monster wells” drilled there 10-15 years ago.
The 459 producers EOG operates in Parshall averaged just 19 BOPD per well in March, 2023. Many are SI, probably need to be plugged.
I assume they have a lot of idle wells in your neighborhood too?
Mike you are spot on. It’s almost game over for the Permian as far as shale goes. Great post.
LTO Survivor,
Would you guess another two years at current drilling rates for Permian to be done? The recent completion rate for all of the Permian basin is about 460 wells per month times 24 months would be about 11 thousand completions for a total well count of about 52 thousand total wells completed in Permian basin ( the current horizontal well count as of Jan 2023 is about 41 thousand wells). Does that seem a reasonable scenario to you?
In my view such a scenario is short by 50 to 60 thousand wells of what is likely.
Gas oil ratio in Lea county for horizontal wells is about 2.77 MCF/bo based on Novilabs data for December 2022. I do not have data on water. The 2022 wells are about as productive as the average 2019 well, not sure how much lateral length has changed there, I do not have access to that data.
For 2019 to 2022 wells about 70% of Lea county wells were completed in Wolfcamp A, Wolfcamp A XY, Second and Third Bonespring, and 3rd Bonespring Lime.
The wells are quite productive from these formations with cumulative output of 312 kbo at 24 months for the average 2019 to 2022 wells from the 5 formations listed above in Lea county New Mexico.
Mike in past 25 months (Dec 2020 to Jan 2023) 1661 wells were completed in Lea county with about 912 wells completed in 2022, lets guess about 900 wells get completed in next two years, so another 1800 wells bringing the total wells completed in Lea county to 6642 wells, if we assume 300 acres per well thats about 2 million acres, but note these wells are spread over 5 formations. If we want to be conservative we assume three formations will see the bulk of the development, all of Lea county consists of 2.8 million acres with potentially 3 benches that comes to 8.4 million gross acres, let’s assume about 40% of this is prospective which brings the total down to 3.36 million acres with about 2 million already developed leaving 1.36 million acres, at 300 acres per well that suggests about 4500 more wells above the two years you foresee. At 900 wells per year, that would be another 5 years. My guess would be perhaps another 5 to 7 years of new wells in Lea at the 2022 completion rate.
I agree the flaring should be stopped, water should be recycled (perhaps with state tax breaks to encourage development of infrastructure) and exports of US crude outside of North America should stop. If all of those happened the drilling rate could be reduced to 450 per year (or perhaps less) and the resource would last longer. Exporting natural gas is also a bad plan and new LNG facilities should no longer be approved so that at least we will not continue to increase the level of natural gas exports, unfair to shut down existing facilities or those that have started construction in my view unless the businesses are compensated for their stranded investments (in the case of government changes in policy causing the stranding).
D Coyne: “ Exporting natural gas is also a bad plan “
You outlined an elaborate plan for almost unchecked oil exploitation in Lea County, then followed it with the above. Those Lea County wells are coming on with a lot of gas. If you don’t want to flare it and you don’t want to export it, how on earth are you going to do this big buildout?
The shale oil is finally painted into a corner. Many oil wells in both the Bakken and the Permian have reached the bubble point, so soon they will be making more gas. This is happening to hundreds of thousands of wells. And yet the only major growth area is exceptionally gassy. At a time when gas is being “certified,” flare and you’ll lose the market to the field of little flaring: the Haynesville.
This is the point I’ve been trying to make for some time. The Achilles heel of shale oil is the gas.
Gerry,
Not a plan, simply an observation of how many wells might be completed in the future under the assumptions outlined. There may be far fewer wells completed due to too much gas and water produced depending upon prices and regulations.
I do not think it is a good idea to waste natural gas by flaring or to drain the water from West Texas and New Mexico by lack of recycling. If development is slower then perhaps there will be enough water recycling capacity, natural gas takeaway capacity, and LNG export capacity to handle natural gas and water from the Permian basin.
Also note that I pointed out that putting such policies as an export ban on oil and no further development of LNG export facilities would lead to fewer completions. If we assume 5500 completions per year is the current rate, reducing the completion rate by a factor of 2 increases the time the resource is exploited by a factor of 2, reducing the completion rate by a factor of 3 increases the longevity of the resource by a factor of 4, etc.
The point is the buildout occurs more slowly and may conserve resources.
Gerry:
Great point!
I’m glad you came back here! This blog needs more posters like you, Mike and LTO Survivor.
Shallow Sand
When you mentioned Midland earlier on, I thought that you were referring to Midland County. I did not realize that Midland was also a basin. That is one of the consequences of an analyst sitting up in Toronto with no knowledge of Texas oil and county geography. So feel free to keep me updated.
Below is todays updated frac table. You mention Reagan county. Note it is up 5 crews from yesterday, 3 to 8.
Ovi.
As I recall, Midland Co, Martin Co, Howard Co and Upton Co had the best Midland Basin wells.
But that’s been awhile ago, maybe that has changed?
Also, as I recall, the Midland Basin wells are lower WOR and GOR than the Delaware Basin wells. Also, I thought generally they were cheaper to drill and complete?
Maybe I’m wrong on that?
I really have quit paying close attention to all of this stuff so hopefully I’m not stepping in it too much.