By Ovi
Below are a number of Crude plus Condensate (C + C) production charts, usually shortened to “oil”, for oil producing countries. The charts are created from data provided by the EIA’s International Energy Statistics and are updated to November 2023. This is the latest and most detailed/complete World Oil production information available. Information from other sources such as OPEC, the STEO and country specific sites such as Brazil, Norway and China is used to provide a short term outlook.
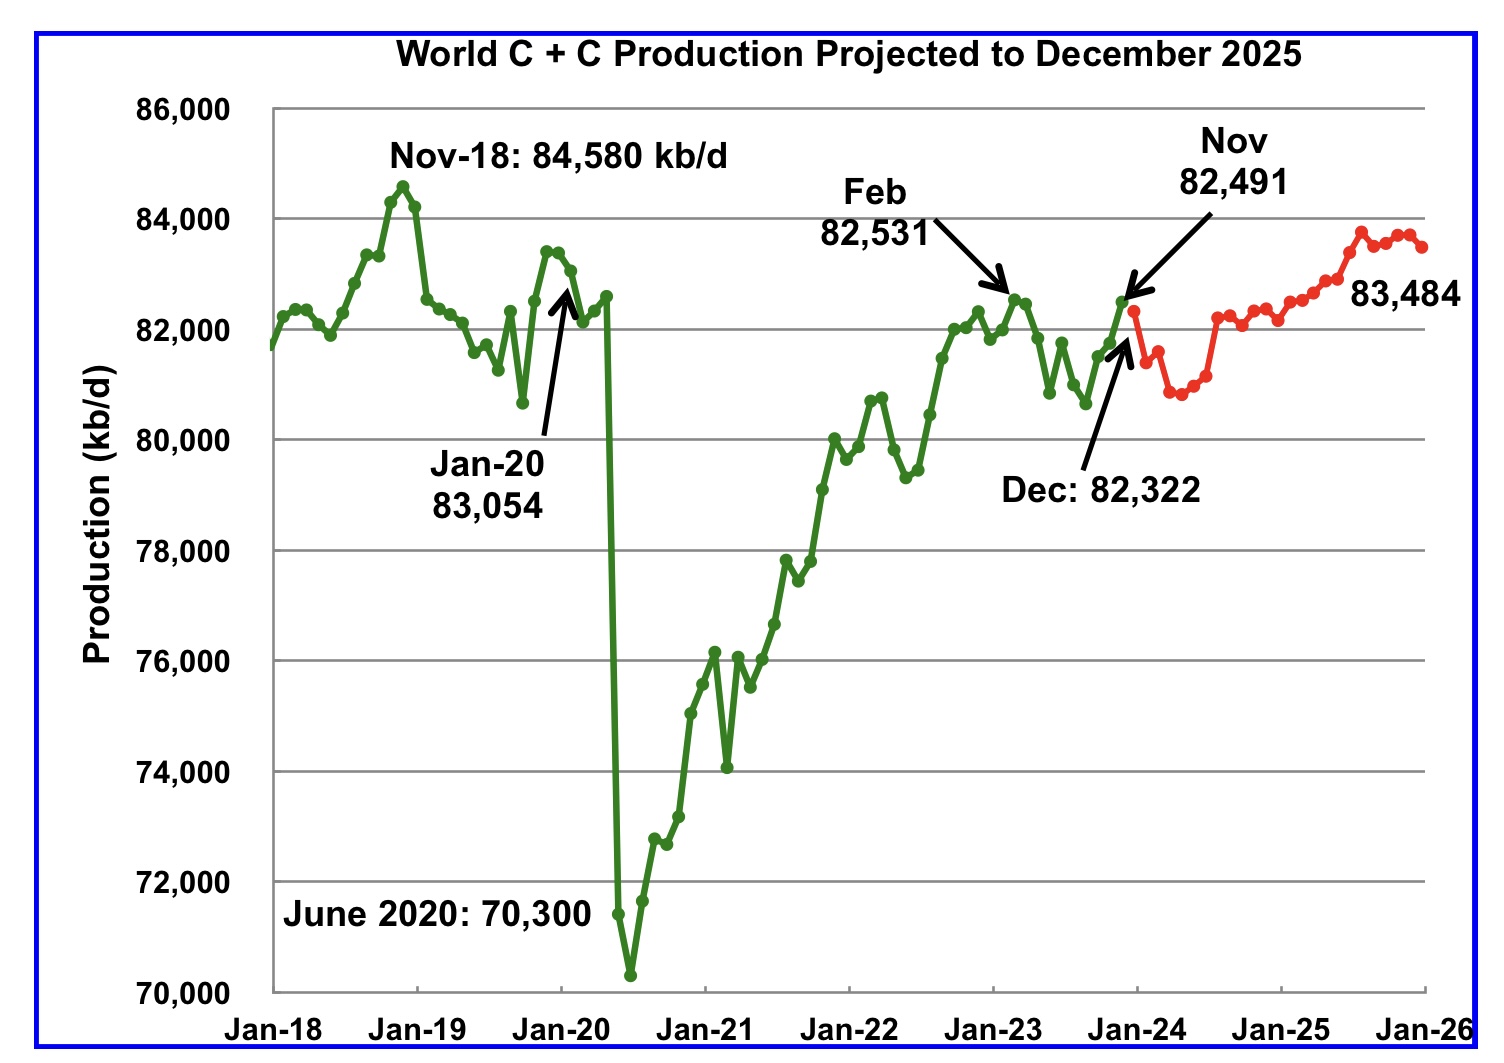
World oil production increased by 745 kb/d in November, green graph. The largest increase came from Canada, adding 360 kb/d. December World production is projected to drop by 169 kb/d to 82,232 kb/d.
This chart also projects World C + C production out to December 2025. It uses the March 2024 STEO report along with the International Energy Statistics to make the projection. (Red markers).
The red graph forecasts that World crude production in December 2025 will be 83,484 kb/d and is 1,096 kb/d lower than the November 2018 peak.
From December 2023 to December 2025, production is estimated to increase by 1,162 kb/d. Part of the big drop projected for January 2024 is associated with the drop in US January production due to bad weather in the central US.
OPEC is projecting close to a 1,500 kb/d increase in demand from Q4-23 to Q3-24. Looking at the chart, supply in Q4-23 is not that different than Q3-24. This implies that the supply/demand outlook should continue to tighten going into the second and third quarter. Keep in mind that OPEC + has close to 3,000 kb/d of production cuts in reserve if required by slowly increasing demand.
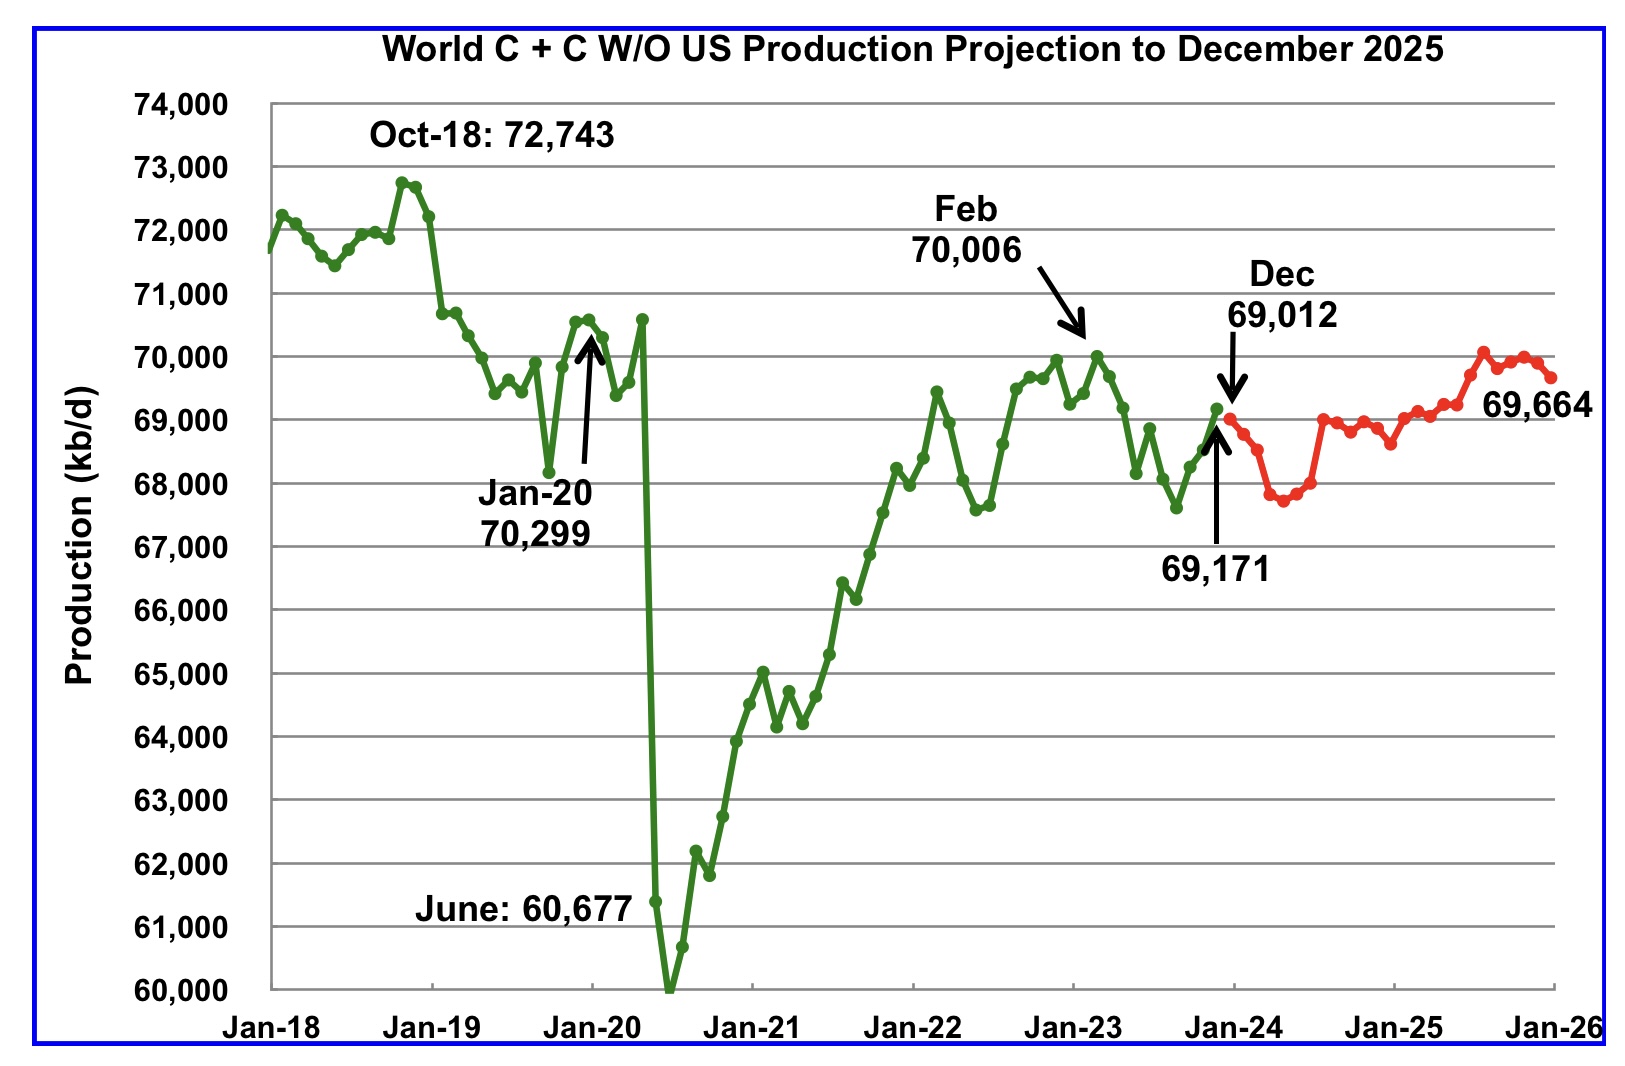
World without US November oil output increased by 645 kb/d to 69,171 kb/d. December production is expected drop to 69,012 kb/d.
Note that December 2025 output of 69,664 kb/d is lower than February 2023. Is this an early indicator that World without US oil production is heading into a plateau phase?
World oil production W/O the U.S. from December 2023 to December 2025 is forecast to increase by a total of 652 kb/d.
A Different Perspective on World Oil Production
Instead of dividing the World oil producing countries into OPEC countries and Non-OPEC countries, this section divides the countries into two groups on the basis of their production capacity. The division will be The Big Three, US, Saudi Arabia and Russia, and the Rest, i.e. the World oil producers W/O the Big 3. The top producer in the Rest, currently Canada, produces close to half of the lowest producer in the Big Three.
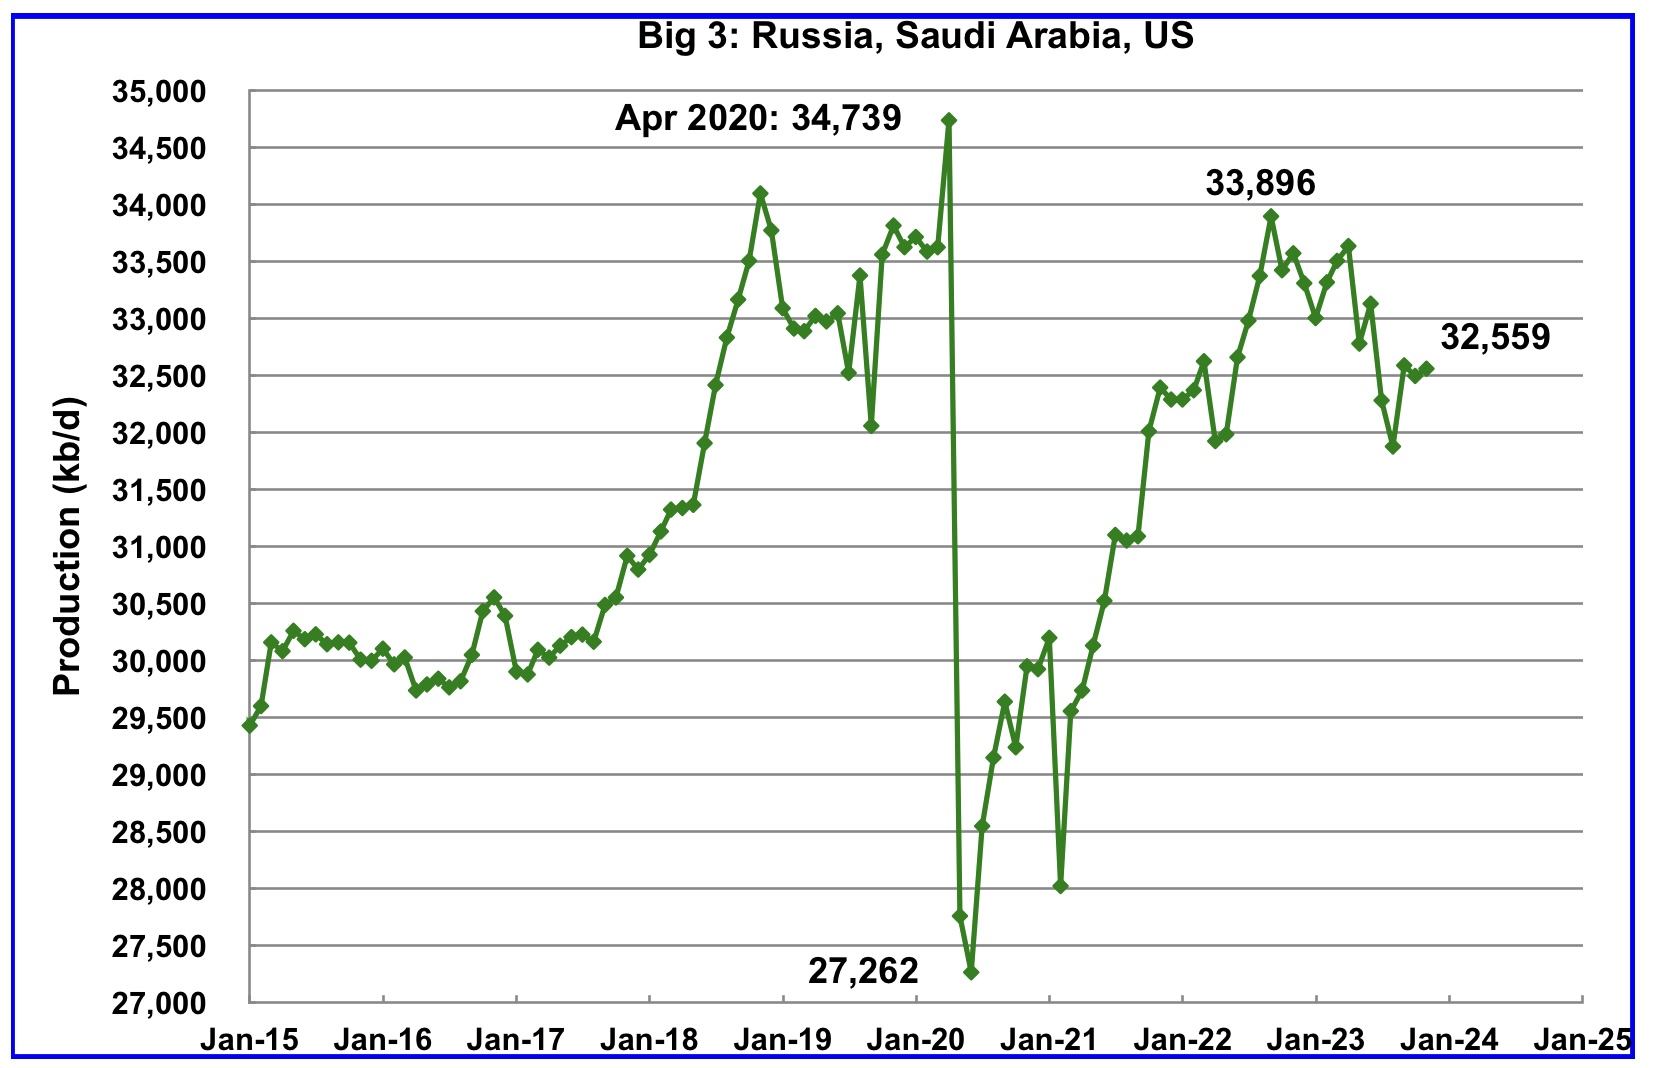
Peak production in the Big 3 occurred in April 2020 at a rate of 34,739 kb/d. The peak was associated with a large production increase from Saudi Arabia. Post covid, production peaked at 33,896 kb/d in September 2022. The production drop since then is due to cutbacks in Russia and Saudi Arabia.
November production from the Big 3 increased by 64 kb/d to 32,559 kb/d.
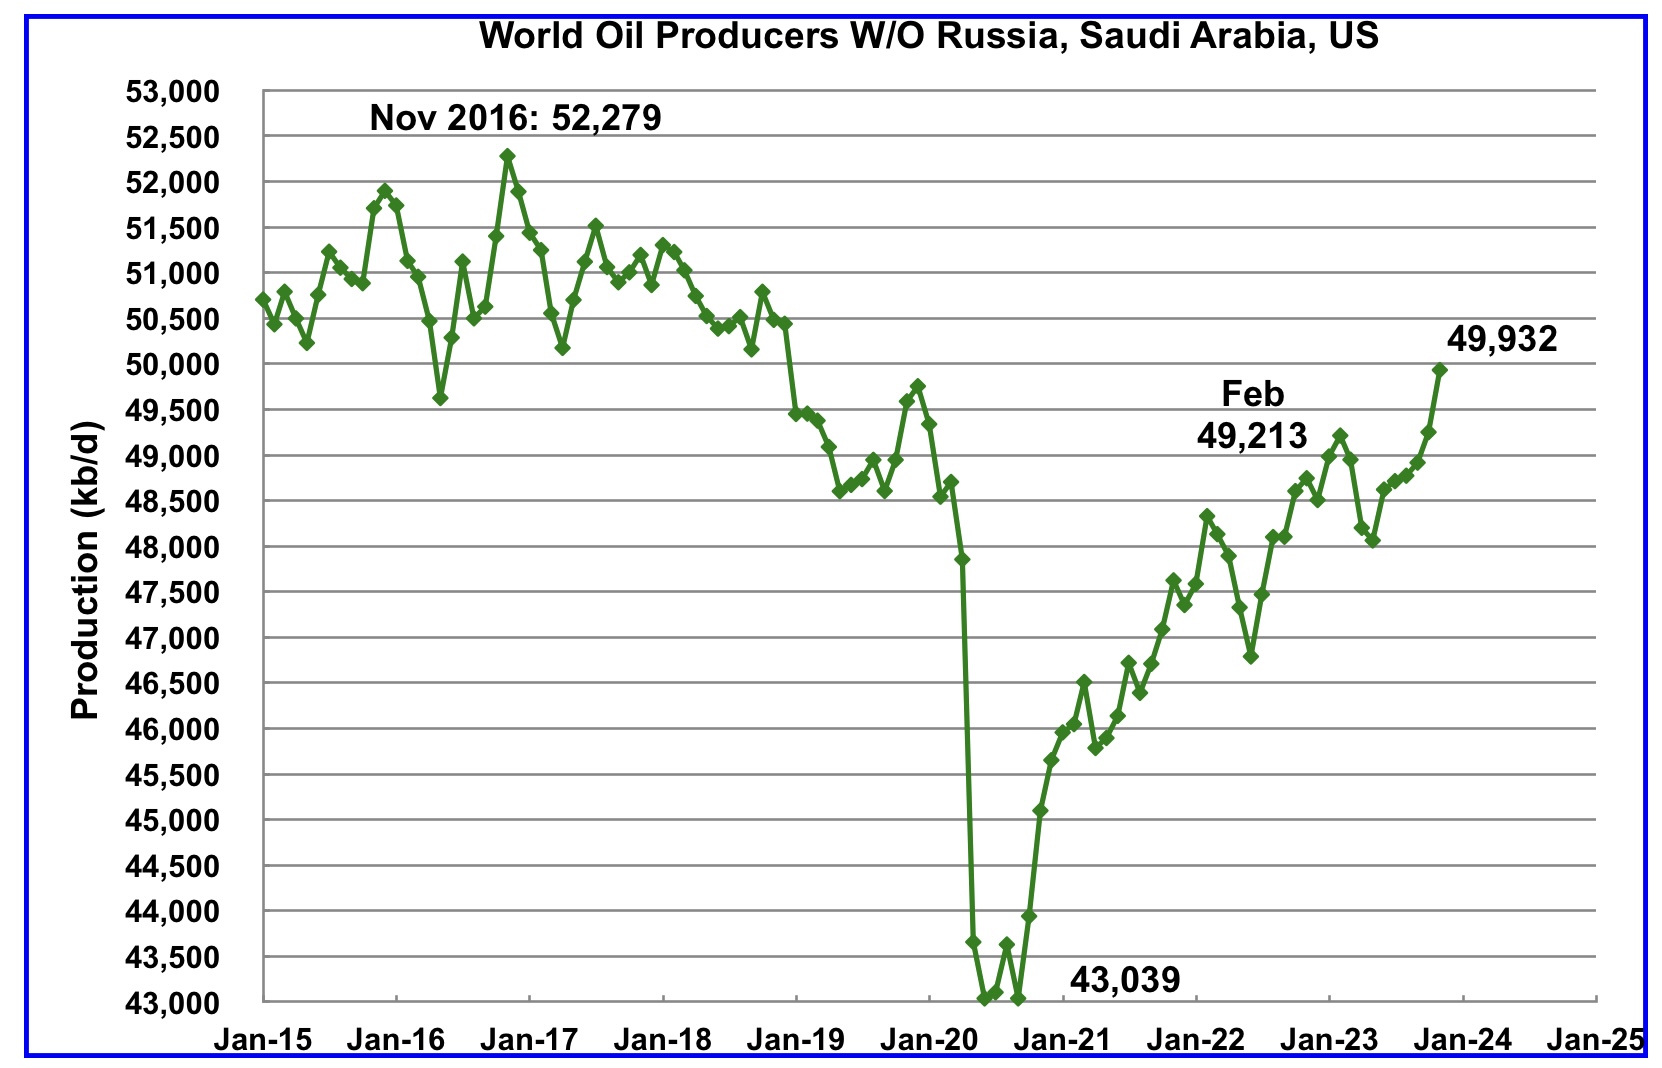
Production in the Rest has been slowly increasing since the low of September 2020 at 43,039 kb/d. In February 2023 production rose to a post covid high 49,213 kb/d. Output in November was 49,932 kb/d, an increase of 682 kb/d over October and exceeded the February 2023 high by 719 kb/d.
World Oil Countries Ranked by Production
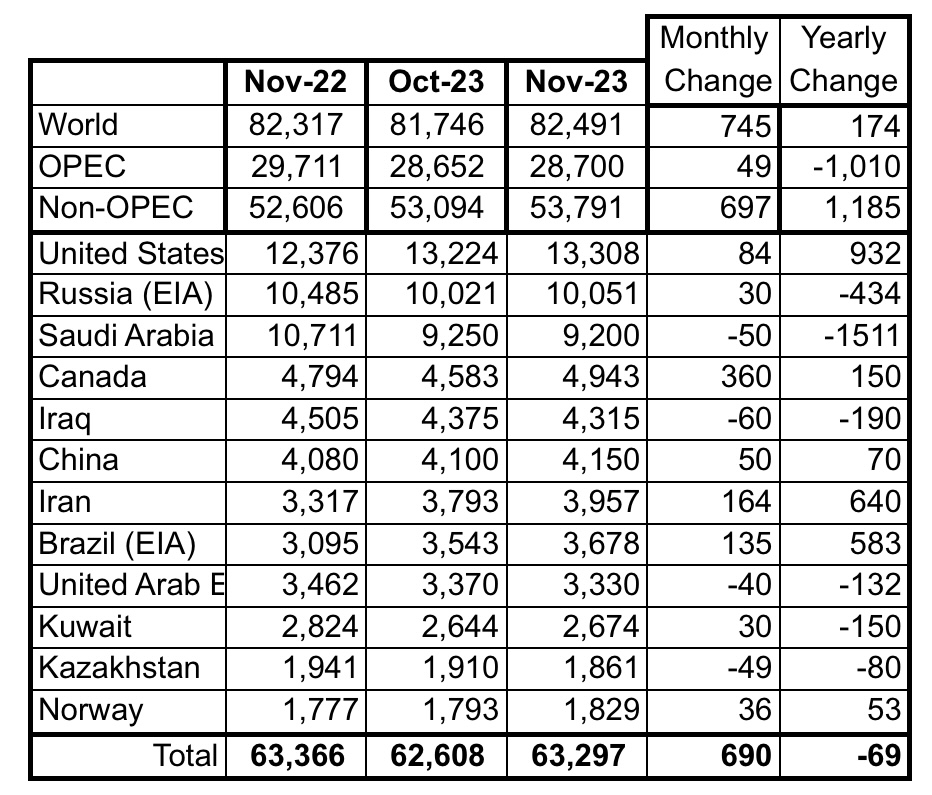
Above are listed the World’s 12th largest oil producers. In November 2023, these 12 countries produced 76.7% of the world’s oil. On a MoM basis, these 12 countries increased production by 690 kb/d while on a YOY basis, production dropped by 69 kb/d. On a YoY basis, note how the size of the Saudi Arabia production drop overshadows the US increase.
Projection for Non-OPEC Oil Production
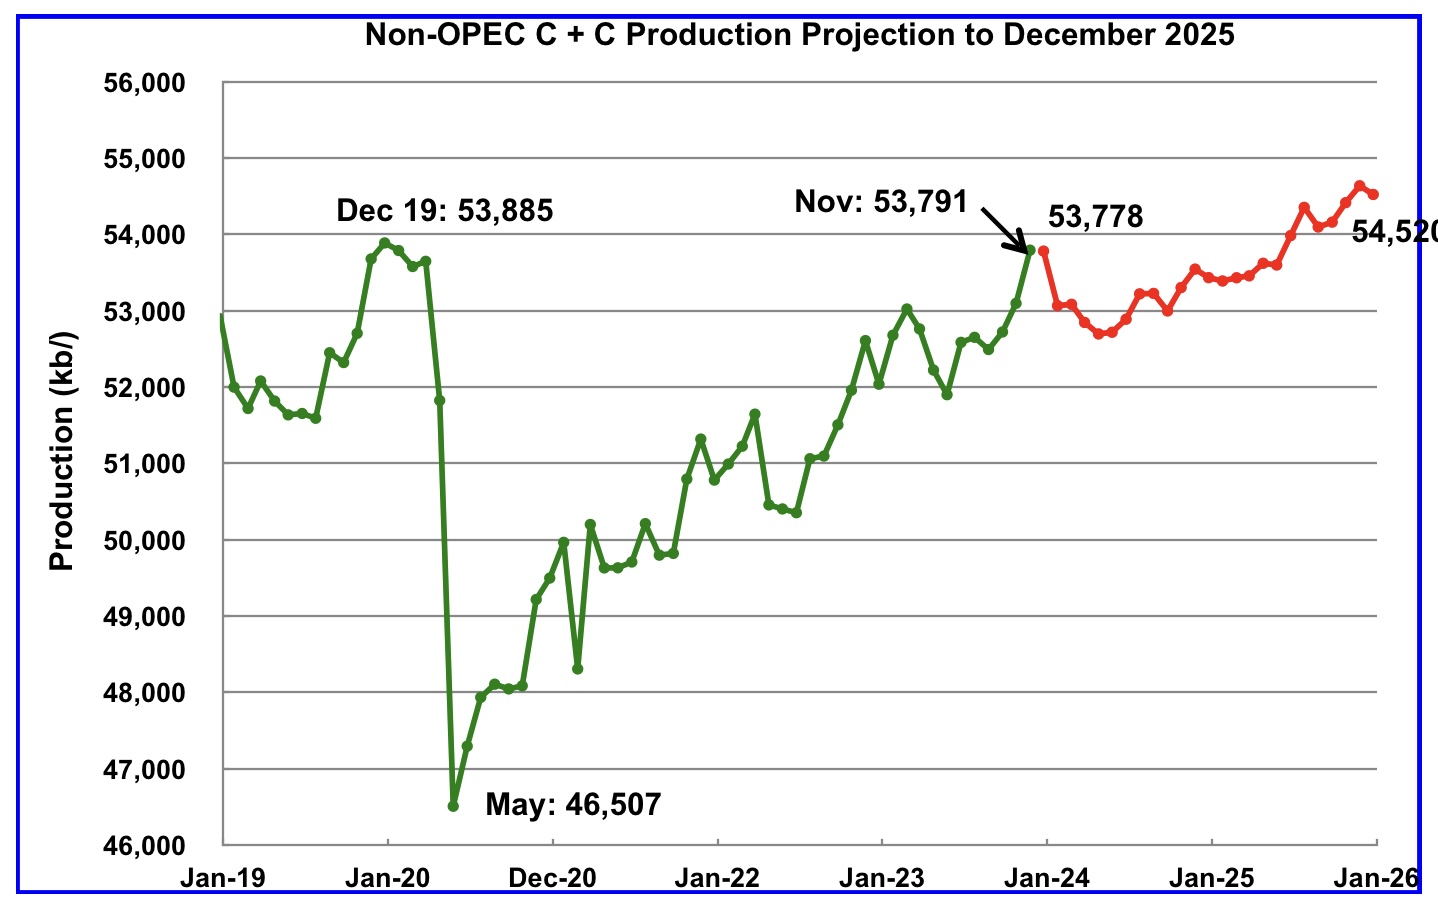
November Non-OPEC oil production rose by 697 kb/d to 53,791 kb/d. The largest increase came from Canada, 360 kb/d. Note that Non-OPEC production now includes Angola.
Using data from the March 2023 STEO, a projection for Non-OPEC oil output was made for the period December 2023 to December 2025. (Red graph). Output is expected to reach 54,520 kb/d in December 2025, which is 635 kb/d higher than the December 2019 peak of 53,885 kb/d.
From December 2023 to December 2025, oil production in Non-OPEC countries is expected to increase by 742 kb/d. According to the STEO, the major contributors to the increase are expected to be the US and Guyana.
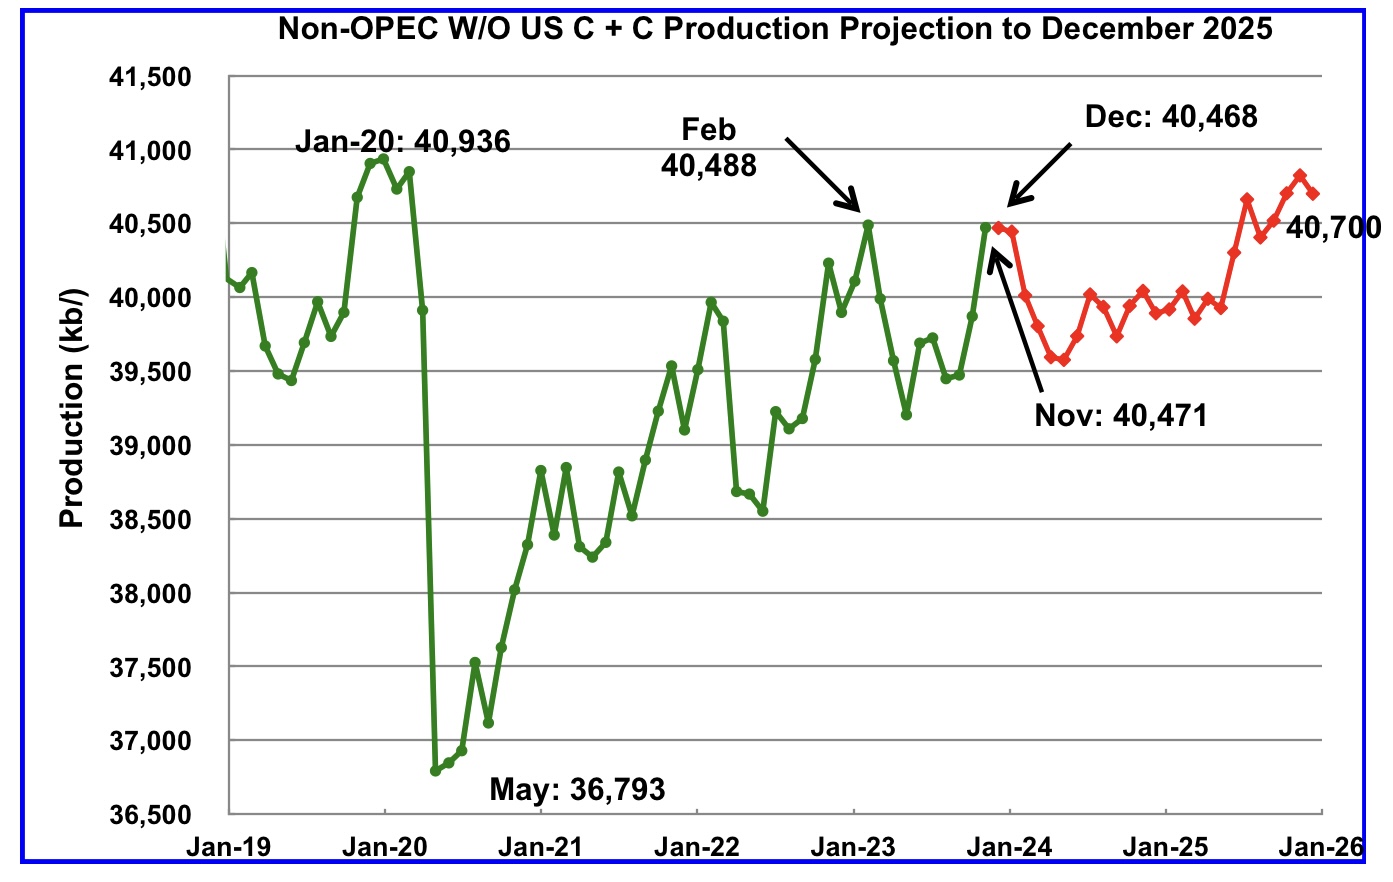
November Non-OPEC W/O US production increased by 601 kb/d to 40,471 kb/d. December production is projected to drop by 3 kb/d from November.
From December 2023 to December 2025, production in Non-OPEC countries W/O the US is expected to increase by 232 kb/d.
Note that December 2025 output is 212 kb/d higher than the February 2020 high of 40,468 kb/d. It is also 236 kb/d lower than the pre-pandemic high of January 2020, 40,936 kb/d.
Non-OPEC Oil Countries Ranked by Production
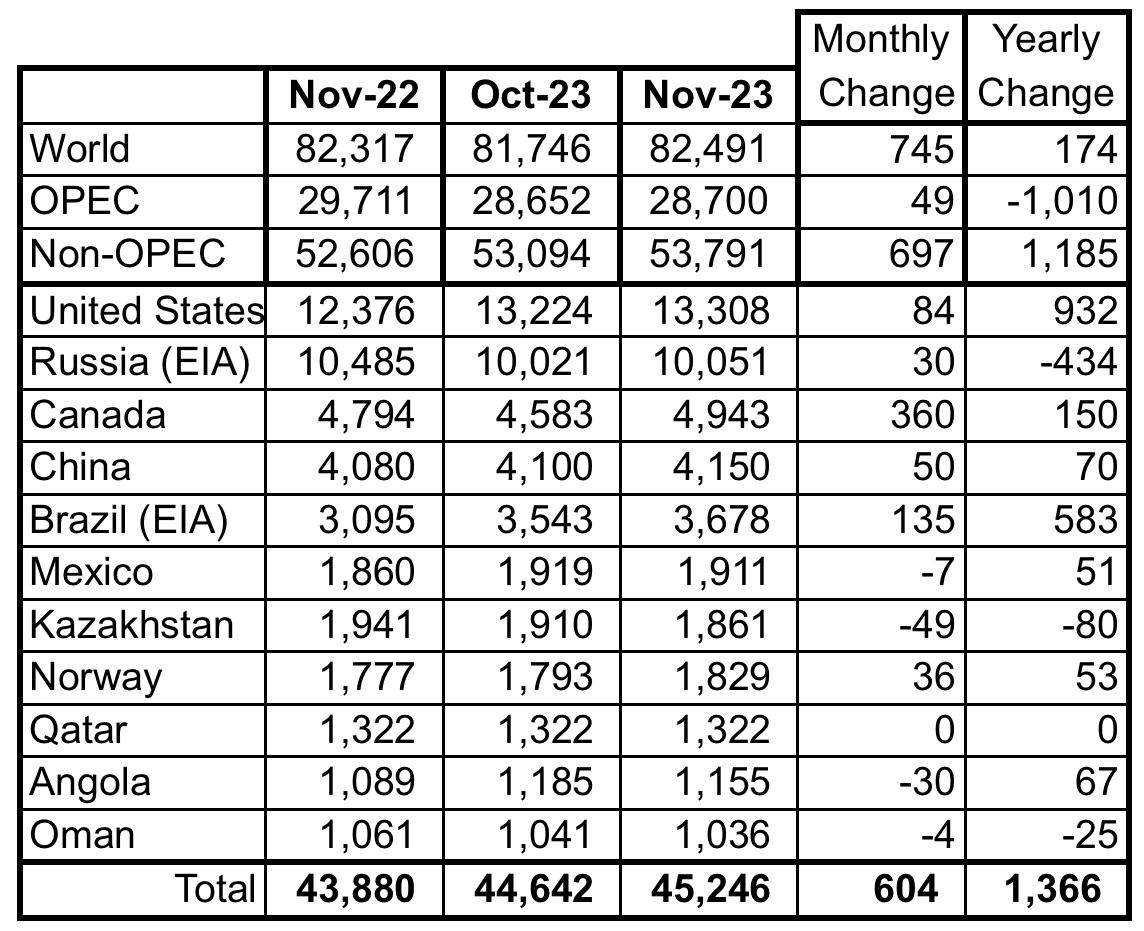
Listed above are the World’s 11 largest Non-OPEC producers. The criteria for inclusion in the table is that all of the countries produce more than 1,000 kb/d. Note the Angola has been added to this table.
November’s production increase for these eleven Non-OPEC countries was 604 kb/d while as a whole the Non-OPEC countries saw a production increase of 697 kb/d.
In November 2023, these 11 countries produced 84.1% of all Non-OPEC oil production.
OPEC’s C + C production increased by 49 kb/d MoM while YoY it decreased by 1,010 kb/d. World MoM production increased by 745 kb/d while YoY output increased by 174 kb/d.
Non-OPEC Oil Production Charts by Country
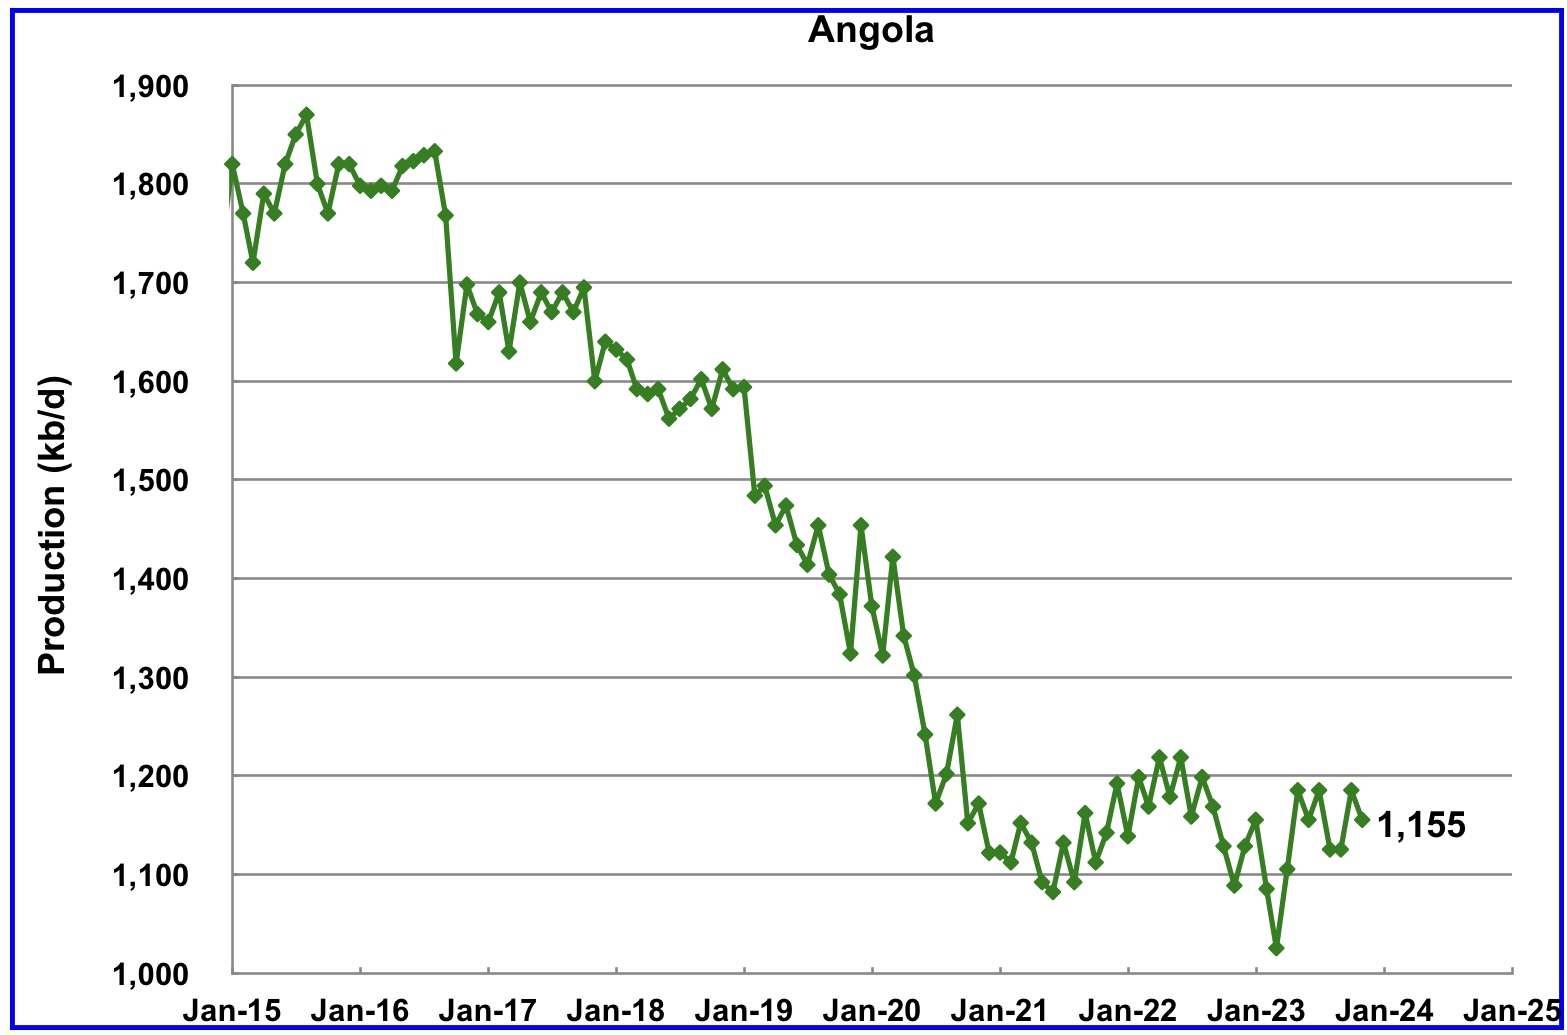
Angola has been added to the Non-OPEC producing countries since they have resigned from OPEC. Angola’s production stopped declining in mid 2021 and is attempting to grow by attracting foreign investors.
Angola’s November production decreased by 30 kb/d to 1,155 kb/d. Angola’s production since mid 2021 appears to have settled into a plateau phase in the 1,100 kb/d range.
According to this source: “Angola to maintain oil output at 1.1. million bpd through at least 2027“.
“Angola is producing about 1.1. million barrels per day of crude, similar to its level before it exited the Organization of the Petroleum Exporting Countries, and expects to maintain those volumes at least until 2027.“
Output at Africa’s second-largest crude oil exporter has declined steadily since hitting a peak of 2 million barrels per day (bpd) in 2008. It aims to produce more natural gas to counter part of the oil decline.”
According to this source: “The government, recent efforts to attract foreign investors should bear fruit in the coming months. Their appetite was already confirmed in September, when the ANPG granted two new operating licences for blocks that contain considerable oil reserves.
The oil sector will therefore return to growth in 2024. However, this growth is expected to remain limited. The sector is being penalised by both the natural decline in reserves and by ageing infrastructure, which requires new maintenance operations.”
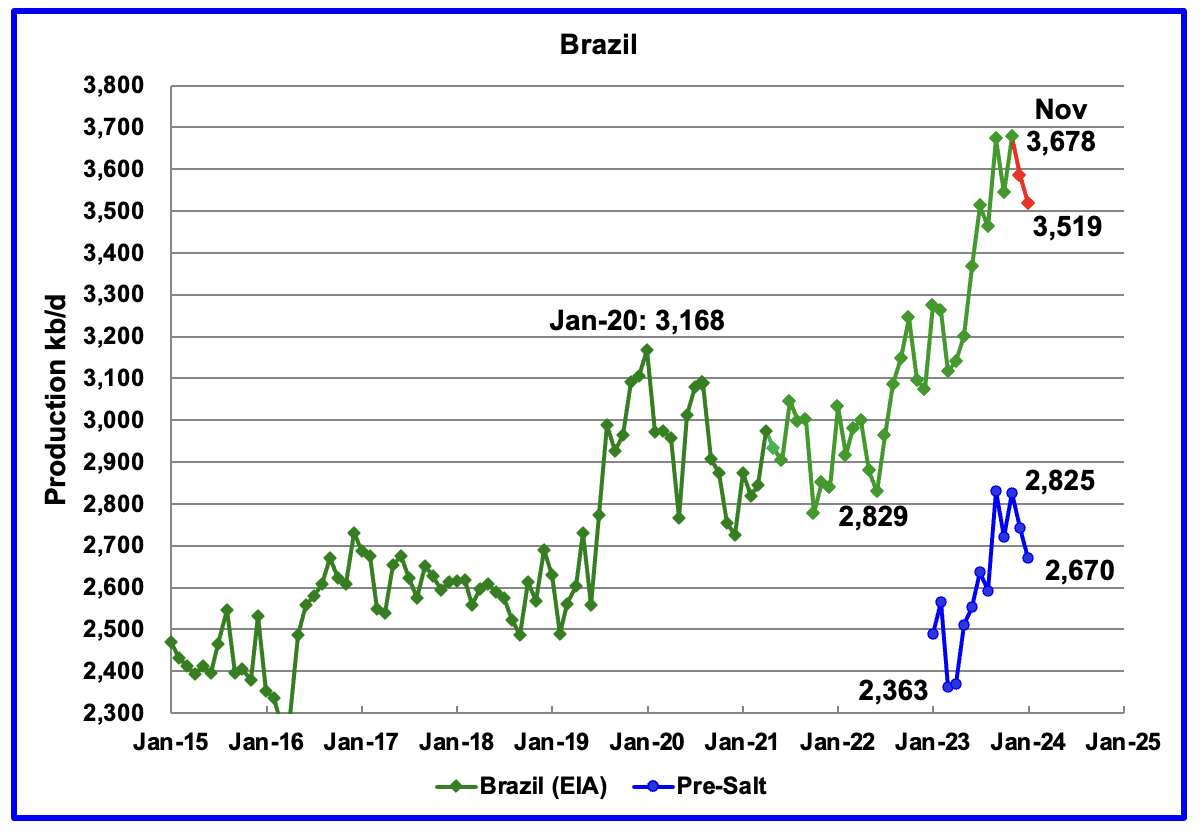
The EIA reported that Brazil’s November production increased by 135 kb/d to a new high of 3,678 kb/d.
Brazil’s National Petroleum Association (BNPA) reported that output dropped in both December and January to 3,519 kb/d. December production dropped by 93 kb/d to 3,585 kb/d.
From March 2023 to November 2023, production increased by 563 kb/d. A similar rise in production is not expected in 2024. For 2024 the MOMR is expecting a smaller increase, closer to 120 kb/d while the EIA is forecasting flat output.
The March MOMR notes that : “Crude oil output is expected to increase through production ramp-ups in the Buzios (Franco), Mero (Libra NW), Tupi (Lula) and Itapu (Florim) fields. Oil project start-ups are expected at the Buzios, Atlanta, Pampo-Enchova Cluster and Vida sites. However, increasing costs in the offshore market and inflation might continue to delay projects and could temper growth in the short term
Production from Brazil’s off-shore “pre-salt” region has been added to this chart. November oil production increased by 103 kb/d to 2,825 kb/d. January pre-salt production dropped to 2,670 kb/d.
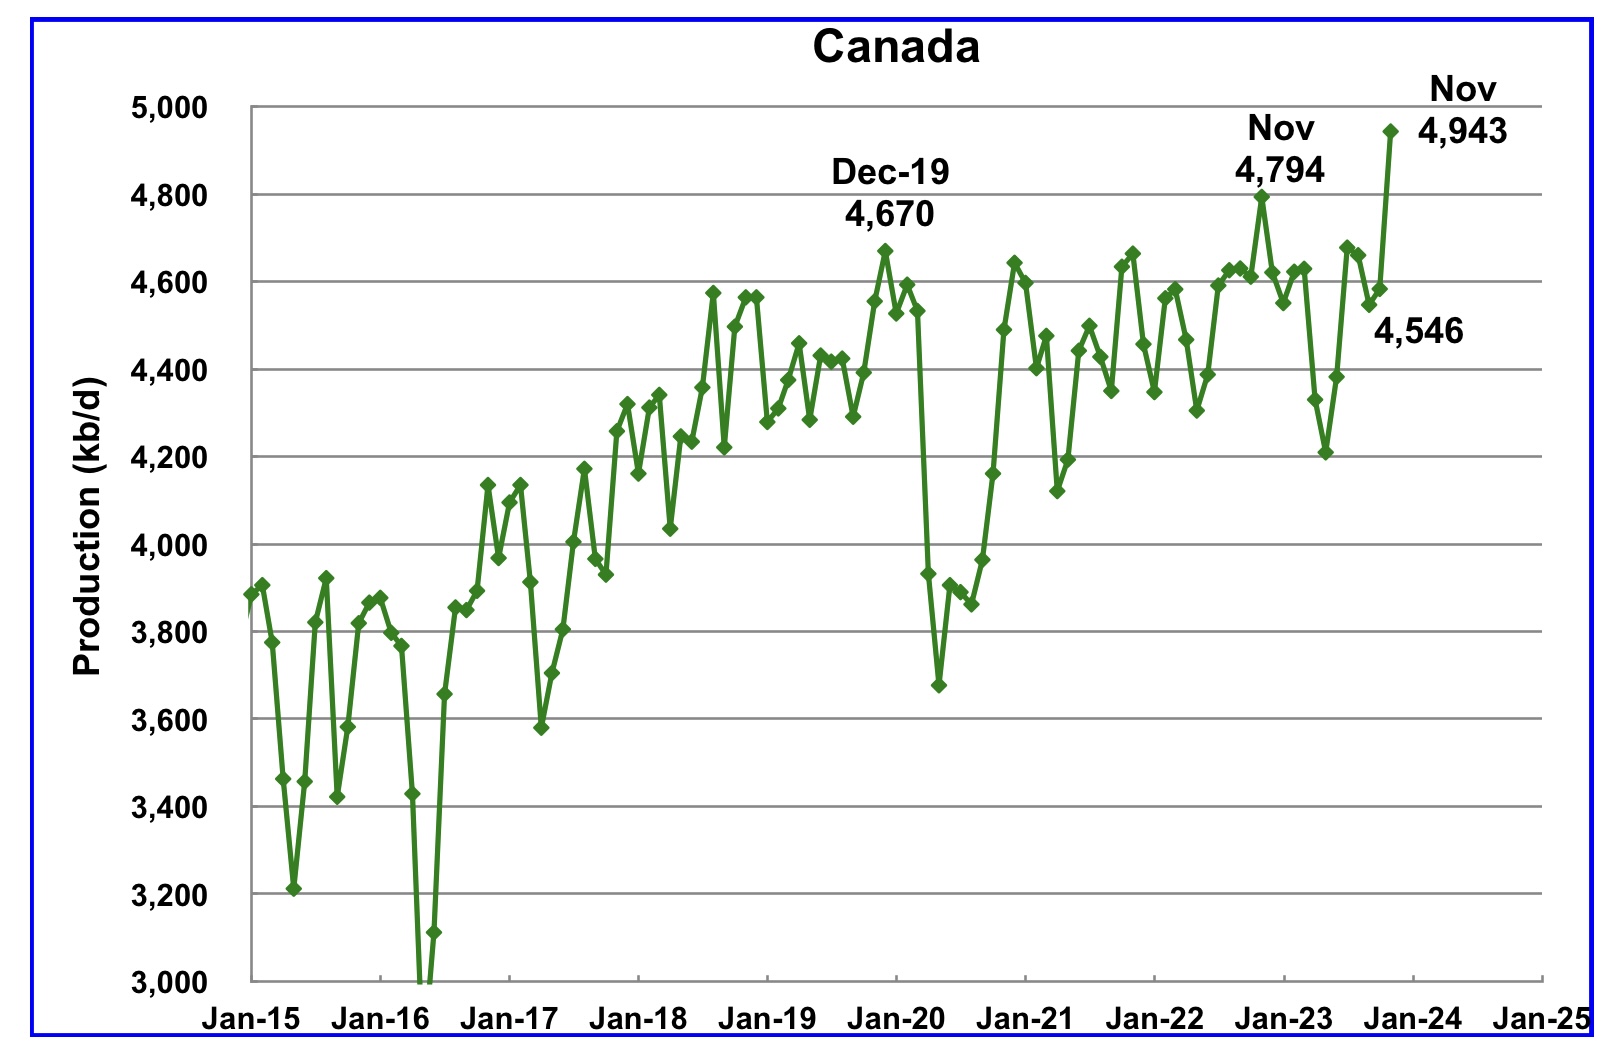
According to the EIA, Canada’s production increased by 360 kb/d in November to a record 4,943 kb/d.
In March 2024 the TMX pipeline suffered another delay when the pipeline could not be pulled through a tunnel.
On February 2024, according to TMX, the pipeline was successfully removed from the tunnel
“Trans Mountain has successfully removed the pipe from the original pullback.
Preparatory work for the new pullback is ongoing including coating and welding the pipe.”
Even though the pipeline is not complete, filling of the Trans Mountain oil pipeline has begun according to this article.
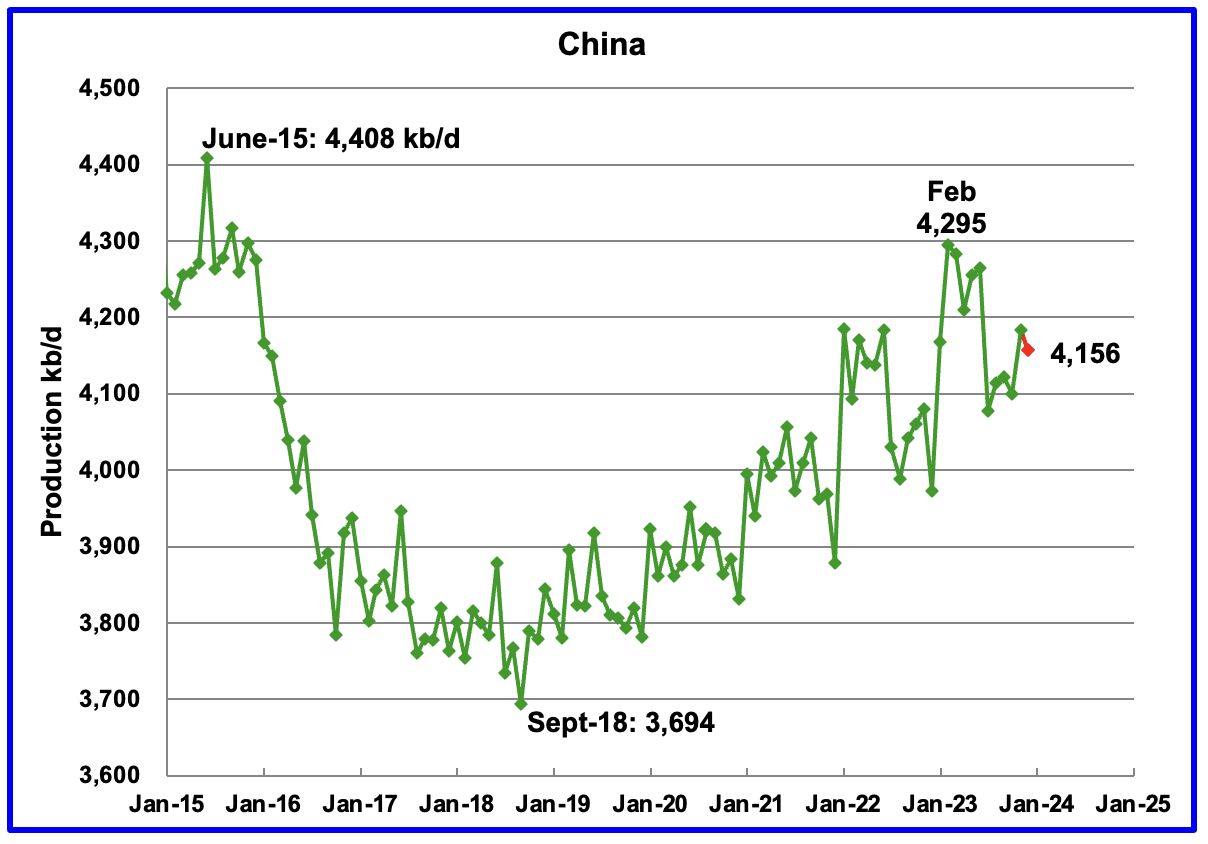
The EIA reported China’s oil output in November increased by 50 kb/d to 4,150 kb/d.
The China National Bureau of Statistics reported that output dropped in December by 24 kb/d to 4,156 kb/d. In late March 2024, The China bureau announced the average production in January and February was 4,277 kb/d (Not shown). This is slightly lower than February high of 4,295 kb/d.
Every January for the last four years, China’s production has seen a massive increase. In 2022 production jumped by 322 kb/d from December 2021 to February 2022. However according to the March MOMR: For 2024, Chinese liquids production is expected to rise by about 10 tb/d. The EIA generally agrees since it is also projecting no growth for 2024.
While China’s production growth has risen steadily since 2018, it may be approaching its post pandemic high as inferred by the March MOMR and the EIA reports.
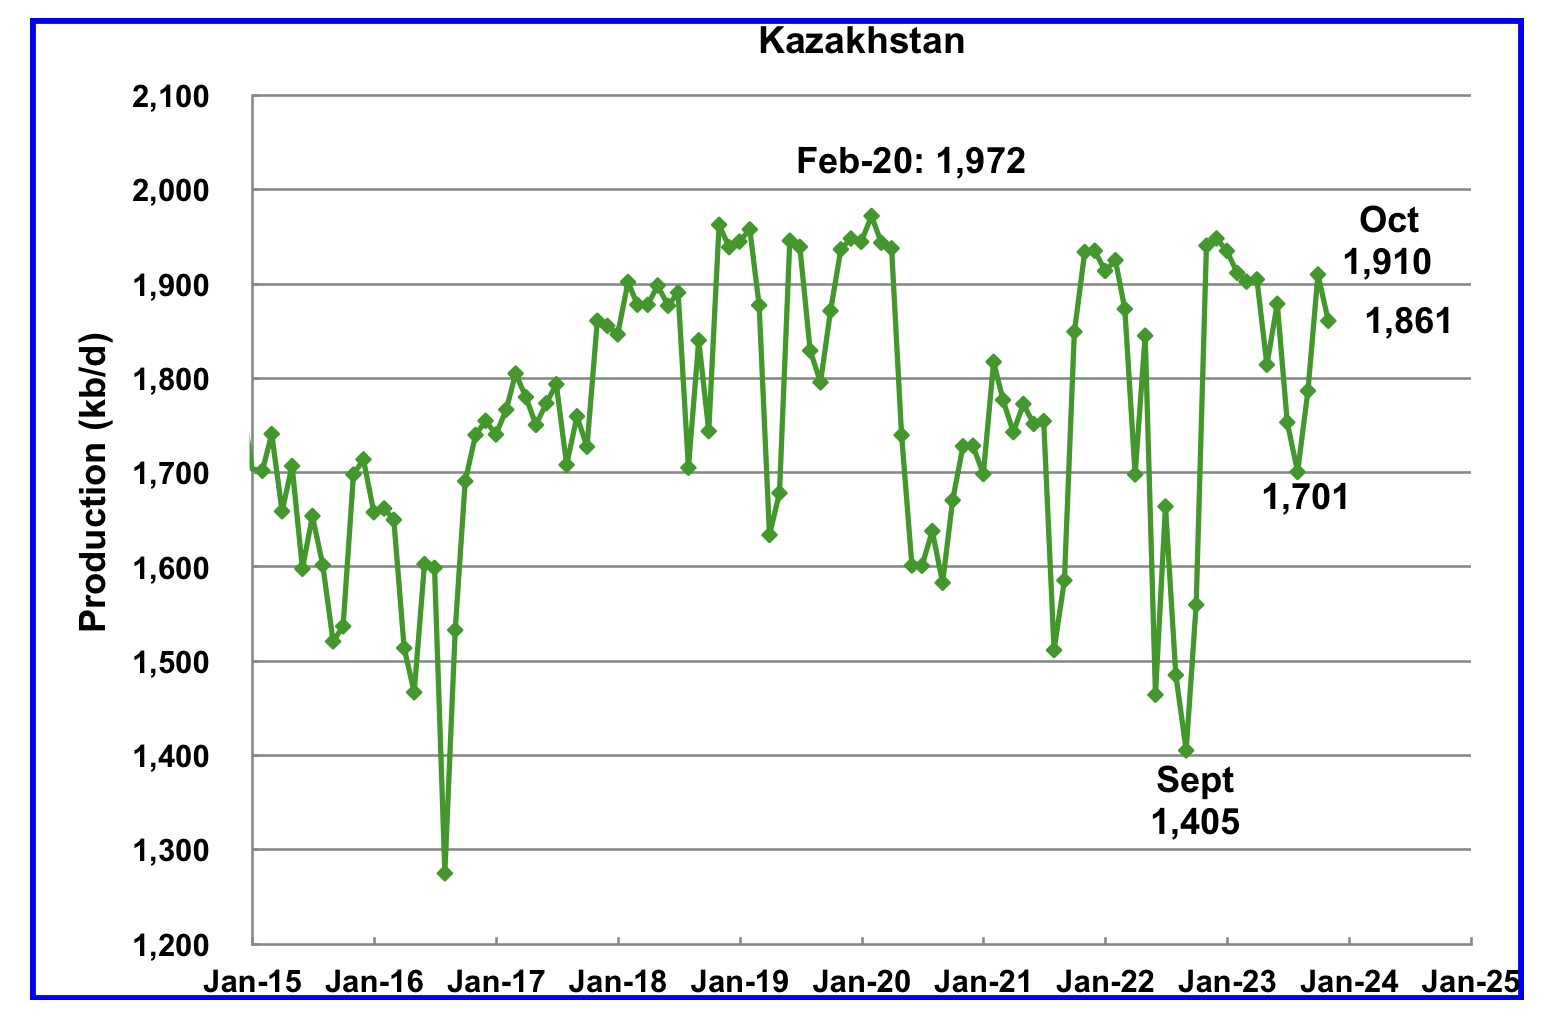
According to the EIA, Kazakhstan’s output decreased by 49 kb/d in November to 1,861 kb/d.
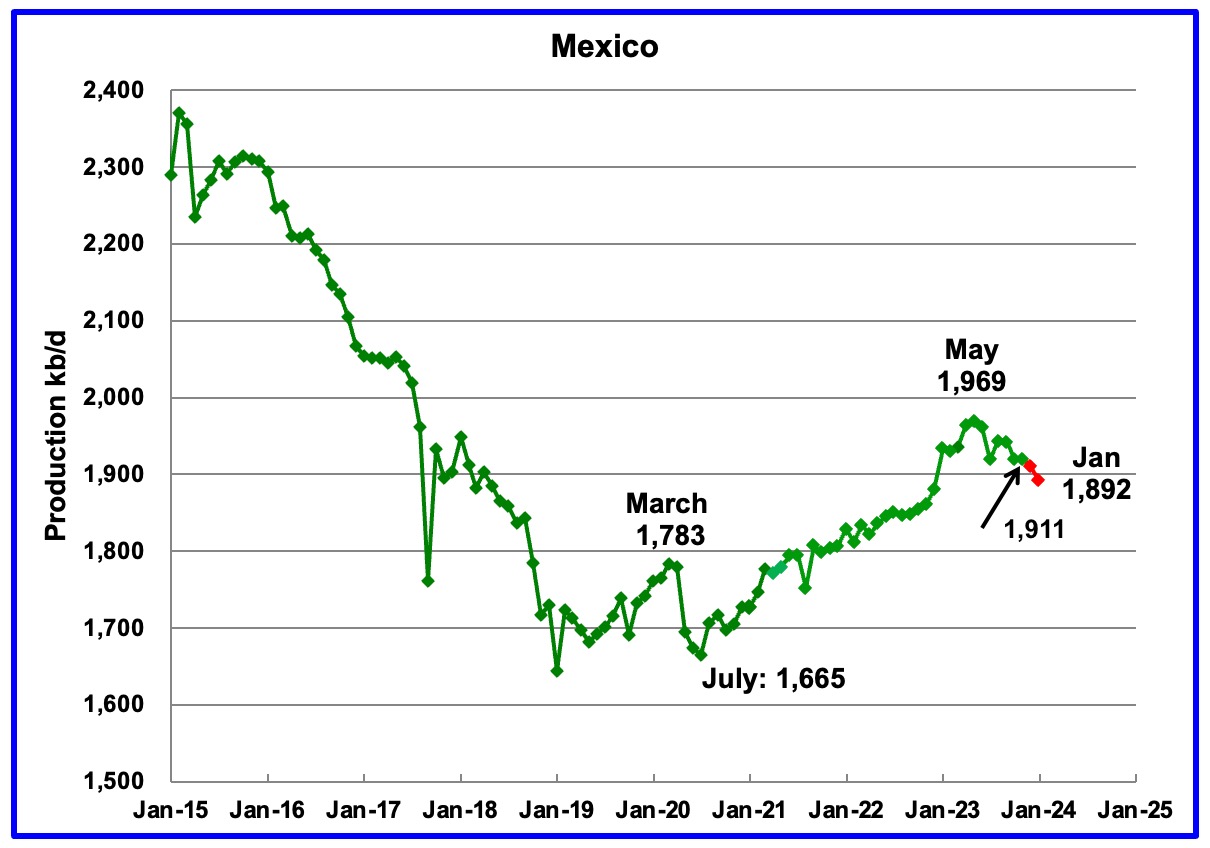
According to the EIA, Mexico’s output decreased by 7 kb/d in November to 1,911 kb/d.
According to Pemex, Mexico’s oil production dropped in December and January to 1,892 kb/d.
Mexico has recently revised its definition of condensate. This has resulted in the EIA adding an extra 60 kb/d, on average, to the Pemex report. The red markers include an additional 60 kb/d.
According to the March 2024 MOMR: “Mexico’s liquids production is forecast to drop by 60 tb/d to average 2.0 mb/d in 2025. Production ramp-ups in projects like Mezcalapa, Amoca-Yaxche, Okom, Tucoo-Xaxamani and Amoca-Mizton-Tecoalli are expected to be more than offset by declines in several fields such as Quesqui and Tupilco Profundo. Meanwhile, output in the Ku-Maloob-Zaap asset is expected to remain stable.
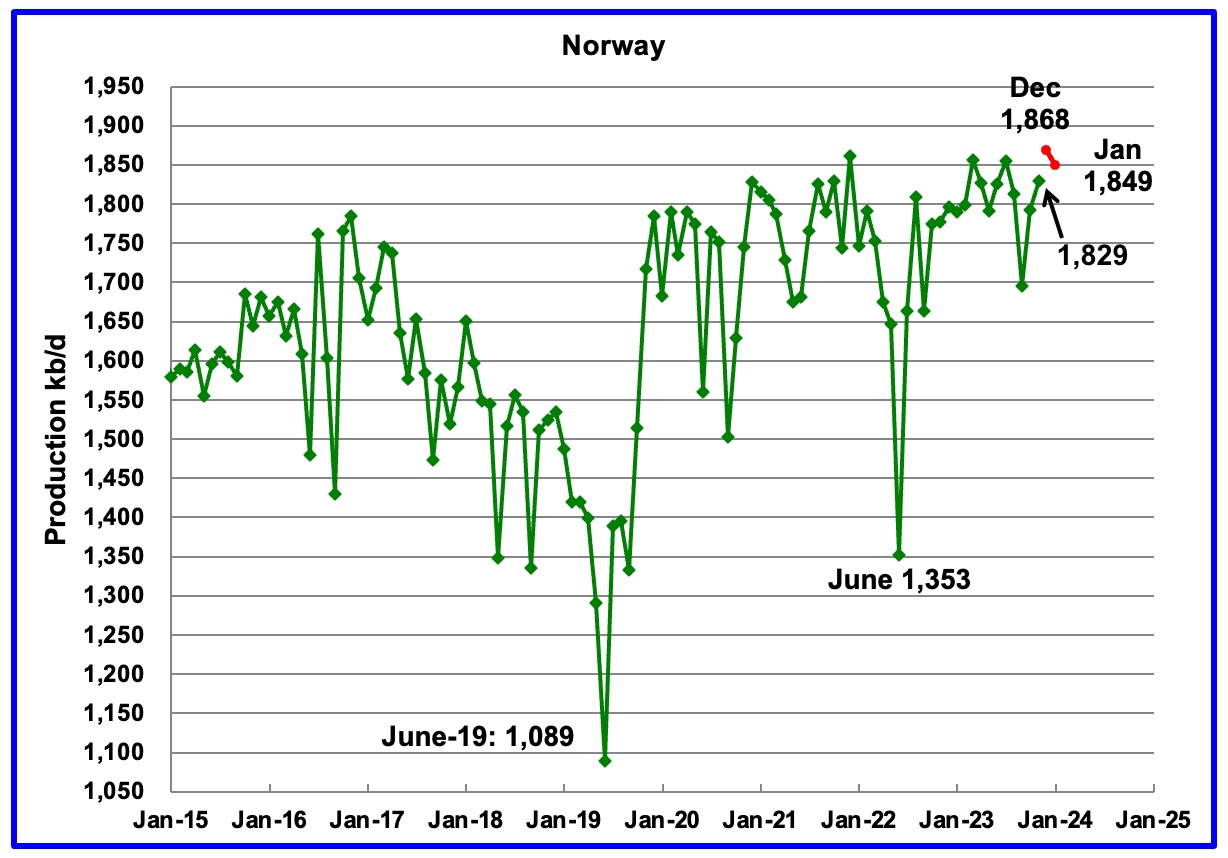
The EIA reported Norway’s November production increased 36 kb/d to 1,829 kb/d.
Separately, the Norway Petroleum Directorate (NPD) reported that December’s production added 39 kb/d to 1,868 kb/d, a new post pandemic high, red markers. January dropped to 1,849 kb/d.
According to the NPD : “Oil production in January was 1.9 percent higher than the Norwegian Offshore Directorate’s forecast.”
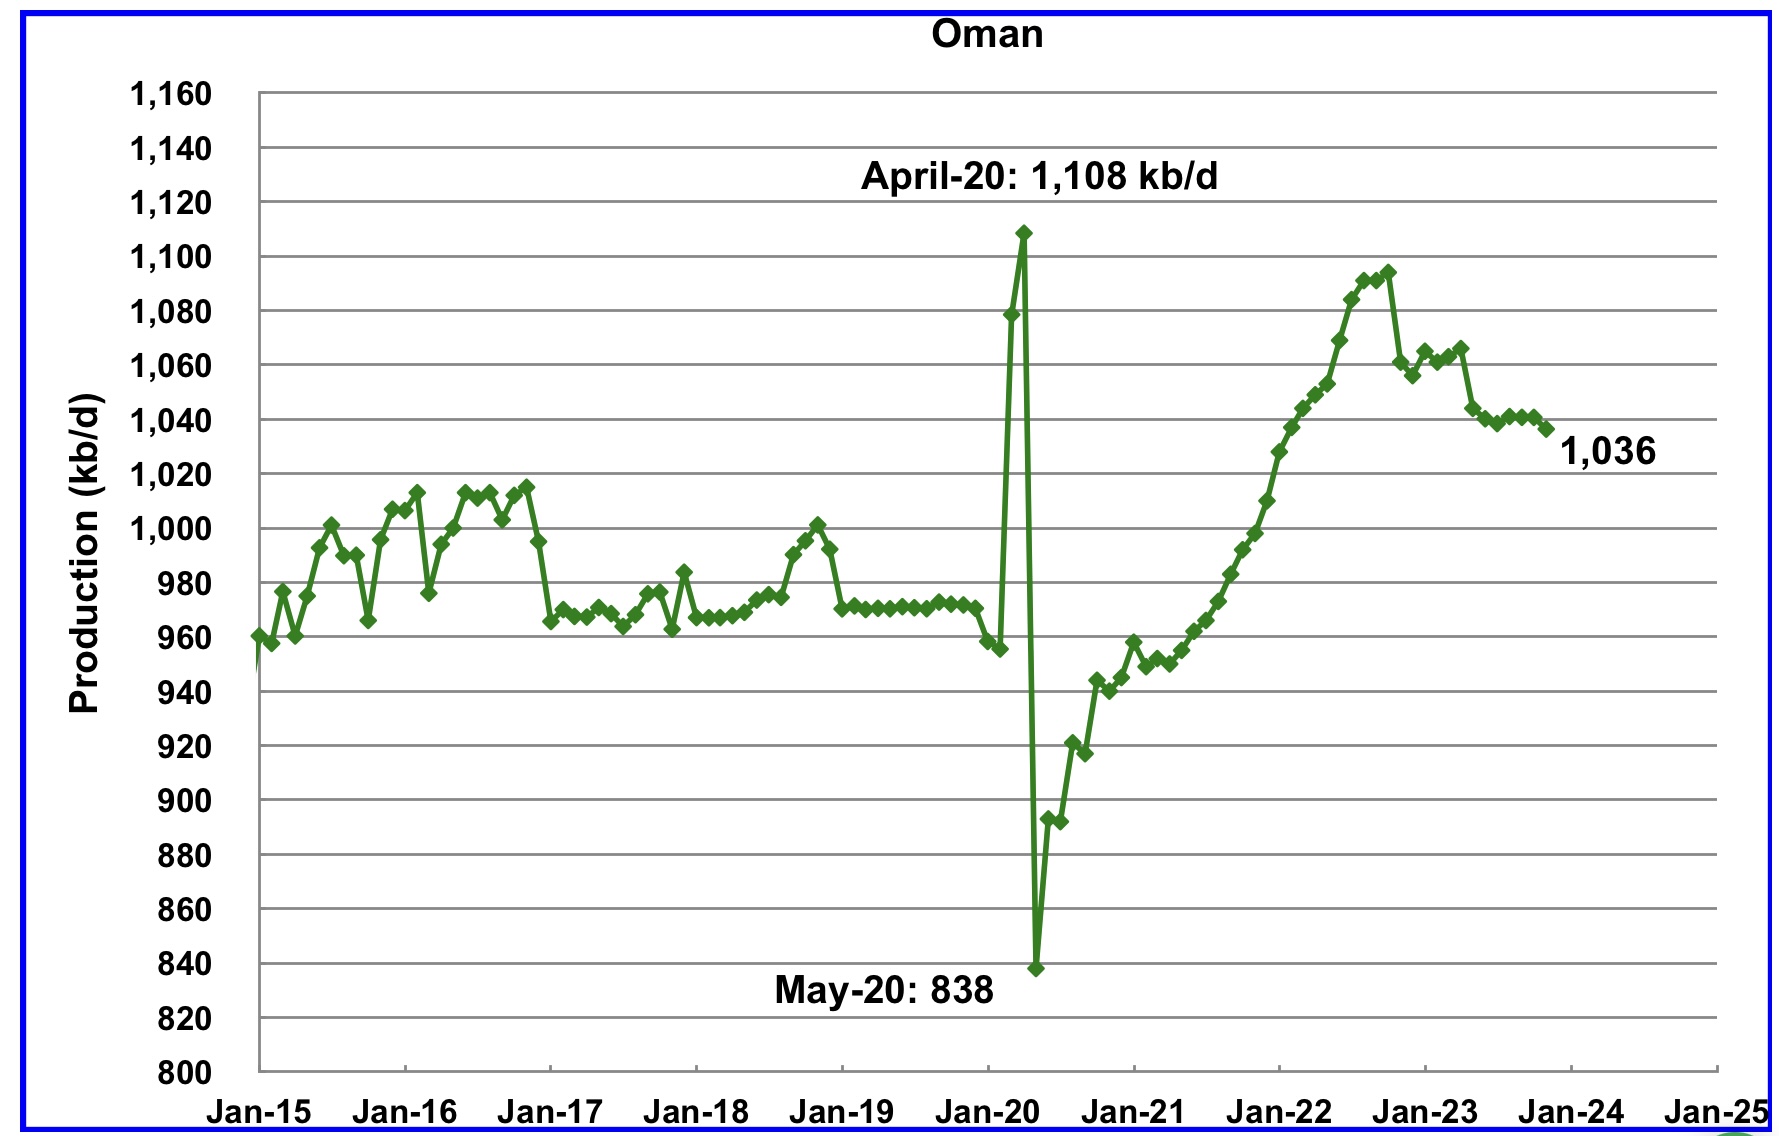
Oman’s production has risen very consistently since the low of May 2020. However production began to drop in November 2022. According to the EIA, November 2024 output was 1,036 kb/d.
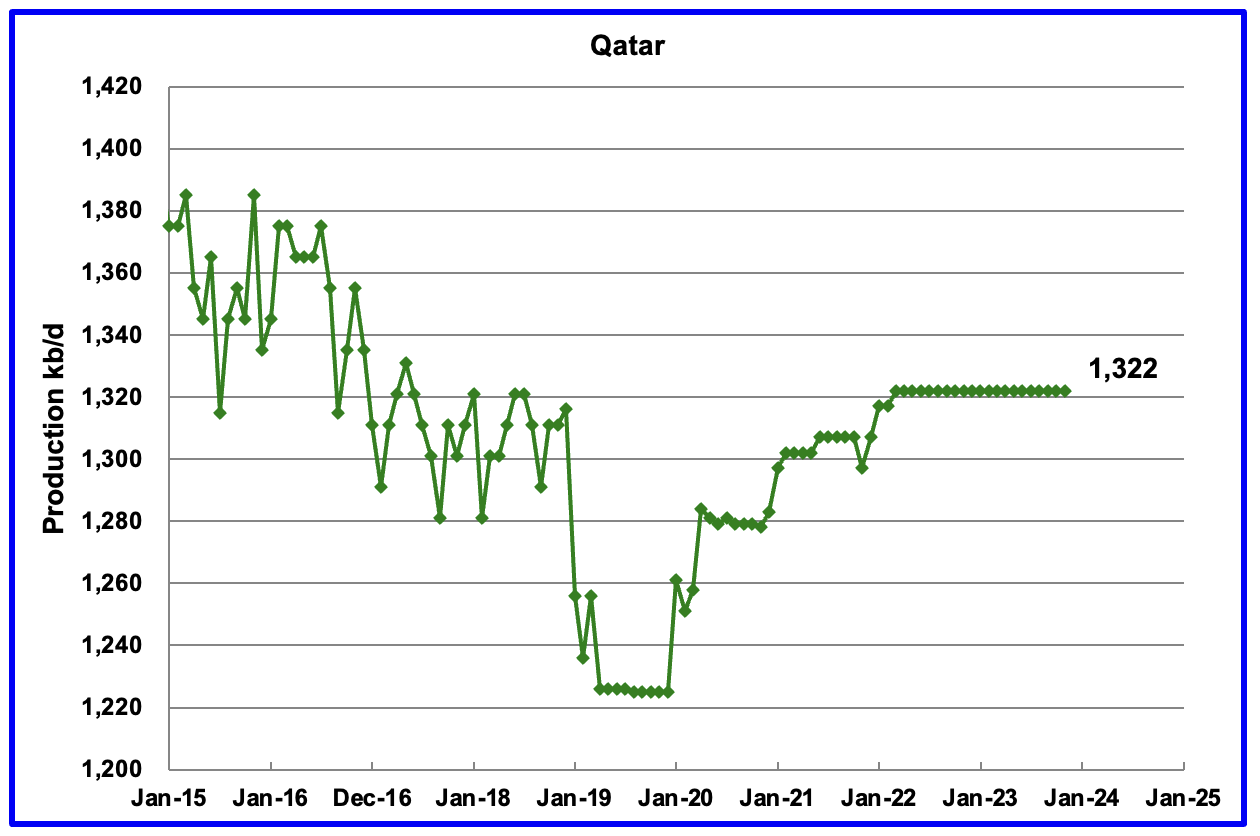
Qatar’s November output was unchanged at 1,322 kb/d, possibly due to lack of updated information.
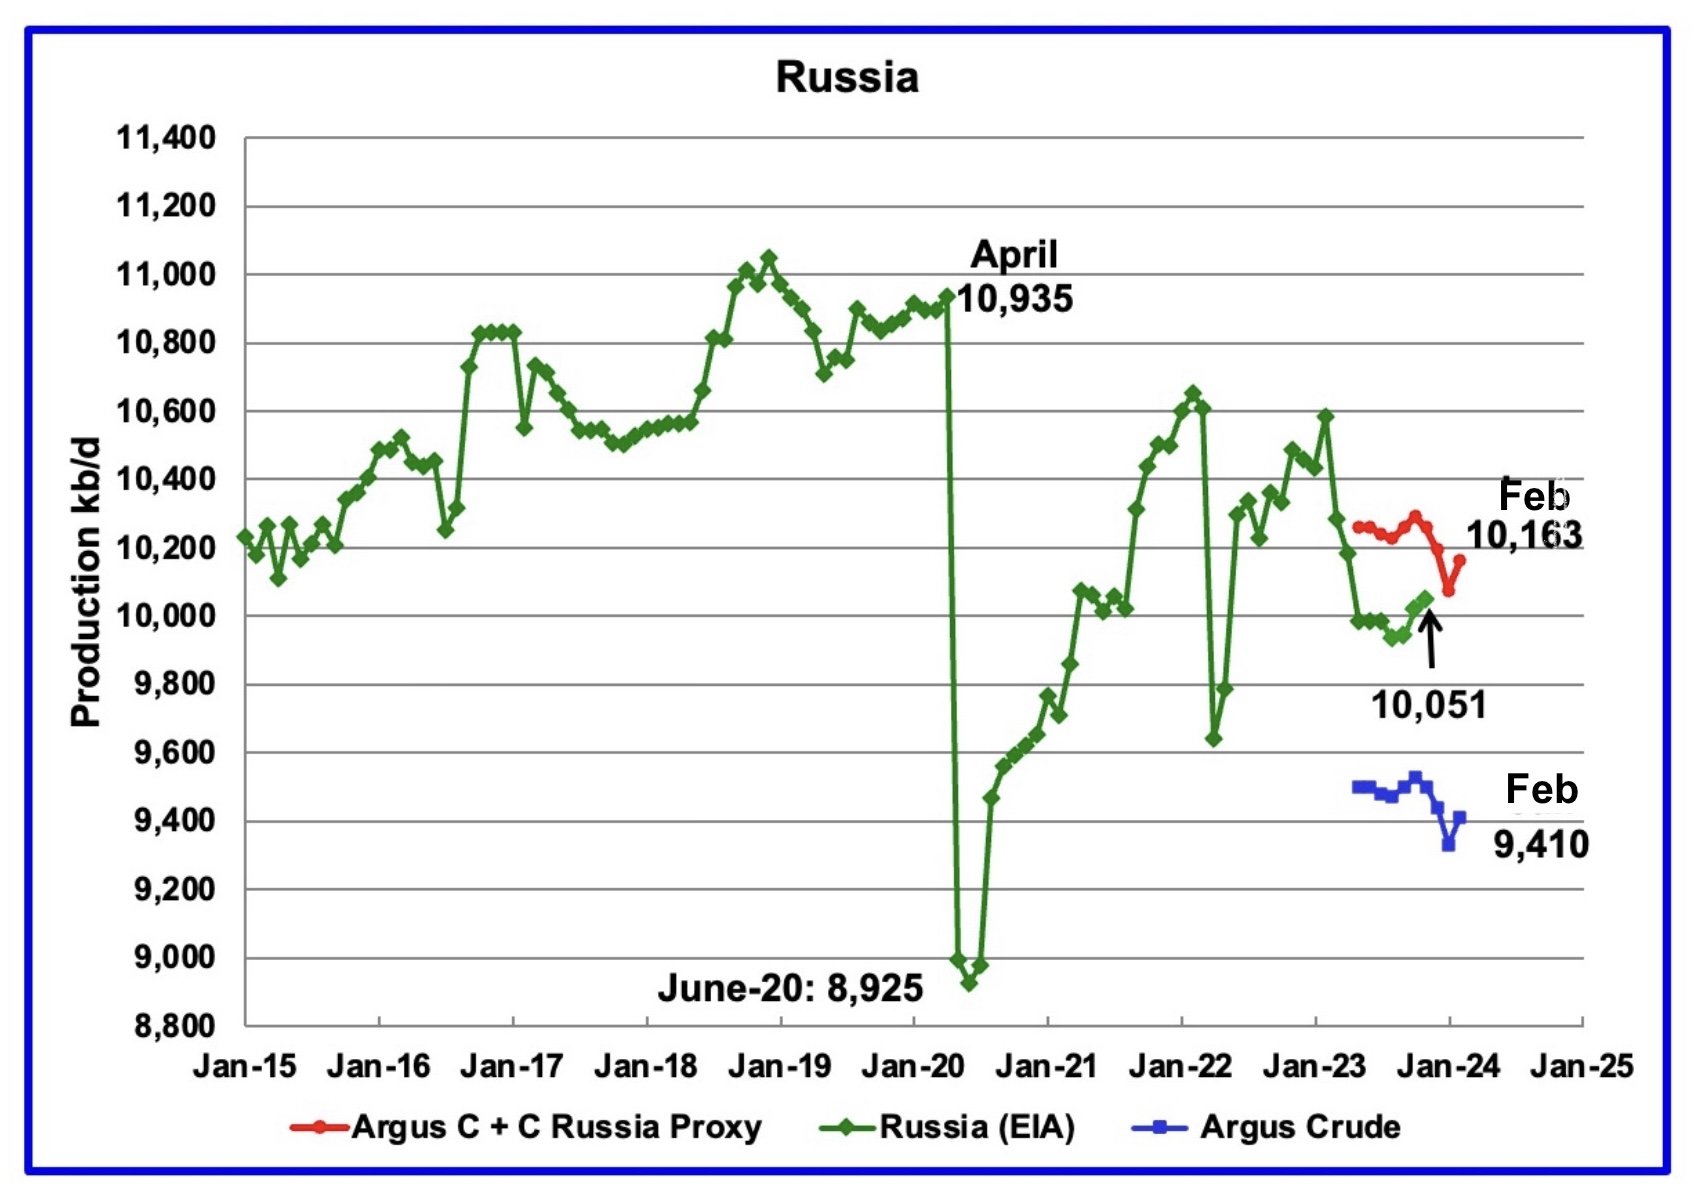
The EIA reported Russia’s November C + C production rose by 30 kb/d to 10,051 kb/d. Using data from the March STEO report, Russian output is expected be slightly higher at 10,076 kb/d in January 2024.
Using data from Argus Media reports, Russian crude production is shown from May 2023 to February 2024. For February 2024, Argus reported that Russian crude production was 9,410 kb/d, an increase of 80 kb/d, blue markers. Adding 8% to Argus’ February crude production provides a C + C production estimate of 10,163 kb/d, which is a proxy for the Pre-War Russian Ministry estimate, red markers. S & P Platts reports that Russian February crude production was 9,430 kb/d, up 10 kb/d from January, reasonably close to the Argus estimate.
If the EIA’s Russian production projection is correct, this indicates that there is no sign that Western sanctions are affecting their oil production at this time. The Argus and EIA trends are going in opposite directions in the September to November time frame. However Argus’ source may be catching up as it indicates increased production in February.
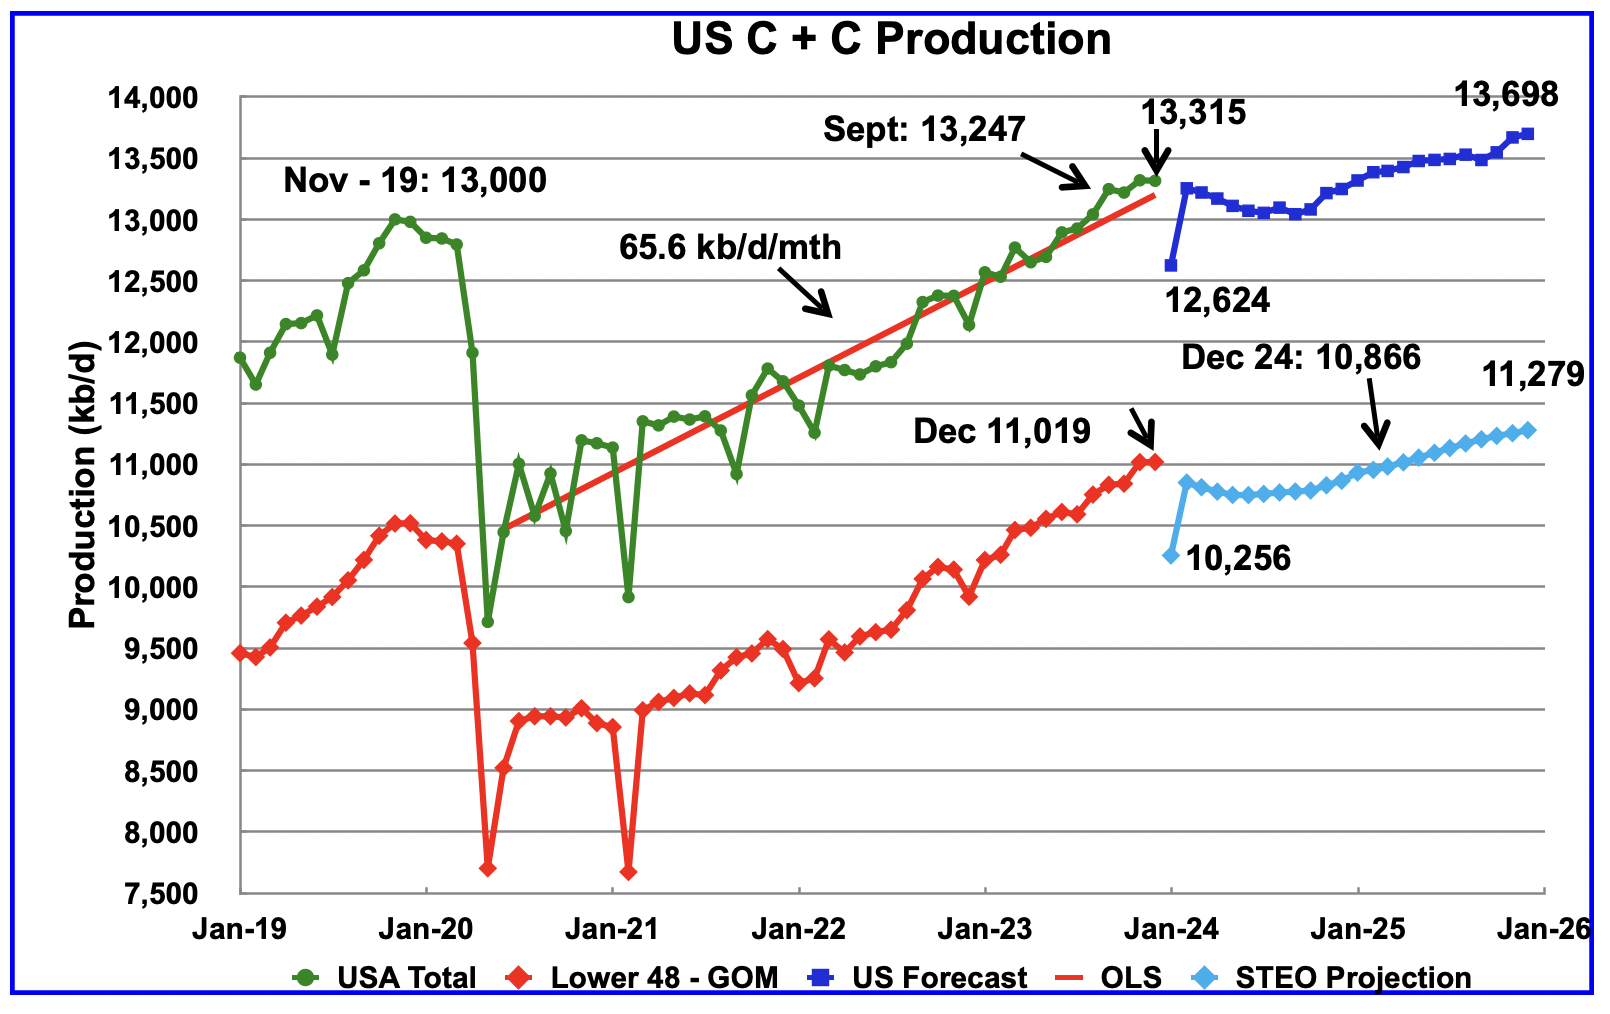
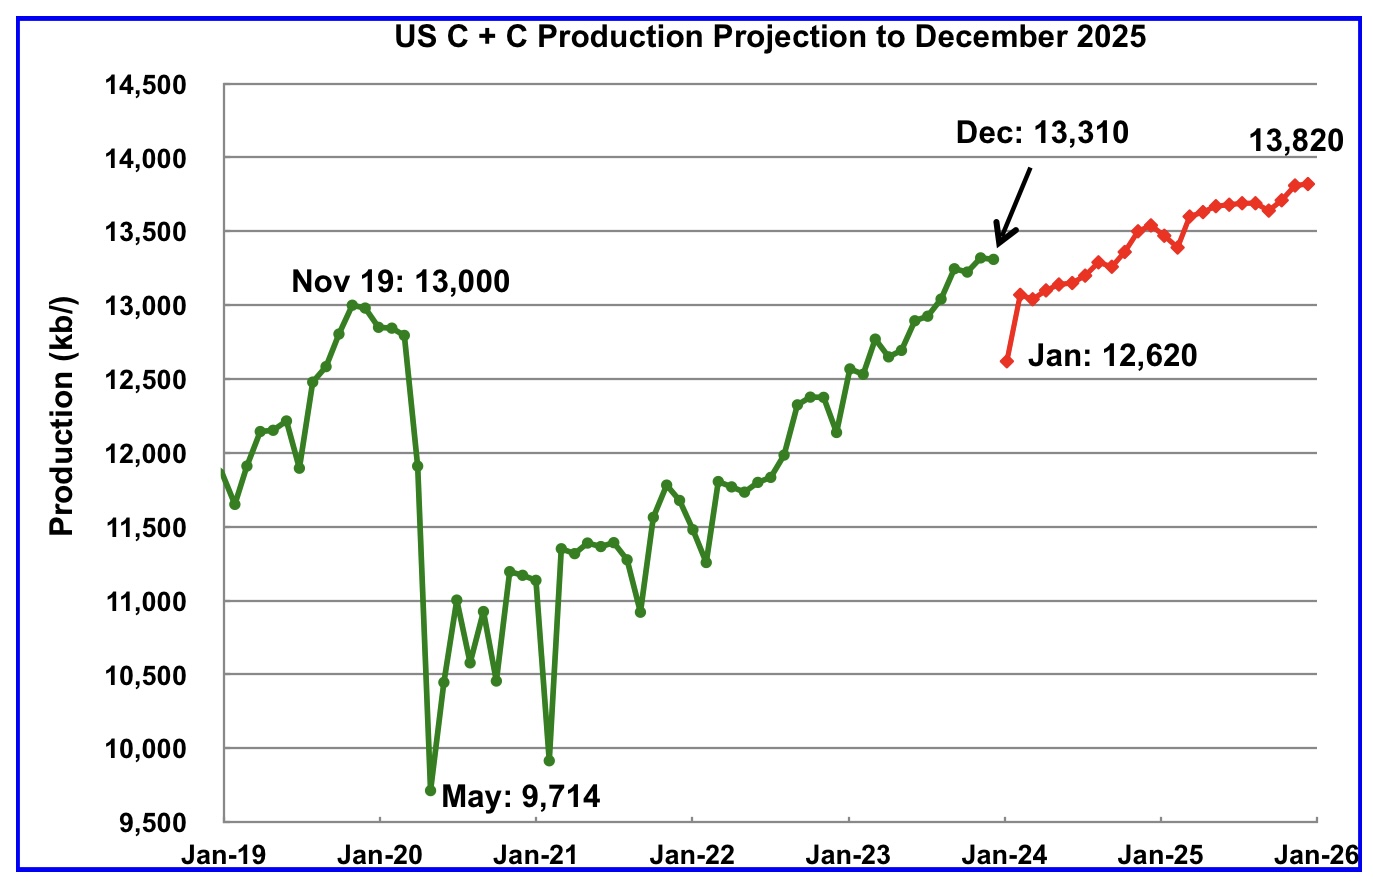
According to the updated March STEO, US oil output dropped by 10 kb/d in December to 13,310 kb/d. US January oil production is projected to decrease by 690 kb/d to 12,620 kb/d due to severe weather in the central US.
The US production projection in the lower chart, red graph, has been updated using the March STEO. The upper chart was posted in the December US update and is reposted here to show how the projection to 2025 has changed, primarily the 2024 portion.
Is the big production drop in the first six months of 2024, excluding January, due to the lack of new well startups during that bad weather week along with the high decline rates associated with the currently producing wells?
113 responses to “November World & Non-OPEC Oil Production”
Here is a graph for US production
Seppo
Genscape is showing Permian production peaked sometime in January. I wonder where the increasing US production forecast by GS going forward is going to come from.
I also think the scale on the right chart is wrong. Permian production is close to 6,000 kb/d.
The financial world in parts still thinks Permian will grow this year.
The shown decline is the prove of Mikes forecast last summer of the Permian decline due to reduced drilling and well quality, showing 6+ months later after the rig report. When this is right, Permian will stall or fall the remaining part of the year since nothing has improved since then, and the DUCs are fewer than before.
So the OPEC is in control of the oil price again – and with the shale drillers flat out they have no incentive to lower the price soon.
If peak and double digit decline decide to show up in April – May – June this year it couldn’t have found a worse time in history to show up.
Ovi,
The right chart is YOY change in 3 month moving average (MMA), I think. I agree it does not look like we will see much US growth in 2024 unless we see some increase in rig counts or in wells drilled per rig. For Permian scenario below I assume rig count remains where it is (for next 5.5 years) and that wells completed are equal to wells drilled 6 months earlier (so little change in DUC count). Output is tight oil only, conventional output from Permian region is excluded. Average new well productivity is assumed to decrease each year by 3.65% for a scenario where lateral length remains at the 2022 average starting in Jan 2023. I also assume no change in number of wells drilled per rig in this scenario.
Dennis
I missed the 3MMA. I agree that the Permian is heading into a plateau phase and it is not clear if US production can grow much more.
Ovi,
I agree on US C plus C output, but only under the assumption that oil prices remain under $95/bo and natural gas prices under $2.50/MCF, higher prices (especially crude oil prices) might lead to higher completion rates and higher output, but my expectation is that oil prices remain at roughly the current level (within $5/b of $87/b for Brent).
Thanks Ovi. Very well done!
DClonghorn
Thanks. Much appreciated.
“Keep in mind that OPEC has close to 3,000 kb/d of production cuts in reserve if required by slowly increasing demand.”
Ovi, I take that to mean that that OPEC could produce 3Mbpd more than they currently do, if the demand was robust. If I am understanding your statement correctly, that implies that the prior Nov 2018 peak could be exceeded, with a production new peak. I do not declare peak demand, rather I guess we will see a gradual upswing in demand for a few years. Price will be the leading indicator, one way or another.
Hickory,
My estimate is about 2300 kb/d of cuts by OPEC big 4 (KSA, UAE, Iraq and Kuwait) all others are close to maximum capacity unless US sanction policy changes. Note that from 1982 to 2019 World C plus C output increased by about 825 kb/d on average. Plugin vehicle sales in 2023 (14.2 million) may have removed about 300 kb/d of oil demand growth and this will increase by about 100 kb/d each year as EV sales grow.
In recent years (2015 to 2023) World output has grown by far less than 825 kb/d per year (even if we drop data for 2020 and 2021), more like 200 kb/d per year. We might be closer to peak demand than most people believe or the trend may revert back to the earlier trend from 1982 to 2019.
Note however that 1933 to 1972 saw World C plus C output grow at about 7% per year, 1982 to 2019 saw World C plus C output grow at the far slower rate of 1.2% per year, so we don’t always see output return to the earlier long term trend. I expect we will see lower World C plus C output growth from 2024 to 2030, probably 0.2% or less on average, possibly closer to zero.
I think demand will accelerate from here to >1.5% p.a., because of two factors:
1. There is a sigmoidal relationship between GDP and transport fuel demand (mogas, diesel, jet), and a very large part of the non-OECD world is in early stages of the steep up-sloping part of the curve.
2. There is not much room left for refinery complexity improvements from here on. Most of the CDU residuals are already being cracked. This has been a major drag on C&C demand over the past few decades, but it is behind us. There is probably ~3M bpd of Middle East use for electricity that will transition in the next decade, but that’s pretty much it. From here on C+C is all transport fuel, and that will be growing faster world-wide than 1-1.2%.
The caveat to this prediction is price/supply. Non-OECD demand is much more price-sensitive than OECD. If supply cannot be ramped at reasonable oil prices, then the S/D equilibrium will be forced lower.
Kdimitrov,
World demand for transport fuel has grown at about 1.77% per year from 1983 to 2018 (about 820 kb/d per year). Not all that clear the trend will continue.
My expectation is that the decreasing transportation fuel used per billion dollars of real GDP over time will lead to only about 330 kb/d annual growth in transport fuel demand on average from 2024 to 2032 with a peak in 2034, this is roughly a 0.5% average annual growth rate in transport fuel assuming real GDP growth continues at the average annual rate from 1990 to 2019 (about 3.4% per year) from 2024 to 2034.
Kdimitrov,
Currently transport fuel is about 76% of C plus C output at the World level, but you are correct that all of the increase in World demand for C C from 1990 to 2019 has come from transport fuel (mogas, diesel, and jet fuel) and this is likely to continue. Notice that difference in % annual increase( 1.7% vs 1.2%) comes from a difference in the denominator (60 Mb/d for transport fuel vs 80 Mb/d for C plus C output).
There are about 40 million plugin vehicles registered in the World at the end of 2023. If each vehicle drives an average of 10 thousand miles per year and on average replaces a vehicle that had fuel efficiency of 30 miles per US gallon on average. That is 333.3 gallons per year or 7.94 barrels of gasoline per vehicle. Multiply by 40 million and we have 317 million barrels per year and divide by 365 days and multiply by 1000 to get kilobarrels and we have 869 kb/d of reduced gasoline demand compared to an alternative scenario where there are no plugin vehicles and instead 40 million more ICEVs with an average fuel economy of 30 miles per US gallon.
In 2024 a conservative estimate for plugin vehicle sales is 17.8 million which would increase the reduction in gasoline demand to 1257 kb/d in 2025 (ignoring the increased number of plugin vehicles likely to be sold in 2025). This also ignores increased 2 and 3 wheeled EVs, increased number of EV buses, EV cargo vans, and eventually EV heavy duty trucks (short haul routes primarily.) China has about a 45% share of light duty vehicles sold which are NEVs (plugin vehicles). BYD is aggressively moving to export markets and we may see India starting to ramp up EV sales next along with other Asian nations.
This may be a much more important factor in reducing oil demand growth than many appreciate as we are seeing a fast exponential rise in the number of plugin vehicles registered world wide.
Hi Dennis,
First a question: does the plug-in vehicle number include two-wheelers (scooters)? Fuel switching from scooters would be much less in volume than from cars.
Second, your math is flawed.
The past growth in gasoline consumption has been slower than the growth of miles driven or vehicles on the road, the gasoline intensity of transport has been going down for decades. The reason is fuel efficiency gains, blending of ethanol, butane and other NGLs, LPG and CNG vehicles, etc…
Plug-in EVs are just another step in that direction, but there is no evidence that that they are bending the trendline.
So, this 0.8-1 MBPD reduction cannot be derived from the miles driven by EVs and the mpg of the gasoline vehicles. Miles been growing faster than fuel. You have to show how these EVs are inflecting the trend.
I, personally, think that the fuel trend will continue to be >1.5% for the next 1-2 decades, unless oil prices shoot-up too high and stay high… The miles trend will be 2%+ probably, and EVs will be the main factor for the divergence, since I think biofuel and butane dilution is close to being maxed-out.
(Also, keep in mind that a barrel of gasoline contains less than a barrel of crude when you do the math.)
Kdimitrov,
I don’t have miles driven for the World, the math is no doubt imperfect, plugin hybrid vehicle probably would have 80% of miles driven on battery, EVs would be 100%. Exact figures for average fuel economy for light duty vehicles Worldwide is a guess and yes it changes over time. I believe the assumption od 10,000 miles per year is pretty conservative, I usually drive about 15 thousand per year in my Tesla, I used 30 MPG, but could have used 35 MPG (about 6.5 l per 100 km). The plugin figures are for light duty vehicles only, it does not include 2 or 3 wheel vehicles.
I used site below for plugin data
https://www.ev-volumes.com/
If one wants to exclude plugin hybrids entirely and assume they drive zero miles using the battery (never plugged in). There are about 28 million BEVs registered in the World (light duty vehicles such as the Tesla Model 3 and such). We can assume 36 MPG and 10 thousand miles in 2024, that would be 6.6 barrels of gasoline per vehicle, this can be reduced by 10% to account for lower energy content of gasoline compared to crude, so 6 barrels of oil equivalent per vehicle times 28 million vehicles results in 457 kb/d less demand than a scenario where zero EVs were ever sold. In 2025 the figure would be 665 kb/d less demand. Demand may grow by less than you believe as EV sales take off.
It will be interesting to watch the demand curve bend.
The trend is difficult to see in the World data, especially due to the pandemic disruption.
Kdmitrov,
This uses data from OPEC’s ASB for World Demand by type of fuel. China transport fuel demand looks like it may be bending (this is gasoline, kerosene, and distillate for China).
Demand for Transport fuel (gasoline, jet fuel, diesel/distillate) with projection for 2023 to 2032.
Kdimitrov —
Electric two wheelers are much more numerous that four-wheelers and doing more to reduce demand for oil.
https://www.drive.com.au/news/e-scooters-slashing-oil-demand-4x-faster-than-electric-cars/
Kdimitrov,
Looking at Non-OECD Transport Fuel Demand (Gasoline, Kerosene/Jet Fuel, and Distillate Fuel) and ignoring 2020 (in red on chart) it looks like non-OECD demand is also bending. From 1995 to 2015 annual growth averaged about 4% and from 2015 to 2019 it had fallen to 2%, I believe the growth rate may continue to slow over time.
At the World level, decreases in OECD fuel demand may offset increases in the non-OECD leading to a plateau in World demand for transport fuel.
Hickory
The question of how much spare capacity OPEC has is difficult to ascertain. The IEA thinks that OPEC has roughly 5 Mb/d of spare capacity. I think it is closer to 2.2 Mb/d, Saudi Arabia 1.5 Mb/d, UAE 0.3 Mb/d and Kuwait 0.4 Mb/d. There is 0.4 Mb/d that is not being produced in the Kurdistan region of Iraq. That explains my thinking on the background for “close to 3,000 kb/d of production cuts in reserve”
So yes if demand today suddenly surged by 3 Mb/d and OPEC opened the tapes, supply would exceed the November 2018 peak. However we know that won’t happen.
Time is a critical consideration when trying to assess World/OPEC spare production capacity. The decline data that I put together indicates that the world decline rate is close to 0.5 Mb/d. So two years from now that 3 Mb/d of spare capacity would effectively be reduced to 2 Mb/d if demand continued to grow at 1.0 Mb/d. That would put production close to the November 2018 peak. Looking further out to 2030 when peak demand is expected by many, the annual decline rate would have reduced that spare capacity to almost nothing.
What do they tell economists who predict outcomes, “Give them a date but not a number or give them a number but not a date.”
Thanks for explanations guys.
Dennis,Ovi
You have really elevated not only the quality of the presentation, but also the quality of the comments on this site.
Well done!
Agree – much better signal to noise ratio.
Thanks!
Vince
Old Chemist
Thanks.
Thanks Ovo –
When was the peak? It looks like late 2018 but not 100% clear…
Above you asked:
“Note that December 2025 output of 69,664 kb/d is lower than February 2023. Is this an early indicator that World without US oil production is heading into a plateau phase?”
It’s been more than 5 years since late 2018 and world excluding US has lost ~1% per year since that time on average…
If plateau was happening then production should be near 2018 levels (not 5% below them). 69.66 MB/D in December 2025 seems extremely unrealistic, if the current trend holds that should be below 68.0 MB/D as a best case scenario for late 2025.
I could see an argument that US is in a plateau phase, but not sure that applies to the rest of the world…
Or maybe I am missing something ? Is there anyone here that still thinks a future world peak is in the cards (aside from Dennis)? Although I think Dennis has firmly moved into camp of the great Demand driven decline fake-out…
It might be useful to add some annual trendlines to some of the graphs, could help distinguish the larger picture from all of the noise… between OPEC and Russia there’s been a decline of 1 MB/D each year.
It’s ironic to me that a website with Peak Oil in it’s name has so much trouble recognizing a pivotal change that happened more than 5 years ago.
Notice anything else happen between 2018-2019? Spoiler – Global debt jumped by more than 20%…
The way the Bank for International Settlements looks at this is Debt to GDP see
https://data.bis.org/topics/TOTAL_CREDIT
Data for all reporting nations credit to non-financial sector to GDP at PPP exchange rates.
Just as a mortgage is lent based on the borrowers ability to pay (their income relative to total debt) the same is true of the economy as a whole. GDP is essentially the World’s income, a typical “safe” debt to income ratio for mortgage lending is about 3 to one or 300%. Japan has had Debt to GDP over 300% for years and several European nations also have high debt to GDP, this is less of a problem than many believe.
But the issue of defining GDP in a real world meaningfull manner still persists…
Laplander,
True of all data at the World level, measuring debt, GDP, income or any economic data point is always problematic, there is not any perfect data that I have seen. So we could just eliminate any discussion of economics, or use the data that exists, I choose the latter.
Note to all that Kengeo’s chart at link below is wrong
https://peakoilbarrel.com/november-world-non-opec-oil-production/#comment-772525
see comments further down thread for an accurate chart (link below).
https://peakoilbarrel.com/november-world-non-opec-oil-production/#comment-772700
Question Dennis- why do we look at ‘non-financial sector’ debt when looking at the issue debt level risk, rather than total debt? I don’t understand the rationale for the distinction. Does this ‘non-financial sector’ debt include all other categories of debt… such as government debts, corporate debt, mortgage debt, etc?
Thank you.
Hickory,
Yes it includes government, household, corporate, and non profit sectors. The financial sector is excluded because of huge amount of notional debt various Collatoral Debt Obligations that don’t really have anything backing them up. Have you seen The Big Short? There are a lot of strange financial vehicles out there that have little to do with the real economy, these are often called derivatives.
See following from BIS and scroll to the “Credit to non-financial sector” section.
https://www.bis.org/publ/qtrpdf/r_qt1509e.htm
Hickory,
I took a brief look at Bank for International Settlements (BIS) Data for derivatives. The “notional” amounts for these derivatives is very high, but the market value of these derivatives is what matters so I compared the market value of credit to the non-financial sector (note that bonds are a form of debt and are priced in markets just like stocks) with the market value of all outstanding derivatives in the BIS database. The credit (to the non-financial sector) market is much larger than the derivatives market (about a factor of 10 larger).
For those that don’t think we can believe GDP measures, this is in trillions of US dollars, but you have to believe exchange rates are real.
Thanks Dennis. My understanding of these matters is laymen (-3) level.
Something I have mentioned in the past, but did not provide a chart, was the expansion of credit in emerging nations which has doubled since 2014 growing at an annual rate of about 8% per year, the expansion of debt in advanced nations has been more modest at about 3.4% per year on average. This chart is at market value in billions of US $ (previous chart in trillions). Note that in terms of debt to GDP (if one can believe that measure) the emerging nations as a group have lower debt to GDP than advanced nations in 2023 they simply have gotten better access to credit than in 2014.
Kengeo,
Source of your Debt data?
Multiple sources, but here’s one:
chrome-extension://efaidnbmnnnibpcajpcglclefindmkaj/https://www.spglobal.com/_assets/documents/ratings/research/101591942.pdf
Kengeo,
That is a link to nowhere, try again.
Did you mean this
https://www.spglobal.com/_assets/documents/ratings/research/101591942.pdf
Here is the chart from S&P Global see page 3
https://www.spglobal.com/_assets/documents/ratings/research/101591942.pdf
The proper way to do this is to either look at debt in real dollars (constant dollars adjusted for inflation) or consider debt to GDP, just looking at nominal dollars doesn’t tell us much. Also note that kengeo moved the 2030 data point to 2025. So his chart is just made up nonsense.
If your going to post a chart make it accurate and if you make a mistake own up to it.
Thanks Dennis –
The chart I posted previously was based on limited inputs (not the link I sent). Point is that it has grown significantly over the last 50 years. And more recently the 20% spike coinciding with peak oil….global debt reached a record high of $277 trillion in the third quarter of 2023, up from $87 trillion in 2000. It sounds like you downplay this? It also sounds like the energy transition demands considerable additional debt?
Kengeo,
The value of a dollar has fallen in the last 50 years so using nominal dollars is a very poor metric. When I was a child I would purchase a popsicle at the corner store for a nickel and a Coke was 15 cents.
Also much of the increase in Global debt since 2000 was due to emerging nations obtaining access to credit markets, that is a good thing. Yes I downplay the doomers that seem to believe an increase in debt is always a bad thing.
Do you understand what happened to credit during the Great Depression? It collapsed. Similarly during the Global Financial Crisis credit temporarily collapsed, but the actions of central banjers and governments helped to avoid a second Great Depression.
The Increase in Global debt to 200 to 300% of World GDP is not really a problem. Chart below shows advanced economies credit to non-fincial sector to GDP % (at PPP exchange rates) from 2000 to 2023.
Kengeo,
Credit to non-financial sector to GDP % (PPP exchange rates) for all reporting nations, advanced economies and emerging economies, data from BIS link below
https://data.bis.org/topics/TOTAL_CREDIT/data
This data shows that much of the increase in debt to GDP at the World level is due to better access to credit for emerging nations, this is a good thing rather than the reverse as it will lift less wealthy people’s incomes and will also enable a demographic transition so that World population stabilizes and then declines.
Kengeo,
Again, where are you getting your estimates? You have given one source, no estimate for debt in 2000 in that source. At BIS Debt was 60 trillion at the end of 2001 and 227 trillion in 2023, over that period for all nations that report data to the BIS, the GDP of the reporting nations increased from 31 trillion to 93 trillion, which is why Debt to GDP is the important metric not debt alone.
Dennis, think you are missing the point – Debt growth is outpacing GDP growth plain and simple. In 2000, relationship was $2.5 debt could generate $1 GDP, now it’s $3:$1 debt to GDP ratio. 25 years before that the relationship was $0.5 debt could generate $1 GDP.
Unless there is a course correction we are on track to grow this relationship by 6-7% each year, by 2050 that could mean debt level is 1500% of GDP…
Average annual US debt expansion in 70s/80s was 10% and then stabilized to 4.8% for 35 years until the recent spike to 20%, an unprecedented jump from $23T in 2020 to present level of $34T.
How much longer can we borrow money from the future that we have no intention of paying back?
Kengeo,
The debt does indeed get paid. Have you ever borrowed money to purchase a home or car? It is not a problem for people to borrow money, in fact lack of credit is much more of a problem, see
https://en.wikipedia.org/wiki/Great_Depression
and
https://www.federalreservehistory.org/essays/banking-panics-1931-33
The banking system was drained of cash as people pulled their money from banks for fear of bank failure. Without deposits there was very little lending which brought the economy to a standstill.
Be careful what you wish for, too little credit is much worse than too much. People having access to credit is a good thing, not a bad thing. There was a time when only the very wealthy had access to credit, now more people have the ability to borrow so debt to GDP ratios are higher. Governments run up debt during economic down turns, they can raise taxes and/or reduce spending to reduce debt levels, it is a choice made by elected officials in a representative democracy.
See following for US Fed Govt Debt to GDP, an increase in taxes or a decrease in government spending or some of both would reduce Debt to GDP. Note the increase in 2020 (Trump’s last year in office) which would be expected in response to the pandemic.
https://fred.stlouisfed.org/series/GFDGDPA188S
Do you see the chart for advanced economies? the Debt to GDP has been stable since 2010 (aside from a brief blip during the pandemic). Most of the increase at the Global level has been emerging economies getting better access to credit, which is a good thing. The global level of debt remains below the advanced economy level and there are nations such as Japan that have had Debt to GDP between 300 and 400% for decades, it is not really a problem.
And on your math, debt to GDP in 2001 for advanced economies was about 200% in 2001 and about 250% in 2023, so a 50% increase over 22 years, about 2.27% per year, so if we assume this continues from 2023 to 2050 that would be about 61% or 310% debt to GDP, not clear where your 7% number comes from, the world will trend toward the advanced economy rate of increase. Also note that from 2010 to 2023 advanced economy debt to GDP % increased from 255 to 260%, so a 5% increase over 13 years or 0.38% per year on average, so for the 27 years from 2023 to 2050 this would amount to about a 10% increase in debt to GDP bringing the 2050 number to about 270%, which would be no problem at all.
Kangeo
The World peak occurred in November 2018 and it is labeled on the chart.
Covid has thrown a curveball into the oil market, economically and physically. The need to shut down wells damaged many wells. We don’t know the extent of well damage caused in many countries.
So what is being seen in the World W/O US chart is two fold, increased demand is allowing new wells coming online and closed wells returning to production. That accounts for the sharp rise in production from mid 2020 to early 2023. Since many wells were damaged that means that they can’t produce at pre-Covid levels.
So the drop of close to 3,000 kb/d between October 2018 and December 2025 is due to OPEC cutbacks, decreased demand and well damage. It will take many more months to determine whether the World W/O US will be on a plateau and for how many years.
Blaming of covid ended several years ago…
that’s “dog ate my homework” kind of stuff…
you said the “c” word not me…since it’s not safe to mention that word on this side of the debate…
Kengeo,
World demand decreased in 2020 and led to very large increases in oil stocks due to the economic downturn. In 2021 there was not much need for a big increase in output because the World was slowly recovering from the downturn. The annual trend from 2020 to 2023 is pretty steep at about 2100 kb/d, much higher than the 2000-2019 trend (858 kb/d per year). After 2023 growth may be more moderate due to slower demand growth in the future compared to the 2000-2019 period. EVs and plugin hybrid sales growth (nearly 50% this year expected in China for plugin sales share) will continue to take bigger and bigger bites out of future oil demand growth.
Kangeo
I report on Covid damage every month in the US report. That 511 kb/d drop from October 2019 is unrecoverable covid damage.
My latest on covid. It’s bad, really bad.
The plateau was 2006 to 2018 (12 years):
Kangeo
To me this table is reporting depletion rate, not decline rate. Two different measurements.
Ovi,
Kengeo’s chart also ignores contingent resources, Jean Laherrere tens to be quite conservative in his estimates of URR and he recently estimated 3500 Gb for World C plus C URR with about 2500 Gb for World conventional C plus C URR. Looking at 1P reserves is not at all useful, even 2P is not that useful when contingent resources are ignored, 2PC gets us close, 2PCX allows for some discovery and reserve growth. Those are the numbers that matter.
Dennis
Thanks. I do not follow 1P or 2P info because it does not have much impact on the peakoil discussion over the next five years.
Why does it not impact the debate? This seems unsubstantiated…aren’t 1P oil reserves at the end of all of the straws we are sucking on? Don’t they represent something? We are thirsty to the tune of 29 Gb per year, we’ve had a great time slurpping down 1500 Gb of this oil smoothie but currently the line is long and it looks like the joint is running out of ingredients…Dennis says that isn’t so, the backyard is full of carrots and spinach and all kinds of goodies to mix in the blender…but is it really?
…1P/2P are shrinking NOT growing!
How can you look at 1P and 2P values over the past 10 years and come to any other conclusion? You should be unbiased when you look at the data/estimates, just repeating over and over the canned language about discovery and reserve growth does no good, it’s a really simple concept that is somehow lost/ignored on/by many here…
Kengeo,
I will create an example using 1P reserves, to attempt to explain reserve growth.
In the US at the end of 1976 crude reserves were 30942 million barrels and in 2005 crude reserves were 21757 million barrels. You would say proved reserves have decreased.
Consider however that cumulative production of US crude from Jan 1977 to Dec 2005 was 71687 million barrels and there was 21937 million barrels of newly discovered fields.
So add 1976 reserves to 1977-2005 discoveries and we get 52879 million barrels. We then subtract the 71687 million barrels of oil produced and get -18808 million barrels, actual reported reserves at the endo of 2005 were 21937 million barrels so reverves must have grown by 21937 plus 18808 or 40745 million barrels of reserve growth from 1977 to 2005. As we gain more knowledge and technology improves the estimates of what can be produced changes over time, this is called reserve growth and it is substantial.
Data from
https://www.eia.gov/dnav/pet/pet_crd_pres_dcu_NUS_a.htm
See also here:
Using data from
https://data.bis.org/topics/TOTAL_CREDIT
US Debt to GDP for non-financial sector from 2008Q1 to 2023Q3.
This is an interesting take on the issues of decreasing diesel supply. With the proportion of reserves needed in developing new oil fields rising exponentially, and most of that energy required as diesel, and ther only being a limited proportion of diesel in each barrel of crude we are approaching a point where new oil fields will only provide a small, and declining, new supply of diesel to society in general. And therefore:
“No diesel, no mining, no metals, no construction. At least not beyond any scale what we had during the Middle Ages.”
https://medium.com/@thehonestsorcerer/meet-the-gator-growing-energy-demand-316de796d191
It’s a medium size investment to run this equipment on a different hydrocarbon. If Diesel is 8$ / gallon and Butane (as by product of the growing gas production) at 2 $ equivalent, you’ll see refitting everywhere.
And at least mining is the least critical application of hydrocarbons – all underground mining is done electrical because of air problems (have fun to start a 3.000 PS Diesel engine in a narrow corridor 2000 meters under surface), and in pit mines a conveyor or train system is often used, too. It’s just a price thing if more infrastructure pays out. Building these rails for mine trains or moving conveyors to a new location is not more complicated than building a solid dirt road that doesn’t collapse under these 100 ton trucks.
Diesel (and jet fuel) is most critical to wide transport and local distribution at the moment – no alternative there besides Butane for road transport at the moment. And no, electric transportation is not there yet.
The price matters a lot – a thing neglected in this forum by all but the real oil producers. If Dennis would make his simulation with a price -> drilling -> production -> price feedback look he’ll see nice oscillating results, more like in reality but with even less accuracy to see the future. Because there are a lot of parameters to fill, most of them from guessing.
I made things like this at my studies, it’s normal in physics as the result of non linear differential equation systems you can’t calculate, only simulate.
You might like to do some homework on butanes, the supply of which is miniscule compared with diesel. The global supply of butanes is less than 200 million tonnes and much of the production is already consumed in existing appllications ( petrochemicals, alkylation, gasoline blending, auto-gas, heating). the consumption of diesel is considerably more than 1.5 billion tonnes depending on the applications.
Moreover butanes would require that the engine be modified to in effect be duel fueled. Butanes have a high octane number and low cetane number making them resistant to compression ignition. A small pilot charge of diesel fuel typically combusted in an indirect injection set up that acts as a pilot flame to set off the alternative fuel which is injected separately.. This is how a diesel engine can run on methanol or LNG.
Comparing fuel costs in volumetric units is always misleading. Butane have a density of about 0.65 whereas diesel it typically 0.84. The CV of butanes is about 5% greater than diesel m/m.
When they don’t push up freeze out (some Butanes and Propanes are simply burned in nat gas plants), you can run as you have written direct on LNG – the effort is somewhat higher.
It all depends on the price – and when we run in a longer lasting Diesel crisis with dirt cheap nat gas, the transition will be made.
This isn’t exactly rocket science, you can already buy it:
https://www.omnitekcorp.com/altfuel.htm
You don’t even need a new truck. I only wrote Butane because conversion here is even cheaper, for gas cars it’s less than 1500 € to make it bi-fuel.
Worked with LPG-tanks for quite a while, different tests for Butane and Propane tanks according to EU standards, a bit higher pressure for Propane I think, been a while since.
Also quite some interest for car conversions already at that time, but I´m not in the loop now, was ~3-4 years ago.
Edit, due to the different liquifaction pressure, of course.
Eulenspiegel,
I do use price in my tight oil models, for the World it is a bit difficult to nail down the costs in various fields, there is data available on this at a cost of many thousands of dollars for IHS Markit/S&P Global Data.
There would be some oscillation due to changing prices, but with the various lags for drilling, completion etc, it is complex to model, also not that decisions are based on expected future prices. My current best guess scenario is based on an assumption of $75 to $85 per barrel at the well head, higher prices could lead to higher output in the short term (with higher completion rates for new wells and lower prices could lead to lower completion rates than I have assumed.
You can try your own models using spreadsheet below (just adjust the row with new wells, note that the EUR decrease sheet assumes 3.65% annual decrease in new well productivity after Dec 2022, but this can also be adjusted (it is based on average normalized (for lateral length) productivity decline from 2016 to 2021 in the Permian basin.)
https://peakoilbarrel.com/wp-content/uploads/2024/03/permian-model-bigx5.xlsx
Chart below is a scenario with higher completion rate due to assumed higher oil prices in the future (over $95/bo in 2023$).
How would this look at $150/barrel, if you might be able to take a look?
JB,
We would have to guess at how high completion rates would rise in that case, note that there are only so many rigs and frac spreads that currently exist so there is a limitation on the possible increase. We will assume 550 completions per month is the short term limit and that it will take at least 12 months to ramp up the completion rate to this level, thereafter we will assume a constant completion rate (perhaps because operators and service companies are not convinced the high price level will be sustained.) I have also assumed NGL sells for 30% of the cost of crude and that natural gas price is $2.50/MCF, I assume these prices are in 2023 US$ and that the capital cost of the well and OPEX costs also remain at current levels in 2023$.
The scenario may be too conservative, but I also don’t believe $150/b in 2023$ will ever be sustained in the future. So this scenario is not very likely in my view, odds of perhaps 1 in 20.
Note that an oil price at this level would tend to accelerate the transition to electric transport, which might reduce oil demand and would tend to depress oil prices due to lack of demand.
Eulenspiegel …. “And at least mining is the least critical application of hydrocarbons – all underground mining is done electrical because of air problems”
Minor problem, that statement is simply not true. Only last week I linked and article on safety of running diesel engines underground in coal mines, after Nick G made the claim that underground coal mines didn’t use diesel equipment, which was also wrong.
https://www.resources.qld.gov.au/__data/assets/pdf_file/0009/1438524/diesel-emissions-mgt-underground-coal-mines.pdf
As that government release states …. “Diesel engine powered vehicles are widely utilised in underground coal mines”…
George is correct, without diesel, it’s back to mining like they did in the middle ages. Only problem is that we have already mined everything they thought was worthwhile at shallow depths. The deep, low grade stuff we have left, will just stay there without diesel, it will become inaccessible to humanity.
Waste Management is the biggest refuse hauler in the US. They are well on the way to exchanging their entire diesel truck fleet to Nat Gas.
“WM operates the largest fleet of Class 8 heavy-duty natural gas vehicles (NGVs) in North America.
We operate almost 11,000 NGVs, equal to 57% of our total collection fleet and 71% of our routed
fleet.”…as of 2 years ago.
Nonetheless, get used to higher and higher diesel pricing over the years. We have had a lovely time of cheap food and myriad of products (diesel and gasoline enabled) for a long period now…hope no one has come to think its a permanent state of ease.
Further Ruminations on Saudi Arabia’s Oil Reserves
In an unexpected move, Aramco, the Saudi national oil company, announced the Kingdom had directed it to maintain its “maximum sustainable crude capacity” at 12 m b/d and to abandon its longstanding plan of increasing production to 13 m b/d. The financial press took the announcement to suggest the Kingdom expects oil demand will soon peak. “Saudi Aramco Drops Expansion Plans, Raising Demand Questions” ran a Bloomberg headline, capturing the zeitgeist.
We wonder if perhaps Saudi Arabia canceled their expansion plans because they worry that remaining recoverable reserves are now insufficient to support higher sustained production.
We wonder if perhaps Saudi Arabia canceled their expansion plans because they worry that remaining recoverable reserves are now insufficient to support higher sustained production.
I have suspected that was the reason all along. They do not have anywhere near the proven reserves they claim to have. Of course, I have been making that claim for years. But pushback from those who actually believe those absurd reserve numbers have dissuaded me from posting more about it.
I lived in Saudi Arabia for five years. Exaggeration is just how they talk. And they expect people to understand that this is just how they talk. They are shocked to find out that Westerners take them literally, especially when their claims are so outrageous, like their oil reserve claims.
Thanks Ron, I fully agree.
Imagine the thinking of the Saudi’s if they really believed in the transition narrative. If they alerted the world that they only had XYZ barrels in reserve (the real number), then ‘the world’ is likely to push for the transition much faster, leaving a lot of Saudi oil as a stranded asset. Much better to keep the world believing in hundreds of billions in reserve so the ‘transition’ only happens slowly..
Of course this means they believe in all the magical thinking that there is a transition at all, which can’t and isn’t happening.
Ron,
I would agree with you and Hideaway on the Saudie reserves and the supposed capacity. All the supposed OPEC spare capacity must be taken with extreme caution. What is the defination of spare capacity? No OPEC country gives any definition of spare capacity.
EIA defines spare capacity as the volume of production that can be brought on within 30 days and sustained for at least 90 days.
https://www.eia.gov/finance/markets/crudeoil/supply-opec.php
My take on the KSA production is that the supposed 2 million b/d spare capacity should be taken with a pinch of salt. They might get there but for how long? I remember the 2008-2009 period when KSA did ot have any spare capacity. They were waiting on the AFK fileds coming on stream and the GOSP was not ready.
I have spent a lot of time working in the ME. Arabs, and they are not alone, have a tendency to “big up” their potential only to fall short when put to the test. Remember in the oil production business depletion NEVER sleeps.
I think the actual “spare capacity claimed is about half of the claims.
Saudi Arabia is desperately trying to move away from depending on oil production for their economic survival. They know what is coming and likely coming soon.
Saudi Arabia hits important economic milestone: Non-oil activities at 50% of GDP
The data points to a positive trajectory for the kingdom’s economy, driven by diversification, and growth across multiple sectors.
Saudi Arabia’s economy has reached a key economic milestone as the non-oil sector activities comprised 50 per cent of the country’s real GDP in 2023.
This is the highest share ever recorded in the country’s economic activity makeup.
This achievement, analysed from data provided by the General Authority for Statistics and the Ministry of Economy and Planning, underscores the kingdom’s ongoing economic diversification efforts.
Consumer spending, private investment push non-oil economy
The non-oil economy, valued at SAR1.7tn (approximately $453bn) at constant prices, has been buoyed by growth in investment, consumer spending, and exports.
Private-sector investment, in particular, has surged by 57 per cent over the past two years, reaching a record high of SAR959bn ($254bn) in 2023.
Leading the charge in non-oil activities are arts and entertainment, which saw an exceptional 106 per cent growth between 2021 and 2022.
Other sectors, including accommodation, food services, transportation, and storage, also experienced robust growth, expanding by 77 per cent and 29 per cent, respectively.
The growth in non-oil activities spans various sectors, with social services, healthcare, education seeing a 10.8 per cent growth; transportation and communication growing by 3.7 per cent, and trade, restaurants, and hotels all registering significant increases of 7 per cent.
Notably, real service exports, driven primarily by tourist spending, soared by an astounding 319 per cent over the past two years, reflecting Saudi Arabia’s transformation into a global tourism and entertainment hub.
Vision 2030
This surge in non-oil activities aligns with the objectives of Saudi Vision 2030, aimed at achieving an economy through diversified growth drivers.
The success in implementing key programmes outlined in the vision underscores the kingdom’s commitment to fostering new sectors that contribute to higher growth rates.
In addition to the non-oil sector, Saudi Arabia’s business sector is witnessing promising growth across various segments.
The Ministry of Commerce’s quarterly business sector bulletin for Q4 2023 highlights a rise in commercial registrations, particularly in land transport of goods, hospitality, technology, tourism, and specialised services.
There is a lot of charts at the bottom of this article, all depicting Saudi’s progress in moving away from an oil economy.
Ron
The more relevant question regarding SA going forward is whether their sustainable production capacity is 10,500 kb/d. Keep in mind that Ghawar is declining by 70 kb/d/yr. Which other fields are making that up.
Ovi,
Have you seen any recent data on Ghawar output? I would say I don’t know whet the decline rate is for Ghawar as I do not have data for specific fields in Saudi Arabia for at least the past 5 years, perhaps longer.
Ron
The problem is that they are following the Dubai model and building a theme park in the desert totally dependent on fossil fuels to operate.
When oil was discovered in the eastern province in the 1940s, Saudi had only 3 million people, most near jeddah along the red sea and in the mountains near yemen. A few nomads near the oases in the center and east of the country. Now, with oil there are more than 40 million. Once the oil is gone, the population will decline. Without the energy from oil and gas there is little reason for anyone to live on the Arabian peninsula. Those who do will live like the Yemenis do today. Malthus will rule the peninsula.
UK annual C&C production through 2023 by start up year from 1975 with proportion by area (Central/North/South North Sea, Irish Sea, West of Shetland). Also showing Water Cut.
UK annual natural gas production through 2023 by start up year from 1975. Also showing associated gas (remainder is dry gas mostly from SNS, which has no oil or condensate fields).
By coincidence this was in the Times today (I’m not sure it’s got all the facts though, which is not uncommon with any MSM writing about energy).
“The amount of energy produced domestically in Britain has fallen to its lowest level on record, increasing the country’s dependency on imports from Norway and the United States.
North Sea oil production last year fell to the weakest level since records began in 1948 and gas output was the second lowest, according to figures from the Department for Energy Security and Net Zero.
A rise in wind, solar and hydroelectric output failed to offset the fall in more carbon-intensive fuels, which meant that total UK energy production was 9 per cent lower than in 2022 and down by more than two thirds on 1999, when domestic production peaked. Maintenance outages and plant closures meant that nuclear output was also at a fresh low.”
I do think that the US under Biden or Trump would use military force to keep Venezuela from asserting physical control over western Guyana, particularly since there is oil at stake. They would be responding to a request for assistance.
-https://newssourcegy.com/news/guyana-will-call-on-allies-if-there-is-any-breach-of-territorial-space-pres-ali-tells-bbc/
-https://oilprice.com/Energy/Energy-General/Exxon-and-CNOOC-Team-Up-To-Challenge-Chevrons-Guyana-Oil-Deal.html
Bad Weather drops US January Production by 762 kb/d
Something is a bit off. North Dakota, which was in the news as heavily impacted by the weather shows only 60kbpd decline. Big declines in TX, NM, OK, GOM…. Is that really all weather?
IMO, it’s a combination of some EIA methodology tinkering, weather, and the seasonal frac drop-off. It may be hard to untangle which one is how much…
Kdimitrov
Add 100 kb/d to ND drop.
ooops!
Math, how does it work?
🙂
US crude looks like it could be rolling over.
https://twitter.com/OilHeadlineNews/status/1773741101901353262?t=q4PpSGX9KKYefQJTzf0LEA&s=19
I agree – weekly production dropping, but this would be a covid-like drop…so not too likely…
Weekly data is of little relevance it is often far from the mark and best ignored.
Kengeo,
Any explanation for why we would use a quadratic equation to fit oil output data?
Here is Monthly US C plus C data from Jan 1920 to Jan 2024 with quadratic fit.
Data from link below
https://www.eia.gov/dnav/pet/hist/LeafHandler.ashx?n=PET&s=MCRFPUS2&f=M
This also tells us very little, but shows that the data one chooses changes the outcome significantly.
We could also use 2010 to 2024 data for an alternative fit, also tells us nothing IMHO.
The Visual Capitalist did some nice visualizations on the relative quantities of materials extracted by all mankind.
https://elements.visualcapitalist.com/the-scale-of-fossil-fuel-production/
https://elements.visualcapitalist.com/all-the-metals-we-mined-in-one-visualization-2/
The amount of oil is about half again as much by weight as all metals put together. The amount of coal is twice that.
Nearly all the metal is iron ore. The numbers for technology and precious metals is vanishingly small.
Anyone claiming EVs are going to increase total mining is simply lying. Even reducing coal and oil consumption by a few percent would make up for the added mining of the technology metals.
Alimbiquated, the arguments for how little we have to mine sound fantastic to the uneducated. Can you please tell us where we mine these 22 million tonnes of copper that come out of the ground as pure 100% copper?
Or perhaps is there more to the story?
Taking just copper, the average ore grade is approaching 0.5%, that’s 200 tonnes of waste associated with 1 tonne of copper. Of course we don’t and can’t recover 100% of the copper but the 90% we do get is fairly good recovery..
Lets do a little calculation based upon reality. We need to mine ~220 tonnes of 0.5% ore grade at 90% recovery to get 1 tonne of copper, so for 22,000,000 tonnes of copper = 4.84 Billion tonnes of ore.
As they say in the adverts, ‘but wait there’s more’!! Ore bodies are not nice and consistent sitting on the surface. The majority of copper mining happens in open cut mines with irregular shaped ore bodies often starting 50-100 metres below surface. Being generous the strip ratio of 1.5/1 (waste to ore), and I know of proposed mines of a grade of 0.02% being planned with strip ratios of 1.3/1, we can add an extra 7.2 billion tonnes of waste that has to be blasted and moved as part of the copper mining operations…
Now draw your graphic with all the waste being removed, then the 4.8billion tonnes of hard rock ore that has to be crushed, then ground to a powder, sent to floatation tanks, have chemicals added to make the copper float (these chemicals come from mostly from oil and gas production).
Basically 12 billion tonnes that needs to be moved for those 22M tonnes of copper. But wait, we need MORE copper every year for the green transition, at lower average grades, from deeper more remote mines on average, with harder ore indexes, and higher strip ratios… Doubling copper production would probably mean halving ore grade, making this 12B tonnes go much higher, especially when recovery goes down with lower ore grades and lower grind sizes, so instead of just going to 24B tonnes moved, we might need to move over 30B tonnes of rock to get 44M tonnes of copper.
Of course to do it all, we would need a lot more oil because the mines are increasingly in remote locations, plus more oil and gas derivatives for the chemicals used in the floatation circuits..
Now do the same type of calculation for every other metal needed for the ‘energy transition’, to see the reality of the situation, instead of these simple, stupid, irrelevant, graphics, made by those trying to delude the stupid and uneducated…
Hideaway
I was about to point out the nonsense of the post but you are much better than I at the finer points of mining. Some on the POB blog live in a world of denial, afraid to accept the reality of the situation. If there is any supporting evidence provided by these “internet experts”, it generaly comes from a source that is an opinion not supported by factual evidence. I am amazed that certain posters refer to the likes of The Guardian, NYT, WSJ, etc as proof of concept. What never ceases to amaze me is the polemic belief that many have regarding unreliables when the evidence is there to be seen. Just look at the cost of delivered electricty. If it is so cheap and so reliable where are all the new projects taking advantage of this abundance. No-one in the chemical industry I can assure you, especially in Europe.
One of the worst misunderstaniding is the LCOE scam. Levelised cost of electricity. A total joke.
Carnot-
if you are planning for new electricity deployment or comparing different generation projects what is a more appropriate or useful financial measure to utilize rather than the 30 year levelized cost of electricity [LCOE] that is based on the best current data?
The utilities of the world take these decisions very seriously, with cost [LCOE] and stability as the heaviest determinants. And the regulations of the region in which they operate.
“Some on the POB blog live in a world of denial, afraid to accept the reality of the situation.”
Carnot, this above is your strawman. Like a narcissist, I’m guessing this is your way of feeling superior or more knowledgeable than others. The regulars here get it. They just don’t need to stroke their ego everyday as others do. It’s just a waste time. When there is so much that can be done to keep this ship of humanity a float a lot longer. There will be a day it all comes crashing down. Some of us just don’t want it to happen on our watch and some of are more concerned about their ego. It’s all about character.
No kidding, half the people here seem to want civilization to collapse just so they can say they told you so
One word response.
Bollocks.
Get a life. You live in dreamland
Hideaway +1
Conventional ~220 Gb
Unconventional ~60 Gb
This just about matches the current level of 1P reserves…
My graphs are prettier:
Kengeo,
At the end of 2021 US cumulative production was 238 Gb and proved reserves were 44 Gb for a total of 282 Gb.
Typically there are also probable reserves which typically are about 70% of proved reserves (in this case about 31 Gb, this would be the enfineering best guess with a 50/50 chance reserves are either higher or lower). So the realistic estimate would be 282 plus 31 or 313 Gb at minimum. Then we need to add reserve growth and future discovery and probably 340 Gb would be more reasonable for an estimate of US C plus C URR. Conventional C plus C URR is likely about 250 Gb and tight oil URR about 78 Gb so perhaps 328 Gb would be my best guess if oil prices remain under $90/bo, but higher oil prices might allow higher tight oil output and perhaps higher offshore as well pushing US URR up to 340 Gb.
Added a version for those that believe in fairytales, URR = 310 Gb…
Let’s say you’re correct and the decline is coming sooner and harder than we can imagine. What then? Bunker down somewhere with guns, goats and gold? Seek out a hippie farming commune? Put our heads between our legs and kiss our ass goodbye? Or try to adapt and make the best of what we have left?
There will be some of each of those options being played out simultaneously. Contraction will not be experienced evenly, there will be huge differences in timing and scale geographically. Watch the UK as they are a decade or more ahead of us in this process. The US will fall hard, but we have some buffers in terms of natural resources that other countries do not. Now is a good time to begin thinking about where you live and what it might be like if the economy becomes more localized and focused on essentials. It is very difficult to keep one foot in the current economy and simultaneously prepare for a different world, especially when the timing is uncertain. But I personally do not think we have too much time left before oil decline rates take hold. I have been following this for 20 years and have been doing all i can think of to put practical resources in place, largely for my adult children as they continue to slog away in the BAU economy.
Good luck
Best of luck to you, being aware is more than half of being prepared! Those in denial will have much fewer options.
Using data from link below for US total C plus C and tight oil we deduct tight oil from US C plus C to find conventional oil output from Jan 2005 to Dec 2019. The trend is a 0.11% annual decrease in conventional oil output over that period or an annual rate of 6 kb/d year. This may change as Gulf of Mexico plateau may end in 2027 or so.
Links
https://www.eia.gov/petroleum/data.php#crude
https://www.eia.gov/dnav/pet/pet_crd_crpdn_adc_mbblpd_m.htm
https://www.eia.gov/energyexplained/oil-and-petroleum-products/data/US-tight-oil-production.xlsx
Long term trend from 1986 to 2009 for US conventional was an annual decrease of about 2.8% per year, we might see about that level of decrease from 2025 to 2040.
Also took a look at US L48 Onshore conventional C plus C output. From Jan 2071 to Dec 2005 the average annual rate of decrease in output was 3.8%. This changed markedly from Jan 2006 to Dec 2019 where the average annual rate of decrease was only about 0.6% per year. If we include the pandemic downturn and rebound so far, so the period is Jan 2006 to Jan 2024 for US L48 onshore conventional C plus C, then the average annual rate of decrease is 1.5%. When US tight oil and US Gulf of Mexico production start to decrease after 2027, we may return to 3.8% annual decreases or perhaps much higher as my current tight oil model suggests about 6% annual decline in tight oil output from 2030 to 2040. This sounds a bit scary, but the linear rate of decrease is about 500 kb/d. Assuming World output at roughly 80 Mb/d in 2030 this would be about a 0.6% decrease in World output at 80 Mb/d and about a 1.2% decrease if World output were 40 Mb/d (note that it is highly unlikely World output would fall to 40 Mb/d by 2040). From 2045 to 2050 tight oil output decreases at a more moderate 200 kb/d, but the exponential annual rate of decrease is about 24%. By Dec 2050 in my scenario, tight oil output is negligible, roughly 300 kb/d.
Typo above, 2071 should be 1971, so US L48 conventional (excludes tight oil) onshore C plus C output declined at an annual rate of 3.8% from 1971 to 2005.
US tight oil model URR=78 Gb peak at 9000 kb/d in 2025, cumulative production to date is about 27 Gb and in the middle of 2027 the model has cumulative production at about 38 Gb. The model assumes oil prices remain under $90/bo for Brent crude in 2023$.
https://www.nytimes.com/2024/03/30/headway/is-guyanas-oil-a-blessing-or-a-curse.html
Is Guyana’s oil a blessing or a curse?
https://www.msn.com/en-us/money/markets/us-considers-allowing-limited-oil-business-to-continue-in-venezuela/ar-BB1kOeYT
USA to reduce sanctions on Venezeulan oil.
An updated post on US January Petroleum Production has been Posted.
https://peakoilbarrel.com/bad-weather-drops-us-january-oil-production/
A new Open Thread Non-Petroleum has been Posted.
https://peakoilbarrel.com/open-thread-non-petroleum-april-1-2024/