By Ovi
All of the Crude plus Condensate (C + C) production data for the US state charts comes from the EIAʼs Petroleum Supply monthly PSM which provides updated information up to June 2023.
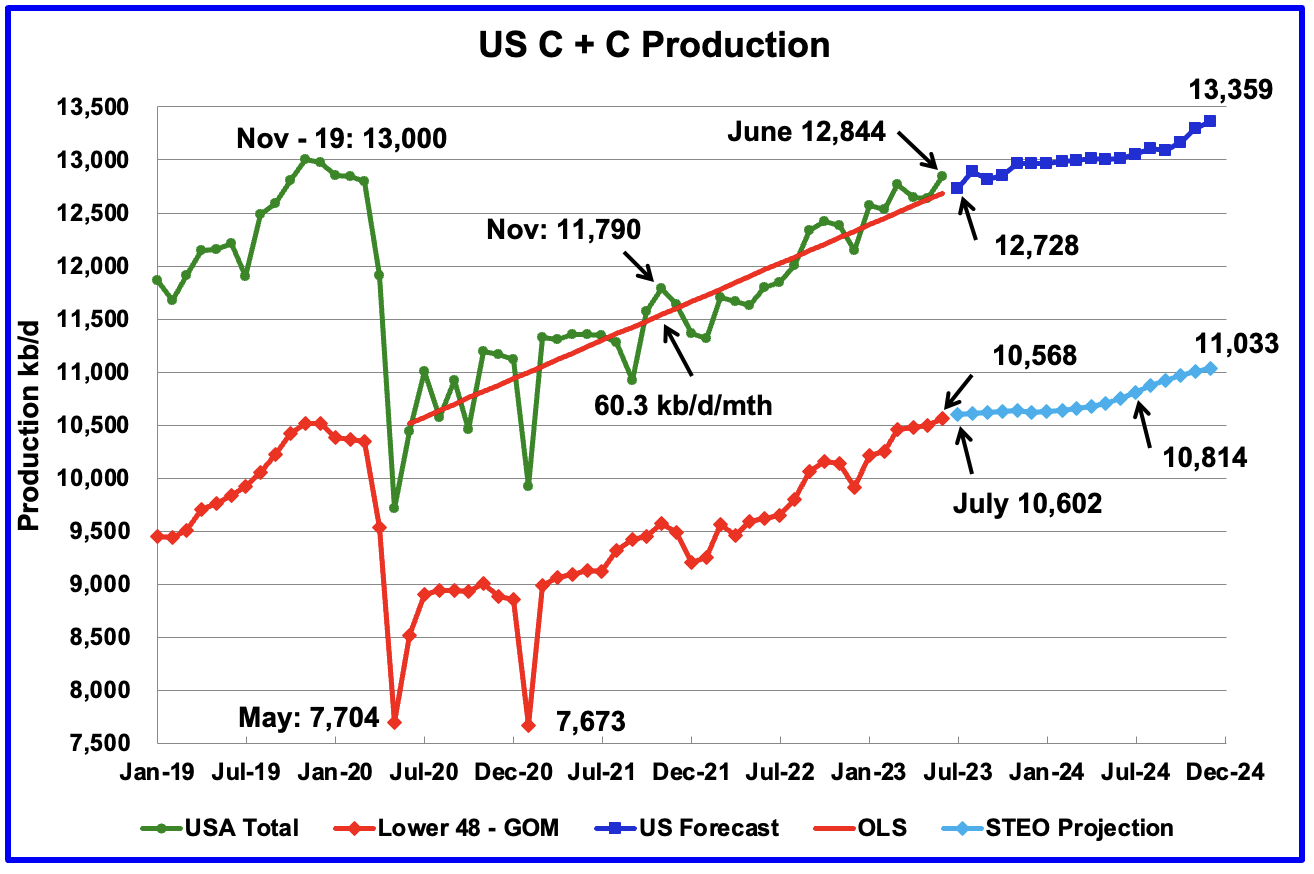
U.S. June oil production increased by 207 kb/d to 12,844 kb/d. The large increase is primarily due to a 147 kb/d increase in the GOM.
The dark blue graph, taken from the August 2023 STEO, is the forecast for U.S. oil production from July 2023 to December 2024. Output for December 2024 is expected to be 13,359 kb/d which is 359 kb/d higher than the November 2019 peak of 13,000 kb/d.
From July 2023 to December 2024, production is forecast to increase by 631 kb/d.
The August STEO forecast for June production was 12,676 kb/d, low by 168 kb/d.
The red OLS line from June 2020 to July 2023 indicates a monthly production growth rate of 60.3 kb/d/mth. Clearly the growth rate going forward into the rest of 2023 and 2024, shown in the dark blue graph, is projected to be lower than seen in the previous July 2020 to June 2023 period.
While overall US oil production increased by 207 kb/d, the Onshore L48 had a production increase of 67 kb/d to 10,568 kb/d in June.
The light blue graph is the STEO projection for output to December 2024 for the Onshore L48. From July 2023, to December 2024, production is expected to increase by 431 kb/d to 11,033 kb/d. However that increase appears to have two distinct periods, a low increase period and a high increase one.
From July 2023 to July 2024, production increases by 212 kb/d to 10,814 kb/d or at an average rate of 17.7 kb/d/mth. From July 2024 to December 2024, production increases by 219 kb/d or at an average rate of 43.8 kb/d/mth. It is not clear what causes the sudden increase in production rate starting in August 2024.
Oil Production Ranked by State
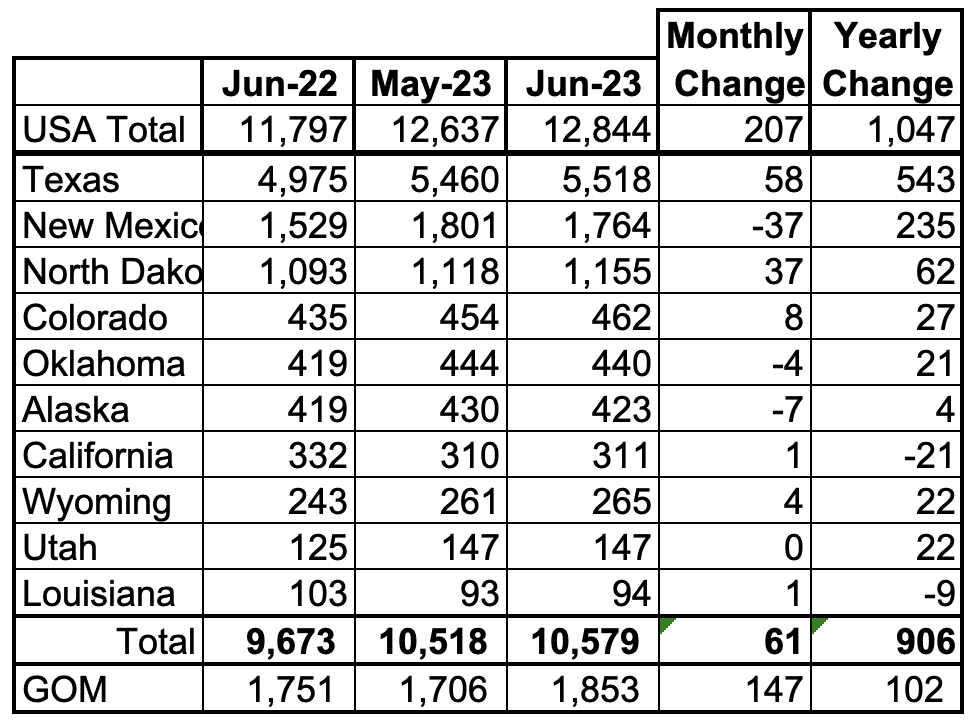
Listed above are the 10 states with the largest US oil production along with the Gulf of Mexico. These 10 states accounted for 82.4% of all U.S. oil production out of a total production of 12,844 kb/d in June 2023. Note that GOM MoM production is the main component of the June increase of 207 kb/d.
On a YoY basis, US production increased by 1,047 kb/d with the majority, 778 kb/d coming from Texas and New Mexico.
State Oil Production Charts
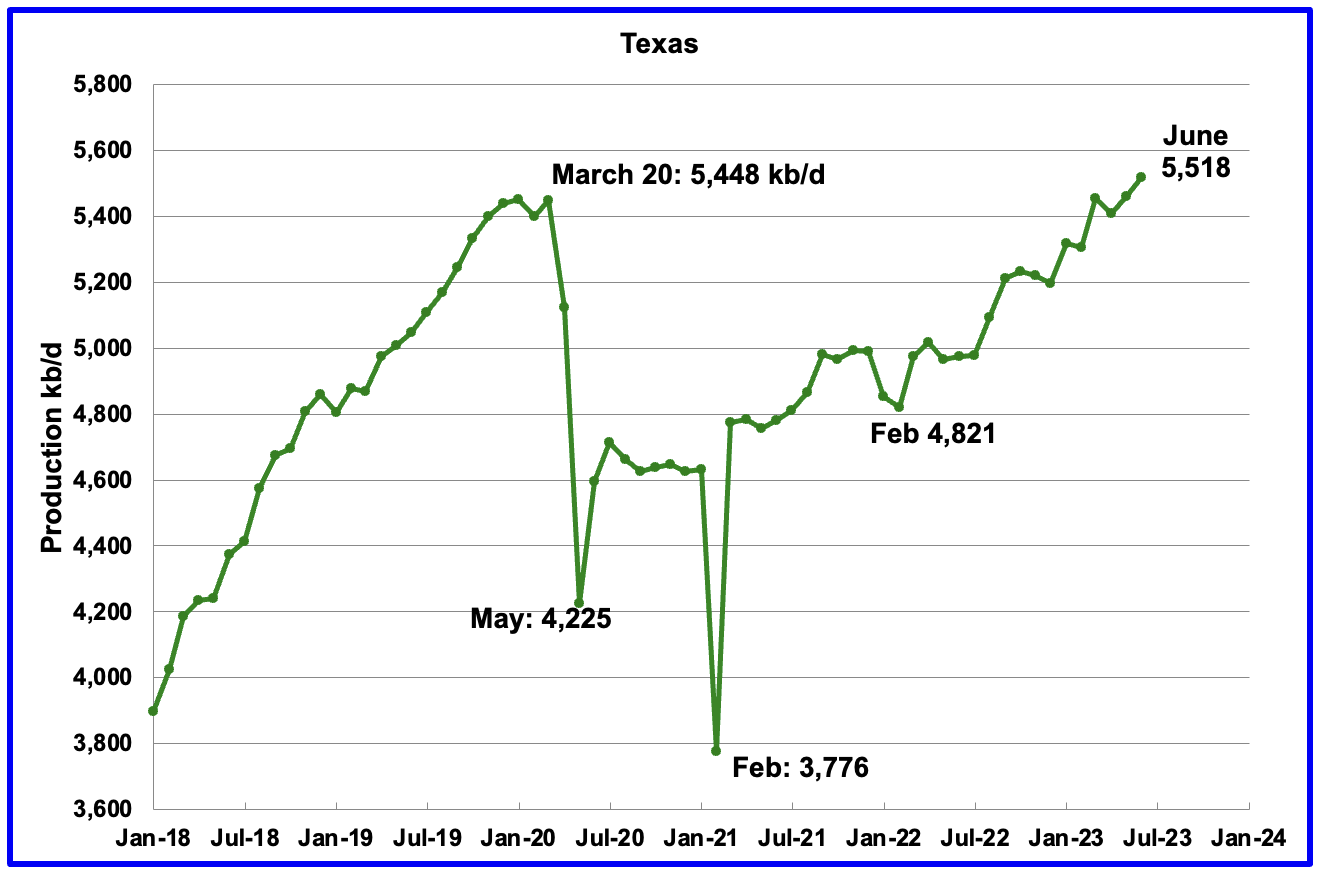
Texas production increased by 58 kb/d in June to 5,518 kb/d. June’s output is 70 kb/d higher than the March 2020 high of 5,448 kb/d. Part of June’s 58 kb/d increase is due to May being revised down by 34 kb/d. Relative to the original May post, June production is up by 24 kb/d.
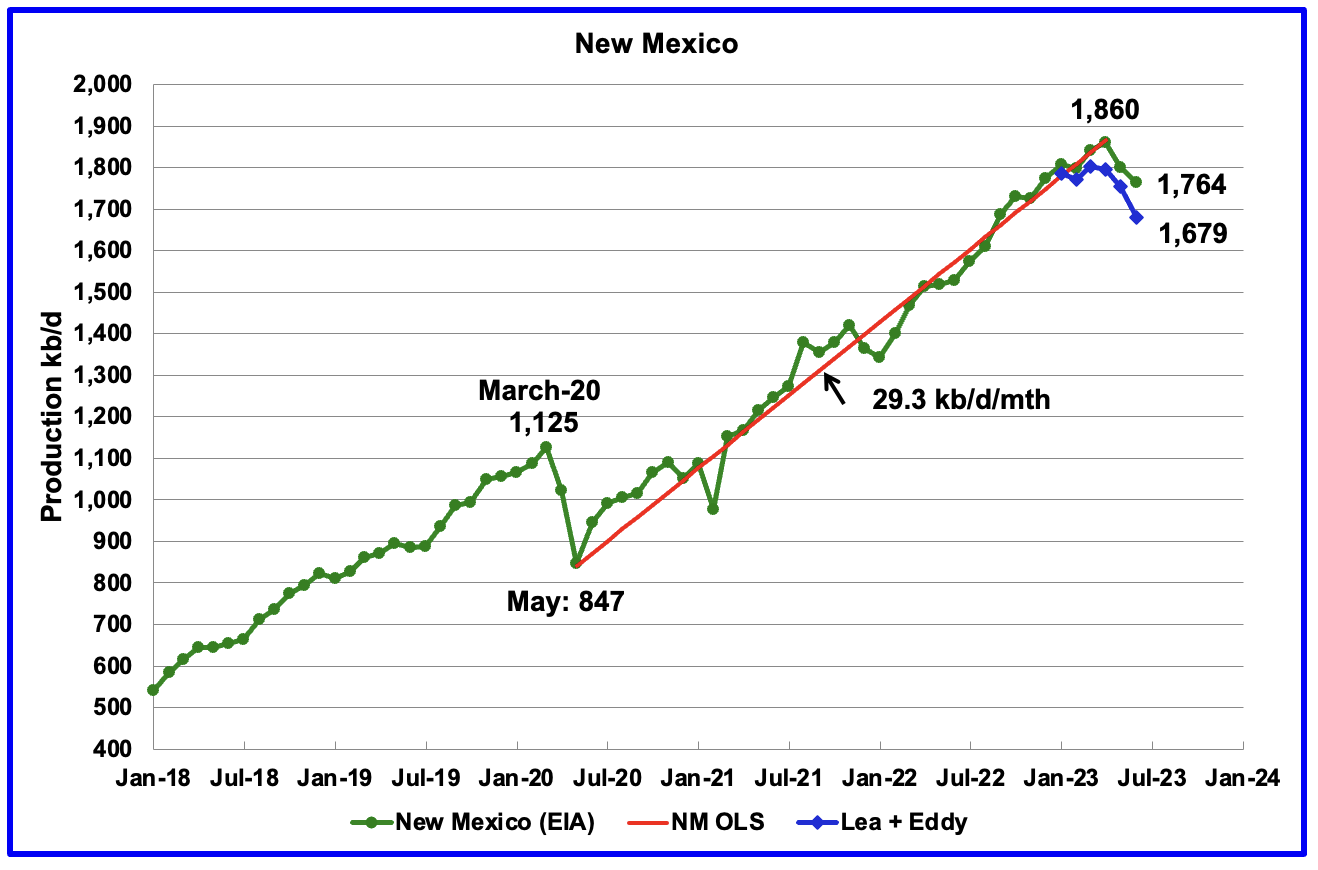
New Mexico’s June production decline is the second significant one since January 2022. June’s production decreased by 37 kb/d to 1,764kb/d.
Of the 1,764 kb/d, 1,679 kb/d came from the Lea and Eddy counties, 95%. The Lea and Eddy county production data for June is not complete and will be updated over the next three months. The first blue marker is January’s total production from NM’s Lea and Eddy counties. Their combined output was 1,785 kb/d compared with 1,808 kb/d for all of New Mexico, a difference 23 kb/d. For February, the comparable production numbers are 1,799 kb/d and 1,771 kb/d, a difference of 28 kb/d.
More production information from these two counties is reviewed in the special Permian section further down.
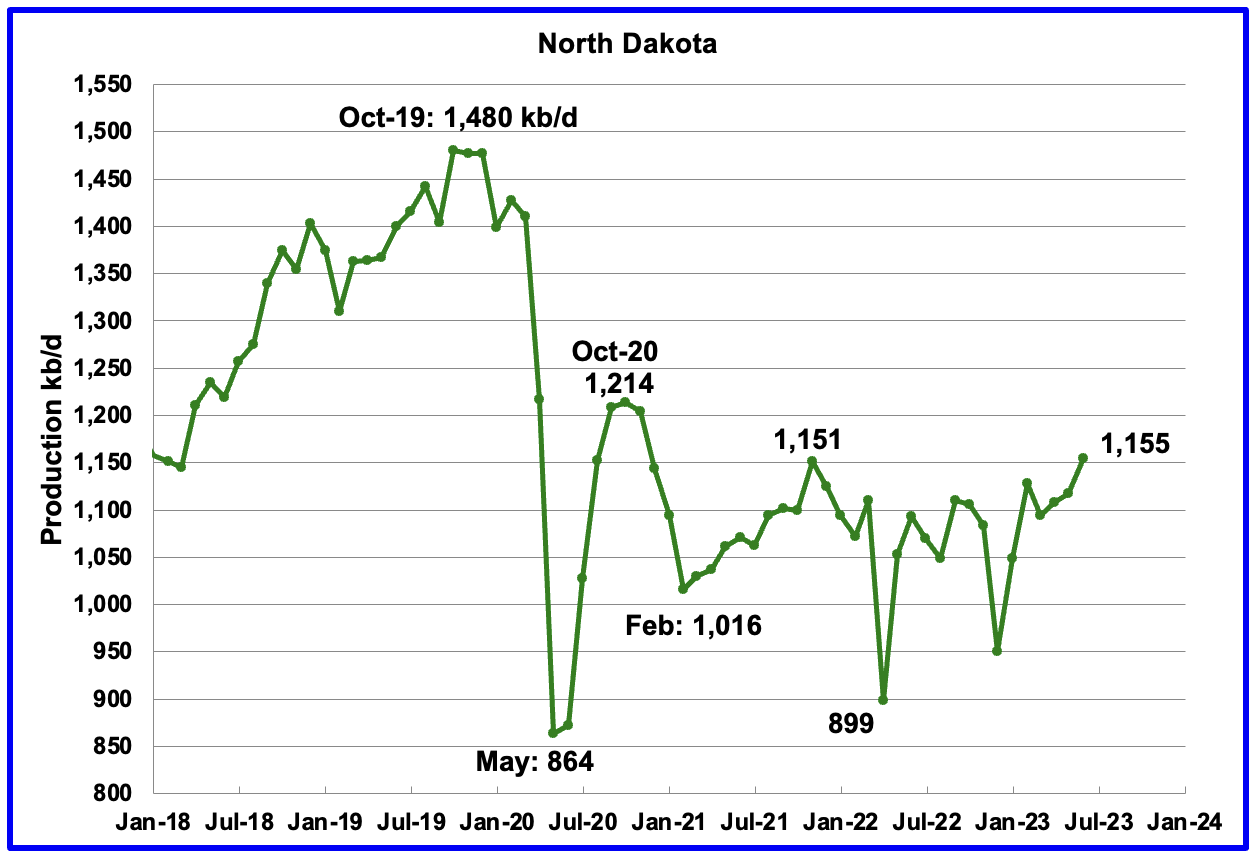
North Dakota’s oil production has begun to increase after being impacted by extreme cold weather in December. June’s output increased by 37 kb/d to 1,156 kb/d. Current production is 59 kb/d lower than October’s 2020 production of 1,214 kb/d. Production over the past two years has been on a plateau but according to this Source production will be up for the next two months because:
“Well completion, which is the process needed to prepare a well for production, was at 85 in June and 83 in July, above the level needed to keep production stable.
“Next month we ought to be reporting another production increase,” Helms said.
Seventy wells were permitted in July. The state is now at above 18,000 active wells, an all-time high.”
Another Source stated:
Helms said oil prices remain above $80 per barrel, with demand for oil exceeding supply. He called that a “sweet spot” for oil production.
“Oil and gas operators said if oil was to drop below $63 a barrel, they would reduce drilling and completions,” Helms said. “If it went over $86, they would significantly increase. We’re in the $80s, which means slow growth.”
Helms said that’s been the story in North Dakota for some time.
“Now you’re seeing it in all the basins,” Helms said.
Helms said New Mexico saw its oil and gas production drop by about three percent in June.
In 2019, ND was averaging 93 b/d from each well. For June 2023, well production has fallen to a low of 66 b/d/well.
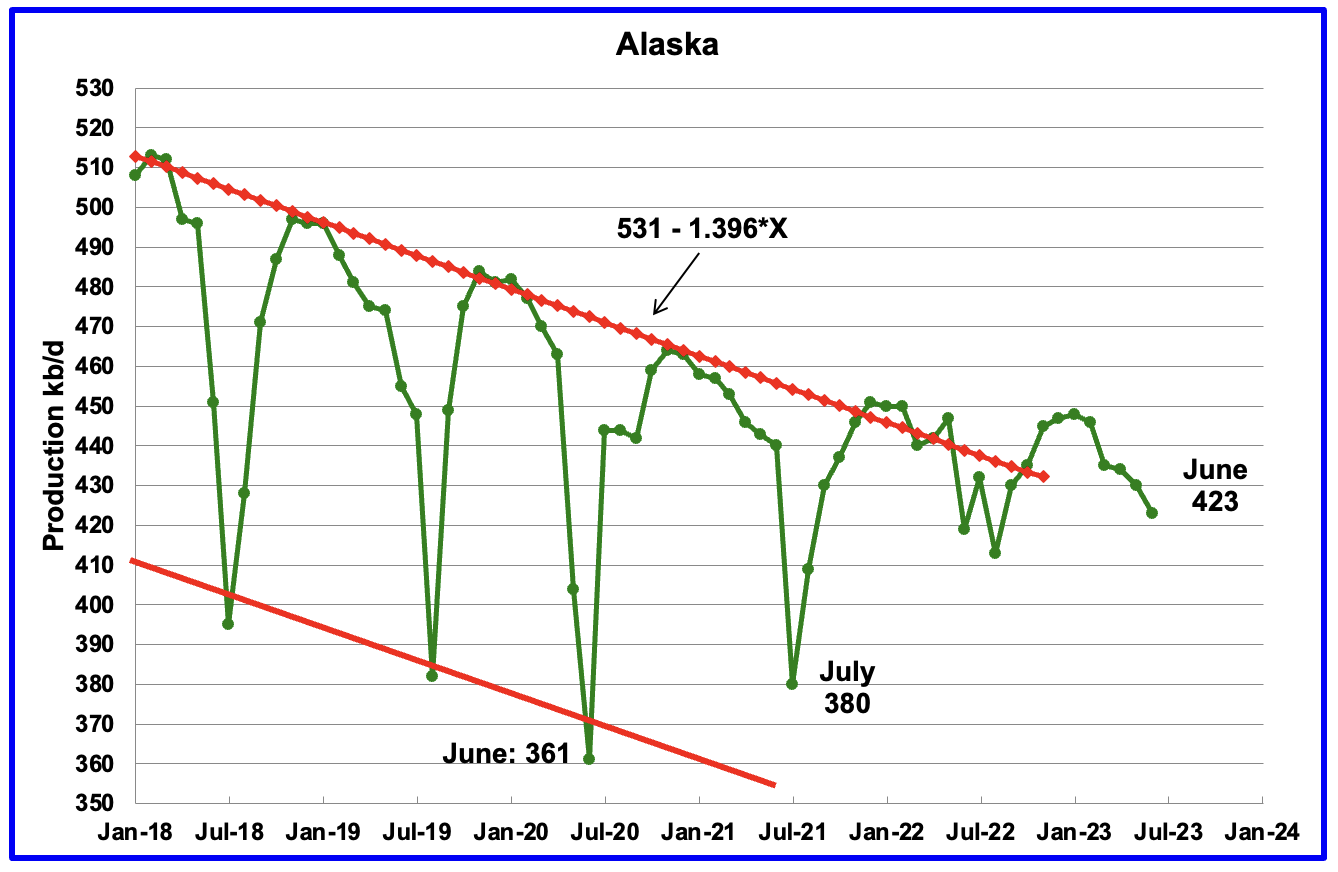
Alaskaʼs June output decreased by 7 kb/d to 423 kb/d. Production in 2023 is deviating from the down trend line of previous years due to the addition of a new oil field. Production YoY is up by 4 kb/d.
Two new projects which were scheduled for 2020 and 2021 which would add 20 kb/d and 40 kb/d respectively may be coming online after being delayed due to Covid.
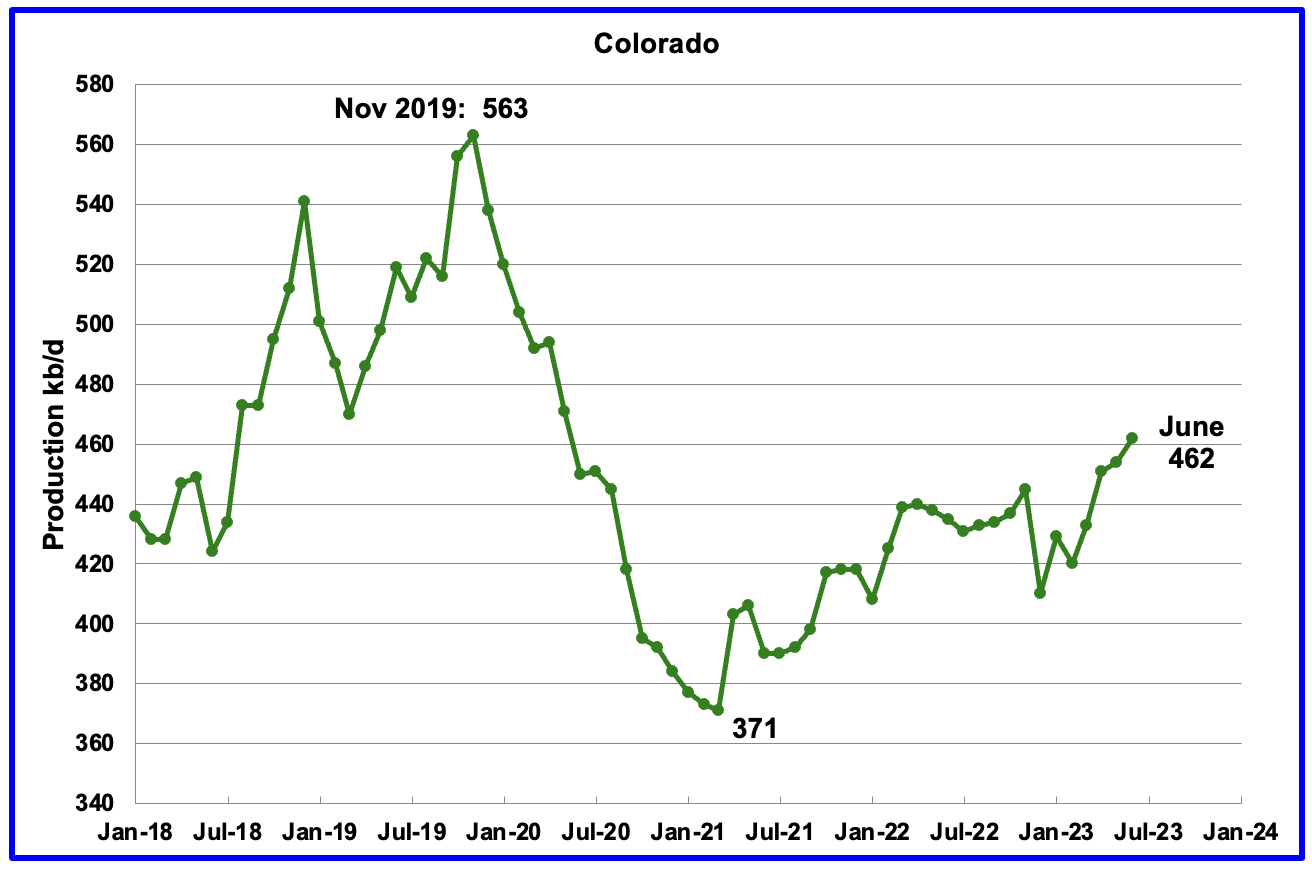
Coloradoʼs June production increased by 8 kb/d to 462 kb/d, a new post pandemic high.
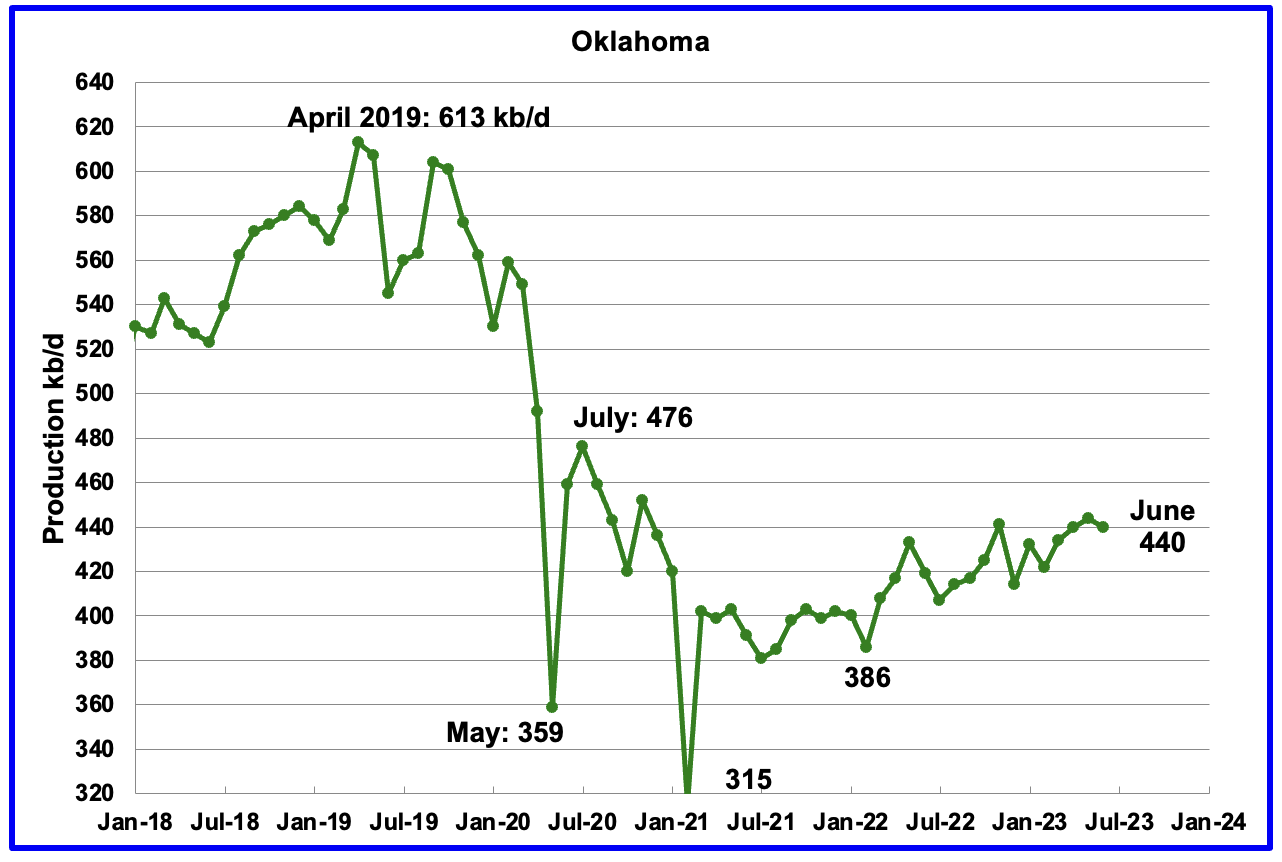
Oklahoma’s output in June decreased by 4 kb/d to 440 kb/d. Production remains 36 kb/d below the post pandemic July 2020 high of 476 kb/d.
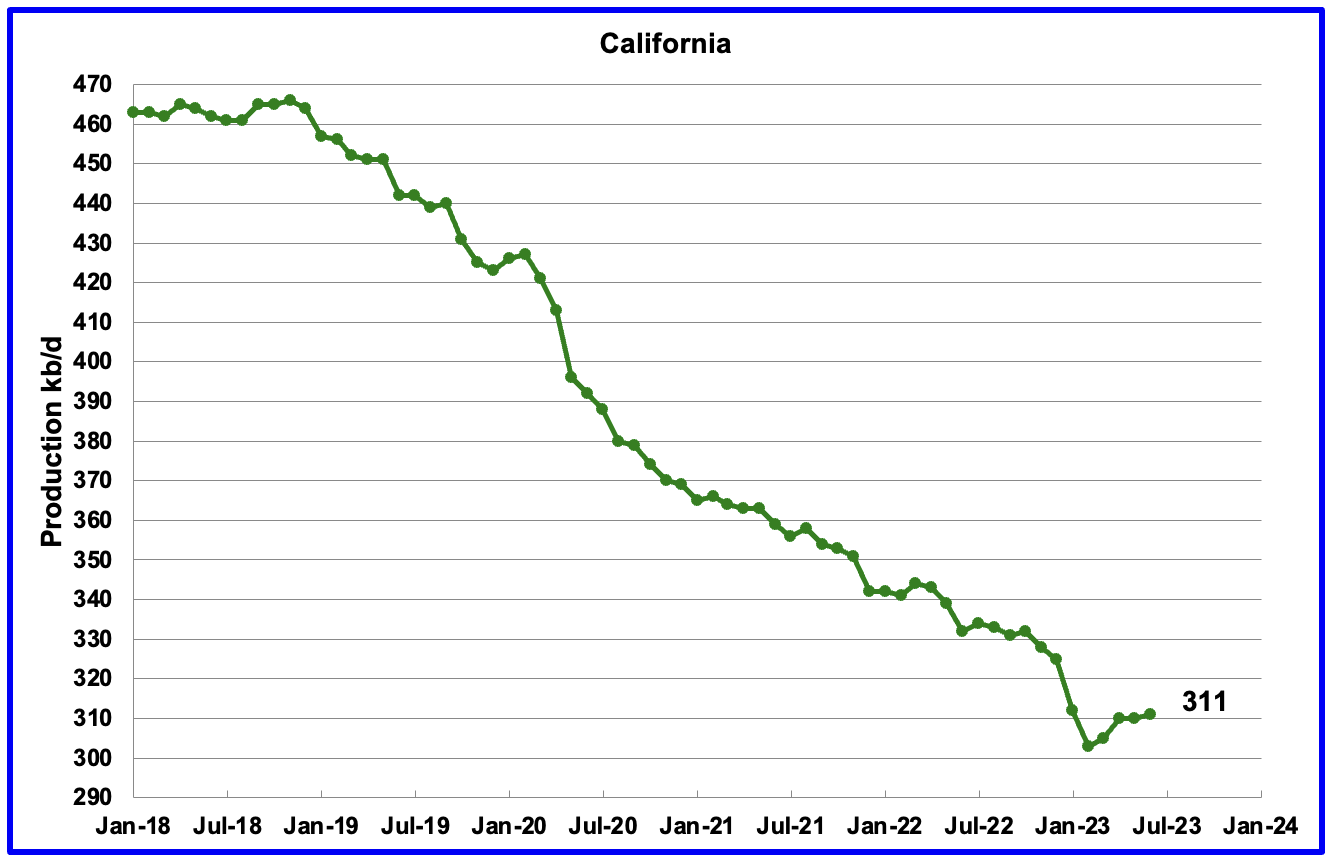
Californiaʼs overall slow output decline trend accelerated in January and February. However from March, through June production has risen. June output increased by 1 kb/d to 311 kb/d.
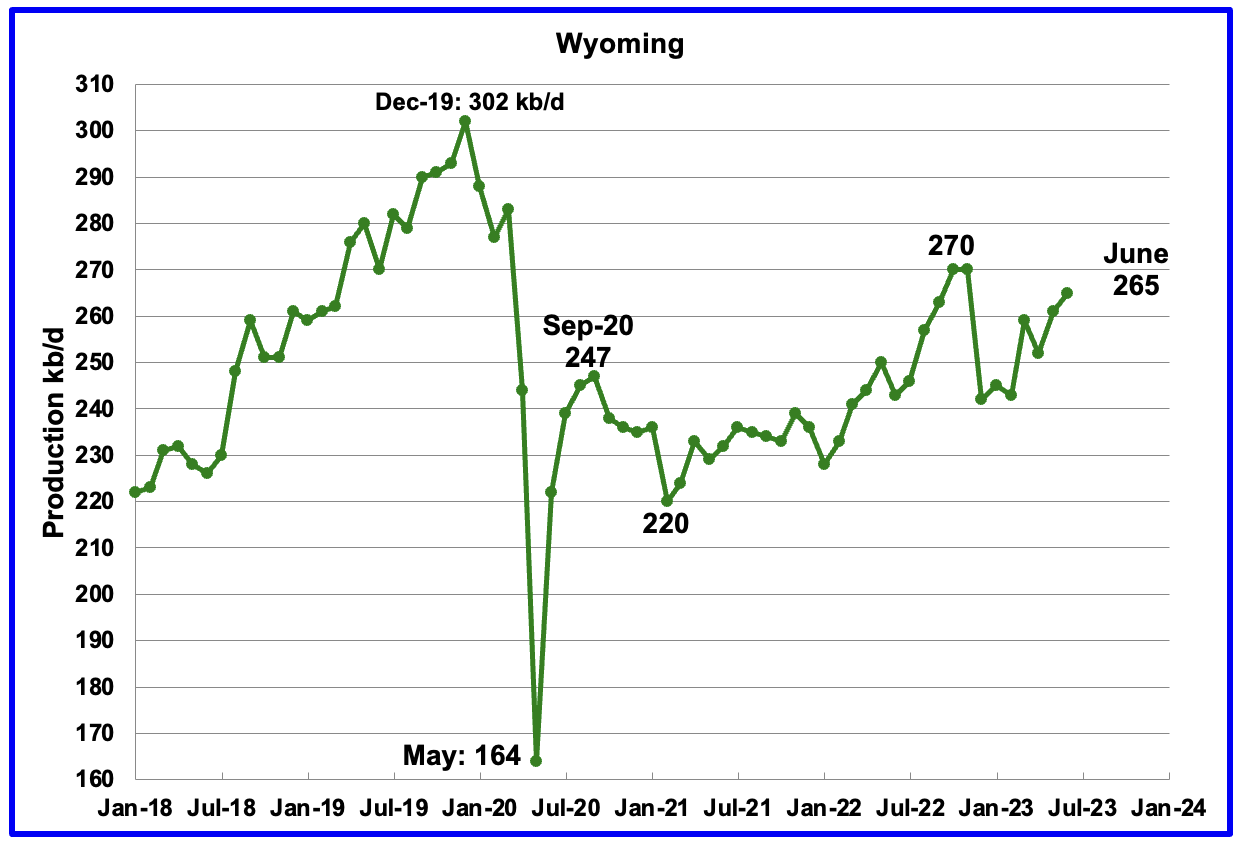
Wyoming’s oil production in October and November 2022 reached a post pandemic high of 270 kb/d. June’s oil production increased by 4 kb/d to 265 kb/d, 5 kb/d lower than November 2022. Production has been rebounding since February.
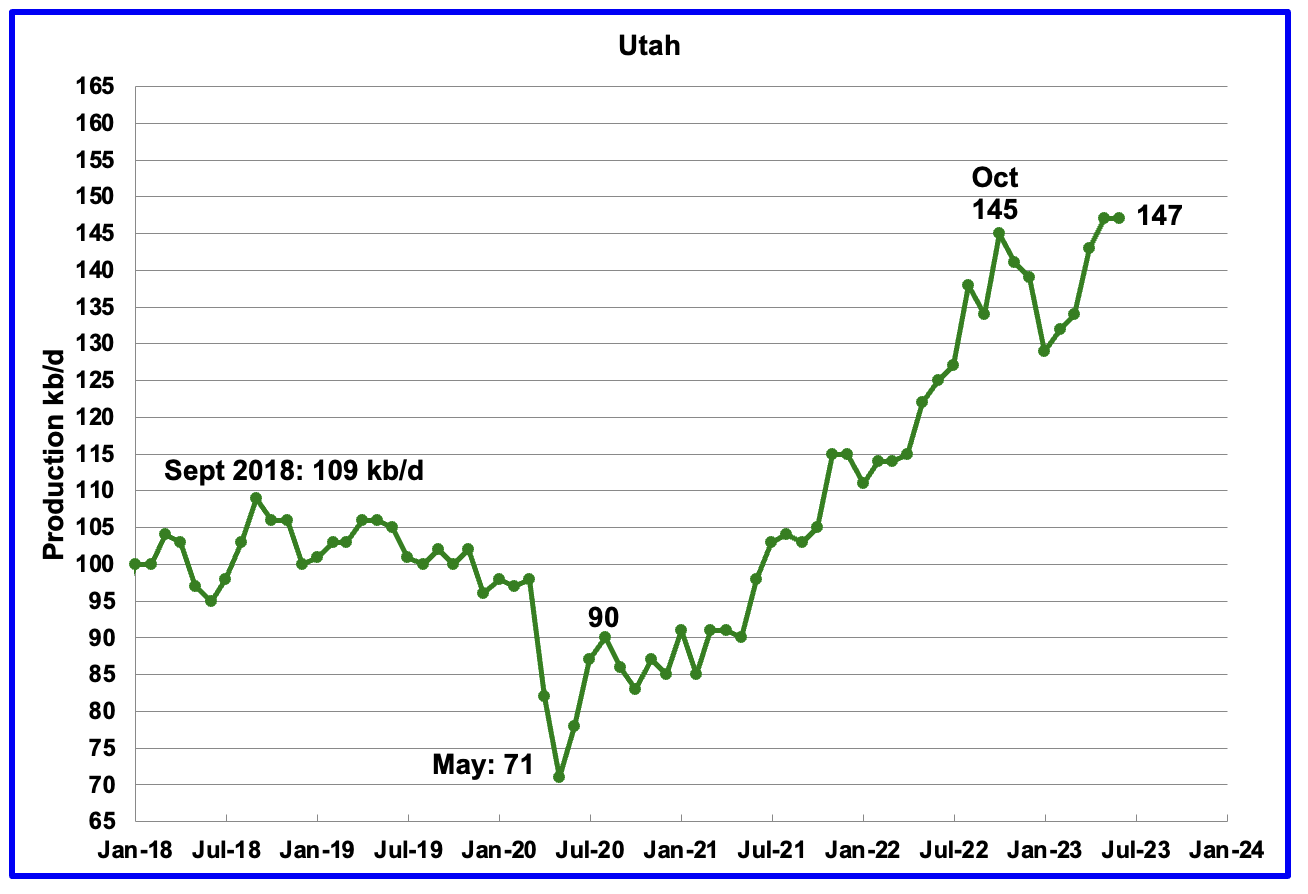
Utah’s oil production reversed its declining trend in February 2023. June’s production was unchanged at a high of 147 kb/d. For the first 4 months of 2023, Utah had 7 rigs operating. Since May the number of operational rigs has bounced between 8 and 9, which may account for the increased production.
The increased production is coming from the Uinta basin.
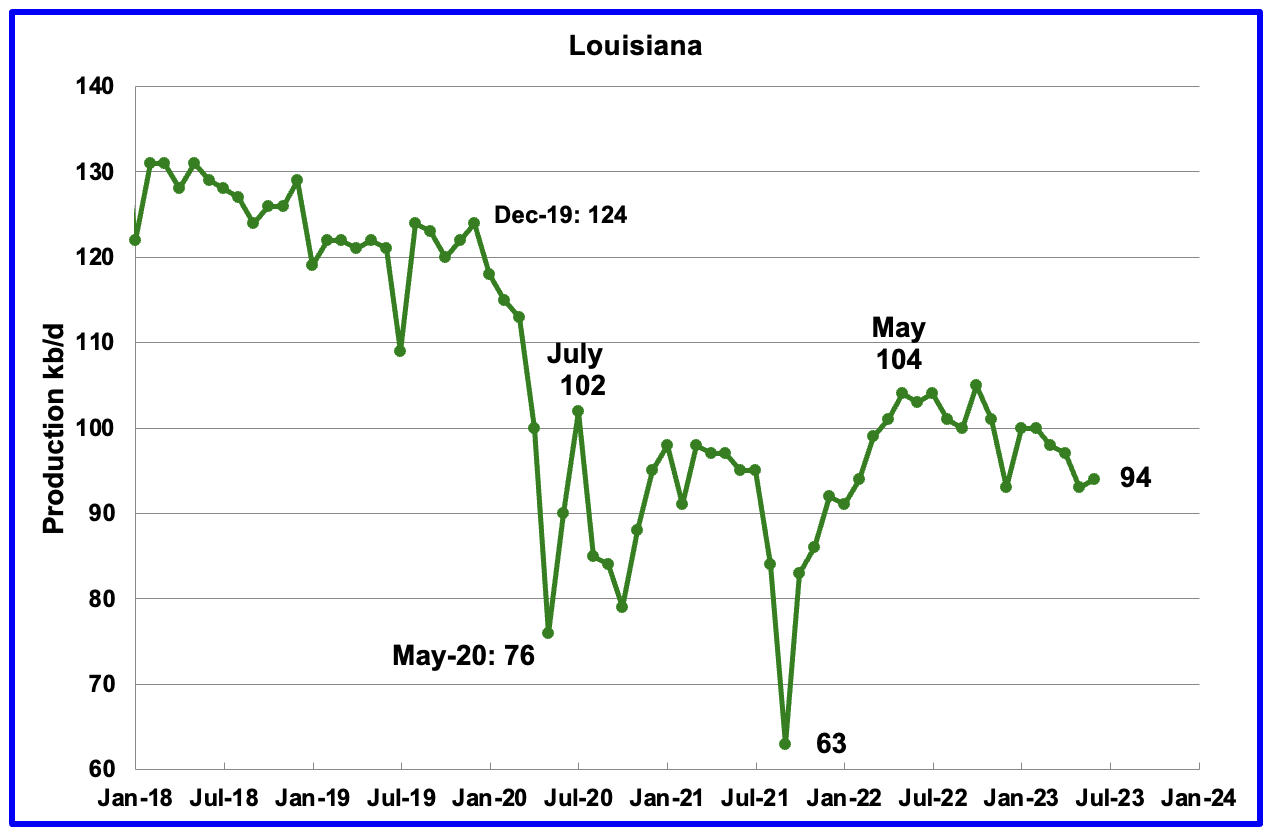
Louisiana’s output rose from the low of 63 kb/d in September 2021 to 104 kb/d in May 2022. Since then output has entered a slow declining phase. June’s production rose by 1 kb/d to 94 kb/d and is 10 kb/d lower than May 2022.
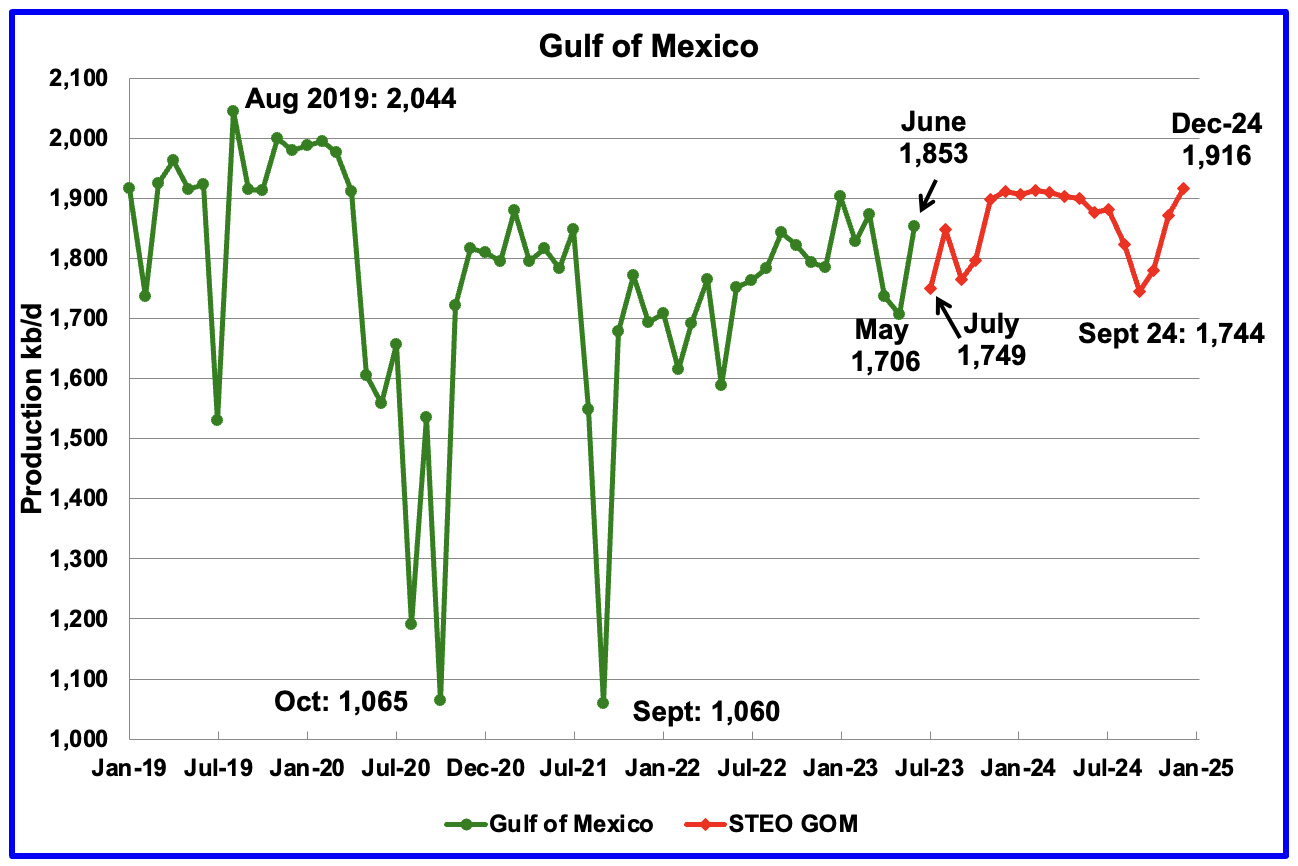
GOM production rose by 147 kb/d in June to 1,853 kb/d.
The August 2023 STEO projection for the GOM output has been added to this chart and it projects that output in July 2023 will drop by 104 kb/d to 1,749 kb/d.
The June spike to 1,853 kb/d could be a reasonable estimate since Shell announced that the Vito platform had begun production on February 15, 2023. Also according to this source Mad Dog 2 began production in April 2023.
It is not known if the GOM decline shown for August 2023 is related to extensive maintenance or potential hurricane activity.
A Different Perspective on US Oil Production
In this section US production is broken down into two parts, the Big Two, Texas and New Mexico, and the remaining states, The Rest.
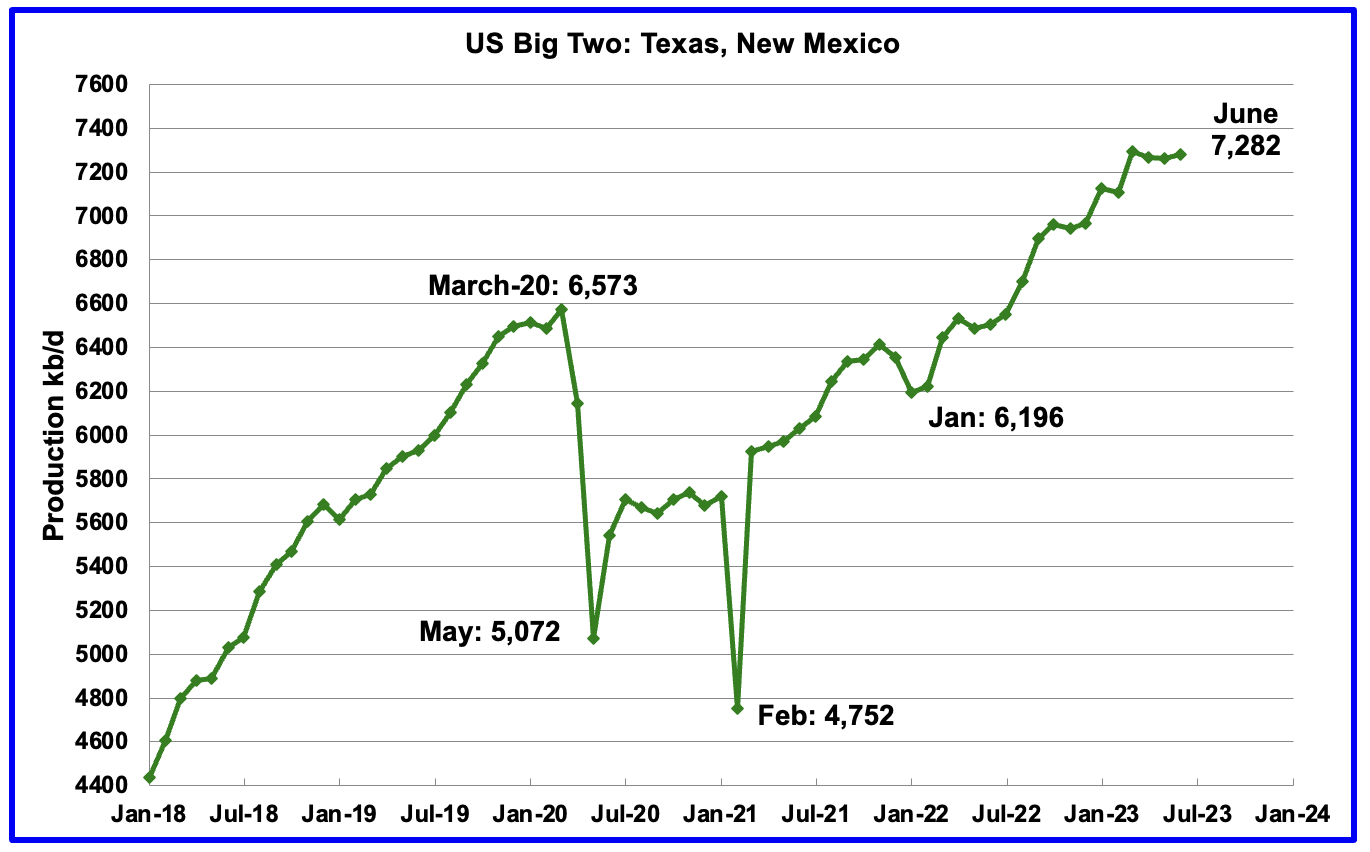
The Big Two states’ combined oil output for Texas and New Mexico.
June’s production in the Big Two states increased by a combined 21 kb/d to 7,282 kb/d with Texas adding 58 kb/d while New Mexico dropped by 37 kb/d.
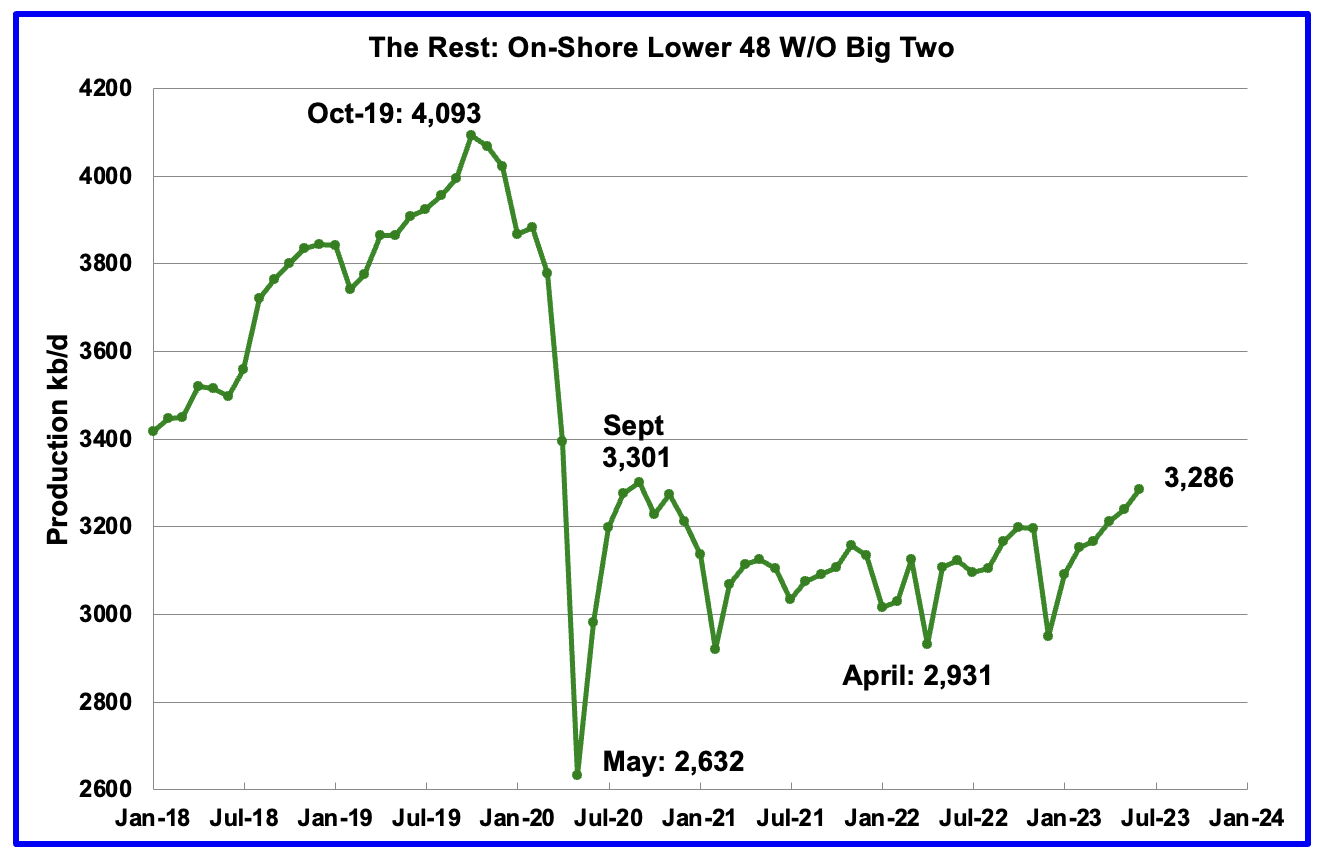
Oil production by The Rest
June’s production in The Rest rose by 46 kb/d to 3,286 kb/d. From May 2021 to April 2023, oil production in The Rest has been range bound between 3,000 kb/d and 3,200 kb/d. However May and June are the first months in which output broke above 3,200 kb/d primarily due to small YoY increases in Utah, Colorado, Oklahoma and North Dakota. Of the 46 kb/d increase in June, 37 kb/d came from North Dakota.
The main takeaway from The Rest chart is that current production is 807 kb/d below the high of October 2019 and this appears to be a permanent loss that will never be recovered.
To put June’s production increase in perspective, here are the three biggest components
- GOM 147 kb/d. Note that GOM production is expected to drop over the next few months.
- North Dakota 37 kb/d
- Big Two 21 kb/d.
- Total 205 out of 207.
WTI
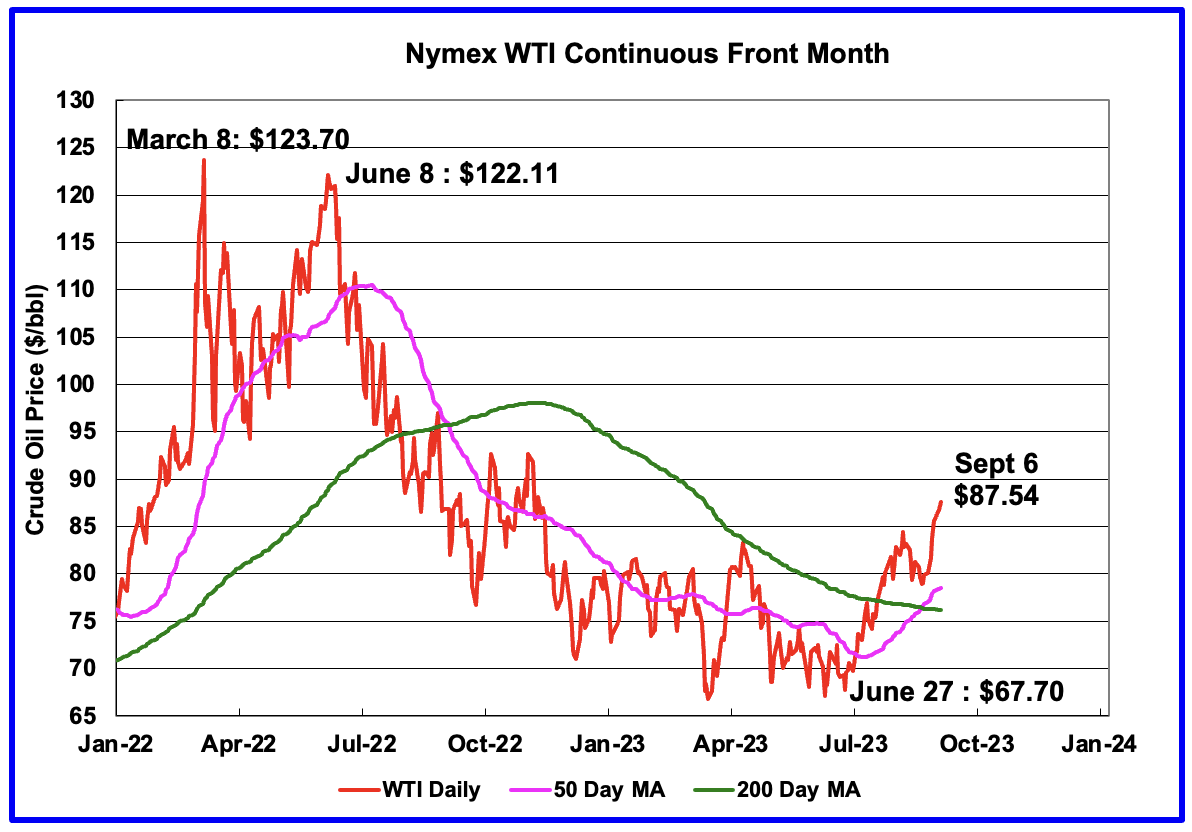
WTI has been on fire since Saudi Arabia implemented its lollipop cut of 1 Mb/d on July 1. A golden cross pattern occurred in late August which added more fuel to the fire.
Weekly Rig and Frac Spread Count
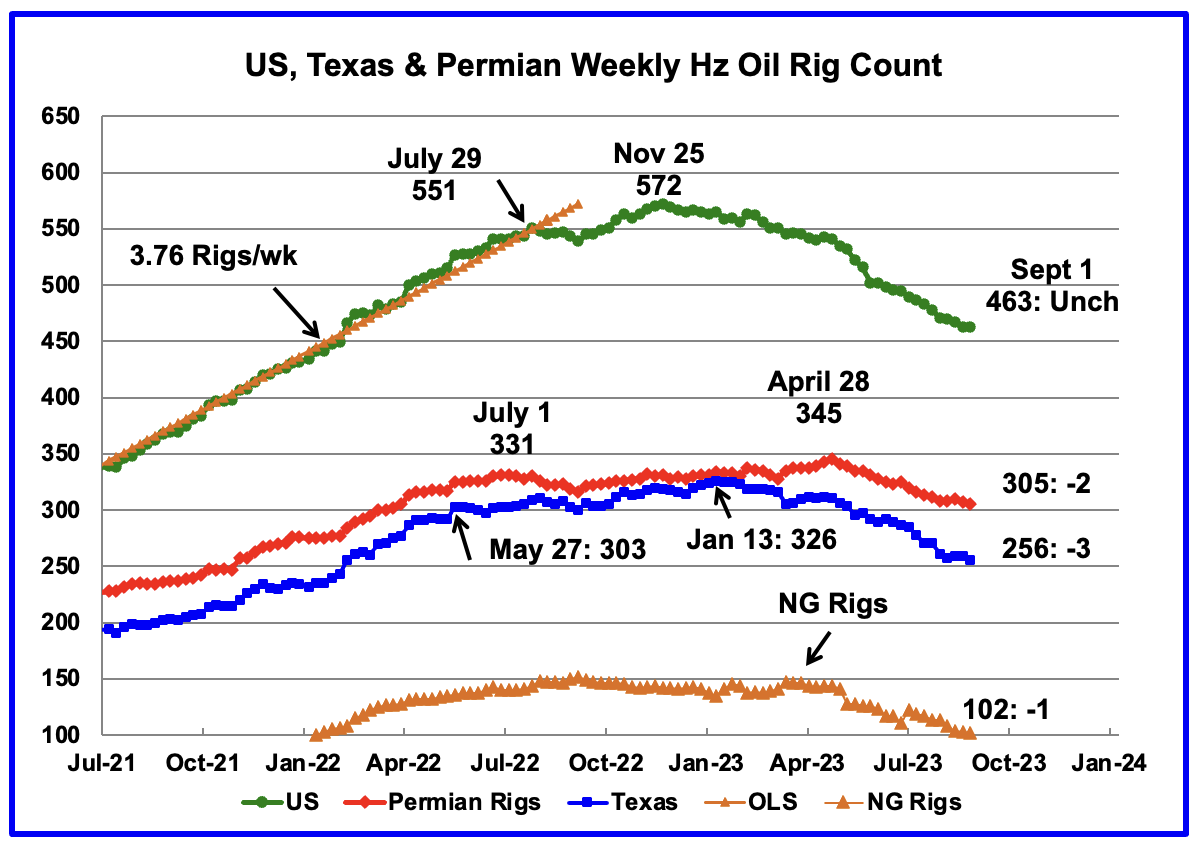
A high of 572 Hz oil rigs was reached in the week ending November 25, 2022. In the week ending Sept 1, 2023 the number of rigs was unchanged at 463 and is down 109 from the November high of 572.
In the week ending September 1, Permian rigs decreased by 2 to 305 and Texas rigs were down 3 to 256. Specifically for the Permian, Texas was down 2 while New Mexico was flat at 101. Note that the general trend for rigs in the Permian is a slow decrease since the April high and is currently 40 fewer than the 345 rigs operating on April 28, 2023.
In April 2023, WTI was over $80/b. Now that WTI is back over $80/b, will the decreasing rig count trend reverse?
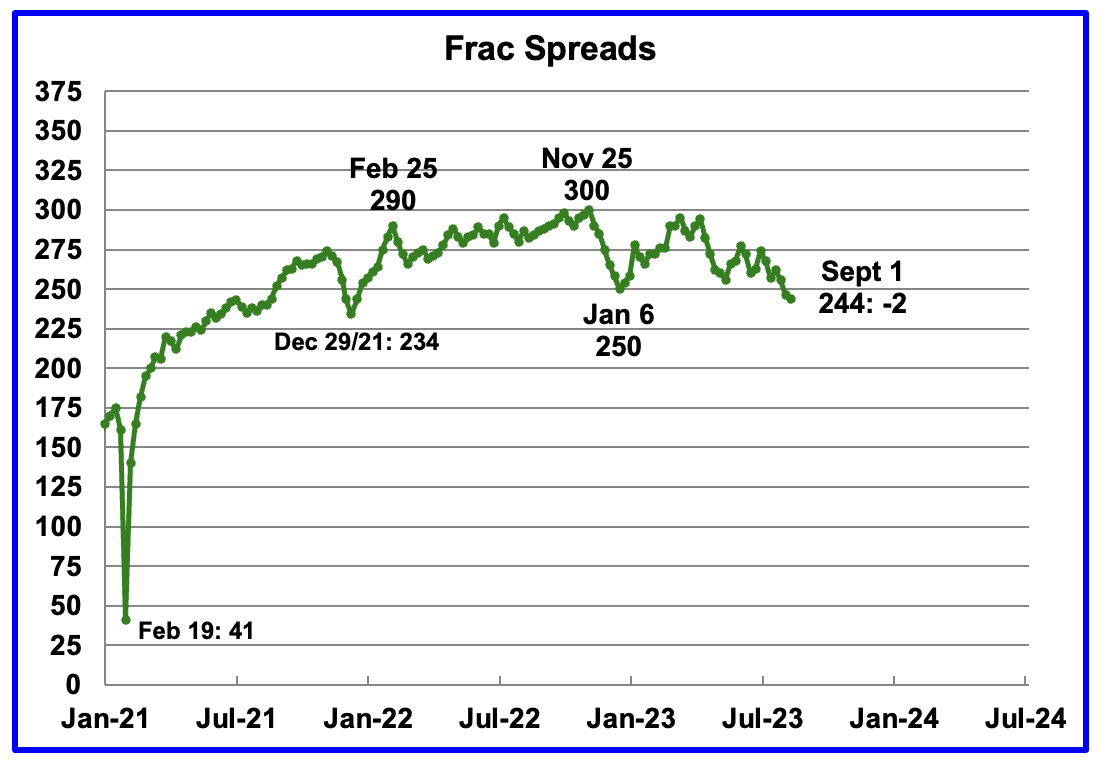
Since January 2022, the frac spread count has wandered between 250 and 300 fracs per week. For all of 2022 the average weekly frac count was 280. However in the last week of August and early September, the frac count dropped below 250.
For the week ending September 1, the frac count dropped by 2 to 244 and is down 56 from the high of 300 in November 2022. The current count is significantly lower than the 2022 average of 280 frac spreads per week.
Note that these 244 frac spreads include both gas and oil spreads.
Frac Spreads by County
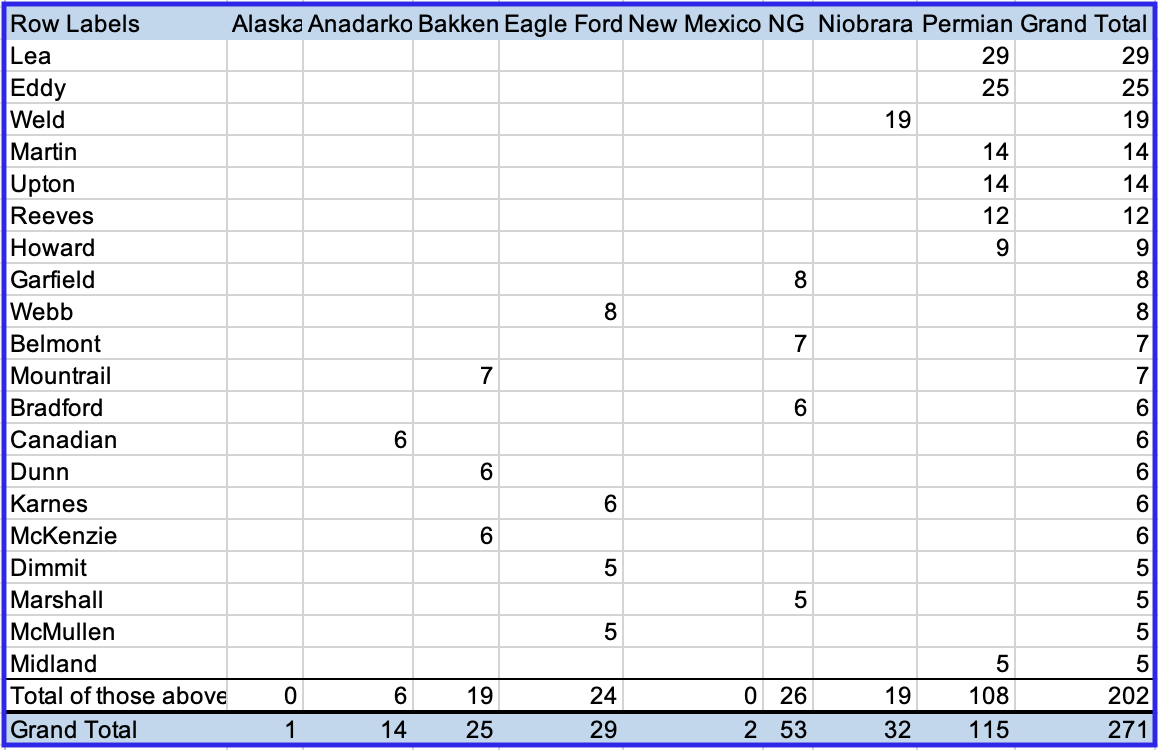
Above is the Frac Spread count by Basin and County for the week July 22 to July 28. Only those counties with 5 or more frac spreads are shown.
I have been working with the frac spread data published by this Site. The CSV data they publish appears to be about 5 to 6 weeks delayed. While data for later weeks is there, it appears to be incomplete. For the week July 22 to July 28, the official frac count reported for that week was 268. This analysis is showing 271. This leads me to think that the analysis is reasonably correct.
A few weeks back I was concerned that Midland frac data was not appearing in the database. For this week, data for Midland county has reappeared.
The largest number of frac spreads continue to operate in New Mexico’s Lea and Eddy counties. However, under New Mexico, a new county showed up, Sandoval, which is in the NW of New Mexico and not in the Permian. It is producing close to 5 kb/d and am wondering if this is a new drilling/oil area.
One thing to note in this chart is that the NG frac spreads only account for 20% of all spreads. Earlier comments from other sources were indicating that NG spreads represented 50% of all spreads. Could this lower percentage be associated with the lower price for NG today vs one year ago?
Permian Basin County Charts
This monthly Permian section is being added to the US report because of a range of views on whether Permian production will continue to grow or will peak in the next year or two. The issue was brought into focus recently by the Report by Goehring and Rozencwajg which indicated that a few of the biggest Permian oil producing counties were close to peaking or past peak.
This section will focus on the four largest oil producing counties in the Permian, Lea, Eddy, Midland and Martin. It will track the oil and natural gas production and the associated Gas Oil Ratio (GOR) on a monthly basis. The data is taken from the state’s government agencies for Texas and New Mexico. Typically the data for the latest two months is not complete and is revised upward as companies submit their updated information.
Of particular interest will be the charts which plot oil production vs GOR for a county to see if a particular characteristic develops that indicates the field is close to entering the bubble point. While the GOR metric is best suited for characterizing individual wells, counties with closely spaced horizontal wells may display a behaviour similar to individual wells. For further information on the bubble point and GOR, there are a few good thoughts on the intricacies of the GOR in an earlier POB comment.
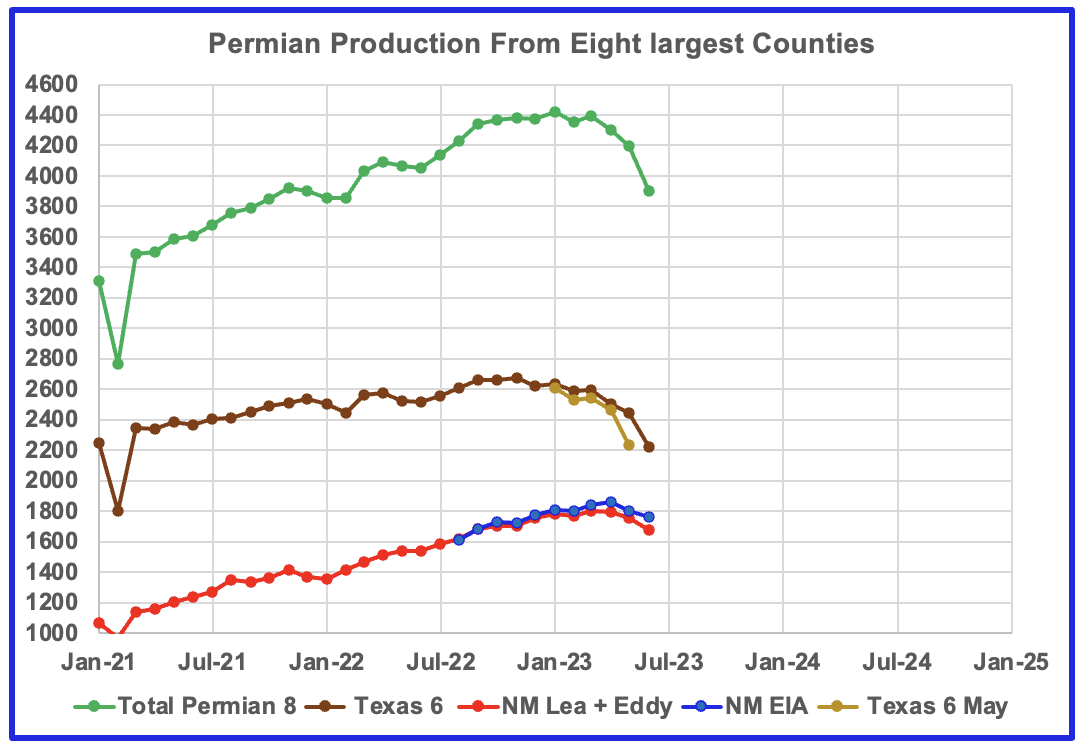
This chart shows oil production from the eight largest counties in the Permian. In the New Mexico Permian, there are two counties Lea and Eddy. The remaining six are in Texas; Midland, Martin, Reeves, Loving, Howard and Upton. The graphs are updated to June.
The red markers show production from the two NM counties while the blue markers show total production for NM from the EIA monthly production report. The EIA must have some correction factors to increase NM’s output from NM’s official site. The brown markers show output from the six biggest Permian counties in Texas.
In the August update for the Texas 6, the previous June production data was updated by 1% for January and 2% for February, March and April.
New Mexico Permian
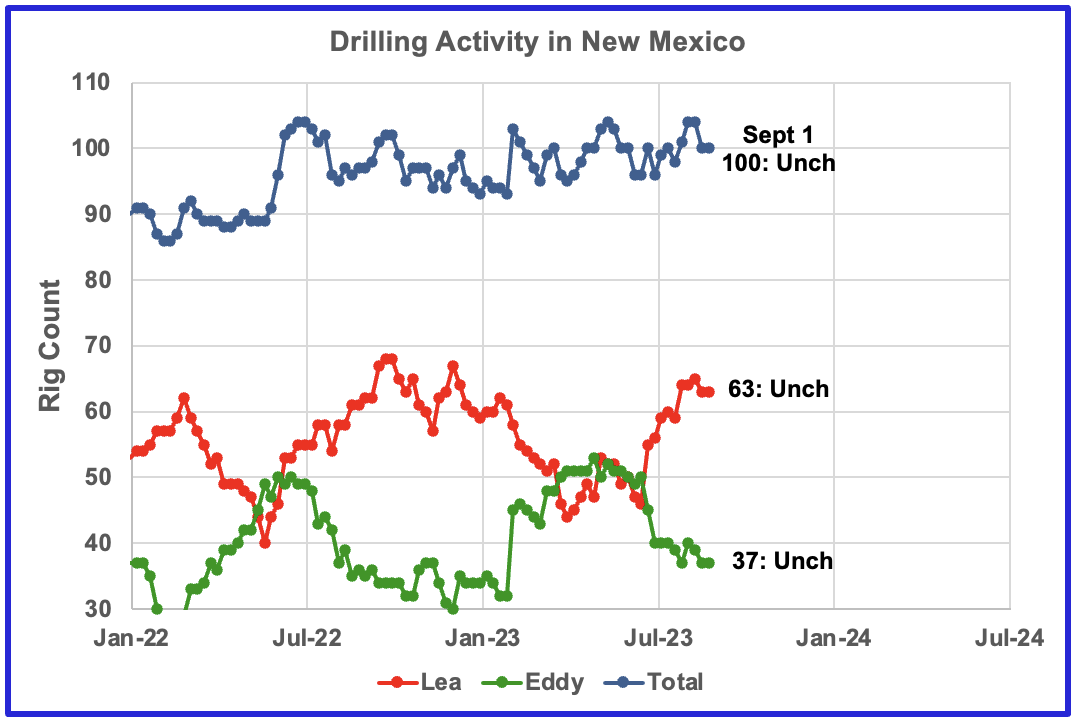
Rigs are moving from Eddy county to Lea county. Over the last 10 weeks drilling activity has increased in Lea county and dropped in Eddy.
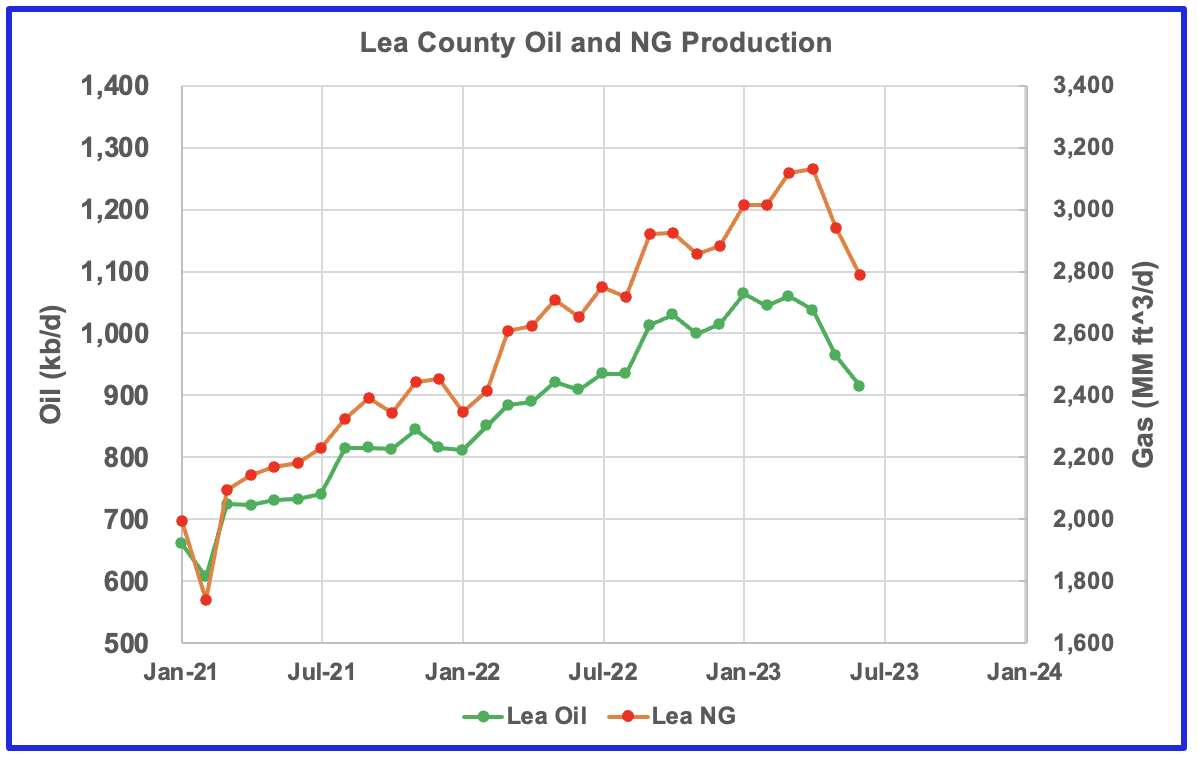
Over the last three months, oil production is falling faster than NG production in Lea county.
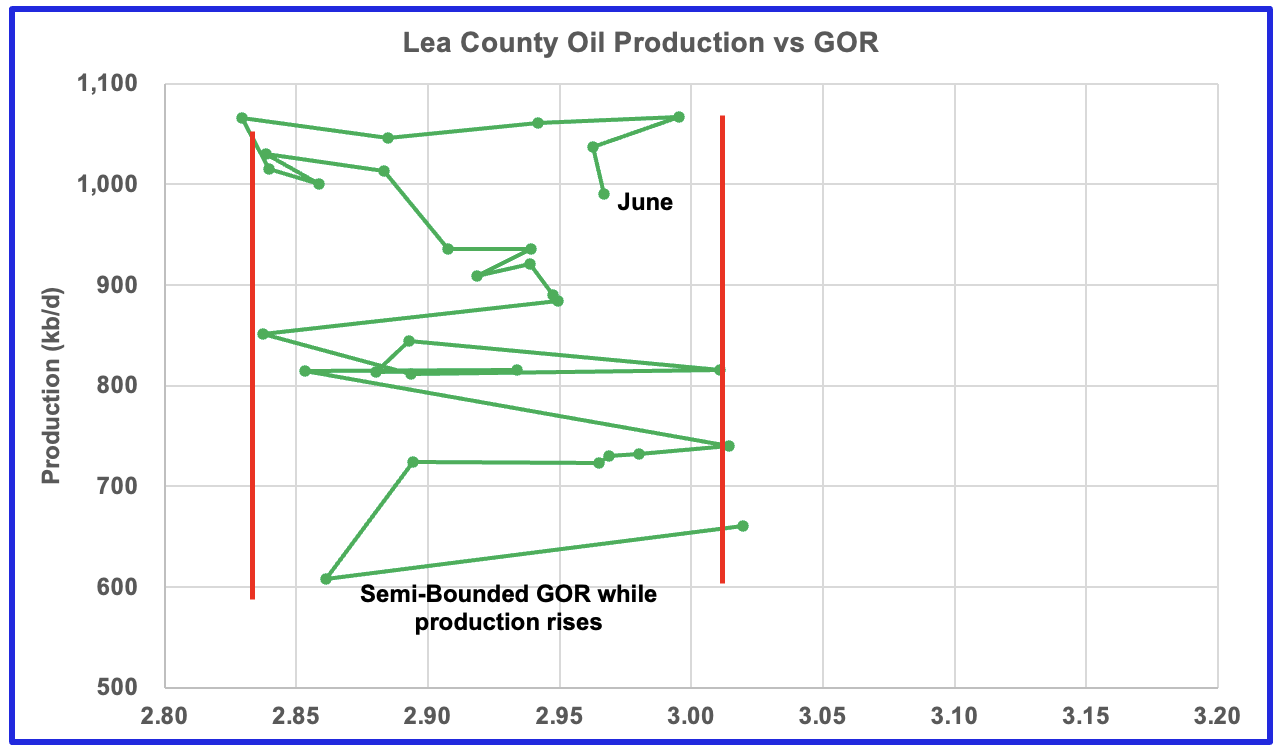
After much zig zagging, production stabilized above 1,000 kb/d and the GOR hints at an increasing trend while production stabilizes over 1,000 kb/d. The data for the last two data points, May and June, is incomplete.
This pattern of a zig zagging GOR within a semi-bounded GOR while oil production increases to some stable level and then moving out to a higher GOR to the right has shown up in a number of counties. See three cases below.
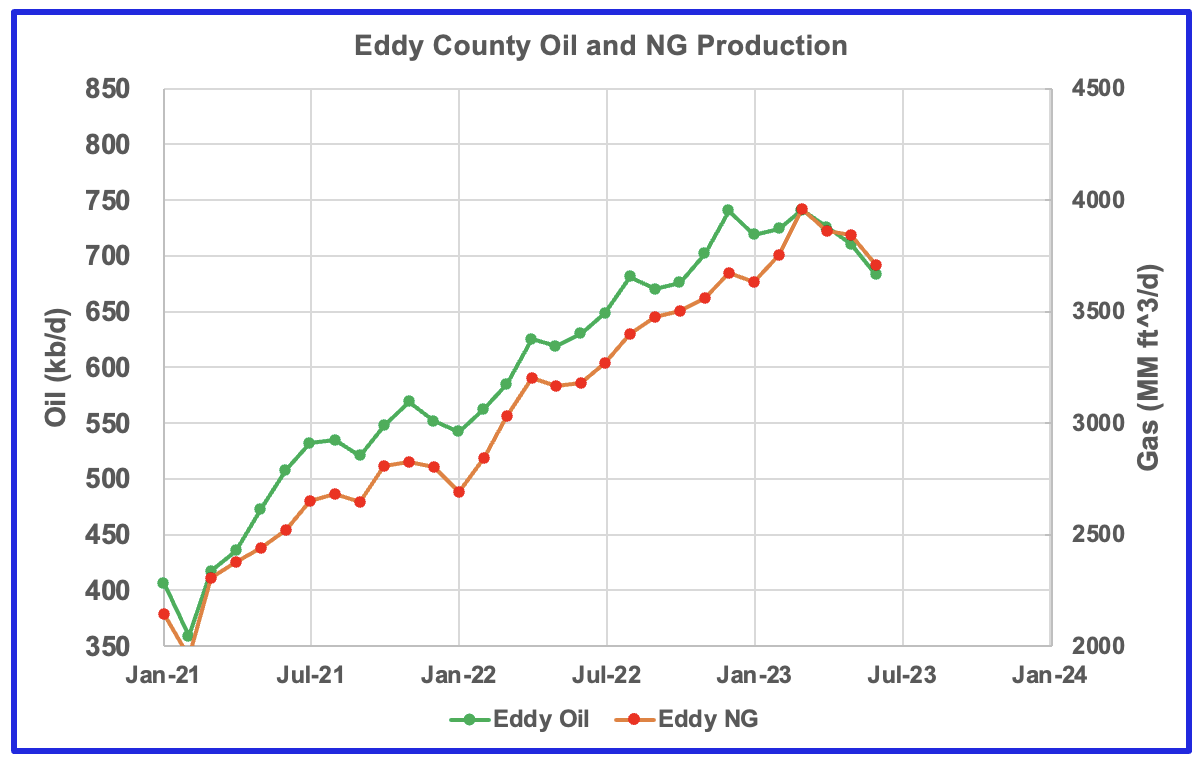
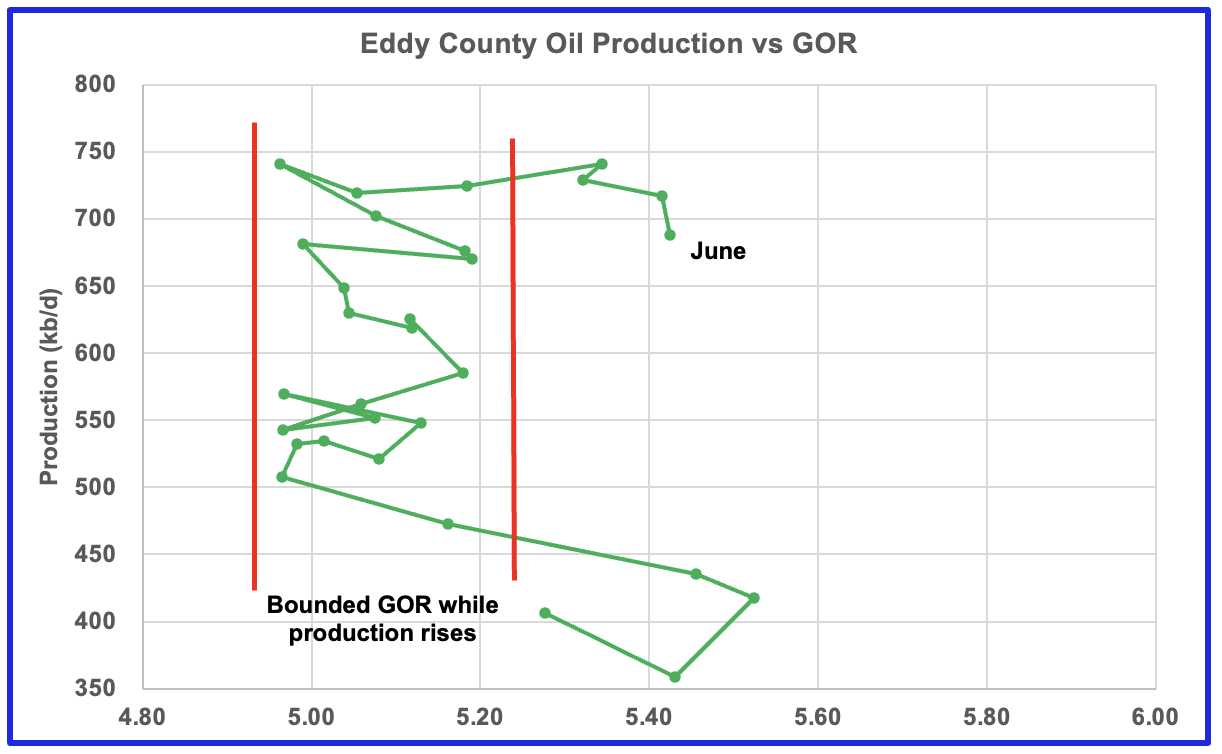
The Eddy county GOR pattern is similar to Lea county except that Eddy has broken out from the semi bounded range. Does the breakout indicate that most of the wells in this county have entered the bubble point phase?
Texas Permian
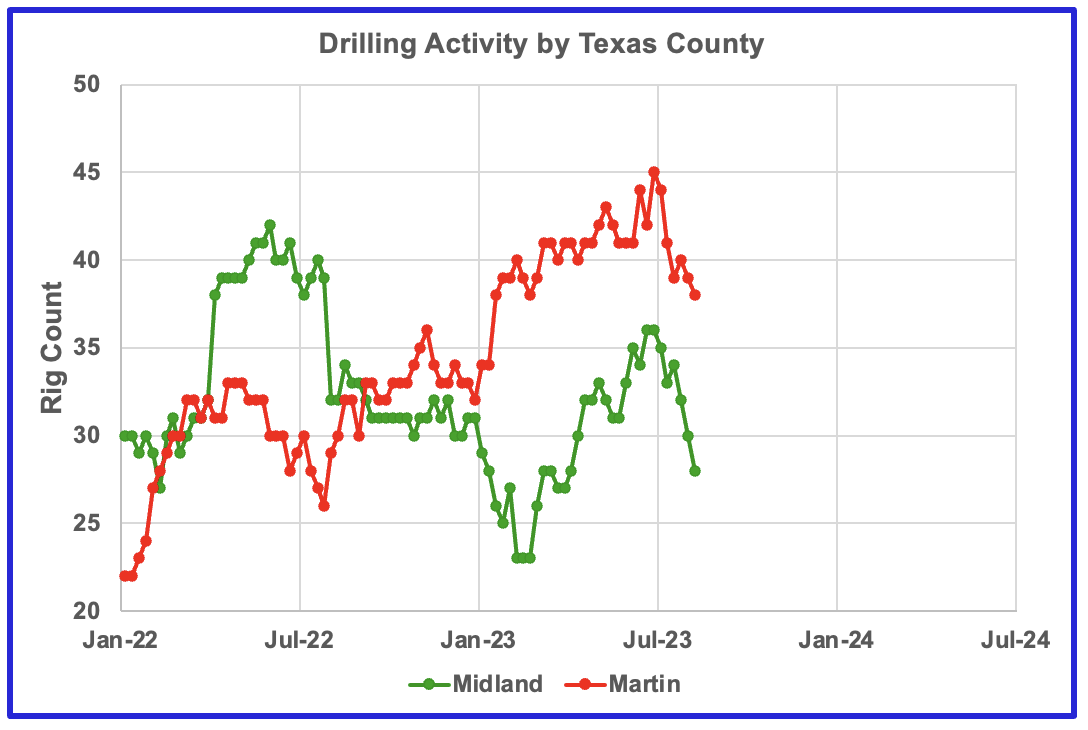
Drilling activity dropping in both Midland and Martin county has dropped over the past 6 weeks.
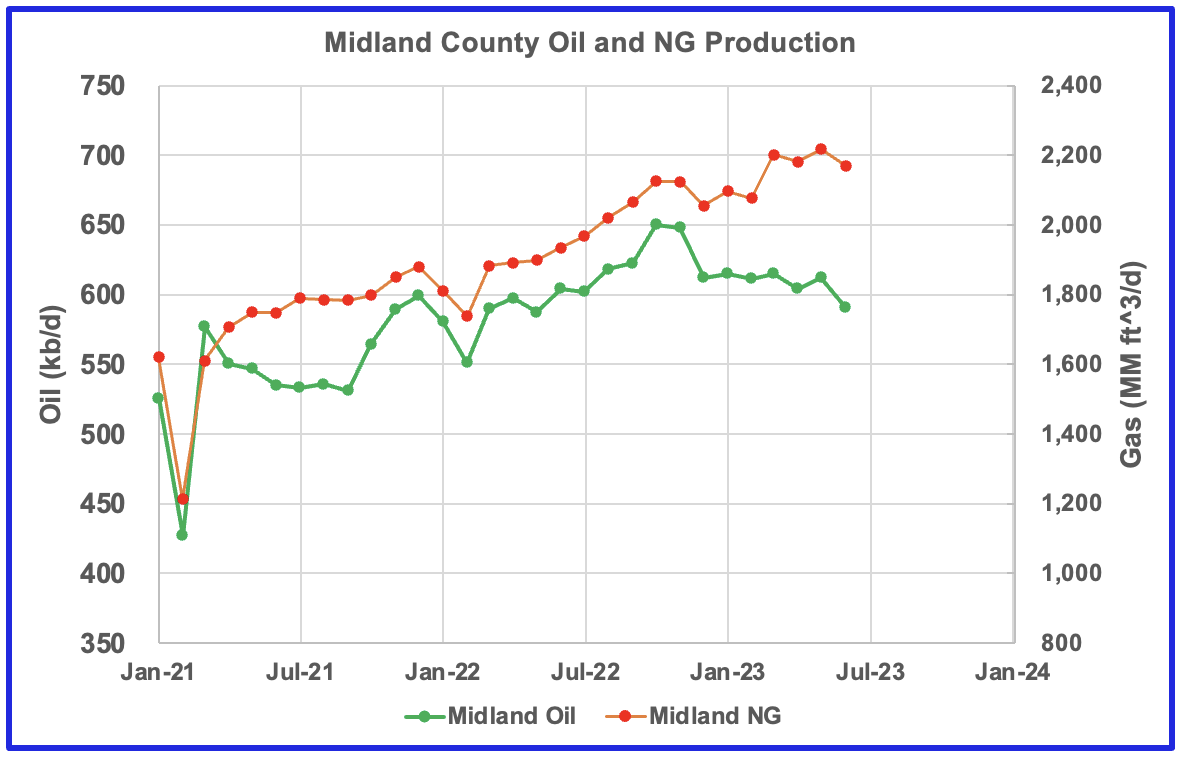
Natural Gas production increasing while oil production drops in Midland county
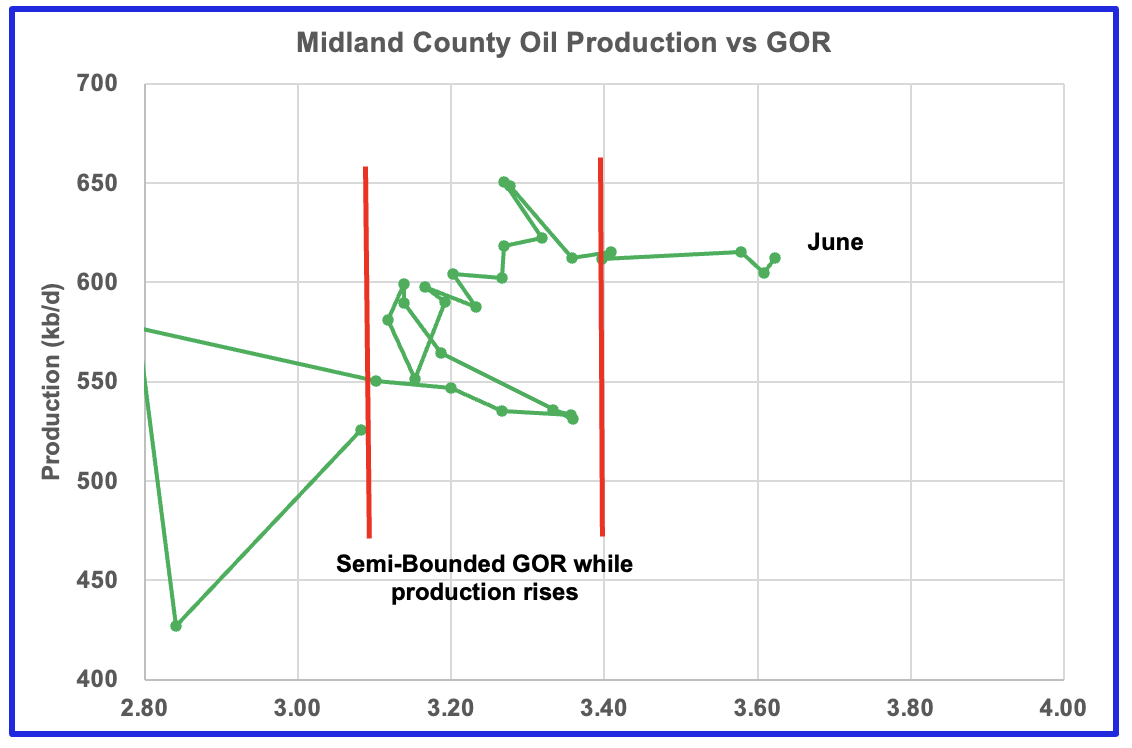
GOR breaking out to higher values and oil production dropping. Has Midland entered the bubble phase?
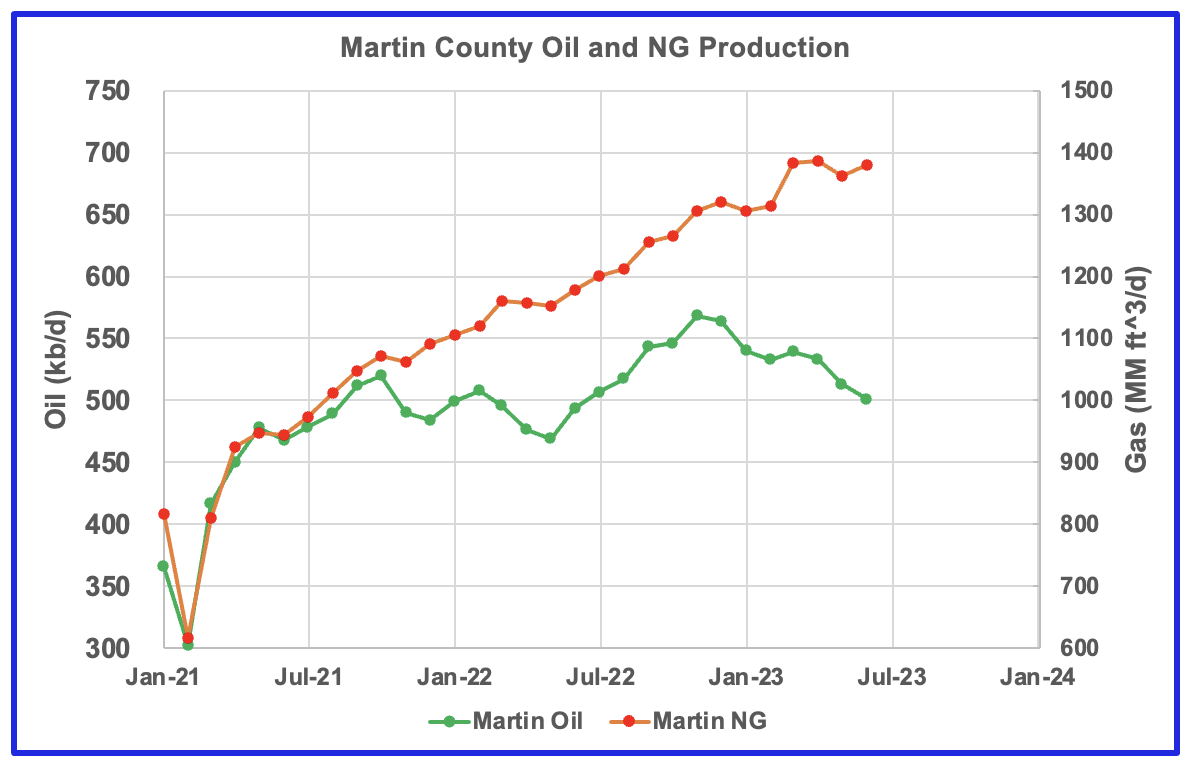
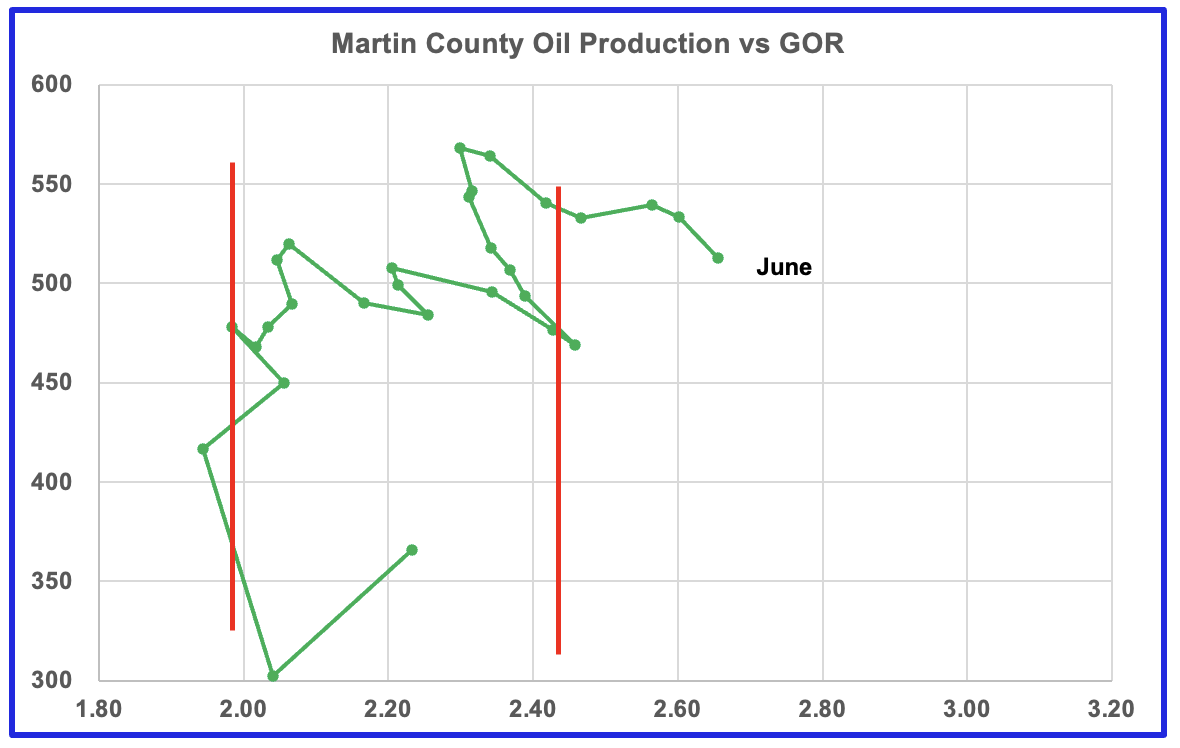
Similar GOR pattern to Martin county. Note that Midland county is adjacent to Martin county.
Are the oil production vs GOR charts above exhibiting characteristics indicating that three of the four counties in the Permian are in the bubble point phase and are close to or past their peak?
Biggest Oil producing County in the Eagle Ford
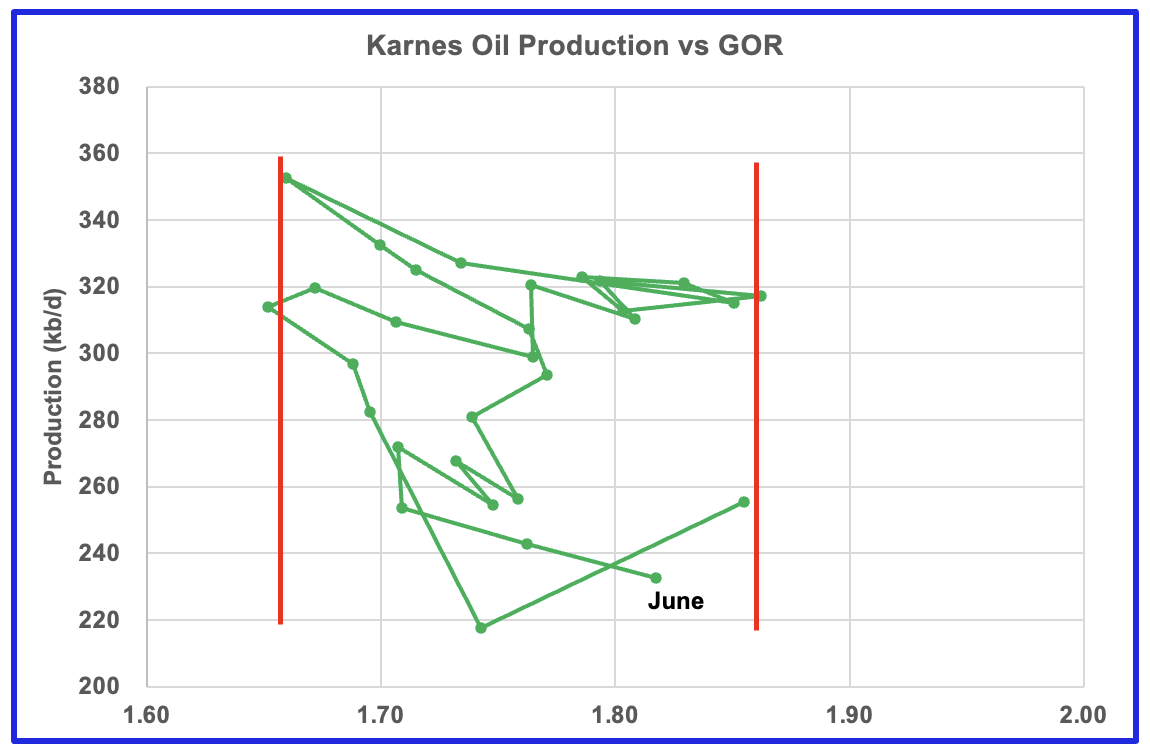
This is the GOR vs oil production for Karnes county but the GOR is still within its typical range while production is dropping. This may indicate that Karens county wells have not entered the bubble point phase, yet.
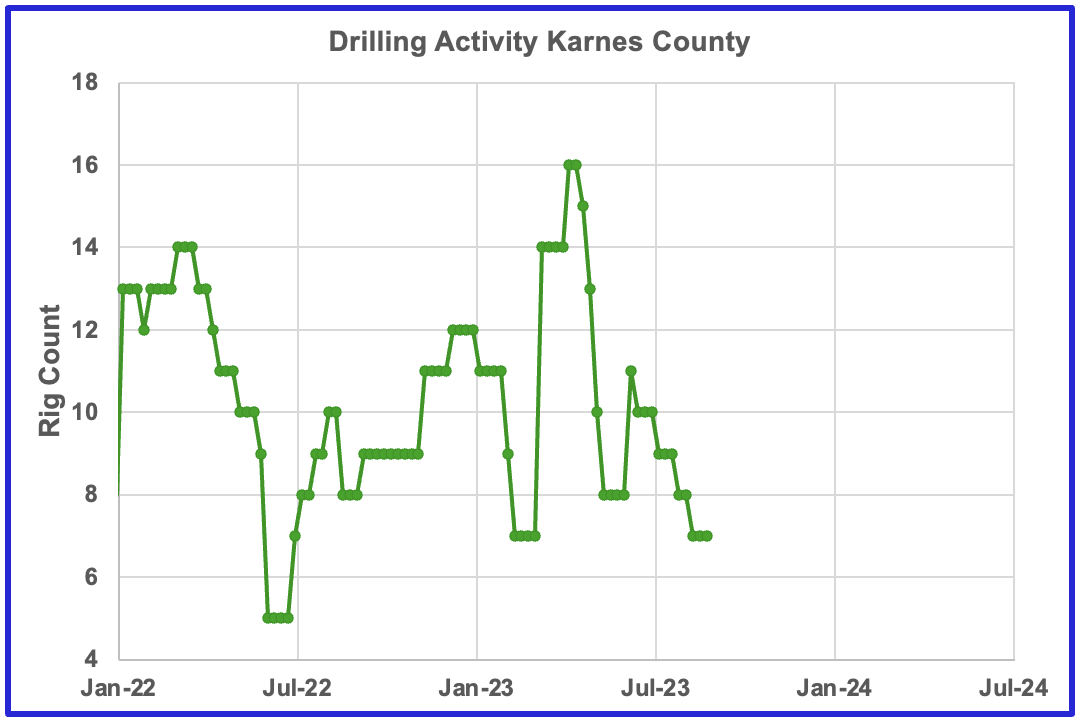
Drilling activity in Karnes county has been dropping since April.
Drilling Productivity Report
The Drilling Productivity Report (DPR) uses recent data on the total number of drilling rigs in operation along with estimates of drilling productivity and estimated changes in production from existing oil wells to provide estimated changes in oil production for the principal tight oil regions. The August DPR report forecasts production to September 2023 and the following charts are updated to September 2023. The DUC charts and Drilled Wells charts are updated to July 2023.
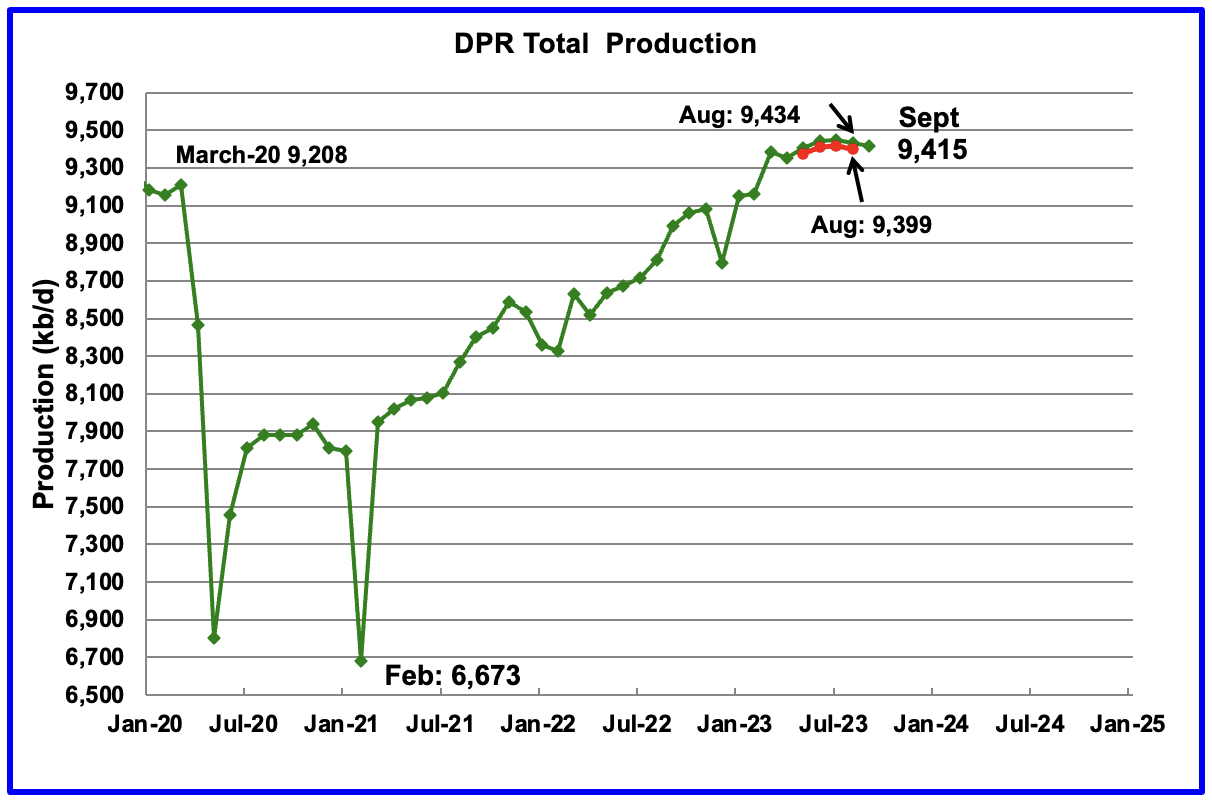
Above is the total oil production projected to September 2023 for the 7 DPR basins that the EIA tracks. Note that DPR production includes both LTO oil and oil from conventional wells.
The DPR is projecting that oil output for September 2023 will decrease by 19 kb/d to 9,415 kb/d. This is the second drop in a row since the July peak of 9,449 kb/d. The drop is due to the reduced drilling and completions that began earlier this year.
The August DPR production report increased/revised production over the last few months by roughly 30 kb/d to 35 kb/d over the July report. For instance, August output in the July report, red markers, was revised up by 35 kb/d from 9,399 kb/d to 9,434 kb/d.
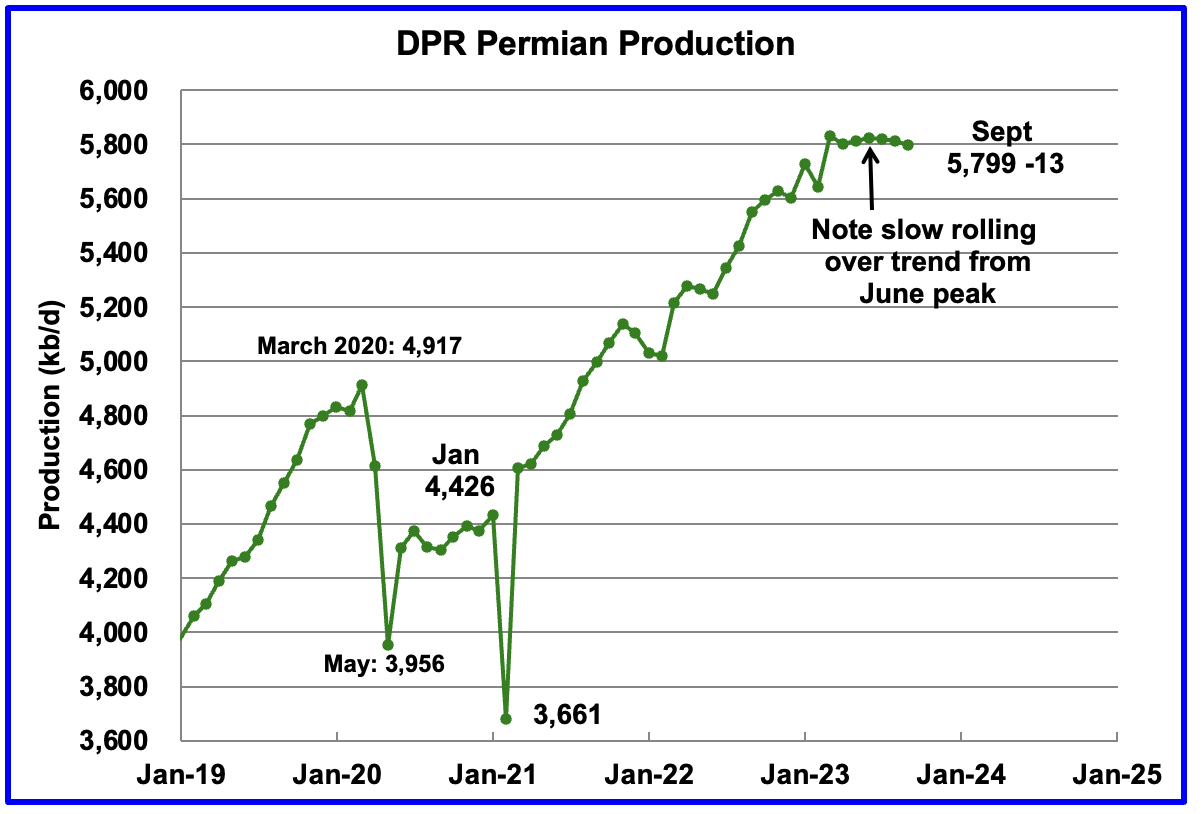
According to the EIA DPR report, Permian output continued to roll over in September. It is expected to decrease by 13 kb/d to 5,799 kb/d. The last six months of production data clearly shows a slowing trend in monthly production increases which now has turned to decreases, similar to the trend above for the total oil production in the DPR regions. Note the production difference with the following LTO chart
September’s output is 882 kb/d higher than the pre-pandemic high 4,917 kb/d.
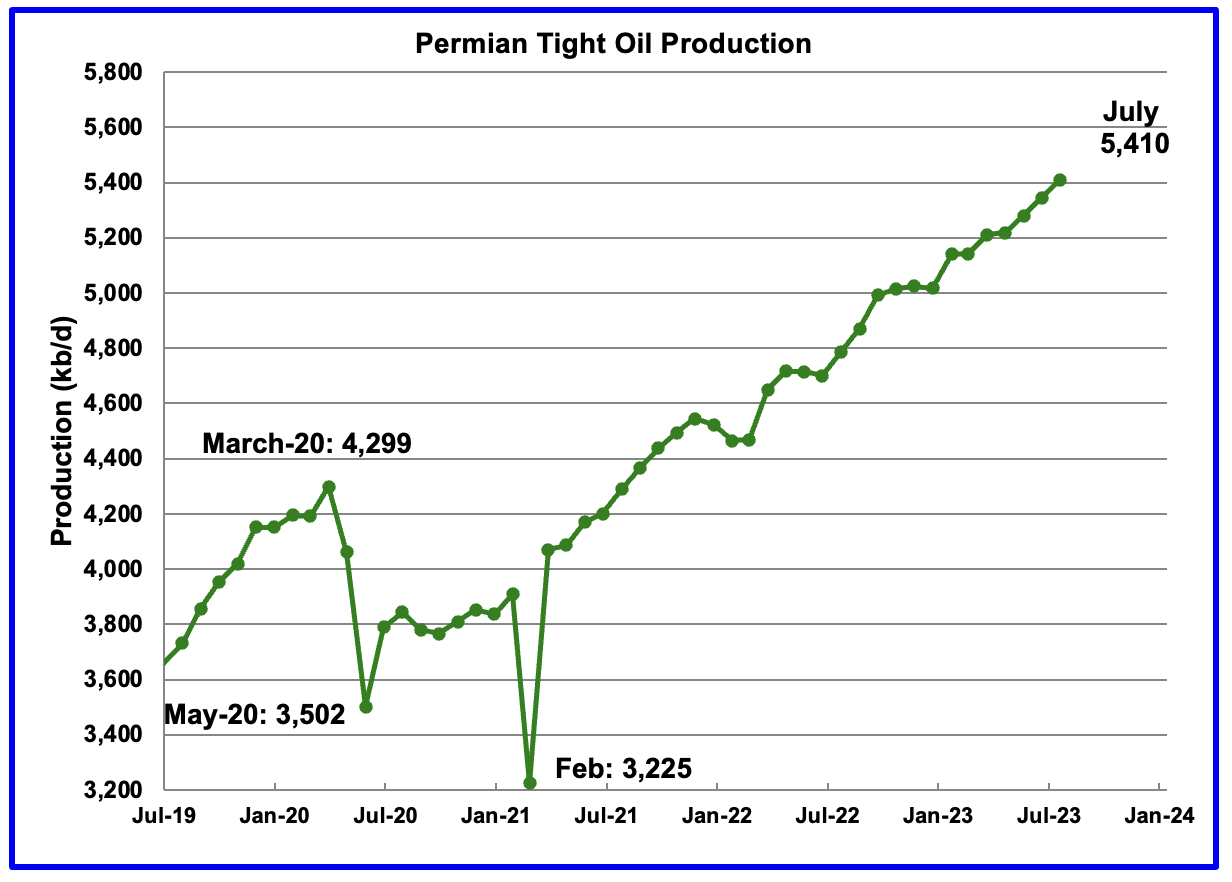
EIA LTO report shows no sign of production rolling over. Which one is correct?
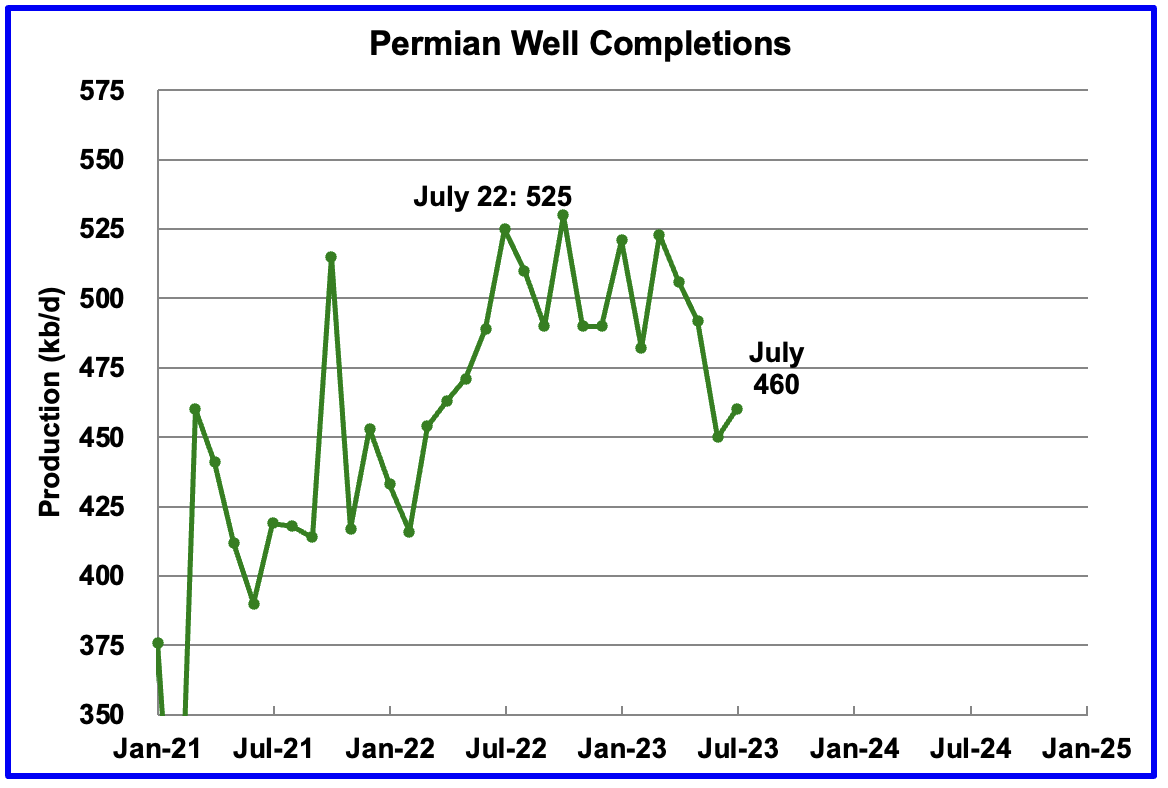
During July, 460 wells were drilled and 460 were completed in the Permian. (Note that July is the latest month for DUC information). The completed wells added 371 kb/d to July’s output for an average of 808 b/d/well. The overall decline was 372 kb/d which resulted in a net decrease for Permian output of 1 kb/d. Of the 460 completed wells in July, 461 would have been required to offset the decline.
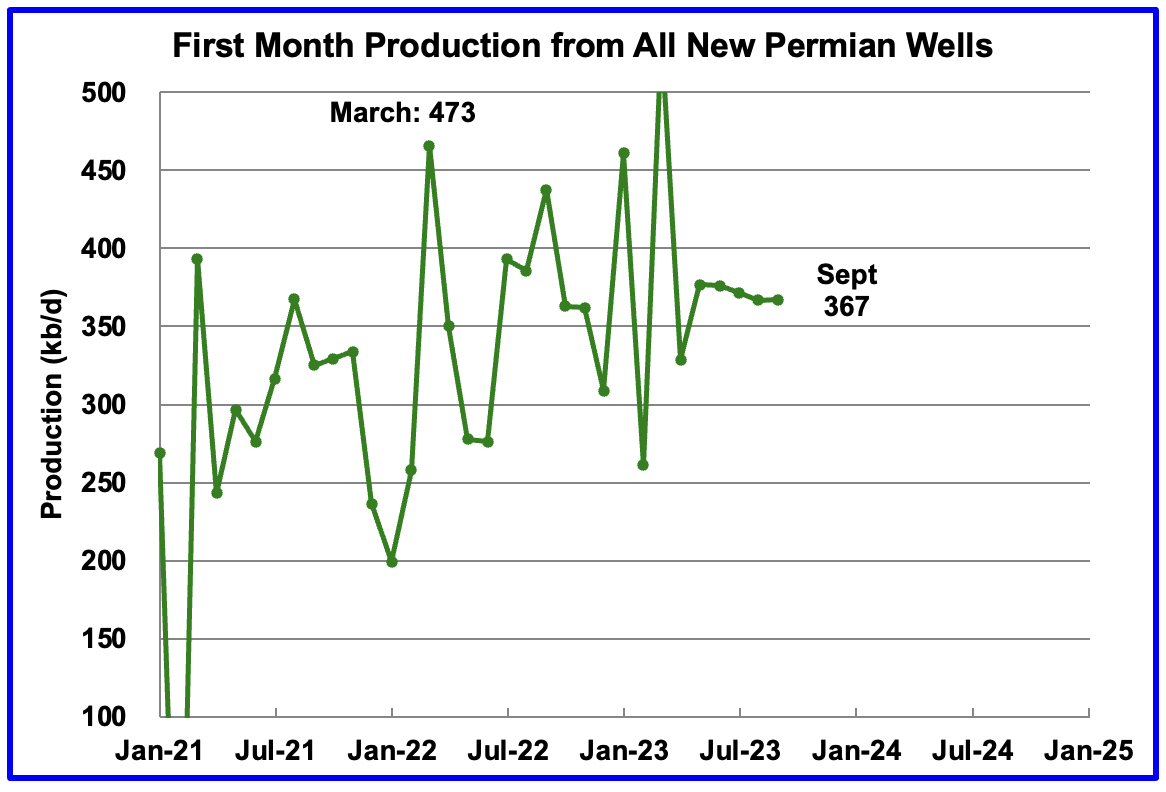
This chart shows the average first month total production from Permian wells tracked on a monthly basis. The total monthly production from the newest Permian wells in September was 367 kb/d. Production continues at close to the 370 kb/d level but hinting at a dropping trend. Production has been close 370 kb/d for the last five months.
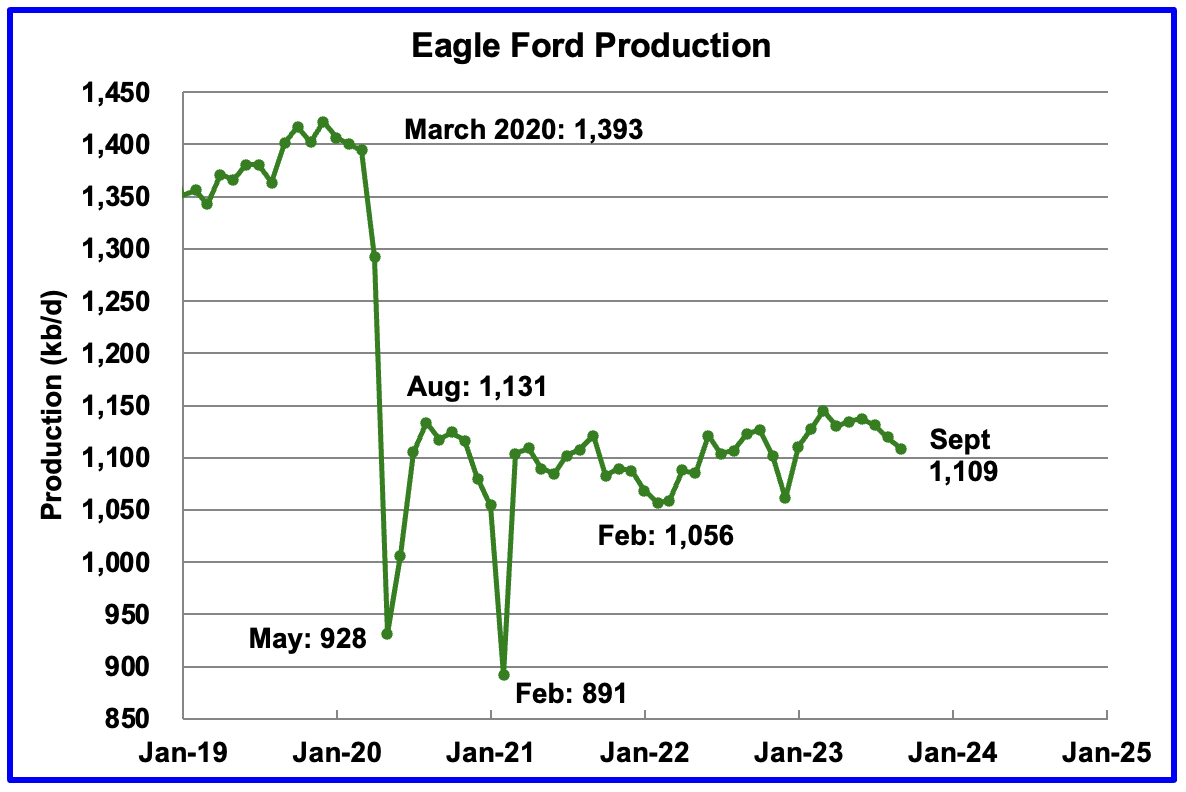
Output in the Eagle Ford basin has been in a generally flat trend since March 2021, fluctuating over a range of between 1,050 kb/d to 1,150 kb/d. September’s forecast projects output is expected to decrease by 11 kb/d to 1,109 kb/d.
At the beginning of the year 2023, 68 rigs were operating in the Eagle Ford basin. The rig count began to drop in mid March to 60 and dropped further to 50 in August.
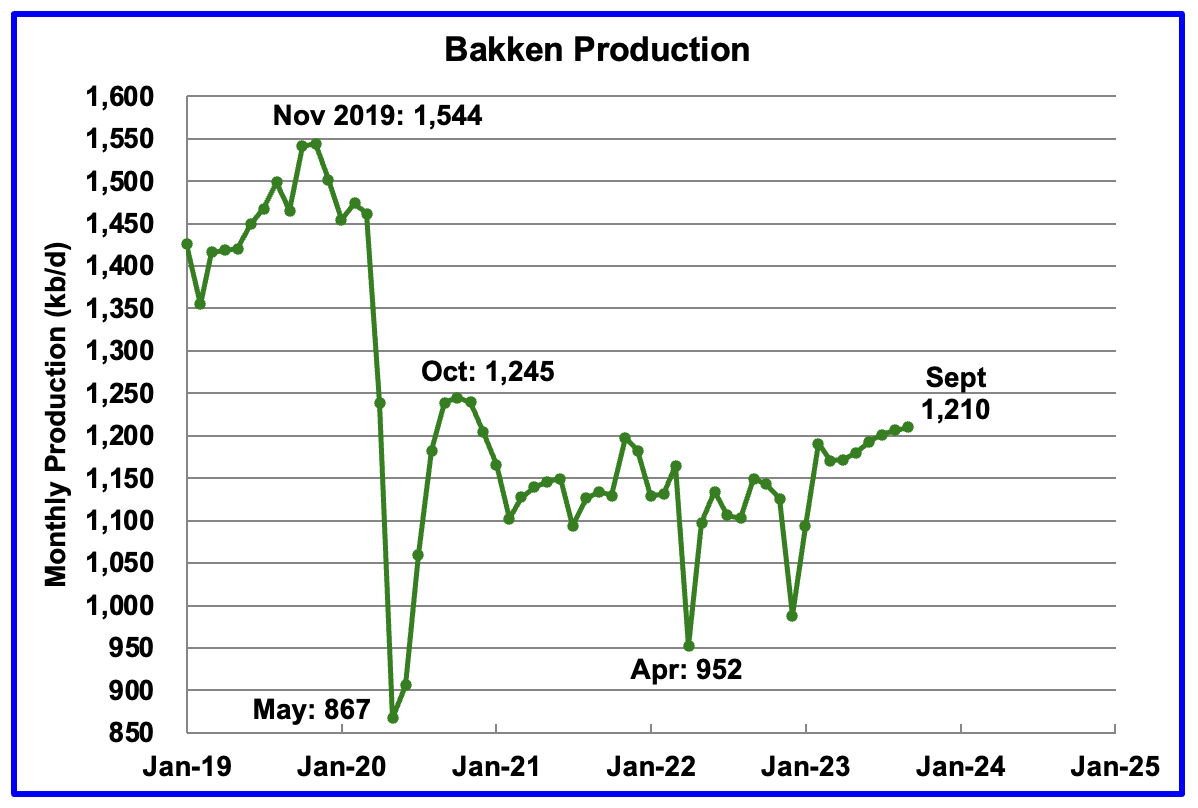
The DPR forecasts Bakken output in September will be 1,210 kb/d an increase of 4 kb/d over August. September production is 35 kb/d lower than the post pandemic peak of 1,245 kb/d in October 2020.
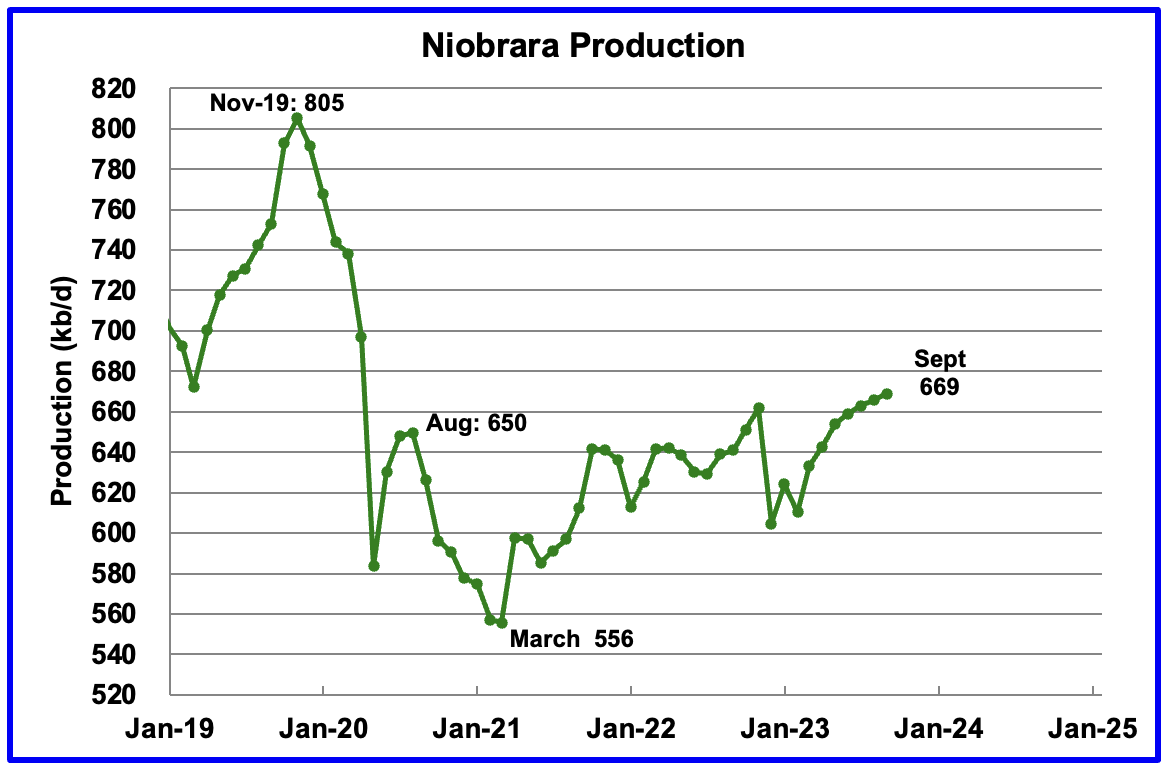
Output in the Niobrara continues to increase slowly. August’s output increased by 3 kb/d to 669 kb/d.
Production increased due to the addition of rigs into the basin but stabilized at 16 ± 1 rigs in March and April. However in August and September the rig count dropped to 14.
DUCs and Drilled Wells
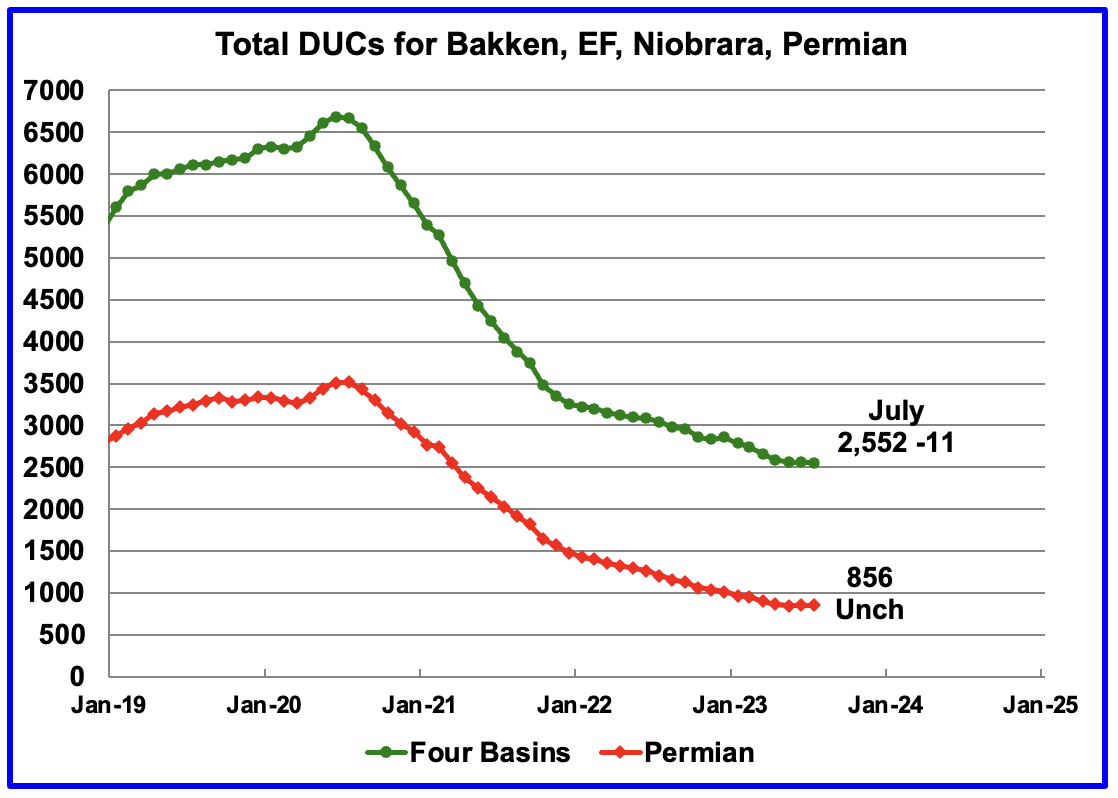
The number of DUCs available for completion in the Permian and the four major DPR oil basins has fallen every month since July 2020 and continued to decrease in July. July DUCs decreased by 11 to 2,552. Of the 11 DUCs decrease, 10 came from the Bakken.
July Permian DUCs were unchanged at 856, a first.
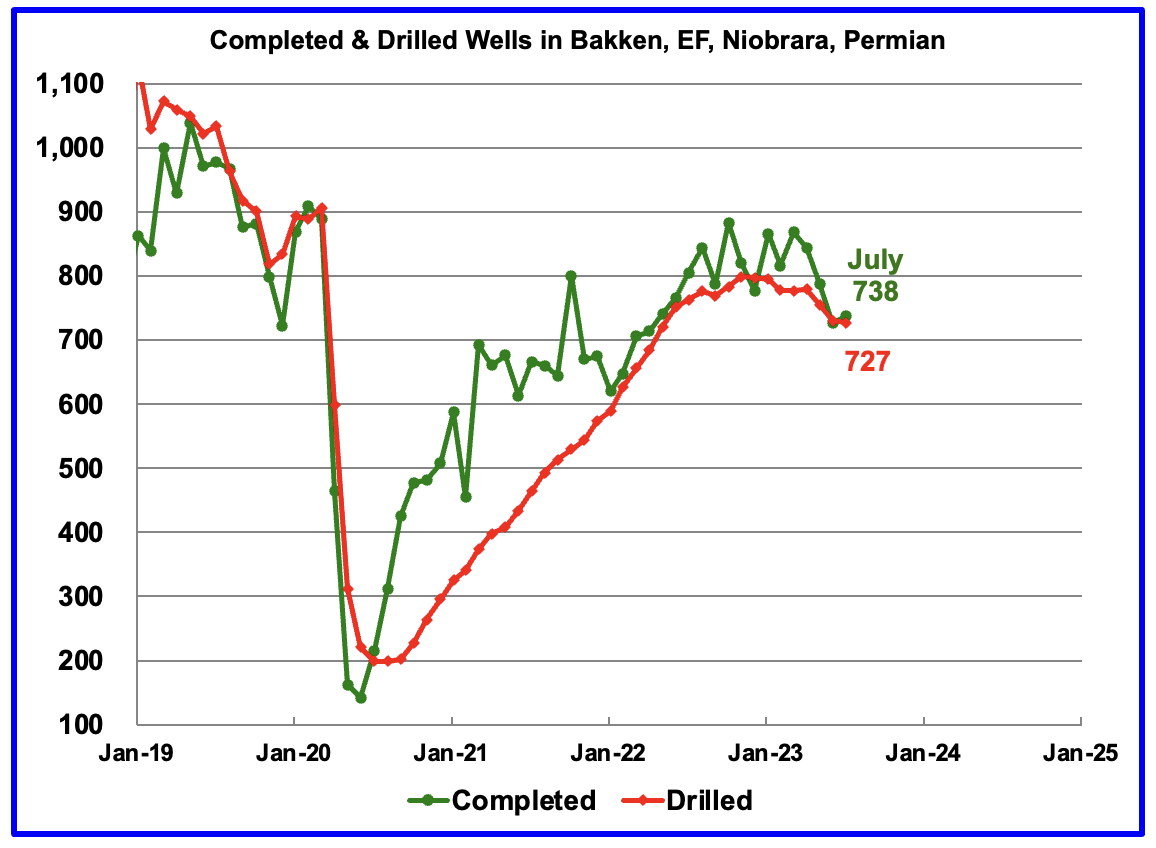
In these 4 basins, 727 wells were drilled while 738 were completed for a net decrease of 11 DUCs in July. Both drilled wells and completions are down from higher levels in late 2022 and early 2023.
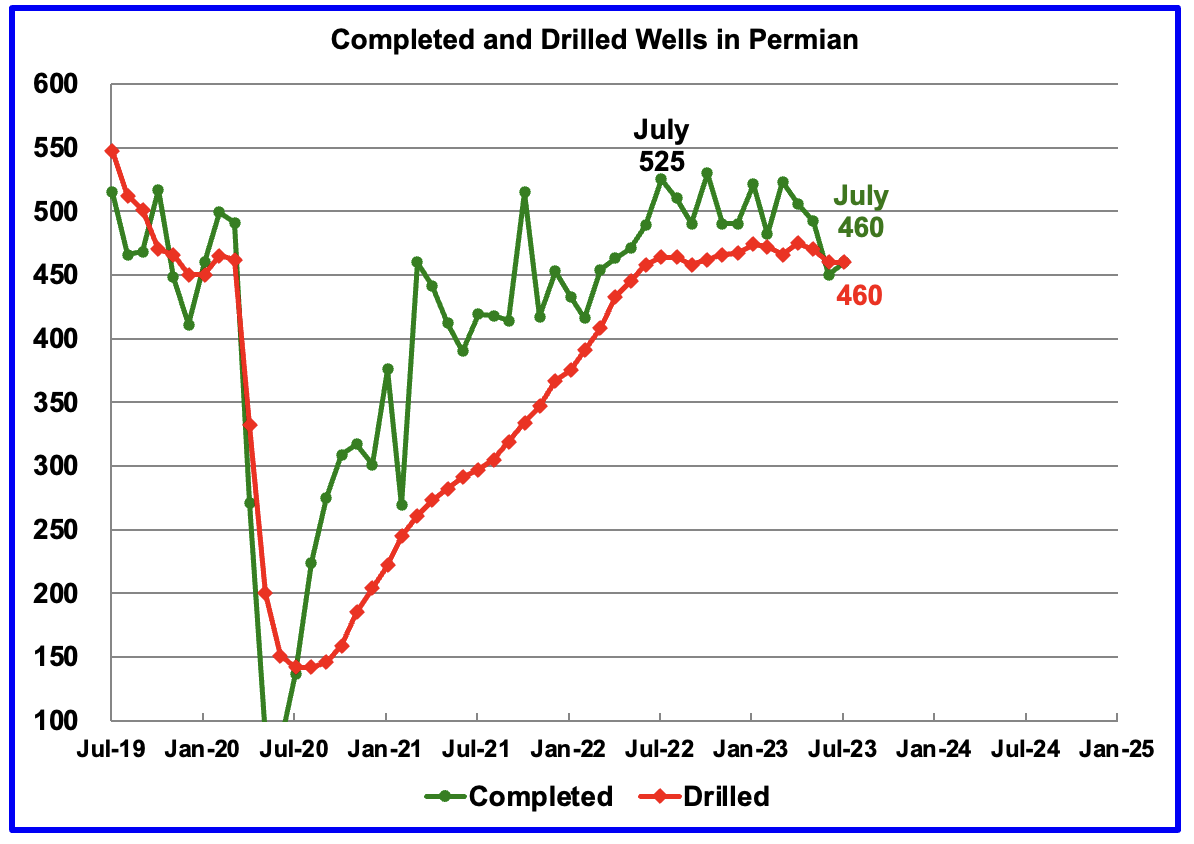
In the Permian, the monthly completion rate has been showing signs of slowing since the July 2022 high of 525.
In July 2023, 460 wells were completed while 460 new wells were drilled. The gap between completed and drilled wells in the Permian has now been reduced to zero, a first.
The Permian, as of July, had 856 DUCs remaining and the completion rate was 460 wells/mth. This means that the current cycle time between drilling and completions is 1.86 months or 57 days.
137 responses to “US June Oil Production Rises on GOM Jump”
In early January 2023, Dennis put out a challenge to POB participants to guess the average WTI price for 2023.
As a reminder, attached are the submitted guesses with 4 months to go.
The average shown in the chart is the average of the submitted guesses, $87.90/b. The Sept 6 price is $87.54/b.
The current WTI average price, based on trading days to September 6 is $76/b
Crap. In order for my average guess of 105 ( I think) to win oil will need to shoot up to 143 and stay there for the rest of the year….. I guess I’m knocked out of the race. 🙁
rgds
WP
WeekendPeak.
Maybe if oil gets up to $100 we can declare a moral victory. The previous year’s bet was final price. I didn’t realize that Dennis slipped in average.
Ovi,
We can go by whichever people prefer, I can’t remember, we might have asked for both average and final price.
Dennis
It really doesn’t matter, it’s all in good fun.
What is interesting is how close the current price is to the guessed average.
The wisdom of crowds verified again: https://en.wikipedia.org/wiki/The_Wisdom_of_Crowds
Thanks for the post Ovi.
Perhaps we should throw a party after the contest is over for those who did not see the word “Average”. It will be an average party!!
( seeing myself out….)
rgds
WP
Yeah that recession just never came and it’s not looking like it will anytime soon so I guess I’m out
https://wolfstreet.com/2023/09/07/my-favorite-recession-indicator-the-next-recession-moves-further-out-of-sight/
Lol +1
Thanks Ovi.
Great Job.
On Permian DUCs, the Novilabs DUC count is very different with Permian DUCs at about 2208 in March 2023, the count in Jan 2019 and June 2020 is fairly close to the EIA estimate, but since June 2020 the counts have diverged.
https://public.tableau.com/shared/5CM5ZZ534?:toolbar=n&:display_count=n&:origin=viz_share_link&:embed=y
Dennis
Thanks
That is a very large difference between NoviLabs and the DPR. At this time I think there is something wrong with the Novilabs Texas data. For March, NoviLabs shows 392 DUCs in NM and 1,816 in Texas. The NM March DUCs are less than half of the number in the DPR. That seems to make intuitive sense.
I also looked at the rig counts for NM and Texas Permian. For most of 2022, drilling in the Texas Permian was close to 60% higher than In NM. Difficult to explain the big difference in DUCs by comparing drill rigs.
I think Novilabs gets its data from the RRC of Texas, but I may be incorrect.
Drilling rigs in Texas and NM Permian.
Ovi.
We assume the rig count is accurate, but I have wondered about that.
Any idea how the data is collected? I don’t know how.
I do know the vertical rig count is contradicted for the States of Kansas and Illinois by other sources.
Shallow Sand
I have no idea how Baker Hughes collects the data.
Shallow sand,
Do you have links to the other data? I can’t seem to find it. Is the rig count in Illinois and Kansas now higher than 2018 to 2019?
See also two comments at
https://peakoilbarrel.com/steo-and-tight-oil-update-august-2023/#comment-762915
Illinois and Kansas produce a small percentage of US oil.
The reason I point them out is that I receive the IOGA newsletter and the executive director in his remarks says the state is averaging 10–12 rigs running, plus the source you found regarding Kansas rigs running.
This just made me question how accurate the other states are too.
Neither IL nor KS move the needle, even regarding US vertical production. Texas probably has by far the most vertical onshore.
I suspect if you look at the production by state in 2003, it would still fairly accurately reflect the proportion each state contributes regarding vertical oil production. Of course, the amounts would all be less today than 20 years ago.
BH records all rigs “turning to the right” (i.e. actually drilling) on Friday noon (I think), so it will record fewer than the actual number of rigs in the field. I think it’s a fairly informal arrangement between all the companies that provide drill bits, but it seems to be pretty indicative of actual activity.
Shallow sand,
Baker Hughes used to track workover rigs up to June 2007, it may be these are no longer counted.
Found this for Kansas rigs (both oil and gas rigs, I think)
https://www.iogsi.com/PDFs/Web Charts/KS Rig Count.pdf
Kansas C plus C output and 12 month trailing average in chart below
If we use DPR data for Permian and Eagle Ford and PSM data for Texas and New Mexico and assume the June 2020 to December 2021 average conventional output is the conventional output in these areas from Jan 2022 to June 2023 and further assume the Eagle Ford official EIA tight oil estimate is correct we get the following for the average of these two different estimates for Permian output (labelled DC estimate on chart). This estimate is higher than either the DPR or official estimate, but the assumption of flat conventional output may be incorrect which would make my estimate too high if conventional output has increased.
Dennis
Here is another piece of info that might help sort out the difference between the Permian DPR vs the LTO Permian
Attached is a chart that disaggregates the LTO Permian production into “Spraberry” and “Wolfcamp + Bonespring”. Also added is a graph for the production sum for Midland, Martin, Glasscock, Upton and Reagan counties using RRC data.
As you can see LTO W + B production has been relatively flat since January 2022. However the LTO Spraberry production has been rising since January 2022 while the Spraberry RRC production is again relatively flat and hinting at declining.
According to Wiki, “As most often defined, the Spraberry includes portions of Irion, Reagan, Upton, Glasscock, Midland, and Martin Counties,”
Wiki says “portions” of the listed counties. Not sure how LTO does “portions”. The RRC production data is for the whole county.
Ovi,
RRC data is always incomplete. This is seen easily by comparing PSM data to RRC statewide C plus C data. Also the Permian formations includ both Texas and New Mexico, so the Lea and Eddy data should be included.
The RRC data includes all output from the counties, both tight and conventional, the EIA data is more specific to those formations, the better comparison is to Novi labs, but Novi labs excludes vertical tight oil wells where the EIA does not.
Based on my estimate it looks like Permian output has flattened, but it has does this several times and then continues increasing.
Comparison of RRC and EIA data for Texas C plus C output in kilobarrels per month. Data is similar up to September 2022 (RRC data about 99% complete) and then diverges with data only 78% complete in June 2023.
Dennis
The point I was trying to make in the above chart is that the LTO Spraberry data seems wrong and the data you posted from Novi Labs seems to confirm that. The slope difference between the RRC data and the LTO data is what I was comparing. New chart below shows it better.
The first chart compares the five Spraberry counties chart with the LTO Spraberry chart. Totally different slopes.
The second chart is from the Novi lab site you referenced. While the Novi Labs data is slightly lower than the RRC data, the critical feature to notice is the production slope for the Novi Labs and RRC production data are very similar but distinctly different that the LTO Spraberry data. I think the Spraberry LTO is incorrect.
Ovi,
Those counties also have wolfcamp output, not just spraberry output, and there are many other formations as well along with conventional oil output, so comparing the slope of spraberry (for all Texas counties) with 5 counties including all oil is an apples to oranges comparison. It does not tell us a lot.
Dennis
I am not sure where this comment comes from “comparing the slope of spraberry (for all Texas counties) with 5 counties including all oil is an apples to oranges comparison.”
The comparison is Spraberry LTO vs those five RRC counties. The green graph is the same as the Novilabs chart and the slopes are very similar. LTO Spraberry has a problem.
Dennis
All I am trying to do is to show the disparity in the production slope between the LTO data for Spraberry and the data for the 5 main counties in Spraberry using data from the RRC and the data you referenced for those same counties from NoviLabs.
Attached is a chart which shows production for the Spraberry counties using data from the RRC and NoviLabs compared to the LTO Spraberry data.
The difference in the slope leads me to think that there is something wrong with the LTO Spraberry data. We know the difficulties that the LTO was having. Part of the discrepancy between the LTO and DPR Permian production data may be due to the LTO Spraberry data. The discrepancy has to resolve itself at some point.
Below is the reference you posted for the five Spraberry counties.
https://public.tableau.com/app/profile/peters6703/viz/shared/K8Z52T9HN
Ovi, the Lower Spraberry is also working well in a good chunk of Howard County and southern Borden County. That may have something to do with the difference.
Gungagalonga
Thanks for the info. That certainly complicates things. Not quite sure how the EIA LTO staff sort out these partial basins. So far the LTO data is going up in an almost straight line.
Novi Labs Chart
Dennis
Attached is a daily Texas production chart to get rid of the February drops due to the low number of days. I am surprised to see that January 2023 is close to 200 kb/d too low.
Ovi,
The RRC data is not complete after Sept 2022, it gradually goes from 99% complete in Sept 2022 to 78% complete in June 2023.
In the 6 Midland Basin counties most tight oil comes from either the Spraberry or Wolfcamp formations.
The difference in slope you are seeing between the 6 counties you mention and Spraberry may be due to flat Wolfcamp and conventional output in those counties.
So what is the right dataset to assess properly the evoution of production in the Permian? If I understand correctly, LTO is not good because it mixes data that have nothing to do with each other : ?
Jean Francois,
The EIA official estimate is usually best, but lately it seems perhaps a bit low. Novilabs data is also good, but the estimate stated in the post is usually best and accounts for incomplete data from state agencies.
The best estimate is from the June report on the Permian at Novilabs for April 2023, quoted below
Permian tight oil production grew to just below 5.3 million b/d in April (after upcoming revisions, horizontal wells only).
After that we have guesses using various assumptions, that’s the best we can do. The DPR estimate for April 2023 is similar to Novilabs, but note that the Novilabs estimate does not include output from vertical tight oil wells, and includes output from formations besides Spraberry, Wolfcamp, and Bonespring (about 150 to 200 kb/d for April 2022 to March 2023 period).
Ovi,
Using Novilabs we have the chart linked below for Midland, Martin, Upton, Glasscock, and Reagan with output shown by formation.
https://public.tableau.com/shared/3BSHMPP2B?:toolbar=n&:display_count=n&:origin=viz_share_link&:embed=y
and link below by county
https://public.tableau.com/shared/K8Z52T9HN?:toolbar=n&:display_count=n&:origin=viz_share_link&:embed=y
Keep in mind there is a lot of vertical tight oil wells in the Sprberry formation which are not included in Novilabs data (about 350 kb/d as of December 2021).
OPEC And Russia Didn’t Keep Oil Production Cuts To Raise Prices Bold mine.
The latest announcement from OPEC+ keeping temporary oil production cuts in place through December 2023 is not what it seems. Most news reporting on the cuts has focused on potential Saudi and Russian collusion against the United States as the motivating factor behind the decision. While there may be plenty of friction between said countries, the real story is much more sublime.
Russian oil production cuts are not voluntary – they are the result of factors related to Western sanctions in retaliation for Russia’s aggression against Ukraine in the Black Sea war. Major oil companies and several oil service companies either curtailed operations in Russia or pulled out completely after Russia’s February 2022 invasion of Ukraine. The abandonment of assets by highly experienced and efficient oil companies left some Russian oilfields to be run by less experienced entities. Over time, normal maintenance and repairs that needed to occur have not been as robust under Russian control as they were under multinational oil and oil service companies’ control. It is only natural, and not at all unexpected, that Russian oil production would fall under such circumstances. Additionally, Western sanctions and embargoes on equipement, spare parts, and technology are pressuring the Russian oil sector even further, creating more of a strain on Russian oil production capabilities.
OPEC cut for a different reason. Click on blue link to find out why.
Along these lines-
“Russian farm minister says fuel shortages threaten harvest and sowing…
“”We already have problems with the availability (of fuel). We will now stop harvesting, and we will not sow winter crops. It will be a disaster,” he was quoted as telling the joint session of parliament’s monitoring and agriculture committees. “Maybe it’s time to temporarily stop exports of oil products until we stabilise the situation on the domestic market.””
https://www.agriculture.com/russian-farm-minister-says-fuel-shortages-threaten-harvest-and-sowing-7965972
We must accept the longer this war is going the lower the russian production will be. They have too many ressources in war material production to replace all western oil technology that breaks. They could perhaps when there was no war.
And buying everything on the black market is slow and expensive- and so the farmers have to work without fuel. Cannons are more important.
Times are interresting, and not the good way.
Russian oil production 2021 = 11.00 mbpd
Russian oil production 2022 = 11.20 mbpd months of sanctions
Russian oil consumption 2021 = 3.48 mbpd
Russian oil consumption 2022 = 3.57 mpbd months of sanctions
Watcher wrote:
Russian oil production 2021 = 11.00 mbpd
Russian oil production 2022 = 11.20 mbpd months of sanctions
I have no idea where you got those numbers but they don’t match the EIA’s data. According to them:
Russian oil production 2021 = 10,110,000 Barrels per day
Russian oil production 2022 = 10,280,000 Barrels per day
Ovi,
The RRC data is not complete after Sept 2022, it gradually goes from 99% complete in Sept 2022 to 78% complete in June 2023.
In the 6 Midland Basin counties most tight oil comes from either the Spraberry or Wolfcamp formations.
The difference in slope you are seeing between the 6 counties you mention and Spraberry may be due to flat Wolfcamp and conventional output in those counties.
BP’s, now Energy Institute’s, World Statistical Report. The Bible of oil for 70 some years.
Russia 2021 production 11 mbpd
Russia 2022 production 11.2 mbpd
So even EIA admits a production increase amid sanctions? Must be . . . either embarrassing or not noticed.
Ron
I still think that Saudi Arabia is resting Ghawar and possibly Safaniyah.
I don’t think resting has any benefits. I do no know why they are cutting production, but I doubt seruiyskt it is not to rest any fields.
Ron
I know what the consensus is but I still think they are resting Ghawar has benefits.
Here is the latest EIA data for Russia. The last data point is May 2023. The arrow marks the point where the EIA, just this month, revised Russian production down by 368,000 barrels per day. This may have been an error. If so, they will correct it in the future. The data below shows the December 2017 data and January 2018 data and the amount revised. But I think someone messed up here. Otherwise, I have no explanation.
……………………………Dec-17 … Jan-18
Russia August data 10,527 10,550
Russia Sep. data….. 10,527 10,182
Difference …………….. 0 …… -368
Anyway, Russian production is in decline.
World Oil Production Update
May production is down by 1 Mb/d from April. It is a combination of a 560 kb/d downward revision to Russian April production and 440 kb/d drop for the rest of the world.
That is not exactly correct, Ovi. Russian revision goes way back to January 2018, but in May, Russian production was only down 193 Kbpd from April, from 9,516 to 9,332 Kbpd. The rest of the world was down 811 Kbpd in May from April. Saudi production was down 700 Kbpd, from 10,800 Kbpd to 10,100 Kbpd. All that is C+C, of course. The OPEC MOMR has them down 520 Kbpd from April to May, from 10,496 to 9,976 Kbpd.
Russia Chart Prior to revision
Compare the attached chart with Ron’s above. April production in the attached April chart posted last month has been revised down by 561 kb/d, from 10,077 to 9,516 kb/d. The 560 kb/d shift in the last two data points can be seen by comparing them with the last two points in Ron’s chart.
The updated/revised April and May production figures are 9,516 kb/d and 9,323 kb/d respectively.
Permian productivity
Rig and Frac Report for September 8
– US rigs were down 4 to 459
– Permian rigs were down 2 to 303 with Texas Permian up 1 and NM Permian down 3 to 98
– Eagle Ford was down 1 to 46.
– NG was down 1 to 101
Fracs were up 8 to 252
I feel indebted to peak oil barrel. I extract a lot of information from the page and then process it to redefine the complicated situation we find ourselves in.
https://futurocienciaficcionymatrix.blogspot.com/2023/09/esto-es-insostenible-y-no-hay-solucion.html
Ovi does excellent work, we are all grateful.
Agreed. If there’s one thing I’ve learnt from POB, it’s that many smart people are willing to write articles for free that are much better than those written by people who expect to get paid for it. Always a pleasure to read the works of Ovi, George Kaplan, Dennis, Mike Shellman and all the rest. I feel a debt is owed.
I updated some old charts for UK offshore oil production, which is in pretty steep decline now. The small, dark wedge on top shows the low additions in the 2020s. UK counts lease condensate from gas/condensate fields as crude and the virtually invisible pale green wedge from dry gas fields (mainly in the Southern North Sea. At current decline it will run out just about when available global exports drop to zero, which doesn’t bode well.
This was a projection I production in 2020 based mostly on P10 (i.e. optimistic) estimates in environmental impact statements that are required before new developments get approved. The red diamonds show actual production, the black ones show a previous OGA (now NSTA) estimate and the blue diamonds are from a Shift project estimate from a couple of years ago (however these include NGPLs). Obviously actual production is way below all estimates. Discoveries have been quite low and are not going to make up the gap. Three potential developments, Cambo, Rosebank and Greater Buchan, have attracted lots of attention from Leave Oil but really they are marginal fields with poor EROI and low side risk so don’t get to the front of the IOCs fid queues.
One of the success stories has been Buzzard, which has exceeded the P10 estimates (from the Buzzard II project) but is now in serious decline.
In comparison there have been many disappointments, e.g. Mariner (heavy oil), Clair Ridge (phase III is in conceptual design now) and Laggan-Tormore (gas-condensate).
1
2
Thank you Mr Kaplan.
Great stuff as always.
Thanks for the update George. Europe’s energy situation certainly seems to be compromised. We will see when economists and politicians begin to wake up to the plight.
Guyana is set to add an additional 1 million bbd (up from current ~350,000 bbd) in 5 years. Potential is to go MUCH higher.
Brazil is planning on ~2 1/4 million bbd increase (currently just over 3 million bbd) in 7 years.
Argentina is planning on passing the 1 million bbd mark in ~6 years, near doubling present output.
That must-read oilprice article on Iraq – referenced on this site by Old Farmer Mac – describes Iraq’s proposal to add near term oil output to 5 million bbd (almost a million bbd more than today) with the aim to double that capacity yet again.
I am forever puzzled at how – contrary to these aforementioned statements – the prevailing view on this site is looming scarcity.
This does not even begin to address the – mainly political – constraints placed upon Venezuela, Russia, Iran and – internally, at least – Canada.
World is awash in oil from a geological standpoint, and will continue to be so far off into the future.
Ovi, (great posts, as always. Muchos gracias) that reference to Sandoval county, New Mexico oil production that you made last thread may be San Juan basin work.
There is a relatively small oil window in that region which has, as per USGS, tens of trillions of cubic feet of TRR natty.
The only hydrocarbon that dwarfs oil potential is natural gas … a century’s worth, at least. (Likely unbounded as countries around the world tap their domestic resources rather than let their citizens freeze/starve).
Guyana can easily reach and exceed one million b/d. Argentina will or will not reach one million b/d in 2030, but Brazil has a very difficult time meeting its forecasts.
https://futurocienciaficcionymatrix.blogspot.com/2023/06/los-frios-numeros.html
Thanks Dennis. Although I don’t share your forecasts, I think you do an excellent job. I also follow George Kaplan, Mike Shellman, Ron, and many others who post on Peak Oil Barrel.
Quark
I also think that Dennis makes great forecasts. He gets concerned when his model is too high by 100 kb/d. I think that is totally amazing that the models get that close.
Thanks Ovi and Quark,
My forecasts are wrong about 100% of the time, but about 95% of the time in the past the forecasts have bben too low, with the exception of the pandemic period from 2020 to 2021. Eventually I may get the forecasts right where half the time they are too low and half the time they are too high. No forecast is likely to be correct, infinite possibilities in the denominator and any one forecast has zero percent probability of being correct.
Coffee
There are some people on this website who have been claiming “Peak oil” since TheOIlDrum days and it is impossible to argue any moderation with them.
If you look at all producing countries you will see some are increasing but many are in decline.
Look at the 25 year charts
https://tradingeconomics.com/united-kingdom/crude-oil-production
https://tradingeconomics.com/norway/crude-oil-production
https://tradingeconomics.com/australia/crude-oil-production
https://tradingeconomics.com/nigeria/crude-oil-production
As you say, there are countries that are finding oil and increasing production. However adding all the pluses and minuses together global oil would have peaked around 2016. The one country that stopped that happening is the U.S. Which nobody on TheOilDrum predicted.
https://tradingeconomics.com/united-states/crude-oil-production
The low oil price at the moment tells us there is plenty of oil at the moment and that is why OPEC + is cutting production. Once oil gets up to $130 for a couple of years, as it was 8/10 years ago we will see what the world can produce.
Once the U.S. peaks in 2/4 years, there really isn’t any other country or countries that can come up with an extra 2 million barrels per day that is lost from all the declining countries each and every year.
Total liquids will peak at around 106 million barrels per day. I would not call that a scarcity, we just have to start being more frugal with a deminishing resource.
Charles,
“Once oil gets up to $130 …”.
Exactly.
While my comment mentioned the political constraints on several countries’ production, the economic factors are even more impactful.
A dominant theme on this site regarding high oil pricing is demand destruction.
Of course.
That certainly occurs, but MANY other knock on effects emerge, with more robust production being the most obvious.
Alternative energy sources are another consequence of high oil pricing, and this enters the realms of political, ideological, and (very high) financial scenarios wherein the ‘winners/losers’ are in constant existential circumstances. (Witness the offshore wind industry, the coal industry – at least in the US, absolutely NOT worldwide.)
When I see higher pricing – say ~$110 oil/~$6 HH – I see ENORMOUS amounts of acreage – the so-called Tier 2/Tier 3 prospects – becoming profitable to develop.
This, again, (obviously and historically) leads to more product which tends to tamp down final cost.
The Appalachian Basin is where my attention has been focused these past few years and I’m tellin’ ya Charles, the number of wells routinely producing ~5 Billion cubic feet FIRST year is significant … throwing off $15 million gross at $3/1,000 cubic feet. Six bucks would not only double that, but it would expand the viable footprint by the tens of thousands of acres.
Same general principal would apply to the oil basins.
We are not looking at a liquid hydrocarbon scarcity for quite sometime, IMHO.
Quark, me siento honrado, señor. Gracias. I enjoyed reading your blog.
https://www.oilystuffblog.com/forumstuff/forum-stuff/cosas-buenas.
There is a Novi chart in here that is a good example of thousands of other examples of what Tier 3 and 4 level locations will look like in the Delaware Basin. The Midland Basin is no different. In both sub basins of the Permian the further away from the heart of the watermelon, the gassier the rind is and the less liquids these wells will make. These flank wells will require much higher natty prices to be profitable, not higher oil prices.
This secondary stuff will NOT help anybody in the US; its liquids are plus 48 API and will have to be exported, as will the natural gas in the form of LNG, but not before substantial takeaway is built out. And remember, in depletion gas ‘reservoirs,’ like shale containers, gas does NOT produce forever after bubble point is reached. We will reach an OMG moment soon where people will get that and no more effort will be made in the way of associated gas LNG exports.
This is all a good example of how mismanaged this valuable resource was in the US. Now that we REALLY need it, and the price is high, rig counts are tanking and nobody can stand on their own financial feet from net production revenue. All the good, cheap stuff was…exported.
Believe what you want, or what you must, but the American tight oil phenomena is speeding to a red light. When you see the (real) reserve replacement ratios for tight oil in 2023 you are going to flat have a cow.
Thank you very much Mr. Shellman.
I value industry experience above all else.
Quark,
Link to model below, which can be modified for different completion rates in row 4 of the output sheet at link below.
https://docs.google.com/spreadsheets/d/1yl88SAdQy_M5zso5TiHuoi_j00-bxJoJ/edit?usp=sharing&ouid=105320434049434900507&rtpof=true&sd=true
Chart below ha a conservative completion rate profile, normalized productivity for average well has been decreasing at about 0.5% per year from 2017 to 2021, it is a bit early for estimates of average well productivity of more recent wells (we do not have enough data to make good estimate.) The scenario assumes 460 wells are completed each month from Sept 2023 to August 2027 and then the completion rate decreases.
The completion rate can be modified under the assumption that productivity continues to decrease in the future (just decrease completions at 0.5% per year to account for productivity decrease).
Dennis, your readers don’t like my stuff, generally, particularly with regard to exports, and the only reason I post links is because it is bloody hard to publish images here. Takes too much work and I would simply have to re-write what I’ve already written. I am not into self promotion, be assured of that, please.
With regard to it being “too soon” to know what recent well productivity is doing in the Permian, Novi does not believe that nor does Enverus nor Flow, or much anybody else. IP180 has become the standard metric, sadly…after that, because cash is King, the numbers get worse. The past two years, Basin (forrest) wide, it’s more like 6% per year. In high graded sweet spots, much worse.
https://www.oilystuffblog.com/forumstuff/forum-stuff/where-is-this
Mike, another theatre and not oil at all – but very related. It’s about energy.
More and more towns here in Germany start developing deep geothermal projects. The derricks are coming.
Drilling up to 5000 meters in the deep and then going horizontal guarantees boiling water almost everywhere – so they want to take on this mostly for heating energy but also for generating electricity. Some technic is taken from the horizontal wells – so the fracking adventure helped for a new class of energy source – and one that is reliable around the year and the clock.
There are wet rock and dry rock systems projected with closed loops (no water contact to the rock) – times get interesting and people that know how to operate a big rig are in demand.
One of those:
https://www.thinkgeoenergy.com/drilling-starts-for-first-commercial-eavor-loop-in-geretsried-germany/
https://www.globenewswire.com/en/news-release/2022/09/20/2519205/0/en/KCA-Deutag-Eavor-GmbH-Sign-Contract-to-Drill-Revolutionary-Geothermal-Power-Project.html
At least it should be interesting for the drilling part.
Eulen, thanks! I never got to drill a geothermal well. I went on a blowout once that was geothermal. The well head was too hot to touch with cotton gloves. Unbolting flange bolts were like touching hot pans out of an oven with no hot pads. Rubbers are a big problem in these wells, like BOP rams, etc. and in the old days they would cook bottom hole assemblies at greater than 350 F. A buddy of mine in the Cooper Basin of Australia has been drilling geothermal wells. They’ve gotten good at it now. An excellent, realistic, affordable source of future energy.
Mike,
Thanks. I think we need at least 18 months of data to get a decent estimate and I only have access to free reports at Novilabs. For the most recent data published in June there were 5663 wells completed in 2022 in the Permian basin and we only have 4 months of data for those 5663 wells with average cumulative output at 80.6 kbo. For the 4773 wells completed in 2021 the average cumulative output at 4 months was 84 kbo. For the 3628 wells completed in 2020 average cumulative output at 4 months was 77 kbo. This does not account for increasing lateral length.
For EUR in kbo normalized to the average lateral length of a 2016 Permian well we have:
2016, 362
2017, 354
2018, 352
2019, 354
2020, 341
2021, 349
Over this period (2016 to 2021) the decrease in EUR per foot of lateral was about 1% per year. I maintain that we do not get a good estimate of EUR with only a few months of data. I believe it was you who suggested that a couple months of data does not tell us enough to determine long term EUR. I agree, though perhaps I misunderstood the lesson.
Some of this decrease in EUR may be due to increased lateral length and less productivity in the toe of these longer wells, eventually I expect an optimum well length will be determined and average lateral length may stabilize at that optimum lateral length. Some of the decrease in normalized output since 2016 may be due to increased lateral wells having lower productivity normalized for lateral length. When (or if) average lateral length stops increasing we may get an idea of what proportion of the decrease in normalized EUR is due to increased lateral length.
Eventually we will also see poorer rock result in lower EUR.
Dennis, I am just a messenger and a harbourer of beliefs different from yours. Your shit is actually dangerous, I believe, and unhelpful. I can only hope few pay attention to it.
The 0.5% annual decline in well productivity statement you made is flat ass wrong. 100%. When using six month metrics for determining well productivity, 18 months is sufficient. Lots of people think so. If you understood what you were attempting to analyze, even remotely, you would get it.
Oil is not a game of statistical trendology. You must truly understand what it is your trying to analyze to be relevant.
If you don’t like what Ted Cross and Novi believe about their TRRC data, take it up with him/them. Then Enverus and so on and so on. Get your stuff out there, let others pick it apart. They will tear you apart.
Or just stay here, and be a one eyed Jack. Where you are safe, and a handful of people believe you. That’s probably best.
Mike,
Yes it might be 1% rather than 0.5 %.
People say stuff to get headlines, I just report what I find based on data.
If you want to use IP180, here is normalized 6 month cumulative output to the average length of a Permian well completed in 2016 for 2016 to 2021 wells (2016, 2017, …, 2021)
77
78
79
81
82
86
The average lateral lengths from 2016 to 2021 in feet are:
6914
7412
7944
8614
9051
9346
Data for 6 month cumulative from
https://novilabs.com/blog/permian-update-through-april-2023/
For lateral length I used
https://www.eia.gov/todayinenergy/detail.php?id=54079
I still think it is too early to judge 2022 and 2023 wells based on data I have available. The preliminary data suggests a 9% drop in 6 month cumulative output normalized for lateral length in 2022, to just below the level of 2016, 0.5% less than the average 2016 well. Note that 6 month cumulative gives a very different result from using a hyperbolic and exponential terminal decline to estimate EUR as I do in my analysis.
Yes my analysis is very dangerous, some believe my estimates are much too high (you for example) and others such as Coffeeguyzz and Texastea believe my estimates are far too low. In the past they have mostly been too low, perhaps this will change in the future. My guess is the estimates are roughly correct, time will tell.
For my well profiles Novi, my model (kbo),month
2013, 142.5, 140 at month 108
2014, 172.9, 171.5 at month 96
2015, 217.4, 228.5 at month 84
2016, 278, 276 at month 72
2017, 277, 273 at month 60
2018, 268, 267 at month 48
2019, 257, 258 at month 36
2020, 236, 236 at month 24
2021, 199, 199 at month 15
My estimates for EUR of average Permian wells by year based on Novilabs data (these are not normalized for lateral length) from 2016 to 2021 in thousands of barrels of oil (NGL and natural gas are excluded from these EUR estimates).
362
379
404
441
446
472
I assume the wells are shut in when output reaches 15 bo/d or less, when average annual decline rate reaches 12.5%, it is assumed any future decline is at an exponential rate of 12.5% per year.
Coffeeguyzz,
If natural gas rises to $6/MCF, then natural gas will quickly be replaced by cheaper wind and solar for electricity production and by heat pumps for space and water heating so demand for natural gas may wane and the price of natural gas will decrease. Oil demand will also likely decrease as electric transport replaces ICEV transport so oil prices might rise temporarily to $100/bo or more, but by 2030 to 2035 oil prices will decrease with waning oil demand and expensive tight oil, oil sands, Arctic oil, and many offshore oil prospects will no longer be profitable to develop.
The same will be true for much of the shale gas resource as natural gas prices decrease and a lot of associated conventional gas may also be left in the ground as oil production wanes.
Assumptions of high future oil and natural gas prices beyond 2035 are likely to prove incorrect.
There may be a lot of oil and gas resources that are never produced because their production would no longer be profitable at market prices.
Dennis (head in the sand ) Coyne, says “If natural gas rises to $6/MCF, then natural gas will quickly be replaced by cheaper wind and solar for electricity production and by heat pumps for space and water heating so demand for natural gas may wane and the price of natural gas will decrease. Oil demand will also likely decrease as electric transport replaces ICEV transport so oil prices might rise temporarily to $100/bo or more, but by 2030 to 2035 oil prices will decrease with waning oil demand and expensive tight oil, oil sands, Arctic oil, and many offshore oil prospects will no longer be profitable to develop.” As I recall you were claiming wind and solar would replace coal, well not so much, actual not at all. But why quibble?
my retort is, Dennis you have been reading from the same script for a decade despite the fact that this actual data constantly proves you wrong. Here is Rapier doing what he does best, sticking to the facts and drawing LOGICAL conclusions.
https://oilprice.com/Energy/Coal/Coal-Use-In-Europe-Rises-In-Shocking-Reversal.html
“The net result was a global increase in coal consumption to the second-highest level on record, only 0.01% below the record level set in 2014. Essentially, despite all the world’s efforts to reduce carbon dioxide emissions, coal consumption is as high as it has ever been.”
Your analysis also complety ignores the dramatic cost increase the ” green energy” industry is experiencing. (as predicted by me months ago)They ain’t cheaper than anything or they would not need government to underwrite it. The offshore whale wacker industry is going belly up and companies are abandoning projects around the world or going are going hat in hand to governments for bailouts. We are told that you are an educated person so that leaves lack of idle curiosity or the deliberate and willful turning your head away from the facts as they exist.
There is NO freakin way this country or any can rebuild its transportation fleet and at the same time rebuild its energy infrastructure in a less than decade, IT IS NOT GOING TO HAPPEN. NOT EVEN CLOSE.
“The same will be true for much of the shale gas resource as natural gas prices decrease and a lot of associated conventional gas may also be left in the ground as oil production wanes.”
This statement shows suck a lack of understanding as to be almost childish, perhaps fantasy. I don’t know how much longer the facade of a green energy transition can stand even in the advanced industrial countries, but what I do know is those countries that have to spend real Dollars as apposed to printing them, will continue to use coal, nat gas and oil for as long as any is available. To the point that many have, are and will subsidize the cost to their citizens.
Rabier will look at nuclear trends in his next article I wonder what he will find😉I hope he looks into how much oil and gas reserves we will be able to capture once the polar ice caps finally melt after that.
last pass, if one want to be taken serious, they should leave the cue cards at home.
Texastea,
Yes Coal consumption increased as natural gas prices soared in recent years. World consumption of fossil fuels increased by 6 EJ from 2018 to 2022 while primary energy consumption increased by 23 EJ over the same period, in other words only 26% of the increase in World energy consumption came from fossil fuel with the other 74% of the increase for the 2018-2022 period coming from non-fossil fuel, with 63.5% of the increase in energy consumption consisting of wind and solar energy.
I do not think there will be no use of oil and natural gas by 2035, simply that demand for these fuels will fall below supply which will drive prices for oil and natural gas lower.
Time will tell which of us has their head in the sand, you will find it is not me before long.
As to subsidies, the lack of pollution control on automobiles for many years and the buildout of a national highway system at little cost to the oil industry are examples of subsidies that have long been provided to the fossil fuel industry.
If the US would pass a bill taxing carbon emissions, the need for subsidies for wind, solar, and EVs would be eliminated, this is another example of pollution by fossil fuels that should be taxed.
The US and many nations refuse to implement such a tax due to the inability of politicians and citizens like you not being able to think long term.
Texastea,
World coal consumption in exajoules from Statistical Review of World Energy. I expect we will see this decrease over the next 20 years. It has been pretty flat from 2011 to 2022.
Well said, Dennis!
a good of explanation for energy fantasy statements that I have seen…wishful thinking will lead to better outcomes…alas that is not how the world works but I was really looking for an answer. short cnbc video. also mentions New Englands energy dilemma burning wood and oil because of politics.
https://twitter.com/staunovo/status/1701867957935083548
Despite the way with statistics from Dennis, the reality between 2018 and 2022, was that wind and solar increased by 1,582Twh in total for that 4 year period, while fossil fuel use increased by 1,681Twh.
What I’ll find interesting is the rate of growth in renewables when overall FF use declines. My suspicion is that the growth rate in renewables will crash as the prices of renewables will rise a lot due to increased costs of their manufacture. They totally rely on FF for their mining, processing, transport, manufacture and erection. In this country (Australia) solar is much more expensive than it was 3 years ago, and large scale projects have all but dried up for the future, as the price of electricity on the wholesale market has gone negative during the middle of the day for most of the year when it’s windy.
The above numbers for the world energy increases came from Our World in Data..
https://ourworldindata.org/grapher/global-primary-energy?time=2006..latest
A dose of wind reality from Abhi Rajendran
“The industry is falling apart. So govt tries to throw more money at it which will have to be offset with more taxes
What a business model”
Trying to replicate this type of behavior in the US is a total joke #netzero
Quote
Tracy (𝒞𝒽𝒾 )
@chigrl
·
4h
EU’s von der Leyen pledges more support for wind industry
The European Union will put forward a package of measures to support Europe’s wind power industry as renewable energy companies struggle with challenges including inflation, European Commission President Ursula von der… Show more
https://twitter.com/ARaj_Energy/status/1701952347658707314
Hideaway,
I am looking at total energy use and the increase in that use from 2018 to 2022, data from link below
https://www.energyinst.org/statistical-review
2018 world primary energy consumption=581 EJ
2022 world primary energy consumption=604 EJ
change from 2018 to 2022=604-581=23 EJ
2018 world fossil fuel consumption=488 EJ
2022 world fossil fuel consumption=494 EJ
change from 2018 to 2022=494-488=6 EJ
For non-fossil fuel energy use we have an increase from 2018 to 2022 of 23 minus 6 EJ or
17 EJ or 17/23=74% of the increase in World energy consumption from 2018 to 2022 was from non-fossil fuel consumption.
Check out the data yourself.
Also solar energy consumption increased by 6.93 EJ from 2018 to 2022 and wind energy consumption increased by 7.67 EJ, when combined (6.93 plus 7.67) we get 14.6 EJ of increased consumption of wind and solar energy from 2018 to 2022 or 14.6/23=63.5% of the World increase in energy consumption from 2018 to 2022 was from wind and solar energy.
As to future energy use, we can only speculate. At present wind and solar are cheaper and as fossil fuel depletes and becomes more expensive the relative price of fossil fuel compared to non-fossil fuel energy may continue to increase. Only time will answer that question. What will actually occur in the future is unknown.
This is a mean-spirited heartless remark. A reminder that we have Mr. Rapier in our hearts given the tragedies in his family the last couple of years.
C+C global peak was in Nov 2018.
US Peak was 2019, a second peak likely occurred in August at ~12.5 mb/d…
If a new US peak is even possible, it will likely take another 12-18 months to find out…
Hint:
Global peaK WAS IN NOV 2918
Or maybe Nov 2018.
About US, not for long, considering the latest production data for the main part of Permian production as exposed above.
I’m just dealing with reality, not speculation.
Coffeeguyzz
Thanks. I think you are correct regarding Sandoval being in the San Juan basin. Is there new drilling activity starting there?
Ovi,
I have no clue about upstream activities in that part of the country.
What I do know is if/when Mexican Pacific coast LNG plants start to ramp up in future years, the San Juan Basin and the Piceance may see a surge in activity as they are a relatively close source (along with the Permian) to supply feedgas.
Sandoval oil output may never be large, but it could be interesting to see how/if it develops.
Coffee,
I saw a table showing an overwhelming majority of countries in decline. I googled Brazilian oil production and consumption, their spare capacity is 8% and their economy is growing. Who knows if the projected increases in Brazilian capacity are going to be exported. I doubt Argentina will export their oil or natgas, assuming they could get their act together. The coming declines in shale on top of the worldwide declines might be offset to some extent by production from Guyana, Argentina, Brazil etc., but it wont be enough. Jeffrey Brown’s export land model is something to factor in when thinking about the dynamics that are unfolding.
Perhaps a repost. My apologies if it is.
The case against imminent peak oil demand
https://www.axios.com/2023/08/24/crude-oil-demand
One of the more surprising (startling?) unacknowledged data points regarding North Dakota’s ~1.15 million barrels per day production is that there are only about 33 horizontal rigs currently working there.
This is WAY down from years gone by.
Has anyone seen the Red Queen leaving the building?
Asking for a fren.
Coffee:
I like your optimism. Like you pointed out, there is certainly enough geology to last us forever. Add in politics and that makes geopolitics–which is the worst I’ve seen in my lifetime. How to parse the requiem mass?
The Bakken is a mature field; however, the new wells drilled by the now sold Crescent Point USA team have been magnificent: cost held down, reservoir pressure carefully tended, good economics. The Weld County Niobrara is a mature field, yet the now sold PDC could drill out and complete a 12-well pad in a month’s time and maintain reservoir pressure in limestone. The San Juan Basin, of which you speak also, was developed with total disregard for the land or the people, many of whom are First People–the risk of Sandoval County contaminating the watershed and aquifers all the way to Jemez Springs are, in general, too foul to speak of and not need Listerine. The Eagle Ford itself is mature, but there is a crest of Buda Shale underlying Austin Chalk that curves upward through Madison County and holds a lot of oil. Oklahoma is a low producer, yet Tom Ward is tonning it with the Mississippi Lime, because there is a high helium content to ML NG and helium is scarce. I’m sure the wells in the Marcellus are excellent, but no better than the Haynesville and I can tell you from personal experience that at <$3gas, not many new monster wells in the Louisiana Haynesville pencil out. Tier what? Up in the Bakken the way you control reservoir pressure and spacing is a lot more important than whether land is Tier this or that. The frack lines don't perpetuate nearly as far as was originally thought, so you don't need exceptionally thick shale (just really oil dense), but pressure is a different matter–it equalizes throughout the basin via carbonate imbedding within the shale, slowly moving along seams of strontium carbonate, limestone, or dolomite, depending on where you are.
So, replacement? Well, when the USA gets nervous and worried about supply, and that transmits to the rest of the world, there's going to be one hell of an inelastic skitter in prices. Russian oil is likely to dip astonishingly–due to inadequate parts replacement and technical knowhow (Sakhalin II is being held together by an energy-impoverished Japan). Resting or nesting makes no difference; it is apparent that the giant Ghawar is coning millions of barrels of water into multiple wellbores–and there is no replacement for Ghawar. The pre-salts are, as you know, the most precious of replacement "whales"–gravity just about ideal, free of sulfur and toxins–but they cost a fortune to drill. If we get down to relying on pre-salt production, we're looking at $200 oil.
I love NG. Everywhere something fell over dead, NG results, so it's in a lot of places, but NG moves by pipeline, and right now it is impossible to obtain a permit to build an interstate pipeline. It's even hard to get an LNG train permit. The very people who are beating the daylights out of the cleanest hydrocarbon are the same ones making saints out of Xi's bunch for producing solar panels and EV's manufactured by burning bituminous coal in quantities great enough to overwhelm all the rest of the world's efforts.
I'm trying very hard here to pick up on your optimism. So far I'm just not feeling it. For example, why, you asked, are there no more rigs in the Bakken. Well, as above, the dear old basin is long in the tooth, but really, the data storage centers–think the "Cloud"–are pirating the software engineers. More money, no more cold ND winters, job security. Nobody is considering the fact that Bloomberg says that by the end of this decade data centers will be consuming 10% of the electricity. And everyone fled from the Bakken to the Permian–it's a much larger pond, even if the wells aren't as good. Want money to drill? Say Permian.
I'll go work on my attitude. Seems like a bifurcated world out there to me. And winter's coming.
Possibly the largest Lithium deposit in the world found in Nevada. This would be a great thing for the US if it pans out.
https://cleantechnica.com/2023/09/10/lithium-deposit-in-extinct-nevada-volcano-could-be-largest-in-the-world/
Dennis
I am trying to track down the reason for the difference between the DPR and LTO production data. I still think the problem lies with the Spraberry LTO data.
Below is another look at the effect of the Spraberry formation on Permian LTO production.
– The blue graph shows Permian LTO production W/O Spraberry. It is essentially flat since July 2022.
– Wolfcamp plus Bonespring is also flat from July 2022.
– Spraberry is shown by itself and that is the source of all the recent growth in LTO production.
The next chart compares Spraberry LTO production vs production from the 5 main Spraberry counties according to NoviLabs and the Texas RRC. Note the Texas RRC data is updated to June vs April for Novilabs.
I wonder if there is some way of checking with the EIA LTO office and asking what they have to say regarding their confidence in the Spraberry LTO production.
Ovi,
Not sure where the Permian w/o Spraberry data comes from? Perhaps an error in spreadsheet?
As I have mentioned before, the 5 main Spraberry counties also produce considerable quantities of oil from both the Wolfcamp formation and also conventional oil wells, also RRC data beyond September 2022 is incomplete.
It may be that both Wolfcamp and conventional output in those counties has been decreasing while output in other counties in Texas and New Mexico have been increasing.
It is also possible the EIA estimate is incorrect. Note that the Novilabs data is based on Texas RRC and New Mexico State output data, but older data from June 2023, so not as up to date.
Dennis
The LTO Permian data minus Spraberry is all LTO data. Sum all the columns and subtract the Spraberry column.
Almost impossible to make an error with such a simple calculation.
Ovi,
Permian data is Spraberry plus Wolfcamp plus Bonespring, Permian w/o Spraberry is equal to Bonespring plus Wolfcamp. Novi labs has following:
https://public.tableau.com/shared/BQ2DNMBHR?:toolbar=n&:display_count=n&:origin=viz_share_link&:embed=y
Output in July 2022 was 4061 kb/d for Permian w/o Spraberry.
Maybe you were using Permian DPR data, I thought you were using official EIA tight oil data.
The calculation you made is US tight oil data w/o Spraberry, if I am understanding correctly. See chart below.
Spraberry LTO production vs production from the 5 main Spraberry counties according to NoviLabs and the Texas RRC.
Ovi,
Novilabs data for Spraberry at link below
https://public.tableau.com/shared/GMG39BPJC?:toolbar=n&:display_count=n&:origin=viz_share_link&:embed=y
The difference between the Novilabs data and EIA data is that Novilabs only presents output from horizontal tight oil wells, the EIA data also includes output from vertical tight oil wells.
US tight oil w/o Spraberry tight oil
Same as what I posted. Flat from July 2022 to July 2023.
Ovi,
Yes except you called it Permian w/o Spraberry which is not correct, that was the source of my confusion.
Dennis
Sorry. My Bad. Getting too deep into the weeds.
Attached is a comparison of US Tight oil (LTO) vs US Tight Oil W/O Spraberry.
Ovi,
Yes when looked at in that way most of the increase is from Spraberry, Wolfcamp decreases may have been balanced by Bonespring increases.
Also possible that EIA estimates for Spraberry output are incorrect. I don’t know the correct answer.
Generally PSM is pretty good,
If we assume conventional output is relatively flat for onshore L48 we get can estimate tight oil output.
Permian estimate based on PSM for Texas and New Mexico and assuming EIA official estimate for Eagle Ford is correct. Trend is 787 kb/d annual increase, for Spraberry over same period it is 557 kb/d for EIA official LTO estimate.
Dennis
The issue when output is close to reaching a peak or plateauing is: Where is the more critical information, is it in the past or is it in those last 4 data points which are flat?
Also appreciate that the DPR has a different view on what is happening in the Permian as to whether production is slowing or continuing to grow.
We will get a clue in the next three or four months.
Ovi,
There have been lots of periods where output has been flat for a few months, as to what happens in the future, we will see, I don’t have much faith in DPR projections, I don’t think rig counts give an accurate method for determining future output.
I agree we will know more in a few months.
Also note that th DPR suggests conventional output is rising in recent months in tight oil regions, I doubt that is correct, seems likely that the DPR is wrong for past 6 to 9 months as both PSM and official LTO estimate suggest a different estimate.
Ovi,
Note Permian output for the PSM tight oil estimate from March 2022 to July 2022, output was relatively flat over that period.
To get a better judgment on just how bad the real economy is in places like China. Or really the entire global economy but in particular China.I look to the Japanese yen.
Everybody has at least heard of the the Japanese carry trade. Though most people don’t understand it’s not just 6-7 trillion dollars in Japanese savings we are talking about. It also a massive amount of Japanese bills that large banks have used as collateral to borrow dollars to lend into China and elsewhere.
When the carry trade unwinds. The Yen will appreciate massively. Any uptick in Japanese bill yields will trigger this. If yields start to fall faster in say the US than they do in Japan would also trigger this as everyone will want to lock-in any gains before they evaporate.
Well the dollar liquidity flowing into China has dried up. Which is why understandably China wants to not have to use dollars to buy oil.
But when those Japanese savings start coming home look out. It’s going to be deflationary to the rest of the world. Just watch the Yen. It’s not that it’s a safe haven currency. It’s a low yielding funding currency in a world where everyone else has jacked interest rates up at record pace.
Yen strengthening in the current environment means further deterioration of the global economy and ultimately oil demand.
I should point out the Yen hasn’t yet strengthened a bit against anything yet. But it’s also way over sold against everything setting up the scenario where yen start coming home and deflating the economy.
Supply and demand dynamic versus global macro backdrop. One says higher prices the other says I don’t think so.
Peak Oil Chat
https://www.youtube.com/watch?v=30jpWR5roIk
Opec leaders extend cuts, Iran restores output
Argus estimates Iranian crude output at 3.2mn b/d in August, up from 3.04mn b/d in July, supported by another strong month of exports. Iranian crude exports — almost entirely to China, often indirectly and at market-beating discounts — stood at about 1.3mn b/d in August, according to preliminary Vortexa data.
This is a far cry from the sub-500,000 b/d it was selling for much of 2020 because of the sanctions, and just shy of its post-sanctions high of 1.38mn b/d in July. Iran’s August output equates to an unprecedented 630,000 b/d increase since the start of the year, according to Argus figures, offsetting almost half of the 1.35mn b/d fall in Saudi production over the same period. Should Iran be able to deliver the 3.4mn b/d it is targeting by the end of this month, it would erode further any sense of urgency from the group’s kingpins to bring production back in the immediate future.
Note EIA is reporting Russian May C plus C output is 9,323 kb/d. Argus has July Crude production at 9,480 kb/d. One of these numbers is questionable.
https://www.argusmedia.com/pages/NewsBody.aspx?frame=yes&id=2487641&menu=yes
5% annual oil production decline is here…average annual decline of 3 MB/D for next decade.
2 MB/D average annual decline in 2030s, then 1.5 MB/D average annual decline in 2040s.
URR is 2,500 Gb plus or minus 10%, in 2050, annual production will be somewhere between 10 to 16 Gb (~25 to 45 MB/D). Monthly declines of ~250,000 Bbls.
Conventional crude peaked in 2006, peak including unconventional was ~2018.
Now 17 years post conventional peak, and more than 5 years post cumulative peak.
There will not be a secondary peak to rival 2018, that ship has sailed…
Kengeo,
We will see. Average annual decline from 2018 to 2022 was about 0.8% per year. From 2020 to 2022 annual output increased by about 3% per year. Not clear where the 5% per year decline estimate comes from, but it would suggest 2023 annual average output at 76.2 Mb/d for World C plus C, seems pretty doubtful.
URR is likely at least 2700 Gb and might be as high as 3500 Gb for World C plus C (2022 estimate by Laherrere et al).
Dennis – It’s a simple test to figure out if URR is 3500 Gbbl:
Will world production reach 35 Gbbl in 2025 then decline?
Are proven reserves >2000 Gbbl? (1P is less than 300! 2P less than 500!)
If true, then URR is equal to ~3,500 Gbbl
If true, then year 2024 production will equal ~35 Gbbl
If true, then year 2025 production will equal ~35 Gbbl
If true, then plateau length is ~11 years (~2019 to 2030)
If true, production growth will stop in ~2025
If true, production in 2050 will be 28 Gbbl
Outcome – Rejected; production of 35 Gbbl in 2024 is way too high.
Can run similar test on other URRs, best fit of the data is between 2250 Gbbl and 2750 Gbbl.
Basing URR on proven reserves suggests even 2250 Gbbl may be too high an estimate…
We have never consumed more oil in history than we have today’: Eric Nuttall
One prominent energy investor says the world has never consumed more oil than it currently does, despite narratives of waning demand.
Frugal,
This depend on how one defines “oil”. If we include refinery gains, biofuels and NGLs such as ethane, propane, and butane as the IEA does, then oil output is high.
I define oil as crude plus condensate output. That peaked in 2018 and might be surpassed slightly with a new peak in 2027 or 2028 (only about 1 Mb/d higher than 2018). Demand probably won’t fall below supply until 2033 or so.
Gentlemen, I would once again draw your attention to that destroyer of all models and forecasts: War.
When Chiang Kai-shek was losing the war to Mao Tse-Tung circa 1950, he fled to Taiwan with a lot of Chinese history and artifacts. Chairman Mao vowed to get it back, along with the island.
President Xi’s father was Mao Tse-Tung’s propaganda minister during the time when every sentient Chinese read and carried a copy of “The Little Red Book.” Intrinsic in Chairman Mao’s hundred-year plan was to reclaim Taiwan and Hong Kong and make China whole once again.
Graham Allison has spent his whole adult life studying the likelihood of this at the Kennedy School. His conclusion is that war between America and China is “inevitable.”
China is buying all the gold they can amass. And mining it too. Story has it they’re going to back their digital yuan with gold, to make them the world’s most favorable trading partner. They’re hoarding oil–up to 950 million barrels and climbing. The Spratly Islands are pretty well built up, and they’re close enough to the Taiwan Strait to be strategic. Add to that the fact that 50% of all crude oil and LNG traverses the S. China Sea and the Taiwan Straits.
It would take a blind man to fail to see that China is preparing for war. And it is absolutely going to eclipse everything else. The only model that will work for that is the Monte Carlo theory.
Gerry Maddoux,
Yes a major war would change things, the Chinese may be smart enough to realize that a nuclear war is not a good idea so it would likely be a conventional conflict.
Russia’s experience in Ukraine may give the PRC pause about an invasion of Taiwan, difficult to guess.
Yes war with the Chicoms is inevitable but more due to Xi wanting to write history in other people’s blood. He wants to be seen as the new Yellow Emperor (Huangdi from 2711 BC). The South China Sea will be a kill box for the Chicoms. Also developments in electronics over the last 20 years have favored the defense. Even bus drivers in China now have to waste half an hour a day studying Xi Jinping Thought. China is an open air prison and now they are being tortured as well.
Somebody on Facebook highlighted your failed prediction
https://www.facebook.com/groups/climatechangediscussion/posts/6805821516144693/?comment_id=6806391896087655
Nice job in missing it by that much, and in the wrong direction to boot!
Does anyone know the quality of the oil being used to replenish the SPR?
It has been suggested that using 6 month cumulative production might be an accurate way to assess estimated ultimate recovery for Permian basin wells. The chart below suggests this is not likely to be correct. Chart is based on Novilabs data from
https://novilabs.com/blog/permian-update-through-april-2023/
I also use data from EIA for Permian lateral length from
https://www.eia.gov/todayinenergy/detail.php?id=54079
Anyone have any info on port at Derna? It seems the dam break might have an impact on port facilities.
balanced and reasoned comments regarding energy transition….show the math
https://www.mckinsey.com/industries/oil-and-gas/our-insights/you-need-to-do-the-math-and-then-explain-the-math-a-talk-with-exxonmobils-darren-woods
https://twitter.com/tedcross/status/1701581224861475255
“If rigs are falling, why is oil production rising? We have been getting this question a lot recently, and it’s worth diving into as we consider the supply outlook for US shale.
If you look at the numbers, through April 2023 in the Lower 48 operators brought on an average of 756 wells per month (green bars in the chart), approximately 100 wells per month more than they put on production in 2021. It’s a tad bit lower than 2022 (786), but still relatively high for this cycle.
This is because there is a delay between drilling activity and the production response, as completing and then producing wells takes time. Last week, we showed a ~9 week delay produced a good fit between oil price and horizontal rig counts, but that’s only to drilling, not production!
Third, the COUNT of drilling and completions spreads is key to production growth rates. A decrease in D&C activity will decrease the growth RATE but not necessarily make it negative. If the current levels of 557 horizontal rigs (black line on the chart) are maintained, we show a very modest shale production growth of about 250k bo/d from July ’23 -> July ’24.
Of course, the rig count could go up, down, or sideways. But do keep these points in mind as you think about future supply scenarios!”
“I wrote this about a month ago back in August when everyone was freaking out about rig count declines. Interested to get your thoughts –
You have to evaluate rig count data in the context of today’s E & P world. While still a valuable data point for measuring drilling activity, rig count doesn’t tell the true production story anymore.
Over the last five or so (ish) years efficiency has been the name of the game in the oil & gas industry. This includes exploration efficiencies, drilling efficiencies, extraction efficiencies, and most importantly – capital expenditure efficiencies.
Over the last 5+ years, with the development and implementation of automation software, A.I., and improved drilling methodologies, upstream companies have seen great success getting more flow and greater output with their existing wells.
In other words, E&P companies are flattening the decline curve while increasing flow rates on existing wells. So, while rig counts may be down, that doesn’t mean production is also down, at least not to the extent that rig count data might traditionally point to.”
https://twitter.com/bfrye21/status/1701621128395940149
interesting thread
A new update for May Non-OPEC and World Oil production has been posted.
https://peakoilbarrel.com/may-non-opec-and-world-oil-production/
A new Open Thread Non-Petroleum has been posted.
https://peakoilbarrel.com/open-thread-non-petroleum-sept-13-2023/