By Ovi
Below are a number of Crude plus Condensate (C + C) production charts, usually shortened to “oil”, for Non-OPEC countries. The charts are created from data provided by the EIA’s International Energy Statistics and are updated to May 2023. This is the latest and most detailed world oil production information available. Information from other sources such as OPEC, the STEO and country specific sites such as Russia, Brazil, Norway and China is used to provide a short term outlook for future output and direction for a few of these countries and the world. The US report has an expanded view beyond production by adding rig and frac spread charts.
Where STEO data was used, the ratio of C + C to All Liquids was calculated. The average for the last eight months was used to project the June and July production numbers in a few cases.
World oil production and projection charts are presented at the end of this post.
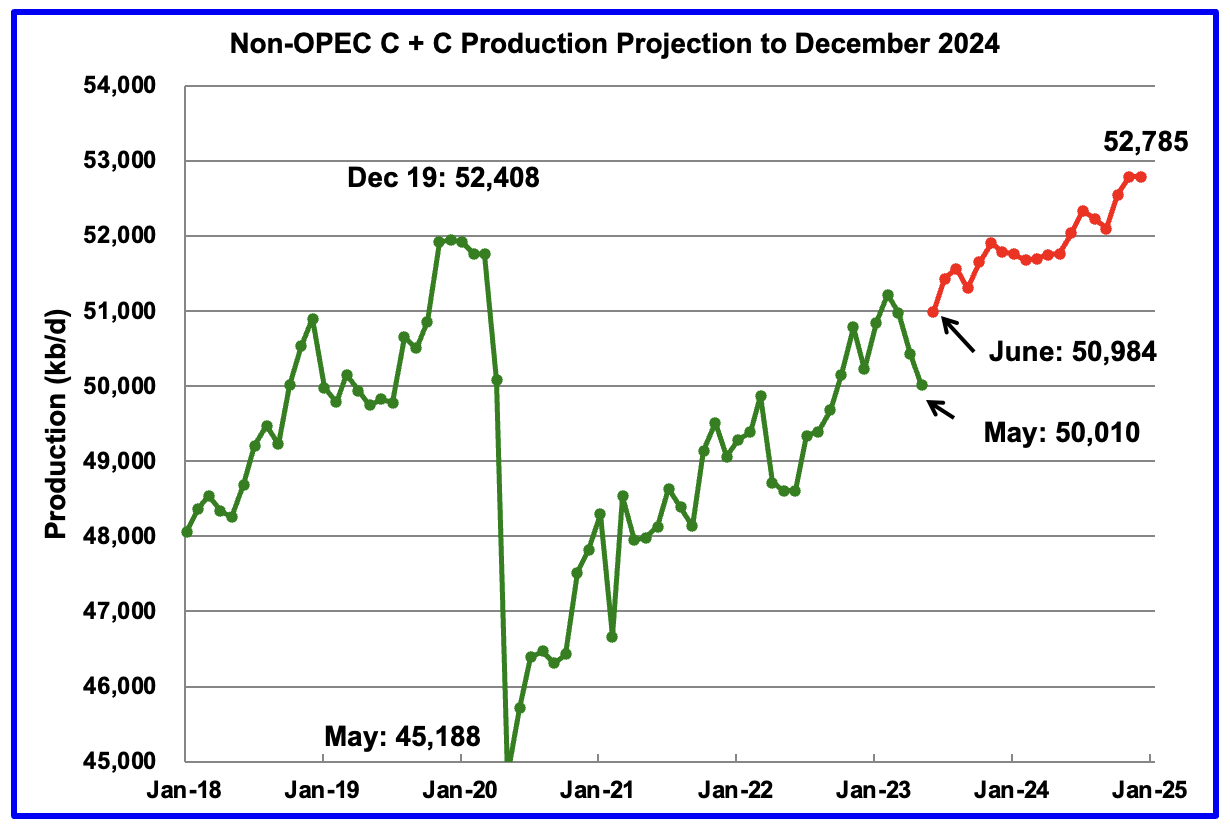
May Non-OPEC oil production dropped by 412 kb/d to 50,010 kb/d. The largest decreases came from Canada 118 kb/d and Russia 193 kb/d.
Using production data from the September 2023 STEO, a projection for Non-OPEC oil output was made for the period June 2023 to December 2024. (Red graph). Output is expected to reach 52,785 kb/d in December 2024, which is 377 kb/d higher than the December 2019 peak of 52,408 kb/d. It is also 410 kb/d lower than projected in the previous Non-OPEC post because the EIA made a significant reduction/revision to Russian output back to January 2018.
From June 2023 to December 2024, oil production in Non-OPEC countries is expected to increase by 1,801 kb/d, a seemingly unrealistic forecast. According to the STEO, the major contributors to the increase are expected to be the US, close to 600 kb/d and Canada close to 800 kb/d, both estimates considered to be on the high side.
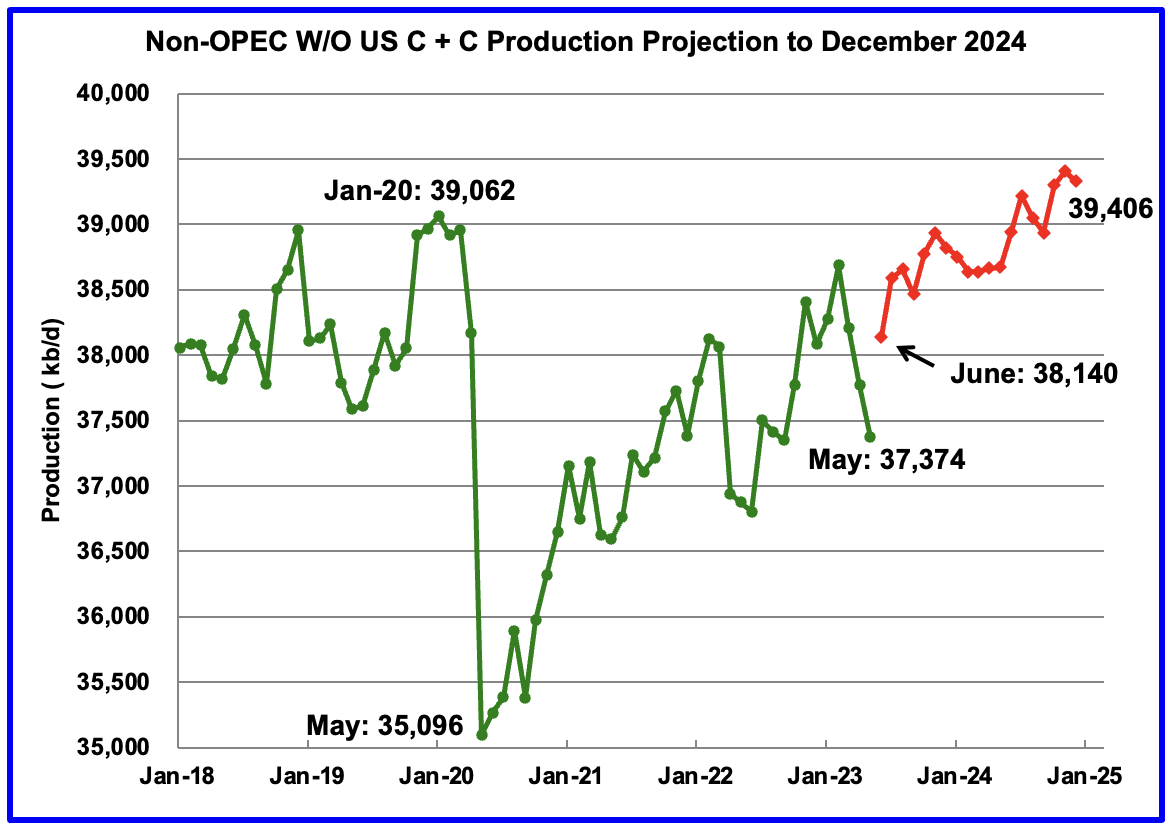
May Non-OPEC W/O US production dropped by 398 kb/d to 37,374 kb/d. June 2023 production is projected to increase by 766 kb/d. Major contributors will be Canada and Brazil. See associated charts below.
From June 2023 to December 2024, production in Non-OPEC countries W/O the US is expected to increase by 1,266 kb/d.
Note that December 2024 output exceeds the pre-covid high of 39,062 kb/d in January 2020 by 344 kb/d.
Non-OPEC Oil Production Ranked by Country
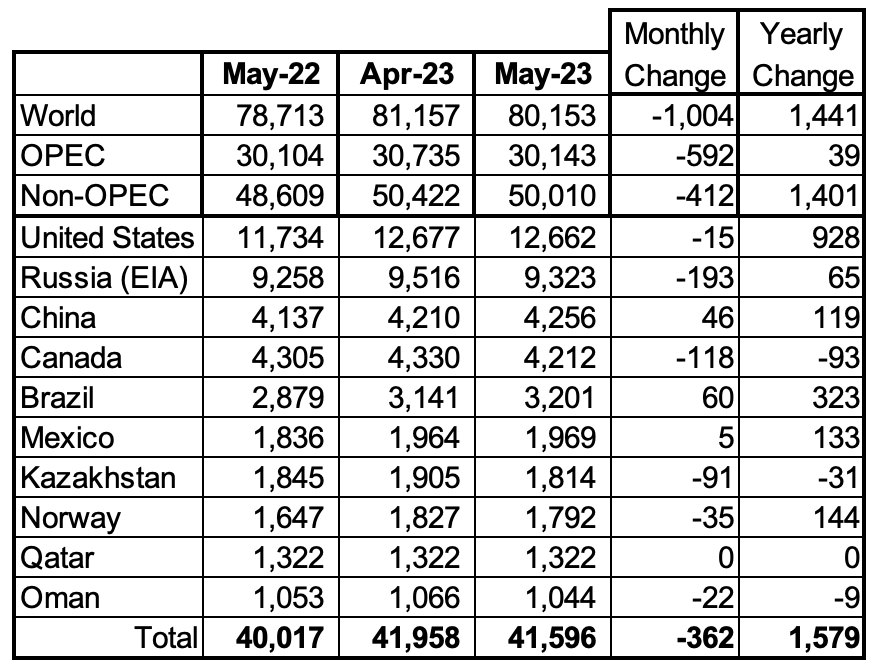
Listed above are the World’s 10 largest Non-OPEC producers. The criteria for inclusion in the table is that all of the countries produce more than 1,000 kb/d.
May’s production drop for these ten Non-OPEC countries was 362 kb/d while as a whole the Non-OPEC countries saw a production decrease of 412 kb/d.
In May 2023, these 10 countries produced 83.2% of Non-OPEC oil production.
OPEC’s C + C production decreased by 592 kb/d in May while YoY it increased by 39 kb/d. World MoM production decreased by 1,004 kb/d while YoY output increased by 1,441 kb/d.
Non-OPEC Oil Production Charts
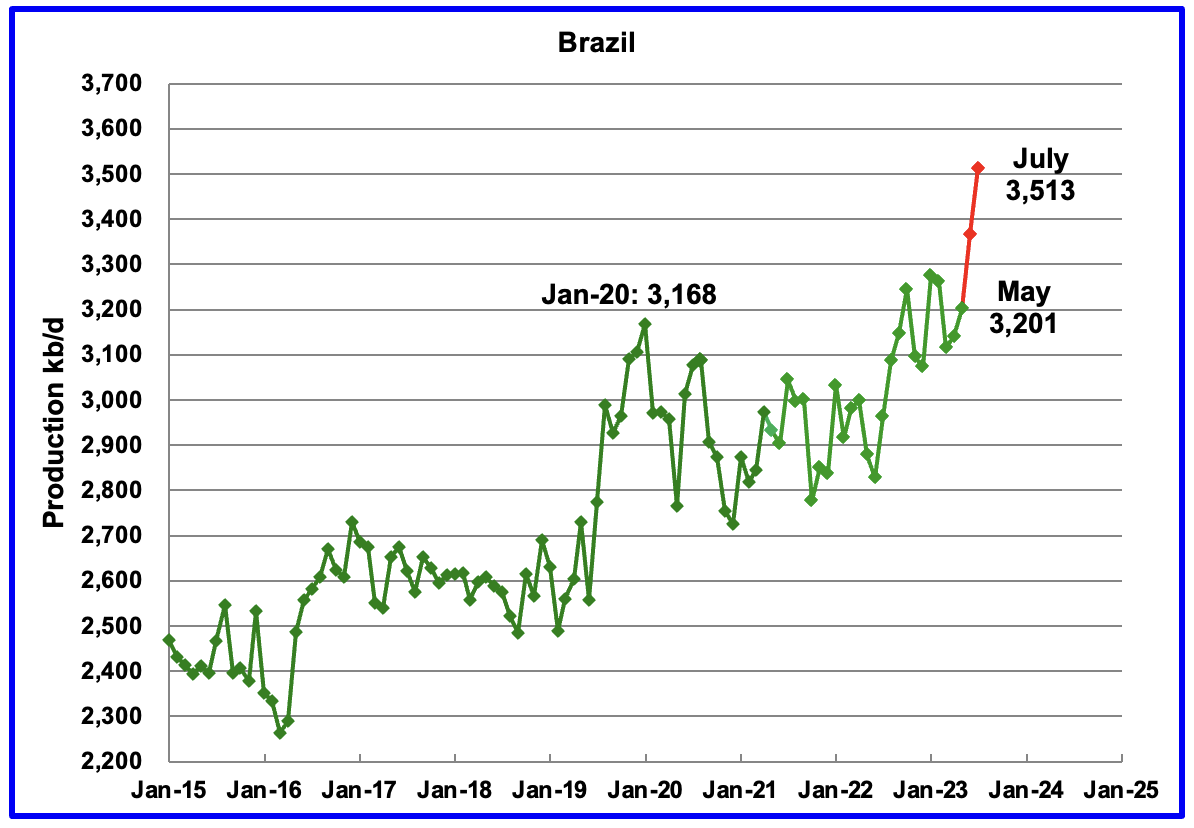
The EIA reported that Brazil’s May production increased by 60 kb/d to 3,201 kb/d.
Brazil’s National Petroleum Association (BNPA) reported that output in June and July increased to a new record high. July increased by 146 kb/d to 3,513 kb/d mainly due to new project start-ups in the Pre-Salt layer, red markers.
According to the September MOMR: “Recent monthly growth is attributed to two new FPSOs, which started production in May. This includes Anna Nery, installed at the Marlim complex in the offshore Campos Basin, and Almirante Barroso in the Buzios subsalt field. M-o-M recovery in Tupi and some post-salt fields also improved Brazil’s performance. Overall, crude oil output is expected to be supported by offshore start-ups announced since the beginning of the year.”
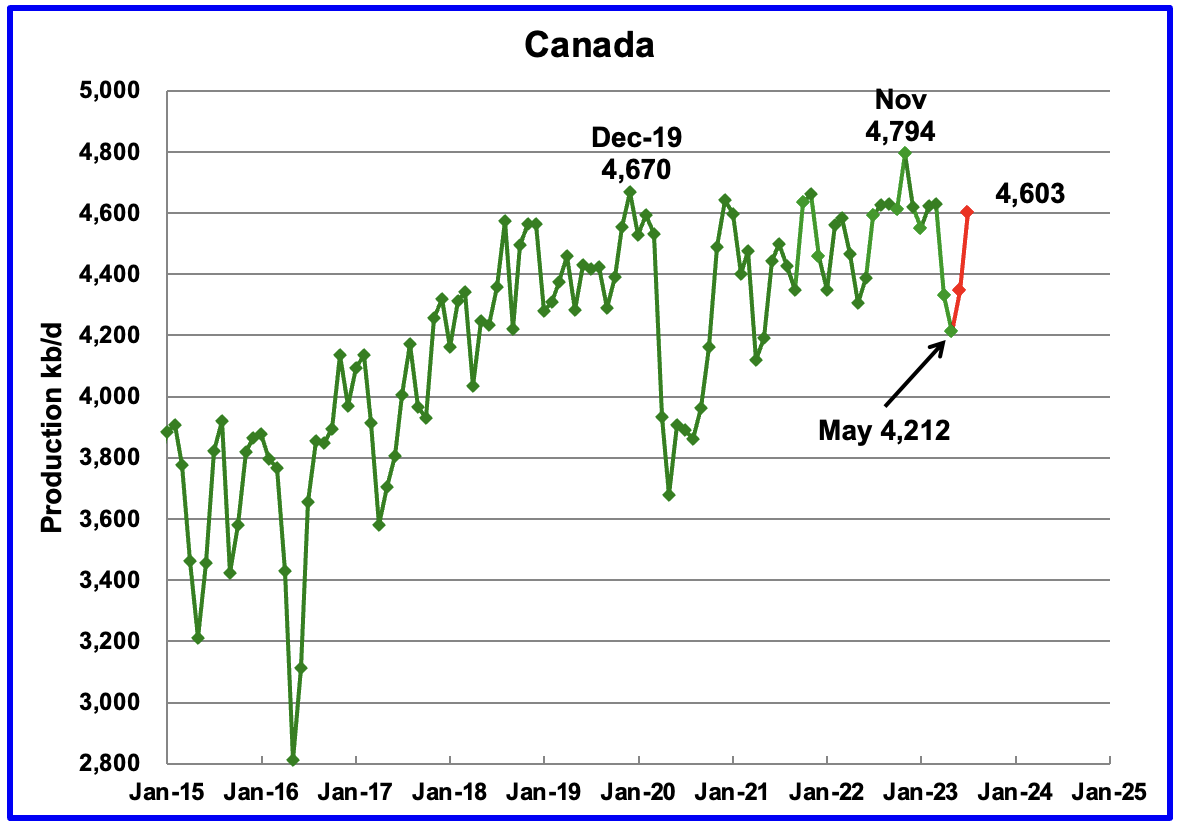
According to the EIA, Canada’s production declined by 118 kb/d in May to 4,212 kb/d. The April and May drops to 4,212 kb/d were due to significant maintenance at the oil sands mines and upgraders. The STEO is forecasting a production rebound of 391 kb/d from May to 4,603 kb/d in July.
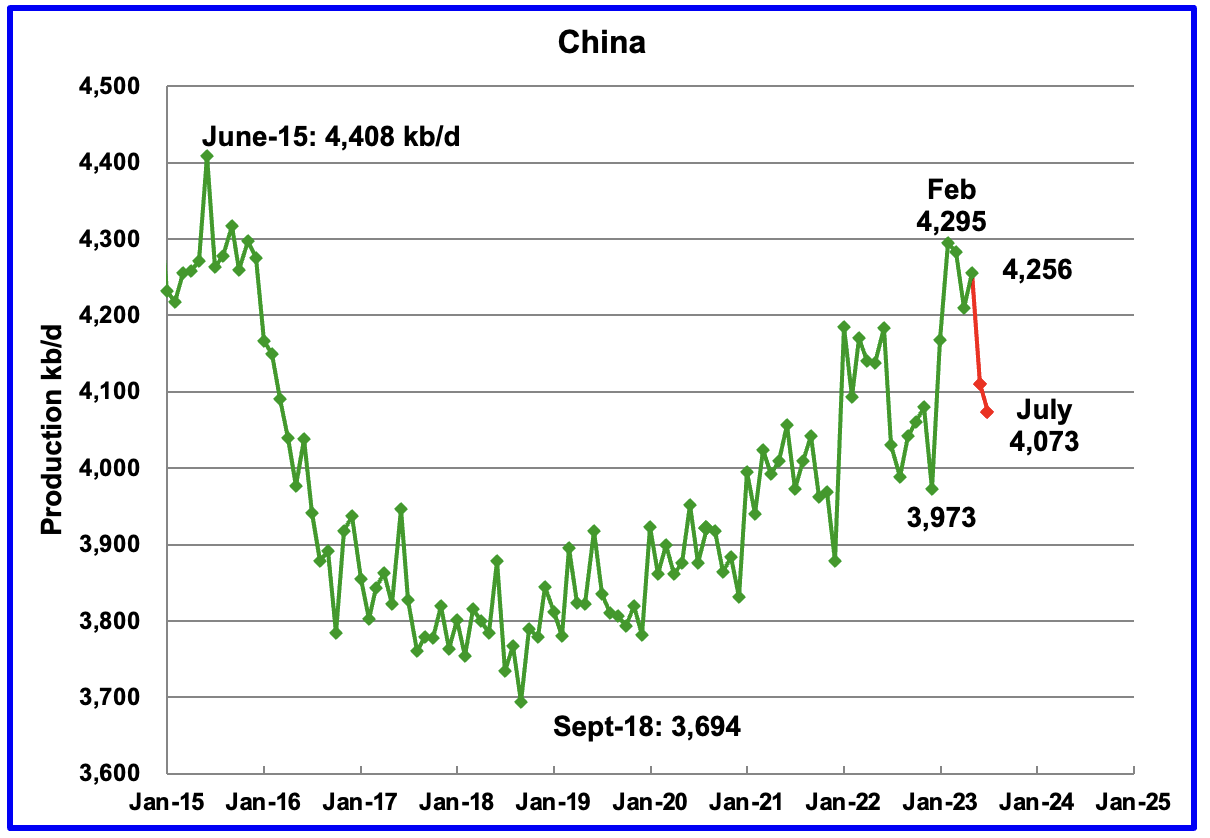
The EIA reported China oil output in May increased by 46 kb/d to 4,256 kb/d.
The China National Bureau of Statistics reported that production during June dropped by 146 kb/d and dropped a further 37 kb/d in July to 4,073 kb/d.
While China’s production growth has risen steady since 2018, it may be approaching its post pandemic high.
Every January for the last four years, China’s production has taken a massive jump. In January 2022, production climbed by 307 kb/d to 4,185 kb/d. In 2023, production jumped in both January and February by 322 kb/d to a new high of 4,295 kb/d. Production then drops after these big increases. Are the production jumps associated with new wells being brought online and why in winter?
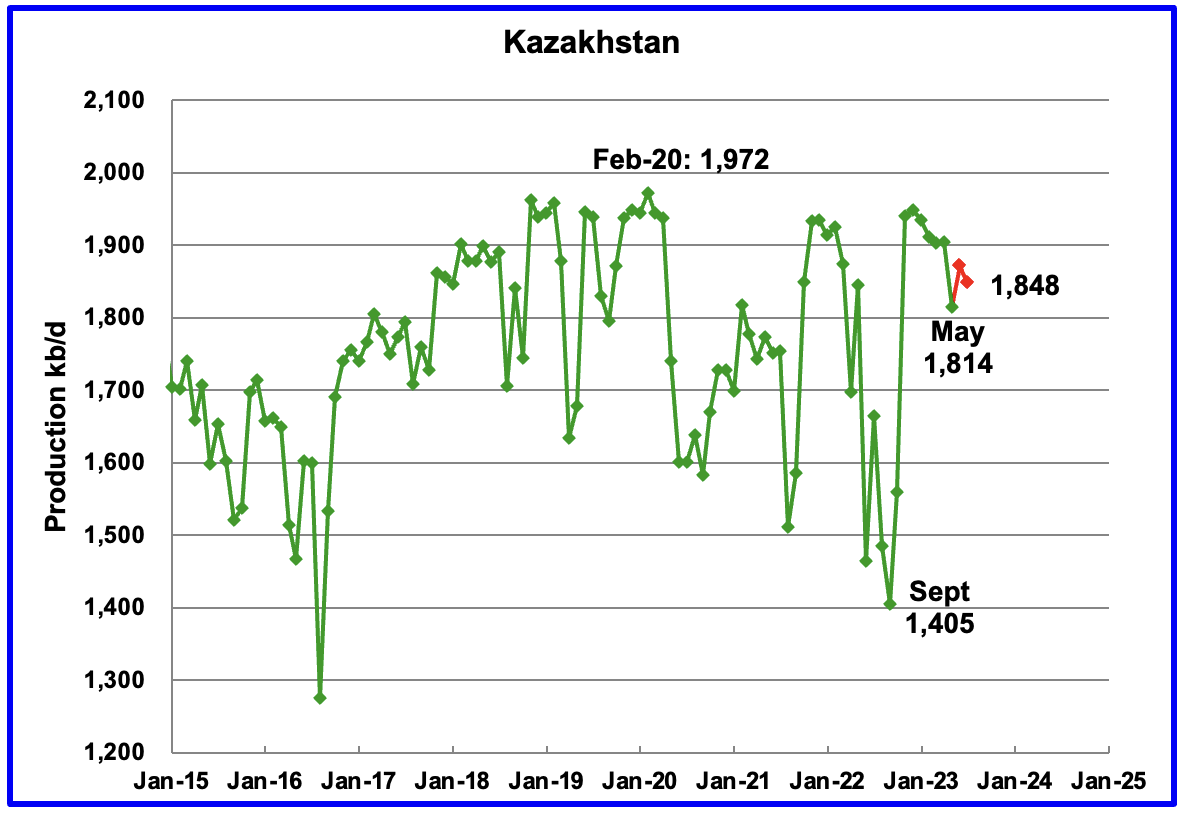
According to the EIA, Kazakhstan’s output decreased by 91 kb/d in May to 1,814 kb/d. The STEO is forecasting a production increase in June and then a drop to 1,848 kb/d in July.
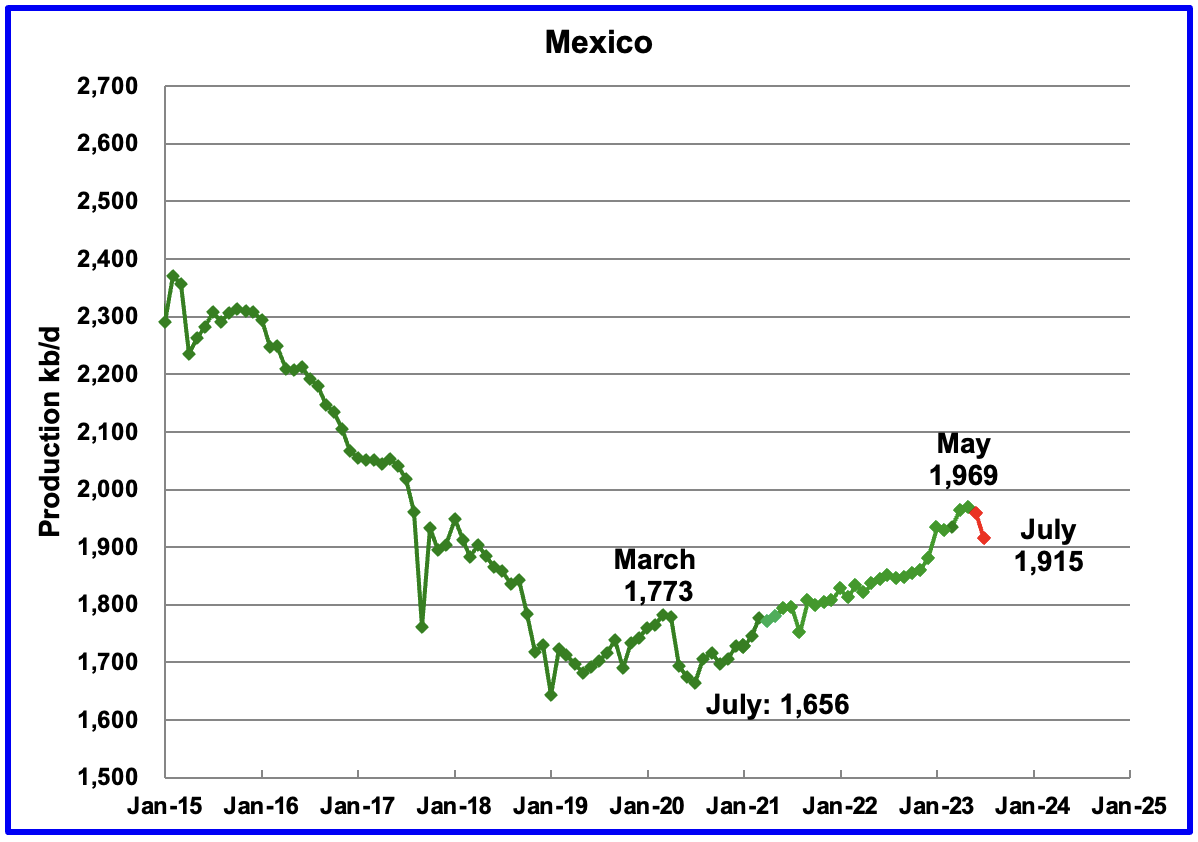
Mexico’s production in May was 1,969 kb/d an increase of 5 kb/d over April. Output dropped to 1,915 kb/d in July according to Pemex.
Mexico has recently revised its definition of condensate. This has resulted in the EIA adding an extra 60 kb/d, on average, to the Pemex report. The red markers include the additional 60 kb/d.
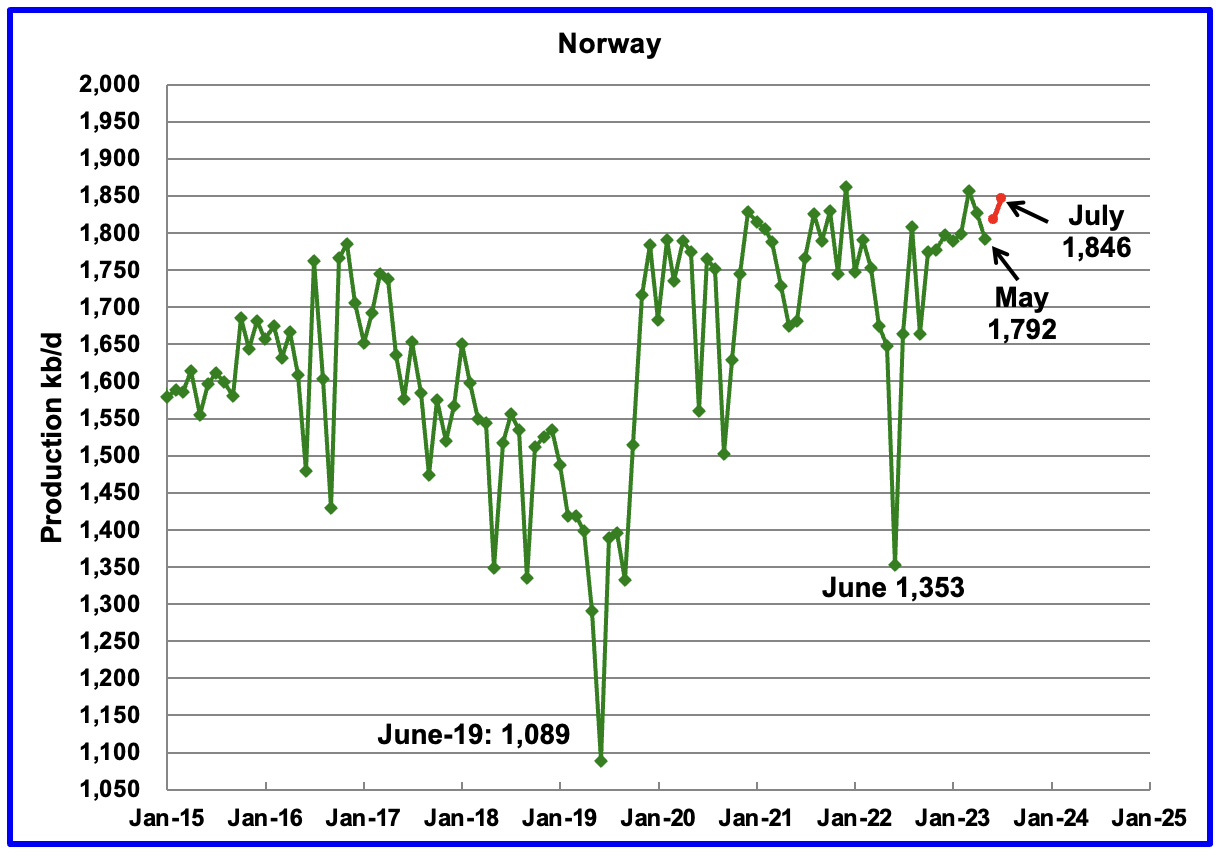
The EIA reported Norway’s May production to be 1,792 kb/d. The Norway Petroleum Directorate (NPD) reported that June’s production rebounded to 1,818 kb/d and then to 1,846 kb/d in July. (Red markers).
According to the NPD : “Oil production in July was 0.6 percent less than the NPD’s forecast and 0.4 percent lower than the forecast so far this year.”
According to this source: “The North Sea’s biggest oil field Johan Sverdrup now has the capacity to produce as much as 755,000 b/d of crude.” Current production of close to 1,850 kb/d appears to be close to Norway’s oil production peak.
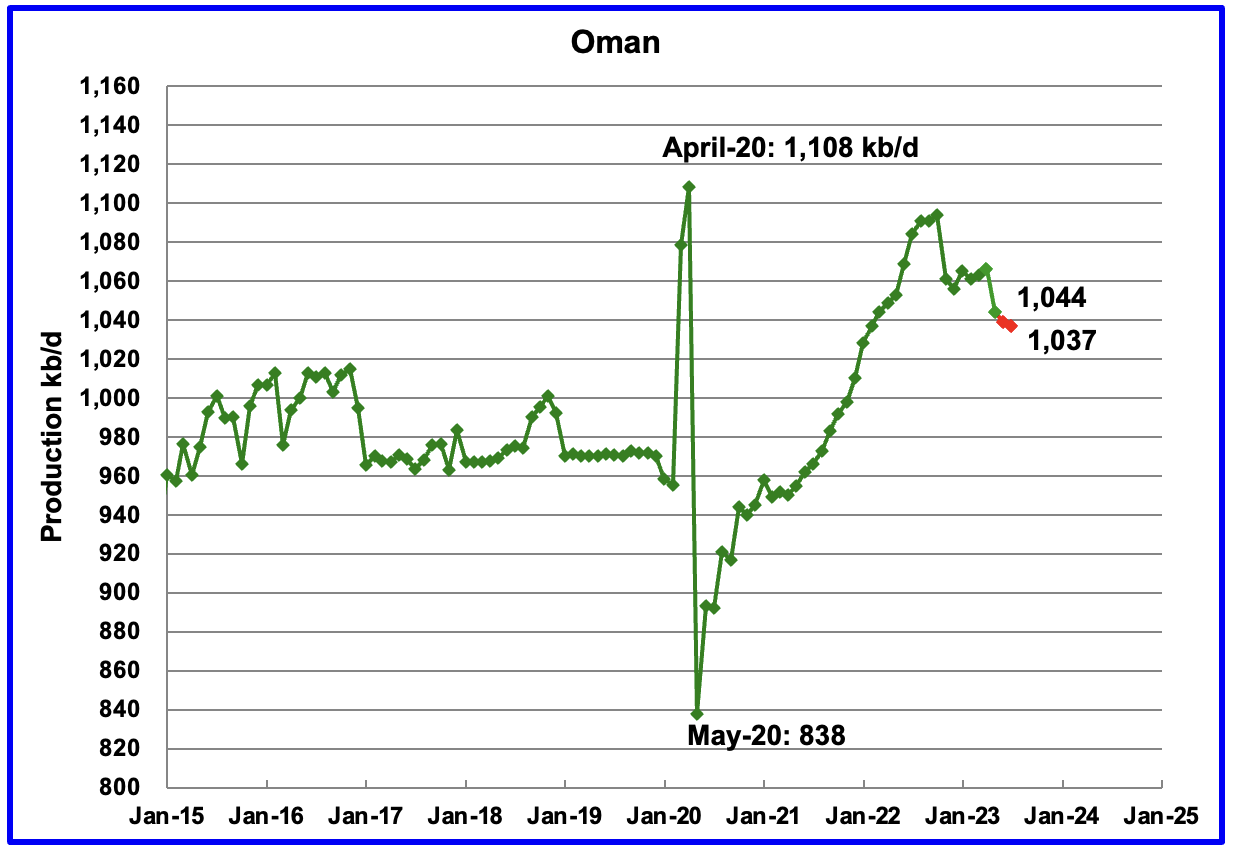
Oman’s production has risen very consistently since the low of May 2020. However production began to drop in October 2022. Oman’s May output dropped by 22 kb/d to 1,044. The STEO indicates that production will continue to drop. July production is expected to drop to 1,037 kb/d.
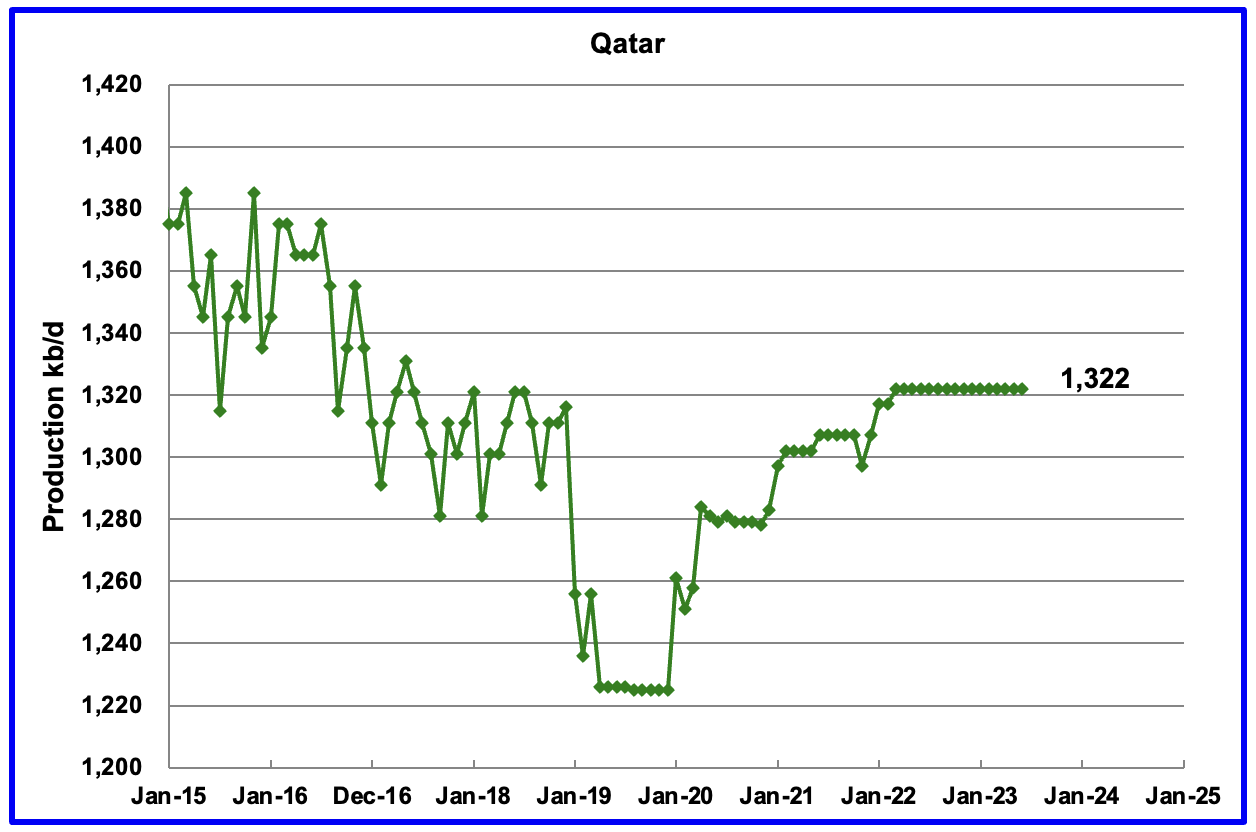
Qatar’s May output was unchanged at 1,322 kb/d, possibly due to lack of updated information.
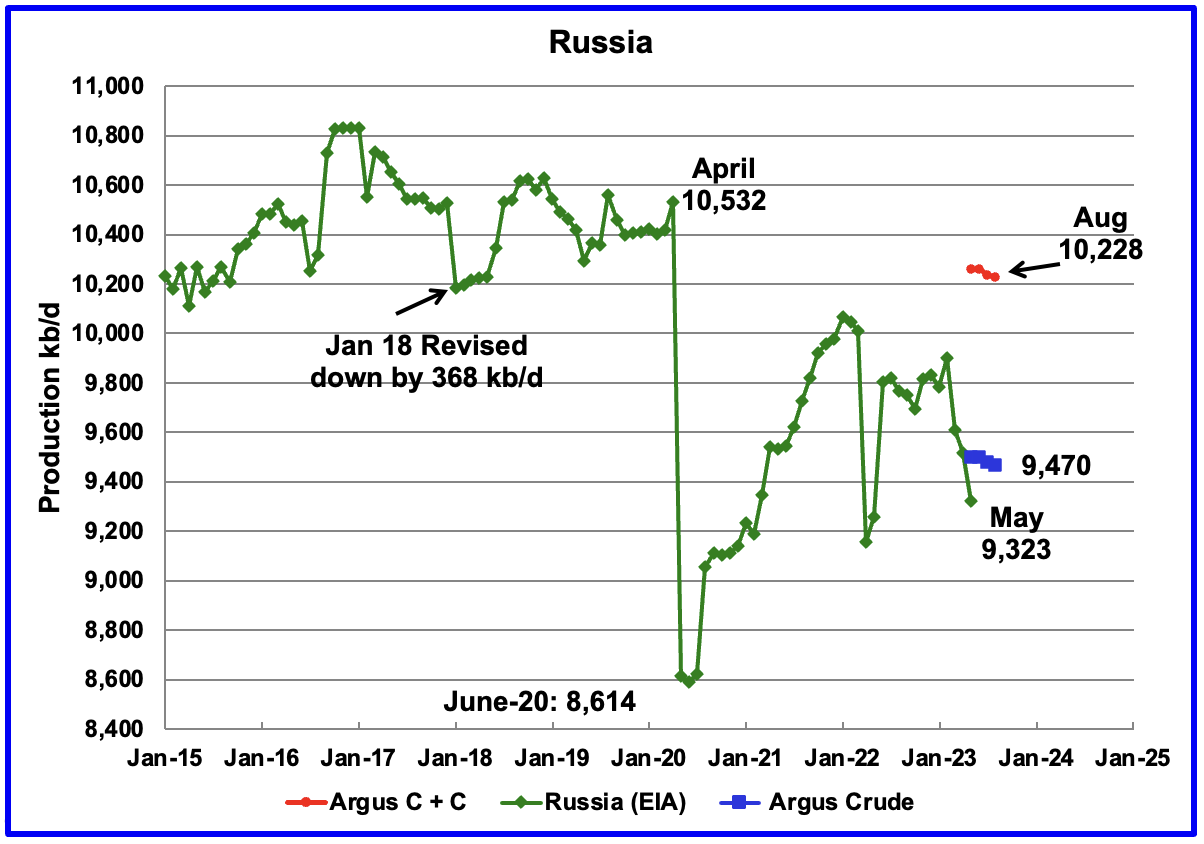
The EIA reported Russia’s May C + C production dropped by 193 kb/d to 9,323 kb/d. This drop does not reflect the 368 kb/d significant reduction/revision made to Russian output in January 2018 shown in the chart.
Using data from Argus Media, Russian production was estimated from April to August. For August, Argus reported that Russian production of crude was 9,470 kb/d, blue markers. May production is available here. Using information from this S & P Global article, Russian condensate production is close to 8% of crude production. Adding 8% to August crude results in C + C production of 10,228 kb/d, red markers.
Clearly there is a major discrepancy between the EIA’s C + C production and other sources which just report Crude. See next table.
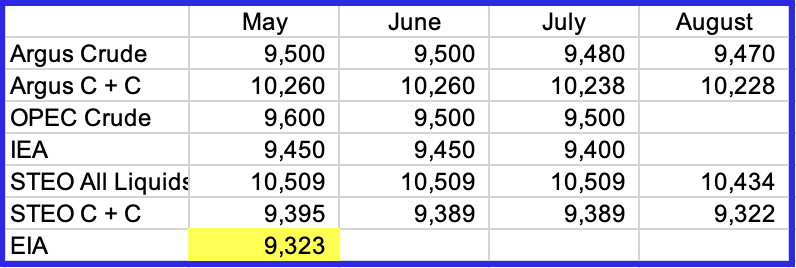
This table shows the significant difference between the latest Russian C + C production reported by EIA compared to many other sources. The EIA reports C + C. However by reviewing the data in this table, it appears the EIA’s latest Russian production is closer to crude.
The Argus C + C row is Argus Crude multiplied by 1.08 as noted above. The OPEC crude data is taken from the OPEC MOMR. The just released September MOMR makes the following statement: “Russia’s liquids production in July fell by around 30 tb/d m-o-m to average 10.8 mb/d. This includes 9.5 mb/d of crude oil and 1.2 mb/d of NGLs and condensate.“
Crude production as reported by the IEA and OPEC are very similar.
STEO all liquids production is taken from the current September report. STEO C + C uses the ratio of past EIA C + C production for Russia with the STEO all liquids data. The current average ratio over the past eight months is 0.8934.
Looking at the latest EIA production data for May, it is more closely aligned with the Crude information from other sources than C + C as inferred from the Argus data. It will be interesting to see if there is a correction to the EIA data in the June report.
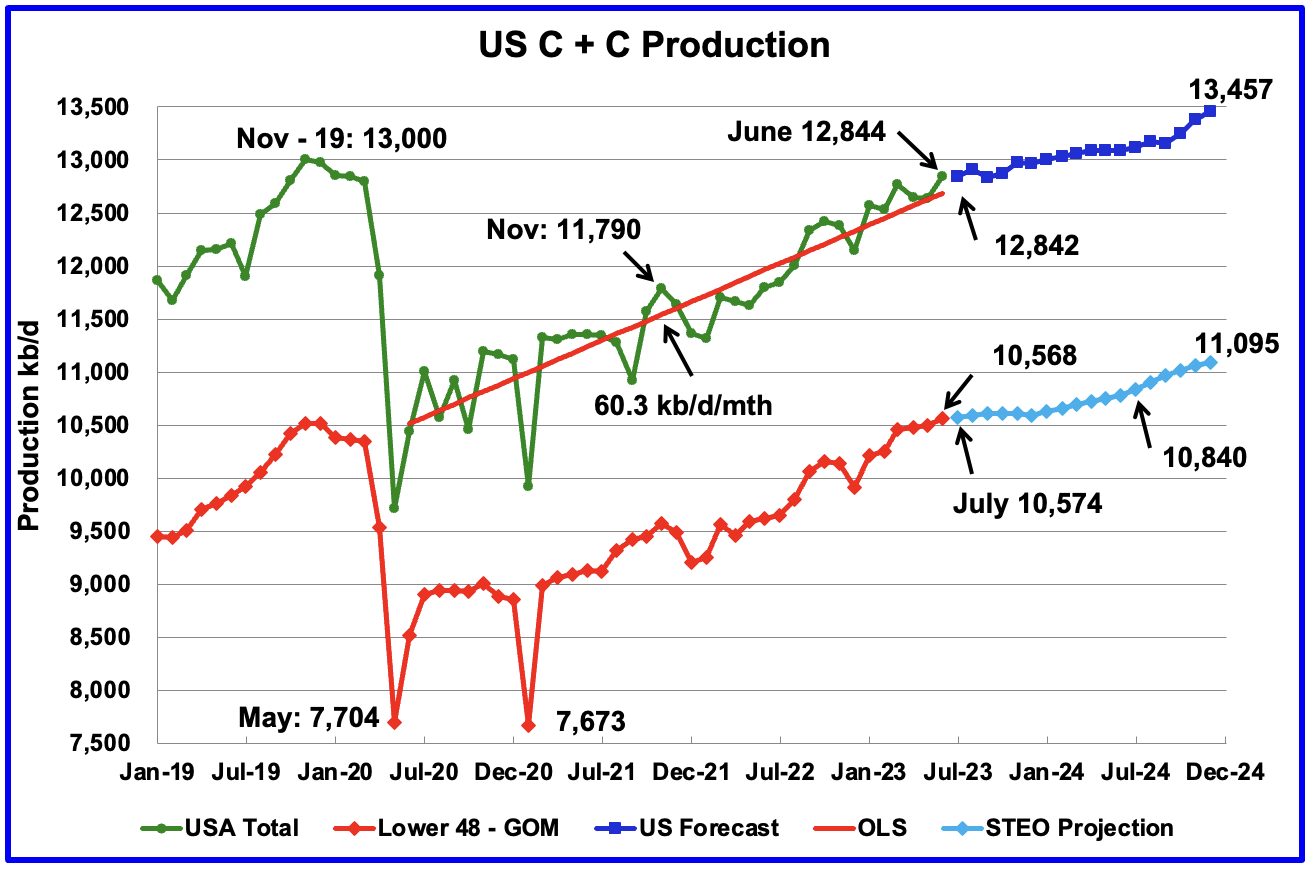
U.S. June oil production increased by 207 kb/d to 12,844 kb/d. The large increase is primarily due to a 147 kb/d increase in the GOM.
The dark blue graph, taken from the September 2023 STEO, which has been updated since the last post, is the forecast for U.S. oil production from July 2023 to December 2024. Output for December 2024 is expected to be 13,457 kb/d, which is 98 kb/d higher than posted in the September US post.
For both the US and the Onshore L48, little change is production is expected in July.
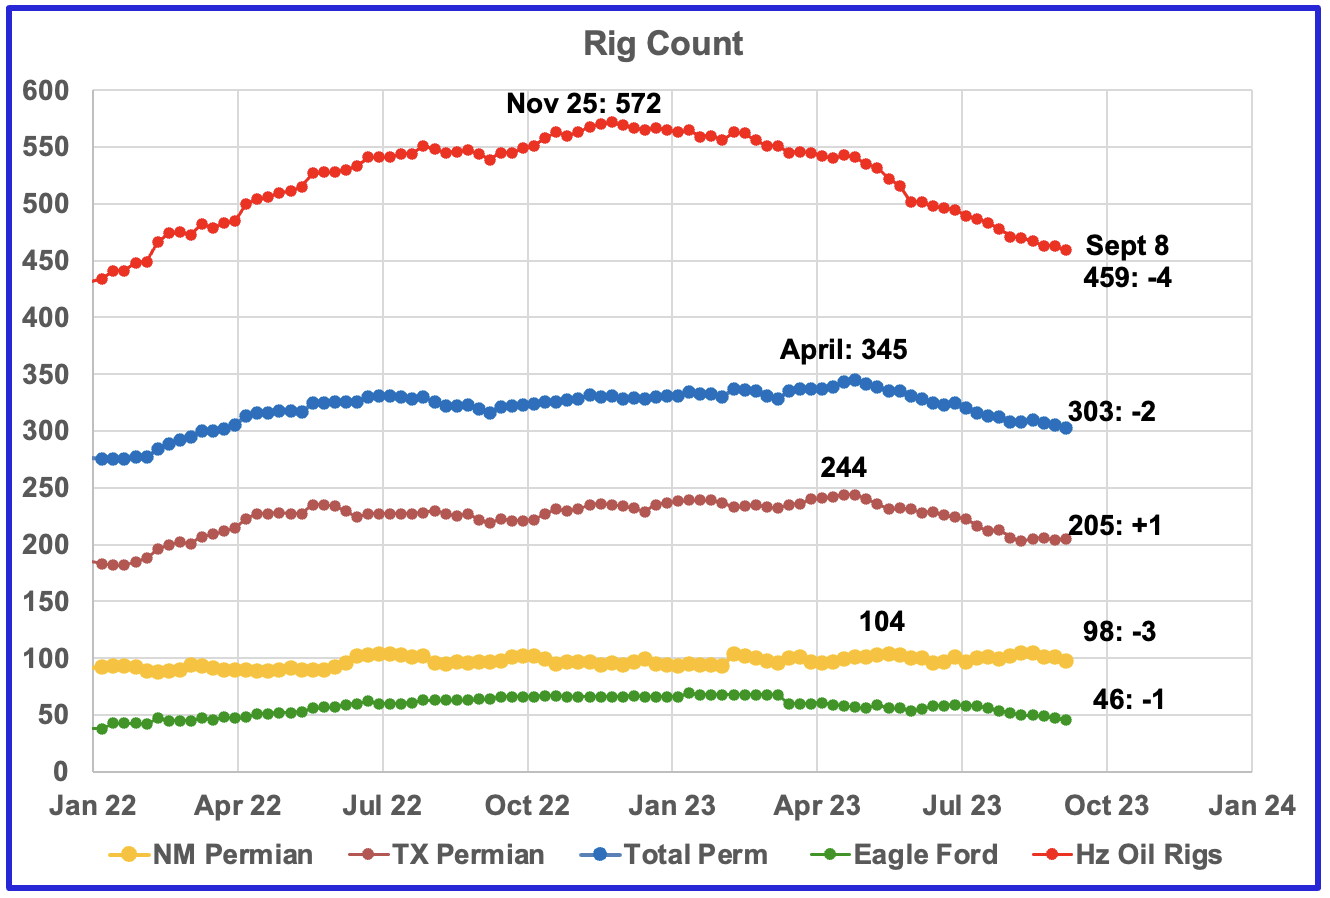
- A high of 572 Hz oil rigs was reached in the week ending November 25, 2022. In the week ending Sept 4, 2023 the number of rigs dropped by 4 to 459 and is down 113 from the November high of 572
- Permian rigs were down 2 to 303 with Texas Permian up 1 and NM Permian down 3 to 98
- Eagle Ford was down 1 to 46
- NG was down 1 to 101, not shown
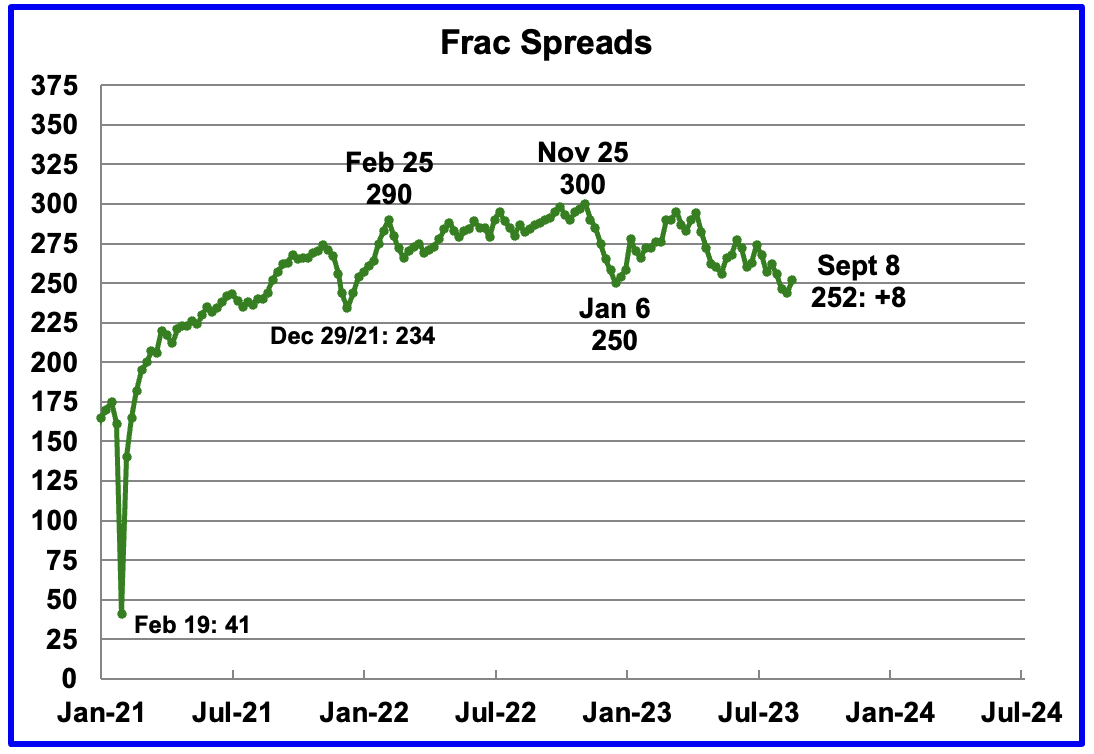
Since January 2022, the frac spread count has wandered between 250 and 300 fracs per week. For all of 2022 the average weekly frac count was 280. However in the last week of August and early September, the frac count dropped below 250 but recovered to 252 in the week ending September 8.
The frac count is still 28 spreads below the 2022 average of 280 and includes fracs of NG wells.
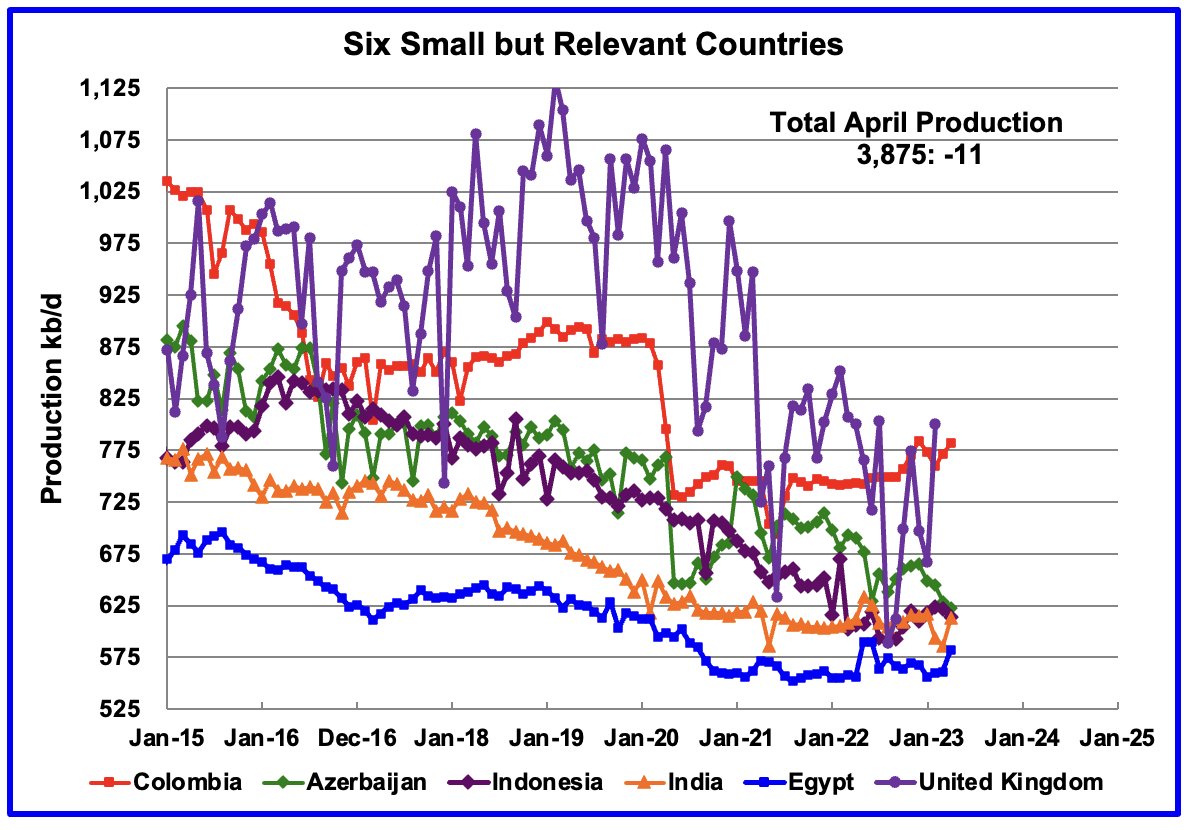
These six countries complete the list of Non-OPEC countries with annual production between 500 kb/d and 1,000 kb/d.
Their combined May production was 3,875 kb/d, down by 11 kb/d from April.
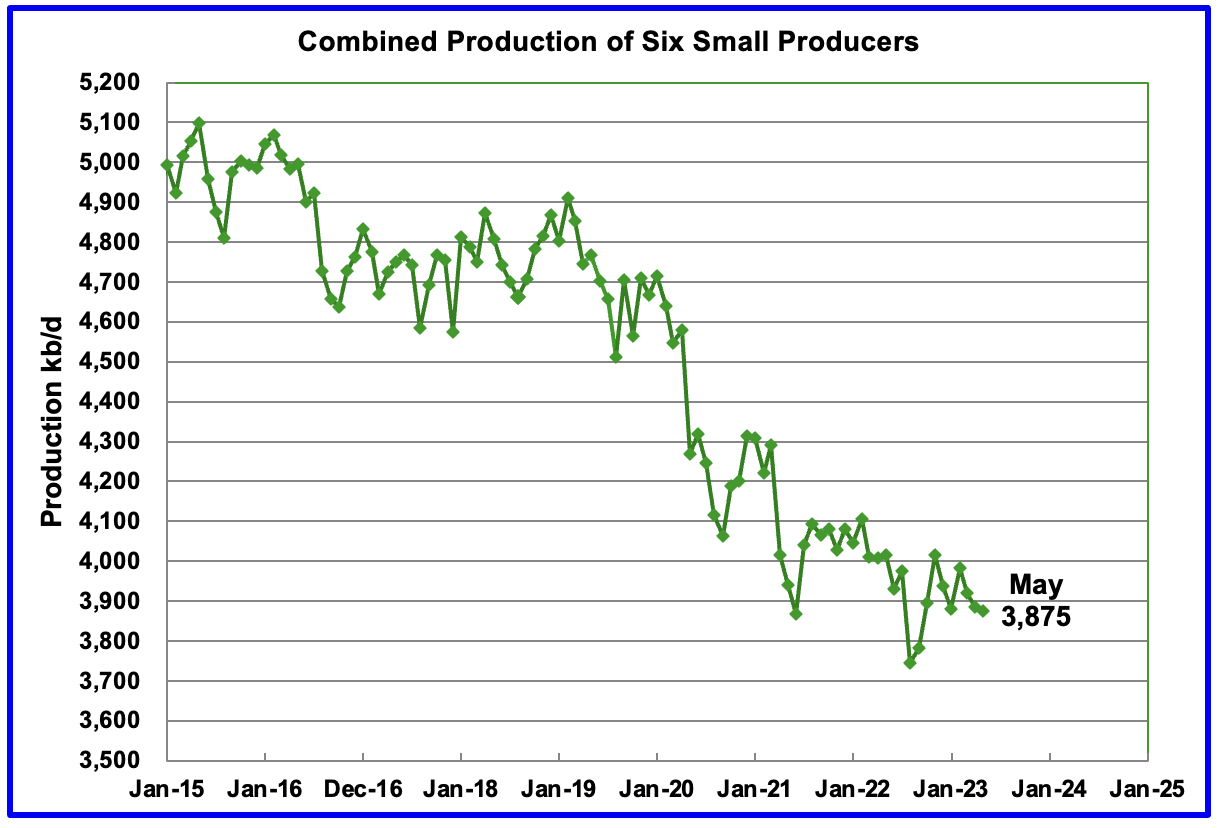
The overall output from the above six countries has been in a slow steady decline since 2014 and appears to have accelerated after 2019.
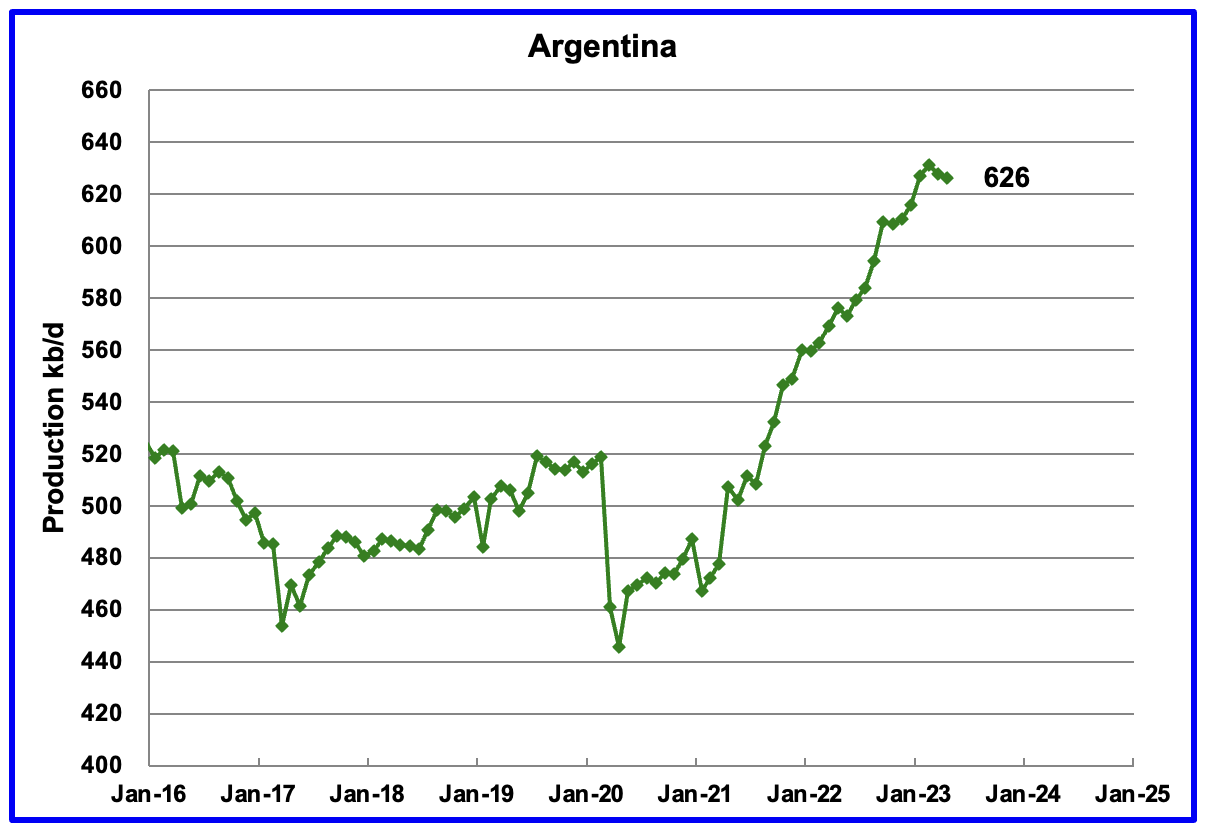
Argentina is now producing more than 500 kb/d and should be added to the Six small countries above. However I don’t plan to do that because it’s a country with growing production while the others are declining.
Oil production is rising in Argentina because of the opening of the Vaca Muerta formation. According to this Source: “Vaca Muerta shale formation accounts for nearly half of Argentina’s oil and 60% of its natural gas, potentially producing one million barrels of oil per day by 2030.”
A Different Approach to World Oil Production
Instead of dividing the World oil producing countries into OPEC and Non-OPEC, this section will divide the countries into two groups on the basis of their production capacity. The division will be The Big Three, US, Saudi Arabia and Russia, and the Rest, i.e. the World oil producers W/O the Big 3. The top producer in the Rest, currently China, produces less than half of the lowest producer in the Big Three.
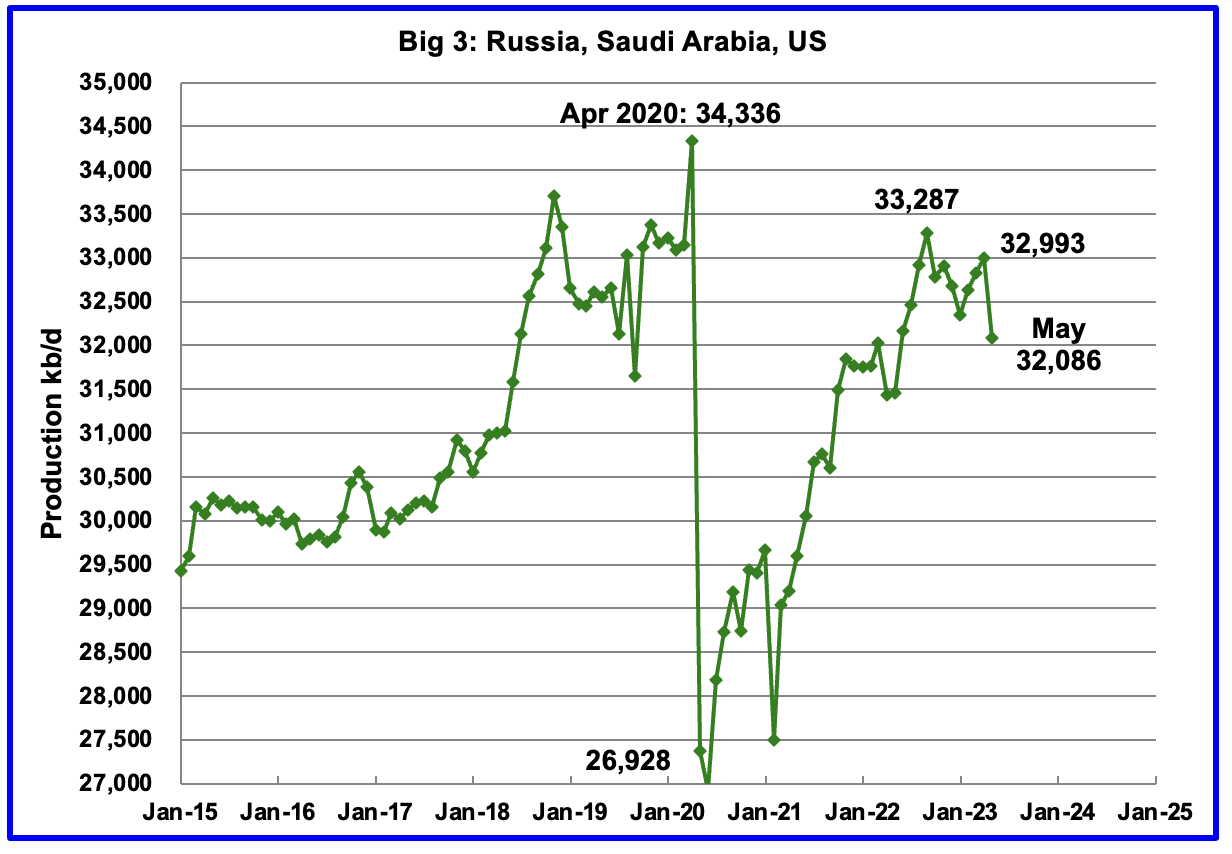
Peak production in the Big 3 occurred in April 2020 at 34,336 kb/d. The peak was associated with a large production increase from Saudi Arabia. Post covid, production peaked at 33,287 kb/d in September 2022. The drop since then is due to production cutbacks in Russia and Saudi Arabia.
May production was down 907 kb/d to 32,086 kb/d.
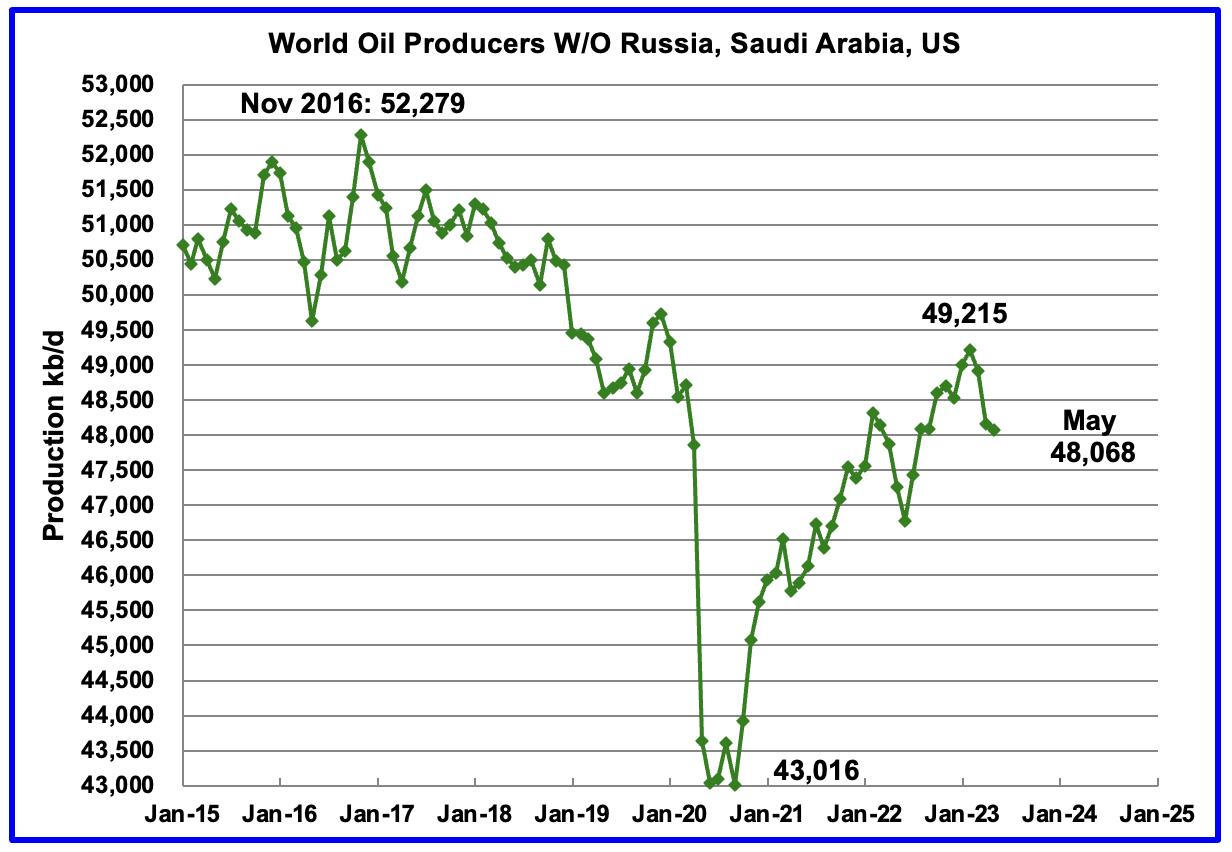
Production in the Rest has been in a slow decline since peaking in November 2016 at 52,279 kb/d.
Production rose post covid to 49,215 kb/d in February 2023. Since then production has dropped by 1,047 kb/d to 48,058 kb/d. The two biggest contributors to the drop since February are Canada 411 kb/d and Iraq 230 kb/d.
World Oil Production Ranked by Country
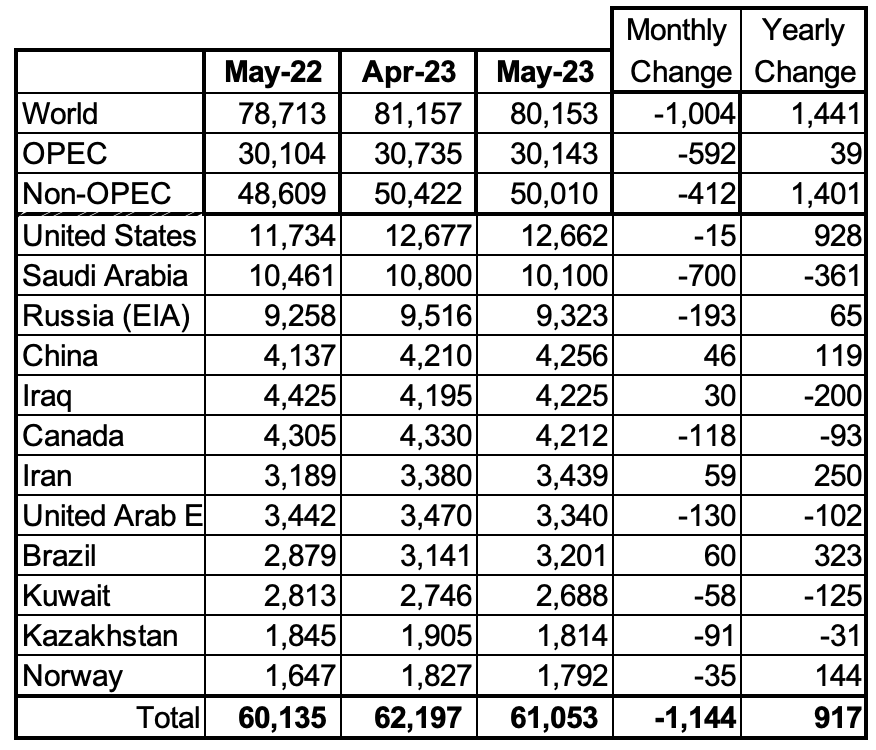
Above are listed the World’s 12th largest oil producers. In May 2022, these 12 countries produced 76.2% of the world’s oil. On a MoM basis, their production decreased by 1,144 kb/d while on a YoY basis, production increased by 917 kb/d.
World oil production decreased by 1,004 kb/d in May. The largest decrease came from Saudi Arabia 700 kb/d followed byRussia with 193 kb/d.
World Oil Production Projection
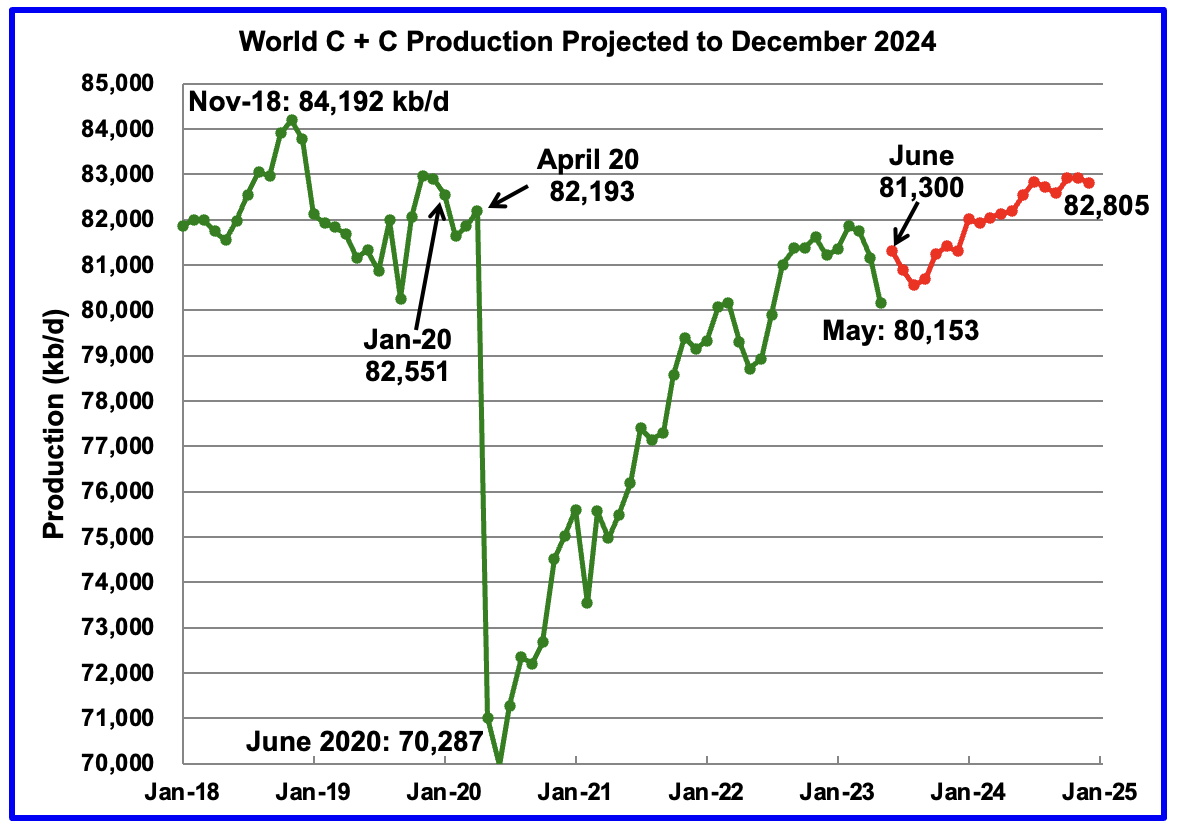
World oil production in May decreased by 1,004 kb/d to 80,153 kb/d.(Green graph).
This chart also projects World C + C production out to December 2024. It uses the September 2023 STEO report along with the International Energy Statistics to make the projection. (Red markers).
The red graph forecasts that World crude production in December 2024 will be 82,805 kb/d and is 1,387 kb/d lower than the November 2018 peak. Note the large increase of 700 kb/d to 82,000 kb/d in January 2024. This could be due to Saudi Arabia plus other OPEC + countries partially reversing their previous cuts.
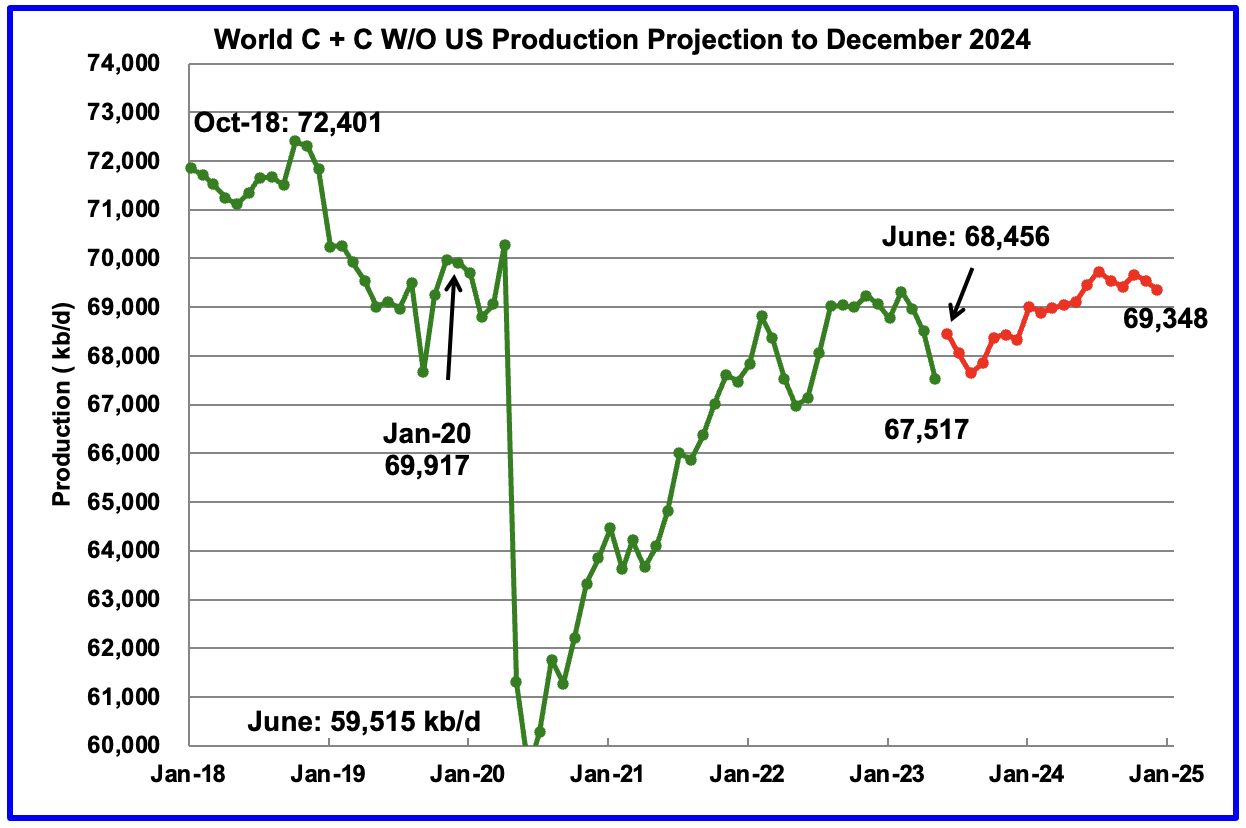
World without the US oil output in May decreased by 990 kb/d to 67,517 kb/d. June’s output is expected to increase by 939 kb/d to 68,456 kb/d. December 2024 output of 69,348 kb/d is 3,053 kb/d lower than October 2018 output of 72,401 kb/d.
World oil production W/O the U.S. from June 2022 to December 2024 is forecast to increase by a total of 892 kb/d.
174 responses to “May Non-OPEC and World Oil Production”
“This could be due to Saudi Arabia plus other OPEC + countries partially reversing their previous cuts”
We will see if they can or, maybe more simple, want to do that. Whatever happens, it seems that they don’t care that much about Biden or the US for that matter.
Required
I think the Saudi’s have to walk that fine line between how much they want for their oil and the risk of tipping the world into recession,
WTI hit $90. At $100, the world economy starts to get hurt.
Amazing to think US will again exceed 13 million bopd.
Seems that last time it went down afterwards, on November 2019, I always thought that the pandemic brought down the production but it seems it started before that…
Svaya,
World output peaked in Nov 2018 when OPEC nations increased output to set high quota levels for cuts that began in Jan 2019, World output decreased due to OPEC cuts in response to falling oil prices that started in the fall of 2018 due to a World oversupply of oil (which was the result of a rapid increase in US tight oil output in 2018.
I was talking about the US production.
Svaya,
Yes US production decreased a bit in late 2019 and early 2020 due to low oil prices (under $60/b) at the time.
Thanks Ovi for the post.
~ 97% of the World yearly increase between May22-May23 came from non-OPEC countries. 66% of which came from the U.S.
If U.S production stalls, oil prices will surely shoot higher.
Thanks Ovi – Great analysis as always.
In light of current conditions (increasing prices – yet decreasing production), additional growth of 1.5 mb/d per year seems like a big stretch.
I was curious and plotted the previous projections, see below:
Right now there’s a big divergence between reality and the forecast, I would guess that will get sorted out soon enough…
Since world production peaked ~54 months ago (Nov-2018), production has been falling at an average rate of 81,500 barrels per month (2,670 b/d).
More recently, 1 mb/d was lost over the course of 3-4 months. This works out to be a loss of ~250,000 b/mo.
In 2019, the monthly loss was about 170,000 barrels per month.
I suspect we will see a return to 2019 loss of production of ~170k barrels per month (loss of 2 mb/d annually).
For context, 1979 to 1983 loss of 10 mb/d was realized (~208k barrels per month)…
If this turns out to be the case, production at the end of next year will be ~76 mb/d (not 83 mb/d).
Looking at conventional oil only, we see a stark contrast between 2018 and 2022:
Kengeo,
After production fell from 1979 to 1983, production increased at an average annual rate of roughly 800 kb/d from 1983 to 2018. Output has been fallling lately because OPEC believes the market is oversupplied and has cut back output to support oil prices and balance the market. In 2019 output fell because OPEC cut back on output (as they have done from 2022Q4 to the present.) In 2020 and 2021 output fell due to lack of demand during the pandemic.
Dennis –
There is one massive difference between 1980 and 2020 that you prob. already know.
Between 1975 and 1985 reserves grew at an astounding rate of ~7% annually.
Between 2015 and present reserve growth has been on average less than 1% annually.
Growth in reserves and growth in production are intrinsically tied to one another.
Based on the lack of reserve growth and the lack of any production growth since 2018, it’s clear that we will not be seeing production growth. We have decades of data for many countries that points to the exact opposite, production decline. This is where we have landed, we’re beyond the 50% production mark of even the most aggressive URR estimates (3,000 Gb), which would require reserve growth/discovery of more than 1,000 Gb in the near term. With oil prices relatively high, why would the Saudi’s and Russia let the moment pass when they could be exploiting their production? Answer is simple, their reserves are largely tapped out and they simply can’t continue producing at the high levels they have sustained. Even by your best non-conservative estimates, there is limited upside growth in world production. I think very soon you may realize your estimates are far too high. It’s now been ~3 years post Covid, doesn’t look like US production has been able to match levels achieved ~4 years ago…
Kengeo,
I agree there is a big difference between now and 1980, which is why I do not expect output to grow by 800 kb/d for 35 years as it did from 1983 to 2018 (28 Mb/d). I expect a small increase from the 2022 level of output, an average increase of about 3 Mb/d over the next 5 years (an average annual increase of about 600 kb/d) with a peak in 2027. I think it is you who may realize soon that their estimate is far too low.
As I have pointed out before, contingent resources have already been discovered, higher prices and improved technology converts much of this resource to 2P reserves over time. Cumulative C plus C output at the end of 2022 plus Rystad 2PC resources are about 2750 Gb. Rystad expects another 340 Gb of discoveries in the future. Laherrere’s estimates for URR have been conservative in the past and his most recent estimate is 3500 Gb, Rystad’s 2PCX estimate is 3100 Gb, my best guess estimate is about 2690 Gb for World C plus C URR.
Time will tell whose estimate is better.
At the end of 2022 World cumulative C plus C output was 1473 Gb, the peak does not necessarily occur at 50% of URR. At the end of 2018 World cumulative output was 1358 Gb. If one wants to argue that peak must occur at 50% of URR, this would imply a URR of 2716 Gb, if one wants to claim a URR of 2500 Gb then the peak occurred at cumulative output of 54% of URR.
I agree, peak may occur late stage, with say 75% of URR produced. A number of mechanisms could be responsible. In theory, if >50% is difficult (slow) to produce then peak could occur at 40%. With less than 300 of 1P reserves, I would argue there is higher prob. That 50% midpoint has been passed…
Your plot requires some very difficult parameters in order to occur:
Cumulative production of ~1,650 Gb by 2028 (peak at >60% URR).
A 12-15 year plateau, which would require >4,000 Gb URR.
The peak production is directly related to URR ~2,300 URR has a peak of 30.5 Gb.
~2,600 URR has a peak of ~32 Gb. A 3,000 URR would have a peak at ~33 Gb.
4,000 Gb would have a peak approaching almost 40 Gb. The 2018 peak suggest URR between 2,000 and 2,500 Gb. Additionally, to continue growth beyond 2018, URR would need to be >2,750 Gb.
Additionally, once tight oil is removed from the calc’s it becomes very easy to see what is going, currently we have ~~25 Gb of conventional annually produced, down from a peak of ~29 near 2006 timeframe. This suggests the best case scenario of ~2,200 to 2,300 Gb. Adding produced of ~1,500 Gb with ~750 Gb future production this makes sense.
Dennis – Your estimate is only 20% too high, but that is enough to significantly throw off your projections.
It’s easy to wave your arms and say that future discovery and reserve growth will bring the URR up considerably, but with 1P URR at 1,800 GB, and 2P URR only slightly better at 2,000 Gb, you will need discoveries and growth of ~100 Gb per year to reach your URR.
Is that realistic, to have URR growth of 5% annually? That hasn’t occurred since 80s and 90s…not sure why you think that would start now?
The shame of it all is that for whatever reason, tight oil got produced at a rate that could only last ~10 years whereas if it had been produced at half that rate would’ve lasted 20 years and so on.
If we are lucky (which is unlikely), the tight oil production will plumet so that we can stretch those reserves for the next 30-40 years.
Show us the appreciation of 1P reserves and we can talk, until that happens your estimates are wildly speculative and not based on even a remote possibility…
Calling them “conservative” is rich…comedic, but rich…
Dennis – I’m glad you mention this:
“As I have pointed out before, contingent resources have already been discovered, higher prices and improved technology converts much of this resource to 2P reserves over time.”
This is exactly what is not happening, a 1P URR has been stable since 2016 at ~1,750 Gb, it has not grown during this ~7 year period. Likewise, 2P URR of ~2,000 Gb has been stable and not grown of this timeframe, while produced oil goes up annually around 30 Gb, 1P and 2P reserves have been revised downward by nearly equal amounts. Since 2019, 2PC URR of ~2,650 Gb has also been stable. This trend can only continue for ~10 more years at this rate, therefore it’s most likely that production will fall significantly over that time period. I think you realize this is true, whether you want to or not (it doesn’t support your future production numbers).
Kengeo,
I will defer to those with more knowledge than me. Jean Laherrere has been doing these estimates since at least 1998 (no doubt it has been longer), he says 3500 Gb URR for World C plus C. The peak would be at 1750 Gb of oil produced, if we assume peak at 50% of URR, for my scenario this occurs at about 2031, but unconventional oil follows a different output curve than conventional oil and peak occurs earlier than 50% of URR (if 3500 Gb is correct). Also note that conventional oil has not followed a Hubbert curve over most of historical production (1871 to 2005) so any expectation that a Hubbert curve would predict future production accurately seems silly.
In any case future production will tell us which scenario is closer to the truth, 1P reserves tell us very little. As Mr. Laherrere has repeatedly said, 2P reserves are much more informative than 1P reserves as it is the engineering best estimate under current conditions of technology and price. In my view 2PC is an even better estimate because 2P reserves tend to increase over time as oil prices rise and technology and knowledge improves. Note the my best estimate is currently 2027 for World peak at 1624 Gb of cumulative C plus C output. This would be at about 52% of the Rystad 2PC plus cumulative output estimate and about 46% of the recent Laherrere et al 2022 estimate.
Dennis –
Your argument doesn’t work.
“1P and 2P will grow/increase” – Test it please!
I listed the values above, 1P and 2P continue to decline.
Your coveted 2PC reserves are not moving over to 1P/2P, why not?
You can’t blame oil prices, so what is a rationale explanation?
I would think that two-thirds of 2PC reserves might not be economical or technically achievable?
Worldwide, oil production has stagnated for at least 15-20 years, with some minor exceptions (US tight oil being one, Brazil and couple other places being others).
The magnitude of production indicates the URR, the timing of the peak also indicates the URR.
Using three lines of evidence we know there’s a high likelihood that URR is ~2,000 – 2,500. Please double-check your Laherrere reference, his work does not support your URR estimate of 3,500 Gb.
The key with passing the 50% URR mark is that it means significant production growth is no longer possible. If URR were 3,500 or 4,000 Gb then we might expect reasonable growth for the next 10-15 years, we might also expect a higher producation rate ~20% higher than present…none of this is occuring, but the opposite is, telling us that peak oil is at least 5-10 years in the rearview.
By your own accounts (charts), conventional oil peaked/plateaued between ~2008-2016 and is decline, making a centered peak around 2012.
Based on this, URR is approximately 2,350 Gb…
To achieve this URR, we need 1P to more than double by 2040, so we need 10% annual growth of 1P…this will allow 1P to remain at ~300 Gb while it’s annual growth is equal to/consume by annual production.
I think this is what you call running on fumes, on a global scale…
US tight oil decline rates are the true monster lurking in the shadows, when they come out all hell breaks loose!
Kengeo,
If 1P and 2P reserves are stable, that means reserves are being replaced each year. Sometimes prices affect reserves, as prices increase more of contingent resources get classified as reserves and the contingent resource estimate may also increase.
You are wrong to think I believe my scenario is too high, it is quite conservative and if wrong is likely to be too low just like most of my scenarios in the past.
Dennis –
Here’s a direct quote from the Laherrere 2022 paper, Section 4.5:
“Thus, we suggest that the global reserves of ‘realistically-accessible’ oil (essentially, conventional oil including ‘light-tight’ oil) are probably only about 750 Gb or so, once the extra heavy oils and adjustments for probable overstatements of Middle East and FSU reserves have been subtracted. Moreover, this measure of oil reserves has been on a declining trend for over 35 years, and would last only about 25 years at current rates of production.”
Adding his estimate of 750 Gb results in a URR of ~2,200 Gb. As I’ve said before, your URR is ~20% too high, and is not conservative at all.
I’m glad that you defer to the expert(s)!
The estimate for C plus C reserves is 3500 Gb in the 2022 paper. That is the only number that is of any importance.
Peak for conventional was 2016 at cumulative production of 1273 Gb which implies a URR (assuming it occurs at 50% of URR) of 2546 Gb, this is pretty close to the Laherrere estimate for conventional oil. Unconventional URR might be as much as 600 Gb, the 954 Gb unconventional URR implied by the Laherrere analysis seems unlikely to me. Note that your 2250 Gb estimate ignores extra heavy oil reserves which are substantial. Why would we ignore these reserves? Laherrere has long used a conservative estimate for extra heavy oil of 500 Gb and the 2250 Gb estimate for conventional resources is low by at least 250 Gb, a more likely estimate for conventional resources is 2800 Gb, if oil prices remain high, if oil prices fall after 2033 conventional output might only be 2500 Gb.
There are a lot of ways to plot the EIA data. Here is my way. All but the last 3 data points are from EIA International, the last 3 are projected from STEO data.
I use a parabolic fit, assuming SA and Russia will continue to cut production.
“This thinking on fossil fuels is ideologically driven, rather than fact-based. It also does not take into account the technological progress the industry continues to make on solutions to help reduce emissions. Neither does it acknowledge that fossil fuels continue to make up over 80% of the global energy mix, the same as 30 years ago, or that the energy security they provide is vital.”
https://www.opec.org/opec_web/en/press_room/7217.htm
this is a tuff question, who to believe…. the facts or the pollyanna (lying) politicians and their worshippers
Texastea,
Fossil fuels made up 81.8% of World primary energy consumption according to the Statistical Review of World Energy in 2022, in 1980 fossil fuels were 90.6% of World primary energy consumption. In 2015 fossil fuels made up 85.1% of World energy consumption. Thirty years ago fossil fuels made up 86.5% of World primary energy consumption. Last time I checked 86.5% is not equal to 81.8%, though it is true that both are over 80%, fossil fuel use has been decreasing since 1965 when fossil fuels provided 93.4% of World primary energy consumption.
Fossil fuels will deplete and alternative energy sources must be developed, wind and solar are the cheapest alternatives. Just as fossil fuel needed government assistance in the form of subsidies for roads and bridges (without which demand for oil would have been much smaller) wind and solar also require government assistance to develop rapidly enough to eventually replace fossil fuel. A carbon tax would be a better alternative which might lead to a more efficient allocation of resources. Note also that nuclear power receives huge government subsidies in the form of insurance and waste disposal.
Those with their head in the sand have a difficult time seeing the train approaching. The problems of fossil fuel depletion and climate change are real for those with their eyes open and heads above ground.
It might not occur to some, but OPEC has a vested interest in the continued use of fossil fuel, their analysis is a little like tobacco companies evaluating the health risks of smoking cigarettes.
For thirty years I’ve been hearing about Arctic ice free summers due the relentless increase in man made carbon dioxide. Well the 2023 summer ice melt just finished with 5000 cubic kilometers of ice in place. And the polar bears are as numerous and happy as ever. The Danish Meteorological Institute shows that the winter freeze has begun.
The trend is not our friend:
https://climate.nasa.gov/vital-signs/arctic-sea-ice/
Rgds
WP
Ervin,
It takes time (hundreds of years) for the Ocean to warm due to increased atmospheric CO2, the CO2 level in the atmosphere changes very slowly once carbon dioxide emissions from human activity (mostly fossil fuel combustion and land use changes) ceases, on the order of thousands of years (half life of about 10,000 years). It is a long term problem which short term thinkers have trouble grasping.
Many don’t care much about their grandchildren I guess.
First, the rooster crowing in the morning does not make the sun come up.
Correlation is not causation .
Second, I believe that you believe that in the not to distant future the world will start running out of fossil fuels so it stands to reason that our great great great grandchildren won’t have much of a life regardless what we do or don’t do today. We need to be honest with ourselves and be smart with our energy choices. One simple point, today the highest the sun gets above the horizon in the UK is 42 degrees. In Southern Florida it’s 68 degrees. A UK solar farm is there to make people feel good not save the plant.
Dude. I’m embarrassed to have to point this out but they make these things called racks and you can tilt the pv panels so they’re perpendicular to the incoming rays. Even in the UK. You should check it out.
Dennis, say “Many don’t care much about their grandchildren I guess.”
Allow me to take on the emotional, rather than fact based approach, to make a rather weak debate point. Many witnessed the tragic flooding in Libya. North of 11,00 dead in a matter of minutes.
https://www.nbcnews.com/news/world/libya-floods-death-toll-derna-rcna105001
Texas just got past its second weather / electric grid emergency in as many years. I don’t know if it will be Texas, the North East of the United States, the mid west or California, but at some point in time a similar very tragic and momentous policy changing event will take place. To sacrifice the safety, security and livelihoods of those living today at the alter of predicted climate doom that most actual scientist say does not exist, is not just short sighted, it is criminal neglect.
https://cowboystatedaily.com/2023/08/20/former-uw-professor-among-1-600-scientists-to-declare-climate-change-not-an-emergency/#:~:text=What do a Nobel laureate,there is no climate emergency.
I have no problem, in a larger context for an “all the above approach” to energy. I have a real problem when those people who promote green energy to the exclusion of what is actually required, to keep the lights on, industry running and hospitals open are allowed to do so, unchecked. There is NO PLACE ON earth that can support an industrial economy without fossil fuels. Period. That includes the mining, manufacturing, transport and installation of green energy projects. Adaptation, technological innovation free market capitalism is the best chance the world has to face any and all challenges including but limited to climate change. All thinking human beings know this, so proposing anything else speaks to a sinister agenda.
Texastea,
Free market capitalism in its pure form does not get the job done, government intervention gets roads built for example and without government interference in the nuclear industry, there would be no insurance company that would touch the nuclear industry. There is a climate emergency for those with a basic understanding of science. The vast majority of scientists that are experts in the field of climate science believe the situation is not good.
Claims to the contrary by “scientists and lawyers” tells us very little.
The heat island effect has been studied and is a non-issue. The fact is that carbon dioxide is understood to affect the climate theoretically and the data backs the theory. Climate is complex and the fact that computer models don’t match historical data precisely should cause concern that they may in fact be underestimating the danger.
When we build a structure we typically over design by at least a factor of 2, to build in extra safety over the life of the structure. The world can transition to non-fossil fuel energy and doing so helps to insure that climate damage is minimized.
I agree that well regulated free market capitalism is a good approach to solving many problems, but negative externalities such as pollution are not addressed well by the free market without government regulation, infrastructure (a positive externality) suffers from the problem of inadequate investment without government intervention. These concepts are well understood in mainstream economics.
The sinister agenda can be found in research that tries to delay addressing the climate problem, much the way fake science funded by tobacco companies delayed addressing the dangers of smoking.
Wikipedia on cofounder of Clintel (the organization claiming there is no climate emergency), the other cofounder is a journalist (essentially no scientific credentials).
https://en.wikipedia.org/wiki/Guus_Berkhout
His field is not climate science.
Dennis…..”There is no climate emergency,” affirms a declaration signed by 1609 members of the world’s scientific community, including two Nobel laureates, who charge against government policies and the global climate agenda.
“The declaration, supported by the Global Climate Intelligence Group (CLINTEL), does not discount the harmful effects of polluting emissions, but it does speak of a politically motivated exaggeration that takes advantage of uncertainty.
“Climate science should be less political, while climate policies should be more scientific,” rads the introduction to this initiative led by John F. Clauser and Ivar Giaver, both Nobel laureates in Physics. The declaration defends its independence and ensures that the public debate around climate change is based on misconceptions.”
https://voz.us/there-is-no-climate-emergency-two-nobel-laureates-lead-a-statement-against-environmental-sensationalism/?lang=en
I would think Dennis since I believe you have stated you have a undergrad in physics you would feel some relief that two Nobel laureates in physics have stated there in no climate emergency, of course they could be lying dog face pony soldiers or it could be that you are just plain wrong yet again. IN either case it does not matter. What will be will be, and nothing you or I say is going to change that.
“no climate emergency”
Emergency.
It would be nice to deal with this problem before it is urgent enough to be declared an emergency, by even those with vested interest.
Mitigation actions for dealing with this problem take a long time to enact, as we have seen for the past 50 years.
Waiting for declared Emergency status would be the greatest foolery.
Texastea,
Did these physicists receive their Nobel prizes in climate science?
Physicists are very specialized in their field. Winning a Nobel prize does not make someone an expert in climate science.
This is the latest ice cover chart for Arctic ice from the National Snow and Ice Data Centre
The year with the lowest ice cover in the Arctic was 2012.
https://nsidc.org/arcticseaicenews/charctic-interactive-sea-ice-graph/
Ovi,
Nice chart… but who needs ice. Can’t make money on ice. 🙂
Let’s talk 5 trillion barrels of more oil to burn.
steve
This guy needs more ice. 😁😁
This is not about polar bears fellows. Although polar bears do indeed serve as a useful symbol for the health of the biosphere in general.
But I know that most humans don’t really care much about any of that…
until they can’t find food.
And it doesn’t take a genius to foresee that climate instability from global warming is putting the worlds grain harvests at greater and greater risk as time goes on.
And I know you probably think that food supply problem will only be affecting someone else, and therefore don’t care much about it.
But even for you who really does only care about money (Steve for example), the economic bite from global warming is just starting to ramp up. Chunks of GDP are going to start sloughing off. Property insurance is the tip of the iceberg on this.
We are quickly adding an extra ingredient to the
Limits to Growth soup.
I need ice for my drink – so yes, I do need ice.
rgds
WP
Ovi and Dennis, come on man what are you trying to pull here. Why start the chart in the 1980’s. Why not go back to the point of when the industrial age started, you know when man starting putting CO2 in the atmosphere by burning coal and oil. I think most would agree that is a fair starting point. Perhaps you don’t because it blows you chart to smithereens and makes your point at best Moot and worst deliberately misleading.
https://notrickszone.com/2020/09/23/arctic-sea-ice-stability-extends-to-14-years-long-term-arctic-has-been-stable-since-1900/
Texastea,
That is when satellite measurement began. We don’t make stuff up, we show the data.
Let’s just ignore the 40+ years that show an unprecedented melt rate that if kept up for another decade, leads to ice free Arctic. You know, like all those centuries before when the Arctic famously had no ice and was documented by all the aboriginal people of the cold, sorry, the hot Arctic Circle region.
I’m guessing you think it’s going to just rebound back and refreeze millions of sq/km of sea area not beholden to ice since I was born. Maybe oil will also rebound back and we’ll smash 150 Mbpd by 2030. I mean, it can happen, right?
Another paper on long term arctic ice extent, in both cases models are used for reconstuction of sea ice extent from 1900 to 1979. The second paper reaches different conclusions than the first cited by Texastea.
https://www.washington.edu/news/2019/08/08/more-than-100-years-of-arctic-sea-ice-volume-reconstructed-with-help-from-historic-ships-logbooks/
Arctic Ice Volume from
http://psc.apl.uw.edu/research/projects/arctic-sea-ice-volume-anomaly/
Dennis
The last ten years shown in more detail look different than the trend. Are the last 10 years indicating a stabilizing level of ice volume?
As an aside, the picture size is 60k.
Ovi,
There might have been a strong El Nino around 2010-2012 which led to an larger anomoly those years, generally with climate change we look at longer term trends such as 30 years or more.
This is apparently due to a shift in the winds after 2007. These winds, due to the persistence of a dipole pattern (an anticyclone on Canadian basin and a depression on Eurasian side) are accumulating fresh water coming from Eurasian rivers in the Canadian basin. As a result, the above sea ice layer is relatively insulated from the heat carried by the oceanic water masses coming from the Atlantic and which are flowing below. But, the authors think that this atmospheric dipole pattern will soon end which would end the current sea ice stability. https://www.science.org/doi/10.1126/science.adh5158
Ovi
Global weather patterns are not fixed, it is not surprising that certain areas will get cooler for some years.
However globally we are losing billions of tonnes of ice each year.
This melting is reducing the intensity of the warming which would be even more extreme.
https://climate.nasa.gov/vital-signs/ice-sheets/
The ice in the Andes and Himalayas provides water for millions of people, they will have to move to other places to live.
https://e360.yale.edu/features/andes-meltdown-new-insights-into-rapidly-retreating-glaciers
The Arctic ice is at least partially dependent the Atlantic Ocean temperature, which does vary according to the Atlantic Multidecadal Oscillation (AMO) index. The question is whether this is a real oscillation – long after Michael Mann coined the term AMO, he had second thoughts and has since asserted it may not actually be an oscillation. He now thinks that the actual variation caused by unpredictable external forces such as volcanic activity and perhaps man-made aerosols and GHGs.
The neat part of this is that the AMO cycle of ~60 years is easily modeled by a tidal forcing interacting with an annual impulse.
https://user-images.githubusercontent.com/2855758/268762214-08703ad0-cc24-4771-93fa-3f4aed5d6c0f.png
One extra step in the fluid dynamics response is it amplifies the the faster variations.
Astounding. Mann’s head would spin off if he had to do another 180 on this topic.
Dennis says “It might not occur to some, but OPEC has a vested interest in the continued use of fossil fuel, their analysis is a little like tobacco companies evaluating the health risks of smoking cigarettes.”
Really the Organization of the Petroleum Exporting Countries have a vested interest in the continued use of fossil fuels. HMMM I wonder how many doomer climate promoters did not know that, I am guessing a lot based on the other religious beliefs many of them hold so dear, thanks for the public service announcement.
When green energy can complete its own life cycle of mining, manufacturing, shipping, installation using only green energy, you may be right, but until that time comes, decades from now, the world WILL REQUIRE fossils fuels, unlike cigarettes to keep the lights on. TO deny such a fact at this time in history is to be nothing more than “lying dogface pony soldier.”
Many may have noticed WTI closed above $90 today as I correctly predicted several months back. By now I suppose that many readers here have recognized I value actually being accurate in my analysis and predictions over slogans and notecards from the greenies cult circuit. SO what’s next you might be asking yourself.
I am closely watching the monthly oil charts for the “magic” bull market maker MACD crossover. I think it is a mistake to assume all the Russia and the Saudi ‘s want are higher oil prices. They IMHO are out to tip the world balance of power using oil and now are in the best position in two decades to do just that. I think a repeat of the 2007 -2010 markets and economic calamity for the US and Europe is on the table. In 2007, the monthly MACD on WTI crossed at $75 and then WTI went up to $140 over the next 11 months. Every time the monthly MACD has crossed following a bear market OIL went up at least 50%. In 10/09 $77- $113, in 4/16 $50- $75 and in 11/20 $45-$114. So these types of moves are certainly on the table. The political fall out will be tremendous, the economic fallout maybe even more so. I think HHH has several good points but just needs the correct catalyst to spark his greatest economic fears.
As I also forecasted two months ago we may have seen the lowest CPI print for the year, as year over year comparison in the energy markets are now headwinds. CPI and PPI are now heading up again. The inflation comparison the US experienced in the 1970’s is still very much on the table. All in all being long energy is a good bet for the next few months. If I am correct with respect to my analysis, there will be a time to change course but that ship has not even left port yet.
Let’s look at the US consumer. Or 70% of the US economy. Real wages have been negative for over 24 months. Put it on a chart there is really nothing to compare it to at anytime in the past.
Savings are at extreme lows while credit card balances have exploded to all time highs. Overlaying these two in the same chart is down right scary.
Student loans repayment kickback in the 1st of October.
Since the stimulus money ran out more people have no choice but to get a job. Which has kept unemployment figures from rising. As long as unemployment numbers are low and oil prices are high FED will continue hiking rates.
When the data starts coming in soft and unemployment start to rise. The FED goes from hawkish to neutral or a pause. Then to a rate cut.
If you are bullish on oil prices when the FED starts to cut rates is when you should really be concerned. Because they will be cutting for a good reason which isn’t oil bullish.
My analysis is spot on it just takes more time to play out than anyone on this blog can handle so they assume it’s just wrong.
Bank credit is also in contraction btw. Particularly in Europe. So while Europe importing oil at a record or near record might sound great it’s not a forward looking indicator to where demand is going.
My guess is higher for longer interest rates only really last 2-3 months at best in Europe before they have to cut to support growth.
And ultimately just because a central bank cuts rates doesn’t mean commercial banks are going to start making loans like crazy and jumpstart the economy into growth.
Look over at China. Their central bank is cutting rates left and right and it doesn’t really matter. Unless demand from China’s two biggest customers the US and Europe is fixed then there is no fix for China.
It’s in China’s best interests for the war in Ukraine to come to and end and trade relations between Russia and Europe to normalize. And for oil to flow at max volume everywhere to keep prices down.
You can put money in the pockets of US consumers by getting oil prices down. China’s best interest and the rest of the BRICS members don’t really align.
I mean really is Russia or anybody else capable of stepping in and providing end demand for China’s products? To keep hundreds of millions of Chinese employed.
It’s in China’s best interests for the Saudi’s to reverse course and pump as much oil as possible. And if you’re receiving Chinese yuan as payment for oil you want those yuan to retain value. So technically it’s probably in Saudi’s best interest to keep oil prices down.
If we keep going down this path. Demand for oil in China will fall off a cliff as unemployment goes through the roof there and the ability for the average person to pay nosebleed home prices/mortgage is impaired beyond repair. And we get to watch the largest single asset in the world take a huge haircut in price they can’t recover from. Which will have knock on effects for the rest of the global economy.
” it just takes more time to play out than anyone on this blog can handle”
Who on this blog was calling for $25 oil 6 months ago ?
You damage your own creditably and insult everyone at the same time. Unbelievable.
HHH
Can you tell us the reason you do not see stagflation happening?
If you think about where the cost of food is headed and why.
Global soil erosion is destroying 24 billion tonnes of top soil each year, each year there is less soil to grow food.
Aquifer depletion is now really starting to impact the amount of water available for irrigation.
https://thehill.com/policy/energy-environment/4176511-four-in-10-groundwater-wells-hit-all-time-lows-in-last-decade-nyt/
Obviously increasing floods and droughts are adding to the dire situation.
Perhaps the biggest driver of food inflation now is Global population. Increasing by the equivalent of the population of Great Britain every 10 months.
Food inflation is at 15% in Europe and 10% in India.
People are spending more on food and therefore other areas of the economy will be hit.
One of the biggest boosts to the global economy over the last 70 years has been cheaper and cheaper food. In order to produce all that cheap food farmers have drained groundwater which they mostly got for free. They ploughed the soil planting the same crops year after year. Increasing the pests and diseases that now need the strongest chemicals to control.
Food inflation is here to stay and other areas will stagnate.
Charles,
I don’t see 70’s style inflation stagflation. I see 2008 style crash ahead. Yield curves around the globe are telling you inflation’s shelf life is limited.
Only way I’m wrong is if the yield curves steepen out from here. Meaning 10 year at about 6.5% 20 and 30 year bonds higher than that.
That’s not going to happen. Or never has in the past happened. T-bill always end up going lower than the long dated bonds to un- invert the yield curve.
We headed straight into a big damn recession. That’s is exactly what the yield curves are suggesting.
I get the argument of shortages. But when the economy is crashing all around that ceases to matter.
China is selling US treasuries at a loss. Massive loss just to get US dollars to try. I say try. To bailout their real estate sector. Remains to be seen if they can do it.
We are talking multi billion dollar companies that can’t come up with a $15 million interest payment.
If you think the housing crisis in 2008 in the US was bad. Wait till this blows.
$25 oil
Evergrande is something like a 10th of the size of Country Garden. And this is a dollar issue. Something they can’t print out of thin air.
If you truly understand the leverage within the Chinese economy. Their 2-3 trillion in US treasury reserves won’t be enough.
Their banking system goes down with the real estate sector.
https://seekingalpha.com/article/4635283-iea-really-messed-up-this-time
sometimes using ONLY government or quasi government data (should we talk inflation statistics) can lead to false or completely bogus conclusions, those that believe government data is impartial, fair or without bias are doomed to be wrong a lot, if not always. may explain a great deal of the conclusions we have seen on POB.
“Those with their head in the sand have a difficult time seeing the train approaching. The problems of fossil fuel depletion and climate change are real for those with their eyes open and heads above ground.”
True, but this is just one facet of this Dennis.
Another big one is vested interest. Most of the big talkers around here, for example, that have been bashers of anything not fossil fuel are those with a big wad of assets and/or income based entirely on the fossil fuel industry.
And that accounts for the top 10 on their list of motivations.
Secondly there is the phenomena of Willful Ignorance. This is a conscious choice, often based on a partisan allegiance. Sometimes this overshadows vested interest, although manipulators of the weak minded try and often achieve a blurring of these two motivating issues.
And third is one that we all should be able to relate to- we’ve all grown very accustomed to this fossil fuel civilization. Just about everyone likes to hope that the party will just keep on going. The extremely inconvenient truths about fossil fuel depletion and climate disruption are something that most would happily ignore, or hope that dogged denial would somehow cause them to just go away.
Hickory,
I agree the World will face a difficult adjustment, pretending that there is no climate risk or that fossil fuel output will never decrease only makes the job more difficult.
Best to face our problems and get to work.
Ideologically driven, indeed.
“Petro-masculinity is helpful to understanding how the anxieties aroused by the Anthropocene can augment desires for authoritarianism.”
Petro-masculinity: Fossil Fuels and Authoritarian Desire
https://www.researchgate.net/publication/325897790_Petro-masculinity_Fossil_Fuels_and_Authoritarian_Desire
My fav quote from petroleum geologist Mr Art Berman at the 36:35 mark.
https://youtu.be/zkzQRiiN1Jw?t=2195
“I think we’re kinda done lol” ~ AB
Russia Chart
I have heard back from the EIA and they confirm that the January downward revision in the Russia chart does not include Condensate. They plan to correct the data for the next publication.
This also implies the first two and last two charts were also shifted down.
Ovi,
Is it possible to redo the World chart with the revised Russian data using the STEO as suggested by the person at the EIA?
Dennis
I have answered this at the end so that everyone can see it.
In the News:
The United States exported a record volume of natural gas in the first half of 2023
The United States exported more natural gas in the first six months of 2023 than in any other previous six-month period, averaging 12.5 billion cubic feet per day (Bcf/d), 11% (1.3 Bcf/d) more than in the same period in 2022, according to our Natural Gas Monthly. In May, U.S. net natural gas exports as liquefied natural gas (LNG) and by pipeline averaged a monthly record high of 13.6 Bcf/d. In 2017, the United States became a net exporter of natural gas (natural gas exports exceeded natural gas imports) for the first time since 1957, primarily because of increased LNG exports.
https://www.eia.gov/naturalgas/weekly/#tabs-prices-2
funny way to run an energy transition….keep in mind LNG exports will grow significantly in the next two years.
This is absolutely brilliant, while China buys up all the fossil energy resources it can get, it sells us all the intermittent “renewables”. Trading reliable (gas and oil) future resources for unreliable and nonrenewable/intermittent (wind, solar, hydro). The road to ruin is paved with good intentions.
China is selling us hydropower? You in Burma?
I was for about 15 minutes.
But that was quite a while ago.
And someone with a rifle convinced me to leave.
Shameless fearmongering.
In fact China is installing renewables at a much greater clip than we are.
“ China is shoring up its position as the world leader in renewable power and potentially outpacing its own ambitious energy targets, a report has found.
China is set to double its capacity and produce 1,200 gigawatts of energy through wind and solar power by 2025, reaching its 2030 goal five years ahead of time”
https://www.theguardian.com/world/2023/jun/29/china-wind-solar-power-global-renewable-energy-leader
Fossil fuels are available once and then gone. Renewables are available in similar quantities on an annual basis in perpetuity. Anyone who can see past their nose knows it is fossil fuels that are intermittent. The path forward with the least harm to the most people/living things is 1) reduce our consumption; and 2) use the remaining fossil energy while it lasts to build renewable energy infrastructure so we don’t fall off a cliff at the end. Anyone who believes otherwise is either a quitter or a profiteer.
“Fossil fuels are available once and then gone. Renewables are available in similar quantities on an annual basis in perpetuity.”
Can we mine the required minerals, manufacture, deploy and maintain “renewables” with no fossil fuel input? Has ever been done? Even without any thought about the economics of it? You techno-hopefuls can’t be that deep in denial. But I guess “Technology will improve!”, “It’s just not there yet”, “History has shown it’s possible” is always on the table.
When you enter a factory in France, most of the electricity it uses is from nuclear, another non-fossil source.
And they can produce stuff there, if they want solar panels or spare part for nuclear.
So yes, it works.
PS: They have almost half the CO2 output than Germany per head count and $ GDP. So yes, less fossil fuel usage is already possible.
PPS: Halving CO2 production world wide would be enough – there are natural sinks. It’s in the UN climate report.
Since it’s literally the only path forward other than walking around with your thumb up your ass, I don’t really see the point in arguing about whether it will or won’t be possible. Probably somewhere in between. But it might be and if you look at the cost curves for PV, batteries, and wind, all down over 90% in the last 20 years, it’s not hard to make a case for it being possible.
What we do know about fossil fuels is this. First, they are utterly without a doubt destroying the planet. Second, they will in the next generation or two be for the most part gone. Good riddance.
Stephen, my new hero. Well said.
Required- “Can we mine the required minerals, manufacture, deploy and maintain “renewables” with no fossil fuel input? ”
You are not asking the right question (‘no fossil fuels’), since that scenario is not what we face.
We face a situation where we will see declining fossil fuels over the next three decades, and we’d be fools not to be rapidly augmenting and replacing as much of that decline as we can,
if we want to still have affordable and available energy to live on.
And we are about 50 years late to the game on this.
Regarding mineral supply…sure it is possible that sometime in the future there will a mineral/energy roadblock to civilization. It may be crude oil or copper, neodymium or graphite, etc. Hard to say what will be the first material shortage to grind things down. Until then we get done what we can. In the end, mineral shortage will likely not be the thing that puts a stop to the big story of global economic growth (Overshoot).
More likely countries will break down into geopolitical trading blocks, and we will simply not be able buy some of the things we need even if there is not a global shortage. Many countries already face this, and always have,
I’m all for intermittent renewables, but you need to be honest about how they are produced.
They are oil derivatives, if you can’t see that then you are blind.
“Renewables are available in similar quantities on an annual basis in perpetuity. Anyone who can see past their nose knows it is fossil fuels that are intermittent”.
Please show us all the mines that operate on nuclear power, the earth moving machines that run on electricity instead of diesel…this renewable utopia you speak of sounds like a fairy tale…
Reality is that solar panels, wind turbines and blades, and anything else “renewable” is not at all renewable without the presence of vast amounts of crude oil and refined diesel products to mine, manufacture, and move these items.
That’s the entire point, we need to save ALL the oil we can so we are able to produce these other items which help conserve the limited oil supplies we have. Renewables aren’t a replacement for oil, they just extend the life by several factors. The giant diesel guzzling trucks that carry one person around need to get phased out asap, what a ridiculous use of fossil fuels. Let those guys run natural gas if they must…
” Renewables aren’t a replacement for oil, they just extend the life by several factors”
Extending oil by a century or two seems like a decent goal for an earth of soon to be 9 Billion people.
But keep in mind that even if 100% of the energy used to produce PV came from fossil fuels
that the PV energy payback period for the lifecycle energy input is in the 1-3 year range in places where about 80% of the worlds population lives and works.
And there is nothing to say that PV electricity can’t be used for big parts of that manufacturing chain.
Find a new complaint.
@Hickory,
” the PV energy payback period for the lifecycle energy input is in the 1-3 year range”
Could you and others that keep repeating this lie, either prove it or stop using it??
Start with the Energy Invested (EI) bit of EROEI. All the papers that I’ve been able to find miss out on 80-90% of the energy invested bit because they claim it’s too hard to measure, so start out with false assumptions. For example they start with the energy to make the 8% weight of a solar panel as xx kwh from the aluminium frame being the energy to produce aluminium at at the rate of approx 15,000kwh/tonne of aluminium.
Do they count a portion of the energy cost in building the smelter? No, do they count the energy cost of the workers? No, do they count the energy cost of building the roads and bridges to the smelter? No, do they count the energy cost of building the pots and equipment inside the smelter? No, Do they count any energy cost in the education of the engineers and designers of all the equipment? No…
They just count the 15,000kwh/tonne of aluminium in the calculations, nothing else. So yes we can make up stories of how great renewables are if we want to miss the overall reality that modern civilization is not possible when fossil fuels use starts to decline rapidly. All the renewables (and nuclear) do is delay the inevitable by a bit of time (a decade or so at best) for those that can afford them. Meanwhile we burn and pillage the planet a whole lot more by destroying the ecosphere in a road paved with good intentions of unsustainable ‘sustainability’. For example building windfarms where the last 70 birds of a species exist…
https://www.abc.net.au/news/2022-06-06/robbins-island-wind-farm-could-harm-parrot-population/101125474
So why isn’t anyone mining, processing, transporting concentrates, smelting, then transporting again to factories, manufacturing, then transporting to the world solar panels with only the inputs of electricity? The reality is while it might be possible (no-one has proven this though), it would be way more expensive than by using fossil fuels at every step.
For your own knowledge, please look up the energy invested bit (EI) of the EROEI calculations, to see how much is left out in the world of renewables calculations.
The only real way I’ve come across to attempt to measure the real energy inputs is the capital cost and ongoing operating and maintenance costs, then comparing all types of energy production machines with each other. Of course using unsubsidized and untaxed numbers to compare on an even playing field.
Hideaway- Eroei on all energy sources is a rough determination based on many variables.
A big source of error on this for PV is using manufacturing data from the time prior to the mass production manufacturing scale we now have. The energy input per panel has plummeted over the past decade.
If you want an indication of the EROEI applied to real world, then just look at the price of energy for various sources. In most countries of the world (the ones with some sun) solar is the cheapest source for new generation.
And that is why the utilities of the world are contracting for as much PV as they can get developed. This utility demand is driving very fast growth- The world is thus on track to install 360 GW of new solar power capacity in 2023.
For perspective, that equates to annual energy produced from just about 72 full size nuclear power plants [1000MW each] assuming the average nuc plants achieve a 90% capacity factor…which is generous since in reality the global CF for nuclear has been typically in the low to mid 80%’s].
And for a little more perspective…in 2022 the world commissioned 6 new nuclear power stations, and decommissioned 5. Thats a global net gain of 1.
I point this out about nuclear not to be a judge of the merits of that source, but to emphasize that money for new electrical generating capacity is flowing to the lower cost (and simpler/quicker) option.
Bottom line…the energy input cost for all items purchased in the world is embedded in the product price. That applies to a car, to a TV, to a barrel of oil, to a ton of enriched uranium or purified lithium, and to PV panels.
Stephen,
What have you read about Cesium Germanium TriBromide cells? All that I have read says they are cheap to manufacture; about a tenth of silicon cells, but I have not read anything about their longevity, conversion rate, durability, etc. Only that “Tesla” is planning on manufacturing them. This should have an impact on fossil fuel usage but so far it reads like vaporware.
Texastea,
Yes the US is depleting its resources very quickly and sending them to other places rather than conserving them for our citizens. This may seem like a good thing until we no longer have adequate energy resources and then it will seem to have been very short sighted. Those who worship the free market tend to be very short term thinkers, and they also do not realize that free markets are only efficient under very specific circumstances that are seldom realized in the real world.
July ND +14 kb/d to 1,181 kb/d.
The chart below shows the performance of newly added fields in the GoM. Over the 18 months shown 250kbpd has been added but the total basin production has not changed much, implying a decline rate of about 14kbpd per month. Over the next two years new additions are Dover, Rydberg, Whale, Ballymore, North Shenzi, Shenandoah and Salamanca for about 370 nameplate, 340 average, or just about 14kbpd per month, which implies production may stay just about level. It may actually drop a bit because some of the big fields like Mars-Ursa, Thunder Horse, Great White, Jack etc. are now quite mature and have exhausted most brown field prospects so may start seeing accelerated decline and some mis size newer fields like Stones and Big Foot will be coming off plateau. After mid 2025 there is not much in the pipeline so production will start falling quite fast, maybe up to 200kbpd per year.
George,
Thanks.
If oil prices rise to $100/b and remain there or higher, is it possible there are some projects that might reach FID, or is there not much in the way of contingent resources in the GOM?
https://www.reuters.com/sustainability/us-launches-first-offshore-wind-auction-oil-rich-gulf-mexico-2023-08-29/
“Biden’s administration wants to deploy 30 gigawatts (GW) of offshore wind by 2030, and the Interior Department said the three offered Gulf leases combined had the potential to account for more than 10% of that amount.
“It is striking just how bad the economics clearly must be in order for two of the three sites to remain unsold … and for the site that was sold to go for such a low price,” said Alon Carmel, a partner at PA Consulting who advises offshore wind companies.”
who would have guessed this…oh that’s right it was me😎
and
https://www.arkansasonline.com/news/2023/mar/30/264m-bid-for-oil-leases-in-gulf/
some transition….
“Chart of the Day: Surprise! EU crude imports are at a record high, despite penetration of electric vehicles.”
Summary
Figure (1) above shows the imports of crude and condensates of the 27 members of the EU. Imports peaked in 2017 but now the record has been broken: EU imports of crude and condensates are at a record high despite the widespread use of electric vehicles.
EOA’s Main Takeaway
We do not have the recent consumption numbers in these countries. Consumption numbers tell a better story than imports. However, lower consumption with increasing imports means the EU is in big trouble.
The record import numbers are a significant development: despite the increased numbers of electric vehicles and the recession in some countries, crude and condensate imports increased. In other words, EU’s dependence on importing one of the “fossil fuel” sources increased. In our view, one of the reasons (as we discussed in the past) is the subsidies that several EU governments provided last year. Some of them are still in effect today.
Speaking of dependence on imports, the EU is not only dependent on US LNG but also on US crude and condensates as shown in Figure (2) below. Europe is the natural market for US oil given the geography and the logistics, especially after the pivot of Saudi Arabia and the rest of the Gulf States to Asia. This puts Europe’s energy supplies under the mercy of hurricanes in the Gulf of Mexico and US politics!”
https://afalhajji.substack.com/p/daily-energy-report-126?r=1vkr3y&utm_campaign=post&utm_medium=web
energy transition is all talk and no action
Transition deez nuts.
But no, you’re right. The transition, if one can call it that, is really just enabling us to get the last gooey clusters of fossil fuels more efficiently. We’re bootstrapping our economies with REs to try and paper over things that should be giving everyone nightmares.
Yes. Keeping everyone consuming and in their goddamned cars is no frigging transition.
“energy transition is all talk and no action”
Ironic to hear that coming from a Texan,
who’s state is vastly under performing it potential on this.
Its like having an all star team that only puts up 3 points on game day.
Remember that its only the first game of the season on this front.
Have you ever heard of the Rimini protocol ? https://en.wikipedia.org/wiki/Rimini_protocol
Watching the oil price, i found it stabilizes in the middle between the industry limit and the OPEC limit at about 7-8 %BOE. This effect started in the beginning of 2023.
For me is the question: Is the stabilization intention, coincidence or a mechanism ? Does the Saudis know the Rimini protocol and stabilize the oil price to follow it ? Or is the machine “industrial civilization” forced to follow the protocol to remain stable ?
Last Diagram for today:
US car sales versus oil price.
I have expected (1.5 years ago) that car sales can increase only if the oil price falls below 6 %BOE. I was wrong, the increase happened with prices of about 7-8 %BOE.
A second thing i did not expect (1.5 years ago) is that many countries (US, EU, china) support EV car buyers with heavy subsidies.
So, i was wrong with my prediction for car sales because subsidies torpedoed it.
Rig and Frac Report for Sept 15
Fracs UP BIG TIME, Rigs flat
– Rigs unchanged at 459
– Texas flat at 257
– Permian up 1 with NM down 2 and Texas up 3
– NG up 6
Fracs UP 12 to 264
Further up Dennis has asked if I could update the world chart. I have done it two different ways.
In the second chart below I have used the April EIA data for world production and replaced the August STEO report with the updated September version.
The first chart below is the one in the post above to make it easier to compare.
This chart uses the April EIA data and the updated September STEO.
May is about the same but the forecast is shifted up by close to 500 kb/d.
This chart compares the difference between the change in Russian production between the April and May reports. It also compares the difference in world production in the April and May reports to correct for all other changes and then makes a correction to January to April.
For example in the April Report, January world production was 81,833 kb/d vs 81,345 kb/d in the May report , a drop of 488 kb/d. Russian production dropped by 544 kb/d, a difference of 56 kb/d using the same two reports. So to update the April EIA data to what it should have been in the May report for January, 56 kb/d was added to it. The same was done for February through April and a correction was made for May.
In this case May was changed and close to 100 kb/d was added to the forecast.
In summary, close to 600 kb/d was added to the forecast. Russian condensate was too low by 577 kb/d in May. So the upward shift of the forecast by close to 600 kb/d is in the ballpark.
Thanks Ovi,
For this last chart (which is probably the most accurate projection for September STEO and corrected EIA International data) what is average annual C plus C output in 2023 and 2024? By eyeball it looks like about 81.7 Mb/d in 2023 and perhaps 83 Mb/d in 2024, for World C plus C output (in 2018 output was about 83 Mb/d, so 2024 might match this based on STEO data).
Dennis
Good guess.
2023 81,806 kb/d
2024 83,090 kb/d
Attached is a centred moving average.
Thanks Ovi.
here is Rapiers article on nuclear
https://oilprice.com/Alternative-Energy/Nuclear-Power/Can-Chinas-Nuclear-Ambitions-Offset-Its-Coal-Addiction.html
“The International Energy Agency has projected that we will need to double the world’s nuclear output by 2050 to reach net zero energy. Although we can’t change the past, we can work to improve the public’s attitude toward nuclear power. It is possible to build, design, and operate nuclear power plants that can’t suffer the kinds of disasters seen in Chernobyl and Fukushima. It is naturally going to take some time to convince a skeptical public of this.
But the stakes are too high. We have to devote the resources into doing this. Otherwise, taking a serious bite out of global carbon emissions may be an insurmountable challenge based on the overall demand growth for energy, and the inability of renewables to even keep up with demand growth.”
I think this sums it up very nicely
Regardless of Hickory’s perpetual optimism renewables are not possible without fossil fuels. And even is all fossil fuels were used solely in the manufacture of renewable systems the scale needed wouldn’t decrease consumption nor the fact that fossil fuels are finite. Basically lights out regardless of choices made.
No one considers that our modern steel and concrete require 2000-3000 deg C nuclear is 600C and electric arc is far too energy intensive. No fossil no steel no concrete no plastic.
Correction for you JT…I am not optimistic about renewables, or any other specific facet of the energy situation we have in front of us. None of the sources are without big problems. Energy supply per capita is likely near its peak, and oil supply/capita certainly is.
It would be more accurate to characterize my stance as being an equal opportunity realist.
I post reality checks here to comments made by others that are either simply false on a factual basis, or are blatantly politically motivated, or are a skewed opinion based on vested interest.
Its good to hear about other perspectives and to learn from people about things you are unfamiliar with, or perhaps have been brainwashed against.
Hickory,
I post reality checks here to comments made by others that are either simply false on a factual basis, or are blatantly politically motivated, or are a skewed opinion based on vested interest.
The question is, how do you know you are not biased ? And it just doesn’t apply to you. Fact is we are all biased, it is part of the human condition (which we fail to truly acknowledge for ourselves but readily see in others).
Rationality seldom impacts irrationality. So in essence people come here with their own irrational opinions (which they believe is rational), argue when presented counter points to their beliefs, and leave with the same opinions. You, I or anyone else posting here doesn’t change a thing.
‘The question is, how do you know you are not biased?’
Oh I am sure I am biased and opinionated just like everyone else,
but I work at challenging my preconceptions with factual analysis when I can find it.
And I work hard at keeping partisanship out of the equation…I don’t follow any party line.
At work I get paid very well for identifying and describing scientific reality in a particular field with very high volume and a lot at stake. Bias, opinion, or speculation without basis in fact are inclinations that get weeded out very early in training in my field, or you don’t make it past square 1. While energy and environment are not my field of work, I do try to apply the ‘search for reality’ in all aspects of my interest.
But certainly I do express opinions here to some degree, like everyone else.
You clearly do, and not the most scientific way of doing so (but we all need a break from the mundane, right?):
“skewed opinion based on vested interest” – That’s good, you apparently are the judge, jury, and executioner!
What’s great about POB is the ability for honesty and transparency…
While we all have our biases, I don’t think too many here are pushing interestes/agendas….I could definitely be wrong.
“Rationality seldom impacts irrationality”
Wow- that is good. I’m going to add that one to my vocabulary,
Thanks!
rgd
WP
I feel that Hick exhibits an evidence based view. Everyone has biases, knowledge deficits and makes errors. I feel that Hick is an ethical broker of intellectual honesty. I’ve never seen Hick make a claim that can be proven verifiably false in less than 5 seconds; more than I can say for some commentators here over the years.
That’s a great point, there are all these applications people waive their arms around and say renewables for this and that…without diesel and jet fuel the entire world and local economies fail…
No amount of smoke or mirrors can change that hard reality…
Diesel is king.
I think that’s unfair to Hickory. I may have my disagreements with him on some matters, but I do know that he isn’t Nick G level of Pollyanna when it comes to what we all are staring down the barrel of. I respect that we could use all the help we can get, and if that means PV and wind turbines dotting the landscape, so be it, even if the easy wins on demand are foregone.
We frittered away our lead on nuclear and that’s not going to come back and save us. REs at least are here right now, even if they are no panacea and merely enable BAU that bit longer.
Steel can be made with hydrogen. They build some big plants at the moment in Germany.
And hydrogen can be made in different ways – one way is cheap desert solar.
Eulen
Can you tell us which desert solar plant is producing hydrogen? How many shares do you have?
If you buy shares in a company it’s because you have faith that it will make money.
Last time I searched the amount of Green hydrogen produced in all the world could fly one plane from Europe to New York. That is compared to the 650 billion miles flown by all planes.
Does not look good
https://acwapower.com/en/projects/neom-green-hydrogen-project/
This is the biggest currently in the making, 4 GW. Should be enough for a flight or two.
And it’s just the beginning. Australia plans to step in big, too.
Thyssen Nucera builds the modules for creating the hydrogen- they have 20 MW modules.
Desert solar produces at 1-2 cents per Kwh – and you use up all direct without storing and other expensive stuff. Should be in line to the price of oil soon.
Ps: I have a few Nucera stocks – it’s just a tech stock speculation.
Eulen
If that solar to hydrogen does produce 600 tonnes of hydrogen per day. That would produce enough hydrogen in a year for a couple of hours of global aviation consumption.
We would have to build 20,000 of them to produce the hydrogen just for aviation at current rates of consumption.
By 2035 there will be another 900 million people on the planet wanting their share of flights, food and cars.
To power all the ships today with current population would take another 20,000 solar plants.
Considering it is already 2023AD and global coal consumption it at a climate destroying 8.4 billion tonnes I am not hopeful.
Calculated in oil equivalent this plant produces ca 10 kbpd. When using fuel cell planes, you can get perhaps the double mileage out of this than with kerosen.
All in all, yes you need 8000 plants like this to replace the complete oil production (or bigger ones), 4000 when you get more efficient with hydrogen.
But there are also geothermy and nuclear. Heck, I’m burning oil at the moment to heat my home, but under our town in just 2000 meters depth is a huge deposit of boiling water. Instead of drilling for oil, refining it, transporting it around the world and burn it to get hot water.
A notion to consider-
If indeed oil production has peaked in 2019,
this means that oil demand has also peaked since during the past 4 years the oil price
has not risen to be a limiting factor to economic growth.
As a counterpoint to this consider the prospect of future accelerating economic growth and resultant oil demand growth sometime during this decade. The window for this scenario is slowly closing.
Hickory,
Oil prices are pretty high at present at about $90/bo. If OPEC maintains cuts through the end of 2023 we may see $100/b or higher by the end of the year.
Dennis
I hope that OPEC, aka SA, can find the right balance between greed and recession. Allowing for inflation over the past years, I think the economy can deal with $95/b to $100/b. Beyond that, I think the economy starts to slow.
Ovi,
The economy slowing is what central banks are trying to achieve due to high inflation at the moment. Expensive energy will only exasperate inflation which means central banks would need to continue raising interest rates.
A recession would welcome by central banks at the moment.
Ovi,
I agree with your assessment 100%.
Everyone should keep in mind that average WTI oil price from October 2010 to September 2014 was $121.85/bo in 2022 US$, over that period the World economy grew at about 3% per year in real (inflation adjusted) US $. So we might not see much effect on the World economy until WTI reaches about $120/bo or more. For Brent this would be roughly $138/bo in 2022 US$ (average real Brent oil price from October 2010 to September 2011).
The real number might be a bit higher than this due to reduced demand for oil as the World gradually moves to electric transport for land transportation, as a rough guess perhaps as high as $160/bo for nominal Brent oil prices in 2027 or so.
Macroeconomics at the World level can be quite complex especially as politics often intervenes.
My guesses on this are highly speculative with near certainty that they will be incorrect.
That period of time isn’t the same as now. Not a good comparison. US consumers are way more broke today than during that time period.
Saving are at extreme lows. Stimulus money ran out. Credit cards are maxed out like never before. Real wages are negative like never before. And millions will have an extra $200-$400 monthly student loan to repay in about 2 weeks.
HHH,
As I recall, the economy was not in great shape after the GFC, I doubt things are much worse now than in 2010.
See
https://fred.stlouisfed.org/series/DRCCLACBS
$100/barrel is pretty expensive compared to 1990’s prices. So is housing and most other things.
But I don’t think $100/barrel oil would be resulting in much demand destruction.
Do you, and what is a good indicator to watch on this?
Hickory,
My understanding is usually demand destruction comes from the lack of credit availability due to things like higher interest rates, tighter lending criteria or good debt going bad.
In this particular scenario banks theoretically should tighten lending due to further increases in interest rates also harsher lending criteria as a result. So what this does is slow the economy which causes demand destruction. Usually as a rule of thumb, higher prices and loose monetary policy/credit availability have a positive correlation.
But Dennis knows more about this than me. I am sure he can add further insight.
Hickory,
I would agree that $100/bo won’t result in much demand destruction and we might see increased supply at higher oil prices. If the demand response is larger than the supply response (demand rises by a smaller increment than the increase in supply we should see oil prices start to fall, if oil prices continue to rise this suggests supply is rising more slowly than demand, stable prices suggest supply and demand are rising (or falling) at about the same rate.
Adjusted for inflation, oil price has averaged $40 per barrel pre-2000, and $100 a barrel post-2000. Wages from the 1980s thru ~2015 were essentially unchanged with median household income (inflation adjusted) of ~$67,000 annually. By 2021 that amount jumped to ~$81,000 over ~5 years. It now appears that it’s dropping back down to range of $75,000. The average household in the 1980s and 1990s had purchasing power of ~1,000 barrels of oil. More recently that amount is less, ranging from 300 barrels of oil (2008) to ~800 barrels (present).
With these numbers in mind, I think oil price doubling from current levels is a given. $10-12 per gallon fuel is certainly coming, likely sooner than most people think.
Really comes down to how quickly tight oil supply dries up…if it’s quick then the fuel price will need to skyrocket in order to balance the low supply…
That’s the irony of the US tight oil boom…if it had been developed responsibly we could have had slightly higher fuel prices ($6-8 per gallon) for a longer period of time. Instead we tried to keep the fuel prices low and overproduced and now we will be stuck with much higher pricing. This will no doubt impact inflation over the next years.
” Instead we tried to keep the fuel prices low and overproduced”
Not quite. Production has been brisk simply because there was money to be made.
It has been an unregulated feeding frenzy without any organized pricing or long-term supply considerations or planning.
Oil has been grotesquely underpriced–and therefore wasted–for a century. It was, and is, a gift from the earth. It can be replenished, but only if you have a few million years to wait. To purchase an exceptionally skinny ten-dollar hamburger from McDonalds and complain about hundred-dollar oil would be laughable under ordinary circumstances. But today’s circumstances aren’t ordinary, are they?
China burns 60% of the world’s coal, and yet they are a member of the Paris Agreement and are routinely lauded. They produce most of the solar panels, control refinement of 75% of REE’s, and almost all the cobalt trade. They have stockpiled 980 million barrels of oil, an equivalent in NG, and all the coal they can get. Some of the U.S. Strategic Petroleum Reserve even went to China.
Not to be a doomsdayer, but China launched a hypersonic missile last year that circled the globe in an hour, and is also maneuverable enough to avoid countermeasures. This from the country burning coal to produce electricity to charge electric vehicles to the congratulations of the world’s “true” doomsayers. How much hydrocarbon do you think that evil missile eats up? And does anyone really think it was built for protection?
This first got silly. But now it’s just downright frightening. And if that’s xenophobic, fine by me.
An attempt to transition from the current global energy system of heavy fossil fuel dependence
to a scenario with a higher balance of other sources like solar, nuclear, geothermal, wind
will be very expensive.
Not only will the global economy have to pay more and more for depleting fossil fuel E & P,
but simultaneously paying for all kinds of additional energy related materials and equipment…
the list is long and pricey.
We should not be surprised by the need to double energy related spending/capita just to run in place between now and 2050.
I suggest that failure to quickly ramp up spending on transition mechanisms will result in an outcome which ends up being much more expensive and/or less effective as time rolls on.
Bruce Oksol’s site (themilliondollarway) has some production data today (Sunday) that may shed some light on how North Dakota – with only ~33 drill rigs – can keep chugging along at over 1.1 million barrels per day.
2 wells have gone from ~850 bbld/~1,600 bbld to over 43,000 and 23,000 after nearby wells were frac’d.
The produced water went from negligible to 50,000 bbld and 80,000 bbld, which is significant on many levels.
This is one display of how the formation pressure – a much discussed topic on this site – can be increased to boost production from older wells.
In a somewhat related topic, the Appalachian Basin continues to produce a preposterously high ~35 Billion cubic feet per day with only 40 working rigs. (Years ago, on this site, an industry professional expressed skepticism about the AB producing a then-projected 7 Trillion cubic feet per year. Current output is now nearly double that).
There are a lot of bright people on this site who sincerely seek out accurate, truthful info by which their opinions are then formed (confirmed ?). Like, forevuh, the Red Queen effect was embraced as ‘Gospel Truth’ by those who doubted the resilience of the ‘shale revolution’.
How can justification be awarded to this now wildly discredited view … along with so many others that are continuously shown to be lacking in merit?
Coffeeguyzz
Could you provide a link to that page. A search for “themilliondollarsay” leads to a very confusing site.
Ovi,
“themilliondollarway.blogspot.com” is the site.
Mr. Oksol – proud Williston native – usually makes several postings each day.
The 2 posts from this morning were titled ‘update MRO wells’ and ‘Halo effect’ containing recent production data from these 2 aforementioned wells.
Coffeeguyzz
This what I get. How is one supposed to find stuff on the Bakken when you are being presented with news on Nvidia. Very frustrating site. Not even a tab for Bakken.
Ovi,
You are correct in that Mr. Oksol has spent much time these past couple of years discussing various stock market ‘plays”.
One should be able to toggle backwards a few postings (little blue arrow near bottom?) to view his posts on Marathon’s wells.
I use a tablet and I believe you are viewing a ‘computer’ presentstion.
Sorry, I am not particularly tech savvy.
Coffeeguyzz
Thanks for getting me there. I just had to scroll down. Same on the computer and iPad. Next problem.
As I read it, the jump in production occurred in 2019. Could you please do me a favour and explain those numbers in the column. Columns without headings? The only thing I get is that MRO is Marathon.
Ovi,
Sure. (If you go back just one more post, another MRO well – the David Beck USA 24-7H has several months’ production data with the entire heading labels included).
1. Fourth column is total month’s oil production in barrels.
2. Fifth column is ‘Runs’ … the actual amount sold. Slight differences between production and sales is usually due to actual truck deliveries for sale. This involves money/taxes/royalties to various VERY interested parties and is considered a solid benchmark.
3. Sixth column is produced water in barrels.
4. Seventh column is gross natgas production expressed in units of 1,000 cubic feet.
5. Eighth column is natgas sold (in 1,000 cf units).
6. Ninth column is natgas flared/vented … that is not sold (see my #2 explanation for significance of sales figure). One can add sales and vent/flare numbers and then subtract from total Production (column #7). Any difference – between 60,000 cubic feet and 120,000 cubic feet when I used to check – should be natgas consumed onsite … whether for gas-assisted Artificial Lift, powering local hardware, or whatever. Could be ‘evidence’ of natgas injection if/when EOR takes place).
Note … years ago, operators would flow virtually all the injected frac water within days of frac completion.
No longer.
They maintain the hundreds of thousands of barrels underground so as to ‘push’ the oil into the wellbore for many months ongoing. Your posted Buehner well had ~200,000 thousand bbls of produced water over 7 months. The David Beck MRO well had 235,000 bbls produced water in just 3 1/2 months after coming back online.
Coffeeguyzz
Thanks for all the help.
Coffeeguyz: “Bruce Oksol’s site (themilliondollarway) has some production data today (Sunday) that may shed some light on how North Dakota – with only ~33 drill rigs – can keep chugging along at over 1.1 million barrels per day.
2 wells have gone from ~850 bbld/~1,600 bbld to over 43,000 and 23,000 after nearby wells were frac’d.
The produced water went from negligible to 50,000 bbld and 80,000 bbld, which is significant on many levels.
This is one display of how the formation pressure – a much discussed topic on this site – can be increased to boost production from older wells.”
*There is this fascinating geology in the Middle Bakken which consists of laminated facies. That zone is oil dense and geo-mechanically weak, which makes it vulnerable to an increase in reservoir pressure, which further opens nano pores from the matrix. Additionally, since that oil is saturated, there is free gas in those new wells, looking for a way out. In this case it dissected the laminated facies, in the process stimulating the old wells nearby—the fabled “Halo Effect.”
This is the future for EOR, in my humble estimation. Laminated facies don’t exist everywhere, but they are common enough to exploit. Incidentally, this occurred in an area that was formerly designated as Tier 4, “condemned.” Marathon has developed some magnificent wells in this area–known as “The Bailey Field” in poor, downtrodden south Dunn County.
In the absence of laminated facies, injection of CO2 down the old wellbore has stimulated wells, but not nearly to this extent. But with carbon capture growing like a weed in a sidewalk crack, CO2 has to be stored somewhere, and no better place than down dead well bores. The Achilles heel of these shale basins has been more interconnectivity than had been thought likely. This is repairing the Achilles heel, and could result in another variable percentage recovery. In other words, they won’t all be this good, but probably economical.
“has developed some magnificent wells in this area”
They’re always magnificent …. until they aren’t. Disposable like a 5th-year running back.
Dennis
I have just downloaded the first big July dump from New Mexico, added over 1,000 kb/d to July vs smaller updates of 50 kb/d.
Attached is the oldest chart I have for the NM Permian vs the July update. The first chart has production data up to May while the second has data up to July. The focus here is to look at January, February and March to see how much production data has been updated over the last two months.
The first chart has January at 1,772 kb/d, February at 1,749 and March is shown at 1,771. The same months for the second chart are January 1,785 kb/d, February at 1,771 and March/April are shown at 1,803 kb/d. The two month increments for Jan to March are 13 kb/d, 22 kb/d and 32 kb/d.
By adding those same increments to Feb to April, Feb to April might look like this: 1,784, 1,825, and 1,835, respectively, red markers, two months from now.
To me NM appears to be rolling over but looking at earlier times there have been flat production spots before resuming its climb. The only difference I see is a higher GOR currently than in the past. It will be interesting to see which report has it right, DPR or LTO. Higher prices might change things.
July Chart
Ovi, as we’ve discussed in the past, a lot of these Delaware basin wells come in with a huge gas cut, and they let them run hard, so they hit the bubble point quickly. Then according to physics, the GOR goes higher. If according to script, the gas production will fall off in a few months, and that signals the end of terminal decline. That is happening in all solution gas driven systems, just faster in those front-loaded wells.
Like with all shale systems, only 8-12% of the oil in the matrix gets released into the throat of fractured pores. It is going to be very interesting to see if captured CO2 put down terminal wells will stimulate them to release another percentage. I suspect that Occidental knows the answer or would not have purchased the Canadian company, which you probably know much more about.
Not to be a downer, but the halo effect that Coffeeguyz wrote about–the two wells in S. Dunn county North Dakota–can’t be used as prototypes, because that formation possesses laminated facies that shatters like an eggshell with fracturing. That’s probably the reason for such a dramatic stimulation of the old wells by fracking the new ones. Very interesting period coming up in the shale fields!
Mr. Maddoux,
Several years back, North Dakota’s EERC released a ~20 page (pdf) report on Liberty’s Stomping Horse truncated EOR project.
Fascinating data, including the molecular make up of the recovered oil, which was heavily overwieghted towards the larger asphaltene molecules.
This seems to make sense as the larger molecules would originally block the throat pores more readily as pressure drops.
While I no longer follow these developments too closely, two recent, somewhat similar comments struck me as both odd and meaningful.
Professionals in the industry have stated that virtually all the oil entering the wellbore after a few years online is coming from the matrix only a few feet from the wellbore.
So, that ~500 frac propagation – either side – would be unproductive relatively early in a well’s lifetime.
When you consider a 50 barrel per day, 10,000 foot lateral is producing less than a quart of oil per foot ongoing, it seems to òffer such a huge, tantalizing return to those outfits who can crack the code in EOR.
Imma bettin’ that some operators already have succeeded somewhat in these efforts.
“Like with all shale systems, only 8-12% of the oil in the matrix gets released into the throat of fractured pores.”
All so interesting reading on what otherwise can be explained by random diffusion. The difference between the ad hoc empirical explanations one finds in geo-engineering and the well-characterized experiments we do on the microscopic level in the semiconductor labs is vast. It’s all the same physics math though.
Gerry
I will just keep on showing the charts. I will leave it to you to explain the physics associated with oil wells. In that regard could you explain this comment from above.
“If according to script, the gas production will fall off in a few months, and that signals the end of terminal decline.”
With my understanding of physics and pressure drop, I was expecting to see the word “beginning” where the word “end” is placed. By terminal decline I assume you are referring to the long slow-decline oil tail.
Well, I’m no professional–I’ve just studied it a lot by necessity. But no, I was not referring to the long slow decline oil tail. I’ll try to explain what I’ve learned from reading, and also by watching production curves.
These good shale wells go anywhere from two to six months without dropping much production. Then they begin that long slow decline which you referred to. That gradual decline proceeds for between three and five years. At some magical point in that gradual decline there will be a dramatic increase in the GOR, which signifies the bubble point. And that marks the beginning of so-called terminal decline, which is a phase of rapid decline. A lot of people figure that the high gas cut relative to oil will last for a long while at that ratio, but it doesn’t; gas production, too, drops after a few months. Mr. Shellman has some very nice curves showing this. When that happens, the well is end-of-life from an economical standpoint. Of course, the price of NG determines, to some degree, the point at which the well is a goner.
My supposition with this frenzy over carbon capture is that CO2 injection will coax a variable percentage of oil from those “dead” wells. Like coffee said, with a pressure drop the long-chain hydrocarbon molecules get stuck in the throat of the fracking pores. That is worse near the toe of long laterals. But what if it were possible to introduce a new pressure head, along with a solvent that would imbibe the larger hydrocarbons and pull them into the well bore? Enter CO2 from carbon capture. CO2 is very dense, builds reservoir pressure, and is an excellent solvent for hydrocarbons. CO2 flooding is old hat for conventional producers, but might introduce a new era for unconventional wells that are end of life.
Gerry
Thanks. You have clarified my question.
Original statement: ” and that signals the end of terminal decline”
Current statement. And that marks the beginning of so-called terminal decline, which is a phase of rapid decline.
It is the current statement that I was expecting in your first explanation.
Ovi,
Terminal decline is usually an exponential decline at some fixed percentage (10 to 15% per year), prior to this a well tends to have a “hyperbolic” well profile. See
https://petrowiki.spe.org/Production_forecasting_decline_curve_analysis
equation one is the hyperbolic and equation 2 is the exponential, I assume the output follows a hyperbolic curve fit to the first 18 months of output data until the annual decline rate reaches 12.5%, beyond that I assume terminal decline at 12.5% per year (exponential decline) until output reaches 15 bo/d and then assume the well is shut in.
The Average 2019 Permian basin well based on Novilabs data is shown below, terminal decline at 12.5% per year is reached at 82 months and cumulative output of 345 kbo. The well is assumed to reach its economic limit at 15 bopd at 181 months from first flow at cumulative output of 426 kbo.
Thanks Dennis
https://www.oilystuffblog.com/forumstuff/forum-stuff/stop-lying
The comments section is great on this one…Mike Shellman is writing some of the best and most important stuff on the internet.
No one is listening…but historians will look back and see who knew what he was talking about.
Thanks Andre, I agree.
I think PeakOilBarrel holds the same status.
It is great stuff. People don’t realize it yet.
I’ve learned alot from you Dennis.
Thanks.
Mr. Shellman thinks my stuff is crap, but I like what he does and have learned much from him.
Dennis
Just keep up the good work with the models.
Andre
I hear what Mike is saying and I am looking for some proof of the decline. As you have seen, I have started a special section in the Permian as part of the US Post. While I see a hint of slowing in the NM Permian, NM Permian charts above, it will take another three to six months to confirm a slowing growth trend.
I will let the facts speak for themselves.
You do great work Ovi! Keep it up!
Andre I agree, Ovi does excellent work.
EIA Forecasts Continued Decline In U.S. Shale Oil Output Bold theirs
The EIA expects shale oil production in the United States to decline for a third consecutive month in September, dropping to 9.39 million bpd.
The Permian Basin will make up for the majority of the decline with a 26,000 bpd reduction, closely followed by Eagle Ford which is set to see a drop of 17,000 bpd.
Despite the continued decline in U.S. shale oil output, the EIA still sees U.S. oil production hitting a record high this year and surpassing that high in 2024.
Shale oil production in the United States is set to decline for the third month in a row to 9.39 million barrels daily, the Energy Information Administration said in its latest Drilling Productivity Report.
That would be down from 9.433 million barrels daily for August and a record-high 9.476 million bpd for July.
Most of the decline would come from the Permian basin—the star of the shale patch. There, the EIA has projected a production decline of 26,000 bpd, followed by a 17,000-bpd output drop in the Eagle Ford basin.
Reuters noted in a report that the decline this month would be the biggest negative monthly change since December last year.
Ron,
In the past you have suggested the DPR is not very good (something about a warm bucket of spit as I recall.) I agree with that assessment.
Dennis, the guys at the EIA who do the DPR saw my criticism and said, “Hey, Ron Patterson, over on PeakOilDrum, says our predictions are not worth a bucket of warm spit. And looking back, he is right. So we had better get our act together.” So they did.
No, there’s no need to congratulate me, Dennis. I will just rest on my laurels. 🤣
Ron,
I think they have it wrong, but we will see.
Dennis/Ron
The DPR branch is listening to and believing Mike and that is why production started to fall in July.
October is projected to be down by 41 kb/d 9,391 kb/d.
Ovi,
The model is based on rig counts, but should be based on the completion rate. In order to match the DPR estimate we would need to see rising conventional output in non-DPR areas of the L48 minus GOM, it seems unlikely that this is the case. We will eventually see the DPR make corrections to their forecast for June to October.
Below I take the difference between STEO L48 excluding GOM and DPR for all regions and the average of that difference from March 2021 to Jan 2023 (about 1070 kb/d), then this value (conventional outside of DPR areas for L48 excl GOM) is subtracted from L48 excluding GOM STEO estimate to get an alternative estimate of output in the DPR regions and the estimate is compared with DPR.
For the DPR estimate to be accurate would require conventional output to have increased by about 14% in the Jan 2023 to October 2023 period in areas outide the DPR regions of L48 excluding GOM, which seems unlikely.
What the hell is going on in Russia?
Armed men storm offices of bankrupt Russian oil producer
More than 20 armed men stormed the head office of a bankrupt oil producer in East Siberia last week in the latest twist in a battle for control over a lucrative export project.
Two videos distributed on Russian social media showed a group of armed men allegedly landing at the site by helicopter, searching and removing personnel from what are believed to be offices belonging to Dulisma, a producer that declared bankruptcy in 2020.
Dulisma is owned by Russian businessman Alexei Khotin, who has been under house arrest on embezzlement charges since 2019.
The company was declared bankrupt in 2020 and a court approved temporary receivership to work out a debt repayment plan or sale of the company.
Dulisma successfully appealed to have the decision overturned, only to be hit by new bankruptcy rulings in 2021 and 2022.
Irkutsk regional news outlets suggested that the armed men were dispatched by a new, unidentified owner who reportedly purchased almost all of Dulisma’s shares held as loan collateral by state-controlled Rosselkhozbank.
The bank issued the company loans totalling 80 billion roubles ($840 million) in 2014 and 2016, Moscow-based news agency Interfax has reported.
Along with Russian tax authorities, Rosselkhozbank asked arbitration courts to intervene, saying the producer still owes about 53 billion roubles in loans.
Russian independent news outlet PravdaUrfo said the same armed men were reportedly seen in December 2022 raiding the offices and facilities of another oil producer, Kayum Neft, which operates in the Khanty-Mansiysk region in West Siberia.
A video on the chaos in Russia.
Video: Watch Ukrainian special forces reclaim offshore platforms from Russia as fire burns on at gas facility a year after strike
Russia has lost the ability to fully control the waters of the Black Sea, which makes Ukraine many nautical miles closer to the return of Crimea, commentator says.
Ukraine has claimed to have regained control of oil and gas platforms in the Black sea that Russia took over following its annexation of the Crimea Crimea Peninsula in 2014.
And a video released by Ukriane’s military intelligence department this week also revealed that regional producer Chernomorneftegaz apparently continues to neglect a fire at another platform, a shallow-water gas producing facility that was hit by a Ukrainian strike in June last year.
The fire on a stationary production platform at the Odesskoye field south of the port of Odessa has been raging since June last year, with traces of smoke extending for dozens of kilometres and often visible in NASA satellite images of the Earth.
The 15-minute video also shows several inflatable-boat raids by Ukrainian special forces to other platforms at the field to remove Russian radar equipment installed on drilling rigs.
The video suggests that Chernomorneftegaz apparently mobilised four of its jack-up drilling rigs to the Odesskoye field — the largest in gas reserves and the closest to Ukraine’s shores — mooring them next to stationary unmanned production platforms to serve as hosts for air radar and military personnel.
There is a lot more to this article. Click on the blue headline above to read it.
Can the Economy can handle $100 oil
Oil prices are on track to soon cross the $100 per barrel level, but the economy should be able to handle the higher costs of the key energy commodity, Chevron CEO Mike Wirth told Bloomberg in an interview on Monday.
West Texas Intermediate crude oil has surged nearly 30% since July and hit a high of $91.36 on Monday, while Brent crude oil jumped to a ten-month high of $94.95. Prices for gas at the pump are also on the rise, with the average national gas price rising to $3.88 on Monday, according to data from AAA.
https://ca.finance.yahoo.com/news/oil-prices-track-hit-100-035807310.html
Ovi – For all that oil does it’s still really cheap. Take a look at Hong Kong, gas is $13/gallon there vs $3 in Texas. I remember $0.99/gallon in 90s, that would be $2 with pricing adjusted for today. Until gas hits $4-5 per gallon in Texas I’d say it’s still extremely cheap.
Even if gas goes to $10 a gallon, it’s still less than 10% of most people’s income.
WTI continues to gain $10 per month, I don’t see that stopping until Dec/Jan…so $115-130 by next year.
In Singapore oil is already $100 a barrel…
Kangeo
I remember buying my first gallon for 25¢. After $100/b, there will be less discretionary spending. Will this result in core inflation going down as CPI is driven higher by gasoline?
CPI is mainly housing/rent. Oil isn’t nearly important. Oil could go to $120-$130. But if real estate tanks during same time. CPI will fall.
Incomes are massively not keeping up with prices. Banks are tightening lending standards big time. Credit is getting turned off.
Someone please explain to me where the money is going to come from to support $92 oil much less $120-$130 oil.
Of course the CEO of Exxon is going to say higher prices are no problem. If he actually believes that he not in touch with reality.
Consumers are getting squeezed from every angle. Oil is just part of the problem. If high oil prices were the only problem maybe $120 oil would be feasible.
US consumers are pretty much maxed out on their credit. And will have to start paying down those balances.
When those balances are paid down or say when student loans are paid down. Money is destroyed. Just like when you pay the principal portion of a mortgage money gets destroyed.
We are heading into more money being destroyed than money being created as banks are tightening and consumers will be left with little choice but to start paying down debt.
Back in 2008-2009 those who were leveraged long oil futures were forced to sell. It had nothing to do with supply and demand. And oil prices took the elevator down.
This time won’t be any different. Might actually be worse.
Real family income
https://fred.stlouisfed.org/series/MEFAINUSA672N
Ron – I wonder if Russia is the canary in the coal mine for global collapse? The Russian economy peaked 10 years ago and things aren’t so great anymore, not sure if/when it might get better there…hope they don’t launch the nukes in the meantime…
New posts are up.
https://peakoilbarrel.com/opec-update-september-2023/
and
https://peakoilbarrel.com/open-thread-non-petroleum-sept-19-2023/