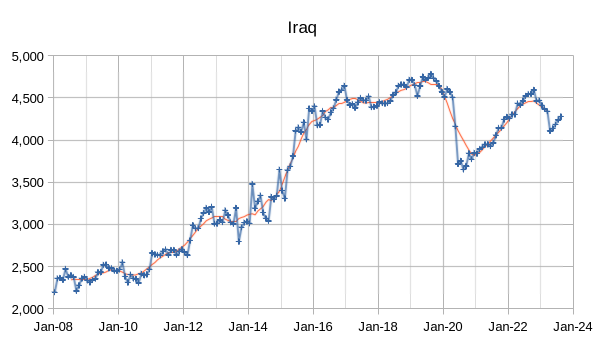
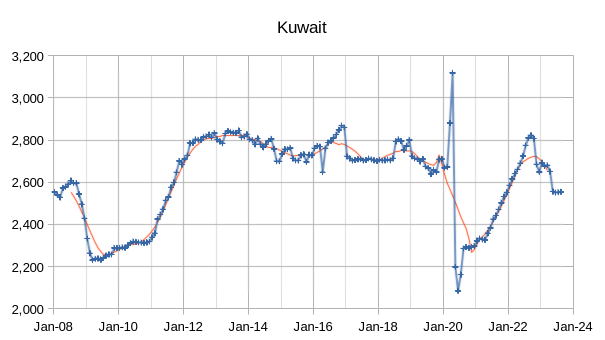
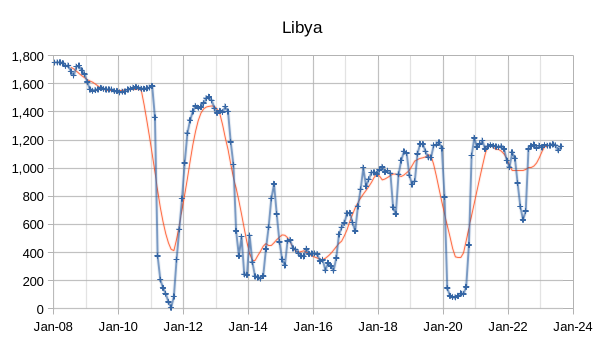
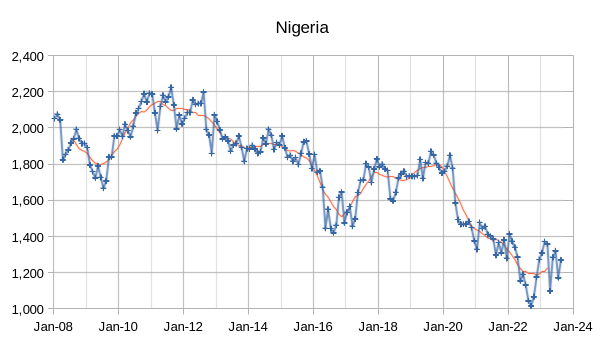
The OPEC Monthly Oil Market Report (MOMR) for September 2023 was published recently. The last month reported in most of the OPEC charts that follow is August 2023 and output reported for OPEC nations is crude oil output in thousands of barrels per day (kb/d). In many of the OPEC charts that follow the blue line with markers is monthly output and the thin red line is the centered twelve month average (CTMA) output.
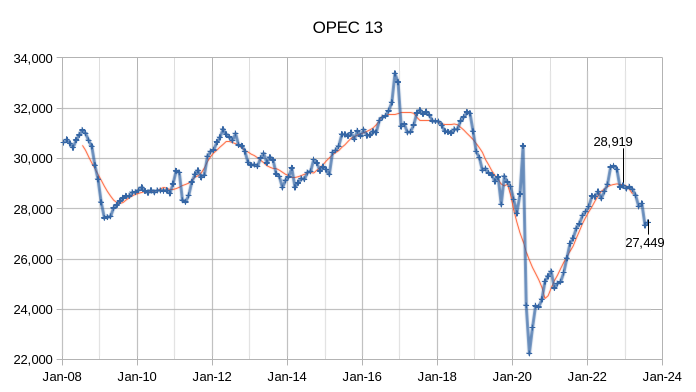
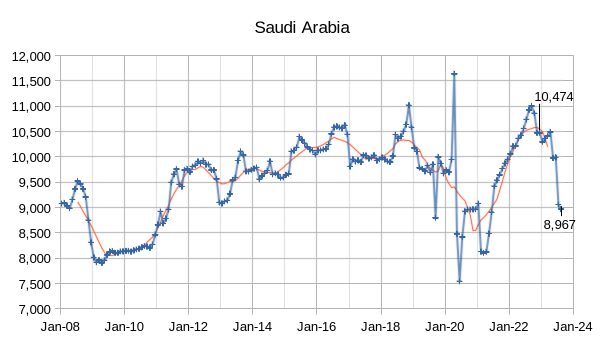
OPEC crude output was revised higher in July 2023 by 26 kb/d compared to last month’s report and June 2023 OPEC crude output was revised higher by 54 kb/d. When the World was at its CTMA peak for C+C output in 2018, OPEC crude output was about 31300 kb/d and by August 2023 OPEC crude output had fallen to roughly 3851 kb/d below the CTMA peak in 2018. The OPEC 13 crude output in December 2022 and August 2023 are noted on the chart, with OPEC 13 crude output falling by 1470 kb/d in the past 8 months. In the Saudi Arabia chart below we find that output fell from December 2022 to August 2023 by 1507 kb/d so that the OPEC 13 cuts during 2023 mirror the Saudi cuts (with the Saudi cuts actually being 37 kb/d more than the cuts by the rest of OPEC combined.)
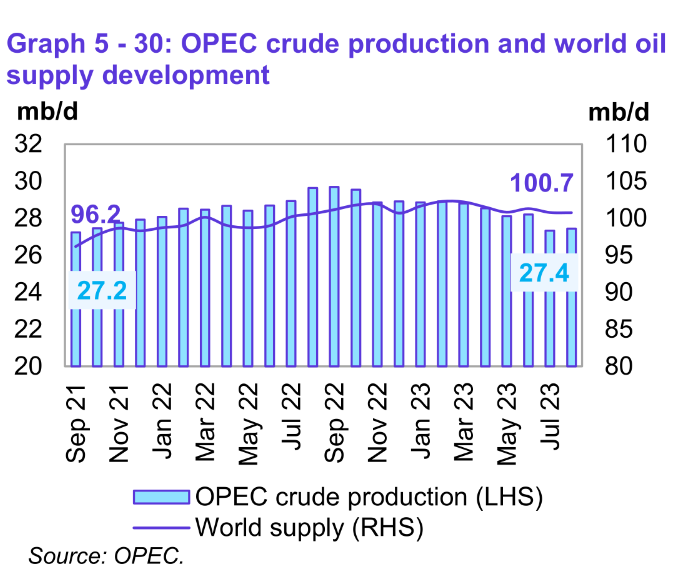
Preliminary data indicates that global liquids production in August was unchanged from last month
and averaged 100.7 Mb/d. World liquids output increased about 3.5 Mb/d in the past 23 months (from 96.2 Mb/d in September 2021).
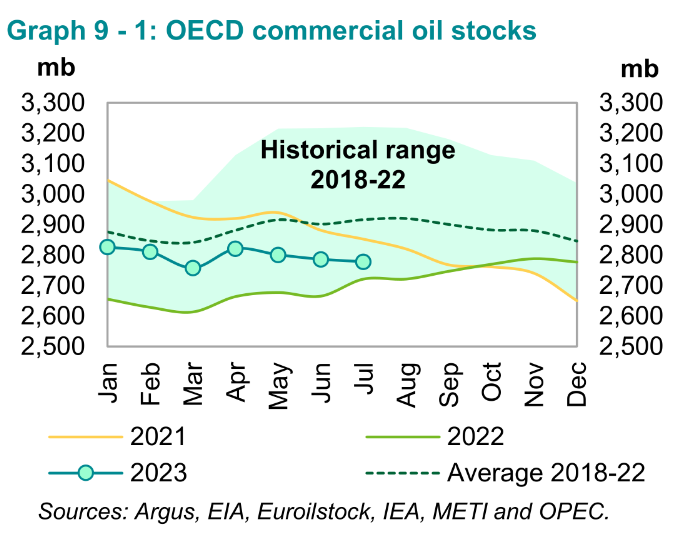
Preliminary July 2023 data sees total OECD commercial oil stocks down m-o-m by 7.9 Mb. At 2,779 mb, they were 57 mb higher than the same time one year ago but 138 mb lower than the latest five-year average and 190 mb below the 2015–2019 average. As OECD stocks come closer to the bottom of the 5 year range we may see oil price spike further.
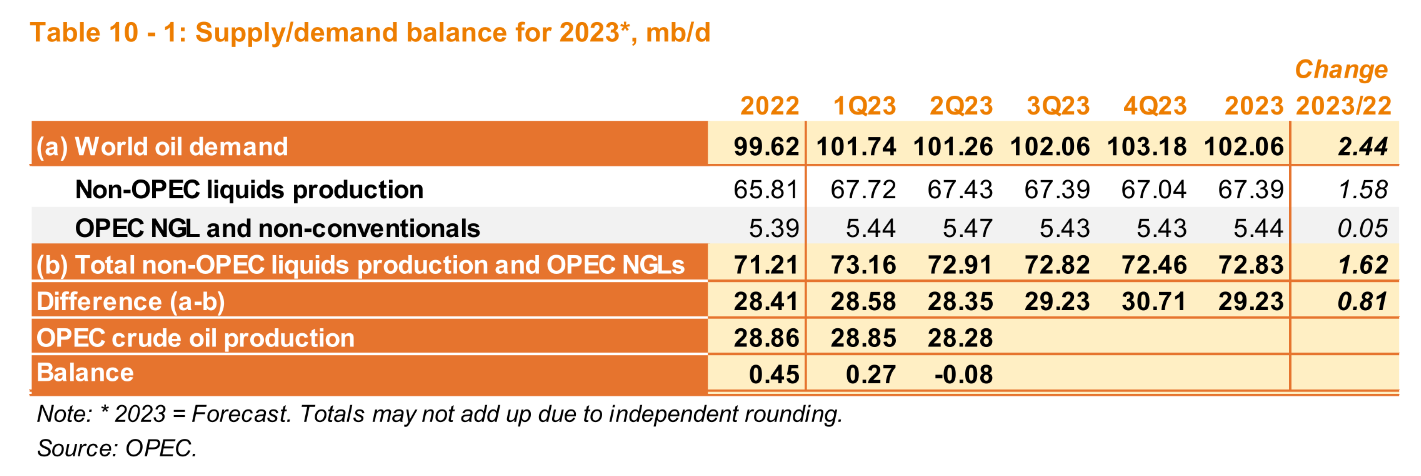
If OPEC continues to produce at the August 2023 level of about 27.4 Mb/d of crude oil, we will see a significant draw in World Oil stocks, assuming OPEC estimates for Non-OPEC Oil Supply and World Oil Demand are correct. My expectation is that the World Oil Market will become very tight and oil prices should rise, unless OPEC increases output to balance the OiI Market. It is also possible that OPEC is overestimating future demand for oil, higher oil prices might lead to slower growth in World demand and perhaps higher non-OPEC output which would reduce the call on OPEC.
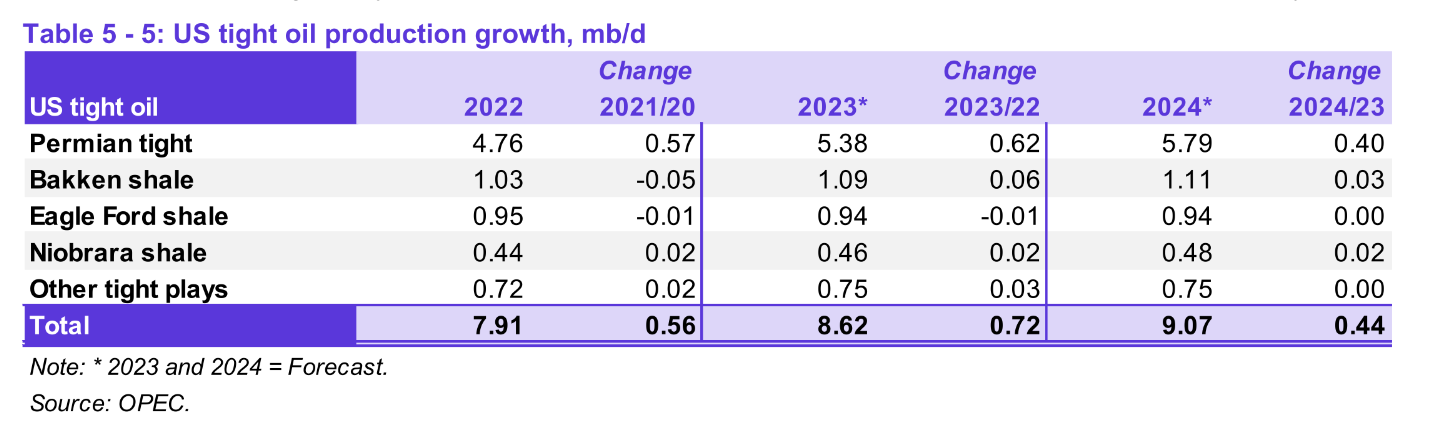
OPEC has reduced its estimate for US tight oil growth to 720 kb/d in 2023 and 440 kb/d in 2024 compared with last month’s estimate (760 kb/d in 2023 and 490 kb/d in 2024). The estimate for 2023 is similar to my scenario (723 kb/d increase in average annual tight oil output from 2022 to 2023), their estimate for 2024 remains a bit more optimistic than my scenario (with a 358 kb/d increase in annual tight oil output in 2024).
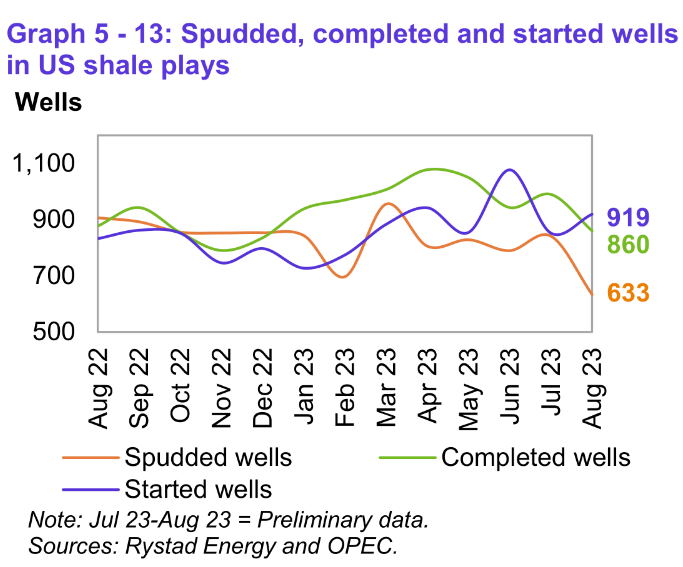
The numbers on the right are August 2023 preliminary estimates for Started, Completed, and Spudded wells in the EIA-DPR Shale regions. For July 2023 the preliminary estimates are 841 wells spudded (up 52 wells from June), 990 wells completed, and 852 wells started. Historically the preliminary data for the most recent two months has usually been revised higher in the future.
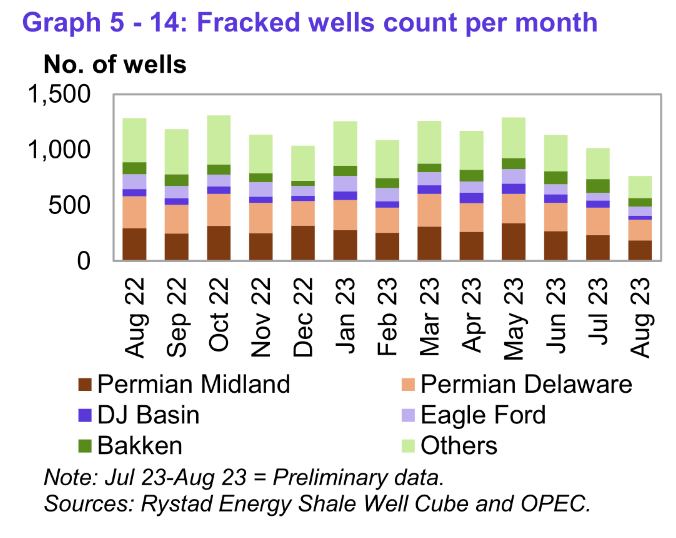
Again the most recent two months of data is usually on the low side for fracked wells. Rystad reported that 1133 oil and natural gas wells in shale regions were fracked in June 2023, 1017 wells fracked in July and 765 wells in August. The breakout by region was 482 wells fracked in July in Permian, 127 wells in Bakken, 67 in Eagle Ford, and 64 wells in DJ Basin (Niobrara). In June there were 523 wells fracked in the Permian.
264 responses to “OPEC Update, September 2023”
Thanks for the post Dennis. Great work as usual.
(post 1/x)
Saudi Arabia oil production update.
Saudi Arabia (abbreviated to KSA) is one of the most important countries in terms of world oil
supply, and even more so in terms of exports. On the other hand, it is one of the most opaque when
it comes to oilfield figures. The URR of some of them, such as zuluf or khurais for example, can
vary according to estimates from simple to quadruple, and their proven reserves are in practice
worth very little. The purpose of this post is to try and shed some light on the Saudi situation and to
assess a long-term forecast (2050) of its oil production. I would like to point out that I personally
have no connection whatsoever with the oil industry. I therefore apologize in advance for any errors
I may have made, and would be happy to engage in a debate on the subject, provided that openmindedness
and respect are the order of the day.
Historical outlook of the production
During the 20th century, production was dominated almost entirely by Ghawar, Safaniyah and
Abqaiq (chart 2), who are, in the words of Matthew Simmons, the king, queen and queen dowager.
A turning point came in the 2000s, with a number of fields coming on stream or back into
production, making up the rest of the royal family.
Thanks for the info. Would it be possible to show the cumulative totals for each field and some indication of decline rates for the older fields?
yes it’s possible but since i cannot post more than one graph per post, it would be rather annoying and difficult to read. And as far as i know there are only two fields in decline : Abqaiq and Ghawar. I have planned to post a chart with the historical and forecasted production for the last one. The majority of others are in plateau and a very few have probably still a growth capacity (notably Zuluf, marjan and shaybah)
Your chart ends in 2017. As Ghawar production was reduced at 3000 kb/d in 2021, the whole chart should be contracted by now as the rest of the little oil fields have not probably increased their own production as you stated below. Am I wrong?
Je suppose que je peut vous parler en français (if not it would be an horrible mistake of my part). Le graphique se termine en réalité en 2018 (libreoffice n’avait pas la place pour charger la dernière année je suppose). Mon estimation personnelle (que j’ai posté plus bas) est que les autres gisements saoudiens seront en mesure de combler le déclin de Ghawar et Abqaiq pour quelques années de plus jusque vers le milieu de la décennie 2020. Dennis et Jean Laherrere ont une estimation plus optimiste et Mathew Simmons et de nombreux autres furent beaucoup plus pessimistes. Nous verront comment les choses vont évoluer mais la situation saoudienne n’est pas très réjouissante. Celle de la Russie est peut-être encore pire, donc je suppose que la décennie dans laquelle nous sommes sera (et est déjà) mouvementé en terme de production et du prix du pétrole.
J’espère avoir répondu à votre question 🙂
Merci de la réponse. Attention aux conjugaisons et aux accords pour les participes passés mais merci de l’aimable effort. Je pense, qu’à mon tour, mon expression en anglais n’est souvent pas très propre malgré mes efforts.
(post 2/x)
Table 1 : Major Saudi oil fields production, reserves (own estimation), depletion and crude oil quality
Thank you for the information. According to the table there is 94 Gb left (assuming no reserve growths), which is roughly 3 years of C C world consumption.
If they produce at an average of ~ 10 million bpd it will take ~26 years for their remaining reserves to finish.
Interesting. Great stuff.
26 years left for Saudi, but that was almost five years ago. On average that would imply about a 5% decline from now on. Typically fields come off plateau somewhere between 5 and 10%, so that kind of ties in with everything.
George,
Do you think there is anyway they could reduce and sustain a decline rate of < 5%
Probably yes for a few years, but at some time water break through is going to catch up with them and decline will be steeper. For horizontal wells decline can be dramatic for a couple of years and then will settle down to lower rates. I’m not saying that will happen but it may on some of the fields as they age, and when or if they get to less than 10 years R/P then they will simply have to accept fate and decline will be 10% or more.
Thanks, if you just post line curves for the declining fields on a single chart (i.e. not stacked) it would just need one extra chart, maybe use primary and secondary y-axis if there is a big gap from Ghawar to the others.
FRENCHFRIES,
Jean Laherrere sent me his most recent Chart for OPEC oil production & Forecast. According to Jean, the URR for OPEC is 125 km3, or 786 Gb with 85 km3 of cumulative production or 534 Gb.
Thus, the 534 Gb of cumulative OPEC production is 67% of the 786 Gb of URR. This fits nicely with your figures when we update the cumulative production over the past 5+ years.
steve
Here is Jean’s HL of OPEC’s oil production. It seems the 125 km3 URR is the more realistic trend-line.
Interestingly, due to advanced EOR, it has changed the HL trendline to become steeper. I believe the URR will likely trend even lower in the years ahead
steve
Steve,
OPEC reduced output a lot in response to the pandemic. If we use the 10 years from 2010 to 2019 we get an estimate very similar to the 20 and 30 year estimate for URR.
Steve and others here is mine, It is based on BP data so all liquids since we only get consumption data for that.
Its looks like peak export level for OPEC in this century was 2004, and will never be higher.
KSA….if vertical wells were used from 1975-2000 for 1P recovery and horizontal wells from 2000-2023 for 2P…and 3P is not possible is KSA empty or on last 10% of field ability…
I have seen nothing to suggest that the 2P estimates for reserves don’t still give the best number for final recovery. These would be something like 95% of proven, 50% probable, 5% possible and, maybe, a tiny amount for contingent. There is no theoretical reason these should add to the 2P number, but in practise they tend to do so. As fields get more mature the proportion from proven and probable go up (reaching 100% the day it shuts down) and those from possible and contingent go down. Rystad publish 2P numbers based on well by well analysis, which is about as good as you can get without having direct access to the operator’s full scope reservoir models.
Using EIA data from 1973-2022 and OPEC data for cumulative output to 1972, I get the following Hubbert Model based on an HL from 2001 to 2022. URR is 348 Gb, peak for model is 2024 at 10.2 Mb/d.
Dennis
What do you think Saudi Arabia maximum production is now and how long could they maintain that?
Charles,
I think they might be able to maintain 10.2 Mb/d for 5 years, but this is speculation on my part.
Hickory,
Cumulative production for Saudi C plus C was about 168 Gb at the end of 2022, the Hubbert model has cumulative output at 168 Gb at the end of 2022. Cumulative output was 17.5 Gb at the end of 1972, I have adjusted the Saudi crude cumuative output by assuming the ratio of C plus C to crude was similar to the 1973-1980 ratio prior to 1972.
Dennis
That’s probably not far off, perhaps they may produce 11 but for a shorter period of time.
And you think U.S oil will peak around 2028?
Charles,
Yes 2027 or 2028 is my best guess for US peak.
What has been the cumulative Saudi production thus far?
Hubbert linearisation doesn’t work if there are artificial limits imposed (Hubbert said so himself); the tighter the limits the worst the results and Saudi above all others has the most constraints imposed so will have the most inaccurate predictions when using HL.
George,
I agree.
Dennis, what do you use as the cumulative in 1970? Not that it matters much, for I get URR=350.8 and peak year 2023.5 with data from 1960 on, and starting cumulative of 6 Gb that I fixed so that it checks with Colin Cambell’s cumulative of 91.4 Gb in 1999.
Incidentally, Dennis Coyne, I met Kenneth Deffeyes at the Baker peace conference in 2003, and he mentioned there to me that he did not know anybody who initially rejected Hubbert’s analysis and later changed his or her mind. You are an exception to this, so kudos to you. https://www.ohio.edu/cas/contemporary-history/news-events/baker-peace/past
Professor Korpela,
I have cumulative C plus C output of 104.86 Gb at the end of 1972 for OPEC, for Saudi Arabia I have 17.55 Gb cumualtive C plus C output at the end of 1972 and 168.6 Gb at the end of 2022.
A problem with Hubbert Linearization is that the endpoints of the data chosen is subjective. So there are multiple answers depending on the endpoints chosen. For KSA if we choose a 20 year interval of data the result changes from 362 Gb before the pandemic to 329 Gb after the pandemic for the URR estimate. The average of the two would be 345 Gb, so perhaps 345 plus or minus 15 Gb would be a good rough guess based on this methodology. Laherrere guessed around 300 to 350 in 2018, call it 325 plus or minus 25 Gb. I think anything less than 325 Gb is likely too low for KSA URR and 345 Gb would be my guess.
Clarification of a prior discussion topic-
People have talked about peak oil demand.
Perhaps we will see peak light transport gasoline demand sometime soon,
but I am skeptical that we will see peak demand of all other oil derivatives
in the next couple decades.
My thinking on this takes into account the growing population and purchasing power of the global economy, especially in emerging markets countries where the energy and material per capita demand catchup process will continue with strong momentum. Also, all of the other oil derivatives, from diesel to aviation fuel to bunker fuel, are much more difficult to replace than is light transport fuel.
The king, the queen and the queen dowager.
Ghawar, truly the “king of all kings”, is an aging giant that long ago passed its peak production (exactly in 2004 at 5772 kb/d) and is now seriously depleted. Most URR values are between 80 and 120. 80 is far too low a value; it has already produced that amount. 120 seems too high given the actual decline rate of this field (almost -125 kb/d per year). A linearization gives a URR of 100 Gb with an r2 of 0.99. This is the value chosen for the following chart, who represent the historical (till in 2018) and forecasted production of Ghawar for an URR of 102 Gb and a subsequent decline rate of 5,5% per year.
Laherrere estimates about 123 Gb for Ghawar URR.
See pages 117 to 118 at link below
https://aspofrance.org/2018/10/03/updated-extrapolation-of-oil-past-production-to-forecast-future-production/
yes i think my estimation can be a bit low, it would be interesting to see the impact of the URR with 10 and 20 Gb more.
(post 4/7)
The rest of the royal family
The rest of the “royal family” includes numerous fields, most of which were only recently brought into production in the early 2000s, notably khurais and manifa. They are geologically complex and, in the case of manifa, the oil is of poor quality. Bringing them into production has required billions of dollars of investment and the installation of hundreds of wells, whose flow rates are much lower than those initially drilled in Abqaiq and the northern part of
Ghawar. They were developed progressively, theoretically enabling production at 12 mb/d, which has been much vaunted for years, but is doubted by many analysts.
The following chart represent the Saudi Aramco official targeted production level in kb/d for the 9 others major Saudi oil fields.
(post 5/7)
In practice, it is remarkable to note that they are all well below production targets, albeit with wide variations between fields (chart 8). The question is whether this underperformance is deliberate, as Saudi Aramco does not feel the need to exploit them to their full potential (despite repeated calls to do so or during their attempt to “kill” American shale), or whether it is a sign of difficulty in pushing production as well as maturation of the fields. I suppose that if, in the coming months/years, the oil market tightens up (and I think there’s a good chance it will) and prices soar, with the OECD countries calling on us to increase production, we’ll be able to see whether or not
these fields can deliver on their promises. In which case, their reserves are far greater than the estimated reserves on which the following forecasts are based. Moreover, it should be noted that their depletion rates are significantly higher than those of abqaiq and safaniyah. Perhaps this reflects Saudi Aramco’s need/willingness to push them as fast and as high as possible to maintain overall production for as long as possible. In any case, even with the official figures, Saudi Aramco doesn’t have much room for manoeuvre left, which implies that in the absence of major new projects, Saudi oil production is doomed to decline in the medium and long term.
Chart 8 : «The rest of the royal family» 2018 real production in kb/d in comparison of the official data.
French Fries
Great charts. Thanks for sharing.
Thank you for these charts. If you don’t mind me asking. but I would be delighted to know from where do you get the data?
sorry for the late reply. I have found a few months ago a paper made by a saudi geologist who assess the futur of the saudi oil production. But when i have used the data to explain why i think KSA is close to it’s peak of production, he have used them to prove that KSA can still produce a lot of oil (even at 15 mb/d) for the decades to come.
Thank you FRENCHFRIES for all the interesting charts and information, these would have made a awesome blog post IMO !
FRENCHFRIES: You posted a remarkable and illuminating series of graphs and charts. Thank you very kindly, sir!
FRENCHFRIES – Thank you for this contribution, I agree it would be a fantastic stand-alone post.
The take-home from my perspective is that all data points to a significantly lower URR than many/most expect. I believe it confirms what many have said here that OPEC managed to keep production relatively high well beyond the 50% URR mid point of ~2000-2010. Most likely OPEC is down to the last 25-30% of their oil supplies and production must fall as they keep overproducing their reserves. Their massive divesture of oil and investment in everything else confirms the view that they realize they only have ~10 years left before they run out/low.
We can narrow this entire assessment down to 4-5 countries, those with estimates of oil reserves (2P) of more than ~30 Gb: Saudi Arabia (70), Russia (60), US (50), Canada (50), and Iraq (40). They produce more than half the worlds oil.
This is very significant, it means that worldwide we can expect production to decline between 3-4 Mb/d each year.
About 4-5% annually.
Reality may be that we have even less remaining, a total URR between 1,750 and 2,000 Gb. 1P = ~250 Gb and 2P = ~500 Gb. If 1P is that low, we can expect decline rate >10%, which will be a very difficult pill to swallow.
Without any doubt, a 10-year plateau is simply not in the cards. If there is more oil to be found/grown, it will not change the next 5-10 years of decline.
Kengeo,
Note that the OPEC data excludes extra heavy oil from Orinoco, so this might add another 100 Gb to OPEC URR, in 2018 Laherrere estimated OPEC C plus C URR at about 1200 Gb. Generally Mr Laherrere is fairly conservative in his estimation of URR.
Can you remind us of your prediction for 2024? It seems you now are expecting 10% decline, so if you accept 81.5 Mb/d as a reasonable guess for 2023, you might expect 73.4 Mb/d for annual average output in 2024? Or maybe its 5% decline which would be about 77.5 Mb/d for World C plus C in 2024.
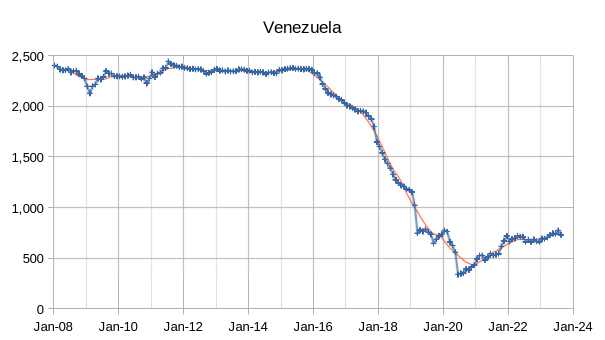
Dennis – Oil from Venezuela is getting produced at <1mb/d, even if they can return to ~2 mb/d, it will not matter in the greater context of global oil depletion. By the time they add ~1.5 mb/d, so many other countries will have depleted by a total amount 10 times that…it's certainly not an argument that it will add to global supplies, more likely they will use all or most of it for themselves, for example from 2012-2014 Venezuela used ~0.8 mb/d. All big ifs, but if they can produce more, it's unlikely much will go to world market (likely be 1-2 countries that benefit, most likely China)….
Kengeo,
Any oil used on planet Earth is part of the World oil market, oil sold by Venezuela to China is oil that China does not need to purchase elsewhere. I tend to agree Venezuela may not contribute much to future World output, my scenario has a very low estimate for extra heavy oil URR, about 100 Gb total from both Canada and Venezuela and about 72 Gb of LTO output from the US, total conventional C plus C output for the scenario is only 2500 Gb with total World C plus C URR of only 2670 Gb (830 Gb less than the 2022 estimate by Laherrere et al of 3500 Gb for World C plus C URR).
Dennis –
Since 2006, the rest of the world has been declining by 1.1% annually.
If we exclude N.A. from the equation, all others are declining by ~1 mb/d (~1.4%). Currently down ~4 mb/d since the 2018 peak.
With relatively short supply, U.S. will see considerable declines soon of at least 1 mb/d each year.
I expect that we will see annual decline of at least 2 mb/d.
Over the next decade or so the rate of decline may be moderate (~2.5 – 5%).
By the 2040s it will skyrocket above 5% and then hit 10% by 2050s.
Production will fall to essentially zero in the 2060s.
If you assume low decline rates of only 1-2%, that means relatively high continued production levels (>40 mb/d thru at least late 2050s) and in turn means we run out sooner (by the mid 2050s).
We are at the transition point from ~10-15 years of peak oil plateau. Now we are entering the decline phase, it will increase each year (as we are already starting to see).
See graph below in response to Frenchfries question…
Kengeo,
I think you need to check your data more carefully. Your OPEC plus CIS, plus US, plus Canada as big producers and resof world defined as World minus this big producers group has been declining at about 1% per year for C plus C production since 2006, about 245 kb/d per year, the big producers have been increasing at an average annual rate of 662 kb/d per year (this includes the years of pandemic oversupply where output was cut i response to oil glut).
If we look at the pre-pandemic period of 2003 to 2019 we find the big producer group increased at an annual rate of 951 kb/d per year and the rest of the World declined at about 220 kb/d per year, a net increase for the World of 731 kb/d per year. The future rate of increase will be lower than this probably on the order of 400 kb/d per year on average from 2023 to 2027, then I expect output to gradually decrease at an increasing annual rate over future years as the world weans itself from oil use.
Dennis – See below, your increasing production suggests a URR of ~3,200 Gb.
1P suggest URR of 1,850 Gb (maybe this is too low, but we don’t know for sure yet, likely 80-90% chance it’s too low).
2P suggest URR of 2,000 Gb (50-50 chance of being about right, therefore this is the “Best” guess based on a coin flip).
2PC suggest URR of 2,750 Gb (<10% chance of being correct, likely too high and doesn't seem to match production data). Your value of 3,200 Gb matches closest to 2PCX, I'm not sure what probability 2PCX has of being close to the actually figure (I would guess <1%).
The highest URR I'd support you on is ~2,400 Gb, this would imply world peak of ~2014 which generally matches for conventional oil.
But even if you want to use ~2,750 Gb, still peak was several years ago…so don't think there's a remote chance of growth of next several years…
Kengeo,
As I have mentioned several times, conventional and unconventional oil should be modeled separately, the peaks do not occur at the same time. For conventional the peak was 2016 (cumulative reached 50% of 2500 Gb URR in 2015), for uncunventional the URR is 170 Gb, peak is 2027 at cumulative of 72 Gb.
A single Hubbert curve doesn’t get the job done, you need two.
Venezuela is shipping a lot of water with the oil, and that is separated at the receiving port. That is what some refinery guys at the gulf claim.
Kengeo,
I agree with your assessment that a 10 year plateau seems to be quite unlikely assuming the relevant data supplied is an accurate reflection of whats on the ground.
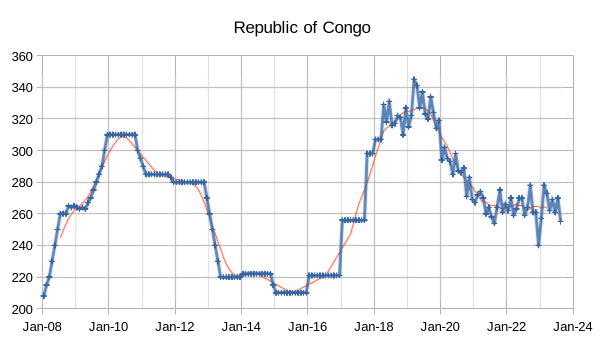
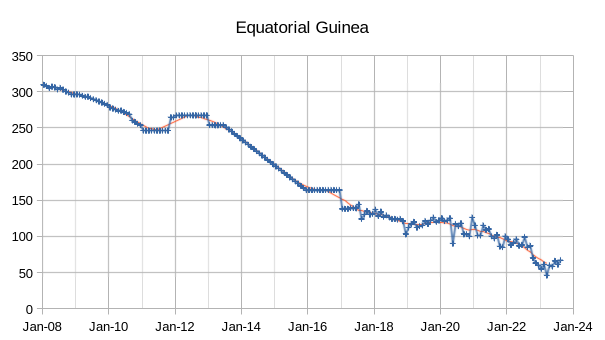
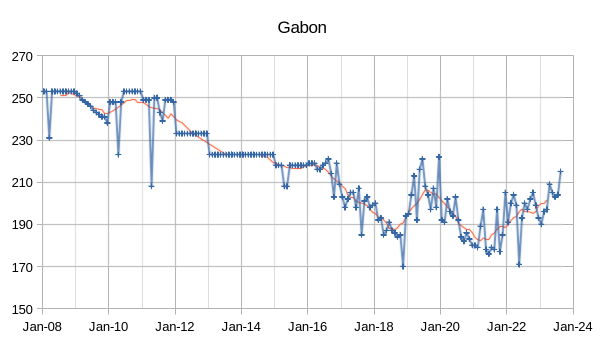
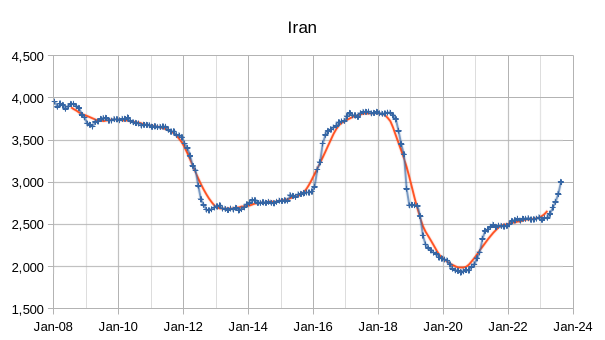
Thanks Iron Mike, it seems the list of production losers is growing…I guess at this point it might be the only list there is…just scanned all the charts above, all losing production over the last 3-5 year period…
It would probably be interesting to make a forecast for each of the 10 majors oil producing countries since the world minus these “Big ten” is in decline since almost 20 years (Ron have post pretty nice graph about this in the past).
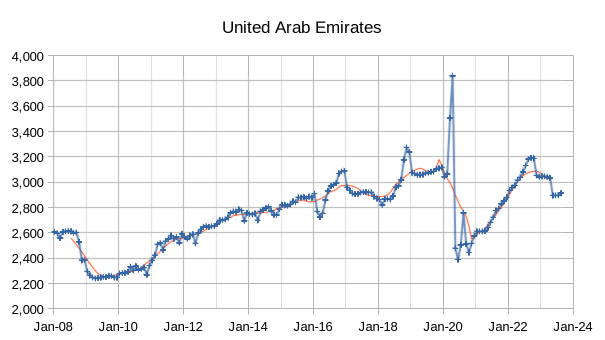
Thank you FF (fossil fuels or french fries). To add to your pots, there are only 22 countries in the world that export over 100 kb/d and of those 16 are past their production peak so that leaves only 6. Those beyond the peak lost 7 Mb/d of exports between 2008 and 2022. That is from 17 Mb/d to 10 Mb/d. The countries left are Saudi, Irak, UAE, Canada, Oman, and Kazakhstan, Kuwait peaked in 1972 and Iran in 1974. Mexico is joining the list of importers, and my guess is that Brazil will likewise as the domestic demand increases. Again the numbers are for all liquids because we only have consumption data for that.
We are already 9 years into the peak plateau phase…here that chart again.
Hickory,
I tend to (probably mistakenly) count the plateau from the peak onwards. So I dont think the plateau can be sustained to 2028 is what i meant. Of course the plateau is subjective and can include or exclude many data points.
Mathematically it probably makes more sense to have the peak in the middle
Iron Mike,
As Hickory defines the plateau (and it seems as good a guess as any to me, I agree most things are subjective) my best guess scenario has output remaining above the lower limit of Hickory’s plateau until 2033 (average output that year would be 80.4 Mb/d). The plateau would start in 2014 and end in 2033 with average output over that 20 year period at 81.3 Mb/d, the midpoint of that plateau would be 2023/2024, I have the peak at 2027, but any year from 2018 to 2029 is likely and we have the data through 2022 and know the current peak is 2018, my best guess is 2027, but it could be any year from 2025 to 2030 in my view, the specific year is of little importance in the grand scheme.
Dennis,
Yea that seems like a reasonable prediction to me also. One reason i like your prediction is that I think its entirely possible that a slowing global economy might possibly delay a second peak into the late 2020s.
On the other hand, if the global economy continues humming BAU, if the 2018 peak isn’t surpassed or equalled by 2025 we won’t see the 2018 peak beaten. And a terminal decline will start by around 2025 which has been my initial guess for peak oil.
My prediction is entirely dependent on the global economy and the global economy is entirely dependent on credit expansion. There is a lot of moving parts.
Iron Mike,
Your scenario also sounds quite reasonable, I agree there are many moving parts all of which are difficult to predict, also possible that we never reach the demand levels of 2018 due to a combination of higher oil prices, a slowing economy and the transition to electric land transport. I discount this last possibility in my scenarios, but my thinking is that this is the most likely reason that 2018 would remain the peak in World centered 12 month average output for all time.
Iron Mike- “My prediction (on oil production peak) is entirely dependent on the global economy and the global economy is entirely dependent on credit expansion.”
And credit expansion decisions by government/banking system is in part dependent on inflation considerations, which in turn is partly dependent on energy prices.
How does humanity spend a lot more money on energy systems (equipment and fuel) without escalating inflation, which in turn requires credit tightening?
Its a failing spiral scenario.
Repercussion of Overshoot in a finite world.
“… the specific year is of little importance in the grand scheme.”
I very much agree with Hickory’s definition of a plateau and that we’re more or less at the middle of it. Technically I also agree that the precise year of the peak is of minor importance (we might see two peaks, an absolute one in 2018 relates to monthly data, and another one in the near future related to running average). But my concern is, especially in these times of a not so cold war and the strategic importance of reserves, how markets will react. IMO the jigsaw of limited production and a resulting recession should soon show another ugly tooth.
By the way, where’s Ron? I didn’t read anything from him. Hope I’ll be able to check this post later, my connection is as weak as the battery …
“the specific year is of little importance in the grand scheme”, i completely agree with you, and i found sad that many economists or writers who talk about energy or the “demise of peak oil” focus only with a specific year who, if exceeded, would then prove that the whole peak oil debate is completely wrong (Forbes, NYT or Thefiscaltimes have many articles of this kind).
Iron Mike and others –
After looking more closely at production data, I think I’ve figured out what is going on…
Between late 1980s and 2008 oil production increased at a rate of ~1.4% annually.
By 2008 oil production plateaued and remained there until 2012 when US tight oil growth helped drive annual growth of 1.6%. Since 2018, there has been no additional growth (5 years).
In order to remove the US tight oil we can exclude US production from the overall picture.
Doing so confirms a plateau ranging 2009 to 2016.
The current production level excluding US is likely at it’s lowest level since ~2000.
Another way to think about this is that we had two waves, the first being the overall world oil production wave that crested in the early 2000s and a second wave that built up in 2010 and is cresting now (US shale). It’s tempting to combine them but they will both behave much differently (and one is 6 times bigger than the other). The big wave has a much longer period/timescale than the small wave. The small wave (US shale) has a much shorter period, it will also decline much faster.
Taking all of these factors into consideration, I would break this down into several segments/periods:
Pre-global peak – 2000 to 2007
Global peak – 2008
Global plateau – 2009 to 2016
US shale peak – 2018
Post-peak decline transition – 2019 to 2022
Post-peak decline – 2023
TBD but 2024 to 2030 will likely be decline of 1-2% annually.
So you can make the overall plateau as wide as you want, say 2001 to 2022 (21 years), or narrow it all the way down to the year in the center 2012, which marked the beginning of US shale growth.
Kengeo,
Interesting view.
In your thinking will the decline rate increase > 2% after 2030 ?
Iron Mike –
It’s difficult to say but we know that production managed a long term growth rate of ~1.5% for 30 plus years. I don’t think anyone here would argue that 4-5% decline rates are inevitable at some point.
I would say decline rate will on average be at least 3% per year over the next decade, it will be easily measurable since we are talking about a few key producers (Russia, OPEC, and US).
The longer we manage low decline rates 1-2%, the worse the drop will be later on.
At some point we should see a rate of decline greater than 10%, so the key is how quickly we decline in the meantime. Hopefully it’s a fairly steep decline over 12-18 months then a moderate decline of 2-3%, this would allow production to continue and be the least worse option, but I don’t see an orderly decline to be very likely.
The short answer is that we will not be so lucky to have 30-40 years of 1.5% decline, we would run out far too quickly. You can add up 20-30 mb/d that will be lost over the short term (next 15 years), so the next several years will be challenging to say the least.
It’s fascinating to me that this slow motion train wreck has been in progress for 15-20 years and somehow there are still cheerleaders talking about future growth and peaks…bewildering.
We are here to witness/document it.
Iron Mike,
My view for future annual decline rates for World C plus C for an Oil Shock Model with URR=2675 Gb.
Dennis – For the OPEC 13 chart above, what is the average OPEC decline rate from ~2017 to 2013? It appears to be at least 5-6 mb/d lower over that period, even with relatively high oil prices. Is the decline rate accelerating? Looks to be somewhere between 3% – 7% depending what time period you look at. Currently looks like ~7%, we will see if that tapers off or continues…
Kengeo,
Using an OLS fit to Jan 2017 to August 2023 the average annual decline rate is about 700 kb/d over that period. In percentage terms from Sept 2017 to August 2023 (this period was chosen to eliminate any seasonal effects) average annual decline was about 2% per year.
Over most of this period (Jan 2019 to August 2023) OPEC was cutting output because the World was oversupplied with oil. Prices were certainly not high relative to 2010 to 2014, particularly during the pandemic years of 2020 to 2021. We will see in 2024 how much OPEC is able to produce, my guess is 29 to 30 Mb/d, if oil prices remain over $90/bo OPEC may choose to develop resources more aggressively, especially the big 5 in the Middle East (Saudi Arabia, Iraq, UAE, Kuwait, and Iran).
Over the 2025 to 2030 time frame I expect relatively low average decline rates from OPEC 13, on the order of 1% per year or less.
(Post 6/7)
With the URR i have estimate in my second post, these 9 others fields have still probably a significant remaining growth potential but it’s worthy to note that’s it far below of the official Saudi Aramco production target (chart 9) and that beyond the mid-2020s (or even beyond 2030 with a higher assumed URR), these fields would probably begin to decline. In this scenario, KSA oil production from their 12 majors fields remains globally stable until the mid-2020s, before starting a relatively slow decline, and then a much steeper one from the 2030s onwards (chart 10 of the post 7/7).
Chart 9 : Historical (01/01/2019) and forecasted production in kb/d of the others 9 major fields and comparison of SA target
Which means that your (all of ours) window of opportunity for getting electric transportation system lined up and deployed is just about 5 years.
Better get to it!, or you and your region will be waiting in a long line for vehicles and chargers, batteries and transformers, and permits and electricians.
Relevant note- my wife charges up her mid-size AWD electric car at home. Our utility has a fixed price for retail electricity. Gasoline would have to be under $1.50/gallon to be cost competitive per mile. Current gasoline average price in our county [6th biggest GDP in the country] is $5.26/g
Where i live (France as my weird pseudo suggest) the price of gasoline is almost $7,8/gallon, which push serious difficulties above many peoples. Slowly (and much slower than the northern european countries) but surely the French government is starting to take action for reducing energy consumption and increase electrification. The question of the demand of electricity is another complex question and RTE (the gestionnary of the electricity transport reseau) have made a very interesting report about this.
Take care of you and of your family 🙂
Gas needs to be more expensive, not less. Electricity too, for that matter.
No one ever cut back because of cheap energy and better efficiency. You want to see people realise how precious these things are? Let them keep driving F-350 RAM Turbo MAXX ST mega trucks that do 10 MPG on a level. Then we’ll see how people value their energy slaves daily.
(post 7/7)
Conclusion
It is likely that, despite still considerable uncertainties, KSA’s oil production is close to its decline. I have not assessed the production potential of other fields (lords and peasants) such as Hawtah, Fadhili, Nu’ayyim, Abu Hadriyah or Dammam but their production capacity remains very limited compared with the super-giant fields studied. For this reason, they are unlikely to significantly alter the forecast made below (chart 10). My personal best case for KSA is a broadly flat production at 10 mb/d or so for a few more year before a decline. I let everyone make their own forecasts based on their personal estimates. We’ll see in a few years who will hit the nail:)
Chart 10 : Historical and forecasted production in kb/d of the 12 biggest Saudi oil fields for 1951-2050 (nota : the black line indicated the last available data and the red line indicate approximately the date of redaction of this post).
French Fries,
Great stuff, merci beaucoup.
Laherrere forecast from October 2018, see pages 117 and 118 at link below
https://aspofrance.files.wordpress.com/2018/10/35cooilforecast-oct.pdf
I superimposed my Hubbert Model on top of Laherrere’s chart shown above for easier comparison.
The post Covid rebound in OPEC rig numbers seems to have settled out at about 100 fewer than previously. I don’t now if this is due to labour shortages, supply chain issues, cost inflation etc., or there would have been fall of this period anyway because of decline in prospective sites. (Note – Iran not included by Baker-Hughes.)
https://www.barrons.com/articles/peak-oil-is-near-the-path-down-will-be-treacherous-730f2981
Everyone agrees with this headline.
But it pivots from peak supply to demand. Like we’re in control, we like playing with fire. It implies climate change is more treacherous than less FFs.
The real problem is over population with higher expectations , errrr but then again I guess this is just an opaque way of dealing with it.
Long time reader of TOD and POB, first post.
I have been thinking about Ghawar fields a long time, since the Satellites o’er the Desert days showed the water injection wells around the perimeter of the anticline.
Is it likely that the decline is slower now, and when water approaches the top of the production zone at the peak of the anticline large areas will water out and production will Seneca Cliff all at once, at least in that area of the field? If this is likely with USA depending on shale oil which drops off quickly and all the prime spots drilled first, this could cause the world production curve decline to be very steep.
I have taken PetE and Geology classes in my university days, but am not a professional in those areas, just a very interested observer.
You put it very well.
Most every known producer is in decline, for variable reasons.
And I think the Saudis are saying that–in their own quirky way.
If the oil extraction in Ghawar is stopped in various sections over time and is restarted, does that give time for the remaining oil in place time to “percolate” up above the flood level?
It seems, dear centex, the stock to flow ratio is up for a rather dramatic change. The stock owners are in charge. For now.
Saudi ARAMCO has been reiling for years about underinvestment in the oil patch. WHY? Underinvestment by other nations would only mean more money for Saudi Arabia. Why would they want other nations to invest more? Why would they want other nations to produce more oil?
Aramco CEO says underinvestment in hydrocarbons causing energy crisis
Warning about the lack of investments in the oil & gas sector, Saudi Aramco CEO Amin Nasser said taxing oil companies and capping energy bills are not solutions to the global energy crisis.
Speaking at a forum in Switzerland, Nasser said underinvestment in the hydrocarbons sector when alternatives to fossil fuels were still not readily available was among the root causes of the global energy crisis.
It is true that more and more capital expenditure for oil E & P is necessary if the world desires to try and keep up production for longer. And despite concerns about climate disruption from fossil fuel combustion, humanity is on the path to keep up with as much combustion as can be afforded….by and large.
Problem is diminishing returns on investment with each dollar spent on the effort leading to less and less net production, perhaps with rare exception.
Yeah, but you didn’t answer my question. Why is Saudi Aramco screaming for other countries to invest more in exploration?
We all know – or at least think we know – the answer: SA is peaking and can’t produce more so they want others to fill the gap.
But that and a subway token……
rgds
WP
I am in agreement but with a slightly different spin. My opinion is that the Saudis aren’t actually concerned with filling the gap: they would like others to produce more to allow them to hide the state of their fields. We all know there is no spare capacity, but if demand was met by other producers, they could continue to pretend there is.
Good point. Posturing probably is a strong motivation.
rgds
WP
The ruling elite in Saudi must be starting to feel a bit exposed. As the production declines they will be unable to afford the dane geld to all the drone princes and princelings. Add in a large “credentialed precariate” (as Turchin calls them), some Sunni-Shi’ite strife (internally and with Iran or Qatar), a climate that is becoming unliveable in places and all the foreign workers that do the dirty jobs, including much of the fighting, and the place is a bit of a powder keg. If earth in is overshoot because of fossil fuels then Saudi is the extreme example. The natural population is tens of thousands not millions. The emergency escape jet liners and super yachts are kept on hot standby. If trouble starts rolling then production could collapse quickly. This must influence how they think, act and speak. I don’t know what they would gain directly from highlighting others under investment, some of it may be a message to their fellow OPEC members, some just frustration with a continual “call on OPEC” and associated internal interference from the west.
Ron, “Why is Saudi Aramco screaming for other countries to invest more in exploration?
I don’t think it’s at all complicated but we are all just guessing. For a practical point of view and I would include myself and most oil and gas professionals in this view, I offer:
Despite all the hoopla regarding energy transition and electric vehicles, it aint happening, at least at a pace that will keep the world from having a significant energy crises in the near future for LACK of investment in oil and gas. The short cycle horizontal sector flooded the market and kept new investment in longer cycle projects from happening. With the increase of cost world wide, $50-$70 oil does not offer the needed returns required by investors and still have sufficient funds for new investments. Most major economies still think they are “entitled” to cheap oil. I think the Saudis are just stating the facts as they see it, the world will require oil and gas for decades and to get that oil and gas to market prior to a major energy crises new investment is needed now. Again that is just a guess but nobody I know professionally sees any differently and we are all in the same boat as the Saudis, that is we benefit greatly from higher oil and gas prices but still want the world to keep moving forward.
Thanks, Texasteattwo, I agree completely. The world will need more oil in ten years and even more in twenty years. And it will just not be there. Food is produced with the aid of fossil fuels. Less fossil fuel, less food. It is as simple as that—end of story.
https://twitter.com/Rory_Johnston/status/1705256288647631259
Ron interesting chart on the subject.
“Without increasing oil and gas capex, we risk energy deficits and acute inflation across the commodities complex. This may lead to multiple oil-led energy crises in this decade, potentially much more severe than the gas crisis seen in Europe in 2022.” – JPM
“we believe that the global economy is able to withstand triple-digit nominal oil prices, as in real terms such prices remain below the peak levels seen in 2008 and 2011 and also below the “demand destruction zone” (ie. oil share in world GDP >5%, vs c. 2.5% currently)” – JPM
“We forecast a 1.1mbd S/D gap in 2025 widening to 7.1mbd in 2030 driven by both a robust demand outlook and limited supply sources.”
TL/DR: oil deficit to hit 7mmb/d in 7 years.
Thank you greens
https://twitter.com/zerohedge
what has been very clear for now many months now is becoming mainstream…a oil and gas super-cycle is/may now be underway. domestic US producers will have another “boom” cycle. the greens had their time in the sun but its hard to sell fantasy and fairy-tails to starving, struggling or barely getting by working class people anywhere. now on with the show!
Saudis need to conserve their oil as long as possible in order to diversify their economy. Unfortunately they cannot make the desert bloom.
They are simply following the Dubai model and that is completely flawed.
Saudi’s at best have maybe 15 years of oil exports left. In reality probably 10 years left as they will choose to go to zero as production falls substantially. Which means they will no longer have income from oil sales.
Russia is facing same situation. Oil revenues go to zero. With no available oil exports prices on a global market won’t matter. The benchmark prices won’t matter. Since you can’t get it regardless of price.
Saudi’s will go broke with no oil income. Investment income isn’t likely to replace oil income as the value of assets fall in the environment of No oil exports.
Less oil is going to be highly deflationary everywhere.
Exactly why they are divesting and diversifying. Feel sorry for the scmucks that fall on that sword…
“ Saudi Arabia’s Aramco Considers Selling $50 Billion in Shares”
https://www.wsj.com/business/energy-oil/saudi-arabias-aramco-considers-selling-50-billion-in-shares-4d5e4dd1
@HHH & Kengeo
Aramco is just another Enron I guess (maybe the whole stock market for that matter). Peak oil collapse is going to be miserable but it wont be without some amusing situations. The third party certification companies could get their estimates/audits for Aramco and even shale inventories wrong by an order of magnitude and then what? Sue? In an energy collapsing world? What will there be to gain? Force majeure. Joke is on the investors for not doing any diligence. There will be less litigation during the energy cliff but plenty of conflict.
Much of Saudi oil is used on their own air conditioning.
“During the peak summer months, when temperatures soar past 120°F, Saudi Arabia burns about 700,000 barrels of oil a day for air conditioning.”
https://www.washingtonpost.com/news/energy-environment/wp/2018/03/28/why-saudi-arabia-is-trying-to-pull-off-an-utterly-massive-new-solar-project/
Hello Ron, good to read your lines. I started to miss your comments!
Well, I am slowly fading away. I will be posting less and less from now on. I am working on another book, my very last one. This one will cover the subjects more deeply than the other two. And the last chapter will cover the coming collapse of civilization as we know it. I will try to explain why it is inevitable. Also, I will try to explain why the average citizen of the world has no idea what is about to happen and wouldn’t believe it even if they were presented with overwhelming proof of the coming catastrophe.
I would be really interested to buy your new book 🙂 personnally i think we are at the twilight of our current civilizational model and i’m very curious to see what would be like the new one (if there’s one and i hope so). As Jean laherrere have said me a few years ago “vous les jeunes, vous aurez du pain sur la planche” (or in english “you young people will have your work cut out for you”). The new era who come are full of challenge but also of potential profits.
Take care of you
I hope you do read my new book, but it will not be out until next year, likely early summer. It will be the last thing I ever write for public distribution.
Keep us posted when you do get a release date finalised. I would like to send money to secure a copy of the book as soon as it comes out.
No need to send any money. The book will be available on Amazon.com, both Kindle and paperback when it is published.
Count on me as a reader! This looks to become an essential must read for the peak oil crowd and hopefully for many more.
Frenchfries,
Very cool that you have met Mr. Laherrere. I agree with his sentiment.
Keeping it simple- He could just be putting out a warning to world about the pending supply situation as he sees it.
Global oil production may or may not exceed the 2018 peak.
What will be different is from 2028 almost every country which has kept production at around 80 million barrels per day over the last 7 years will be in decline.
With Canada, Brazil flat, the U.S. Saudi, Russia in permanent decline it will be a different and difficult era.
Decline rates could be higher than expected due to horizontal wells declining far faster than vertical wells.
A study of hydrogen production show that all the renewable electricity infrastructure built so far would only be enough for half what aviation would need. The world would lose that amount of oil in 2 years.
We are in trouble
Charles,
Other forms of energy may ramp up to take the place of fossil fuels and energy may be used more efficiently, as is the case for EVs, heat pumps, LED lighting, many more efficient appliances and so forth.
In addition population will decline as the demographic transition proceeds worldwide. South Korea saw its total fertility ratio fall from 6 births per woman in 1965 to about 1 or less today, education is the key, particularly for girls and women along with better access to birth control and equal rights for women.
There has been a lot of change over the past 60 years, I expect there will be more changes over the next 60, the pace of change has been far higher than I would have guessed 40 years ago, hopefully the pace of positive change in the future will occur faster than many of us imagine, or not, many if us won’t be here to see.
In addition population will decline as the demographic transition proceeds worldwide.
Even if the world total fertility rate ramps down to zero over the next 60 years, the population will not decline by then, rather it would level off at over 10 billion and would be near that level by the end of this century. The demographic transition only slows the rate of increase and lowers the total population at the plateau. The only thing that will reduce world population this century is an increase in the death rate. To get the population to a reasonable level (1 or 2 billion) by the end of the century would require excess deaths per year that would make WW2 look like nothing.
This discussion about prospective declines in oil production glosses over the tight correlation between energy production and population. If oil really does decline per the modeling discussed here and coal-to-liquids or gas-to-liquids can’t replace it, the human population will decline accordingly. 2% of 8 billion is 160 million excess deaths per year. The deaths would come from lack of food.
Joe Clarkson,
Many nations have total fertility levels below replacement, in fact half of the population of the World lives in nations with total fertility levels below the replacement rate, with lower total fertility levels population can fall pretty quickly.
We are currently on a path to have global population at about 9.7 Billion by 2050.
Hard limitations, and the human reaction to those, may very change the picture to the downside before too long. As Joe said.
I don’t think the drop in global reproduction rates will come close to matching the decline in prospects for sustenance and habitability on any kind of timely or proactive basis. In fact, we a more than 50 years late for that.
Hickory,
Of course it will take time, but with good policy the transition can happen relatively quickly, in any case the sooner we begin the sooner population may begin to fall because people choose smaller families. Just one of a basket of possible policies that might improve the situation, there is no panacea.
Interesting paper on long run fertility and population.
https://sites.utexas.edu/pwi/files/2023/09/spike_site.pdf
This year the global TFR is 2.3118 and in 1992 the TFR was 3.04. TFR doesn’t change instantly. And note that, from the chart you posted, even with a TFR that rapidly approached 1.75 (by 2030 to 2050), the population decline doesn’t begin until 2060 or so. All I was pointing out is that it is not true that population will decline as the demographic transition progresses. Only after many decades of additional progression of the demographic transition, will the population then begin to decline. If you want population to decline starting right now, you need a lot of excess deaths.
My arguing over this may seem a little nit-picky, but given the situation the world is in now with human population overshoot and the need for that overshoot to be resolved as soon as possible, relying on the demographic transition is not going to save the day. If you want to rely on birth rates to be a significant part of overshoot resolution, only a worldwide ban on having babies will do much. And even that will take some time to work. The global death rate is now only 0.77% and although, as the population average age increases, the death rate will go up, it doesn’t get much above 1% until people are older than 60, so it will take some time for the population to “age out” and die. Admittedly, rich countries have a much older starting demographic profile, which would ensure much more rapid population declines with zero births.
But a real-world situation, like Korea, with a TFR of 0.8 and an older demographic profile is not going to have much of a decline in population until after 2040 (only 1.6 million down from its peak of 51.8 million in 2020) and will still have 37.7 million people in 2070.
Demographic transitions are very slow, especially when the only variable is birth rate.
Joe,
Yes such transitions take time, but population will fall as this occurs.
Dennis
EVs , heat pumps, trams, electric trains, hydrogen powered ships and planes will all demand more power from wind and solar.
This is not just about peak oil but addressing climate change. The amount of coal, oil and gas being burnt is now far higher than the maximum to prevent other feedbacks from making things worse.
https://www.pbs.org/newshour/science/driven-by-climate-change-thawing-permafrost-is-radically-changing-the-arctic-landscape
Anyone who believes politicians, that hitting net zero by 2050 will prevent catastrophe is deluded.
The degradation that is happening now, not tomorrow but today guarantees hundreds of millions excess deaths over the next 20 years.
Droughts, flooding and building on land has reduced the amount of land per person by half.
https://www.globalagriculture.org/report-topics/soil-fertility-and-erosion.html#:~:text=Each%20year%2C%20an%20estimated%2024,every%20person%20on%20the%20planet.
If million’s are already starving to death now what will things be like in 10 years time?
https://www.un.org/en/chronicle/article/losing-25000-hunger-every-day
Fact is the rich think they will be fine, once 3 or 4 of billion people perish there will be enough for the rest. However once the feedbacks of forest fires and soil erosion get to a certain point it won’t stop until the human population is so small as to no longer impact the world.
What population is required to allow the world to start to regenerate?
https://www.footprintnetwork.org/our-work/earth-overshoot-day/
Considering how much worse the environment is today than in 1970. The world probably can handle a maximum of 3 billion. Probably far fewer than that.
Charles,
I agree climate change needs to addressed, reducing fossil fuel use as quickly as is feasible is one way to address that problem, sequestering atmospheric carbon is another as is recycling, cradle to grave manufacturing, less leisure travel, producing and consuming locally as much as possible, better urban design so less travel is needed, producing quality products that can be repaired and that can last for decades or centuries rather than days or months, reducing or eliminating excess packaging, these are amongst the actions that might be taken along with lower family sizes, many nations have total fertility ratios less than 2 some below 1.5, in a single generation, my family has seen total fertility ratio fall from 5.5 to 1.27 in a single generation, similar to what happened in South Korea, education is a key to making this happen.
Empowering women is key to making this change.
Stephen,
I agree, some research suggests one way to accomplish that is through education, there are some very patriarchal societies (Korea and Iran for example) that may not be models for women’s rights but in spite of this have seen rapid decreases in TFR.
It may be that better educated women have greater opportunity and are better able to assert their rights.
All agrarian civilizations were built for women by men, which is why we are currently and exactly in this staggering jackpot of both population overshoot and progressive climate debasement.
As for this self-righteous call to ’empowerment’ – for what purpose exactly? To get even more of them to report to the cube farm for 8 hours a day? (Which is where the ’empowered’ end up) Most of them hate that life – according to the last survey, more than 70% hate their jobs and would prefer to stay home if they could afford to. So there’s that.
In what way does female ’empowerment’ abet the energy situation? The last time I looked, real men on real drill rigs had to work really hard to get oil out of the ground. Will female ’empowerment’ somehow change or replace that? With what, exactly?
Mike Sutherland,
This is about population growth and fertility rates, women having the rights to decide whether to have children or not makes a difference in the number of children they have.
If you don’t see that, there is nothing left to explain.
Empowered women don’t have babies they don’t want because they are allowed access to birth control and abortion. Having fewer babies means fewer humans. Fewer humans means less demand for energy and other scarce resources. Somebody is obviously having trouble getting laid lol. Maybe try tapping into your sensitive side and see if that helps
Dennis
The world food comes from the soil, how do you fix 24 billion tonnes washed and blown into the oceans this year and last year and the same for the last 20 years.
There is no reasonable scenario where global fertility rate drops to your hopeful level in time.
https://ourworldindata.org/births-and-deaths
Births exceeding deaths by 50 million in 2035, which means global overshoot will cause even further devastation.
Do you understand overshoot?
Charles,
There are many problems, better agricultural practices will help with the soil problem, also eating fewer animal products reduces energy use, soil loss, and likely results in better health. I expect there will be difficult times ahead but focus on how to ameliorate problems rather than focusing on the problems themselves.
As for the speed of the transition to lower fertility ratios, South Korea went from 6.2 births per woman in 1958 to 1.6 births per woman in 1988. Iran went from a TFR of 6.5 in 1983 to 1.77 in 2006. In 2021 the World was at 2.32 births per woman, S. Korea went from 2.44 to 1.6 births per woman in 5 years, and to 1.2 in another 15 years, in 2021 the TFR in S. Korea was only 0.88, in Japan it is 1.2, in China it is 1.16, Europe is 1.48, South America is 1.81, and North America 1.64, Africa is 4.31, Asia 1.94. Australia/New Zealand TRF is 1.63. Data for 2021 (most recent year from UN.
https://population.un.org/wpp/Download/Standard/MostUsed/
As I understand it, the UK has about 30 years of productive topsoil remaining. If correct, the effects of that should be starting to be noticed soon
Here’s a quick and dirty look, rest of world is losing 0.5 Mb/d every year since 2006.
What’s interesting, I believe URR of 2,250 Gb is a fairly realistic number (it’s essentially 2P plus 250 Gb growth/additions). That translates to 67% of available oil has been produced, which lines up well with estimates for Saudi Arabia…
– US has nothing left to give as far as growth goes (and certainly not more than the rest of the world is losing each year).
– OPEC + is also clearly tapped out, so down from here…
Kengeo,
Using EIA data
https://www.eia.gov/international/data/world/petroleum-and-other-liquids/annual-petroleum-and-other-liquids-production?pd=5&p=00000000000000000000000000000000002&u=0&f=A&v=mapbubble&a=-&i=none&vo=value&&t=C&g=0000000000000000000000000000000000000000000000000000004&l=249-00000010000000000000000000000000000000000000000201&l=176–176&l=271-00000000000000002000000a000800000000000000000g0g8&l=272-0000000000000000000000000000000000000004000000000000004&s=94694400000&e=1640995200000
I get a different result. Not clear where you are getting your data.
Longer term chart for 1973 to 2022, EIA data.
I wasn’t sure what CIS was, I had to look it up. Commonwealth of Independent States. I am still not sure which nations are members of the CIS. But their oil production is collapsing according to Statista.
Crude oil production volume in the Commonwealth of Independent States (CIS) from 2019 to 2050, by scenario
Crude oil production forecast in the CIS 2019-2050
Published by Statista Research Department, Apr 4, 2023
By 2050, the annual production volume of crude oil in the Commonwealth of Independent States (CIS) was forecast to decline to one exajoule under the Net Zero scenario. In 2019, the crude oil production in CIS amounted to 29 exajoules.
1 exajoule is equal to 163,455,763 barrels of oil equivalent (us)1. Alternatively, exajoule is equal to 174 million barrels of oil equivalent.
Ron –
CIS compared to North America and Middle East provides 20% of the combined production:
CIS – Russia + Kazakhstan = ~12 mb/d, they also have ~20% of the 2P oil reserves (75 Gb), assuming production doesn’t drop much more (bad assump.) they could produce for another 15 years or so. More likely production will drop to a sustainable level and they can run 20-25 more years.
North America has slightly more at ~100 Gb 2P oil reserves, however we are producing at ~20 mb/d so our fate is similar, run out in 14 years at current production levels.
Middle East has considerably more 2P oil reserves, ~170 Gb, producing them at ~25 mb/d, this results in a similar depletion timeframe as CIS.
Grouping these 3 regions we get the following:
Production of 57 mb/d.
2P reserves of 350 Gb. URR = 1,850 Gb.
Average of 2P and 2PC reserves of 650 Gb. URR = 2,150 Gb.
2PC reserves of 950 Gb. URR = 2,450 Gb.
Below is a graph which assumes peak production at 50% URR (2P = 975 Gb [2006]; Ave-2P-PC = 1,075 Gb [2010]; and 2PC = 1,225 Gb [2015]).
For all cases the peak is assumed to be ~80 mb/d.
For simplicity the decline rate is 1% for 10 years, 2% for 10-20 years, then 3% >20 years.
Graph below with actual production values (per Dennis’ link), and the different decline scenarios (2P, ave-2P-C, and 2PC).
As we can all see, doesn’t matter how much oil is there, the decline is the same, just shifts a couple years here a couple years there….US shale production has made it a bit blurry, but we are at the point of confirmed decline, there is no doubt about it…
Note – If you remove the US tight oil contribution, the decline is much closer to the 2P scenario, so we might expect that 2P is in fact the “Best” estimate of remaining oil reserves. This is a very important fact since focusing on the 2PC value overinflates remaining oil reserves by ~600 Gb. The question is, have we used >80% of conventional oil (2P)? Or have we only used >60% of conventional (2PC), or maybe somewhere in between? But without question, we are at least 10 years past peak conventional oil production, which likely occurred sometime between 2005 and 2015.
2018 was the point in time where peak production occurred, likely at a value between 54% of URR (2PC) and 72% of URR (2P).
The only debate left is decline rate, no future growth, no future plateau…
If we are lucky we will be in a controlled slide (but unfortunately something tells me it will be uncontrolled).
Dennis – Please prove me wrong!
Kengeo,
We have no proof of what will occur in the future, only speculation. Laherrere estimates 2500 Gb for conventional oil URR, this seems a bit low unless peak demand causes low oil prices around 2030-2035 as I expect. My best guess for unconventional oil is about 170 Gb (about 98 Gb of extra heavy and 72 Gb of tight oil).
For comparison see chart below and note the charts are not all that different. The main difference is that you expect decline to begin immediately, I think output increases for a few more years and decline starts in 2027, that is simply my best guess, based on a very conservative estimate of URR (more than 800 Gb less than that of Mr. Laherrere).
Also keep in mind that many believe 2P reserves should point to the best estimate, I think this is the best current estimate assuming no future discoveries, technological progress, or changes in expected future prices.
The problem is simply that the above assumptions always prove false.
1998- URR=1800 Gb
2005- URR=2000 Gb
2010- URR=2200 Gb
2015 URR=2400 Gb
2018 URR= 2700 Gb (including extra heavy oil)
2022 URR=3500 Gb (conventional plus unconventional)
this last estimate seems too high to me, probably 3000 Gb would be more reasonable, if we assume oil prices remain high indefinitely (no transition to electric transport).
Dennis – Thanks, added your model to the graph, notice the strong divergence in 2022, I would say this model is not matching current production values, but maybe you expect a big turnaround soon? Would like to see monthly actuals versus your model and how they might be correlating…
Kengeo,
The model is done on an annual basis. We will see when we have 2023 World output data how well it correlates. Currently my scenario is below EIA STEO projections through 2024.
Kengeo,
The model matches EIA data through 2022 (annual output data), 2023 is similar to STEO estimate for 2023 and slightly lower than STEO for 2024 (2025 output for shock model is similar to the 2024 STEO estimate.)
If Moore’s Law (doubling of chip density Q2 years) is still remotely operational mankind will figure this out and come up with a way to provide energy and electricity to the globe’s people without destroying the place. In my view, oil and gas will continue to play a large role, but oil will go for petrochemicals and gasoline while gas will produce the fertilizer and cement and also drive standby turbines in utility plants. Direct air carbon capture has been shown to work by Lehigh in its cement factory, and by LF in fertilizer production. An exceptionally dramatic turnabout would come from merely using LNG instead of coal, in conjunction with DAC.
I understand the limitation of NG feedstock in certain locales, such as China. But that’s quickly changing. The largest NG deposit by far is in the Qatar Peninsula, and they are gearing up their LNG facilities at warp speed. The biggest threat to Qatar is this massive deposit, as ME neighbors are jealous. Qatar is set to become, as strategic energy providers, what KSA was for years. They are so wealthy, well situated and autocratic that they can become the LNG capitol without getting approval by Congress, or a regulatory agency, and they have enough NG to drive the least painful transition from coal to LNG. Qatar will set the price.
It makes absolutely no sense for the U.S. to throw its economy to the dogs when China burns gargantuan quantities of low-quality bituminous coal. China has talked a good game while building dozens of new teapot utility plants that burn coal. They use 60% of all the coal used in the world. The air obviously gets mixed up in the troposphere. Germany and the UK have also increased coal burning while preaching the gospel about climate change.
The U.S. has at least decreased coal usage, but has been exporting coal while talking up climate change and imposing draconian bills that have raised the debt load awfully. But the U.S. pales compared to Australia–on both counts. Australia has built out huge lithium-ion-exchange battery dumps to store energy, while quietly exporting as much coal as China will take, which, lately, has been picking up incredibly since China ended its ban on Australian coal.
I’m optimistic about the future of the globe, because of Moore’s Law. I’m less enthusiastic about current climate change leadership which mandates one thing while doing just the opposite. Thank goodness for Qatar!
Err, how exactly does Moore’s law apply to geology?
I think you’ve got “direct air” capture mixed up with carbon capture and storage (which is much easier when from concentrated tail gases). And Moore’s Law is dying if not yet dead because of the phisical limit of the size of an atom, the difficulty of cooling and the exponentil growth in cost of chip manufacture as they get smaller (until quatum computing comes along anyway).
I’m not the one who perverted the terms, George. The Inflation Reduction Act credits $180/metric ton removed by DAC (direct air capture). Occidental paid $1.1B for Carbon Engineering with a plan to establish dozens of DAC units in dense CO2 “point” zones (close to refineries, etc) and then sequester the CO2 somewhere. I’m just guessing here but I would imagine that “somewhere” would be down dead oil wells, for stimulation and also to get the IRA carbon capture credits. The same will be true for fertilizer and cement manufacturing plants–to get the extra incentives. Perhaps I misused the terms, but I wasn’t referring to putting these things in the great outdoors, like in Switzerland, but in high CO2 density zones where tons of CO2 can be collected in a swift process. On the plains of Nebraska, it would take a while for DAC, but I would imagine Occidental has some locations in mind.
As to Moore’s Law, you’ve got me. I used it mainly as a tool to make a point that we’ve gotten to the place where I think we can get ourselves out of the carbon hole we’re in. And I did it only because the remarks had gotten so morbidly negative. Nothing was ever done in the spirit of pessimism, except suicide. And I somehow have to hold onto faith that the planet isn’t doomed. I probably should just quietly exit, because I do like oil and gas, and I think this carbon capture and sequestration concept has a lot of merit–even if it’s called something else in order to get the extra credits.
But you wrote “Direct air carbon capture has been shown to work …” It hasn’t. The carbon capture in cement and fertiliser plants is directly on the tail gas streams, which are not air. In fertiliser plants they come directly from the CO2 removal process (e.g. Selexol or amine unit) and, from memory, would be above 90% CO2. For cement works it comes from the kilns and is also very rich in CO2. The majority of such schemes have eventually failed and been shut down, but they are still doing better than DAC which has so far got no further then small pilot plants.
Gerry Maddoux wrote: If Moore’s Law (doubling of chip density Q2 years) is still remotely operational mankind will figure this out and come up with a way to provide energy and electricity to the globe’s people without destroying the place.
Thanks, Gerry, that’s a real keeper. I may use that one in my book. That is how most people rationalize things in order to deny the obvious coming collapse. This one is that scientists are so brilliant they will figure out something. After all, Moorre’s Law shows just how smart they are, and Moore’s Law proves that they can come up with some way to provide the energy needed to save humanity without destroying the place.
Hint: the place is already being destroyed. (“Place” meaning the ecosystem that provides nourishment to all living creatures on earth.) It is not completely destroyed yet, but it is getting there at breakneck speed.
I love Gerry’s posts. I hope he continues.
But we are all fallible apes.
Apes in the African Savannah didn’t need to understand exponential curves to survive.
Moore’s law is an exponential curve.
It was and has been very accurate. But an idiot like me can see it will not keep going.
A keeper, indeed, sort of like those who mis-apply subatomic physics to “spirituality.” Whatever that is.
I have no idea what you are talking about unless you mean “quantum entanglement”, or what Einstein called “spooky action at a distance”. Einstein hated it but Niles Bohr and Werner Heisenberg loved it. It was later proven a fact by the great physicist John Bell, who received the Nobel Prize for his work.
Or, you may be talking about the Double Slit Experiment as explained! by Jim Al-Khalili
Man, there is really some spooky shit going on there. It seems that some unknown entity has knowledge of when you are using a recording device and when you are not. Something non-human, something spiritual. But as Jim says in the video, if you can figure it out, then you, Mike B, will be awarded the Nobel Prize.
Note: If you have something to say, Mike, just say it. Your sarcasm stinks.
Cargo Cult is what William Catton Called it.
Seppo, what are you calling “it”? You lost me there.
Ron, I was referring to what William Catton described in his book Overshoot. He mentioned that during the WWII on some pacific island, US built a landing strip. When planes arrived, the airmen gave the natives goodies. After that the natives developed rituals to attract the passing plane high in the sky to land on their island. It sometimes worked not because of the ritual, of course. This came to be known as a cargo cult. Today people hope that engineers will come up with a new energy source. Did not John Kerry say that we need to solve the climate issue with technologies that have not yet been invented. Modern form of cargo cult.
Thanks Seppo. I am very familiar with the cargo cult story. I have Catton’s Overshoot. I read it cover to cover and refer to it frequently. I did not get the connection to the subject being discussed.
Mike B was trying to be sarcastic about the two-slit experiment that I discussed in my book. As usual, he had no clue as to what he was talking about.
Sorry Ron, I again answered to the wrong post. Here is what I referred to as Cargo Cult
“After all, Moorre’s Law shows just how smart they are, and Moore’s Law proves that they can come up with some way to provide the energy needed to save humanity without destroying the place.”
Mr. Patterson,
As per Carolyn Myss, regarding the misconflation with spirituality and religion, “Spirituality is an individual recognition of the existence of a non physical Reality. Religion is a cultural expression of that”.
One of the ironic aspects of secular humanists – in general – is that they are the most ardent worshippers of the godhead called Reason. No Torquemada ever was or will be more intolerant of the heresy of questioning the Supreme exaltedness of Reason, disregarding the fact that this status is entirely self-appointed. This, despite the uncontestable fact that we sentient humans – all of us, anywhere and everywhere – permanently exist in the state of pre-cognitive awareness.
Bell’s theorem should – at the very least – give pause to those who confidently disparage the myriad wonders of this universe.
(Personally, I think the concept of waves traveling in both directions may ‘answer’ a lot of uncertainties. So much that we do not ken.)
Thanks for the reply Coffeeguyzz. I had to look up “Torquemada”. I got: “Spanish Dominican monk”. I do not regard reason as the only tool in the toolbox, though it is a very important one. Logic is another tool. But what are we using reason on? What are using logic on? Evidence, that’s what. Nothing should be believed without supporting evidence. And nothing should be disbelieved when there is evidence to support it.
Most people have ideologies, or worldviews, that are not supported by evidence.
“Conclusion
US oil production is not surging, it’s flat. Please ignore the EIA weekly US oil production figure. It is not useful. As long as you know that and look at what we say US oil production is, you will have an edge over the rest of the market”
https://hfir.substack.com/p/public-is-us-oil-production-surging
Dennis – Since you love so much to refer to the 3,500 Gb value for URR, here’s what production might look like if that were a possibility, notice current production is much lower than it should be if 3,500 were realistic.
This assumes by 2120 there’s still ~500 Gb remaining in place. Could provide a longer tail or stay in place…
Peak is ~2032 at ~93 mb/d. I don’t believe this to be remotely possible, you may disagree, this would imply ~2,000 Gb of reserves, a value roughly 4 times 2P and almost double 2PC…
But wouldn’t that be great if production could continue to grow for another ~8-9 years to help transition to renewables? But wouldn’t be so great for GHGs.
I agree 3500 Gb is not likely realistic, which is why my best guess scenario is about 830 Gb less at 2670 Gb, roughly similar to the 2018 Laherrere estimate for World URR.
FRENCHFRIES – See a possible OPEC decline graph below, tried to match it to your Saudi Arabia decline rates, while it may be skewed it’s likely close enough, do you agree?
https://www.oilystuffblog.com/forumstuff/forum-stuff/room-to-run
This is juicy, junior…RRRREEEAAALLLL JUICY!
Great link to a site i’ve never heard of.
“Great link to a site i’ve never heard of”….inside the blog post.
https://www.mineralanswers.com/
Been reading oilystuff for a while.
Not about jacking prices…
“We can reduce more, or we can increase, that has been a subject that we want to make sure that the messaging is clear, that it’s not about, again, this jacking up prices,” Prince Abdulaziz bin Salman said Monday.
I actually believe them.
Some members of the Organization of the Petroleum Exporting Countries and its allies, known as OPEC+, are implementing 1.66 million barrels per day of combined voluntary declines — which falls outside of unanimously agreed OPEC+ policies — until the end of 2024.
https://www.cnbc.com/2023/09/19/saudi-energy-minister-says-oil-supply-cuts-are-not-about-jacking-up-prices.html
This is interesting…
https://ourworld.unu.edu/en/wikileak-cables-saudi-arabia-oil-reserves-overstated
“According to the cables, which date between 2007-09, Husseini said Saudi Arabia might reach an output of 12 million barrels a day in 10 years but before then — possibly as early as 2012 — global oil production would have hit its highest point. This crunch point is known as “peak oil“.”
Sounds like someone knew/knows what’s going on….
https://biosidmartin.com/has-saudi-arabia-reached-peak-oil/
So far, Ron is still correct…Dennis sees a future peak 4-5 years from now, how that could happen is anyone’s guess:
“When was the peak of oil production in the world?
However, recent production data suggests that the all-time peak production may have already occurred. Ron Patterson, a computer engineer, who worked with Saudi Aramco oil company, suggests that the all-time peak may prove to be November 2018, when the world was producing oil at a rate of 84.7 million barrels per day (mb/d).”
Saudi Arabia is done playing the swing producer roll, they are all tapped out and know it!
Kengeo
Why is oil relatively cheap at the moment? Is it because there is a shortage?
It was over $100 for 3 years 2011 to 2014 averaged $112 for those 3 years. That price brought on a fair amount of additional oil
https://ourworldindata.org/grapher/oil-production-by-country?time=1970..latest&country=QAT~OMN~SAU~NOR~IRQ~USA~ARE~OWID_WRL
How much impact did Covid have on exploration?
Global capex is nowhere near what it was around 2012/2014
https://www.iea.org/data-and-statistics/charts/global-oil-and-gas-upstream-capital-spending-2014-2019
Adjusting for inflation oil needs to be $130 for 3 years to match the prices in 2011 to 2014.
If oil companies repond as they did last time spending would be around $900 billion per year for at least 3 years. It would take a further couple of years for production to fully ramp up which would put us around 2028.
It’s the economy and interest rates, that’s why it’s priced at $90 per barrel. That’s also the price most producers demand, the critical oil exporters have cut supply and price is responding accordingly. Some demand is being addressed by alternatives (wind, solar, hydro, EVs). Those would help to lower the oil prices and address demand. Not sure comparing the pricing and structure 20 years apart is meaningful, too much has changed. China is a much different economy than 20 years ago too.
I don’t believe further significant investment in US shale will result in meaningful or sustainable growth…market knows that and that’s why investment is low…
But what is your point anyhow?
Kengeo
Firstly it was only 10 years ago oil companies were still spending double on finding oil than today.
10 years ago China was already importing large amounts of oil as it does today.
My point should be obvious, the low oil price tells the oil companies there is no shortage and therefore they are reluctant to spend too much upstream because they may not see a return on the investment.
There is still vast amounts of oil to be found but it would take prices consistently above $130 for the oil companies to commit to developing those fields.
About a fifth of world oil reserves needs $130 to make it worth drilling obviously the world does not need it at the moment. How can you know what is possible
All of this adds up to the fact that
‘new’ oil is going to very expensive.
Higher price will eventually steer use toward the more important and irreplaceable
categories, and away from more easily replaceable categories such as light transport.
Rig and Frac Report for September 22
Both Rigs and Fracs are Down this week
– US Rigs down 8 to 451
– Permian rigs down 4 to 304 with 3 from NM and 1 from Texas. Last time there were 93 rigs in NM was February 3, 2022.
– Eagle Ford flat at 43
– NG down 1 to 106 (not shown)
Fracs Down 5 to 259
Average weekly Fracs in 2022: 280
Average weekly Fracs in 2023 to date: 269
Ovi,
Thanks. To me the more interesting comparison would be the most recent 52 week average compared to the previous 52 week average. Or if you want yo use year to date, compare YTD for 2022 with YTD for 2023 for the nearest similar date. Either gives us something that is more comparable.
Dennis
2022 bounced between 250 and 300 rigs
2023 is doing the same.
That is why I made the comparison that way. Regardless I think the Rig average is going to be down this year. Just giving a heads up,
Ovi,
I agree the trend has been lower, higher oil prices might change this trend. Often the frack spread count has risen in the autumn, at least the past 2 years, perhaps that occurs again in 2023.
In 2022 the YTD average frack spread count was about 278 vs 269 in 2023, so based on year to date weekly data the drop has been about 3.2%. Much bigger difference comparing to the same week in 2022 at 288 frack spreads vs 259 in the most recent week, a 10% drop YOY. Keep in mind that some of this drop may have been due to a decrease in the number of frack spreads in shale gas rather than tight oil.
OPEC estimates about 27% of wells fracked in July were outside of the big 4 basins, but some of these may have been Anadarko and Powder River Basin wells, unfortunately we don’t have good data on this except from Ovi. He estimated about 20% of frack spreads were natural gas spreads in late July, but is not clear how this number might have changed over time. In any case the data is a bit fuzzy.
JPMorgan forecasts energy “supercycle” with Brent crude potentially hitting $150 per barrel
In a research report published on Friday, JPMorgan (NYSE:JPM) analyst Christyan Malek upgraded the entire global energy sector to an overweight rating, warning that the recent surge in oil prices could potentially drive Brent crude prices as high as $150 a barrel by 2026. This prediction is based on factors such as capacity shocks in the near to medium term, an energy “supercycle”, and an ongoing transition away from hydrocarbons.
Malek anticipates Brent prices to range between $90 and $110 in 2024, and between $100 and $120 in 2025. However, JPMorgan still expects Brent to hover around $80 per barrel over the long run, although there’s a risk that long-term prices could settle at about $100 a barrel.
According to JPMorgan, the global supply/demand imbalance is likely to stand at a 1.1 million barrel a day deficit in 2025 but widen to 7.1 million barrels per day in 2030. This scenario is driven by both a robust demand outlook and limited supply sources.
How many EVs are there in his 2030 scenario?
Apparently not enough EV’s, …and not enough oil.
Sounds correct to me.
Ovi goldman seems to be on the same page.
Energy transition efforts, including decreased investment in hydrocarbon production, have contributed to rising oil prices and increased reliance on fossil fuels in backup scenarios.
Offshore wind projects are being canceled, EV sales in the U.S. are slowing down, and the solar industry faces competition from cheap Chinese panels, highlighting challenges in the renewable sector.
Despite clear setbacks, governments remain committed to their energy transition goals, potentially leading to even higher energy costs in both Europe and the U.S.
https://oilprice.com/Energy/Energy-General/Goldman-Sachs-Predicts-100-Oil-As-Renewable-Transition-Falters.html
most points made in the article i stated here on POB several months ago, but now is becoming obvious to the less sophisticated. Energy fantasy has now hit the energy reality wall.
and the money line:
“The price of energy is going to continue higher in both Europe and the U.S. All because of an ill-conceived transition away from hydrocarbons. “
“ The growth of EVs up S-curves means that ICE sales peaked in 2017, gasoline demand peaked in 2019, and the ICE fleet will peak in the middle of the decade. Oil demand for cars will then be squeezed between continued efficiency gains and the rise of EVs. Once electric vehicles make up the vast majority of car sales, the world is around 15 years away from a quarter of oil demand falling to zero.”
https://cleantechnica.com/2023/09/21/the-ev-revolution-in-5-charts/
“ With more electric vehicle choices than ever, EV sales in the US are hitting new heights. In just the first half of 2023, over 670,000 EVs were sold with over 80 percent of those fully-electric battery electric vehicles (BEVs). It took 8 years for the first million EV sales – but now more than a million have been sold in just the past 12 months.”
https://cleantechnica.com/2023/09/22/electric-vehicle-sales-in-us-hit-the-accelerator-pedal/
Texastea,
The transition away from hydrocarbons is only ill-conceived for those with their head in the sand about climate change. Energy cost have increased due to the war in Ukraine and sanctions on Russia and because OPEC has cut output because they believe the oil market is oversupplied with oil, as far as prices for oil, they will decrease as more supply comes online due to higher prices, OPEC will reverse their cuts and non-OPEC output will rise as higher prices lead to more resource development. All the while, EVs will continue to increase their market share especially as more and more models become available.
See
https://www.ev-volumes.com/
Excerpt:
EV shares continued to climb in all markets. BEVs (10 %) and PHEVs (4,1 %) stood for 14,1 % of global light vehicle sales at H1 close, compared to 11,3 % in 2022 H1.
Not clear the EV sales are slowing as you claim.
Also from the piece linked above,
Global EV sales continue strong. A total of 6 million new BEVs and PHEVs were delivered during the first half of 2023, an increase of +40 % compared to 2022 H1. 4,27 million were pure electric BEVs and 1,76 million were Plug-in Hybrids. Preliminary July results show +40 % growth again. The regional growth pattern has shifted: China EV sales increased by +37 % in 2023 H1 y/y, compared to +82 % in 2022 vs 2021. Sales in Western and Central Europe were up +28 % in H1 compared to just +15 % in 2022. EV sales in USA and Canada are +50 % higher YTD June than last year. EV sales outside the aforementioned markets increased by 102 %, albeit from a low base. Overall vehicle markets saw a considerable recovery, weaker and more volatile in China, stronger in Europe with +17 % y/y in H1. The global light vehicle market was 11 % higher for 2023 H1 than in 2022 H1 but still trailed the 2015-2019 average by 5 million units annualized.
Dennis i did not claim anything, that post was quoting the article. With the exception of: most points made in the article i stated here on POB several months ago, but now is becoming obvious to the less sophisticated. Energy fantasy has now hit the energy reality wall.
and the money line:
was taken directly from the article. With respect to climate change, again it’s a tough call, who do I listen too? you or
“Second Nobel Prize Winner Signs Letter With 1,600 Scientists Declaring Climate ‘Emergency’ A Myth”
https://thefederalist.com/2023/09/01/second-nobel-prize-winner-signs-letter-with-1600-scientists-declaring-climate-emergency-a-myth/
“A coalition of more than 1,600 scientists critical of their peers’ hyperbolic claims about climate change drew a prominent recruit to sign their 2019 declaration that the climate “emergency” is a myth.
John Clauser, who won last year’s Nobel Prize in physics, became the second Nobel laureate last month to sign the document with 1,607 other scientists rebuking the idea of a climate crisis.”
I made this point last post, a “true scientist” is open to debate. I true scientist knows the science is never settled, I true scientist spends his life disproving or improving all other scientist work… that is what science is. YOU AINT NO SCIENTIST. If a person holds these doomer climate predictions to heart and can’t be persuaded by those who actually study this stuff then those beliefs are more in the realm of cult like behavior rather than science. Perhaps your motto should be, “we need to ignore science and scientist… to save the planet.” You would have fit in well with the Salem witch trails or other such historic events where people just collectively lost their minds.
“The Salem witch trials were a series of hearings and prosecutions of people accused of witchcraft in colonial Massachusetts between February 1692 and May 1693. More than 200 people were accused. Thirty people were found guilty, 19 of whom were executed by hanging (14 women and five men). One other man, Giles Corey, died under torture after refusing to enter a plea, and at least five people died in jail.[1]”
https://en.wikipedia.org/wiki/Salem_witch_trials
Texas tea,
As I have pointed out before, a noble prize in Physics does not make one an expert on climate science. Most of the experts in climate science believe there is a serious problem. There are a lot of fake scientists hired by organizations that are funded buy fossil fuel interests that have a job of creating doubt, mich like the “scientists” hired by tobacco companies to sow doubt about the dangeres of cigarette smoking.
Perhaps you think that smoking cigarettes is good for you as was advertised in the early 60s.
The view that climate change is not a problem is much the same as the view that smoking is good for you.
There are some people that will believe anything.
TEXASTEA,
(I suspect this might also be relevant to Ron’s work in progress)
there is an agricultural method that seems to solve the problem of carbon in the atmosphere. Re: The Advanced BEAM method, invented by David C. Johnson of New Mexico University. The results are incredible. For latitudes up to mid temperate zone, and provided that reasonable amounts of water can be secured (which are very modest in comparison to those demanded by industrial agriculture) this method sequesters up to ten tons of CO2/ hectare-year.
On UTube there are a couple of agricultural consultants who demonstrate the effect of the method (while unfortunately not revealing their source): production of dark organic soil, going to greater depth with each passing year, high water infiltration & retention, minimal, and eventually no, fertilization. Productivity is about 60 % better than trade methods, but profit is about four to five times bigger, due to lower diesel and fertilizer inputs, and the fact that this system needs to be in constant production, enriching (rather than depleting) the soil with time. So, two and three crops / year, depending on insolation, are reasonable, again, provided that the required water can be secured.
I am no biologist, this was a piece of consulting journalism that I did two or three years back, but I looked into soil biology literature since about 1998, and the results squared beautifully. In fact, there is a body of research in soil biology that would be highly problematic if the principles behind this method didn’t stand.
In Australia about five years ago a programme was launched providing carbon-capture income to enterprising farmers, and anyone interested might want to have a look into it.
I do not have my back-of-the-envelope calculations here, but unfortunately we do not seem to have enough carbon in the atmosphere to do this job thoroughly round the globe.
The main paper describing the method is open access (poorly edited, unfortunately), and for further literature looking into the work of the Australian biologist Dr Christine Jones might prove useful.
Texas Tea
You think the price of energy is going higher because of attempts at transition
“The price of energy is going to continue higher in both Europe and the U.S. All because of an ill-conceived transition away from hydrocarbons. “
realize that energy prices globally would be going even much much higher without the deployment of oil alternative mechanisms.
But of course that is what you so transparently are hoping for- personal gain based on the economic misfortunes of all others.
Don’t be so fearful, oil demand will be robust indefinitely.
You are an interesting character Hickory, you have the ability to look through a computer screen and see anther persons heart. Like wise I think you are nothing but a huge impotent penis. You add next to nothing are almost never right about anything and you love to hear yourself talk. Hope that work for you in real life.
Texas tea,
Your comment about Hickory does not apply to him, but check the mirror.
TTT –
Your vile small-mind (and penis) are the only item you like to parade around this site, if it disappeared I can assure you it would not be missed.
more on jp morgan’s and goldman’s energy call
“Although a major psychological milestone, $100 oil isn’t what it used to be because of inflation. A barrel that today costs $100 is the equivalent, in real dollars, to a $71 barrel in 2010 and a $56 barrel in 2000.”
https://finance.yahoo.com/news/jpmorgan-energy-guru-warns-oil-172634151.html
“Supercycle” – code word for peak oil!
Here is a link to what I recently managed to write
https://www.dropbox.com/scl/fi/kgnuwqeaiagyeyia0su4u/oilanalysis2023.pdf?rlkey=6wzej6fipf8okii9bruv59wib&dl=0
best, Seppo
Seppo
Excellent paper. A super overview and very up to date.
On page 26, you show a partial logistic fit of Saudi Arabian oil production. Next to it you show a linear fit to estimate Qo. The intercept is somewhere between 925 to 1,000 B barrels.
Attached is a logistic fit of Saudi Arabian crude using two logistics. I have added 2023 and 2024 production to the Saudi Arabia data provided by OPEC. I get a Qo of 278 B barrels, which is close to what SA publishes.
Thanks Ovi,
Perhaps I ought to start using loglets as the graphs look very nice. As I understand it,
the first fit assumes the best value for the URR so that the fit looks good. Then
I suppose you restart the calculation after the first cycle with the cumulative after that and then let the logistic fit do its work. Is this the way you do it?
The main point of the paper was to show how the exports are diminishing. This is what Jeffrey Brown was doing. For that, I did not really do any fits as all the data comes from published sources.
Thanks for the great paper Prof Korpela. I really liked your ending…
“It ought to be obvious that my own thinking has led me to the conclusion that the most intelligent course of action is to change our direction and attempt to develop a simpler society.”
I would also add a much lower population, that needs to happen rapidly for the ecosphere, because a simpler society by itself without fossil fuels in the not distant future, would lead to every tree within close distance of population centres being cut down for heating and cooking and every mammal, reptile and bird that could be captures used as food and clothing. We need a much reduced population as we are very deep into overshoot by many billions..
As stated by Prof Korpela
“It is doubtful that the world population growth will follow the UN estimates for the rest of this century, for energy scarcity is likely to cause widespread famines to the world in a decade or two. Such famines were predicted by Paul and Anne Ehrlich,20in their book The Population Bomb, to arrive by 1970’s. That it did not happen, is taken as proof by cynics and optimists that it will never happen, is an interesting aspect of human thinking. But that such famines will take place is near certainty, and the only question is when will they begin? By missing the date by a few decades does not amount to much in the history of man, if the agricultural revolution some 12,000 years ago is taken as the starting point.”
And that is the big point of this whole fossil fuel depletion story.
That, and the repercussions of living in a world where humanity will fight over a declining pie.
Seppo
Microsoft Excel has an “add in routine” called Solver that performs Non-Linear Least squares analysis.
Yes, I know that from David Rutledge’s work on coal. Unfortunately, I do not have excell (perhaps ‘numbers’, the Mac alternative has it too) and never learned to use it well. I am using Matlab.
Seppo
I am not sure of the status of the latest Matlab vs what I used in the 90s.
Recently I was speaking to a second year business student and at some point he mentioned that he had just been given an
optimization exercise and had to use Solver and was having an issue. Fortunately I was able to clear it up for him.
Sounds like university’s are moving on from Matlab.
Based on the link below, the current Matlab has a few built in Solvers.
https://www.youtube.com/watch?v=8g_LB9J0RAQ
There is a fundamental issue between Excell and Matlab. Matlab is a procedural programming language much like many others. If universities want the students to learn such a language, I would think that they would not move into Excell. Also, there is a free Matlab clone, called Octave, (and other similar ones) but it does not have many of the toolboxes. Those are good for people, who are really immersed into some specialized field.
Matlab has an optimisation toolbox which is more comprehensive than Excel’s, but might not be free with the basic package.
Ovi, thanks for the heads up. I had the OPEC figure instead of Saudi. I get URR of 329.3 Gb for Saudi. Our figures are still a bit apart and they should give nearly the same number. I used the last 23 years of data. My first thought was that in your split, you did not used the right cumulative as the starting point in calculating the second peak. But, even then the numbers do not agree. The approach using only one peak ought to give the correct value for URR, at least that is my understanding. How about running your code that way and see if you get close to URR=329.3 Gb. My starting point in 1960 was 0.63 Gb, and it was adjusted so that is would check Colin Campbell’s 85.9 Gb in 1999. There is still the question of how to handle the Neutral Zone, that Campbell says had produced 6 Mb by 1999 and this is not part of the 58.9 Gb.
Seppo,
I get a similar result using HL for Saudi Arabia.
Seppo/Dennis
I have answered at the end in case readers scroll past this discussion.
I modified the calculation because, from what I said in 09/22/2023 at 10:10 pm
because of the Neutral Zone production.
The attempt to get the model model is exactly what I said in my article. It is fun for us technicians to work with the models and data, because we derive pleasure from the time we spend this way. In the end it matters little, for by now we have ample evidence that we are in trouble.
A clear and comprehensive explanation, and some really good graphics. I have a couple of suggestions: 1) Not positive but I think Orinoco belt is heavy mainly because it is immature and hasn’t been fully cooked, whereas Canadian tar sands are old and lost the light components from a period of exposure at the surface; 2) not all reservoirs with water contact get pressure support from the aquifer (e’g. there may be isolated fault blocks so the water can’t flow in) then water has to be pumped in to keep things above bubble point (water flood) or the pressure is allowed to drop and drive comes from the solution gas and some compression of the rocks.
Thanks George, I wrote this over the last three or so weeks, so I did not address all the technical details. But I reread Matthew Simmons’ book and I think he mentioned the fact that some zones do not get water support. I would need to revise that part to discuss more clearly the water support and solution gas aspect. Also, after the first reading many years ago of Simmons’ book, I did not pick at my first reading him mentioning horizontal wells in Saudi Arabia. I only became keenly aware of this with the tight oil.
As to the Orinoco oil, I realize that its production is done differently than tar sands. I just don’t have enough technical knowledge on the subject.
Orinoco heavy flows by itself in the well, they add diluent in the surface pipelines to aid flow. Tar sands don’t flow naturally, the viscosity is greater than 10000cP (which is a threshold for calling it bitumen). I mentioned the immaturity because the way I read one sentence seemed to say that both oils were heavy because they had lost the light components through ageing (Orinoco didn’t, I think).
Almost all of Saudi is water flood, i.e. with water injection wells and large systems to deliver the seawater. Kuwait is mostly aquifer flood and the produced water is quite nasty (corrosive etc.) and (again not positive) but it can’t be augmented with seawater injection because of scaling problems if the two different water types are mixed.
Saudi has more than just horizontal wells, they are intelligent completions so that parts can be shut off to stop water break through and some have side branches drilled (I think these are called maximum reservoir contact wells or something similar). Saudi also has about the best reservoir models around, as well as 4D (real time) seismic and wells just drilled for monitoring so it gets about the best recovery percentage possible.
Thank you George for relaying us your knowledge of petroleum chemistry and geology. It is very valuable to all of us, and by the way, your graphics are better than mine !!!
Orinocco is heavy because bacteria have chewed off the light ends. Same with Canadian tar sands.
Question- for fig 4.2 is the exporter level depicted the total amount of exporting country production, or the amount actually exported? I suspect the former.
Thank you…excellent big picture look.
Net export of crude oil energy is tricky since there is a lot of shuffling of product to match refinery requirements, and some countries import or export big amounts in the form of refined product.
It is what is exported. I should have added the totals up for each column in the table. Exports = 41380 b/d
Here is a parabola for the fit of exporting countries that are in decline. They are done by 2033.
So currently global exports of crude are back down to the 1990 level , at which time the global economy was smaller and population was almost 3 billion less.
Wonder if increased trade in finished product like diesel fills in the apparent gap?
If this is accurate (which I have no reason to believe it is not), then this is much much worse than any here have postulated…this may be the moment where production and price completely decouple (in some ways already has with Russian sanctions and black market trading).
When I read reports of shortages of diesel in Russia I have to wonder is it a production problem, or consumption problem from the war, or theft. One thing we know for sure is it’s in the best interest of oil producing countries to lie about their reserves. Including the US. So are these production cuts voluntary in Russia and Saudi? I have a very hard time believing that if OPEC+ had the ability to crush US shale they wouldn’t do it. But they didn’t. Is it that they’re in decline?
When we account for inflation $140 oil in 2008 would be $200 oil today. So oil is still relatively cheap compared to the 2008 spike but economic fundamentals are much worse. For oil to struggle with $100 barrier when inventories are so low indicates huge weakness in the system.
It would indicate we are already in recession which we are in real terms when you back out inflation from GDP.
At the moment the “struggle” in price increase is normal market mechanic. Traders need to take profit and short a bit after a big increase – fundamentals doesn’t matter for them.
I think technically they build now a flag, and then the increase continues. The story behind the falling oil prices of the last days is that the booming US production increase outproduces the OPEC cuts.
Seppo,
Does it seem that a quadratic function would be a good curve to use in this case? How is the fit before 1985? I would think there are many other functions that would be better, such as a logistic function for example or q/(1+(k/t)^n) where t=0 is the first year of crude exports.
Note that LibreOffice can be downladed for free as a Microsoft Office replacement and that spreadsheet program also has a solver routine. It will be interesting to see if crude exports follow a parabola in the future, I am skeptical.
Why attempt to fit the past when we are concerned about the future?
Seppo,
Past data is evidence used to substantiate a hypothesis. So if we are to choose a function to fit the data, a good fit to more of the data would inspire confidence in our model. I haven’t seen many cases where output data fits a parabola very well, perhaps net exports would be different, especially for those net exporters with declining output, eventually they reach the point where all output is consumed domestically and net exports fall to less than zero. It would at least be interesting to see the data before 1985 on your chart as sometimes there may be symmetry between increase and decrease.
A different take on net exports, this looks at all nations that had cumulative net exports from 1965 to 2022, a group of 34 nations, data from the Soviet Union is included from 1965 to 1984 to see how good the parabola fits over that period based on the fit from 1985 to 2022.
Data from Statistical Review of World Energy.
Dr. Korpela, I enjoyed your paper immensely, sir; congratulations. I find the rubbernecking a little silly, given your stature; let them write their own stuff with the same level of “credibility.”
I see this export issue plain and simple; renewable transportation fuels will not make so much as a dent in world hydrocarbon demand for north of another decade. There is no US refinery “swapping” of light tight oil for middle distillate grade oils, the tight oil sector created that illusion to justify exports and “net” exports of crude v. finished product of derivatives of crude (imported to us for the express intent of finishing) is totally irrelevant when looking at the big picture.
The US is speeding to a red light with regard to its tight oil exports. It could have been done entirely different (still could) and those with the most remaining natural resources, wins. That, sadly, will not be the US. We are on a mission from God to drain ourselves dry, as other people’s money will allow.
When I see your estimated decline for world oil exports chart, MY first thought is… if the world is facing starvation, and the obvious need for hoarding, why in the hell does the US have to share its remaining “food” with the rest of the world? Like China? If we can’t make diesel out of the LTO crap, lets blend it, let do SOMETHING different with it. ANYTHING, other than export it below costs.
America got stupid when NPV got to be…everything.
Again, thank you. I am always in awe of someone who puts so much effort into writing for the sake of preparing others for an unknown future. It exceeds simply trying to be right for the sake of ego. Jeffrey was like that too. He cared.
I agree with the big idea that the US should be working hard to extend the lifespan of the domestic oil supply as long as possible.
Conservative measures that should be adopted
-Yes, an export ban would be a big useful step.
-I’d go further and put a big use fee of some sort on non-essential and frivolous consumption. Sorry RV and airline industries. (yes…Sports teams flying around is frivolous)
-And we should rapidly and thoroughly adopt whatever mechanisms available to substitute functions currently provided by crude oil derivatives. Most obvious on this is rapid national adoption of electric transport…catch up and surpass China where current plug car sales are at 35%.
-The SPR should be filled with diesel as a priority of government.
Its only a matter of time, either way. Better to get to the state of shortage very slowly.
[sorry in advance if these measures would be damaging to you individually]
Hickory,
I think it would be better to implement a carbon tax and let people make choices, governments often make unwise choices due to influence from special interests. Too much micromanagement by the government is not always a good thing.
A high carbon tax would accomplish many of the things you hope to accomplish without specific restrictions placed on businesses and individuals on how they choose to spend their money.
I agree with Mike and you that the export ban is a good idea, for those that claim this should not be allowed in a “free” country, I would point to Dec 1975 to Dec 2015 when such a ban on crude oil exports was in effect. It was good policy then and remains so now.
Dennis Yes a carbon tax and export ban would a way to accomplish the goal of preserving the nations oil for longer, if it was high enough.
Problem with that approach is that it penalizes consumption of oil without discerning critical from optional use. A wealthy person in a jet is not distinguished from a potato farmer on a tractor. The tax would need all kinds of jiggering to make it a useful and somewhat equitable tool, which gets you back to the government policy choices problem.
This goal of extending the life of the nations oil is good, but it just won’t happen by policy choices until we get a lot closer to ‘in your face’ decline. Much higher prices for crude oil derivatives will serve as the blunt tool of discouraging consumption…rationing ‘lite’.
Hickory,
Policies such as fee and dividend would blunt some of the sting of a carbon tax, the potato farmer passes on the tax to her customers. As to what is a frivolous use, this is difficult to agree on, best to let the market decide perhaps, there are more important battles in my view.
I have many very liberal friends from the N.W.; we are Steelhead fishing fools together. We seldom agree on things, don’t allow politics to suffocate us, and I love them all. Making generalizations about people because of, for instance, where they are from, or what they do to make a living, or race, or economic status, is very trite, I believe, and unnecessarily divisive. I actually embrace a rational transition to renewable transportation fuels, one that ALL Americans can afford, and my advice to wacko cheerleaders is to not lie about it the way the shale oil industry has been lying about IT’S sustainability. I appear to be too late on that.
I have actually been out of the oil business, after 55 years, for over a year. But even before then I always, always put concern over my country before those of my own.
Mike –
The issue is that there is no national energy policy. Decisions to explore, produce and export and made by individual companies, all trying to either maximize cashflow and/or shareholder value. It really boils down to the age-old question of what is good for the individual (company) or the collective (country). KSA makes decisions based on national interests – there are no individual companies. The downside of such a structure is that it is likely to put brakes on innovation and initiative. Hence the need to import lots of skills.
The only hint of a national policy in the US is represented by the SPR – but – as we saw – that then has the risk of being used for political purposes rather than looking out for national interests. The US is a collection of individuals struggling to decide on whether to be a nation or not, and you can see that struggle in many different aspects btw.
Rgds
WP
A synthesis here would be easy – and is already implemented in law in the USA.
Just revive steering the oil production intensity by the drilling permissions, give a contingent every year so there is no huge boom / crash but a permanent flow.
Technical improvements are then not hindered – and yes there should (and are) additional environmental rules to obey – shortly said don’t spill oil around and keep the gas in the pipe and not in the environment.
From statistical review of World energy, exports divided by consumption for the World.
Seppo,
I have to say i thoroughly enjoyed your paper, especially the second half where you discuss and critique big pharma, big tech, big food and big energy. Totalitarianism operating under the guise of democracy, woke culture and leftism, WEF and mainstream media narratives conditioning the human herds all the while linking all of that to a symptom or side-effect of an energy depleting civilisation, brilliant stuff.
Your conclusion is pragmatic and carries a level of dignity you’d find in a self-aware human. Not touting to a different type of BAU which is the typical miopic anthropocentric viewpoint.
You displayed critical independent thinking throughout the paper which is the biggest threat to the powers that be. All in all a joy to read 10/10.
Thank you Mike.
Ron gets notable mention here. Clearly peak production isn’t what’s most important rather peak exports particularly diesel which is falling quickly.
https://ia801500.us.archive.org/16/items/oil-exports/Oil%20exports.75odt%20%281%29.pdf
Some good points, but Mr Larsen is in full Chicken Little mode in this paper. He’s predicting his own death by 2027 and human extinction in the 2030-40 timeframe. Essentially China and India suck up all available oil exports and the rest of us then starve to death in the cold while simultaneously being destroyed by flooding from global warming. Then I guess all the Chinese and Indians die soon after. I suggest a few deep breaths and then revisiting some of these pertinent points in a less breathless manner.
Not to worry, Stephen, just find some totally unrelated subject you can show that this man got wrong, and you can totally discredit the author. It’s called “Poisoning of the well.”
All is well with the world. You can go back to sleep now.
The article mentioned:
50% Of Proved Oil Reserves May Have Just Vanished
That article was written over seven years ago. What a few very smart people like Jeffery Brown knew back the, a lot more people are figuring out today. Jeffery called it “The Export Land Model.” You will be hearing a lot more about that in the future.
I think Johan Sverdrup completed its ramp up in June. Since it started up total Norway C&C has been fairly steady. There are two medium sized start-ups due in early 2024 and, Johan Castberg, a larger one, starting at the end of the year. There have been significant cost overruns reported for this but I haven’t seen any impacts on the schedule. Therefore production is likely to be maintained until mid 2025, but then may start declining. Another large Arctic project, Wisting, has been put on long term hiatus because of its complexity (which translates to low EROI and high cost and risk). Yggdrisil (formally NOAKA) is a large multi-field development but not due until 2027.
George
Attached is the latest production update for August from the Norwegian Petroleum Directorate. The July production jump from Johan Sverdrup can be seen, 65 kb/d to 1,846 kb/d, red markers. Not quite a post pandemic high.
August dropped by 41 kb/d to 1,805 kb/d. I wonder how much of this drop is related to maintenance vs decline. It will be interesting to see if those new startups will offset the natural decline rate.
My usual harping: Norway produced about half it´s peak of ~3000 kb/d, i.e. ~1500 kb/d when they more or less by chance found Sverdrup, so I would call it a semi-dead cat bounce. But if they can sell us some oil, or second hand EV batteries in the future, I´m fairly happy.
Gas supply has been declining, though the Troll field, the largest, is maintaing nameplate capacity fairly well. The Nyhamma gas plant takes feed from Ormen Lange, which is declining but more slowly since subsea compression was added, and Aasta Hansen. It supplies the UK directly and exclusively. The Dvalin field is also supposed to feed here; it started in early 2020 but has had problems with Mercury and proper production was only started in August this year.
Global oil reserves have increased by 54 billion barrels last year
https://www.rystadenergy.com/news/recoverable-oil-reserves-billion-barrels-warming-planet
Mainly from proving up existing fields.
Oh wow! We are saved!
While published many months ago, it’s always important to take info completely out of context in a futile attempt to pump you agenda…
Take a closer look at 1P/2P reserves and it’s consistently downward trend….may not fit your agenda though.
Kengeo
Your childish pathetic comment just shows how little you know and how difficult you find dealing with evidence your don’t like.
The fact that you post the same information again and again and again shows a serious mental health problem, obsessive compulsive disorder is my guess.
https://www.nimh.nih.gov/health/publications/obsessive-compulsive-disorder-when-unwanted-thoughts-or-repetitive-behaviors-take-over#:~:text=People%20who%20are%20distressed%20by,help%20people%20manage%20their%20symptoms.
Chucky – Name calling, how big of you. You and TTT might be one and the same!
Kengeo,
Yes 2P reserves have been decreasing. The mistake you make is to not understand that as 2P reserves are produced, they also are added to each year from contingent resources. So if 2P reserves were 500 Gb, the assumption that future output will be no more than 500 Gb is nearly certain to be incorrect. There are three things that you do not account for, contingent resources, reserve growth, and future discoveries.
Can you remind of us of your latest prediction for future output? You seem to have revised your thinking of late, my best guess has remained the same for about the past 6 months or so.
Dennis – Yes, you continue your absurd estimates in light of production data which points in the exact opposite direction, apparently you only review your model every 12 months so I guess another 6 before you adjust. The irony is that the absolutely best case scenario world production doesn’t meet the previous peak (or just barely does as you contrive to make it so).
My estimates have accounted for several decline scenarios where the decline may be anywhere from ~1-5% per year, I would estimate the last 12 months alone have been over 3% decline, review my analysis without your bias and you might learn something. I’ve tried repeatedly to come up with your URR of ~2,700 Gb and always fall short by ~20% (500 Gb).
Using values for Oil that has >90% likelihood of remaining in place doesn’t seem like a good idea (which is why you don’t use the value of 3,500 Gb, right?).
We know for a fact that the key producers and exporters have pushed their fields in ways that will eventually lead to sharp decline (likely already have).
We also know that much of the remaining oil will be more difficult and costly to acquire.
Everything taken together means that within a short period of 5-10 years we can expect a loss of at least 10-30 mb/d.
Your model falsely assumes that somehow the peak could be extended to >70% URR, and you state without evidence that production curve doesn’t follow a Hubbert curve. The nature of resource extraction does follow the curve with a peak at 50%, but cherry-picking as always to fit your needs.
The relative plateau for the past 20 years should be a dead giveaway, you will come to terms with the decline and fix your model in time, most likely within 6 months.
Kengeo,
Output did not follow a Hubbert curve from 1870 to 1995, why would we expect output would follow a Hubbert Curve at all? The Logistic is a convenient function which peaks and declines, but generally output does not follow that function very well over time.
The main reason I expect another peak is due to conventional output remaining on a plateau for a few more years and unconventional output continuing to increase for a few years.
I have pointed out several times that peak output occurred at cumulative output of 1273 Gb for conventional output in 2016, your assertion that peak must occur at 50% of URR implies a URR of 1273 times 2 = 2546 Gb, my scenario has a conventional URR of 2500 Gb.
You have never resolved this inconsistency in your thinking. The rest of the output in my scenario comes from tight oil (72 Gb) and extra heavy oil (98 Gb). the current cumulative output for those types of oil combined is 48 Gb at the end of 2022, my scenario has the peak for these in 2027 at a cumulative output of 72 Gb, the 50% point for URR is reached in mid 2030 for unconventional oil.
I do not use the 3500 Gb estimate because I do not think it is a good estimate, one reason is that the demand for oil may not be large enough to make the extraction of expensive unconventional resources viable, oil prices probably will not remain high after 2033 and extraction rates will fall.
If I am wrong about that and oil prices remain high then it is possible the URR may be close to 3000 Gb.
As to which scenario is absurd, we will see who is closer for 2023 average output and beyond.
Note that I have revised your scenario up to a peak of 83 Mb/d, rather than the 80 Mb/d in your original scenario to give you a better chance of being correct, your original 2P to 2PC average scenario was shifted lower than what I have presented by about 3 Mb/d each year.
Kengeo,
Scenario below more correctly reflects your middle scenario (gray dots in original chart). In 2022 your scenario has output about 4 Mb/d too low relative to reported EIA data. (76.3 Mb/d vs 80.6 Mb/d). It will be interesting to see what output is in 2023.
Kengeo,
A Hubbert model with URR of 2940 Gb using 2003 to 2022 data for HL, peak is 2021, comparison of World output data with model from 1872 to 2022, note the poor fit from 1890 to 1990, this is the proof that the Hubbert model will not fit past data very well, it is unlikely it will model future output very well.
Comparison of Hubbert Model (which looks too low based on recent data), Data from EIA and a Shock Model based on conventional and unconventional scenarios. My scenario matches near term forecasts by EIA through 2024, STEO has output reaching my 2027 peak in 2024, so my scenario is actually conservative relative to STEO.
On the plateau for the past 9 years or so (2015 to 2023), this might be explained by a lack of demand, the low oil prices are a hint this might be the case.
Dennis – Thanks for running these. I believe the trick is “best fit”, can’t expect it to fit perfectly. No matter how you slice it we are past the peak and trend is lower, your model has a strange ‘quasimodo’ looking hump that I don’t believe to be possible, but time will tell.
Kengeo,
My pleasure, at some point I should do separate Hubbert Models for Conventional and Unconventional Oil.
Yes, if you do, suggest trying a shark fin shape for unconventional…I think that is the major risk with the shale oil, still fine to fit HL, but need to recognize production may plateau then abruptly decline, over short period of time (3-4 years). For example, if the ramp was 2010, then peak 2018 thru 2024 (flat 2024-2026), sharp decline might be 2026 thru 2030…(4% decline then abrupt >20% decline after 2028).
Looking at unconventional it looks like we just hit 50% of URR (assumes ~40 Gb – but I think you use a higher value?). Every additional 10 Gb extends plateau by 4 years.
Hopefully URR is closer to 65 Gb, that buys us an extra decade…
I have not posted in a while; however I have still enjoyed the dialogue. In the the micro level of the domestic oil industry and not coming from a world market view, there is a significant dearth of capital going into the Industry.
I have been raising capital for a new project and there is very little appetite for fossil fuel investment except for a few pockets of private family offices. The debt market is closed for expansion or development capital.
Saudi Arabia announced last week that it was looking outside the KSA for oil projects. Running out of Drilling Inventory? Sure sounds like it.
Whether we are peak or not is still highly dependent on product prices. Higher prices for longer is the only way we we keep production up or plateau. The economics are just not there for expensive projects (which is the only major exploration left to exploit)
LTO Survivor,
Thanks for the update, good luck.
I’ve been reading about a diesel fuel shortage. For example: https://www.asiamarkets.com/diesel-fuel-shortages-could-lead-to-a-global-economic-crisis-within-months/
Is it true? Will it get worse?
In a comment above Seppo asked me to rerun a Saudi calculation for the URR using one logistic instead of the two used above.
Using one Logistic, gives URR of 318 B barrels using OPEC crude data for SA from 1950 to 2022 plus two estimates I added for 2023 and 2024. The same data used in the two logistics model.
Seppo in Solver, only initial estimates are required. One then asks it to minimize the least squares fit. It then solves for the constants for URR, peak year for each logistic and the shape parameter. These are shown in the first picture posted. The new numbers for one logistic are shown in the attached picture.
The total least squares for 1 and 2 logistics was 210 M vs 55 M respectively. As I mentioned in the earlier comment, the 278 URR is closer to what SA claims. As for the Neutral Zone, it contribution for many years was in the order of 250 kb/d, a small fraction of Saudi output.
Ovi, do you fit a straight line by least squares for all the data from 1950 to 2024? If you do this, that might explain the difference as I only use the data from 1999 to 2022.
Here is a link to the article with some errors corrected.
https://www.dropbox.com/scl/fi/3iqa8pu4peb9zbivilz5b/oilanalysis.pdf?rlkey=6b4075g05xr4ijmhn9tp8wj55&dl=0
Seppo,
I believe he is fitting the logistic directly with solver rather than using HL. Using HL I get URR=341 Gb when I use 1999 to 2022 data, I am using EIA data and cumulative C plus C at the end of 1998 is 86.87 Gb and at the end of 2022 cumulative output is 168.6. the constant is 0.0435, peak year is 2023.
Ovi,
The Saudis claim to have 278 Gb of reserves, cumulative output at the end of 2022 was about 168 Gb, adding these would give us the URR which is 446 Gb. Not sure what you mean when you say the Saudis claim 278 Gb, this would suggest about only 110 Gb of reserves, I may be missing something.
If the 341 Gb estimate is accurate, it would suggest Saudis may be near their peak as they are close to 50% of this URR estimate, remaining reserves would be 173 Gb, about 120 Gb less than claimed by Saudis.
What is the cumulative output for your Hubbert model at the end of 2022?
Dennis
You are correct, I am using solver directly. Also attached is the HL for two Logistics. Not very linear.
There has been lot of discussion regarding the published SA proven crude reserve number. A number of people think that they are really publishing the URR because it barely changes from year to year, currently 267 Gb barrels. See next tabIe. I am relating to that discussion because it is difficult to believe that SA finds the same amount of new oil every year that is equal to their production.
Also note that OPEC numbers I used from 1950 to 2024 are Crude.
Cumulative end 2022 is 178 Gb barrels
Ovi Thanks,
According to OPEC data at link below
https://asb.opec.org/data/ASB_Data.php
Saudi Cumulative crude output was 165.5 Gb at the end of 2022.
Not sure that 278 Gb is the URR, but it is also not likely to be 2P reserves either, my guess is that the HL estimate by Professor Korpela may be somewhat conservative, but nobody really knows.
Dennis/Seppo
I went back to compare the production to 2022 for the one and two logistic models and found I flipped two numbers. Here is the updated production up to 2022 for the one and two logistic models.
One logistic: 181.8 Gb
Two Logistic: 169.5 Gb vs 165.5 Gb Saudi actual
Numerical Integration of production data gives 165.7 Gb.
So I still think that the two logistic model is better and the URR of 278 is much closer to the claimed Saudi reserves of 267 Gb, which IMO is the URR.
Dennis/Seppo
I just noticed that Frenchfries has a URR of 236 Gb for Saudi Arabia in the table he posted. Another piece of evidence that their published proven crude reserve of 267 Gb is more than likely URR.
There may be smaller fields that could add another 30 Gb to make up the difference.
https://peakoilbarrel.com/opec-update-september-2023/#comment-763711
Latest OPEC data on SA
Per Rystad, Saudi’s have 1P = ~30 Gb and 2P = ~60 Gb
2PC jumps all the way to ~255 Gb.
URR (1P) = 215 Gb
URR (2P) = 245 Gb
URR (2PC) = 440 Gb
I would offer one other possibility, using peak of ~2016, URR could be a maximum of ~320 Gb, this lines up with Dennis’ best guess of 345 Gb, which is interestingly the average of 2P and 2PC…
I believe the max. likely amount to be 275 Gb plus/minus 10%…so a range of ~250 Gb to ~300 Gb, meaning reserves remaining are about 60 to 110 Gb (between 16 to 30 years).
It’s all splitting hairs, the only thing that varies is when production hits zero, in 15 years, 30, or somewhere in between.
Seppo
I don’t use HL.
New Posts are up
https://peakoilbarrel.com/steo-and-tight-oil-update-september-2023/
and
https://peakoilbarrel.com/open-thread-non-petroleum-sept-27-2023/