By Ovi
The focus of this post is an overview of World oil production along with a more detailed review of the top 10 Non-OPEC oil producing countries. OPEC oil production is covered in a separate post.
Below are a number of Crude plus Condensate (C + C) production charts, usually shortened to “oil”, for the oil producing countries. The charts are created from data provided by the EIA’s International Energy Statistics and are updated to April 2026. This is the latest and most detailed/complete World oil production information available. Information from other sources such as OPEC, IEA, STEO and country specific sites such as Brazil, Norway, Mexico, Argentina and China is also reported to provide an extra one or two months production preview beyond the EIA’s latest report.
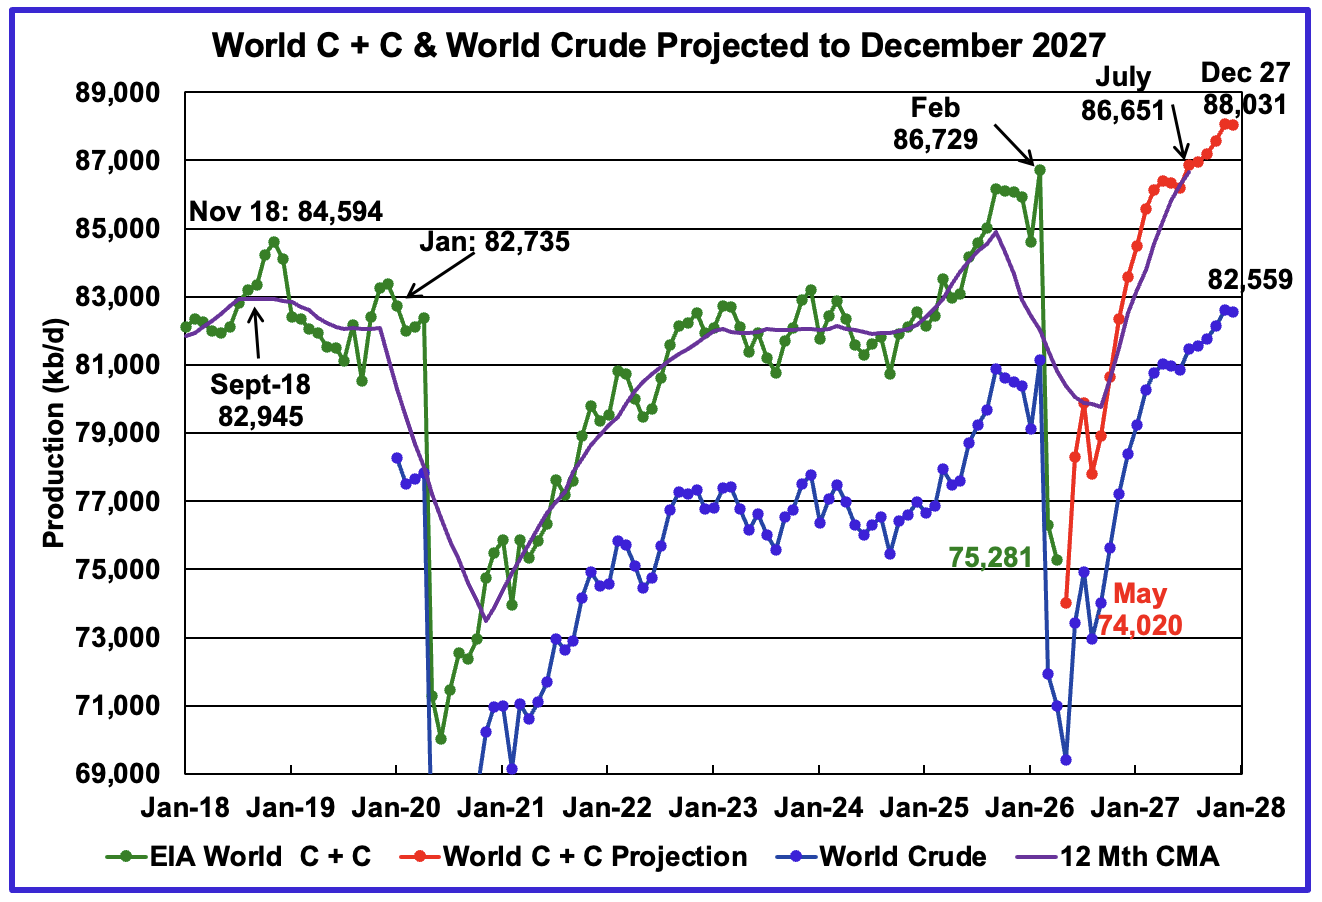
The World’s April oil production dropped by 1,026 kb/d to 75,281 kb/d due to the closing of the Hormuz Straits. The largest contributor to the drop was Saudi Arabia, 900 kb/d.
The EIA’s August STEO report continues to make significant and major revisions to the World’s projected oil production after March 2026 due to the US/Iranian war.
This chart has been updated using the August 2026 STEO to project World C + C production out to December 2027. It uses the STEO report along with the International Energy Statistics to make the projection. Production in May 2026 is projected to fall to 74,020 kb/d and is forecast to be the bottom.
The 12 month Centred Moving Average shown at July 2027 is 86,651 kb/d.
For December 2027, production is projected to be 88,031 kb/d, a new projected high. The increase comes from a number of Non-OPEC countries.
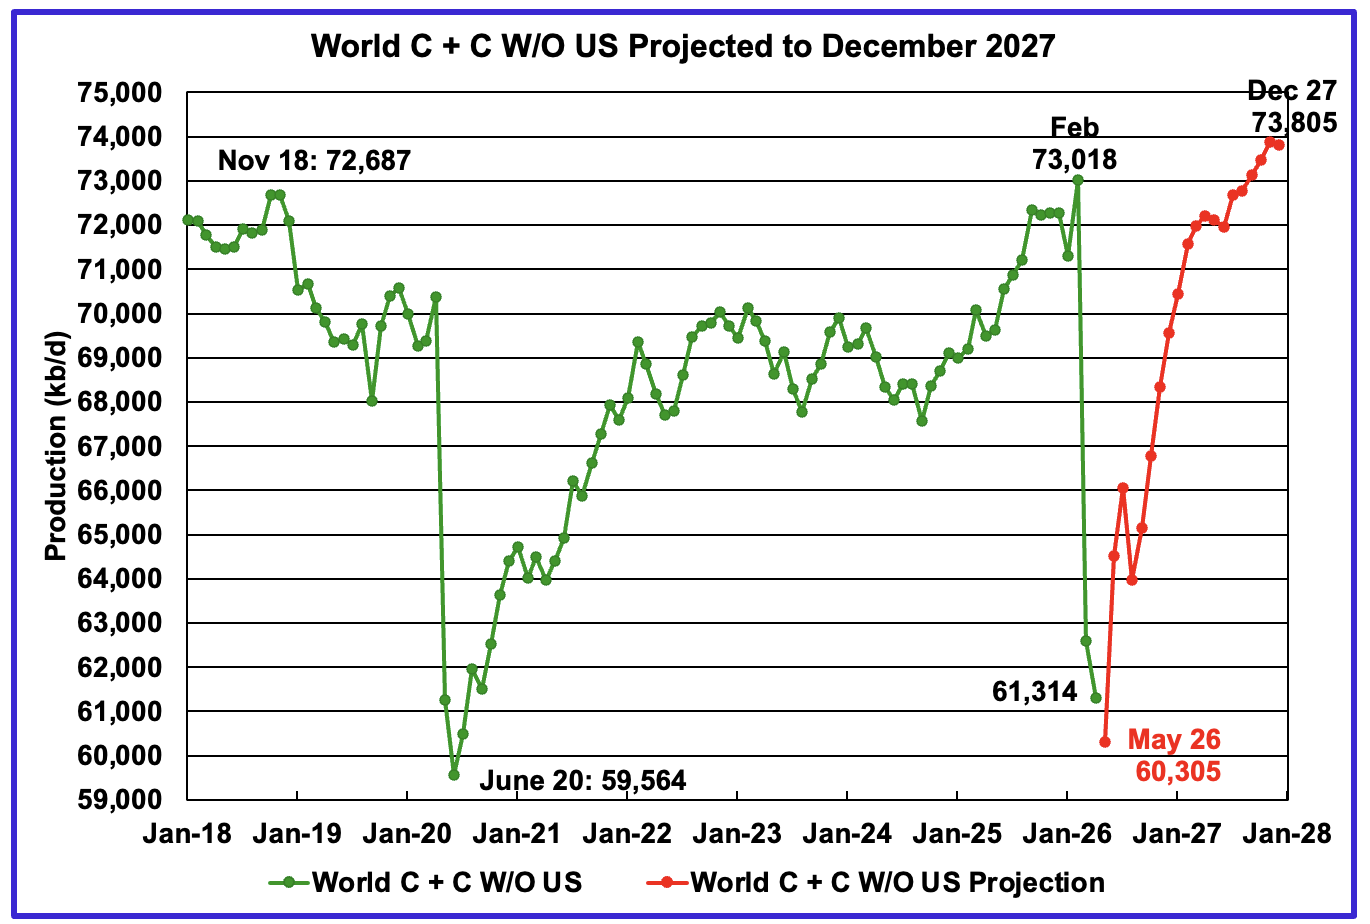
April World oil output W/O the US decreased by 1,276 kb/d to 61,314 kb/d. May production is expected to be the low point at 60,305 kb/d.
The projection is forecasting that December 2027 World W/O US oil production will rebound to 73,805 kb/d.
From February 2026 to December 2027, production is expected to grow by 787 kb/d to 73,805 kb/d. This small increase may be more than welcome to offset the demand destruction associated with higher oil prices.
A Different Perspective on World Oil Production
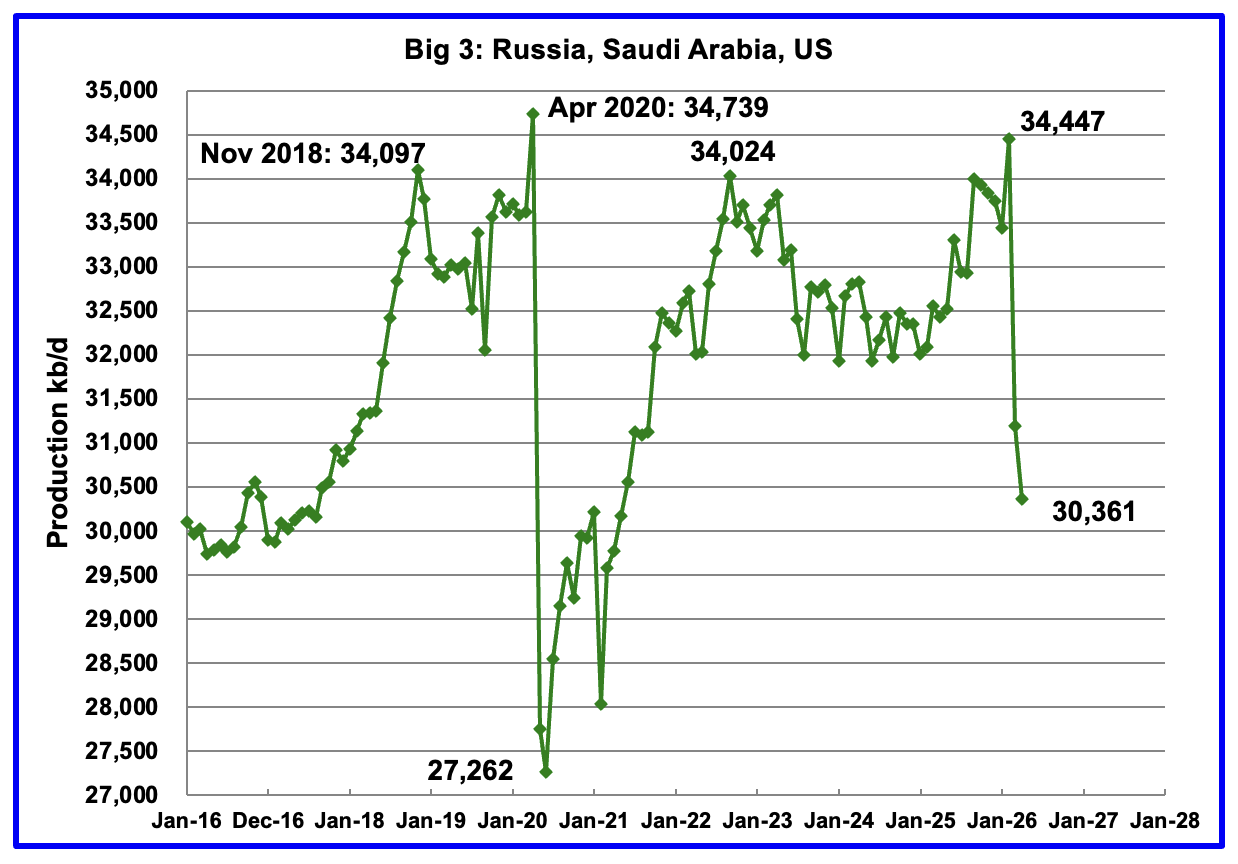
April Big 3 oil production decreased by 834 kb/d to 30,361 kb/d.
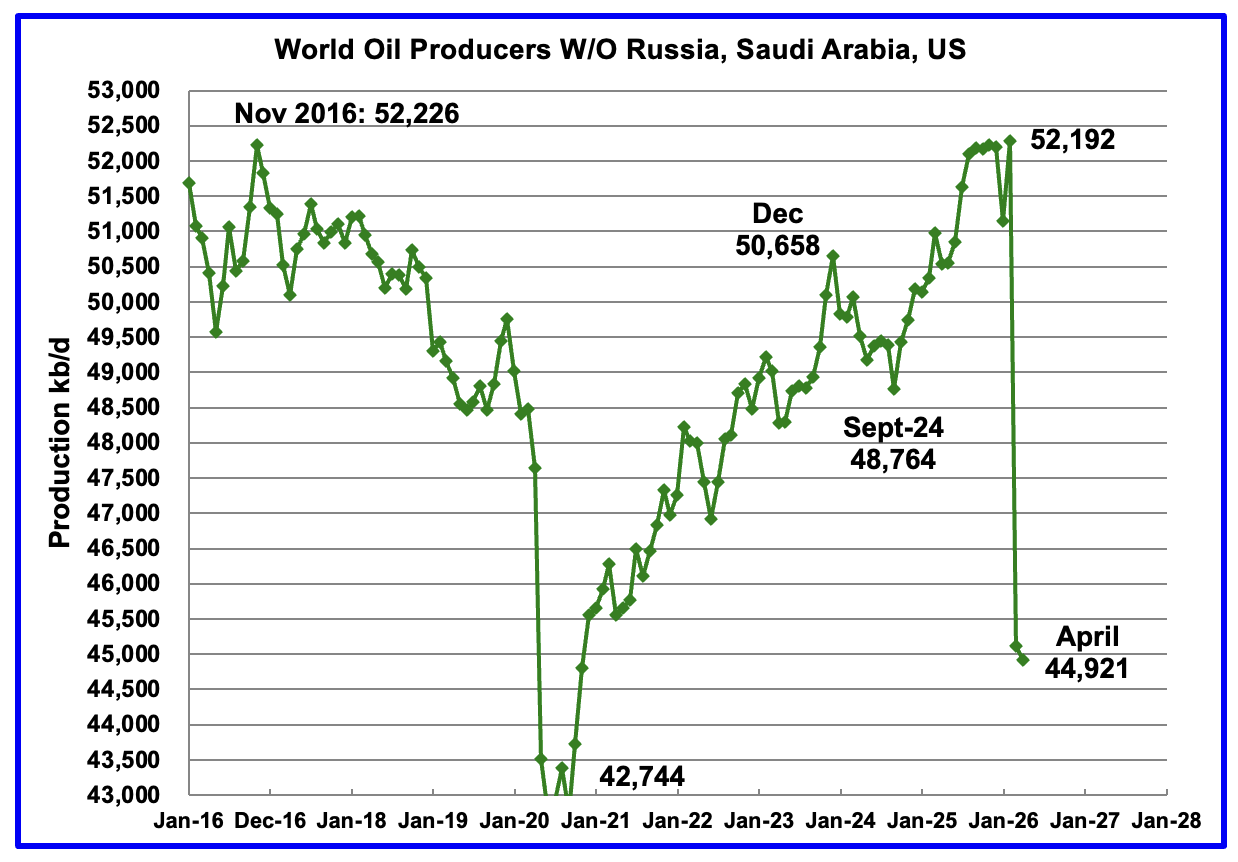
Production in the remaining countries also dropped due to the closing of the Straits of Hormuz. April W/O Big 3 oil production decreased by 192 kb/d to 44,921 kb/d.
Countries Expected to Grow Oil Production
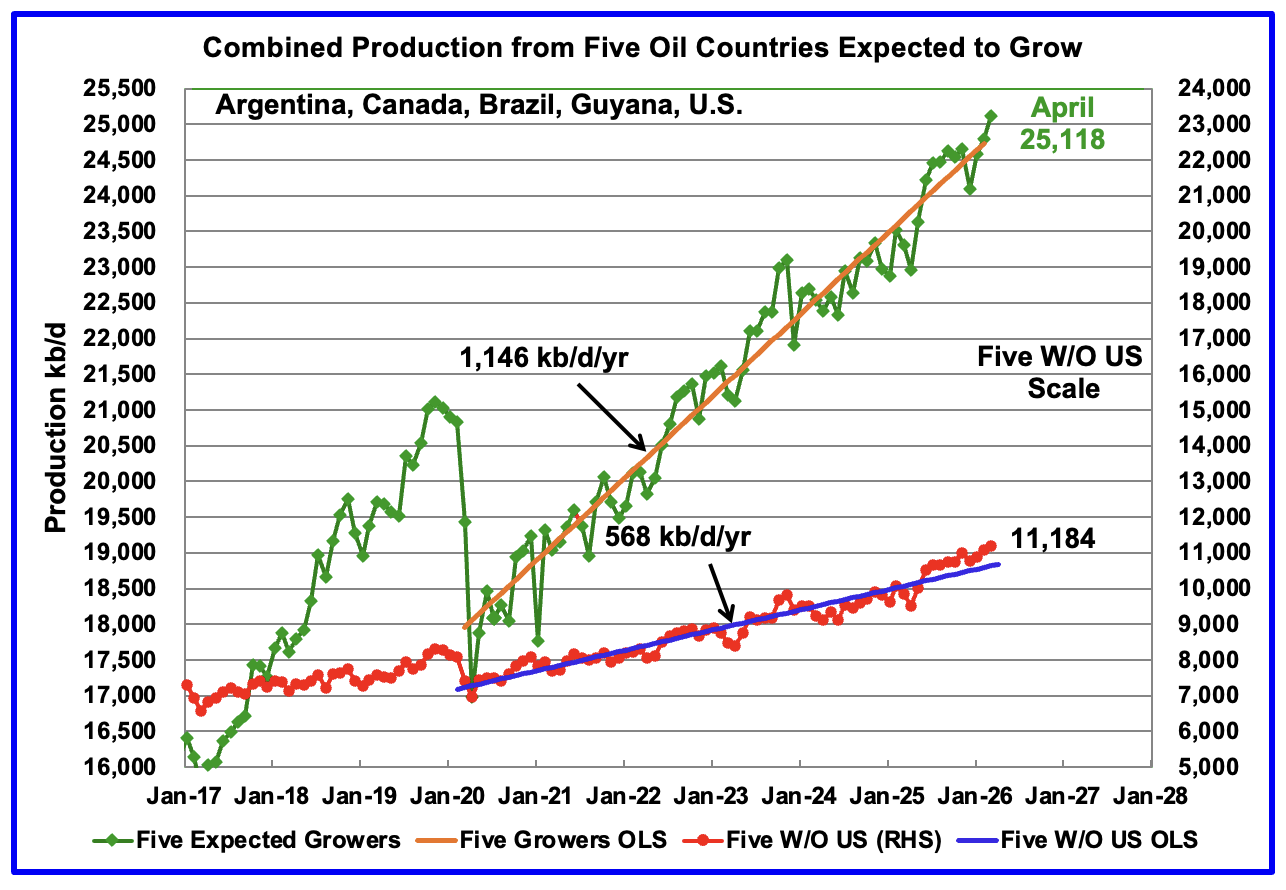
This chart shows the combined growing oil production from five Non-OPEC countries, Argentina, Brazil, Canada, Guyana and the U.S., whose oil production is expected to grow in coming years. These five countries are often cited by OPEC and the IEA for being capable of meeting the increasing World oil demand for next few years. Production from these five countries from April 2020 to February 2026 rose at an average rate of 1,146 kb/d/year as shown by the orange OLS line. This is an updated OLS to February 2026 and the growth rate rose slightly from the previous rate of 1,130 kb/d/yr to 1,146 kb/d/yr. From March 2026 to April 2026, production rose by 326 kb/d.
To show the impact of US growth over the past 5 years, U.S. production was removed from the five countries and that graph is shown in red. The production growth slope for the remaining four countries has been reduced by 578 kb/d/yr to 568 kb/d/yr.
April production has been added to the five growers W/O US chart and it rose by 110 kb/d to 11,184 kb/d.
World Oil Countries Ranked by Production
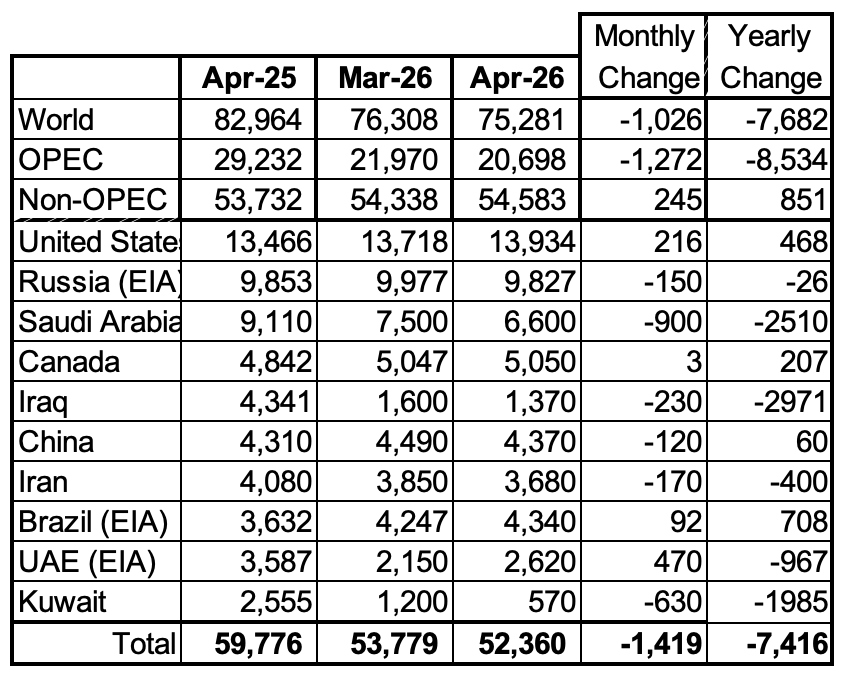
Above are listed the World’s 10th largest oil producing countries. In April 2026 these 10 countries produced 69.5% of the World’s oil. On a MoM basis, production decreased by 1,419 kb/d in these 10 countries while on a YOY basis production dropped by 7,416 kb/d. Due to the ongoing US/Iran war, the countries are ranked using April 2025 production.
Non-OPEC Oil Countries Ranked by Production
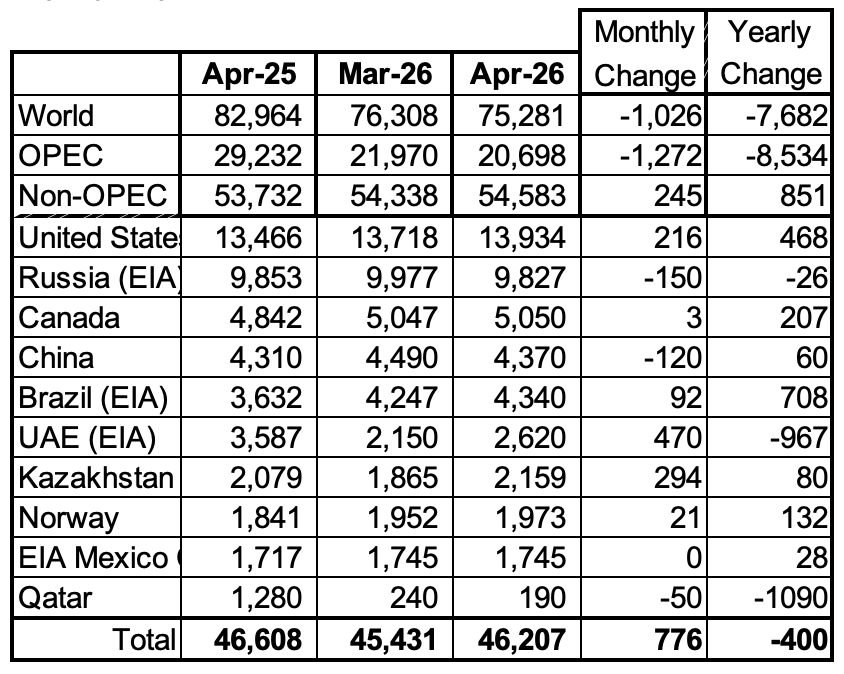
Listed above are the World’s 10 largest Non-OPEC producers. The UAE has been added since they have left OPEC.
April MoM production increased by 776 kb/d to 46,207 kb/d for these 10 Non-OPEC countries while as a whole the Non-OPEC countries saw a yearly production increase of 851 kb/d to 54,583 kb/d.
In April 2026, these 10 countries produced 84.7% of all Non-OPEC oil.
Non-OPEC Country Oil Production Charts
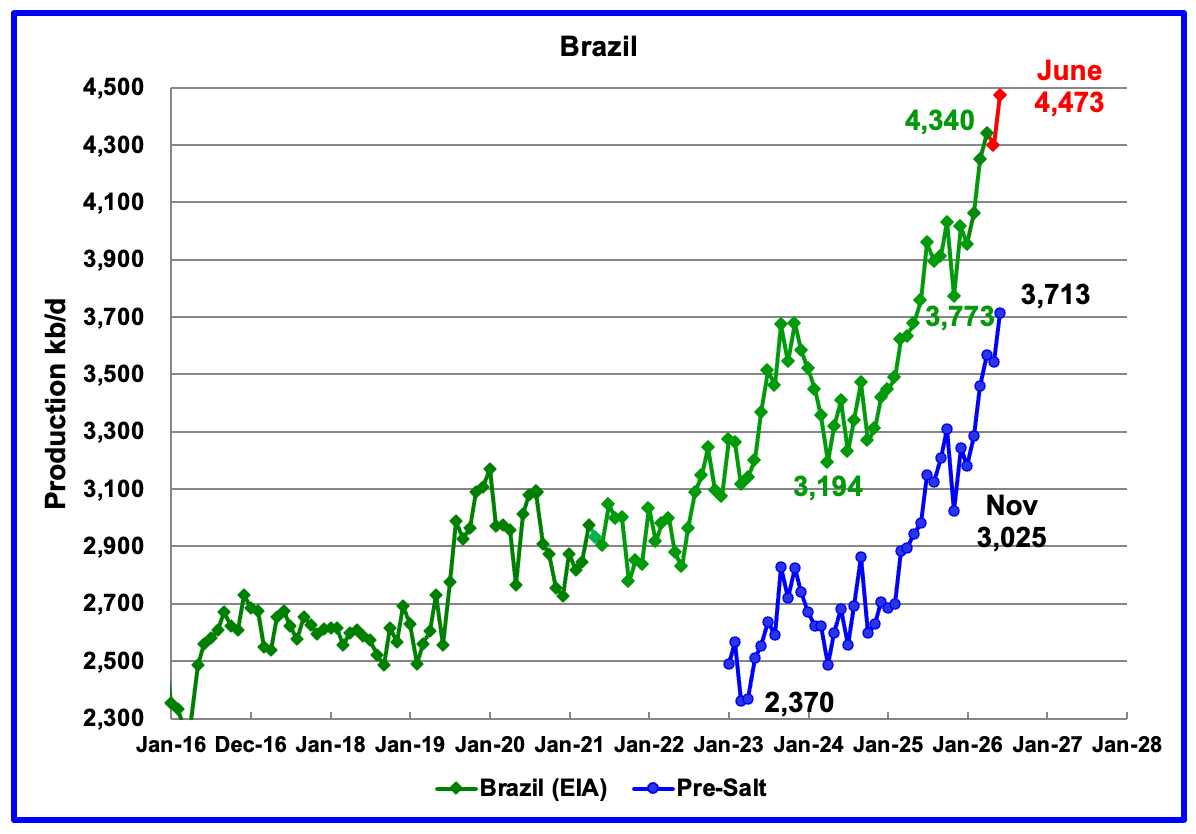
The EIA reported that Brazil’s April production rose by 92 kb/d to 4,340 kb/d, a new record high. According to this Article, the pre-salt reservoirs remained the backbone of national production, accounting for nearly 80 per cent of total oil and gas output.
Brazil’s National Petroleum Association (BNPA) reported that production rose in June to 4,473 kb/d, a new high. From November 2025 to June 2026 Pre-Salt production rose by 700 kb/d and is the major contributor to Brazil’s rising production.
According to the August OPEC MOMR: “Upstream liquids output is expected to rise as production scales up at the Buzios (Franco), Bacalhau and Wahoo projects. Oil project start-ups are anticipated at the Buzios field and the Pampo-Enchova Cluster assets.“
“Despite promising start-up plans in offshore Brazil, rising development costs and sustained inflation could tighten offshore project economics, leading to delays in assumed final investment decisions.“
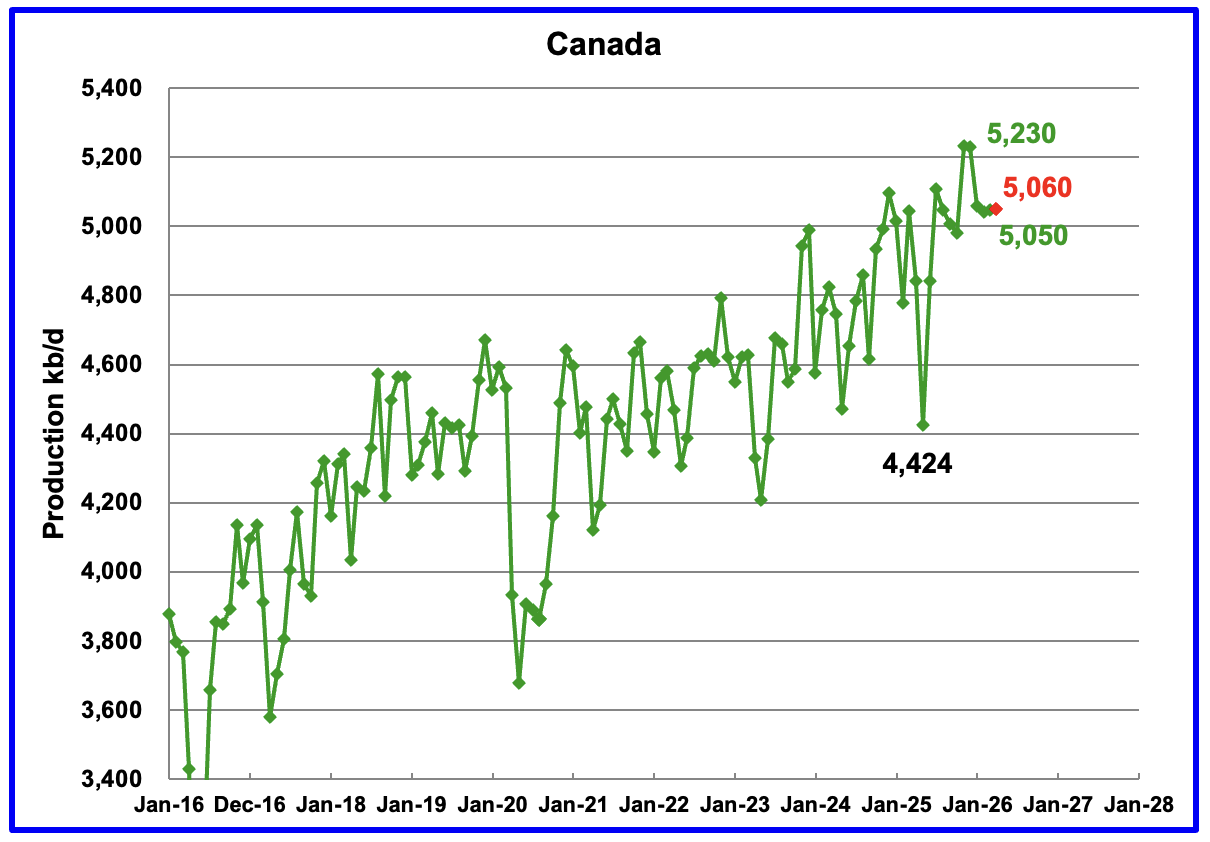
Canada’s oil production increased by 3 kb/d in April to 5,050 kb/d according to the EIA.
Canada’s January and February production was down due to unexpected downtime at a few oil sands companies. May production is expected to grow by 10 kb/d to 5,060 kb/d, red marker.
According to OPEC’s August MOMR: “In 2026, Canada’s liquids production is forecast to expand by 0.1 mb/d to average 6.2 mb/d. Oil sands production is expected to be primarily driven by asset extensions, brownfield developments, debottlenecking and the extensive implementation of advanced drilling technologies.
Canada’s new TMX pipeline is running at full capacity earlier than expected due to the partial closing of the Straits of Hormuz.
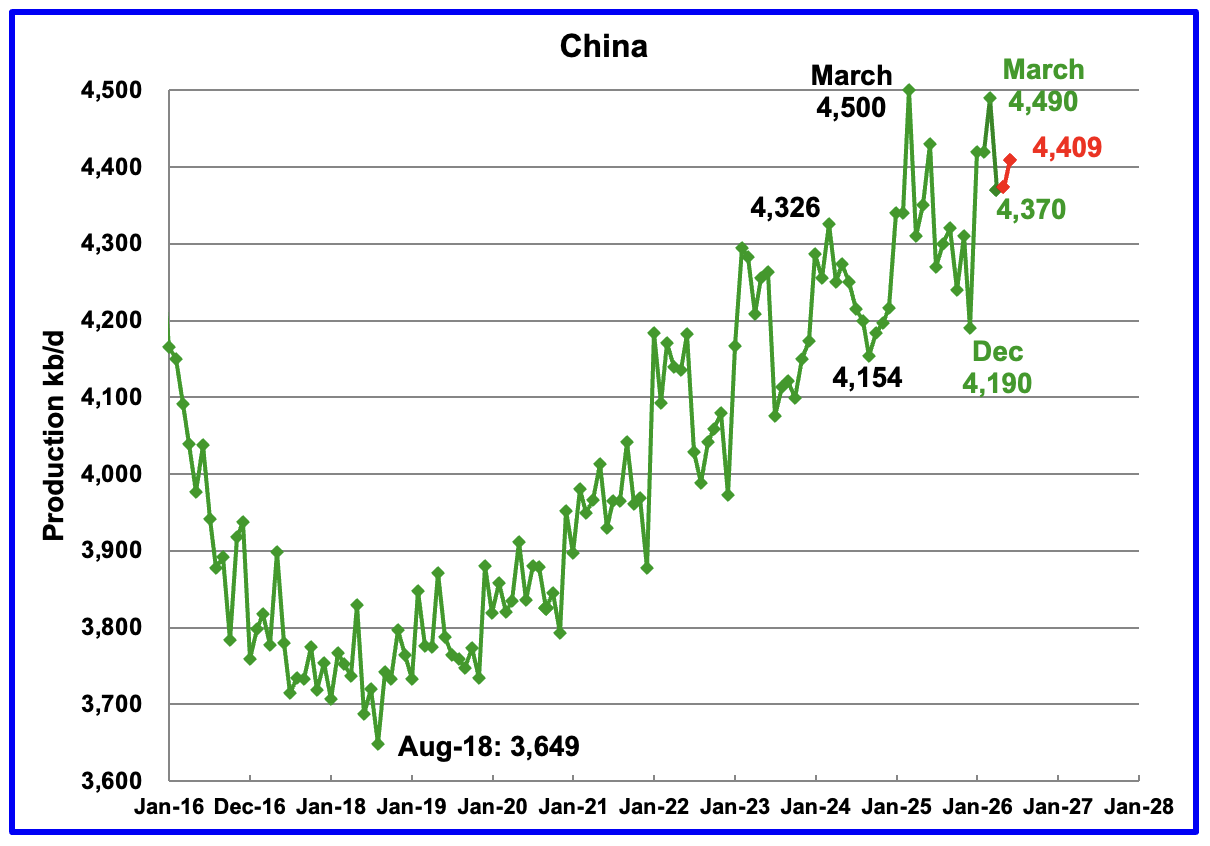
The EIA reported China’s April oil output dropped by 120 kb/d to 4,370 kb/d. On a YoY basis, China’s April production rose by 60 kb/d. For June, China’s oil production rose to 4,409 kb/d, red markers.
For the last two years, March has proven to be a record production month. Again this year March showed a large gain but it did not exceed the March 2025 peak of 4,500 kb/d. Does this hint at an upcoming peak in China’s oil production?
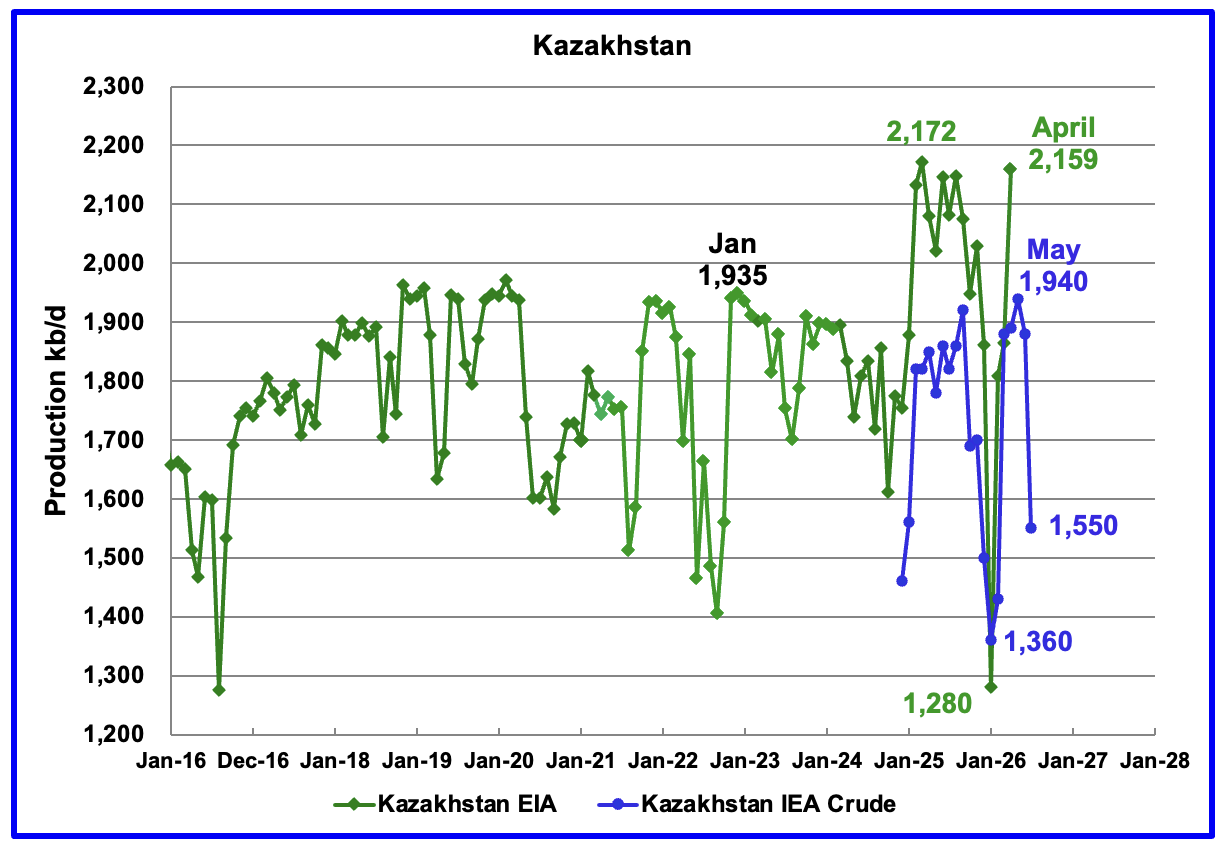
According to the EIA, Kazakhstan’s April oil output increased by 294 kb/d to 2,159 kb/d after the fire damage to the Tengiz oil field power generating plant was repaired. Production hit a low of 1,280 kb/d in January 2026.
Since Argus no longer reports OPEC + crude production, production data for Kazakhstan will now be taken from the monthly IEA reports. The August IEA OMR reported that crude production in July dropped to 1,550 kb/d.
The drop according to this Article was related to disruptions to the CPC pipeline after drone attacks near the Caspian Pipeline Consortium (CPC).
“The decline was linked to disruptions at the Caspian Pipeline Consortium, the main export route for Kazakh oil, the source said. Kazakhstan’s oil production heavily depends on the CPC, as it has no real alternatives to ship the lion’s share of its vast oil output elsewhere.“
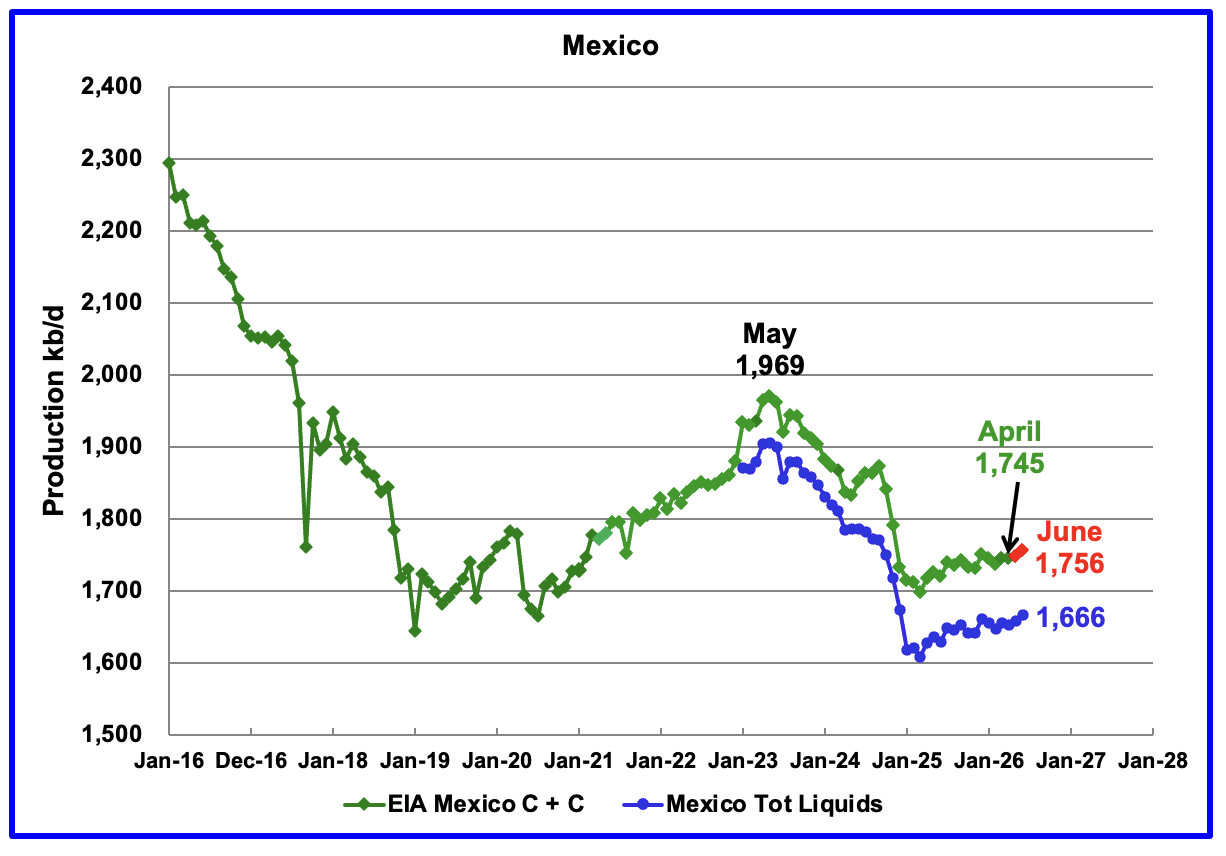
According to the EIA, Mexico’s April output was unchanged at 1,745 kb/d.
In June 2024, Pemex issued a new and modified oil production report for Heavy, Light and Extra Light oil. It is shown in blue in the chart and it appears that Mexico is not reporting condensate production when compared to the EIA report.
In earlier EIA reports, they would add close to 55 kb/d of condensate to the Pemex’s “Total Liquids” report. More recently the EIA has been adding 90 kb/d of condensate to Mexican production. For May and June production, 90 kb/d have been added to the Pemex report. June C + C production is estimated to be close to 1,756 kb/d, red markers. Note that Mexico’s production, as reported by Pemex for the last eight months has stabilized around 1,660 kb/d, blue graph.
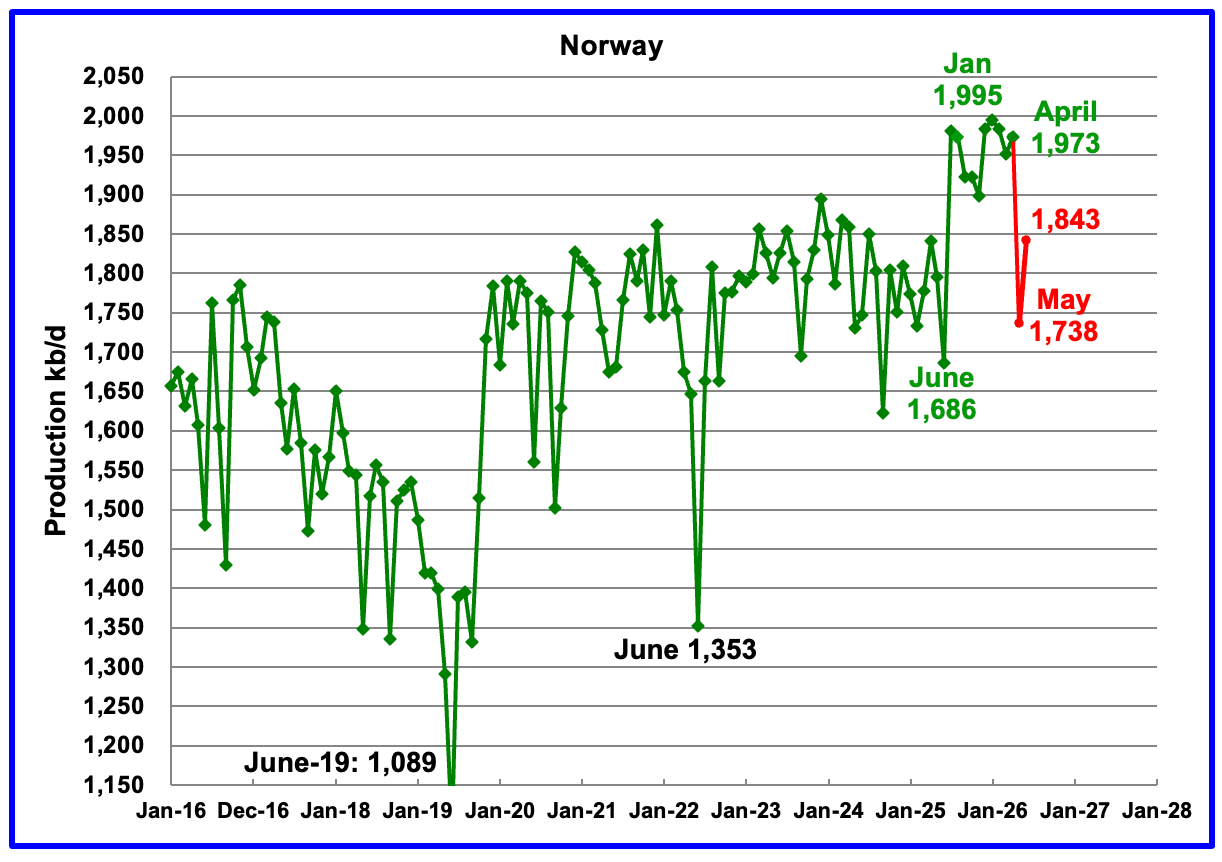
The EIA reported Norway’s April production rose by 21 kb/d to 1,973 kb/d.
Separately, the Norway Petroleum Directorship projected that oil production in June will rise to 1,843 kb/d from 1,738 kb/d in May. The red markers are the NPD’s production forecast.
According to OPEC’s August MOMR: “In 2027, Norwegian liquids production is forecast to drop by around 70 tb/d to average 2.0 mb/d.”
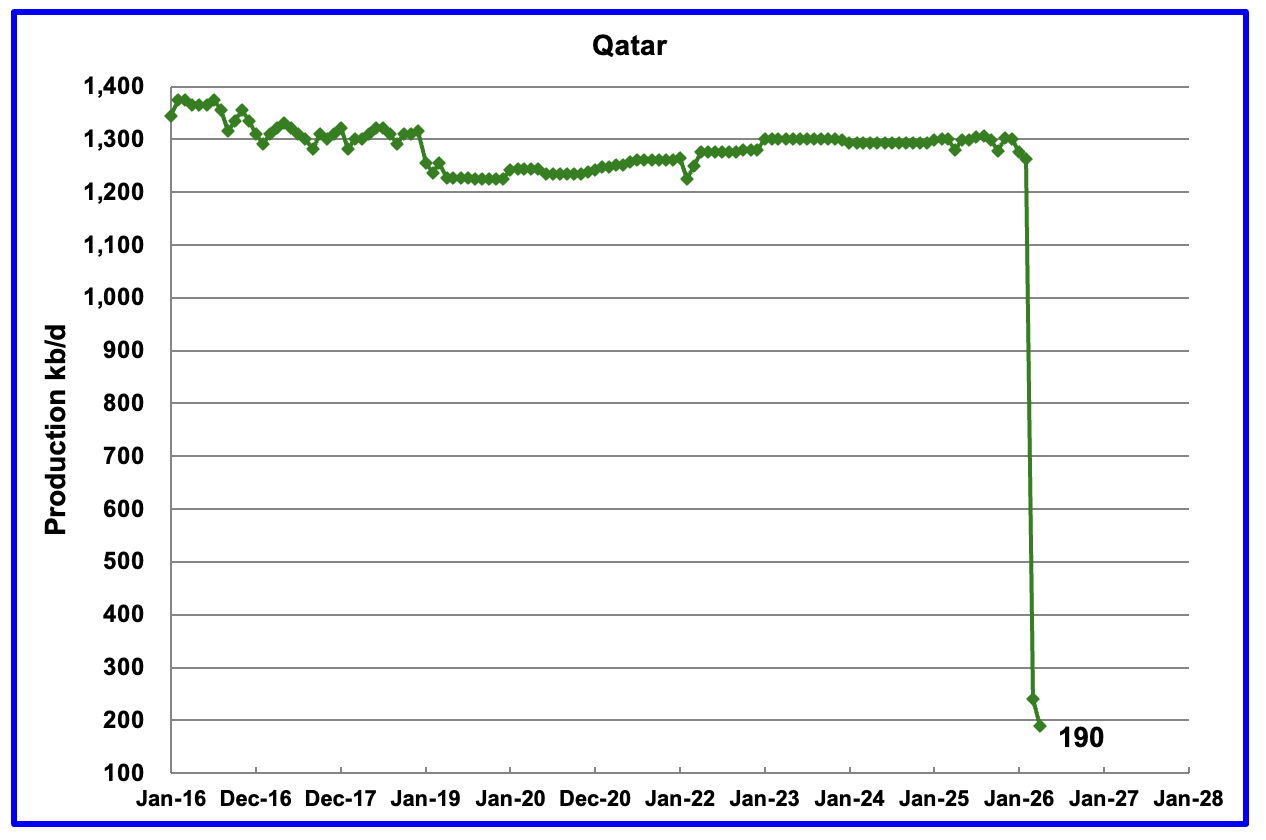
Qatar has restarted providing the EIA with monthly updated oil production. Qatar’s April output dropped to 190 kb/d due to the Iran/US war.
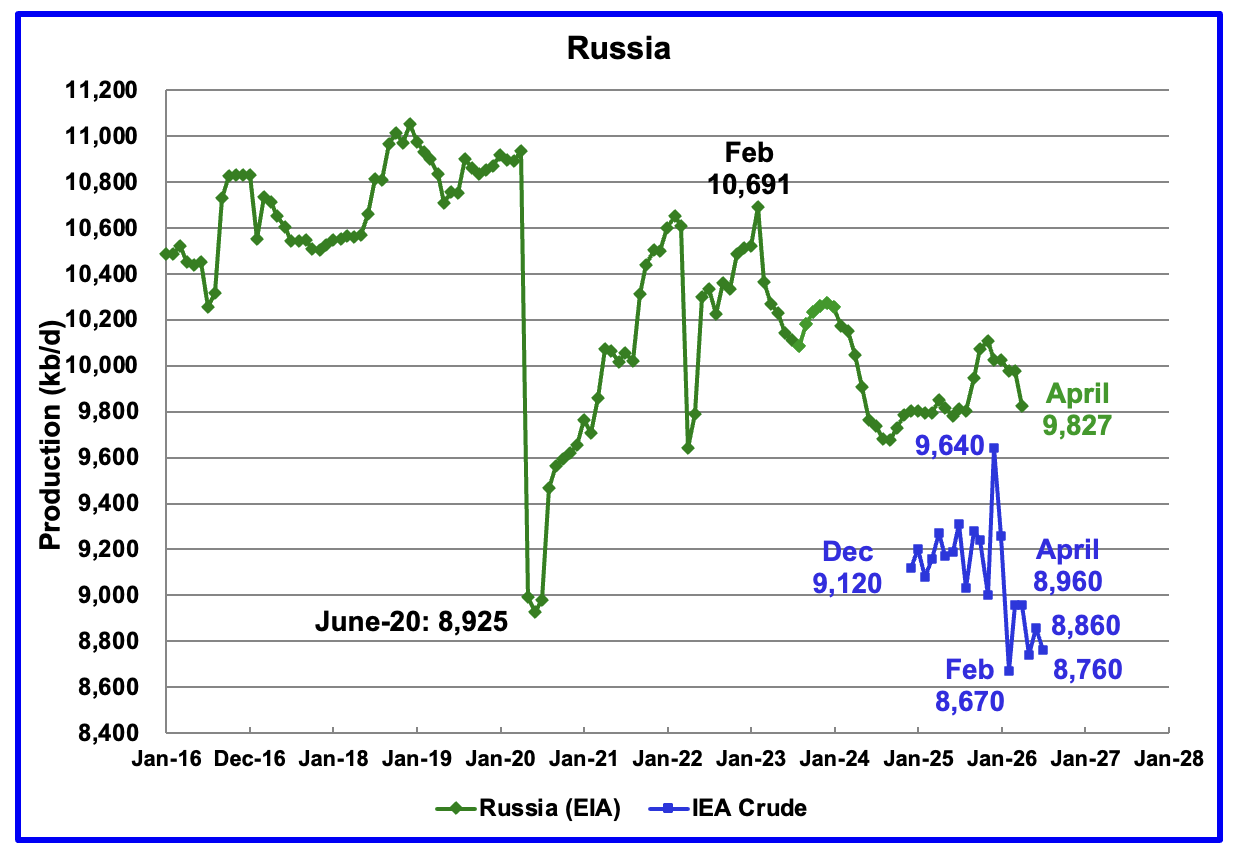
The EIA reported Russia’s April C + C production was 9,827 kb/d and was down by 150 kb/d from March 2026.
The above chart also shows Russian production as reported by the IEA. It is difficult to assess the accuracy of the IEA report since in the past the IEA’s Russian production had been around 100 kb/d to 150 kb/d higher than Argus’ Media. The best that can be done at this time will be to compare the production trends between the EIA and the IEA. I think that Russian oil production continues to be a major state secret at this time because of the damage being caused by the heavy bombing to its related crude oil processing facilities.
The IEA’s August OMR reported that Russia’s July crude production was 8,760 kb/d down by 100 kb/d from June. In both the EIA report and the IEA OMR Russian oil production is in a downtrend probably due to the reported intense bombing of Russian refineries.
The OPEC August MOMR is reporting Russian Crude production in June and July were 8,893 kb/d and 8,887 kb/d, respectively. For July, OPEC’s Russian crude production is 127 kb/d higher than reported in the IEA’s report. Clearly current Russian crude production is down from the December 2025 high of 9,640 kb/d.
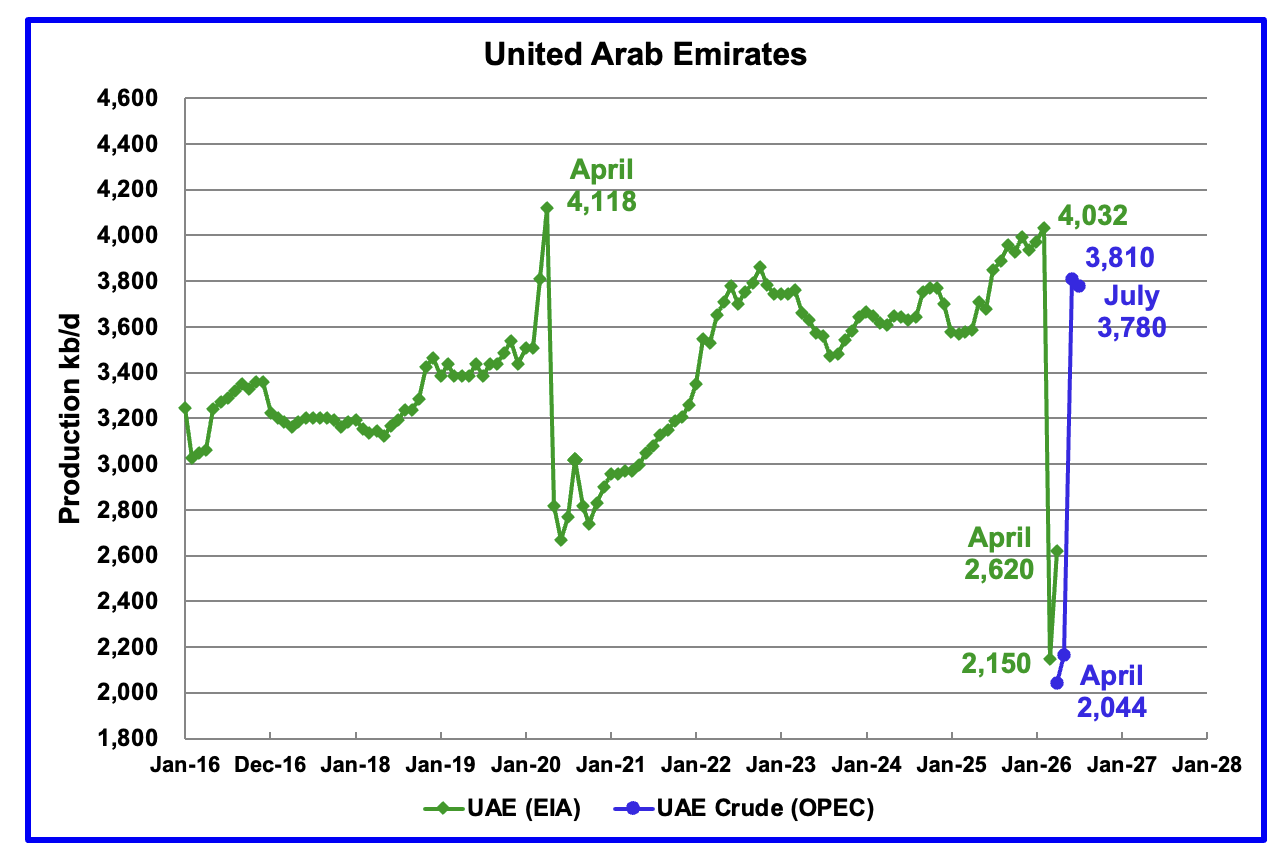
The above UAE chart has been added to the Non-OPEC charts since the UAE has left OPEC. The green graph is C + C production as reported by the EIA. The blue graph is crude production as estimated by OPEC.
The UAE left OPEC because it wanted to produce more oil now. It does raise the question of whether the UAE’s strategic thinkers are looking ahead to when oil demand will begin to fall along with prices and are concerned with being left with Stranded Oil Assets.
For April the EIA is reporting that production was 2,620 kb/d and reported that crude production bottomed in March at 2,150 kb/d. The OPEC August MOMR reported June crude production rebounded to 3,810 kb/d while July dropped slightly.
UAE production is rebounding very quickly. Part of the reason is because the UAE operates an oil pipeline system that connects its onshore oil fields directly to the port of Fujairah on the Gulf of Oman entirely bypassing the Strait of Hormuz. However according to this Article UAE tankers are being attacked while trying to transit the Straits of Hormuz.
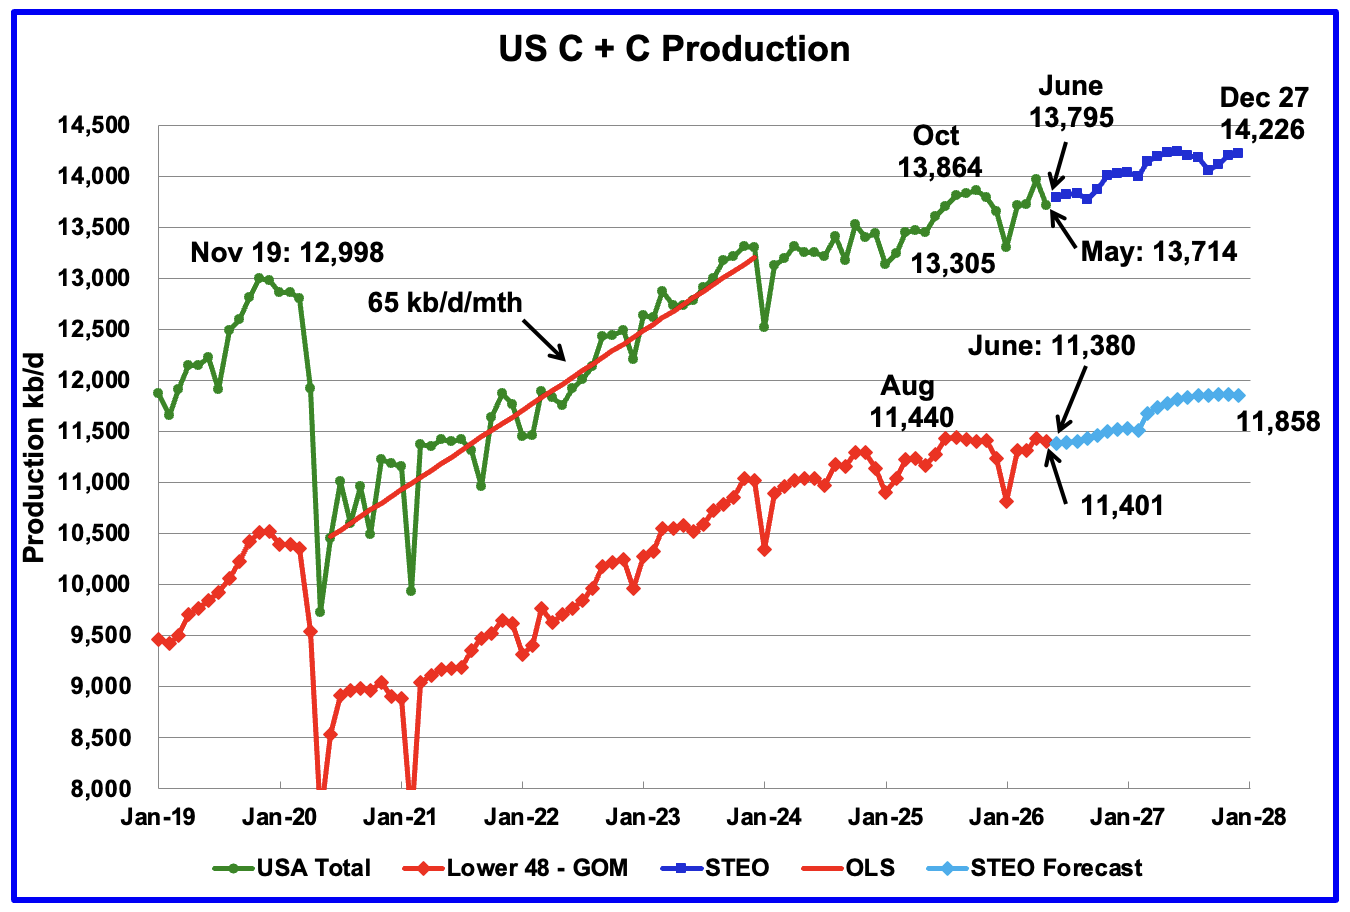
This US production chart showing output up to April 2026 is the same as the one published last week in the US Update. However the August STEO projection has changed, light and dark blue graphs. The December 2027 production has increased by 87 kb/d over the July STEO to 14,226 kb/d. The December 2027 lower 48 – GOM has increased by 77 kb/d to 11,858 kb/d.

Leave a Reply