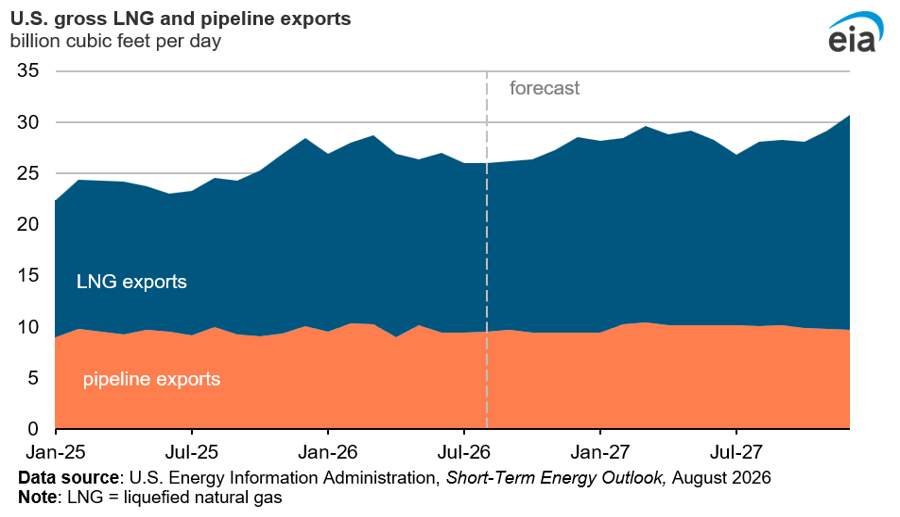
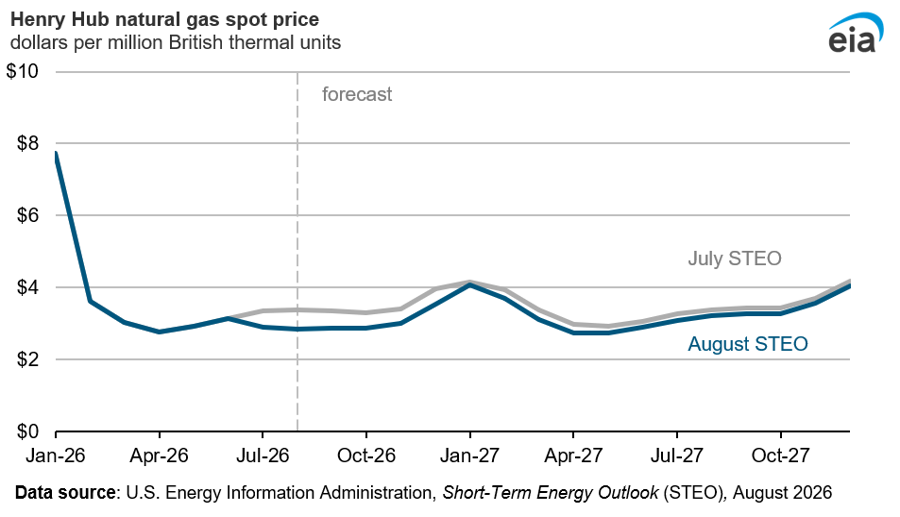
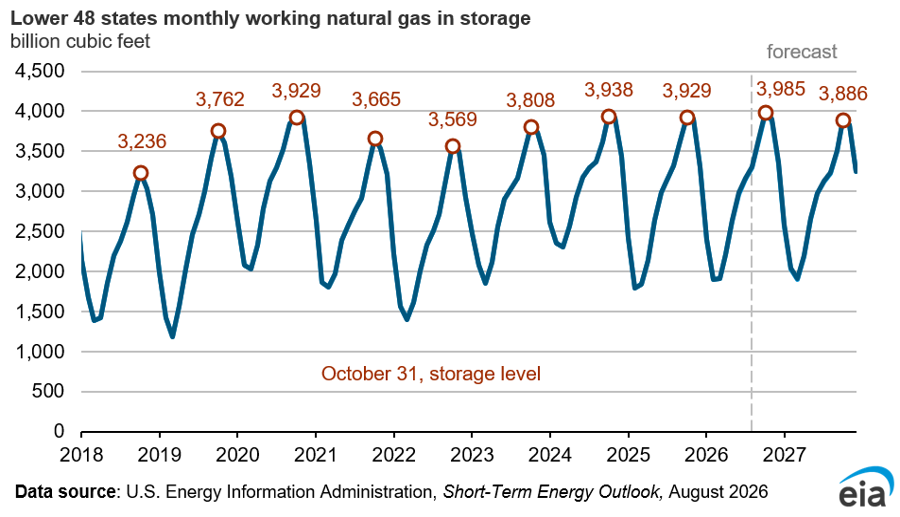
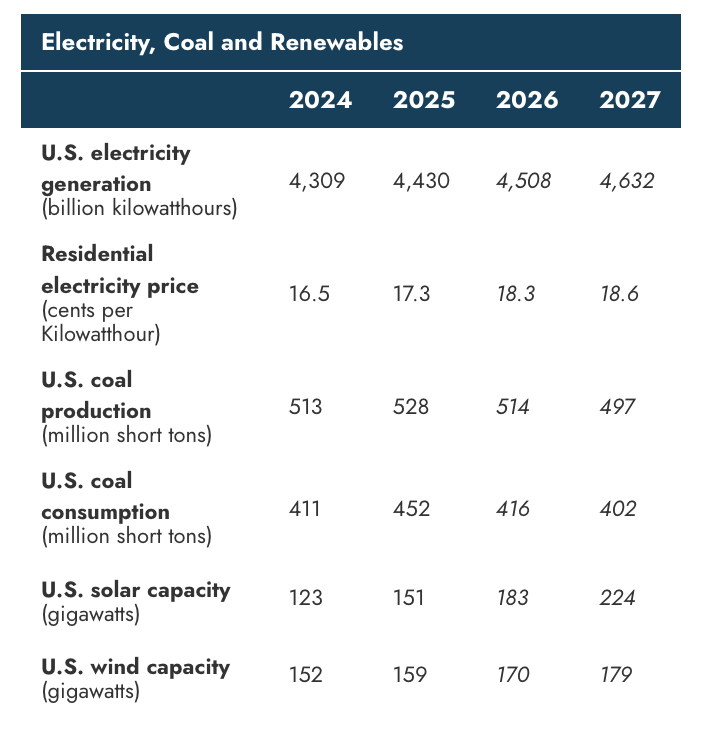
The EIA Short Term Energy Outlook (STEO) was published recently. A summary in chart form.
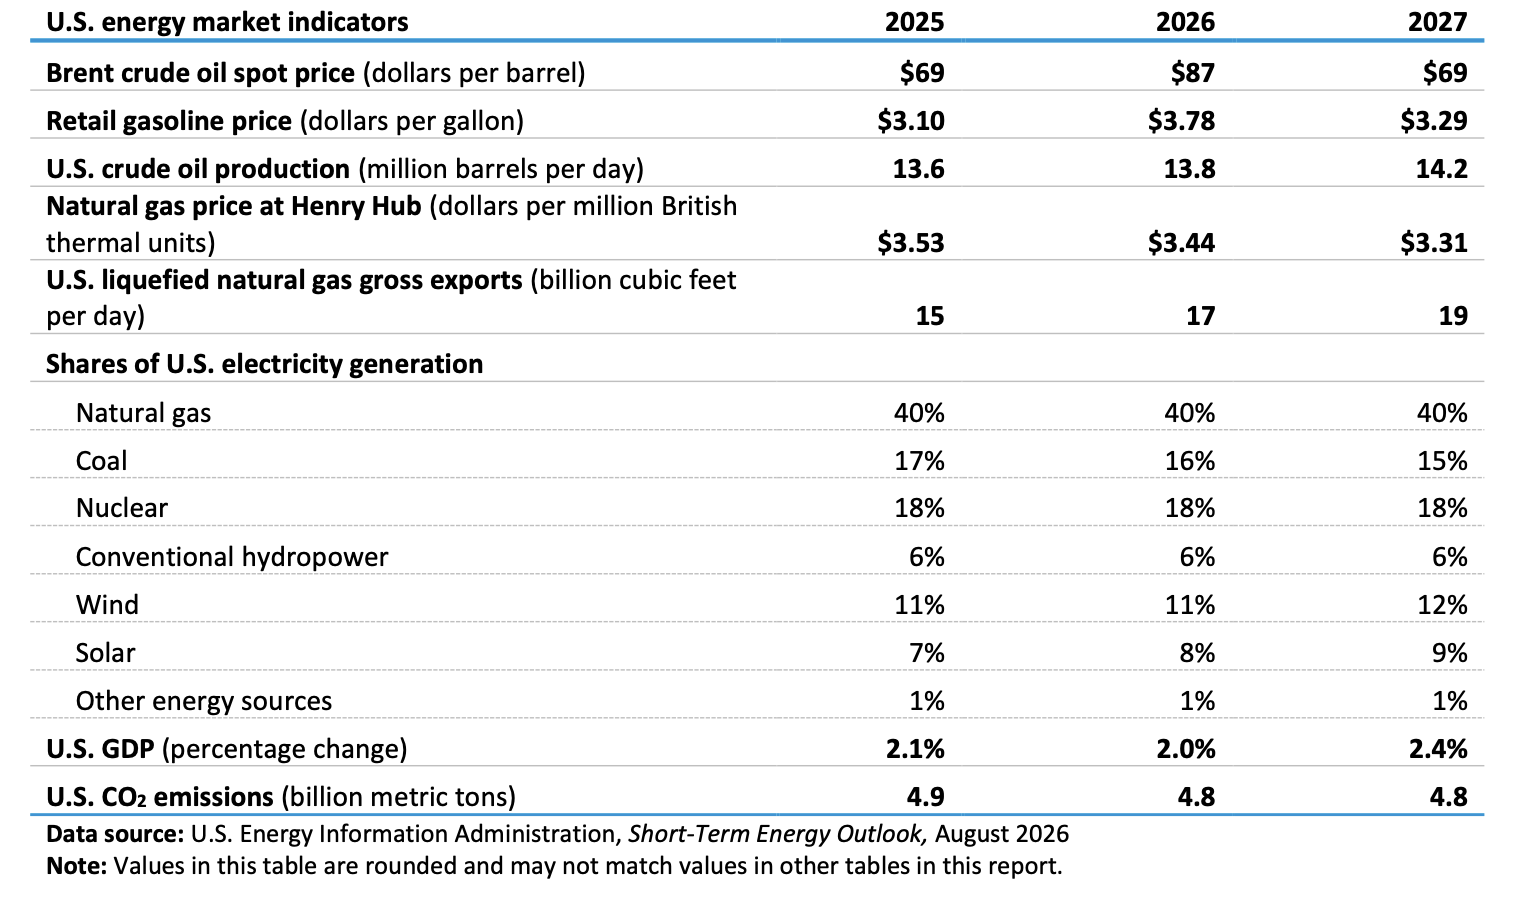
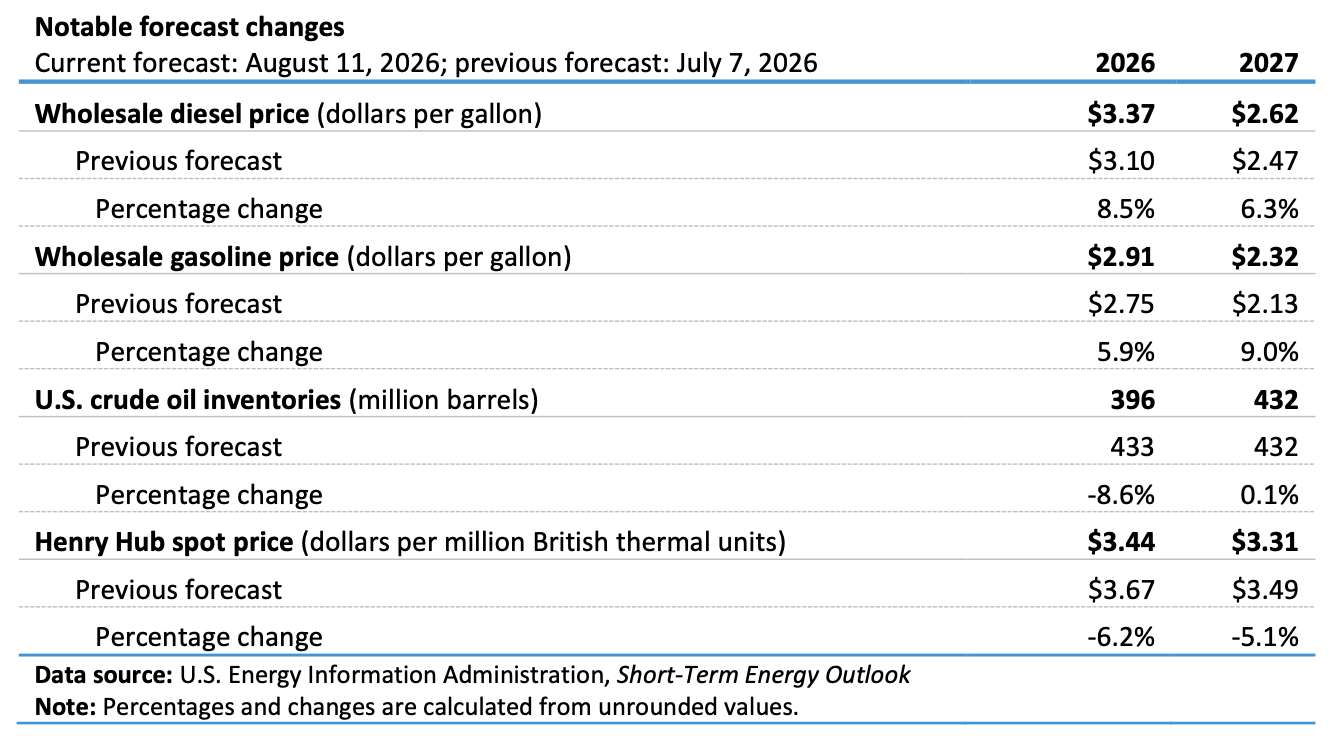
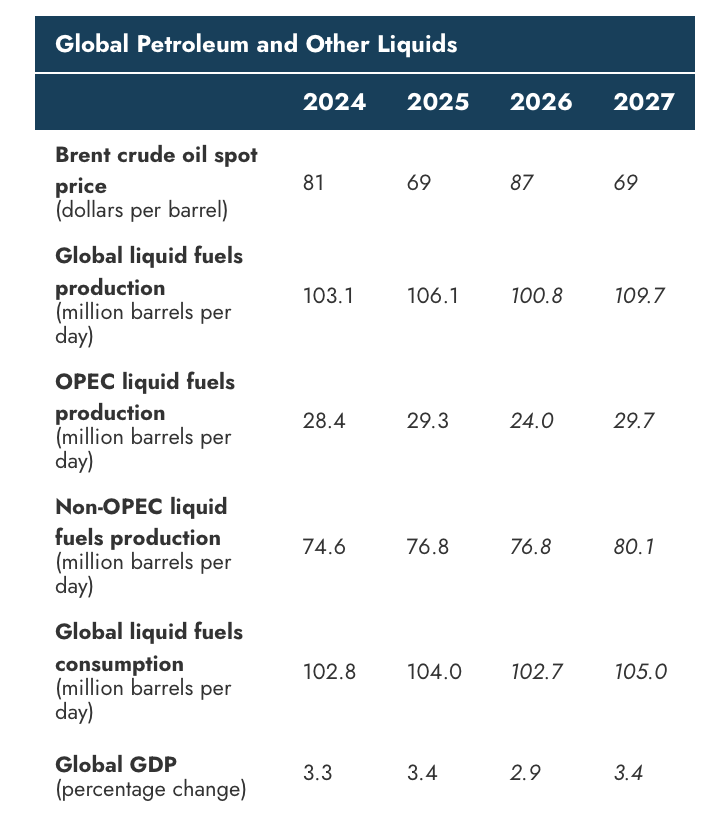
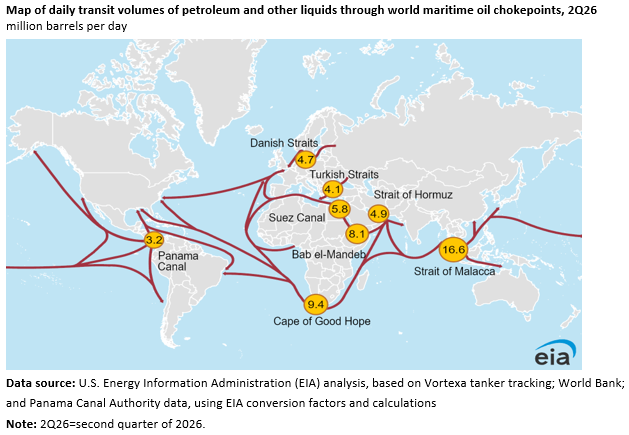
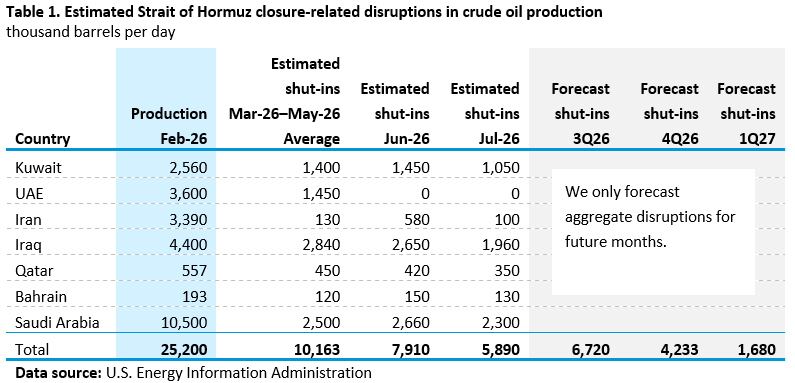
The EIA forecast assumes World output flows return nearly normal (only 1.7 MMb/d of Middle East shut-ins ) by the first quarter of 2027. This assumption is exceedingly optimistic in my opinion.
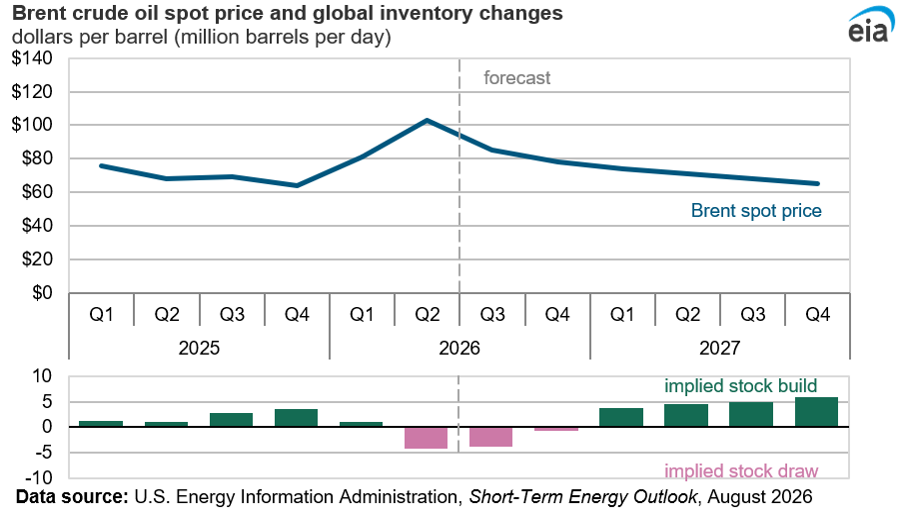
Note the stock build in 2027, not at all realistic.
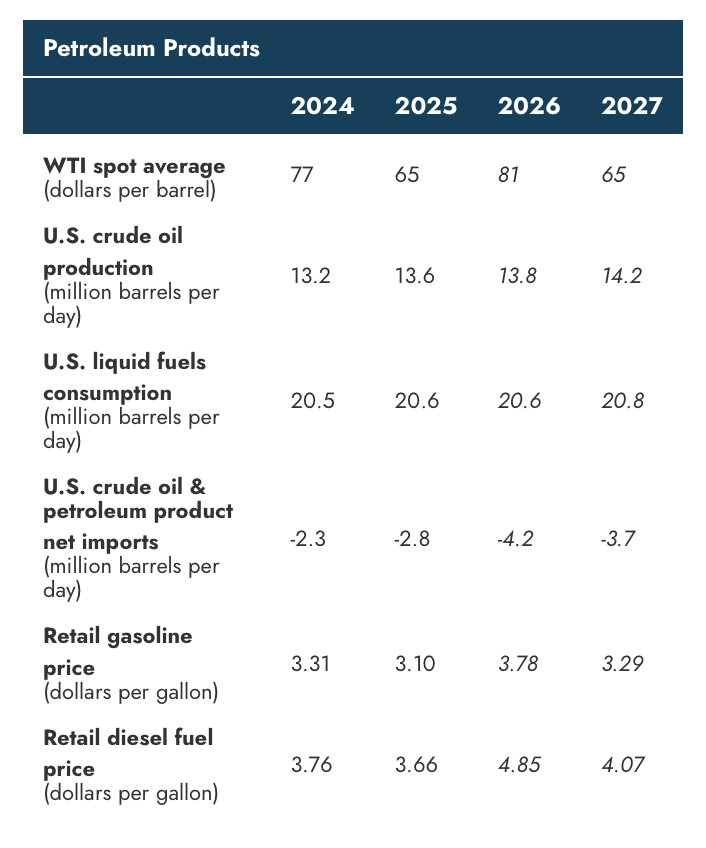
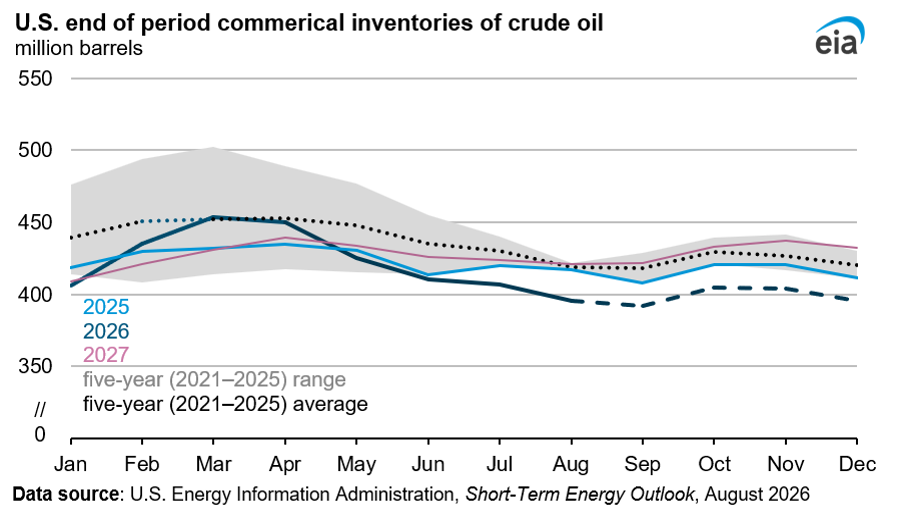
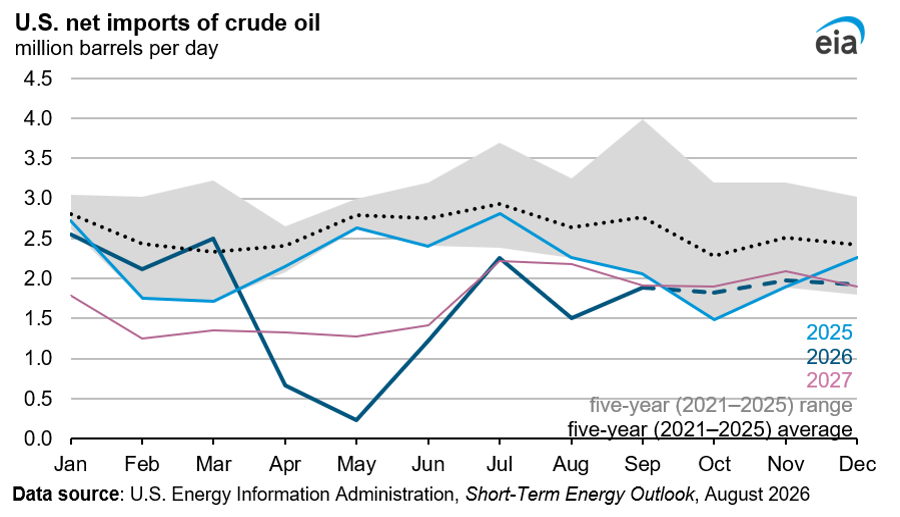
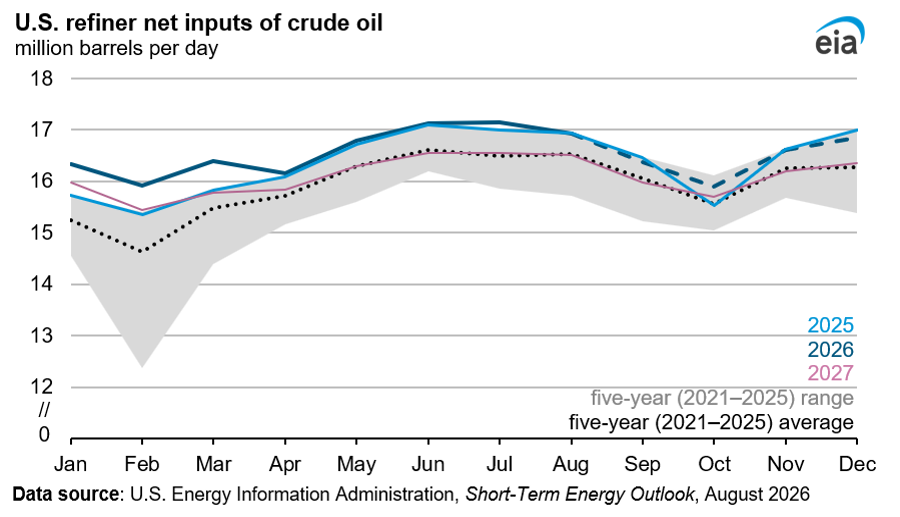
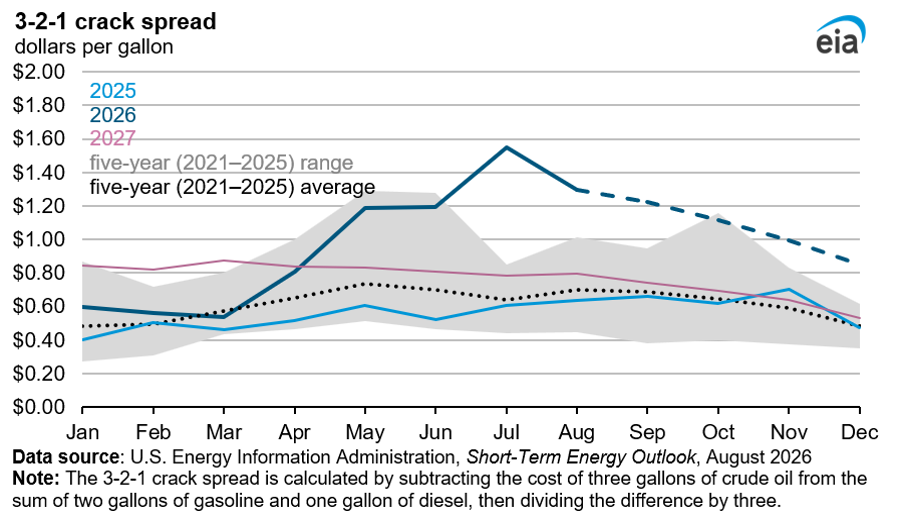
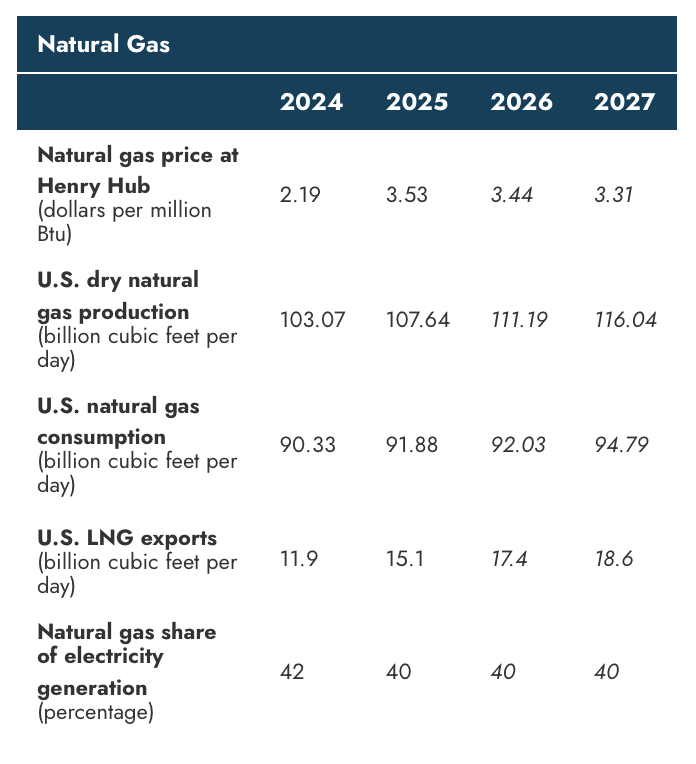
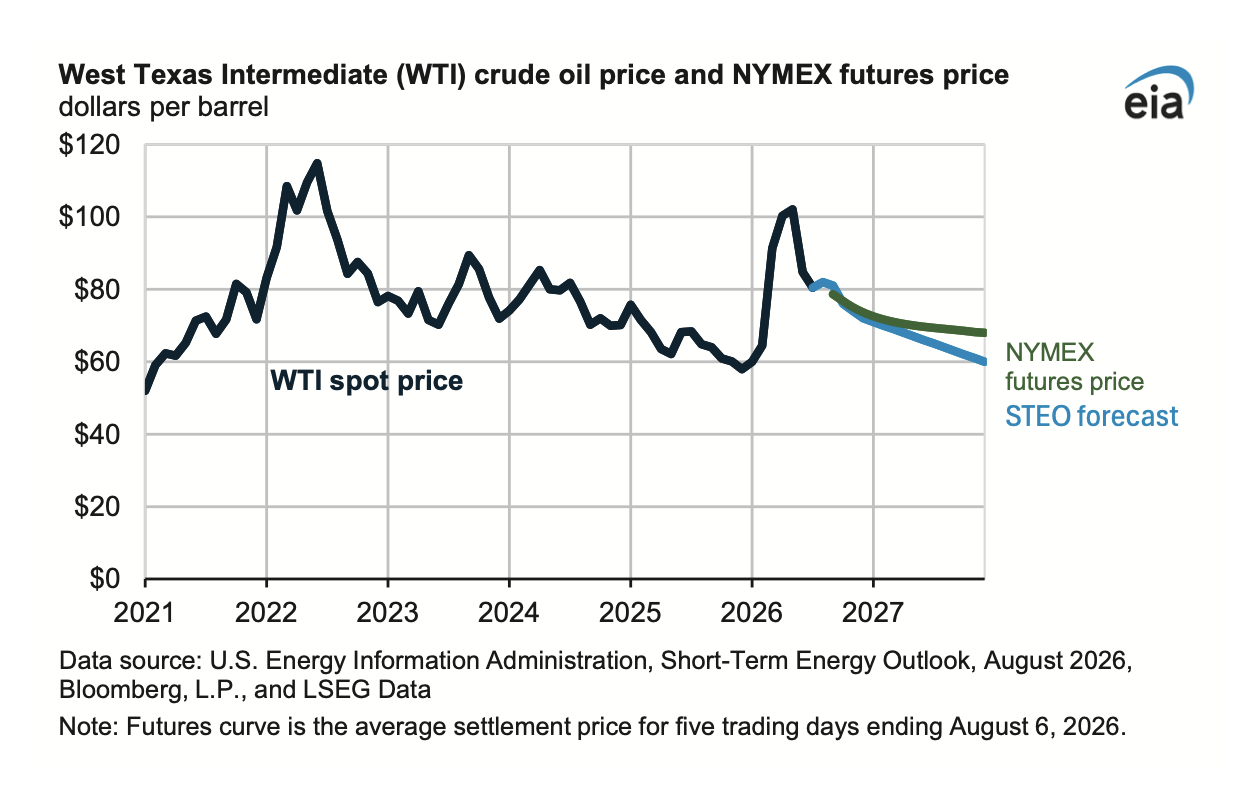
Note the significant difference between the futures market and STEO oil price forecast for WTI. The oil market is likely closer to correct and even that may prove to be too optimistic.
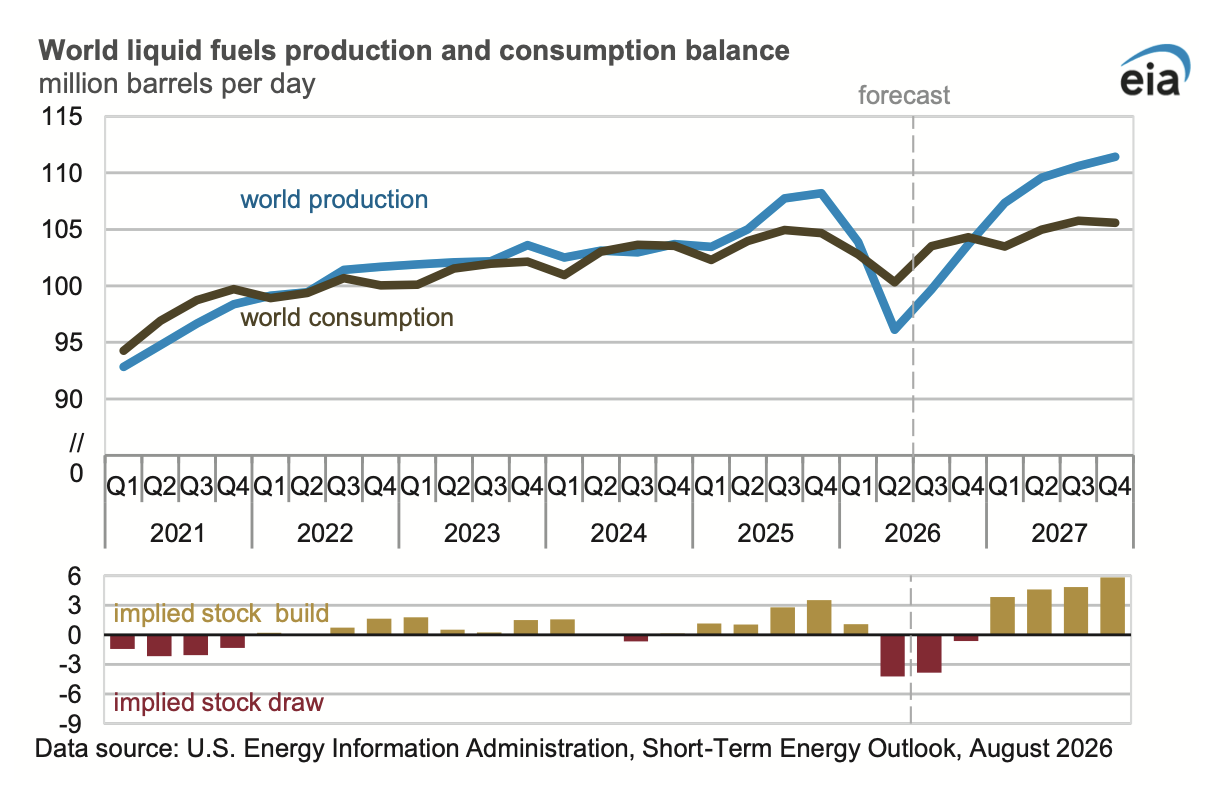
Note the optimistic stock build in 2027, based on a return to normal in the Middle East shipping routes which looks very far from reality.
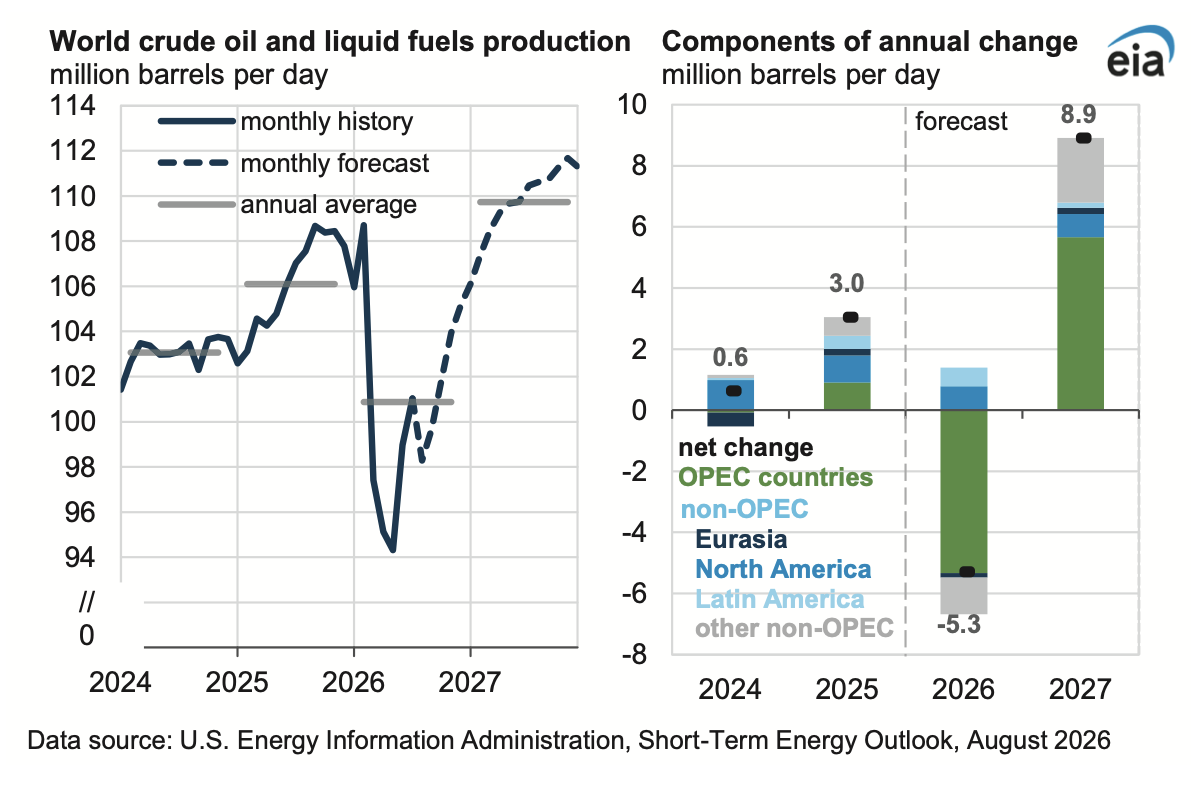
Note the change in OPEC output (in green) from 2026 to 2027, optimistic doesn’t quite cover it.
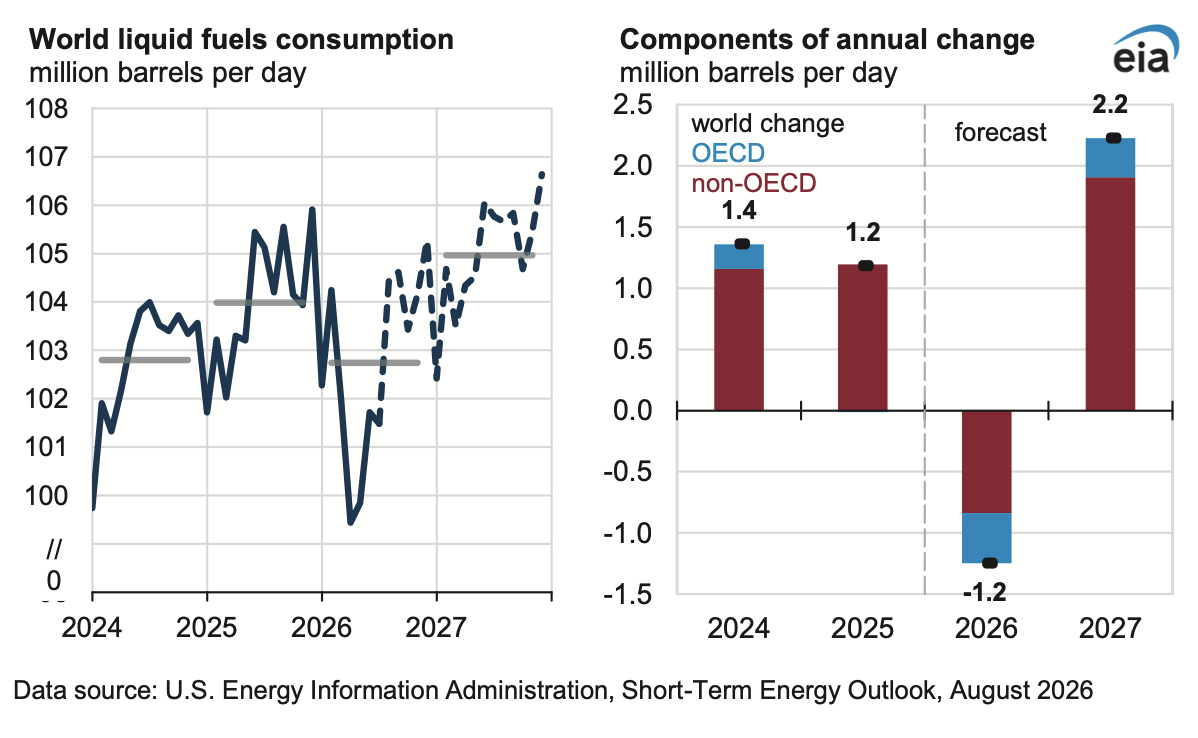
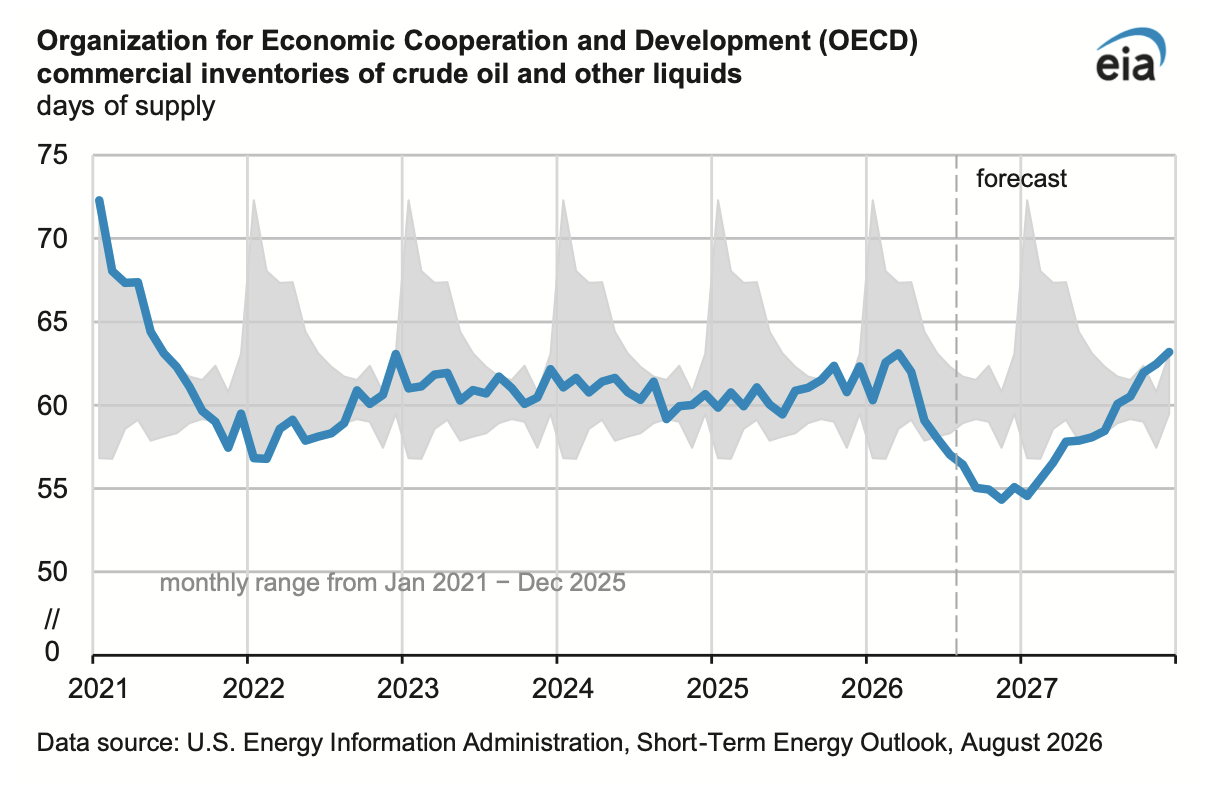
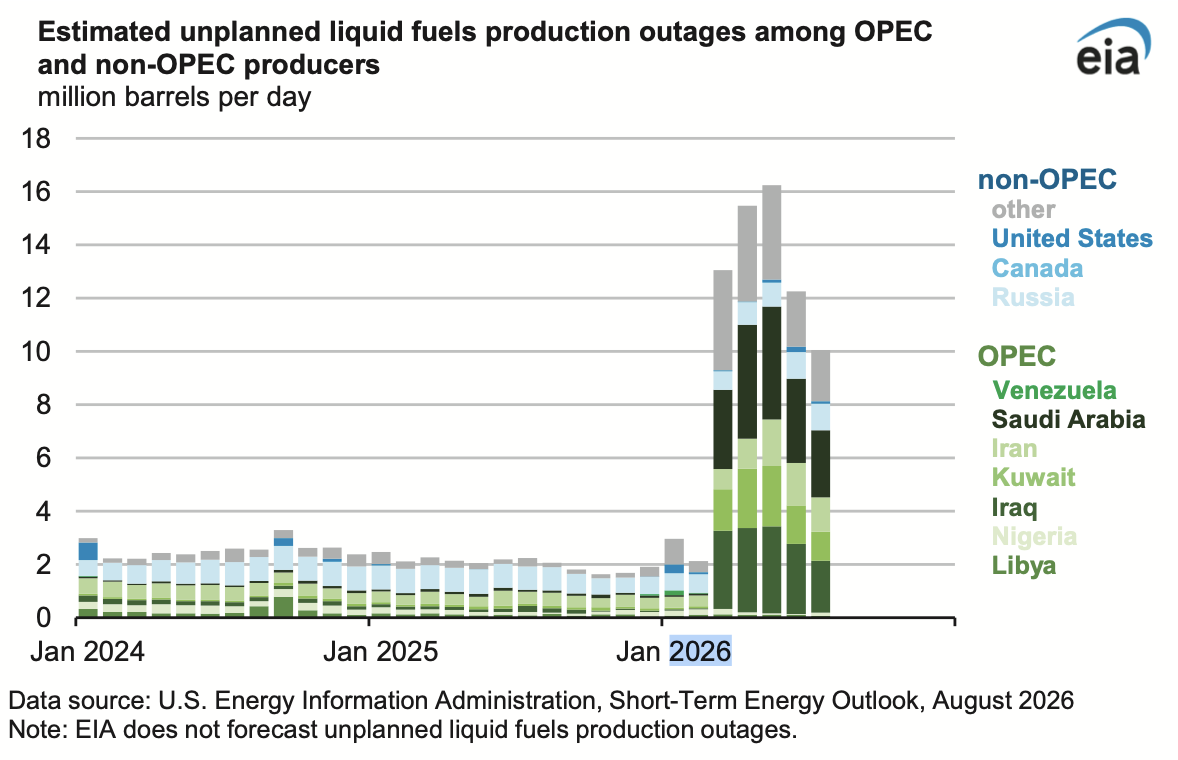
Do these outages remain at 10 MMb/d for the foreseeable future? EIA thinks not, I think 6 to 8 MMb/d until 2029 is not unrealistic given the incompetence in the White House.
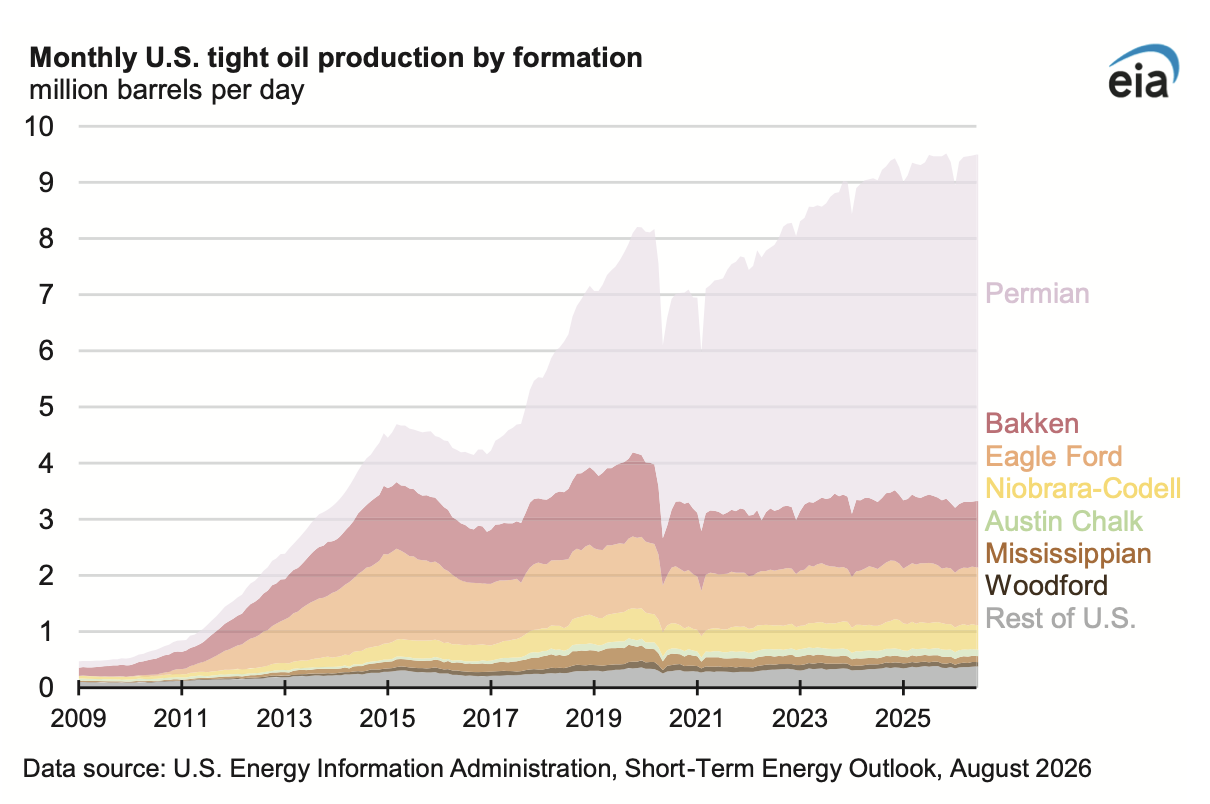
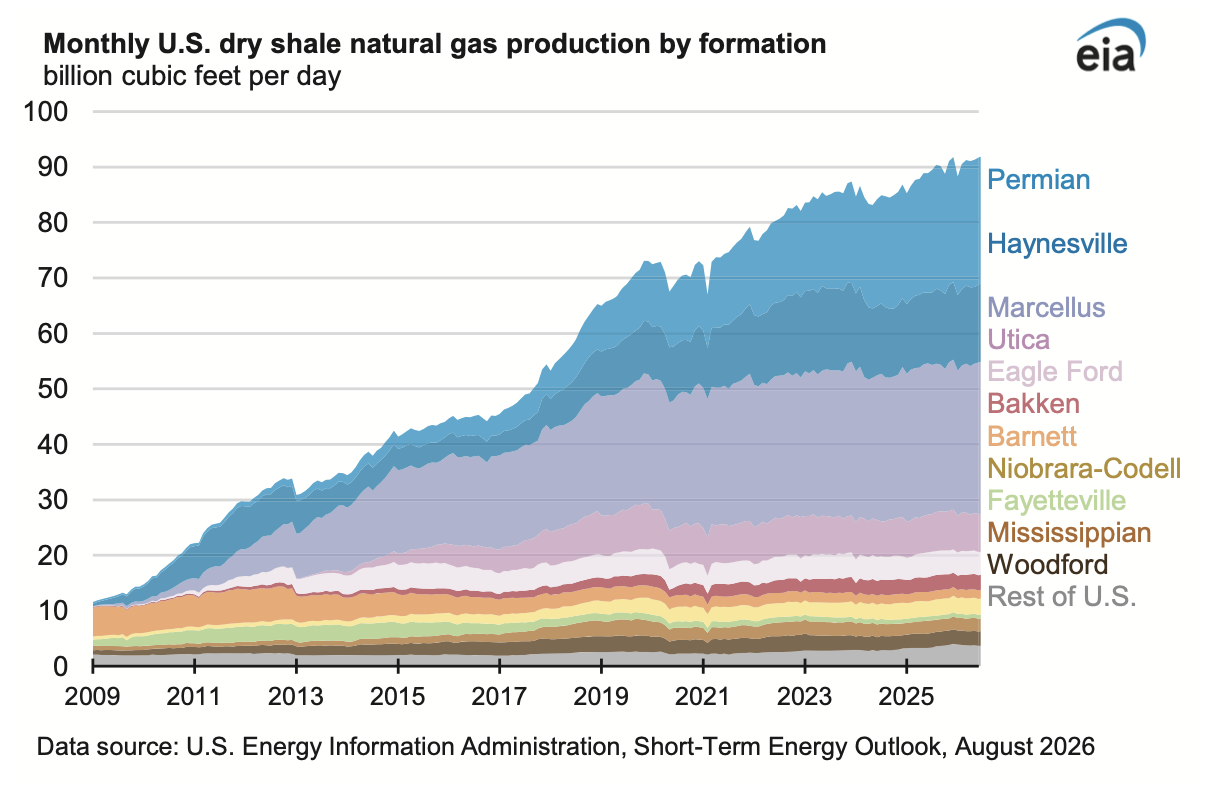
World Natural Gas
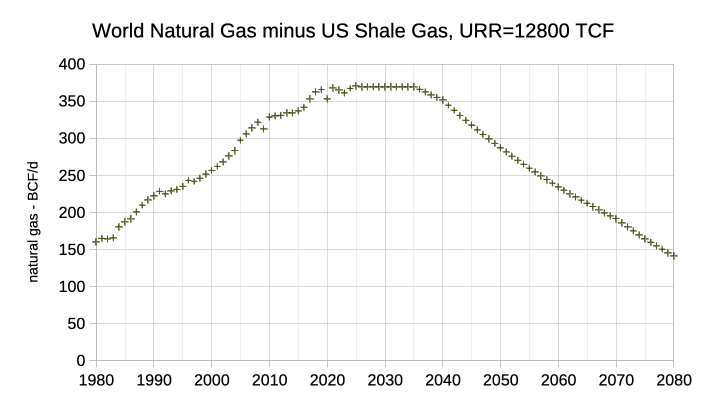
Much of the increase in World Gas output since roughly 2018 has been from increases in US shale gas output. The scenario below looks at World natural Gas minus US shale gas, data from the Energy Institute for World natural gas from 1980 to 2025 and EIA data is used for US shale gas output from 2000-2025. The scenario beyond 2025 is informed by the following Hubbert Linearization for World natural gas minus US shale gas using data from 1998 to 2025, URR is 11500 TCF.
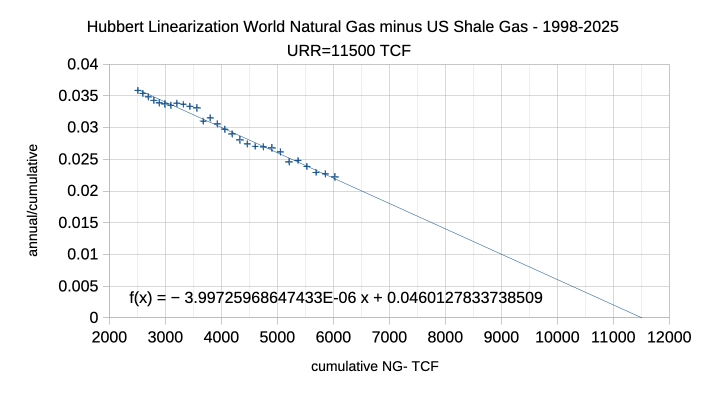
A scenario for World Natural Gas minus US shale gas is presented below, note that this scenario is about 11% higher than the result from the Hubbert Linearization above.
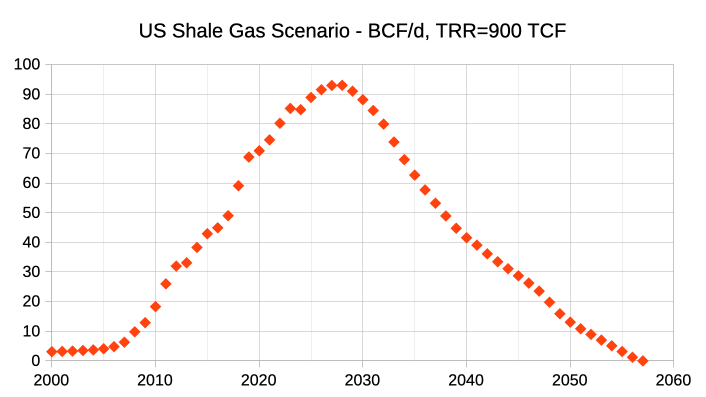
A US shale Gas scenario is presented below.
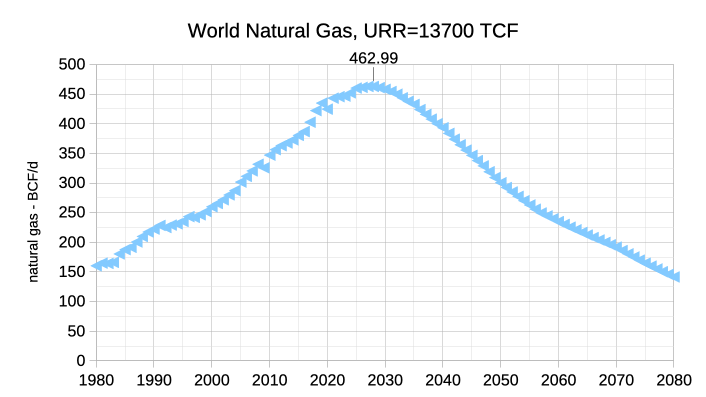
The two scenarios above can be added to arrive at a World Natural Gas Scenario with a URR of about 13700 TCF, this is probably too conservative a scenario, but if correct it suggests a near term peak for World Natural Gas in 2028.
An earlier analysis for World Natural Gas can be found here URR was estimated at 13000 to 26000
TCF with a best guess estimate of 19000 TCF.
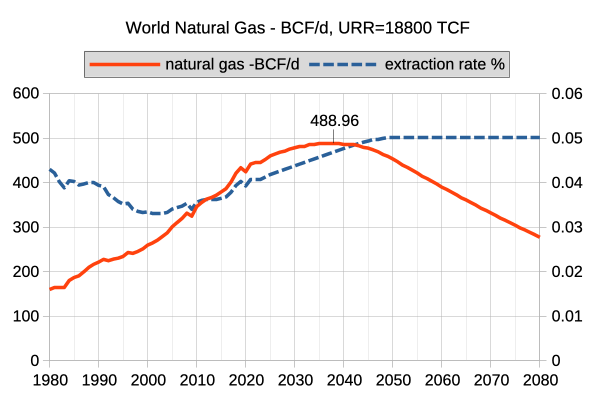
The scenario above is an update to the 19000 TCF scenario from 2015, it roughly matches a Hubbert Linearization for World Natural Gas using 1998 to 2025 data (URR=19500 TCF) which is fairly close to the analysis from 2015. This is the high end expectation for my current analysis.
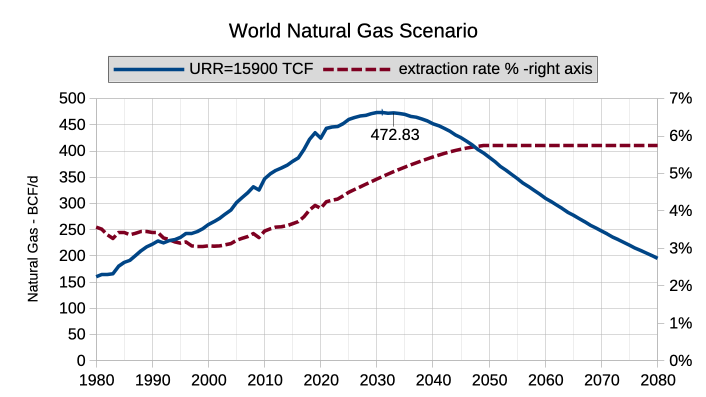
The scenario above for World Natural Gas has a URR of 15900 TCF which is about 27% higher than the Hubbert Linearization for World Natural Gas Gas minus US Shale Gas of 11500 TCF plus a US shale gas URR estimate of 1000 TCF (URR total of 12500 TCF for World Natural Gas). For comparison a similar estimate for World C+C would yield an estimated URR of 2600 Gb compared to my best guess estimate of 2950 Gb (13.5% higher than the HL estimate for conventional oil plus my best guess for unconventional oil).
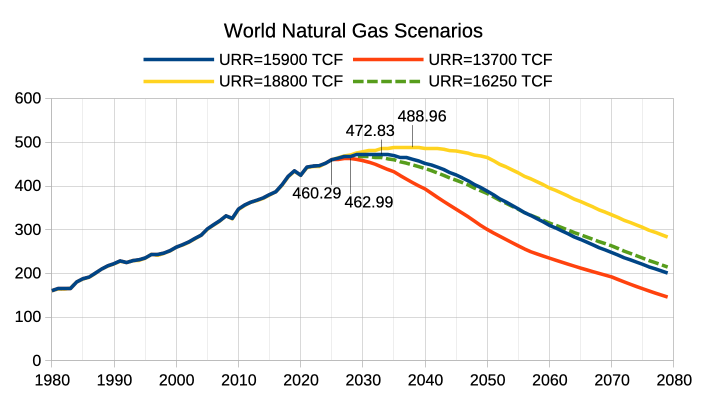
The chart above compares the low, medium and high scenarios with peaks in 2028, 2033, and 2038 and 2025 shown for comparison. The scenario with a URR of 16250 TCF (dashed line) is the average of the high and low scenarios with a peak in 2030 at an output of 468.4 BCF/d.
Leave a Reply