Many different oil shock model scenarios have been presented over time at Peak Oil Barrel. Information on the Oil Shock Model, originally developed by Paul Pukite can be found in Mathematical Geoenergy. The future is unknown, so future extraction rates from conventional (excludes tight oil and extra heavy oil) oil producing reserves are unknown. Also not known are future oil prices which will affect the amount of tight oil and extra heavy oil that is ultimately produced.
For tight oil I have created three scenarios corresponding to a low, medium and high oil price scenario. Likewise I have created three scenarios for extra heavy oil which correspond to the same low to high price scenarios used for the tight oil scenarios.
The mean estimates by the United States Geological Survey (USGS) for technically recoverable resources in tight oil plays combined with reasonable economic assumptions and data gathered from www.shaleprofile.com are used to model tight oil output. The EIA’s AEO 2018 reference oil price scenario is used for the high oil price case and the low scenario uses the AEO reference price case up to the date when it reaches $70/b in 2017$ and assumes oil prices remain at $70/b for all future dates. The medium oil price scenario is the average of the low and high price cases.
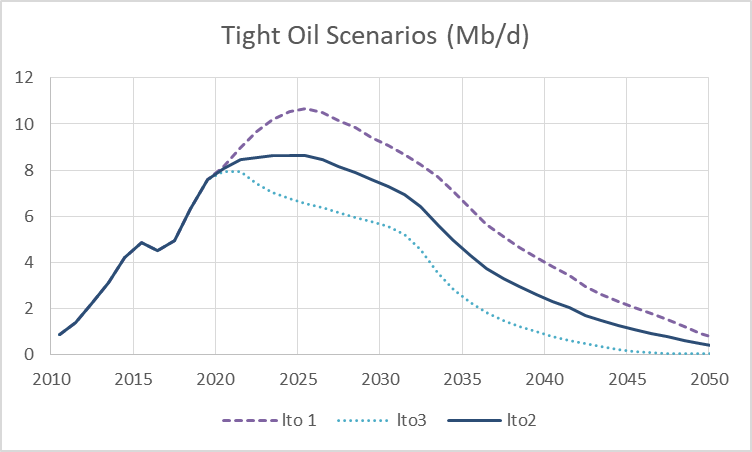
The high tight oil scenario is lto1 and corresponds to the high oil price scenario, likewise lto2 and lto3 are the medium and low tight oil scenarios respectively and correspond to the medium and low oil price scenarios.
For oil sands I use an oil shock model with 500 Gb of resources discovered initially and it is assumed that development of the resource is very slow with an average time from discovery to a barrel becoming part of producing reserves set at 100 years with a maximum entropy probability distribution used for the statistical spread in the years from discovery to mature producing reserve. The year for the start of the producing reserves being developed is set to 1960 with output starting in 1967, extra heavy oil production data was gathered from papers published by Jean Laherrere for Venezuela and from the Canadian Association of Oil Producers (CAPP) for Canada.
Jean Laherrere for many years used a 500 Gb estimate for extra heavy oil URR, this was recently revised to 215 Gb. I have used 200 Gb for the low estimate, 500 Gb for the high estimate, and 350 Gb for the medium tight oil estimate. Forecasts by CAPP were used as the basis for future Canadian oil sands output through 2035, Venezuelan output is assumed to grow very slowly until 2030 and then roughly follow the path of Canadian oil sands output from about 1000 kb/d to 4000 kb/d over 30 years. It is assumed that Canadian Oil sands output flattens after 2040 and declines after 2050, Venezuela’s output mimics the Canadian output path with a delay of 25 years (peak in 2065 and decline in 2075). The low , medium and high scenarios are created by using low, medium and high extraction rate scenarios where it is assumed that low oil prices result in lower extraction rates and high oil prices result in higher extraction rates due to increased profits.
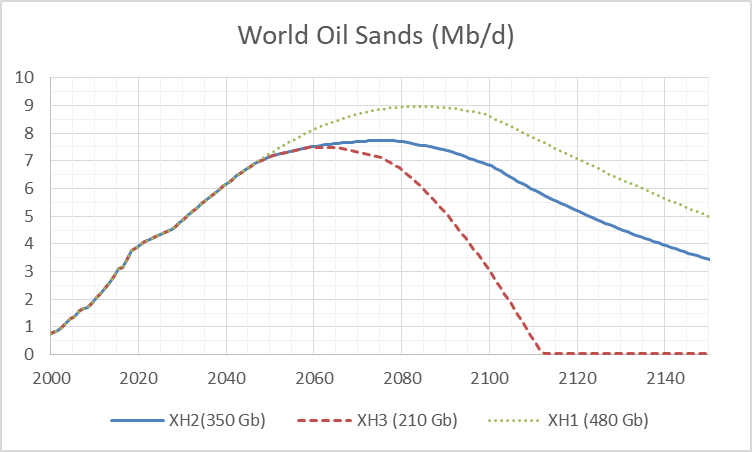
XH1 is the high oil sands scenario, XH2 is the medium scenario, and XH3 is the low scenario. The scenarios have URRs of 210 Gb, 350 Gb, and 480 Gb for the low, medium and high scenarios respectively.
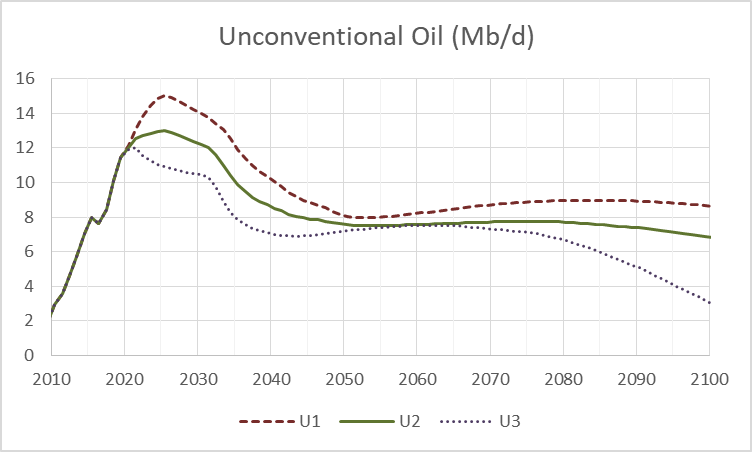
The tight oil and oil sands scenarios are combined into 3 unconventional oil scenarios where
U1=lto1+XH1 = high unconventional oil scenario
U2=lto2+XH2 = medium unconventional oil scenario
U3=lto3+XH3 = low unconventional oil scenario
I define conventional oil as all crude plus condensate (C+C) that is not tight oil or extra heavy oil (API gravity of 10 degrees or less). For my low estimate of conventional resources I use a Hubbert Linearization which results in about 2500 Gb for conventional URR. The USGS estimated about 3000 Gb of conventional oil resources in 2000, I add 100 Gb to this estimate for 3100 Gb for my high conventional oil resource estimate and my medium estimate is 2800 Gb for conventional oil resources.
Using these resource estimates and backdated oil discovery data, a dispersive discovery model can be fit to discovery data, with cumulative discovery modelled to match the low, medium, and high oil resource estimate. An oil shock model can be applied to the discovery model and production data to estimate past extraction rates that correspond with discovery and output data. Future output will depend on future extraction rates from proved producing reserves which are generated by the model assuming stochastic behavior following a maximum entropy probability distribution for the development rate of oil resources. Future extraction rates might increase, decrease, or remain constant. Past behavior shows an increase in extraction rates from 1960 to 1973, a sharp drop from 1979 to 1984 and then a gradual drop from 1985 to 2007, extraction rates have been flat to slowly rising from about 2013 to 2018, but we can only guess at future extraction rates. A conservative guess would assume the extraction rates will remain at 2018 average rates going forward.
The models presented below will use the following convention for labels C1, C2, and C3 denote the high, medium, and low Conventional (C) oil scenarios respectively. Likewise E1, E2, and E3 will denote a high, medium, and low extraction rate scenario respectively, where E1 has extraction rates increasing until a peak in output is reached and then remaining flat after the peak, E2 has constant extraction rates, and E3 has extraction rates decreasing to nearly zero over time. The rate of increase or decrease is matched with the model’s rate of decrease in extraction rate over the 1985 to 2007 period with the extraction rate being gradually increased (or decreased) to this rate (the absolute value of that rate) and then gradually flattened towards a zero rate of change over time.
A model denoted C2E2U2 would suggest URR for conventional resources is 2800 Gb (medium scenario), constant rate of extraction from producing reserves (E2) and a medium URR for unconventional resources (U2) of about 450 Gb from 1967 to 2300.
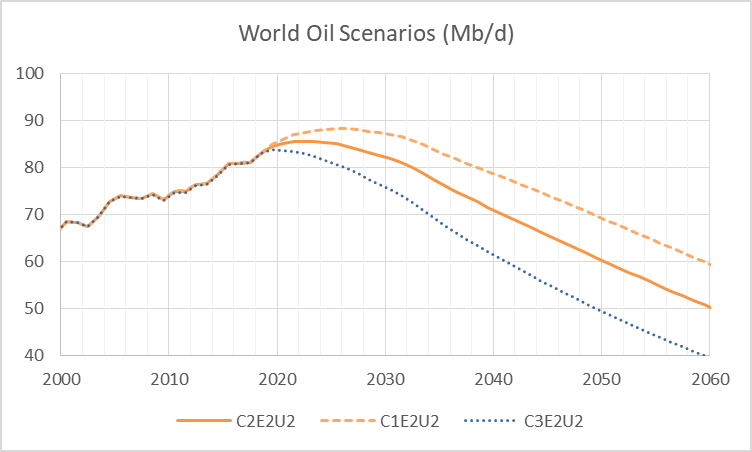
Below I present 3 models, C1E2U2, C2E2U2, and C3E2U2, the only change being the conventional URR in each of the models with URRs (for C+C) of 3500 Gb, 3200 Gb and 2900 Gb respectively. The high model peaks is 2025 at 88.2 Mb/d, the medium model peaks in 2022 at 85.4 Mb/d, and the low model peaks in 2019 at 83.7 Mb/d with the constant extraction rate assumption.
As an example of how changes in extraction rate can change the output path we will focus on the medium (C2) model with medium unconventional resources (U2) with all three extraction rate scenarios (E1, E2, and E3).
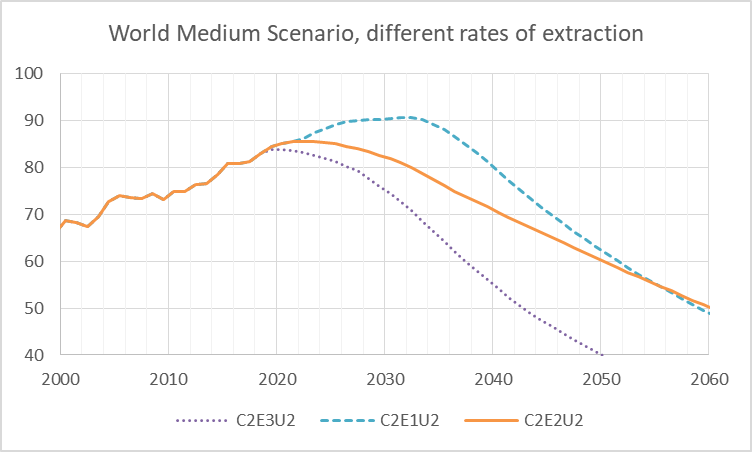
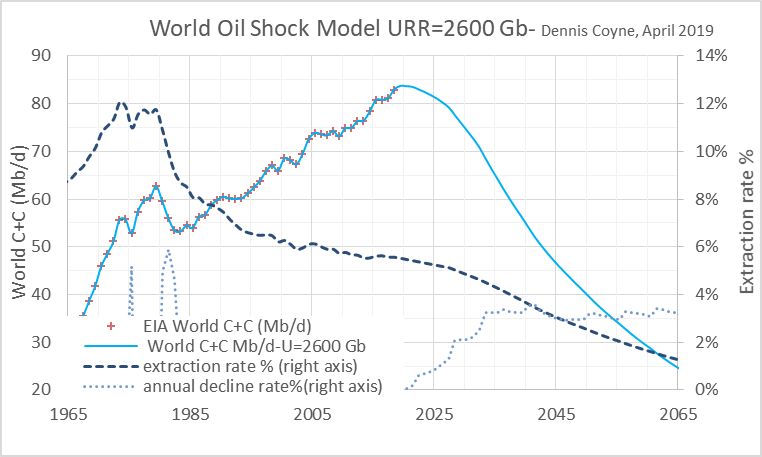
The low extraction scenario (C2E3U2) has lower a lower URR of 2600 Gb than the medium and high extraction rate scenarios (URR=3200 Gb). The medium scenario is unchanged from the previous chart, the peak of the low scenario is in 2019 at 83.1 Mb/d and the high extraction rate scenario peaks in 2032 at 90.6 Mb/d.
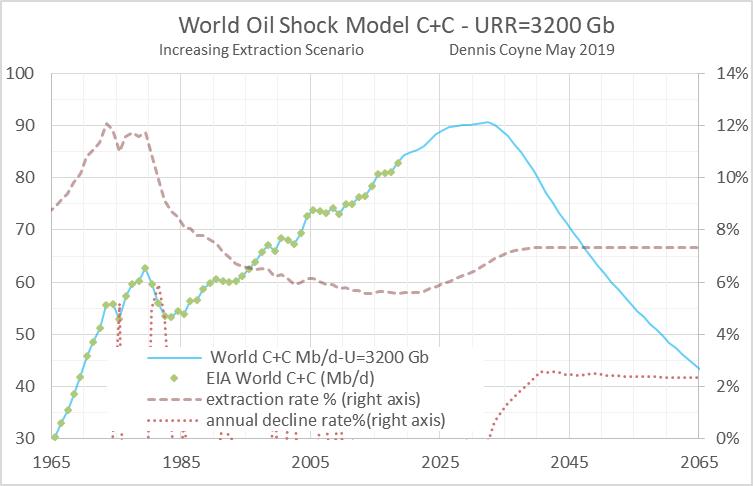
High extraction rate scenario with extraction rate on right axis, the low extraction rate scenario is below.
We often make much of tight oil and oil sands output, but as we show below, they have only a small effect on the peak. We choose the C2E2 model and vary the unconventional scenario from U1 to U3, so we have C2E2U1, C2E2U2 (presented in several charts already), and C2E2U3 in the chart that follows.
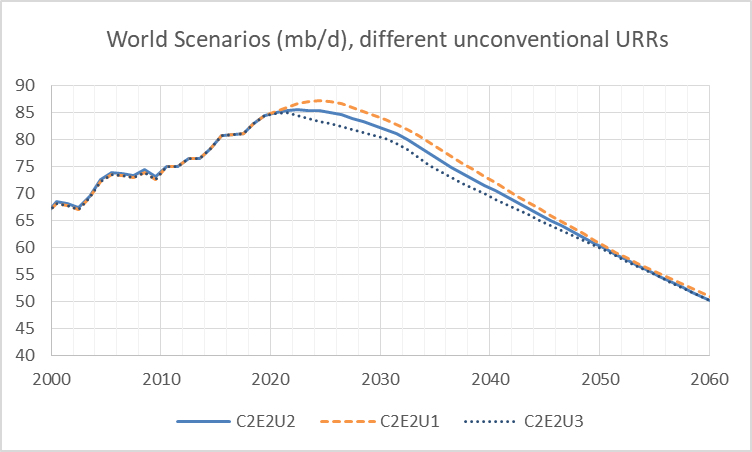
The C2E2U2 Scenario peaks in 2022 at 85.4 Mb/d, the C2E2U3 scenario peaks in 2021 at 84.9 Mb/d and the C2E2U1 scenario peaks in 2024 at 87.1 Mb/d, the URRs vary from 3060 Gb to 3600 Gb, but the output from 2019 to 2060 is affected very little from this difference.
The combination of C1, C2, and C3, with E1, E2, and E3, and with U1, U2, and U3 allows 27 different scenarios to be created.
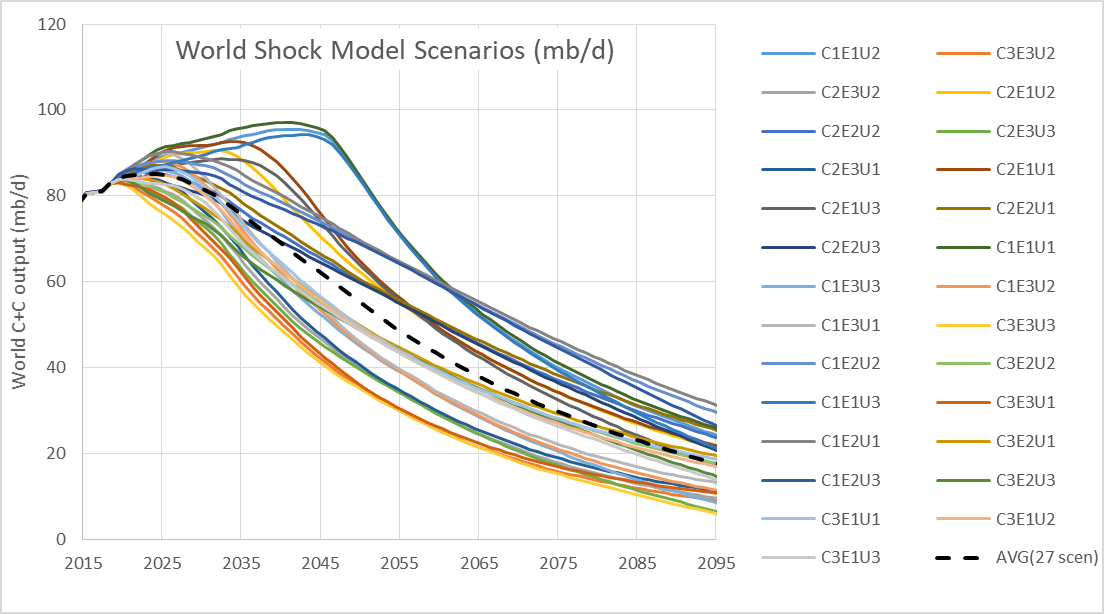
I realize this chart is not very readable, the point is to show the spread of the various possible models, there is fairly dense coverage of the envelope from 2019 to 2040. Note the dashed black line which is the average of all 27 scenarios. The ensemble average has a URR of 3000 Gb and peaks in 2023 at 85 Mb/d, the average scenario has a plateau between 84 and 85 Mb/d from 2019 to 2026.
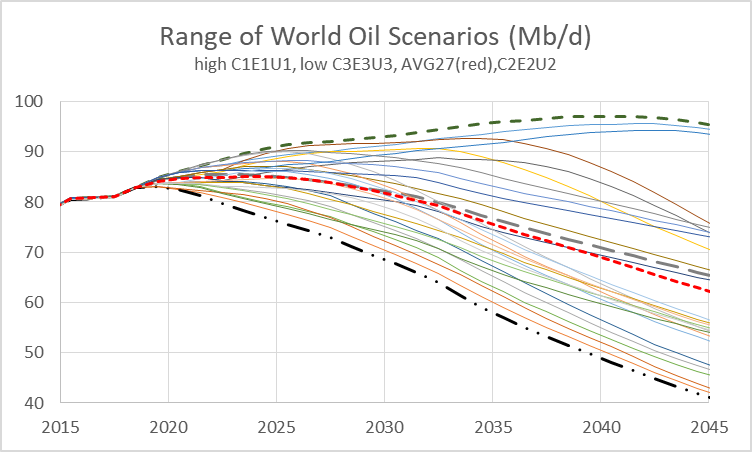
Chart above shows the range of the scenarios with the dashed lines called out in the title. The high black dashed line is scenario C1E1U1 and the low dash and two dot line is C3E3U3, the middle dashed gray line is the C2E2U2 medium scenario and the red dashed line is the 27 scenario average.
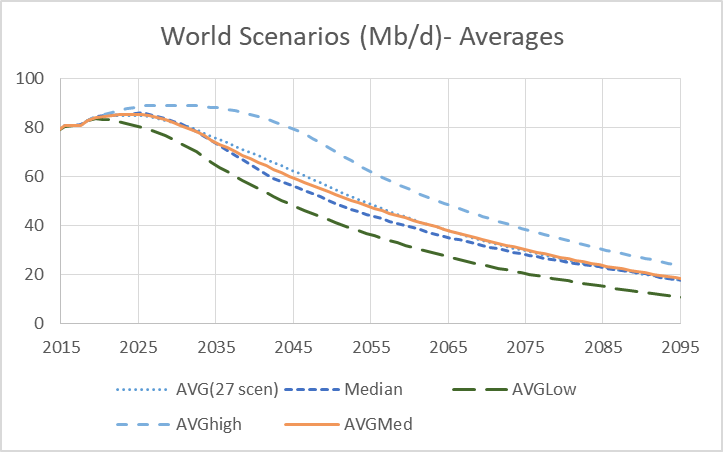
The chart below takes the scenarios sorted from high URR to low URR (through 2200) and then finds the average of the highest 9 scenarios (AVG high), the average of the middle 9 scenarios (AVG med), and the average of the lowest URR scenarios (AVG low).
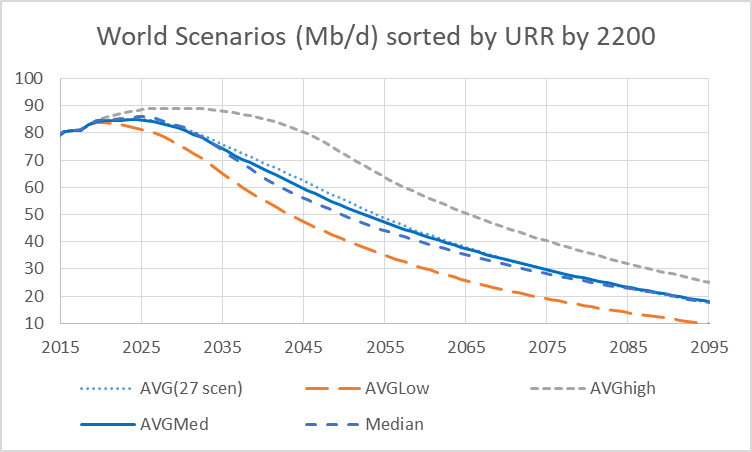
The median scenario takes the median of all 27 scenarios at each individual year, it has a URR through 2200 of 2900 Gb, peak output of 86 Mb/d and peaks in 2025, the 27 scenario average has a URR of 3000 Gb, peak output of 85 Mb/d in 2023. For the AVG Med 9 scenarios URR is 3000 Gb, with peak output of 85 Mb/d in 2024. The AVG High 9 scenarios URR is 3400 Gb with peak output of 89 Mb/d in 2028. The AVG Low 9 scenarios URR is 2600 Gb with peak output of 84 Mb/d in 2019.
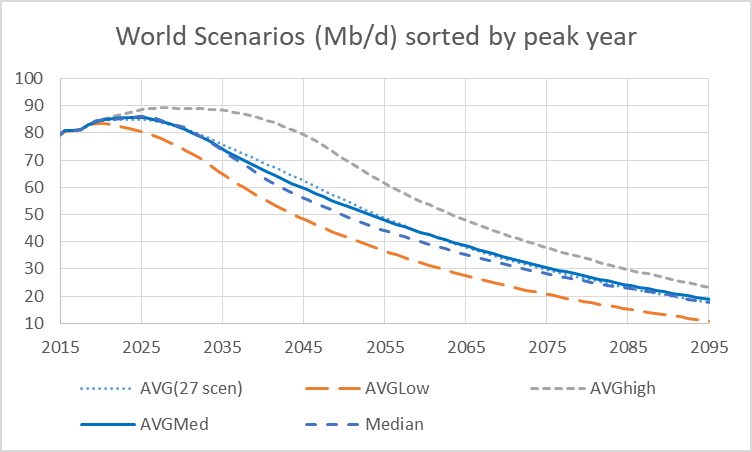
The next chart sorts scenarios by peak output and then groups by top, middle and low 9 scenarios based on peak output.

For AVG Med URR is 3000 Gb with peak output of 86 Mb/d in 2024, AVG High URR is 3300 Gb with peak output of 89.5 Mb/d in 2028, and AVG Low URR is 2700 Gb with peak output of 83.5 Mb/d in 2019.
Chart below sorts scenarios by peak year and splits scenarios in 3 groups of 9 from latest to earliest peak year.
For AVG Med URR is 3000 Gb with peak output of 86 Mb/d in 2023, AVG High URR is 3300 Gb with peak output of 89 Mb/d in 2028, and AVG Low URR is 2700 Gb with peak output of 84 Mb/d in 2019.
As it is not clear which sorting method gives the greatest insight, the chart below takes the average of the 3 methods where AVG Low takes the average of the 3 AVG Low scenarios in the 3 previous charts, the same is done to find an AVG Med and AVG High scenario. The envelope between the AVG low and AVG High scenarios might represent about a 66% probability that World output will fall within that envelope, with perhaps a 17% probability that output might be either above or below the envelope.
The AVGMed scenario URR is 3000 Gb with peak output of 85.4 Mb/d in 2023, AVGHigh URR is 3400 Gb with peak output of 89.2 Mb/d in 2028, and AVGLow URR is 2600 Gb with peak output of 83.6 Mb/d in 2019.
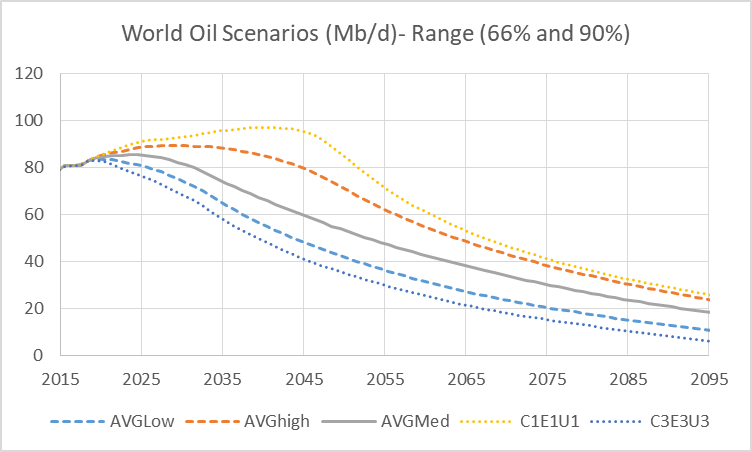
The dotted lines are the highest and lowest of the 27 scenarios presented and might represent a 90% confidence interval, so perhaps a 5% probability that output might be higher than the yellow dotted line and about a 5% probability it might be lower than the blue dotted line. The dashed lines may represent a 66% confidence interval with the gray solid line roughly representing the 50/50 line where there is an equal probability output might be above or below that line.
Note that these are subjective probabilities as we have no statistical data on future output. I have simply assumed in the absence of any knowledge of the future that each of the 27 scenarios presented is equally likely. In reality the lowest and highest scenarios are probably less likely than the medium scenarios so this is a conservative assumption.
My best guess for future World oil output in the absence of a major economic crisis in response to peak oil has extraction rates gradually rising from 2025 to 2045, remaining flat until 2050 and then decreasing at a gradually increasing rate. The extra heavy oil scenario that I believe is most likely is 210 Gb with a tight oil scenario of about 85 Gb (these correspond with the XH3 and lto1 scenarios presented earlier.) Conventional oil with the extraction rate scenario I believe most likely has a URR of 2700 Gb, with the World C+C scenario having a URR of 2985 Gb through 2200. Scenario presented in chart below.
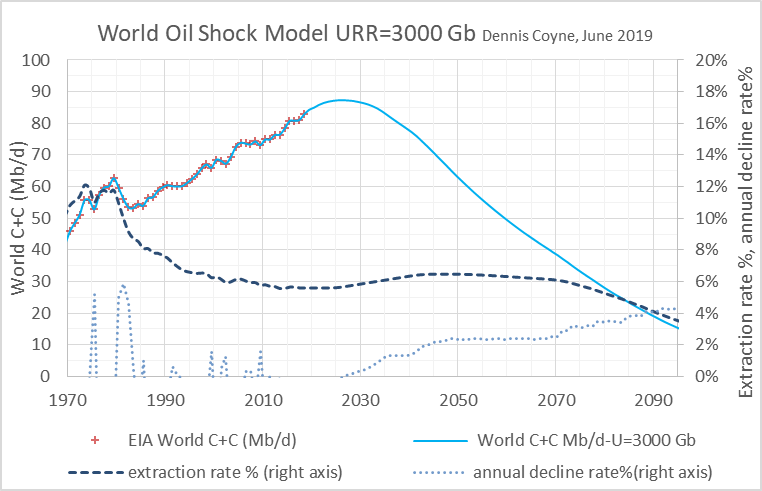
Chart below shows where this “best guess scenario” falls relative to the 27 scenarios presented earlier.
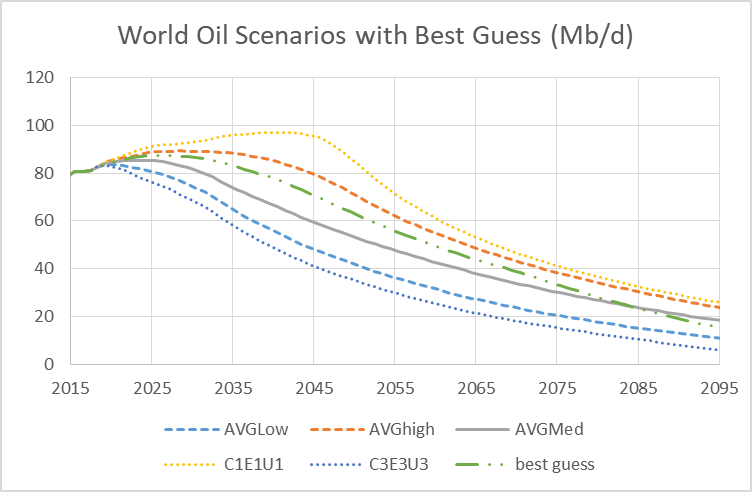
The best guess scenario peaks in 2026 at 87.3 Mb/d. Output remains on a plateau between 86.5 Mb/d and 87.3 Mb/d from 2022 to 2030 in the “best guess” scenario. A safer guess for the peak in World C+C output would be 2024 to 2028, if this guess is close to being correct. A severe recession between starting any year after 2023 would probably mark the peak in World oil output.
391 responses to “Oil Shock Model Scenarios”
excellent!
Thanks Fernando.
https://www.woodmac.com/news/feature/non-opec-decline-rates-remain-stable-until-2020/
What we have seen is low oilprice also increase decline rates as maintenance work are skipped to save money. As I see todays oil production is about 80.6 mbpd and your best suggestion is peak at 87.3. According to EIA oil demand grows with aproximately 1.5 Mbpd. It should than remain 4.3 year or 2023.
Freddy,
From 1983 to 2018 the average rate of increase in World c+c output was 800 kb/d each year.
So that would be about 5 years if the rate continues to increase linearly. It is likely to gradually slow over time as the peak approaches. Perhaps 800, 700, 600, …, 200,100, 0.
Freddy,
In 2018 World C+C average output was about 82.84 Mb/d, so my “best guess” (which could indeed be incorrect) scenario sees an increase of 4.46 Mb/d from 2018 to 2026. An average annual rate of increase of 637 kb/d. Over the past 10 years the average annual rate of increase in World C+C output (2009 to 2018) has been 854 kb/d. Over the past 36 years the average annual rate of increase has been about 816 kb/d. As oil supply becomes short and oil prices increase we may see a gradual decrease in the rate of increase in oil consumed. We cannot consume more oil than is produced except by drawing on oil stocks and those are limited.
From 2019 to 2030 the output in Mb/d is as follows for my best guess scenario:
84.29
84.98
85.82
86.47
86.89
87.18
87.32
87.34
87.25
87.11
86.81
86.48
I have two other models which are pointing to 2023 as peak oil demand.
Dennis’s analysis in this post…isn’t really any good. It’s making the same mistake the oil companies are making: it’s not taking peak demand seriously enough. You can’t just Wild-Ass-Guess three supply-based scenarios based on the assumption that lower demand means lower drilling: we know from the frackers that sometimes they’ll drill more even as profits disappear. If you seriously assume that the market will balance after filling storage, then you have to run a pure demand-based model; after storage fills, supply will have to be shut down to match demand, period. (Rational companies would have been doing this already, but there are a lot of irrational companies.)
Nathaneal,
I have also analyzed peak demand, a realistic model does not arrive at peak demand until 2035 under very optimistic assumptions. If you are correct about peak demand and it occurs before 2026, then output will simply follow one of the lower scenarios which peak as early as 2018 for the lowest cases. Perhaps 2023 might be correct, it is possible that neither of our best guesses will be correct, the possible future scenarios are literally infinite so the odds of being correct are approximately zero.
Thanks for sharing your models!
I think you are right when you predict peak demand at earliest 2035.
Not many, if any, do stochastic models, which takes into account uncertainty.
World oil reserves could be unlimited, but if the cost of obtaining the oil grows faster than the economic benefit that can be obtained from it, Peak Oil will still take place regardless of reserves. That’s why I think oil reserves are irrelevant for Peak Oil and plenty of oil is going to stay in place. It will not be extracted because the economy will not bid its cost of extraction.
Javier
Correct reserves are the oil that can be extracted profitably. Technically recoverable resources are not the same as economically recoverable resources. URR=ERR.
When the cost of substitution drops low enough, there are no economically recoverable reserves.
Nathanael,
There are a number of uses that are difficult to substitute such as air travel, farm equipment and so forth. There is some oil which is quite in expensive to extract in the middle east and in Russia and even some US onshore resources. Those resources will still be economically recoverable even at $20/b in 2017 $.
above I said “in expensive” and meant to say “inexpensive” ie there are cheap oil resources in the Middle East and Russia, probably profitable at $20/b in 2017$, not enough for 80 Mb/d, but probably adequate to provide 20 Mb/d for 30 years or more.
Nice try, Dennis! Great effort. Thanks for putting all the labour in this post.
Future will tell if you’re right or wrong, that’s the way it works 🙂
You know my point of view: oil production is not price related. Nevertheless I like people publishing their ‘best guess’ about the global predicament of peak oil, based on whatever reasonable idea they may have.
Verwimp,
Interesting.
I am pretty sure oil prices change the amount of oil produced.
Maybe producers could chime in.
Perhaps I am wrong.
There is some connection between production and price, but there is an awful lot of play in the market. The cost of oil is much lower than the price consumers are willing to pay in a pinch.
This explains why the oil industry is so profitable. It allows “rent taking”. It also explains why sudden lurches in the price are possible. They are based on trader psychology not supply and demand.
The huge gap between cost and value to the consumer is visible in Europe, where very high taxes on fuel at the pump fail to dissuade consumers from wasting the stuff. The gap results in much of the resource being squandered on oversized vehicles designed to be ego boosters or status symbols.
I am thinking more about oil supply. I assume demand will continue to grow at an annual rate of 800 kb/d each year until high oil prices destroy enough demand to balance with available supply. This is likely to be the case until peak oil is reached between 2024 and 2028. I do not expect substitution will lead to prices falling before 2045. It will take time to replace 1 to 2 billion ICEVs.
Right, I don’t comment on oil supply directly, since I don’t know much about it. As mentioned elsewhere there is some connection between price and supply.
I expect substitution to start having a big effect by the late 2020s. I expect the number of ICE vehicles on the road to stop growing before that — maybe even as early as 2023, depending on battery production, and also on the autonomy wildcard. This sounds a little like science fiction, but just look how the car industry is panicking right now.
Alimbiquated,
I agree. For all road transport oil use, I have the peak in my model in 2026, but demand and supply fall at the same rate until about 2032, after that demand falls faster than oil supply leaving a demand gap and excess oil supply, then oil prices start to fall, potentially this could limit the adoption of BEVs, though it depends upon how fast the prices of EVs fall, it may be that by 2033 EVs are considerably cheaper than ICEVs and the price of oil may not longer have any effect on their adoption as the capital cost of the vehicle may be considerably lower and EV charging infrastructure may have been built out making adoption easier.
It will be interesting to watch.
Substitution is not about EV alone.At least in developing countries like India where I stay it is about public transport,ride share, railway electrification etc .In densely packed cities and towns of India public transport provides the desired frequency to act as an alternative.
I, too, think there is too much focus on substitution linked to EVs. People don’t have buy EVs. They just have to drive ICE vehicles less or at least switch to far more efficient ICE.
Much driving could be eliminated altogether. We will be okay if all recreational driving ends, if necessary trips are consolidated into fewer of them, etc.
Life would be different with less driving, but certainly survivable. And if people did more human powered transportation, they would be healthier.
Boomer,
I agree it will be a combination of substitution (in all forms, public transport, walking, biking, ride share, car pool, and EVs) as well as using transportation less and choosing more efficient means of transport.
It is difficult to model all of these factors, a choice of focusing on EVs alone would tend to give a high end estimate of demand for oil because many other means of transport and increased efficiency are ignored. Note that the effects from all the other factors you mention have been in place over high oil price periods so we can see how they have affected things in the past. From 1980 to 1985 we saw a dramatic reduction in the proportion of primary energy supplied by oil use, in later periods such as 2007-2008 and 2011-2014 the effect was less dramatic. It is unclear if we will see oil prices that are high enough for the non-EV type substitution you envision to have substantial effects.
The focus on EVs is due to it being a recent development which may potentially change things, much like cell phones and the internet have caused changes in society which were difficult to predict in advance.
Yeah, well. that will be rational, but ppl are irational…plus diminishing returns don’t seem to work to change the human lifestyle until SHTF doomsday really becomes a posibility. I find this equivalent to those ppl trapped in a burning airplane which, instead of f…king jump out, try to rescue their luggage
The new Volkswagen and Jaguar I-Pace commercials make me think that these vehicles are going to sale very well. Did Tesla even run car commercials? I am changing my mind on how fast the switch away from ICE vehicles will happen.
Above I say 2045 for falling oil prices, on further analysis my guess would be 2035 to 2040 when EVs and other types of substitution such as public transport, biking, walking, moving closer to work and in a walkable neighborhood, and car pooling, ride sharing, combining trips and buying more efficient icevs lead to demand falling below supply. The focus is on EVs alone, but high oil prices might lead to other effects becoming significant. Autonomous vehicles and increased ride sharing have not been considered. All these other effects would tend to push peak demand to an earlier date, but the scenario is optimistic so any earlier than 2035 is low probability and 2040 is probably the best guess in my view.
As has been pointed out here before, even if people want oil, demand can only go as high as supply.
If the economics of oil supply makes production less attractive, we will hit peak demand no matter how long it takes to convert the world to EVs.
Will demand drop before supply does? I don’t know. But if oil execs and investors and lenders want to get out sooner than later, supply drops. I see signs now and think it may pick up speed within the next few years.
Boomer,
By peak demand I mean a situation where we have falling oil prices, peak supply would be a situation where oil prices are rising because at prevailing prices people would want to consume more oil than is available. If oil producers cut back on investment for whatever reason (low oil prices might be one reason of many possibilities). My thinking is that low oil prices are leading to less investment at present. If supply is short prices may rise and investment may increase.
Demand and supply are always matched by the price of oil, the difference between peak supply and peak demand is the direction of oil prices after the peak. Peak supply will see rising oil prices and for peak demand oil prices will be falling.
I am much less confident than you that rising prices will increase supply.
1. The oil may not be easily accessible no matter the money.
2. There may be industry people who want out no matter the price.
With enough people projecting the end of the oil age, why stay tied to it if you can put your money, time, and skills elsewhere?
These days the very wealthy are less likely to be involved with commodities than other opportunities.
Note that I said investment will increase, rather than supply. If prices are higher then investment is likely to be higher than an equivalent situation where oil prices are low, that is all I am saying.
In general if there is money to be made by producing oil, then it will be produced, if not then it won’t. Pretty simple 🙂
Europe, where very high taxes on fuel at the pump fail to dissuade consumers from wasting the stuff.
Prices matter. Europeans use about 20% as much fuel for passenger transportation as Americans, per capita. 40% fewer cars, 40% less fuel per kilometer, 40% fewer kilometers per vehicle.
European industry, on the other hand, wastes fuel because they don’t pay the same taxes.
Verwimp,
I thought about your comment a bit more. Perhaps you believe demand for oil is relatively insensitive to the price of oil. I agree with that especially in the short run. Longer term consumers will adjust their behavior based on prices, consider 1979 to 1983 as an example of this behavior. In 1984 I bough my first Toyota a 1980 Tercel that got about 35 MPG highway and about 30 MPG in the city, my previous car was a 1968 Pontiac Catalina which got perhaps 16 MPG highway and 12 MPG in the city, so for an equivalent amount of travel I used half the fuel. Demand for oil correlates best with real GDP rather than the price of oil. Supply will track demand, however if the price of oil is so low that oil production is not profitable for the marginal producer, then supply will not be sufficient to meet demand and oil prices will be bid higher.
My discussion of oil price in the post was to do with this effect. Consider tight oil output for example in the US. Output was increasing strongly from 2011 to 2015, but the large change in prices from $110/b to $40/b lead to a drop in tight oil output.
There were those who believed that this was because tight oil production had peaked, but time proved this thesis to be incorrect and tight oil continued to increase as oil prices increased making tight oil production marginally profitable. Likewise Canadian oil sands output has decreased due to falling prices for Western Canadian Select.
So the story in the post is that lower oil prices will have an affect in tight oil and extra heavy oil output and may also reduce extraction rates for conventional oil (especially expensive resources like ultra deep water and Arctic oil) as the World reaches peak demand in 2035 or so due to the adoption of BEVs for road transport.
I was not very clear about this in the post, though we have discussed this before and you have not found this argument convincing.
It seems Shallow sand has often commented that when oil prices get below $45/b he lets low producing wells become idle if they need maintenance and does the minimum capital spending necessary because oil production is barely profitable in his field at that price. No doubt there are many other producers in the same boat who reduce output or expand output more slowly in response to lower prices. This is introductory microeconomics, pretty sure most people have a handle on this.
Dennis, what I have seen working for unconventional small to mid sized oil companies through the ups and downs is oil price can impact supply, but not usually the way we would expect. A significant amount of unprofitable wells were drilled in the post recession years driven by low interest loans to oil companies, and a significant access to capital due a lack of other profitable investment opportunities to hedge funds and retirement funds. In those days growth was the mantra, everyone needed to grow reserves and additional locations to drill, and production, never mind each quarter the company’s dug themselves further in to debt. Even in the oil crash of 2014, not enough companies took advantage of the decline in prices to go through bankruptcy and reduce debt loads. Most just kept piling on debt to drill wells that were not economic, but needed to grow reserves, and production, and to hold the acreage they spent so much money on.
Rig count tended to loosely follow oil price, but it was mostly dictated by if companies could get loans to fund their drilling. We have reached new heights of production mostly because we have also reached a point where most of the acreage in these plays is held by production, or a unit, or a continuous drilling provision. This allows companies to drill their most profitable locations during a lowish oil price and try to get into the black for once. The problem is in a lower longer price scenario, we bleed through all of the best locations trying to stay afloat, leaving increasingly worse oil production on all future wells.
Currently rig count is dropping, far faster than it should be with the oil price, but that is due to capital markets drying up to oil companies. Without access to new debt, they have to try and live within cash flow, which means cutting rigs, and cutting staff. Most of these small and mid sized companies also have a huge debt burden that comes due in a couple years, that they are incapable of paying off.
This is a long way of saying that right now it doesn’t matter in the US unconventional world if oil price climbs to $80, without access to new debt, or debt refinancing, companies will have to focus on paying down debt first, and adding rigs later. Production in the US has essentially peaked already, and I am not sure who else can fill in the gap.
Thanks JG Tulsa,
Let’s take a hypothetical case where an oil company is well run and either has low or no debt and mainly operates by plowing cash flow back into capital investment when it is profitable to do so based on the current oil price level. In that situation, where it exists, would you expect with all else being equal, that an increase in well head prices would tend to increase or decrease output for such an oil company?
I agree the tight oil companies have not operated their businesses very wisely and in many cases have seem relatively unaffected by the price of oil. I doubt that way of running an oil company will continue for much longer, many of these companies will go bankrupt or may be bought up by stronger companies.
Hi Dennis,
It is absolutely reasonable to scale down production when prices are low and vice versa. Those who are able to do so, will do so most probably. Nevertheless we saw production in Bakken and Eagle Ford go down in 2015 and 2016, while Permian was going up during these same years. Same price, other change in production. Also we see, for example during 2017-2018: Mexico and Norway down, China and UK steady, USA and KSA up. Same price, other change in production.
It would make things less complicated if production numbers were closely related to oil price. But I do not see this connection.
I am willing to see it, but I don’t. It is not that your argument are not convincing to me. It’s just the data telling me another story. A more complicated story.
Best regards,
Bruno
Verwimp.
Yes the relationship is not straightforward. Consider tight oil production as a whole and the effect is pretty clear. The capital can move from the more expensive plays to those that are less expensive and the Permian was less developed in terms of horizontal tight oil production in 2015 relative to the Bakken and Eagle Ford so costs were going down there as the recipe for the most efficient way to produce the tight oil using modern methods was being worked out in the 2014 to 2016 time frame in the Permian basin. A look at average well profiles makes this pretty clear (see chart below). wellpro1 is the 2010-2012 average and each well profile from wellpro2 to wellpro6 corresponds to 2013-2014.5, 2014.5-2015, 2015, 2016, and 2017.
For tight oil as a whole we see output decrease from March 2015 to September 2016 from 4892 kb/d to 4307 kb/d where in the 21 months previous to March 2015 output had increased from 3012 kb/d to 4892 kb/d, the net change in the rate of increase in tight oil output went from an 1880 kb/d increase to a 585 kb/d decrease which adds to 2465 kb/d, a pretty significant change in my view.
Likewise for Canadian oil sands we saw an average annual rate of increase for the 21 months before March 2015 of 252 kb/d and for the March 2015 to Sept 2016 period output increased at an average annual rate of 9 kb/d. A less dramatic change, but this would be expected for oil sands where capital investments are longer cycle and larger.
I focus on the forest rather than the trees 🙂
“Nice try, Dennis! Great effort. Thanks for putting all the labour in this post.”
Thanks, lots of upfront work went into the post. Dennis has some cool computational features built into his spreadsheet.
Thank you Paul for creating the original model circa 2005.
https://mobjectivist.blogspot.com/2005/09/oil-shock-model.html
Quien sabe? But, each is based on some reality, each of which could happen.
Nadie sabe.
Hi Dennis, and anybody else who crunches numbers,
What is your opinion as to the price necessary for oil companies to make money in Texas these days , and over the next couple of decades, in constant money?
A high and low estimate or range would suit my purposes just fine. Thanks anybody and everybody!
All that, depends on the cost. The cost can run anywhere from about 800k for shallower sands to over 10 million plus plus for a Permian shale oil well. Each will produce different amounts per month. There is no “Texas” figures. Texas has a HUGE amount of different formations.
But a rough estimate to make numbers is about 60 to 70 dollar WTI price. Some can make it for less, but most are sucking wind at 55, unless you are in shallow sands, which is not so available anymore.
OFM
I assume you are asking about tight oil. About 70 to 80 per barrel in 2018 $ will be needed for Brent oil price for oil companies to make money. WTI about 61 to 71.
Yeah, I’ll agree with that. And we ain’t there yet. With the stipulation that some oil companies could not make a profit at $90 a barrel. And Bubba flat don’t need them.
The decision parameters are extremely simple. It is history, whether on RRC, or wherever. Location makes X amount of oil in Y amount of time. No brainer.
Oh my.
Well, we’re never going to see WTI over $60 again. It’s capped by substitution around $50.
I managed to do a more detailed version of my substitution price model — not just including the difference between gasoline and electric costs, but also including the current upfront price difference between an average gas car and a Tesla Model 3 with a reasonable options mix as a “cost per mile”. And surprise surprise, it produces something close to the current WTI price. That’s a nice result.
As electric cars get cheaper, the substitution effect should bring the cap down from $50 to $20 pretty quickly. It’s going to be a *bloodbath* financially for the oil companies.
My question is: how much financial bleeding before they actually stop drilling? Frackers have been drilling for a decade while burning billions in other people’s money.
We drive a 9 year old Prius and a 4 year old Honda Accord. The Accord is ranked tops for dependability. I see no need to pay anywhere near $30,000 for a new car
Robert,
A 4 year old Model 3 will save you money. Currently a new Accord will have higher 5 year ownership cost than a Model 3.
I don’t understand. I could probably get a new Accord in this area for under $22,000. If less affluent would settle for a Civic. We have no available garage and would not be fond of electrical wiring in the driveway. At least we don’t burn the coal directly in California. I have not encountered a Tesla in Leisure Village this year. Did see one last year
robert
the accord with similar features to the standard plus model 3 would be 30k there are considerable fuel savings with tesla not for everyone charger can be an outside outlet on the side of house condos can be a problem
Robert
Accord Hybrid Touring which has somewhat similar features to model 3 is about 32.5 k according to true car, thats about 4k under msrp.
When extra cost of fuel for Accord is considered over 100k miles the cost of Accord goes up by 4500 to 37k. The Model 3 is about 39k, it is a far nicer car than the Accord. Not everyone wants to spend that much. I used 3 dollars per gallon and 12 cents per kwh I assumed 40 mpg for Accord Hybrid. It is likely that gasline will increase in price.
Hi Dennis,
I remember that calculation was very dependent on estimation of resale value. Also estimated resale value was used in financing capital cost so basically result comes out as autor wants it or as he estimates resale value on the model 3 as there is yet only estimations and no history available.
I dropped the discussion as i realised your financing of cars are very different how financing is done in my country so i would say that “cheaper than accord” applies to US with that resale value estimation of the model 3. Perhaps it applies in other countries also but for sure not in mine.
So the truth is probably not so black and white but more of situation dependent.
I still think comparing lease costs between whatever models you are interested in would tell alot, since leasing companies for sure have taken in consideration all costs over the period of the lease and added a profit margin. Then it just becomes the question do they apply same margins on all brands and cars, probably not but i think this would better indicate actual cost of a car model over time
What is leasing cost for an accord and a model 3 in the us? About same?
Ok i checked leasing costs in my country, model 3 standard edition about 550 dollar/month
Accord was apparently not available in my country so i instead selected a honda SUV Honda CR-V
It was about 450 dollar / month to lease
So about same price then for those two since you get about one full tank a month for the difference to put in that SUV.
Personally im leasing a ford focus combi atm with a decent amount of extra stuff in, i pay 230 dollars / month for that one. If i can find a hybrid that match my cost i will switch next time but so far i haven found one that is similar in size and price (in my country)
Baggen,
At some point cheaper EVs will be built.
I imagine it is cheaper to buy a used car than to lease. In a few years used Tesla Model 3 can be purchased more cheaply.
Baggen,
The author used research by Kelly Blue Book to estimate resale value.
https://mediaroom.kbb.com/2019-01-23-Kelley-Blue-Book-Names-2019-Best-Resale-Value-Award-Winners
Part of the savings would come from fuel savings. This varies by nation as taxes on fuel varies.
Hi Dennis,
I realize the author used an estimation by someone else, but its still just a guess and that guess more or less makes up the entire calculation so it comes down to if you believe the estimation/guess the author referring to and are going to get a new car in the US then calculation is correct and you put down your own money.
If you have doubts about that estimation panning out to be true and you live in the US perhaps you hold of putting down own money.
Or if you as i live in another country where financing looks very different you dont come close in a cost calculation with the tesla/hybrid vs options. Not yet anyway hopefully in a couple of years.
And i promise you i live in a nation with much higher fuel taxation and price compared to the US but it wont come close to even it out anyway.
Compare my current leasing cost vs the cheapest model 3, more than double. Sure you can argue its a much nicer car than my current one. But is it that much nicer so i should basically pay another 2-300 dollars / month to watch it next to my garage? It wont happen in my case.
But probably this is something we all do to an extent using our own reality and applying it on the world when the truth is probably more of a shade than black and white.
As i said i do want to have a hybrid as that would be a perfect fit for my driving patterns, but it needs to come down about 10000 dollars in purchase price for one in similar size as my ford focus combi. Then i will save money on the switch. My lease will be up in 15 months or so hopefully that has happen by then.
Baggen,
Wouldn’t buying a used car save you quite a bit?
I never lease, makes more sense to buy and drive for 10 years or even cheaper to buy used and drive for 7 years. Especially if you buy Japanese.
Hi Dennis,
“Wouldn’t buying a used car save you quite a bit?
I never lease, makes more sense to buy and drive for 10 years or even cheaper to buy used and drive for 7 years. Especially if you buy Japanese.”
Of course a used car would be cheapest, but the article we are both referring to was not about used cars it was about total cost of owning a car over a period of time if you had decided to get a new one. Specifically comparing purchasing a new Model 3 against other new cars.
Personally I dont want an old used car i prefer a new and i actually own two one that i bought cash (2016) and one that im leasing (2018).
Leasing is actually very close in cost compared to buying it cash up front it was a difference of 1500 dollars for 3 years when i estimated/guessed value loss on the purchase option and then i dont own it so i wont have to deal with selling it down the road i will just switch to a new. If i also include capital cost witch i should in the lease vs buy the lease is by far a superior option to me financially.
“At some point cheaper EVs will be built.
I imagine it is cheaper to buy a used car than to lease. In a few years used Tesla Model 3 can be purchased more cheaply.”
I agree used model 3 will be cheaper in a couple of years, especially if tesla manages to get price down on new production. But that doesent go together especially well with that calculation we are referring to witch is heavily dependent on the high estimated resale value of the model 3.
We cant both have high resale value in a couple of years at the same time as we have cheap used model 3. At least i find that outcome unlikely.
Baggen,
Well yes if resale value is high, then buying new may make more sense. You are skeptical of high resale value, if you are correct then used might make more sense.
For me saving money was not really the aim, for the US if the Kelley Blue book estimate is correct for resale value then the Tesla is competitive. Again for me the lease is not the better deal and in many cases lately I was able to get zero percent financing, just paid cash for the Tesla. It’s been a great car so far, big step up from my Camry Hybrid and Prius.
It is not going to be as cheap as a subcompact car.
Dennis,
“Baggen,
Well yes if resale value is high, then buying new may make more sense. You are skeptical of high resale value, if you are correct then used might make more sense.
For me saving money was not really the aim, for the US if the Kelley Blue book estimate is correct for resale value then the Tesla is competitive. Again for me the lease is not the better deal and in many cases lately I was able to get zero percent financing, just paid cash for the Tesla. It’s been a great car so far, big step up from my Camry Hybrid and Prius.
It is not going to be as cheap as a subcompact car.”
I am skeptical of the high resale value yes but that is not my main point. The original question was if buying a new model 3 vs a bunch of other new cars were cheaper to own and operate for a period of 5 years according to that article.
Im simply pointing out that the calculation is heavily tilted towards an estimation of a resale value, and the calculation is also US localized. If you live in the US and agree with that resale estimation then its a go.
As i said personally im not in the market for a used car, but of course that will always be cheapest option if that is your only preference of consideration.
“Again for me the lease is not the better deal and in many cases lately I was able to get zero percent financing, just paid cash for the Tesla. It’s been a great car so far, big step up from my Camry Hybrid and Prius.”
Yeah as i said we live in different worlds come to car financing and that was also my point that the calculation we are both referring to is US localized.
0% financing what do you mean by that, you borrowed money from the bank at 0% interest? Or your using your own money and calculate the cost of that to 0%?
“It is not going to be as cheap as a subcompact car.”
What is a “subcompact car”? like a really small car?
I know you own a model 3, if you could provide me with the average distance you get per kWh i could do a quick example of my reality with numbers, if we select the pay with own cash for entire car option. So i can include the Model 3s lower operating costs.
Baggen,
My 2013 Camry Hybrid and 2015 Prius Plugin have a zero % interest rate. Financing through Toyota, so agreed on purchase price first then arranged financing, though it is likely the agreed price was based on the assumption that I would get the loan at 0%, so possibly the price was higher to account for that. I used a Web service that gave me the “fair price” for the specific model I wanted and got that price in each case. I usually keep my cars for 10 years or more, (2004 Prius traded sold in 2015, 1997 Camry gave to my Dad in 2009, 1994 Accord replaced with 2004 Prius and 2009 Prius replaced with Model 3 in 2018 (sold that one early at 9 years) Some cars in between went to kids 2009 Prius went to daughter and she got the 2015 Prius when we got the Tesla.
So I buy rather than lease because I keep the car for 9 to 10 years, works best financially for me.
Dennis,
“My 2013 Camry Hybrid and 2015 Prius Plugin have a zero % interest rate. Financing through Toyota, so agreed on purchase price first then arranged financing, though it is likely the agreed price was based on the assumption that I would get the loan at 0%, so possibly the price was higher to account for that.”
Ok now you have to explain how this works to me 😀
So the car dealer gives you a 0% loan on the full amount of the agreed value on the car? Am i getting that correct?
where is the rub? I doubt they give you a car for free, so where do they get their money if they finance it for 0% for you for full amount?
When you trade it in for your next car do you get a new 0% loan on the new car then – value left on your old?
You never ever hand the dealer any money at all?
For me the cheapest way to finance a car would be using bottom loan on my house at about 2%, if i exclude the alternative cost on that borrowed money from the bank. If i include it then leasing will be my superior option.
Baggen,
I think it was something like $1000 down, so if the car was 26k, then 25k is “financed” and payments cover principle only over 5 years so to keep math simple if it was 31k including sales tax and we put 1k down, we pay 500 per month for 60 months. Then I own it, next time I buy a car the interest rate is probably higher, these days around 1.99% is common in US for those with good credit scores. Tesla did not offer financing or I didn’t like their rate so I just paid cash.
Dennis,
“I think it was something like $1000 down, so if the car was 26k, then 25k is “financed” and payments cover principle only over 5 years so to keep math simple if it was 31k including sales tax and we put 1k down, we pay 500 per month for 60 months. Then I own it, next time I buy a car the interest rate is probably higher, these days around 1.99% is common in US for those with good credit scores. Tesla did not offer financing or I didn’t like their rate so I just paid cash.”
Ok then i understand, so you basically payed cash but payments are stretched over a 60 month period to reach the agreed upon price. That total price is probably a little bit higher compared to if you would have payed full amount cash upfront, sort of a hidden interest for the dealer for offer this financing.
I use 7% capital cost/alternative cost for spending my own money and i would apply it in both cases above 60 months payment plan or cash up front. This is why a more expensive car like a hybrid or EV will never catch up to the cheaper purchase option even if their operation cost is significantly lower. What i miss out on alternative income eats up any savings i do in operational costs.
This is also why the lease option is the most profitable one for me.
So it comes down to how much more do i want to spend per month to have a car that is a bit or a lot nicer. Changing my Ford focus to a model 3 for instance would cost me about 2-300 dollar per months in difference and im not willing to spend that to mostly look at it parked. I rather have the difference of the capital employed, have a higher income and look at my somewhat less nicer car.
Baggen,
I guess even with the opportunity cost of the capital one needs to consider that at the end of 5 years in one case you own the car and in the other case you do not. If one is willing to keep the car for the following 5 years (for a Toyota this is usually the case) the cheaper option is to buy rather than lease. There is a differential between trade in value and purchase cost that is significant after 5 years, I also typically drive my new cars more than the typical lease mileage.
The main thing is that there is more to the decision than the money from my perspective. Also my wife didn’t like the Prius, she wanted something nicer, she likes her new Model 3 so it works for me.
Dennis,
“I guess even with the opportunity cost of the capital one needs to consider that at the end of 5 years in one case you own the car and in the other case you do not.
if one is willing to keep the car for the following 5 years (for a Toyota this is usually the case) the cheaper option is to buy rather than lease. There is a differential between trade in value and purchase cost that is significant after 5 years, I also typically drive my new cars more than the typical lease mileage.”
No, not for me i will miss out on that extra income every year that i own the more expensive car if i select to purchase with own money, not counting value increase in investment either just cash flow. As i said i did the calculation value loss vs lease cost and came up very even 1500 dollar difference in 3 year. Of course then i have estimated value loss but at least i have history of same model to use for estimation. And i dont want to own a car that starts to get old, just a personal preference of mine so that weighs into my decision process that is not pure economical if it were i would only buy old used cars. Yes as you say it also depends on your driving habits i dont drive much so leasing is a valid option for me, but if you exceed those 15000 km/year in distance the lease option gets uneconomical quite fast. Probably you have similar ranges in your lease options and penalties for exceeding them.
“The main thing is that there is more to the decision than the money from my perspective. Also my wife didn’t like the Prius, she wanted something nicer, she likes her new Model 3 so it works for me.”
Totally agree, same in my case not only based on money/profit as i do have some other variables that are “musts”.
But hopefully we can agree that the reality is not as black and white as that referred calculation in the article made it out to be, but how that affects EV adoption if it goes faster or slower i would not dare to guess but i dont think economy is the main driver for switching for alot of people rather other values.
Im hoping for a hybrid similar size to my current car that comes down about 10.000 dollar in price in 1.5 years, then its a deal in my case when i make next switch 😛
Baggen,
An alternative is to buy a nicer car than a Ford, maybe a Toyota or Honda and run the numbers for using the car longer than just 3 years. If you are in a nation with high fuel prices, the economics might work out if you keep the car for 10 years, and Toyotas and Hondas are quite reliable over 10 years/150,000 miles.
I may be a little more frugal as far as spending on cars.
The Wall Street Journal today has an article about how sources of funding have dried up for frackers.
I’m not sure substitution will kill oil prices. And while I know peak oil will happen, putting a date on it doesn’t much matter to me.
What most interests me is when investors, lenders, and execs at oil companies decide having their money tied up in petroleum just doesn’t make financial sense and it is time to bail.
LTO is going to have to slow down with low prices and less access to capital. North Dakota drilling in at least the past 8 months is going to lose money. Getting mid-$40s at best and in December much worse in the initial flow burst is no bueno. Even if hedged, it’s still an overall economic loser with operators having no positive free cash flow. Cash for additional drilling *has* to come from investors or lenders. That gets choked off, theres no money to pay the up front capital and labor costs of new wells.
Boomer the exact date does not matter, but higher oil prices that are likely from 2022 to 2035 will affect the economy. Higher oil prices will also make unconventional oil resources more likely to be recovered.
My expectation is that high oil prices will eventually lead to substitution of EVs and AVs to the point where oil prices fall in the 2035 to 2050 time frame. This causes much of the extra heavy oil to be left in the ground, about 300 Gb that might have been recovered at a price of $100/b or more in 2017$. A lot of tight oil may also remain in the ground along with deepwater resources.
“Well, we’re never going to see WTI over $60 again”
I think that one is going to bite your ass.
Nathaneal,
I approach it differently and look at realistic rates of sales growth in EVs.
Replacing 1 billion cars takes time, until that is done there will still be demand for oil. one cannot simply assume the sales growth rate of plugin vehicles (about 30% growth for the past few years) will continue indefinitely, the rate of growth will gradually slow over time until the sales rate reaches 70 to 90 million vehicles per year, then it will still take a few years to replace the fleet, a similar model can be created for commercial vehicles. In my model demand falls below supply in 2033, at that point oil prices start to fall, though the rate of decrease is unknown. Oil prices might reach $20/b by 2050 when demand reaches about the current level of OPEC output, difficult to predict what happens to oil prices, but they will go down as the transition occurs. We agree on that point, just not the timing.
According to Mark Papa in Q4 2018 presemtation EOG did not see any possibility to increase oil production as they need 75 usd / bbl WTI. They priority to pay depth , interest and dividend to their investors. If the vreak even price WTI average shale oil is 65 usd today , I doubt this will be reduced the next 3-5 years as the rock formation will have reduced production Quality, the max. latitude lenght and number each drill pad might be reach, now I read gaz is injected to stimulat production the impact of this remain to see. Higher labour cost , increase cost of funding as oil & Gaz is already less popular because of environmental issues. Than there is some increase offshore activity, and onshore drilling in Europe. But even the oil majours want cheeper wells and service work it will not be any cheaper because all need profit to grow a healthy Buisiness. In the mean time about 15% of the oil produced are replaced adding 6-7% decline rate to that and at least 1% growth in demand even with trade war it seems clear the world need significant more oil that is profittable to develop to a cost consumers around the globe , mostely poor in development Country can afford to buy and during time there need to be less energy made from fosil fuel.
I saved the Rystad article that has US at 12.5 now, and 13.4 by the end of the year. I will revisit it from time to time. It’s classic BS to the point of being really funny. Like “Little shop of Horrors” (the original, not the 1986 remake) the really bad SF movie.
I mean, really. We were at 11.9 the end of March per EIA monthlies. With no substantial increase in completions and drops in active rigs, we have increased 600k in two months??? Then in the last half of 2019, we are going to increase another 900k per day, when prices are less than $55 now? Well, if your going to lie, tell a big one. My Venus flytrap ate my homework?
GuyM,
I think we might get to 12.4 Mb/d by Dec 2019, I agree the Rystad estimates are likely too optimistic.
A month ago, I would have agreed that 12.4 was pretty reasonable. Not so sure, now.
No, too optimistic would apply if they were making this Wag at the beginning of the year. By mid year, it can only be defined as intentional BS.
GuyM,
I took a look at the drilling productivity report(DPR) to see if it was wildly optimistic and that was the source of the very bad Rystad estimate. It turns out that the DPR is not terrible, the trend for their estimate from Sept 2018 to June 2019 has a slope of about 666 kb/d each year. If we use the equation of that trend line (based on the 10 months from Sept 2018 to June 2019) to find December 2019 output we get output that is 574 kb/d higher than Dec 2018 output. If we assume Alaska, GOM and L48 onshore conventional are flat from Dec 2018 to Dec 2019, and also assume the trendline based on Sept 2018 to June 2019 data continues to track tight oil output through Dec 2019, then output in Dec 2019 would be 12,537 kb/d.
This is probably a high side estimate in my view probably 12,250+/-250 kb/d would be my guess for US C+C output in Dec 2019 (low end for lower prices and high end for higher prices).
For average annual output, 2019 would be about 1080 kb/d higher in 2019 than in 2018 with average output at 12,040 kb/d in 2019, it was 10,960 kb/d in 2018.
Related: https://oilprice.com/Energy/Crude-Oil/How-Oil-Defeated-The-Nazis.html
Worth A Repost: Mike’s take on this foolishness: – many Texans are in Left Feild.
https://community.oilprice.com/topic/6209-why-is-america-texas-burning-millions-of-dollars-per-day-of-natural-gas/
Damn thats great work Dennis.
I see a few take home messages-
Assuming the world economy continues on without huge disruptions for the next three decades-
there is a huge amount of oil still to be delivered,
we are very close to peak [+/- 5%],
there is still a massive slug of CO2 to be ‘delivered’, and
there is still some time for the world economy to make the technological and policy adaptations to get by as oil depletes.
What could severely disrupt the smooth path ( or result in big under-performance of the potential) displayed in the charting?
To me the big ones seem to be-
warfare and failed states in the mideast,
economic depression severe and long long lasting, and
rapid replacement/substitution by electrification around early 2030.
I assume that Nat Gas will remain in highest level demand in the scenario where electrification of transport becomes pervasive. I also assume that national policy initiatives to rain in crude oil consumption due to climate change, such as carbon taxes, will do little to affect consumption. Countries will focus much of the climate change angst on coal for the next 20-30 yrs, and climate change effects will be felt primarily after oil is on the steep decline part of the curves anyway (2040’s and beyond).
Regarding Nathaniels severe criticisms- you can’t quantify these variables and factors accurately, such as failed states, substitution rates, and national economic policies. That is not what Dennis is presenting.
Hickory,
Thanks. Criticisms are fine there are many points of view. Nathaneal is just more optimistic than I am about how fast BEVs can ramp up. Chart below shows model from 2025 to 2070, and note that it is assumed oil used for things other than road transport is assumed fixed at 2025 levels, a more realistic model would have these uses increasing through 2070 when World population might peak and then potentially decreasing thereafter, the focus was on EVs replacing ICEVs both personal and commercial vehicles. Higher oil prices might also lead to more electrified rail, light rail, buses on overhead wires, etc.
My revised EV transition model has demand falling below supply in 2033 for my best guess models of supply and demand. From 2022 to 2033 oil prices are likely to be high while the transition proceeds. I expect oil prices to rise by $8/b each year until reaching $100/b in 2022 and then the rate will slow to about $2/b per year (constant 2018$) from 2023 to 2033, with oil prices reaching $120/b, then oil prices will start to decline as demand falls below supply after 2033.
Scenario below matches supply with the demand scenario from my EV transition scenario. In this case extraction rates fall and decline rates rise due to a lack of demand for oil (demand below supply) after 2032. We would expect oil prices to fall from about $120/b in 2032 in 2018$, the rate of decrease in oil prices will be whatever is needed to stop the more expensive oil from being produced. It is not clear what the cost curve will look like in 2032 so prices would be impossible to predict (not surprising as we cannot predict oil prices tomorrow with any accuracy). It seems likely that by 2050 or so that oil prices may have fallen to $30/bo or less, if the transition to EVs and other non-oil transport happens fairly rapidly from 2030 to 2050. Note that some commercial vehicles may move to compressed natural gas along with the BEV transition, there may also be a move to rail for long haul shipping.
Thanks for the efforts Dennis, much appreciated.
As you already know these models assume stable conditions. In my opinion this doesn’t seem to be the case at the moment. I am specifically talking from an economic standpoint and obviously there is a myriad of different factors as you already know which i will not go into here.
It seems to me the world economy is heading into uncharted territory, all the major economic powers (I will hesitantly include China too) are going through a period of low interest rates and low growth. There is talk that the Federal reserve will most likely cut interest rates this month I believe in the 18-19 June meeting.
Obviously trumps trade war is a factor in this and it will continue to be so, a drop in copper prices are also reflective of a drop in world trade.
All of this and more that i haven’t mentioned just from an economic standpoint will affect oil prices. If global growth is diminishing, which seems to be the case. This will have negative pressure on oil prices and therefore output, especially from the unconventional side.
It seems to me, central banks around the world are doing everything in their power to keep asset prices that banks hold up. What will be the outcome? I believe no one knows. For me this current situation is a notch beyond Keynesian economics.
Iron Mike,
The economy is difficult to predict. There have been many times in history where there has been political turmoil, perhaps today is worse than other times, this is by no means a given, different historians and economic historians would have widely different perspectives on this question.
For any 3 economists you would likely get at least 9 different predictions for future economic growth with very little overlap in their respective scenarios.
My standard guess includes a recession in 2030. So in the scenario below I have added a GFC2 type recession from 2030 to 2031 where extraction rates decrease over those 2 years, then extraction rates resume their increase from 2032 up to 2039 and then gradually flatten to 2044 and remain flat to 2050 and then decrease. URR for this scenario is 2970 Gb, with peak of 86.2 Mb/d in 2026. Obviously this is one of an infinite number of possible guesses.
I think twentieth and twenty-first century economic trends may not be enough to predict the future. I believe what we are seeing unfold is more comparable to the Industrial Revolution. Massive realignments.
While we haven’t seen the end of oil, I believe we are currently living through the end of the oil age. What the world will look like in the future will greatly depend on available resources, new technologies, and political alliances. While it is possible that the world might come out of this transition a better place, most of us here assume it will not.
The main problem with any transition is the sheer number of people.
Boomer II,
The only thing that is constant is that things never remain constant.
Somebody above talked about Europe and big cars. Europe has a problem. OPEC’s recent world statistical report (BP’s due this week upcoming) quotes global oil consumption growth at 1.5% for 2018.
The growth concentrated in Asia and North America. I believe Europe was quoted as a tiny decline. It didn’t happen from substitution, of course. They have a weakening economy.
This is a double whammy. This will hit EU tax revenue, from lower fuel tax revs. Latest estimate I’ve seen says the EU member states get about 7% of their total taxes from fuel. Pretty much all of them are running a deficit, some have negative interest rates, and this isn’t going to help.
Even with a weak (aging) Europe, and growth disruptions like trade wars,
we will be at 8 billion people in a few years, marching on to 9 Billion.
That is lot more consumers, and many will be able to afford some oil consumption.
There is a lot of wind in the sails of demand.
EU has big current account surplus.
Dennis, from your reply to Freddy:
In 2018 World C+C average output was about 82.84 Mb/d, so my “best guess” (which could indeed be incorrect) scenario sees an increase of 4.46 Mb/d from 2018 to 2026.
Okay, that ain’t all that unreasonable except… except… you have C+C production in 2019 increasing by 1,449 over the average of 2018. February 2019 World C+C production was 82,389,000 barrels per day. Your 2019 average is 1,901,000 barrels per day above that figure. Dennis, that just ain’t gonna happen.
The below chart is through April 2019.
OPEC + Russia + Canada accounts for 55% of the World’s oil production. These 14 OPEC nations plus Canada plus Russia averaged 47,849,000 barrels per day in 2018. Their average for the first four months of 2019 was exactly 46,000,000 barrels per day or 1,848,000 barrels per day below their 2018 average. Their April output was 2,352,000 barrels per day below their 2019 average.
If World C+C is higher in 2019 than in 2018, who will make up this huge difference. US Shale?
Scary Chart!
Canada still has lots of potential, their tars sands are just declining because of low oil prices.
I believe that the Aberta Tar Sands are pretty much “guaranteed” (much less risk compared to drilling for nothing) as long as the price is right. They are definitely there.
I am sure that statement will be destroyed by oil professionals (which I am not). But RockMtnGuy from Oil Drum who used to work on them I think, said pretty much the same thing.
thanks for your work Ron.
Hi Ron,
The model assumes extraction rates in 2019 for conventional oil producing reserves are the same in 2019 as in 2018. If they decrease, output could be lower than my best guess scenario. Output can increase in the final 8 months of 2019 and output data is often revised. I primarily use the EIA C+C data, the average World output for the first 2 months of 2019 was 411 kb/d below the average 2018 World C+C output. In 2018 average output was 1750 kb/d higher than the 2017 average.
My best guess may indeed be too optimistic for 2019, it was a simple constant extraction rate model through 2023 with increasing extraction rates through 2040 then constant then declining.
A modified model below has extraction rate decrease in 2019 so output is slightly less in 2019 than 2018. After that a similar scenario is followed as my previous best guess. For those who complain that the World economy will experience a recession, I agree but I cannot predict those.
Isn’t the answer the difference will be made up by drawing from storage until the price gets high enough to bring more production on? $120 barrel is going to get offshore fired back up and maybe even Venezuela.
No, there is just not that much storage. A nation can draw from storage for only a couple of months until they run out of storage. That is unless they have a tremendous amount of storage. Not many nations have that much storage. 120$ a barrel? You’re dreaming. Perhaps in a decade or so.
The problem is that now even 80 usd/barrel hurts world economic growth.
name,
Any evidence for that assertion?
So I found the downloadable data from OPEC’s Annual Statistical Bulletin noted above. I spent some time comparing their 2017 consumption numbers to BP’s.
They aren’t the same. They are quite a lot different in certain countries.
ASB says world consumption 2017 was 97.32 mbpd. BP says 98.2 mbpd. Not huge diff.
But KSA’s consumption is ASB 3.272 mbpd and in decline since 2015. BP says 3.92 mbpd steady increase since 2015 with a tiny downtick 2016-2017.
Someone has agenda on that.
BP shows KSA having almost overtaken Japan as #4 consumer in the world. ASB shows KSA far under Japan.
BP’s footnotes are far superior for explaining definitions, etc.
I seldom take BP’s word for anything. But in this case, I think they are a lot closer than OPEC’s Annual Statistical Bulletin. I am sure they get their numbers directly from Saudi Arabia. And Saudi will just make the numbers whatever they want them to be.
The ASB KSA consumption numbers are pretty glaring in how they diverge from BP.
Sometimes these numbers reflect domestic refining and the products get shipped off, but in this case KSA’s domestic refining capacity is almost exactly equal to their ASB consumption numbers. With BP saying that’s nearly 700K bpd low, there would have to be some petroleum product importing going on.
A search for Saudi gasoline import does find some hits, the most significant one from 2012 from an Arab newsletter.
What role do the giant oil fields play? As I write in my book “When trucks stop running:
the average size of new oil fields has declined, leaving us heavily dependent on the original giant oil fields discovered many decades ago.
Of the roughly 47,500 oil fields in the world, 507 of them, about one percent, are giant oil fields holding nearly two-thirds of all the oil that has ever been, or ever will be produced, with the largest 100 giants, the “elephants,” providing nearly half of all oil today
Since giant oil fields dominate oil production, the rate they decline at is a good predictor of future world oil production. In 2005, they provided 60 % of world oil. Giant fields only begin to decline after a long plateau phase where production fluctuates within a 4 % range. In 2007, the 261 giants past their plateau phase were declining at an average rate of 6 % a year. Their decline rate will continue to increase by 0.15 % a year, to 6.15, 6.3, 6.45 % and so on. By 2030 these giants, and the other giants joining them as time goes on, will be declining at an average rate of over 9 % a year
Since nongiant oil fields decline at much higher rates, especially offshore and tight oil, by 2030, the average decline rate of all oil fields past their peak production will be higher than 9 percent.
by 2030, from half to two-thirds of global crude oil production will need to be replaced—40 to 50 Mb/d of today’s 77.8 Mb/d
Making up this shortfall will be difficult, since four out of five barrels now come from fields found before 1973 and the majority of them are declining.
So far, Enhanced oil recovery in giant fields has increased the decline rate after peak production, because oil extracted now is unavailable after the peak, making the decline rate steeper. For example, Cantarell in Mexico, the second largest oil field ever found, declined at 20 % rates due to the EOR used to increase the maximum rate of production
Aleklett, K., et al. 2012. Peeking at peak oil. Berlin: Springer.
Hook, M., et al. 2009. Giant oil field decline rates and their influence on world oil production. Energy Policy 37(6):2262–2272.
Murphy, D.J., et al. 2011. Energy return on investment, peak oil, and the end of economic growth. Annals of the New York Academy of Sciences 1219: 52–72.
Thanks Alice, that was very informative. That is why I believe the decline curve will be much steeper than the ascension curve. Individual fields, of course, reach their peak production in only a few years and their decline could take many years. But I am speaking of all the world’s production combined. I think the decline curve will shock most people.
I once made a large poster about this 1978 Rand study. Had become interested in resource studies years earlier and occasionally lectured at ZPG and elsewhere. https://www.rand.org/pubs/reports/R2284.html
Thanks Robert.
I have read that report in the past, it is excellent. A snippet from page xi
That’s very informative, Alice. Very rough estimation from that, is that if shale were able to eke out another 600k increase a year, for a year or two, it could not possibly keep up with current decline rates in the bigger fields. Especially, when that shale increase is not going to start in 2019. World will be down, and add on another year of decline. 2018 will be looking more like peak year.
This poster has been considering post peak for, obviously, years. Kudos, this stuff is good!
http://energyskeptic.com/
Hi Alice,
There is no reason the decline rate will accelerate, especially for onshore fields. The UK declined at about 8.5% per Year after peak. That might be typical for offshore production which is a small proportion of World output. Cantarell is not likely to be typical for Giant oil field decline rates. US decline rate for C+C output from 1985 to 2010 was about 3.5% per year for lower48 excluding Gulf of Mexico and tight oil output.
A simple model can be created with 20 giant oil fields each that produces 4 Mb/d. Each field is assumed to decline at 5% per year and each year from 2019 to 2039 1 field goes from plateau to decline.
From 2019 to 2024 the World decline rate is less than 1% per year, from 2025 to 2031 decline rate is 2.4%, from 2031 to 2040 decline rate is 4.4% per year and from 2040 to 2050 decline rate is 5.1%.
Note that such a model does not account for the development of new producing reserves each year.
The oil shock model takes account of all oil discovered to date and assumes there will be some new discovery and reserve growth.
The oil shock model accounts for this fact. At the end of 2018 of 2800 Gb of World cumulative plus future discoveries and reserve growth about 1810 Gb of cumulative oil discovery had been developed into producing reserves leaving another 1000 Gb of resources to be developed in the future (this is conventional oil only and excludes extra heavy and tight oil resources). At the end of 2018 World producing conventional reserves were about 476 Gb for the medium oil shock model. The blue curve in the chart below shows the new producing reserves that are added each year to the pool of producing reserves. The red curve is oil produced (extracted) each year and the green curve is the modelled dispersive discovery curve (based on backdated oil discovery).
One way to think of producing reserves is a big pool filled with 477 billion barrels of oil.
There is a big pipe flowing into the pool which is a flow supplied by new producing reserves each year as new wells are brought online and adds to the pool of producing reserves. A second pipe flows out of the pool which consists of the oil produced each year. The extraction rate % is the oil produced divided by the producing reserves at the end of the previous year. Chart below shows each of these quantities for my recession model (recession in 2030 and 2031). This is for conventional resources only, tight oil and extra heavy oil are modelled separately.
Note the legend has an error, the extraction rate is on the left axis. Sorry.
Alice,
I was wrong about offshore being a small part of world output in 2015 it was 31% of World C+C+NGL. I still believe the undeveloped resources will offset decline in existing fields and thereby reduce decline rates.
First of all, oil field geography (not geology) can be changed. So that can be one source of corruption in whatever number you want to quote for field production.
Second of all, choke management can also corrupt whatever number you want to quote for field production.
And how about third of all you can change the definition of oil and call all sorts of liquids coming up the well bore “oil” regardless of API density and corrupt whatever number you want to quote for field production. Executives are paid for production, agencies collect taxes for production, royalty recipients are paid regardless of profit, so who is it that would oppose manufacturing any number for production you want to quote? Lenders? The Fed is providing nearly 0% interest rates. Why would lenders care? Maybe refineries would care, but you can probably cut them in.
So you can pretty much put numbers and conclusions about flow to bed.
Watcher,
This is World production, as far as I know all oil production to date has been from the third rock. 🙂 The production data is what has been produced based on EIA data. The Average API gravity has changed over the years, but one can adjust for this by reporting in mass rather than volume as the energy per unit mass remains fairly consistent for different API gravity oil. Unfortunately the EIA does not report by mass, it uses volume. BP does report by mass, but also includes NGL in their production data, bottom line is that the data is far from perfect, we do the best we can with the data we have.
Your complaint about API gravity has always been true, much of World Crude output has API gravity that is below the WTI spec. In years past the lighter oil was sold at a premium price because it was cheaper to refine. The average World refinery was retooled to handle heavier grades of crude as this was the direction crude production was taking. Nobody foresaw the extra 3 Gb per year of lighter crude that would come from tight oil in 2010, it takes time to build refineries and they are expensive capital investments. Makes more sense to export the light tight oil to refineries Worldwide that were designed to refine lighter grades of crude, that is why the laws were changed in the US to allow the tight oil to be exported.
It is pretty dumb that we are wasting so much natural gas through flaring because regulations are not enforced in North Dakota and Texas. That is up to the people of those states especially because the current administration does not care about the environment so the EIA has been gutted.
No, all the talk was about giant fields. Giant individual fields, the numbers of which can be and are tweaked by redefining the boundaries, which Ghawar did and certainly others.
George K’s rebuttal some yrs ago was semi legit in that use can be found for LTO that is not well loaded with diesel or kerosene, so rising API degree numbers aren’t a compelling issue. But no one is going to die from too little plastic. Finding use for liquid that doesn’t have enough diesel in it does not carry the argument. People WILL will die from too little food, planted or transported.
Trucks can run on other fuel besides diesel, gasoline, natural gas, electrified rail, lots of possibilities.
The 1979 Rand study had 75% of oil resources from Giant fields, a lot of that oil may have already been produced so the proportion of produced oil from giant fields is likely smaller today, we don’t have a lot of data from 1980 to 2018 for the super giants and how much oil they currently produce. Jean Laherrere estimated about 2800 to 3200 Gb for World C+C URR in October 2018, at the end of 2018 cumulative production of C+C was 1370 Gb, leaving about 1600 Gb to produce on the third rock. Geopolitical boundries don’t really change this fact.
My book, When trucks stop running, is all about what other fuels trucks could run on. Diesel engines are exquisitely crafted to burn diesel and diesel only, they can’t use gasoline, ethanol, or diesohol. Diesel is second only to uranium in energy density, essential for heavy trucks and especially off-road trucks. My book also explains why a 100% renewable electric grid isn’t possible, which rules out batteries and catenary (batteries are also ruled out because they are too heavy, an 18-wheeler would need a 55,000 pound battery, the truck weights 21,000 pounds, leaving very little room for cargo given 80,000 pound weight limits. Natural gas is finite, trucks would need giant gas tanks for which they’re not designed, there’s not a CNG or LNG distribution system, and cost billions if not trillions to retrofit diesel trucks, temporarily…
It seems like decline rates and the brief age of fossils now depends on the OPEC countries, which have 82% of the world’s crude oil reserves, and 65% of these reserves are in the Middle East, led by Saudi Arabia, Iran, Iraq, Kuwait and the UAE (Newman, N. 2018. Middle East Leads Global Supply of Conventional Oil. Rigzone.)
I’d bet war and a consequent financial crash will be the reason decline rates spike more than geology, but both will play a role in how fast oil disappears.
Alice,
Excellent post, i tried in a previous thread to argue a bit for this case but i could not put word or numbers on it like you did.
I agree with Ron i think future global decline rates will come as a rude awakening.
Baggen,
We have pretty limited information on the biggest oil fields in the Middle East. The best onshore data is from the US and Russia. The US conventional lower48 (excluding Alaska) onshore output.
In chart below for US note that the rate of decline was pretty steady from 1986 to 1997 at about an annual rate of decline of 3.5%/year. The drop in World oil prices in 1998 (about a 33% drop in price) probably was the reason for the steep decline in 1997 to 1999, but notice that from 1999 to 2010 that the rate of decline was less steep (around 1.9%/ per year). Tight oil output is not included in this data, it is conventional (non-tight) onshore L48 C+C output in the United States. For Russia the breakup of the Soviet Union complicates the analysis, the political turmoil caused a decline in output and since output has mostly increased for the nation as a whole. In any case the “steep decline” thesis depends on a cessation of investment in the oil industry, if demand for oil starts to fall below supply of oil we might see this occur, but that is not likely to happen before 2050 except in the case of a severe World recession, which might occur in 2030 or so. Proper economic policy ( none of the silly fiscal austerity policy followed by the Hoover administration in 1930 or the EU in 2009-2011) may make such a recession short lived, poor policy decisions could lead to Great Depression 2, lack of oil supply will not be a problem under that scenario, it will be lack of demand for oil and low oil prices that will lead to falling oil output, a result of an economic crisis.
Dennis,
First please educate me a bit on the definitions if im correct there so we speak about the same things, i will have a hard time putting words to my beliefs in this subject im afraid but i will give it a try.
Legacy decline = decline rates excluding new production?
decline rate = decline rate including new production?
Are those two correct?
As i read some company presentations where i have interest in they sometimes present their decline rates for a field in one presentation, in the next they have drilled a new well in same formation and decline rates now looks better. In my opinion that is just sort of hiding reality even if by logic the new decline rate for the field in total is correct. Old well is probably declining on at least the same rate as in first presentation its just that its masked by the new well i would say, and that new well will move production forward. But when new wells are no longer possible to mask decline of old wells in same resource it should be an acceleration in decline rate even on that powerpoint i guess.
I simply think a lot of the old giants are coming close toward that tipping point where they will se increased decline rates, and as they do they will have an effect on the global rates simply because of their weight of total production volume that still depends on them.
Well Alice said it way better, i cant really add anything of value.
I agree with you information about fields in Middle East is limited, i just think they are closer to their end than you do. (Im not suggesting im right and your wrong, you are way more knowledgable than me about this stuff and i really appreciate your posts, massive effort and generally awesome attitude.) My guess is simply that decline rates is going to surprise globally in not a to distant future.
Baggen,
There are many who agree with you and many who do not.
There are actually more decline rates than you suggest.
For example what you call legacy decline rate has two flavors.
The more realistic legacy decline rate includes investment spending on ongoing maintenance of existing wells and infrastructure.
The second, often quoted, is the “natural decline rate” of a field, which would be the decline rate in the absence of any new investment either for new wells or for ongoing maintenance of existing infrastructure.
The “natural decline rate” is not very natural at all.
In the real World more wells will be drilled and investment to keep existing wells operating will be done as long as it is profitable to do so.
I focus on the actual output from nations or the World with the decline rate being 1-(y2/y1) where y1 is last years output and y2 is this years output.
Linked below is an old paper from 2009, take a look at figure 13 on page 20. Their model predicts 40 to 45 Mb/d of World crude output in 2020.
http://www.postpeakliving.com/files/shared/Hook-GOF_decline_Article.pdf
This is the kind of result we get when the development of new oil resources over time is ignored.
The future decline rate of World oil output is likely to be around 3% rather than 6%. Not all output is from giant fields and new fields are continually developed. When demand for oil falls by 6% per year, then output will fall by that amount, but not before.
Dennis and others,
Thanks for educating me further.
I do think that geological depletion isn’t the only factor that could knock it up to 6%.
Very little oil has been explored for and found in the past 5 years, plus add on another 10 years to develop what’s discovered
As the contribution declines from the Giants more will have to be provided by the other 50,000 fields that have much higher decline rates. Onshore may be 3.5%, but a lot of new oil is offshore with a much higher decline rate, perhaps higher than it needs to be. I’ve heard that oil is left offshore due to the haste in building these rigs to pay investors off as quickly as possible.
Since diesel is all that matters in keeping civilization alive, and U.S. shale oil is only good for plastics, we depend on heavy oil producers like venezuela, mexico, Iran, and canadian tar sands which are all problematic
I’m not so sure there are a lot of good places to drill. A quarter of remaining oil is in the arctic and can’t be obtained because of ice bergs, nor is it likely fields will be developed on land in Alaska due to the challenges of permafrost.
A financial crash stops or slows much of the exploration and production. Potentially for a long time, since unlike in the Great Depression, we won’t have fossils to recover with as we did back then.
Oil is a global commodity today, but will it be when production declines? If not, that will accelerate the decline rate for nation’s that can’t get oil (i.e. the export land model of Jeffrey Brown).
Though we’ll be just fine, I’m sure most nations will be keen to send us diesel in exchange for U.S. fracked plastic.
“Since diesel is all that matters in keeping civilization alive, and U.S. shale oil is only good for plastics,”
I had missed this point in earlier discussions. Can others here confirm that LTO is not suitable for diesel production?
This is only true to an extent. Because refineries we’re designed over the years to process heavier oils than LTO the ones that exist have trouble handling all the light stuff. And the light stuff has less of the distillates needed for diesel. However, they don’t produce no diesel at all, and refineries can be modified/upgraded to produce diesel from pretty much whatever oil you want, for a cost.
What products you get out from the refinery is a function of both what oil you put into it and what refinery you have. There is some diesel in LTO but not as high as conventional oil. Getting a higher share diesel requires a complex refinery (and is costly). It currently makes more sense for refineries to blend with medium and heavy oil.
Oil demand has over time shifted to higher API oil. LTO is too high but perhaps not that bad. I think the main issue is that supply of LTO has increased very fast and demand was not as responsive due to lack of investments in US refineries and export capacity.
One also needs to realize that tight oil was only 8% of World C+C output in 2018, it might rise to as much as 13% of total output, but still will remain a minor fraction of World output. Lots of gasoline is still used in the World and LTO can produce the gasoline and some diesel, people may be confusing NGL with condensate.
In addition to what Jeff said, LTO is just that Light Tight Oil. Light implies short polymers. Gasoline has (ideally) 8 carbon atoms, kerosene 12 to 15 and diesel 16, or mostly around 16. So you can see that in very light oil, only a tiny fraction would have polymers that long.
In petroleum molecules, the carbon atoms are all in a string. That’s why they call them polymer strings.
Plastics is maybe not a good equivalent word for what gets exported. Canada’s very thick oil is essentially dependent on the flow northward of US LTO. High API liquid dilutes the Canadian oil and lets it flow in pipelines. This is about 350K bpd going north. Lots of it is diluent, and a lot goes to Eastern Canada for consumption there because Canada is so large and does not flow much oil from Alberta to the Eastern provinces.
So that is an application beyond feedstock for plastic manufacture.
Article on LTO see especially exhibit 1.
https://www.mckinsey.com/~/media/mckinsey/dotcom/client_service/oil%20and%20gas/pdfs/797317%20implications%20of%20light%20tight%20oil%20growth.ashx
Great report- thanks Dennis
looks like average LTO diesel content is about 2/3rds of the many comparable source they include (page 2)
diesel is all that matters in keeping civilization alive
Oh, my lord. That’s highly unrealistic.
As Dennis said above, “Trucks can run on other fuel besides diesel, gasoline, natural gas, electrified rail, lots of possibilities.”
Trucks can double their efficiency, and go electric. Rail uses 1/3 as much fuel as trucks, and can be electrified. Both trucks and ships can run on NG, hydrogen, methanol, wind and solar (at least partly), synthetic fuel, etc.
China is setting an example by converting its buses very quickly from diesel to electric.
This idea that diesel is essential is very unrealistic.
Nick G the point is its essential today and tomorrow and for the foreseeable future. Yes trucks can run on others things but they don’t.
Richard S,
Nick’s point is that use of compressed natural gas is a proven technology, as is rail both diesel hybrid and electrified, commercial EVs are coming. There is no technical reason that more commercial vehicles cannot switch to energy sources other than diesel, high oil prices will move the industry in this direction and as it ramps up will be found to be cheaper than diesel so that companies that do not make the switch will be at a competitive disadvantage, the changeover will probably take 10 to 20 years.
Baggen,
Decline rates for Mexico, Norway and UK in chart below, about 4%, 5%, and 6%. The decline rate for all three together from 2004 to 2018 is about 4.6% per year.
Dennis,
So these are decline rates including new production then for each country?
I think that is a bit of a false reality to look at it like that, it has worked so far in history and was only depending on money, oil price and perhaps new technology. But when geology starts to matter more and more and you cant put more wells in the reservoar even if you have the cash and the price of oil is high. Then we go back to i think you called it “natural decline” i simply think that that scenario is not that far ahead in the future for some old major fields and that it will have a noticeable impact on global decline rates.
The norway example above is interesting to me, this year Johan Sverdrup will come online and it will ramp up to first fase plateau in 2020. Norways production in 2020 will likely exceed its production in 2019 because of this one field. Would you say Norways decline is 0% or simply state that they are increasing production (and therefore have no decline rate)?
2023 Johan Sverdrup reaches fase two plateau with 660.000 boepd, when this stage is reached the decline rates of the other fields will no longer be masked by this field and i expect we will then start to see decline rates increasing again even if the shear volume of JS field will blend that also to some extent.
Did you expect global decline rates to be lower than for these countries?
(I will respond to your other post when i have more time)
Baggen,
Data for chart at page below
https://www.eia.gov/totalenergy/data/browser/index.php?tbl=T11.01B#/?f=M&start=200001
Yes it includes all output as I only have output data, not individual well data for the 500,000 to 1 million producing wells in the World.
If you have access to such a database, I would love to see that link. 🙂
I look at what has happened historically. The US is the most mature major oil producing nation. If we exclude Alaska, Gulf of Mexico, and tight oil production and focus on 2000 to 2009 (where we have tight oil data) the decline rate was about 2% for US C+C output and from 1985 to 2000 for US less Alaska less GOM the decline rate was about 4%. Less and less of World output will come from Giant oil fields as they deplete and the World decline rate will likely look much like the US.
One possibility for higher decline rates is that World average extraction rates for conventional resources are increased to keep output on a plateau from 2018 to 2050, then we can assume that extraction rates decrease due to lack of demand for oil. In that case decline rates will be high due to lack of demand for oil.
We seem to be asking different questions. I am trying to evaluate what rate output will decline for World output and I have a specific model that tries to address that.
New oil resources are continually being developed, that is what is being missed. As these new resources are developed it lessens the overall World decline rate from some hypothetical scenario where all new development of oil resources ceases. You seem to think that hypothetical scenario is the more realistic one where I take historical output, discovery, and rate of development and attempt to model future output based on this history.
See paper by J Laherrere at link below especially appendix at the end, he expects 215 Gb for URR for extra heavy oil and 2600 to 3000 Gb for conventional (not extra heavy) oil URR, so roughly 3000 Gb for World C+C URR. About 1370 Gb cumulative C+C output had been produced at the end of 2018, so roughly 1600 Gb left to produce. His expectation is 3.5% decline rates (this might be too high in my opinion).
https://aspofrance.org/2018/10/03/updated-extrapolation-of-oil-past-production-to-forecast-future-production/
Plateau model with high decline rates below, the average annual decline rate from 2052 to 2098 is about 4.7%/year for this scenario. Note that I do not believe this is very realistic, it is to illustrate how difficult it is to achieve the high decline rates that many believe are realistic.
clicking on chart will give larger view.
Dennis,
“Yes it includes all output as I only have output data, not individual well data for the 500,000 to 1 million producing wells in the World.
If you have access to such a database, I would love to see that link. ?”
Of course i dont i asked just to make sure we were talking about the same definition of “decline”. I realize you focus on the world production as that is what you are aiming on predicting and then you include all new production as you should.
Im more interested in the underlying decline rates that will be masked by new production forcing us to run faster and faster on that thread mill and drill more and more wells in more expensive locations, in smaller reservoars and with lesser geology only increasing the pace we need to keep doing this to continue clinging on to historical decline rates (including new production).
My belief is simply we are running towards the end here, old super giants needs to be replaced with production from a lot of lesser reservoars and it will be harder and harder to do it. Hell we are drilling the source rocks like mad now for a reason, its the only option left more or less.
For me you can also look at single countries and sort of see the future, as in the end the production profile will be going down for every country. I think we sort of agree on this one but we are guessing on different timing of and angle of that global slope. You are using a way more sophisticated method and you could describe my belief as “a hunch”. I do follow your modells with great interest.
“We seem to be asking different questions. I am trying to evaluate what rate output will decline for World output and I have a specific model that tries to address that.”
Yes i think we are talking past each other somewhat here but not entirely. I more or less base my view on that i think the Saudi and the ME countries has less oil left then officially stated and also that they are working extremely hard atm to maintain the appearance that is not the case. I can of course not prove this but it is my belief, and if that should happen to be correct i think that situation will shock the world sometime in not a to distant future and break the old modells or modells based on historical data.
I guess time will tell.
Baggen
Read the Laherrere paper, he knows much more than me and goes into a lot of detail covering 35 countries. You could just focus on the part where he covers OPEC.
https://aspofrance.org/2018/10/03/updated-extrapolation-of-oil-past-production-to-forecast-future-production/
His URR estimate is 2800 to 3200 Gb for World C+C and he expects a decline rate of about 3.5%.
Dennis,
“Read the Laherrere paper, he knows much more than me and goes into a lot of detail covering 35 countries. You could just focus on the part where he covers OPEC.
https://aspofrance.org/2018/10/03/updated-extrapolation-of-oil-past-production-to-forecast-future-production/
His URR estimate is 2800 to 3200 Gb for World C+C and he expects a decline rate of about 3.5%.”
I glansed at it, its a lot more then i have time to read and i would probably not understand it good enough either. It looked like hostorical data was used together with old decline rates to predict future ones. I simply believe there might be an issue with that and that future decline rates will be different from historical ones.
Old onshore giants dying and they need to be replaced by offshore and shale both having higher decline rates.
Im sorry but i must ask again to understand your point of view.
If we have a field: year one it has one well “A” producing 10.000 poepd in average
Year two: well A produces 8000 boepd in average, well B in same field new well produces 3000 boepd average for year two.
What would you say is decline rate for that field?
Hi Baggen,
The field would have increasing output.
Let us assume further that Well A started producing on Jan 1, 2017 and Well B started producing on Jan 1 2018, so output for the field was 10 kb in 2017 and 11 kb in 2018 so the field decline rate would be -10% (that is output increased by 10%).
In practice we do not have output data for individual wells within a field for most cases, though with a subscription to shaleprofile.com one can get this data for some tight oil plays, it is too expensive for me.
In most cases we have state level or nation level data, there is some ight oil play data available for free from the EIA, but individual well data is expensive and there are probably 750,000 wells producing oil World wide (about 500k in the US alone).
Consider also the following post from June 2014
http://peakoilbarrel.com/oil-field-models-decline-rates-convolution/
There’s a number floating around pushed by a watchdog org called Global Witness claiming that ~$5 trillion will be invested in fossil fuel exploration in the coming years.
https://phys.org/news/2019-04-tn-fuel-exploration-incompatible-climate.html
Considering that 1.36 trillion barrels of oil have been consumed so far, it will be interesting to see exactly how all this money can be spent on exploration.
As someone noted on POB, and paraphrasing, at one time oil was a wealth-producing commodity, but now that it is being significantly depleted, it has become a wealth-consuming commodity.
Great work Dennis, as always
Tell that to the Norwegian Sovereign Wealth Fund.
It’s a world of definitions. “New discoveries” happen if the price rises. The oil was always known to be there, but you call it new discovery because it appears on reserves numbers when it had not before the price jack.
Another nice definition aspect of “exploration” could be money pumped into enhanced recovery tech. That can be exploration money spent without drilling a hole.
Seemed to have missed the significance of $5,000,000,000,000.00 in investment toward exploration.
In 2015, the federal budget of the USA was less than this, at $3.8 trillion.
What exactly are they going to spend the money on? Supercomputers? Boreholes? Prospecting missions to Mars (part of the Moon) ?
Well, $70B is a typical year of exploration budget for all the oil majors combined. 2014 was $95B. $40B in 2016. That’s from a 2016 WoodMac report.
5T / 70B = 71 yrs. And note that is oil only, not oil and gas.
The climate change article you linked has this:
“Yet oil and gas giants plan to invest trillions of dollars in exploring and developing new fields in the coming decades.”
Since they say decades, plural, and add in gas, there’s nothing wrong with the math. Since gas is not included in the 70 yr number above, if you do so, it likely reduces to whatever, 30 yrs. Nothing wrong with the math.
I rest my case. Accountants will believe what they want to believe.
https://imagizer.imageshack.com/img921/2408/WHJEzT.png
The point is that new oil discoveries are on a downward trajectory. By your accounting they will be investing the same amount every year for the next 70 years, yet the numbers say they will be finding progressively less each year.
https://www.iea.org/media/news/2017/Crudeoilresources.png
Seems there is a huge diflict in US what EIA means is produced of oil and how much is stored of oil. They mean one reason might be liquid from gaz production is added in the oil pipes.
https://www.rigzone.com/news/wire/where_is_all_the_missing_us_oil-07-jun-2019-159018-article/
Giant Fields in Arabia are produced till last 10% OIP restricts EIOR and then output 1.5P with horizontal wells fall off w/o 2P CO2 type recover introduced (aka recession, no funds).
Has there been a giant field in KSA that has stopped producing?
fyi
https://aspofrance.files.wordpress.com/2018/08/35cooilforecast.pdf
https://www.spglobal.com/platts/en/market-insights/latest-news/oil/050619-delek-us-expects-tight-export-facilities-to-widen-midland-meh-price-spread-in-q4
https://www.fool.com/amp/investing/2019/06/08/another-new-gas-pipeline-is-coming-to-the-permian.aspx
Gas pipeline in Oct 2019 will alleviate flaring. More gas and oil pipelines on the way. The nearest term oil pipe will be about the same time to Corpus, where they may be still struggling to expand export capabilities. Clear access from Midland to out of Corpus by 2019 is pretty questionable.
Actually, this whole expansion concept has a lot of questions to me. Originating from the production point, including who owns the production. The only point they seem to be struggling with, now, is gas. Midland oil price differentials have pretty well eroded.
https://issuu.com/txrrc/docs/2019_sitton_energy_market_outlook__?e=22468551/70381247
RRC does not seem so positive on Texas growth 2019. 100 to 200k bbls per day more. That is a slight contrast to Rystad’s 1.5 million.
Quite a divergence on shale increase. On one hand, you have Rystad projecting a 1.5 million barrel increase per day, and on the other hand, you have one of the heads of RRC projecting maybe a 120k barrel increase a day. Er, I think I go with the RRC guy, and say flat to up a little. It matches reality as I see it. By the time the monthlies are posted by EIA, the excess projections have been mostly eliminated. That matches the RRC guy, it does not match Rystad. Completions in Texas remain mostly steady. Active rigs are down. The trend, so far this year, is flat to down. Less permits, and ad naseum. But, everyone is going with EIA projections, which are constantly being adjusted due to lowering drilling info data, which has its estimations adjusted each month. By March of next year, all will be adjusted to flat. Until then, everyone stays confused.
And then next year, the estimations will actually start of lower than actual. It’s been there, done that. And keep in mind that IEA’s recent projections include plenty of ghost shale production.
GuyM,
RRC may expect low oil prices. The Drilling Productivity report is not very good and that causes a great deal of confusion. I used to think the tight oil production estimates were pretty good, but lately they have been too high, good data is hard to find so we are flying blind.
Yeah, flying blind is an excellent personification. Your flying your airplane using whatever bellwethers work, and I am flying with an antiquated compass and sometime altimeter, but we do appear fairly close to flight plan. See you out my window, anyway. We may not wind up in LA as intended, but at least we will wind up close to the same location.
The last location we sighted together was the March EIA monthly. It’s an excellent location identifier. May be a little high based upon our Russian professor, but I don’t think it will be off much by now. Matter of fact, as of this month, I am giving up my $10 a month subscription to the RRC pending data file. Trying to prove the EIA monthly report wrong, is simply not worth it. It’s as accurate as they get. Can’t say the same for the rest of EIA’s “data”.
They use a lot of drillinginfo data. While, after the third or fourth month, that data is good as gold, much of their current numbers are sheer estimates. They obviously don’t have real time update estimates, and it takes a long time to straighten it out. Drilling productivity reports are meaningless “data”. Apples times oranges to equal how many bananas.
It will be mostly flat to very little up in 2019. Now, where does it go in 2020? No matter what the price of oil, the majority of independents are locked into the situation they created over the last ten years. The increases will come from the majors, and a few like EOG who are living within their means. Majors will increase, but if you do a comparison of that increase to acreage held, it won’t be much. And the majors will be circling the dying independents. Again, the majors are going to want that oil for their refineries, not export. The great Permian expansion is questionable, in my guess.
So, in 2019, we get minimal expansion, at max 300k, and probably a lot lower than that. In 2019, we may get 500k, and that’s pushing it, IMO. After that it may drop, Quien sabe? Plug that into your IEA projections.
GuyM,
The majors are planning some pretty big increases in output, the stronger independents will buy up the decent assets of the independents that go bankrupt and possibly the total independent producer output will remain flat, I think US tight oil can easily reach 8.5 Mb/d by 2023 and possibly may get to 9.5 Mb/d by 2025, much will depend on the price of oil which I expect will reach $100/bo in 2018$ by 2023. I think oil prices will increase by roughly $8/bo (2018$) each year on average from 2018 to 2023 (12 month average price trend) and then increase at a slower rate thereafter (this scenario assumes no severe recessions from 2018 to 2023).
Heads up.
Concerning the story of organic chloride contaminated Russian oil and the whole theft scenario with dilution the only solution to the problem.
It’s looking bogus. I’m beginning to suspect anti-Russia propaganda.
Various articles are out there on how to remove organic chlorides from crude. It’s a straightforward process. It can be applied at either end of a pipeline. It does not rely on dilution of the concentration down to refinery acceptable levels. The theft process would have no reason to add extra organic chlorides to what was to be put in the pipeline, so at worst — if any of this is true — what would be put in the pipeline is oil from the ground that had not been chloride processed. This stuff would not have extra chloride in it. It would just be unprocessed.
You can do that processing anywhere. It’s absurd to think the only solution is some 100X clean flow that will dilute the levels down. The refineries may not be equipped to do the process because they have not needed to, but Rosneft could come on site and do the process. Has to be a zillion times easier than flowing clean oil for years and find storage for the bad stuff awaiting dilution.
“The refineries may not be equipped to do the process because they have not needed to, but Rosneft could come on site and do the process. ”
How long does it take to build the reactor? Is there construction capacity available?
What I have read is that the German refineries are really pissed and the Russians will face highe fines.
As a technical trader i trained myself to ignore the news and ignore what analyst are saying. Just trade what i see. Ignore what the FED is doing or what the POTUS might say in his next tweet.
Technically all three major US stock indices are rallying back towards trendline resistance. The same resistance that just slammed them down. What your going to get here is a sellable rally. USD/JPY broke out of it’s 4 year long triangle to the downside. Not the topside. This in itself is very telling that last weeks rally in stocks has no legs. USD/JPY should be headed higher and it’s not.
WTI also had a nice rally last week. If stock rally doesn’t last which is what technicals are pointing to. Then rally of price of oil won’t last either.
I still stand by my call that we will $20 something oil before we see $70 something oil again.
Keep in mind that i don’t care which way markets are headed. My opinion is not bias either way. I don’t care if its a bull market or bear market i can trade it either way.
Dennis is claiming $70 oil by OCT 2019. I’m just not buying into that idea at all.
I’m just hoping we reach trendline support by OCT 2019 on a WTI chart. That way i can see if support develops there and higher prices are on the way or support breaks down and $20 something oil is visited.
And few of us, if any, buy into yours.
GuyM,
Just because you don’t like me or you don’t like my point of view doesn’t mean i’m not right.
Year or so from now you’ll be sitting around wondering how on earth did HHH get it that close to calling it right. I won’t be off by much at all. Guess it will be all chalked up to a lucky call because technicals don’t matter.
I don’t have any negative feelings, and time will tell which point of view is correct. Your entitled to your opinion, and so is Dennis. Time will tell. But, your calling your opinion correct before time proves it, at least Dennis leaves an option that he could be off. If oil gets down to $20, you get my apology for disagreeing, hows that?
My opinion is based on what all market participants are doing with their money. That is what a price chart represents. Dennis is basing his opinion on a gut feeling that all will be ok in the economy and market at least until we get to around 2030 and that his math is right.
His math is right. But his gut feeling about the economy rolling along for awhile isn’t. Matter of fact it’s being priced into these charts that not all is ok nor is it going to be ok.
Demand for oil can decrease, but there are limits to how much. If supply after those drops is still less than demand, then prices won’t decrease just because the economy stumbles. At least that’s been true for my 72 years.
I get the feeling that HHH does not seem to understand game theory and the inherent limitations of just watching and reacting to the market.
HHH,
Actually I just assume the economy will roll along as it has over most periods, nobody can predict an economic crisis in advance.
Also I am not looking for daily spikes, I am considering 52 week average oil prices. It is likely supply will be less than demand for the foreseeable future (10 years or more) and that indicates oil prices are likely to rise.
And I may well be wrong on $70/b for Brent nominal prices by October 2019 (monthly average price). Things are difficult to predict with an unpredictable president.
Dood, it’s not enough to be right. You have to be right a statistically significant number of times. And the burden of proof is on you.
Anddddd, if you’re wrong that doesn’t matter either. You could be wrong this time and still be right a statistically significant number of times. But there is no evidence of this.
Just take solace in knowing none of the price predicting people using any method at all achieve statistical significance. It’s not a random process. It’s worse than random. It’s whimsical.
Watcher,
How long do you think we have until everybody in the room so to speak wakes up to the fact that Central Bank intervention doesn’t mean much?
ECB has dropped rates to where and printed how much? And they are still struggling. FED is about to cut rates. I’m going to go out on a limb here and say those rate cuts won’t change a damn thing. They won’t make any of the other numbers better. They won’t jump start growth.
How much time do we have before people start realizing the party is over. When participant by participant comes to the realization that they can’t fix it. What is going to happen then?
Now i know you are a big fan of numbers particularly ones on a screen somewhere not meaning anything because they can be changed by decree. But what happens when numbers on a screen somewhere don’t deliver us the results promised to us by government even when they are changed by decree?
I already have my own thoughts and answers. I really don’t believe we have ten more years of current path. More like five years.
HHH.
I assume you believe oil will go very low because the US dollar index is going to go much higher from here?
The end of QE occurred around the time commodities collapsed (one of the primary causes IMO).
What if US reversed course and tries to weaken the dollar? Or do you think that is impossible?
https://tradingeconomics.com/
Use this link to pull up a dollar index chart. Pull up the monthly chart and back the chart out to where you can see all the way back to 2008. Think you can actually see the chart all the way back to 1985 but just look at the chart during all the years of QE. Dollar was at it’s lowest point ever prior to the 2008 crisis.
Which means QE failed to weaken the dollar. Near zero interest rates failed to weaken the dollar.
You can actually look back all the way to 1971 on their chart.
Under FX click on DXY that is the dollar index.
HHH. That is because many others were actively trying to weaken also?
I’m not saying the US can weaken the dollar as much as it was 2008-14. However, $20 oil implies a much stronger dollar than at present.
If US cute rates 2-3 times before end of 2019 would you still call for $20 oil.
I don’t see $20 oil in 2019 more like late 2020 early 2021. Just judging by distance needed to be covered on a chart.
How many rate cuts are there until we get back to where we were before they started hiking? Any temporary dollar weakness would be follow by strength as the rest of the world are sure to do cuts and loosing of policy after we do.
But truth is everybody that matters. Their interest rates are going to zero. And truth is it’s all going to end badly. Nobody wants to eat their peas. Instead everybody pretends to be solvent when they are not.
Only way to keep this going and even then it won’t last too much longer is an ever increasing amount of debt at an ever lower interest rate.
I also don’t see EU staying together much longer which will give the dollar an enormous push upwards. But that is just an opinion. Until it actually happens.
Do US rate cuts change your view, regardless of timing, be it 2019-21?
Also, US is setting up for a major crop failure. Wouldn’t that affect your prediction?
Rates do not change my opinion. I believe US farmers will get a government bailout. Food inflation is too big of a risk not to.
Inflation on a large scale is just as big of a problem as deflation on a large scale. There will be no Paul Volcker raising interest rates at the FED.
It’s going to be interesting to see how that plays out. You can bail them out but that doesn’t mean more corn will be harvested this year.
I have been paying close attention to the grain market experts. All are saying the funds are underestimating how short of a corn crop there will be and how many acres will not get planted at all.
Anecdotally, just driving across MO, IL, IN and OH makes it clear how late this crop is. Still many fields where nothing has been done. Haven’t seen much corn above ankle high. Have seen almost no soybeans at all that have emerged.
HHH Wrote:
“I don’t see $20 oil in 2019 more like late 2020 early 2021. Just judging by distance needed to be covered on a chart.”
Fed will be much quicker to use QE to prop up the market this time. In 2008 the Fed was reluctant to act to see what would happen with no intervention. But it was apparent by 2009 that the US & the rest of the world was plunging into a depression.
My guess if the rate cuts don’t work and there is a slow down, they will return to QE and do what ever it takes to avoid deflation. The US & the rest of the world is much deeper in debt, and also much closer to the demographics cliff.
We also have war-drums beating for Iran, as the US desperately wants control over Iranian Oil before the Shale bubble bursts.
However, Since the Iran has nukes its not going to be a push over like Iraq\Syria\Libya, etc. Venezuela is also on the hit list and will fall under US control sooner or later.
Okay. Look. Money has value only because you think it does, and your counterparty thinks it does. It doesn’t matter if it’s gold-backed or what. That’s the source of the value. Imagination.
It’s not just blind belief. It’s willful belief. Every person or instrument of power derives it from money so they are NOT going to allow threats to their wealth or power, so their willfulness becomes aggressive in the face of any threat. (See bitcoin).
So when you ask and think about time frames for it all falling apart, do not underestimate the power of collective insistence that it all hold together. This is the one huge difference from the past. CBs don’t compete anymore as advocates for their own countries. They get on the phone and they cooperate with each other in actions taken to keep the wheels turning. They don’t maneuver to undercut the adversary; they maneuver to help the adversary because pretty much all adversaries are a systemic risk.
So don’t ask when it all falls apart. It actually already did in 2009. But you can paper over the event and pretend it didn’t happen — because that’s what willful belief does. It keeps the wheels turning.
Only oil scarcity will put a stop to it.
Only oil scarcity will put a stop to it.
I agree.
I tend to believe Ron has it pretty close this time around. If not spot on.
Central Banks will turn on each other when needed.
Currencies will be targeted for take down. You don’t have to fire weapons if you can put a dent in consumption somewhere equal to the amount of decline in production.
That dent in consumption can actually be spread around.
Dollar is doing some funny stuff. The dollar index itself i’ll have to wait till tomorrow close to be more sure but it looks like it’s going to print an inside daily candlestick. That just so happens to be right at trendline support for the dollar index. Which is very dollar bullish.
You can go look at the dollar against every other major currency and see the set up in the making. Expect the JPY or japanese yen for anybody that doesn’t know.
Something is fixing to break here and it’s not going to be good.
And yes you can see it in the charts before you know exactly what that something is going to be.
No. Currencies will not be targeted for takedown. If that were to take place, we would already have seen it with the Japanese Yen. They have a shockingly high debt to GDP ratio, they do ongoing QE, their CB owns about 50% of their stock market, and they import every drop of oil they burn.
There has been no devastating fall in their currency.
It’s an interesting conspiracy theory, but it does not seem reasonable to expect central banks to coordinate their phone calls to decide which country they’re going to starve to death. I suppose we could imagine the relevant bankers in the phone calls imagining that they can just command a reduction in oil consumption with no death consequences, but that seems like a stretch.
HHH,
I have no skin in the game, just calling it like I see it. I don’t do chart reading, darts work much better. 🙂
Yeah, I found the best results with darts is while blindfolded. Otherwise, you catch yourself aiming at something.
Fundamentals I can sometimes reach a fair conclusion from. Although, I do like to work with the more basic stuff. Like, I haven’t eaten in a day and a half, so that grumbling in my stomach, probably means I’m hungry. Don’t want to get too far away from the basics.
@HHH
I very much enjoy your posts. Keep them coming!
I would very much appreciate it if you would get in contact with me;
rune.likvern[at]gmail[dot]com.
Great article!
Great! Interesting!
Frackporn Delux. At some point, the MSM will wake up, smell the coffee and do some math.
“The industry now finds itself at a crossroads. With capital markets beginning to shun shale drillers, consolidation is likely the direction the industry will take. The best bet for struggling companies now is to find a willing buyer. But several oil majors have recently said that shale drillers are fooling themselves with their asking prices.” Could water contamination issues & plug and abandonment costs result in E&P firms with little positive equity?
https://oilprice.com/Energy/Energy-General/A-Gusher-Of-Red-Ink-For-US-Shale.html
http://insideenergy.org/2015/10/01/the-rising-cost-of-cleaning-up-after-oil-and-gas/
That’s a discussion of P&A costs.
Synopsis: $10K is a typical cost, some less some much more. $10K is typical and $10K must be submitted as a bond to the state on day of drilling. State takes that money to fund P&A if the company goes bankrupt. If it does not go bankrupt it funds the the P&A itself. Don’t know if they get a refund.
Watcher.
It costs $5-6K to plug a 900’ cased wellbore. That’s if everything goes right. That doesn’t include cost to remove equipment and restore location
There is salvage value in the equipment, but that is very dependent on equipment demand and steel prices if the equipment will merely be scrapped.
I’d say it will cost six figures, maybe a quarter of a million to plug each shale well and restore the surface location. This is before salvage. But, in a down market what demand will there be for all of those 640 Lufkin’s?
Mike would know better than me. But $10K, no way will that cover more than plugging a 500-2,500’ vertical hole with 8 5/8” surface and 4 1/2” long string. Again. If all goes well.
100,000 shale wells, if suddenly oil and gas go to near worthless, would cost $25 billion to plug if you are lucky. Add another million conventional onshore wells, you are probably looking at an additional $50 billion to plug all of those. I haven’t even started on offshore, I’m sure GOM would cost more than those two numbers combined.
Then try figuring the cost to decommission all of the refineries and pipelines in the US. I figure that would be even higher than decommissioning the upstream assets. I know of a 70K barrel refinery that closed in the 1990s. There is still a lot of heavy equipment out there moving dirt around 25 years later.
Then there are the job losses.
Decarbonizing will surely be a very disruptive event.
Good grief. That is basically all I can say. Nobody it seems has learned very much about the oil business, about the cost of reserve replacement, decline, depletion, how to do well economics, what the true cost is of TRR reserves…take the comment about oil reserves being a big giant pit with a “pipe” going in and a pipe going out. Holy schnikes. And the fact that money will just keep getting dropped out of helicopters to keep the world in oil and gas because it simply cannot function without it? Right.
I’d say $25bn is probably right to make the current shale oil industry environmentally compliant with a pissed off American public who is already climate change crazy and just waiting for 2020. For a start. Not including pipe in the ground and all that other stuff you can see above ground. Will the public be as willing to drop helicopter money on that problem? Most of the stuff in the Bakken is radioactive NORM hot, how are we going to dispose of that? I know, where does Watcher live?
We’re losing ground, Shallow. Nobody has been listening; they are all bat shit, internet crazy. What is the CME strip out to 2030? About a dollar less than current prices. Hope, however, is a good thing? Money is nothing, but on the other hand, its everything, right?
I listen when you guys speak out. And, it is, bat shit crazy, and that may be a vast understatement.
Mike. I know my numbers were just back of napkin variety, but I assume shale has vastly understated P & A plus land remediation costs. NORM is a good point, I assume that is present in all of the shale oil basins to at least to some extent.
If oil stays at $50 for the next 11 years pretty much all of the equity and most of the debt of the US shale industry is worth $0.
We have been monitoring the methane issue closely. The DOE in cooperation with operators in several states is conducting a study of stripper well methane emissions. EPA said if something like this wasn’t done, there would be no chance of a stripper well exemption.
We do not have one well that will burn a flare, there simply isn’t enough gas. Most of the wells we drilled 2006-14 would not burn a flare, the few that did burned a flare for a matter of weeks. Dead oil here.
However, 300 scf per day isn’t much gas, and toting an $85K camera around to every well periodically and completing 100’s of hours of reports on the same won’t work at $50 WTI either.
I hate to say it, but I think HHH is onto something with his focus on the dollar. Oil will not recover unless the dollar weakens.
Russia can make $40 oil work because dollar/ruble has went from 1/28 to 1/62.
Rune’s work is unfortunately convincing me more and more that the oil price in US dollars cannot be predicted, not explained by Econ 101 supply and demand graphs.
Mike, when US QE ended, those of us who sell energy and food commodities were screwed.
Really depressing to know that we cannot have better commodity prices in US without the Fed cranking the printing press.
shallow sand,
Does an estimate of $50/b for the next 11 years seem like a good guess for oil prices? In my EV transition scenario I ignore increasing use of oil for air and water transport, farming and the multitude of other uses besides road transportation. In short the estimate for demand to fall below oil supply in 2033 is likely to be wrong, it will be sometime after that possibly 2040. Eventually the wells will need to be plugged, a lot of them are in Texas and Mr. Shellman seems to believe the RRC has a handle on that problem and perhaps the rest of the producing regions do not, I have no idea.
In any case oil(C+C) consumption has been rising at about 800 kb/d each year on average from 1982 to 2018. So by 2025 if that trend continues the World will need 87,650 kb/d of output to satisfy demand. The peak in output is likely to be more like 86 Mb/d in 2026, but demand will reach that level by 2022.
I would submit that despite fluctuating exchange rates (which are just as difficult to predict as oil prices, ie not possible) that a lack of adequate oil supply to satisfy desired consumption at $50/b will lead to oil prices that are considerably higher than $50/b. It is possible that a recession might reduce demand, but despite every effort Trump makes to cause a recession, the World economy may prove more resilient than most old men believe.
If there is a recession for the next 11 years, then I will be wrong, but I would put the odds of an 11 year recession from 2020 to 2031 at about one trillion to one.
Dennis.
I really don’t know what the oil price will be from now to 2030.
I hope it is higher than $50. I hope there is another time like 2005-14 (minus the financial crisis) so we can get out in one piece. We will fare poorly ourselves with $50 WTI over the next 11 years. Production will continue to decline slowly, expenses will continue to increase slowly.
It has been eleven years since WTI hit its all-time high and five years since WTI began its decline from over $100 to where we are now.
Who would have predicted the oil prices we have seen from 2015 to now in 2008 or June, 2014?
Who would have predicted US oil production hitting over 12 million barrels a day in the face of low prices, tremendous cash burn and hundreds of oil company bankruptcies?
Who would have predicted that governments would allow the flaring of gas from shale wells equal to gas consumption in several states? That gas would be worth less than zero at times?
Heck, who would have predicted in 2008 or even 2014 that Donald Trump would be President of the US, and that he would insult a former POW, call a former VP of the US a dummy and mentally weak, praise dictators, and think that tariffs are “great things.”
I know you like to make predictions about oil production, consumption and prices, and there is no fault in that. However, there are just too many variables.
Around thirty years ago my parents gave me a small amount of stock in Coca-Cola as a graduation gift. They said, “hang onto this, it will be worth a fortune someday.” Look at a KO chart for the period prior to Y2K. Pretty impressive. Since Y2K. Pretty much nothing. Wish they had given me a small amount of Apple stock instead. But 30 years ago, Coke looked like a much better investment.
Too many variables. Just like strong dollar. It is far from the only one with regard to oil prices, but it matters.
“I know you like to make predictions about oil production, consumption and prices, and there is no fault in that. However, there are just too many variables.”
That’s how I feel. I’m not confident that we can predict a logical response based on supply, demand, and price. There are too many actions being taken that seem ill-advised. People, governments, companies embark on activities which may hasten their demise rather than prevent it.
Does it make economic sense to spend so much on military hardware when other threats are more likely? Does it make economic sense to build a wall if a country is coming apart within?
We can plot how the future of oil is supposed to respond, based on price, but can we be confident that with enough money more oil will be produced?
Thanks Shallow Sand,
Yes I would not have made any of those predictions correctly and will also not be able to predict future oil prices. Just trying to understand your take. Am I remembering correctly that you had suggested in the past that something like $55 to $65/b worked out ok for you?
Has the change in regulations pushed your costs up?
My point is that many suggest that oil is likely to be short even with higher oil prices (you might not agree with that, but it seems to be common view.)
I think if oil prices remain at current levels that oil supply is indeed likely to be short of consumption levels at today’s oil price. A recession would change this so that perhaps supply and demand would balance at today’s price with lower economic output.
I don’t think a recession can be predicted any better than oil prices or foreign exchange rates, perhaps oil prices will remain low. Many seem to think that is the case, in that case the only logical reason this would occur would be that we are in a recession, but it is not yet apparent.
https://www.cnn.com/2019/06/03/economy/us-recession-risk-nabe/index.html
“I hope it is higher than $50. I hope there is another time like 2005-14 (minus the financial crisis) so we can get out in one piece.”
Oil prices will likely go back up once the Fed restarts QE. Clearly This boom cycle is getting very old. I believe its now one of the longest cycles in the past 40 years. Consumer CC debt is now soaring, Auto loan deliquencies are rising, and home sales have flatlined. Is the US consumer finally tapped out, or will lenders find new & creative ways to keep heavily indebted consumers to borrow & spend more? Recall that when the consumers started getting tapped out, lenders created interest-only loans, & loans that permitted borrower to take out 20% more than the value of their homes to keep the game going by another year.
Oil will likely start rising as the US makes preparations to go to war with Iran. Perhaps the USA will attack Iran in 2020 or 2021. At this point its apparent the the US is comitting to a war with Iran.
Mike,
The futures market gets oil prices right about as often as I do. 🙂
Approximately never. You have always been correct on future oil prices, we don’t know what they will be, period.
That is why I do several scenarios with different future oil price assumptions so that with the given set of assumptions about producer behavior (rational profit maximizing behavior), well costs, transport costs, LOE, royalties, taxes, etc, and oil prices we can see what output might look like if the assumptions are correct.
Low oil price and AEO tight oil scenarios below, note that the Brent WTI spread has typically been about $9/bo for the past 3 years or so, so a $70/b Brent price (low scenario) is roughly equivalent to $61/bo at that price spread. This spread may change over time.
Shallow sand,
Watcher’s synopsis was incorrect the article says in Wyoming the average will be $ 100,000 per well on average to plug abandoned wells. So your guess would be 250 k per well for the average tight oil well in the US. Oil and Gas will not become worthless, eventually oil prices will decrease, perhaps in 2035 or so after an increase from 2021 to 2032.
No it didn’t. There is a graph fairly early in the article that shows the vast majority of their wells in Wyoming to be $10K. They laid out exceptions including a very expensive one that was over a half a million dollars. But the graph showed 280 wells to be around $10,000.
Actually I thought it was meaningful that a search for plug and abandon costs had Wyoming as the state that published this information. I have no doubt that shale wells will be more expensive since they are so much longer, but there aren’t any of those in Wyoming I guess.
Perhaps the correct question here is why hasn’t Texas or North Dakota published plug and abandon costs — and as I mentioned the article notes that the state requires a company to put up money in I suppose some sort of escrow to pay for these P&A costs if the company goes bankrupt. Therefore, assuming both Texas and North Dakota require this advance bond, the number the states require would give us at least a starting point for what they expect shale P&A costs to be.
Clearly, Wyoming expects their wells to cost $10,000.
Wyoming does have a lot of very shallow gas CBM wells that have been abandoned. It also has very shallow oil wells also (1,000’ or less).
Wyoming also has many deep conventional wells and horizontal shale wells are there too.
I should have read the article. It says the cheapest well plugged cost under $600 and the most expensive cost over $500K. Also says the deeper wells will cost over $100K each.
I will stand by my guess for shale wells. Wyoming has some oil wells that are just a little over 100’ deep. I am sure those don’t cost much to plug. It’s all about well depth, so a 20,000+ foot well is going to be expensive to P & A.
Keep in mind it costs about $75K to drill complete and equip a 1,000’ vertical hole.
Shallow, do you know if NoDak and Texas require an upfront bond before drilling to cover eventual P&A. Hard to believe Wyoming would invent such a thing.
The amount required would be useful to know.
https://suretygroup.com/surety-bond/oil-and-gas-well-drilling-bond/
Group bonds in Texas, so you get lesser amount covered, the more wells you drill. Most bond cost is a fraction of the face amount of the bond, based upon credit rating. A good credit rating will enable you to buy it at about 5% of face. So, the bonds are not covering much of the cost. Pretty old system.
This entire issue of plugging and associated liability got started based on an internet link. Unfortunately that is the way most people learn about oily matters these days, thru the internet. On social media I have observed people that ten years ago did not know what the black splotch was under their car, argue with people that have been in the oil business forever…because they read it on the internet. Imagine how frustrating that can be for us actually IN the oil business. I’ve reached a point where it does no good to teach anyone, or correct anyone anymore. The internet is the gospel, once they’ve read it they cannot be taught the truth.
I was involved in “plugging” a well in the Big Horn Basin of Wyoming in 93 that cost $24MM, including the cost of the rig that burned up, excluding lawsuits. The point is that not all wells cost the same to plug, not all plugging procedures are the same for similar wells; putting an “average” cost on plugging is absurd. Not all decommissioning will be the same; landowners demand different things to meet clean up requirements. The TRRC requires equipment to be removed from a plugged location, subject to a healthy fine, but it does not address the extent to which the clean up of the surface estate must occur.
A lot of shale oil companies do have abandonment funds set aside and set forth in SEC filings, but they appear to be grossly inadequate. The “plan” is to dump 20 BOPD wells on little guys who are stupid enough to think they can make money with them, before plugging liability occurs. There are problems all over N. America with orphaned wells… trash in the ocean, brain dead politicians who want to study mushrooms and people shooting each other in Chicago. So what?
Operators in Texas must have a bond, guaranteed thru a bank, etc. based on a percentage of wells operated. It is indeed woefully inadequate to cover P&A costs (it covers no clean up costs) but it is effective if one needs to keep operating other wells. The TRRC does not jack with plugging matters and one better be on their toes, up to code and doing the right thing in Texas now days or they won’t be able to operate profitable wells. Period. All operators now pay a hefty fee to permit new wells and a good portion of those fees go to a plugging fund that the TRRC manages to plug old orphaned wells. Almost all permits or filings with the TRRC contains a surcharge for the abandonment fund. There is new, developing legal precedence in Texas where liability for plugging cannot be passed down the line. We have a handle on it. Other states, not so much.
If folks want to learn about oily matters, pay attention to Shallow. His small well experience can be applied to big wells, and big problems. Most people writing about the oil business on the internet do not know a BOP from BOPD.
Need something to worry about? Worry about all of America’s oil eggs now coming from eight counties in arid W. Texas that have NO water to spare for frac’ing. Don’t buy the internet BS about water recycling and remember all that associated gas getting burned off into the air, so 3MM BOPD, and growing!, can be exported to Asia. Yahoo !!
Thanks, Mike. Way back even in the Eighties, the RRC was a force to be reckoned with on plugging. My brother got stuck with the cost, and he was not the final operator, nor the original operator.
Mike,
In an earlier comment Shallow guessed a plugging cost of $25 billion for 100,ooo tight oil wells (I assume he means in 2019 $).
Would your guess be similar?
Watcher,
From the article:
So, based on the relationship between well depth and plugging cost, Wyoming is looking at a future price tag in the range of of $14.7 million to $19 million for its newest, deepest wells, or an estimated average cost of more than $100,000 per well.
Pretty clear the author concludes 100k will be the average cost for the newer deeper wells.
You are correct, I missed the “newest, deepest wells” part of that quote. I think the point is that the horizontal tight oil wells are similar to those Wyoming new, deep wells”.
When we are all done with the tight oil boom we may have completed 200,000 horizontal tight oil wells and plugging them will be expensive.
Seems Shallow sand would guess about $50 billion to plug all those wells and his guess would be better than mine.
Hi Mike,
That was a conceptual model for those who are not oil producers.
Simply put there are producing reserves at any point in time that have already been developed. Producing oil reduces the amount of oil that remains to be produced in the future. Developing proved non-producing reserves to the point where they start producing oil will add to the already existing producing reserves.
Is this incorrect? I understand that it is more complicated in reality, the model is purposefully simple.
Dennis.
Do you take US dollar strength/weakness into your oil price models?
I am sorry if I missed that you do. I feel really dumb that I haven’t focused on currency issues more. It has been in the back of my mind the whole time, but I have been hyper focused on US overproduction since it is much easier to understand.
The Dollar has been King only since post WWII. That’s a very long time in currency. That’s been due primarily to an agreement with SA, who was the absolute oil king at the time. Past accomplishments are never the last say, and SA is getting fed up with the weak politics in the US. It may remain King for awhile, similar to the UK. No power, in name only. But, buyers can opt for other currencies, and the Dollar as King has a limited lifespan in oil. When oil goes, it is just a matter of time.
GuyM. What is the alternative to the dollar?
We have $22 trillion of debt and counting. But what countries have an economy that can handle the collapse of the US economy.
The US is like the $100 million dollar loan the oil promoter owes to the bank. It is not the promoters problem, it’s the banks problem. $22 trillion of US debt is not just the US problem, it is the world economy’s problem.
Imagine the catastrophe if US defaulted on that $22 trillion. Heck, everyone panicked when Greece was going to default, so it wasn’t allowed to.
Saudi holds a bunch, although they are dumping some. China holds the lions share, and they have been dumping even prior to Trump’s tirades. When China says we will be sorry, it’s no idle threat. In other parts of the world, outside of the US, and it’s idiotic concept that it is the yin and the yang, they hold baskets of currency. So, it equalizes. We are not that far from being the same strength as the peso, if we piss enough countries off. Ok, not true, we have to account for the NYSE, but they just hold enough in their baskets on that, until the NYSE becomes just another stock exhange, but lesser than Bahrain. And, loss of US capital is astronomical. And, it does not have to get anywhere near that extreme to provide destruction to the dollar. Loss of the Dollar as primary exchange for oil would be enough.
Not really a big deal.
If China threatens to liquidate its US Treasury holdings, well, it’s always wise to know what words mean. In this case, liquidate means to sell. And to sell you must have a buyer. If there is a buyer then someone else wanted to own US Treasuries.
And when this subject comes up as it does frequently, people have to understand why China bought those Treasuries to begin with. The answer is there are no other vehicles of a magnitude sufficient to service that kind of liquidity. Or at least that’s the official line. A better phrasing would be — after they sell they have a lot of printed pieces of paper in their hand called Yuan. What are they going to do with it?
Infrastructure projects? You can fund those with created Yuan. You don’t have to spend the new money that came in from selling a treasury. You could spend other money for that. And you could before you ever bought the Treasuries. They bought the treasuries for a reason. There are few if any parking lots for that kind of money.
The bottom line is liquidating their Treasuries leaves them with money that they have to find a home for and there aren’t many homes of the size available from US treasuries.
A central bank can prevent default. I could stop right there but there may be merit in fleshing that out.
Greece was a systemic risk because they were going to default, and their default was going to be denominated in Euros. THAT was the problem. They don’t have a central bank. They were forced to accept more loans on top of the loans they already had and the bulk of the new loans were to service the old ones. That’s all to keep the wheels turning, and at that time they were kept turning on the backs of the Greeks.
No country with a central bank can default. If such a danger appeared, the central bank would create the necessary money to service the debt and prevent the default. Which by the way is what QE functionally is while claiming a different intent.
Talking about dollar strength and weakness is somewhat meaningless because the measurement is against other currencies, one of which is pegged to the dollar by govt decree.
No, the problem in Greece was bad governance, not collecting taxes, not keeping track of where the money was going, and a general climate of clientelism. Being in the euro saved them from much worse.
The future of Greece is probably being what’s it has been for 5,000 years, the southeastern gateway to Europe.
Well, we are all Greek.
5TH Century Athens has dominated the world. Even Asia now.
Shallow sand,
No I do not. Oil price is mostly used for my tight oil models, for both extra heavy oil and conventional oil the price of oil is not explicitly included in the model. It is simply assumed that oil price adjusts to balance production and consumption of oil.
Real Dollar index at page below.
https://fred.stlouisfed.org/series/TWEXBPA
Thanks for the link, it is quite strange Rystad on one hand sees a sharp increase in shale oil in 2019 and at the other hand knows 9 of 10 shale Companys are not able to generate profit. Who will pay for all the new wells and the completation of DUCs needed to replace a significant decline and secure the millions of barrels in growth.? I did not know the fracking Companies also have huge economical problems, guess they have problem to get payed for their jobs… Good Mr. President manage to get a deal with Mexico, but still there are many Countries that have weak growth.
Thanks Dennis for your post. I appreciate you being transparent on your assumptions. Would be interesting if those who argue for demand restricted models (especially peak demand in near time) would post a similar piece (Nathanael?).
Frackporn Delux II -more xxx – dood NG is Awesome
https://www.zerohedge.com/news/2019-06-10/energy-dominance-or-flatulence-shale-drillers-bleed-cash
Thank you Peak Oil Revere, Baby Doomer and Jeff.
I don’t have the knowledge to estimate future supply and price.
But I keep wondering about other factors. When will investors and lenders lose interest? When will companies try to cash out rather than throwing anymore money at projects? When will people lose interest in careers in gas and oil (maybe that won’t matter and the industry can run on easily trainable, but relatively high priced labor who drill and provide support services)?
When will perceptions change to where gas and oil is seen to be in decline? I suppose many of you peg that to peak oil. But calling the peak might be hard until it is obvious there are no miracles to boost production again. And if fewer people want to fund production or work in the industry, won’t peak happen for that reason even if there is still oil in the ground? How high would prices have to be to get anyone excited again?
There will always be oil in the ground. It is whether the oil can be produced at a profit at prevailing prices. You are correct that as the industry shrinks costs will go up.
Nobody else has that knowledge either, obviously. And to all of those questions, they are happening now.
Oil Drops Below $54 as Global Recession, Supply Concerns Mount
U.S. crude has fallen about 18% from a peak in late April and volatility has jumped as deteriorating U.S.-China trade relations cast a pall over the global growth outlook. Speculation that demand will weaken, mostly because of the U.S.-China trade war, continue to weigh on prices, said John Kilduff, a partner at hedge fund Again Capital.
And here’s a graph of US rig counts.
Here is the Horizontal Oil Rig count in the US. We are at about the March 2018 level, rig count has dropped from 786 to 694 from Jan 4, 2019 to June 7 2019, about a 12% drop. Most of the current tight oil wells are drilled with horizontal rigs.
The average rig count over the past 2 years was 712 oil rigs, about 2.6% higher than recent levels.
Thanks Dennis!
According to your model, how will the oil production respond to the decrease in rigs?
Tom,
My model does not use rig count. Sometimes with fewer rigs fewer new wells will be drilled, but in some cases the effect is minimal because it is usually the least productive older rigs that are idled. Also there are a bunch of DUCs that can be completed, which only require frac crews as the well has already been drilled, but is waiting for fraccing. So my model just guesses at a future completion rate but does not try to guess at how the rig count correlates with the completion rate.
See well status and check the DUC box only at the page below
https://shaleprofile.com/2019/06/11/us-update-through-february-2019/
About 5500 DUCs as of Feb 2019 and about 664 wells were completed in Feb 2019. The most recent numbers often get revised. If we look back at August 2018 there were 1162 wells completed and the DUC count was 6516 in August 2018.
BP_plc 2019 Statistical Review:
In 2018, energy demand rose by 2.9%, fastest rate since 2010
Carbon emissions rose by 2%, fastest since 2011
https://pbs.twimg.com/media/D8yOI7jX4AAdyh9.jpg
Oil supply rose by 2.2 million bpd, more than double the average rate, driven by US
https://pbs.twimg.com/media/D8yPcZPWkAArJZB.jpg
Annual increase in LNG exports
https://pbs.twimg.com/media/D8yUHEUXUAQgrmS.jpg
Primary energy growth by fuel
https://pbs.twimg.com/media/D8yQPdUWwAEzNdh.jpg
Only oil matters. Consumption up 1.5% globally, agreeing with OPEC’s ASB of last week.
KSA and Japan both reduced their consumption, with KSA still managing to stay below Japan and avoid the #4 consumer label with 1/4 population.
China now consumes 13.525 mbpd. India is up to 5.155 mbpd. Both up over 5% for the year.
Re-read that. THERE IS NO EVIDENCE OF CONSUMPTION DECLINE FROM THE SILLINESS OF EVs.
US consumption increase 2.5% to 20.5 mbpd. Might want to re-read the caps above.
Africa was flat in consumption growth, though western Africa (where the pop gains are) grew sharply, as it has in recent years.
BP has added text about how unsustainable it is for this and that reason. Well, of course it’s unsustainable. The biggest population areas are exploding consumption growth, and this isn’t going to change.
People have to be killed. If you don’t want that to be you, this green money belongs in DoD.
..no evidence of consumption decline from from EV’s.
True, its too early.
But it is coming.
As an example, I’ve got a mixed vehicle (hybrid that plugs in to the garage socket and has a regular petrol engine).
Its imported from Detroit and is big enough to put a sheet of plywood inside.
This past year I did 69% electric miles and 31% petrol miles.
As time goes by, there will be these kind of vehicles everywhere.
But it will take a long time to show up as consumption decline.
There is a huge slug of ICE vehicles on the worlds road.
This is like the abiotic oil wackos. “Oil is being created deep within the earth from non organic sources. In a few million years it reaches depths accessible.”
“This is like the abiotic oil wackos”
Say what? Please do explain in what way there is any similarity between the topics?
Are you saying that the electric miles I drove are make believe?
Are you saying the car computer has been hacked to create make believe miles by the russians, or some such thing?
No comprende.
You may be infuriated to know that both of our kids/families drove over for dinner yesturday- silently, and with massive torque. Silent as in electric vehicles. Its slowly coming.
Did you not write that you didn’t have any kids? Did you adopt or did I quote another Hickory that you simply neglected to deny was you?
Adoption perhaps?
Electric vehicles already reduce oil consumption.
No, not the Teslas. Or the Leaf.
The more than 100,000 electric busses in China do – they drive the whole day, every day the week, so the effect is much bigger than with 1 million electric cars.
So it’s already in the 100kbpd range already – not much still, but existing.
And the round about 100 million electric scooters dent oil usage in China, too. Imagine all of them gas powered exhausting blue smoke.
Can’t number this, but it should be in the middle 100kbpd range, too.
I see that you have missed the point about 5% increase in China oil demand.
No, the point is that oil consumption would have grown even faster without those bus conversions.
People always have trouble with the exponential function…
Don’t you get it? World burns 1.5 million barrels per day more than year erlier, so that it has enough purchasing power to buy EVs that save 100k barrels per day. The same with renewables energy sources. Without increase in FF burn speed, we wouldn’t be able to build renewables, because we live in a FF world since 19th century.
Name,
The increased EVs and renewables will displace some of that fossil fuel use, surely you can see that. Also it is crude plus condensate which is the limiting factor. Using the BP data from 2000 to 2018 the trend in C+C production is an average annual increase of about 781 kb/d, using EIA data from 1983 to 2018 the trend is an average annual increase of 814 kb/d. There is plenty of natural gas and coal until 2040, so renewables can be ramped up, also there is far less energy waste with wind and solar, rather than getting just 38% of the energy consumed as useful work, with wind and solar it is probably 80% at least.
“The increased EVs and renewables will displace some of that fossil fuel use”
It never did in history, so how do you know? FF burn speed keeps increasing as in the past.
Renewables are not energy sources for our civilization, that’s why they do not decrease FF burning speed. Wind and solar energy is not stored, and is too dissipated to power complexity needed to obtain it on large scale. Only lower standard of living for average person on Earth can lower FF burning speed.
Several studies have suggested wind and solar combined with hydropower could provide 80% of energy needs, soon oil output will peak and decline, then coal, and finally natural gas, probably peak fossil fuel use will be between 2030 and 2040, then consumption will fall. Only about 40%, and perhaps less of primary energy is transformed to useful work, most of the energy is dissipated as waste heat that is not utilized. For wind, solar, and hydro power the losses are far lower, probably around 20%, bottom line, of the almost 14,000 Gtoe of primary energy used in 2018 about 5600 Gtoe was used to provide useful work (exergy). So roughly 7000 Gtoe or 290 ZJ (zettajoules)
1 ZJ= 10^12 joules of wind, solar, and hydro would be needed to replace 2018 primary energy consumption.
Only about 85% of that energy is fossil fuel with the rest provided by renewables and nuclear, so a better estimate would be 12000 Gtoe of fossil fuel energy and about 6000 Gtoe of wind, solar and hydro to replace it so about 249 ZJ would be needed, or only about half of the primary energy due to greater efficiency.
https://en.wikipedia.org/wiki/Jevons_paradox
In economics, the Jevons paradox (/ˈdʒɛvənz/; sometimes Jevons effect) occurs when technological progress or government policy increases the efficiency with which a resource is used (reducing the amount necessary for any one use), but the rate of consumption of that resource rises due to increasing demand.[1] The Jevons paradox is perhaps the most widely known paradox in environmental economics.
Nick you must be apart of the gov’t:
[2] However, governments and environmentalists generally assume that efficiency gains will lower resource consumption, ignoring the possibility of the paradox arising.[3]
The only think that will reduce consumption is supply constrantions or a major economic downturn. Generally Depressions cause World Wars.
Oddly enough every century had at least 1 global war going back to at least the 18th century:
18th: Seven Years war
19th: Napoleonic war & Crimean War
20th: WW1 & WW2 & 40 year cold war
21th: Coming: probably between 2023 and 2030.
“THERE IS NO EVIDENCE OF CONSUMPTION DECLINE FROM THE SILLINESS OF EVs.”
Here’s Proof That Electric Cars Are Displacing Gasoline
It’s that pesky first grain of wheat on the chess board, exponential growth thing (courtesy of Arithmetic, Population and Energy – a talk by Al Bartlett on the impossibility of exponential growth on a finite planet). I first posted this over on the non-petroleum thread, then I came and read this thread.
I should also point out that in the Electric Commercial Vehicles, a ten year update – Part 2 that In posted on April 24, in the bit about EV policy in China, I pointed out that China is producing 1,900 battery electric buses a week. That means it is probably the case that China, produces more electric buses in a month than the rest of the world has ever produced.
I still think that EVs are going to make a bigger splash in the commercial vehicle space before they make a big dent in private ICE car ownership.
Skeptics might also want to take a look at the progress of the factory being built n China for Tesla , after just about six months of work:
Tesla Gigafactory 3 Construction Progress June 9, 2019: Video
“Re-read that. THERE IS NO EVIDENCE OF CONSUMPTION DECLINE FROM THE SILLINESS OF EVs.”
There will only be a consumption decline when the number of EVs sold is higher than the increase of car purchases.
IMHO we will see between 2025 and 2030 that EVs kill demand, the interesting question is whether the decline of the oil production starts earlier or not.
2025: 15%-25% of new cars are EVs
2030: >40% of new cars are EVs
https://oilprice.com/Energy/Energy-General/Can-Shale-Survive-Low-Oil-Prices.html
We are talking 90% here.
“But while drillers take an additional hit from discounts, the larger problem is an inability to turn a profit during virtually any period of the shale revolution. Despite years of cost-saving measures, improvements in drilling techniques and promises to lower break-even costs, the shale industry is by and large still not profitable. Investors are losing patience, and as the Wall Street Journal reports, access to capital is beginning to close off for many shale companies.”
And, it is probably closing off, no matter what the price of oil. Hence, they are in a waiting pattern for being gobbled up by the majors, who are still waiting for them to lower the asking price. Gonna look ugly for a couple of years. Permian, smermian, ain’t going to happen. And the analysts are still clueless, waiting for oil production to rise another 1.5 million barrels a day.
IEA Chief warns of world oil shortages by 2020 as discoveries fall to record lows
https://www.wsj.com/articles/iea-says-global-oil-discoveries-at-record-low-in-2016-1493244000
There will be an oil shortage in the 2020’s, Goldman Sachs says
https://www.cnbc.com/2018/11/09/goldman-sachs-there-will-be-an-oil-shortage-in-the-2020s.html
Growing demand for oil will lead to shortage and high prices in 2020s
https://www.newscientist.com/article/2185046-growing-demand-for-oil-will-lead-to-shortage-and-high-prices-in-2020s/
German Military (leaked) Peak Oil study: oil is used in the production of 95% of all industrial goods, so a shortage of oil would collapse the world economy & world governments
https://www.scribd.com/document/387459134/german
Imminent peak oil could burst US, global economic bubble – study
https://www.theguardian.com/environment/earth-insight/2013/nov/19/peak-oil-economicgrowth
I emailed Professor Douglas B Reynolds PhD, Oil and Energy Economics, University of Alaska.
http://uaf.edu/files/som/REYNOLDS-Doug-2016-CV.pdf
And I asked him if our upcoming oil shortage will cause a global economic collapse?
https://imgur.com/a/rBtIrfg
He replied;
“Yes, it will be like that, but may be worse with other extenuating circumstances such as war or the decline of international trade. Hyperinflation as happened in the Soviet and Post Soviet economy is a certainty.”
https://imgur.com/a/rktmHdt
University of California: Environmental Science & Technology (Malyshkina 2010)
1. It Will Take 131 Years to Replace Oil with Alternatives
2. World oil production will peak between 2010-2030
3. World proven oil reserves gone by 2041
https://www.scribd.com/document/394656677/Future-Sustainability-Forecasting-by-Exchange-Markets-Basic-Theory-and-an-Application-Malyshkina-2010
A global energy assessment (Jefferson 2016)
An extensive new scientific analysis conducted by the Former Chief Economist Michael Jefferson at Royal Dutch Shell published in Wiley Interdisciplinary Reviews titled “A Global Energy Assessment 2016” : says “that proved conventional oil reserves as detailed in oil industry sources are likely “overstated” by half.” & “punt bluntly,the standard claim that the world has proved conventional oil reserves of nearly 1.7 trillion barrels is overstated by about 876 billion barrels. Thus, despite the fall in crude oil prices from a peak in June 2014, after that of July 2008, the “peak oil” issue remains with us.”
The World in the 21st Century is faced with huge challenges that go far beyond, but importantly include, energy challenges on the supply, access, and use sides. So severe are these challenges, mainly arising from the demands of a rapidly increasing human population on the Earth’s limited resources, that the future existence of large numbers of people may be threatened with extinction. In that sense, we may be observing the twilight of the Anthropocene (Human) Age.
https://www.scribd.com/document/394043449/A-Global-Energy-Assessment-Jefferson-2015
Projection of world fossil fuels by country (Mohr, 2015) Fuel
Over 900 different regions and subfuel situations were modeled using three URR scenarios of Low, High, and Best Guess. All three scenarios indicate that the consistent strong growth in world fossil fuel production is likely to cease after 2025. The Low and Best Guess scenarios are projected to peak before 2025 and decline thereafter. The High scenario is anticipated to have a strong growth to 2025 before stagnating in production for 50 years and thereafter declining.
https://www.scribd.com/document/375110317/Projection-of-World-Fossil-Fuels-by-Country-Mohr-2015
IEA Chief warns of world oil shortages by 2020 as discoveries fall to record lows
https://www.wsj.com/articles/iea-says-global-oil-discoveries-at-record-low-in-2016-1493244000
Saudi Arabia’s Energy Minister Warns of World Oil Shortages Ahead
https://www.wsj.com/articles/saudi-minister-sees-end-of-oil-price-slump-1476870790
There will be an oil shortage in the 2020’s, Goldman Sachs says
https://www.cnbc.com/2018/11/09/goldman-sachs-there-will-be-an-oil-shortage-in-the-2020s.html
Wood Mackenzie warns of oil and gas supply crunch
https://www.ft.com/content/a1eb0e58-d7a4-11e8-ab8e-6be0dcf18713
Imminent peak oil could burst US, global economic bubble – study
https://www.theguardian.com/environment/earth-insight/2013/nov/19/peak-oil-economicgrowth
German Military (leaked) Peak Oil study: oil is used in the production of 95% of all industrial goods, so a shortage of oil would collapse the world economy & world governments
https://www.scribd.com/document/387459134/german
You ever notice we never get geologists being loud in public about what oil remains where? It’s always economists, who study the behavior of people maneuvering a substance created from nothing.
Simple really….when the World Economy Collapses everything shuts down…the end… We’re talking about grids down all over the world and 7.5B people dropping like f*** flies in short order. The collapse will be absolutely horrible..There is no collapse or horror movie ever produced that has even come close to imagining what the collapse of BAU might look like. I’m talking about every corporation and every social program going bankrupt at once. I’m talking about people eating people. I’m talking about the Worst Catastrophe to ever happen in the history of mankind. Nothing has ever, or will ever come close…(Meadows, 1972) (Motesharrei, 2014) (Turchin, 2010) (Ehrlich, 2013) (Turner, 2014) (Korowicz, 2012)
https://www.scientificamerican.com/article/apocalypse-soon-has-civilization-passed-the-environmental-point-of-no-return/
https://www.nature.com/articles/463608a
http://www.sciencedirect.com/science/article/pii/S0921800914000615
https://www.ncbi.nlm.nih.gov/pmc/articles/PMC3574335/
https://www.scribd.com/document/379418787/Is-Global-Collapse-Imminent-An-Updated-Comparison-of-The-Limits-to-Growth-with-Historical-Data-Turner-2014
http://www.feasta.org/wp-content/uploads/2012/06/Trade-Off1.pdf
Baby Doomer,
People have been preaching collapse for a long time, maybe at some point they will be correct, but I doubt it.
Humans can not live without illusions. For the men and woman of today, an irrational faith in progress may be the only antidote to nihilism. Without the hope that the future will be better than the past they could not go on..
-John N Gray
Errrr… Dennis, it’s happening right now. Our ecosystem is collapsing. Animals are going extinct at the highest rate since the Chicxulub impact 65 million years ago. Indian farmers are committing suicide because they have no water for their crops. Water tables are dropping meters per year all over the world. Insect biomass is dropping like a rock. Ocean fisheries are disappearing. I could go on and on.
But, just because the human population is still rising, people think all is well with the world. We may be the last to have our population collapse but every other species, save those that thrive off humans like rats, mice, and cockroaches, are in headlong collapse. After they are all gone, do you think we will survive in such a barren world. Perhaps since we will have all the world to graze our cows, sheep and pigs. All the wild animals will be gone.
Open your eyes! We are right in the midst of collapse right now. And the rate of collapse is not slowing down. It is actually speeding up.
World Scientists “Warning to Humanity” Signed by 15,000 Scientists from 184 Countries Including the Majority of all Nobel Prize Winners
https://academic.oup.com/bioscience/article/67/12/1026/4605229
Limits to growth had 12 models. One of those models, the “standard run” or, alternatively, the “business as usual” model was the one that 40 years of historical data has tracked/followed.
https://www.theguardian.com/commentisfree/2014/sep/02/limits-to-growth-was-right-new-research-shows-were-nearing-collapse
Gloomy 1970s predictions about Earth’s fate still hold true
https://www.nature.com/articles/d41586-018-07117-2
End of days: Is Western civilization on the brink of collapse?
https://www.newscientist.com/article/mg23731610-300-end-of-days-is-western-civilisation-on-the-brink-of-collapse/
Are we on the road to civilization collapse?
http://www.bbc.com/future/story/20190218-are-we-on-the-road-to-civilisation-collapse
How western civilization could collapse
http://www.bbc.com/future/story/20170418-how-western-civilisation-could-collapse
Jared Diamond: There’s a 49 Percent Chance the World As We Know It Will End by 2050
http://nymag.com/intelligencer/2019/05/jared-diamond-on-his-new-book-upheaval.html
Here’s How NASA Thinks Society Will Collapse
https://www.theatlantic.com/politics/archive/2014/03/heres-how-nasa-thinks-society-will-collapse/441375/
‘Society could end in less than a decade,’ predicts academic historian
https://www.independent.co.uk/news/uk/home-news/society-end-western-world-apocalypse-researcher-cliodynamics-political-turmoil-a7515156.html
This is how UN scientists are preparing for the end of capitalism
https://www.independent.co.uk/news/long_reads/capitalism-un-scientists-preparing-end-fossil-fuels-warning-demise-a8523856.html
Energy Returns and the Long-run Growth of Global Industrial Society (Andrew 2017)
https://www.scribd.com/document/378512599/Energy-Returns-and-the-Long-run-Growth-of-Global-Industrial-Society-Andrew-2017
Modeling sustainability: population, inequality, consumption, and bidirectional coupling of the Earth and Human Systems (Motesharrei 2016)
https://academic.oup.com/nsr/article/3/4/470/2669331
It’s time for a hyper-crash, say multifractal analyses of the main stock market index
https://phys.org/news/2018-11-hyper-crash-multifractal-analyses-main-stock.html
Baby Doomer,
” I’m talking about the Worst Catastrophe to ever happen in the history of mankind”.
Not so fast and loose-
Ask the Indigenous people of the Americas, or the Jews of Europe, for example. These tribes already experienced episodes of 90% or greater genocide.
Secondly, this whole energy shortfall will play out over decades, and there will be some adaptation. For example, the USA could get by with 1/2 as much petrol for the next 20 yrs, while it tightens the belt and finds leaner ways to get by.
I’m not saying this doesn’t have the ingredients to be a hellish experience. And some places will become failed states. All bets are off in those places.
The greatest skill to have when conditions are changing, is the ability to adapt.
What is adaptation to conditions of less energy?
What is the adaptation to condition of severe population overshoot?
How does an economy learn to function on the downside of the growth curve?
Hard questions. Many of the answers are very hard to swallow.
Your screams of denial sound like the squealing of a pig beginning delivered to the butchers shop. The volume of their protestations being directly proportional to the proximity of their inevitable fate..
Boy, aren’t you just cheery this morning.
I don’t think you know much about how I think on these things- I’m certainly not a denier of the realities at hand.
Here is the short version- 2-3 Billion people might work in the best case scenario (where everyone acts smart and lives simply- good luck with that).
We are at 7.7 Billion now.
It is not going to be a pretty adjustment downwards- a big factor here is how fast it all happens. Imagine the difference in a country losing petrol fast [this coming decade], vs gradually [25 years]. Huge difference in outcome is possible between those two timeframes.
Some of us will see it unfold.
Make your plans.
There was a person who used to post here (changing his name whenever he was kicked out so he could come back) who went on and on about the coming apocalypse. There was no point to it other than to indulge in his masturbatory need to keep talking about it.
I suspected he was bi-polar and his posts were during a manic phase.
I wonder if this is the same person.
No, I don’t recall any such person. I have always been the doomest doomer on this blog and I haven’t kicked myself off yet.
I used to post a lot about the coming collapse. Then I started posting that the collapse had already began. But no one pays any attention. They are unable to see the catastrophe that is happening right under their noses.
So I said “What the hell” and just quit posting about it. But the subject still comes up from time to time. And a new bombshell explodes occasionally. You know, like the fact that three fourth of flying insects have somehow disappeared. But that doesn’t seem to shock those who cannot see the nose on their face. They just say “good riddance”.
Wo what are you going to do? That a question to myself, not to you.
I can’t remember the names he has used, but his posts got pretty intense. As I mentioned before, I suspected that he was bipolar.
It wasn’t that he was posting alarming news. It was more that he was organizing a something of a cult so we could contemplate our deaths.
I can’t remember any of that shit. Perhaps I am losing my memory. If anyone else has any input on this mystery poster please inform us.
I remember one of the names now.
Futilitist
Then after he disappeared under that name he came back under another. I remember one post had about forty links to end-of-the-world articles in one comment. He wanted feedback, but those who said anything said they wouldn’t wade through such a mass of un-annotated links.
If you Google Futilitist, it looks like he has been banned from multiple websites.
I found this.
———-
Futilitist on Sat, 2nd Dec 2017 2:08 am
Oh, and welcome to the club of the banned.
I never thought in my wildest dreams that I would ever get banned from theoildrum(rip), The Doomstead Diner, LATOC(rip), 3 different yet amazingly similar so called science forums, peakoilbarrel, and peakoil.com combined. I am practically banned from the entire internet! I doubt I will be allowed to keep posting in this “unmoderated section” for much longer. We shall see.
I think you are projecting based on how paranoid you sound..lol
Starting a cult? WTF? LOL
Hi Ron,
I pay attention to everything you have to say, and while I think you know a lot less than you think you do about some topics, I generally agree with you about collapse.
The biggest difference is that I think collapse brought on by the coming hard crash, economic and ecological, may in a paradoxical sense be self limiting.
ENOUGH people, and enough of what we refer to as business as usual, may perish, without actually destroying ALL of the natural world, leaving the REMAINDER badly damaged but still functional to the extent that r business as usual MIGHT continue for SOME people in SOME places.
Sure we may ALL wind up in dead or in an existential hell, excepting a few million of us who will likely survive anything short of flat out WWIII, and maybe even that.
After studying this matter for the last decade, I now believe there is a real possibility that while most of us will die slow and hard, or fast and hard, some of us may pull thru the coming crisis while continuing to live a more or less modern, if severely circumscribed, industrial life style.
There’s ample reason to believe collapse will come to pass, but that it will come to pass in a piecemeal fashion. Food production is very unlikely to crash all over the world the same year, or even over a period off three or four years. Oil production ditto. Production of any and all of the things we must produce to keep the wheels of industrial civilization turning, ditto.
If everybody in Africa, other than the people directly involved in producing oil and other mineral wealth dies off, it won’t matter at all to the rest of the world, in terms of business as usual.
Everybody in India could starve, or die of plague or exposure or thirst, and it wouldn’t really matter, in terms of the survival of the rest of the world, except that the nation of India would not go quietly into the night. India would go to war,seeking to seize other countries resources, but India has little ability to project power beyond her national borders. Nevertheless, the war might still escalate into WWIII.
Take Africa and India out of the equation. Take out all the little countries in South America. They can kill each other off, wiping out half or more, even ninety percent of the South American population, right up thru Central America to the Mexican border, but none of the countries of South America have the ability to project power very far beyond their own borders. If industrial civilization collapses in South America, ninety percent of the people there will perish……but ten percent will manage a successful return to a preindustrial life style and economy.
Will the rest of the modern world survive collapse on the grand scale, but collapse that happens PIECEMEAL on a REGIONAL BASIS, over a period of years or decades?
I now believe it is not only possible but maybe even likely that a few countries, ones that are still rich and powerful and well endowed with natural resources, will pull thru, with their people continuing to have running water, working sewers, grid juice, food in stores and cops who are real cops rather than a local strong man’s good squad.
Of course I might be wrong, but I’m willing to ADMIT I might be wrong. Are you?
We survived the end of WWII here in Germany, and the rest of Europe, too. Kind of post-apocalypse time 1945-1950.
Farming was down a big time, Energy scare, infrastructure damaged.
It somehow worked, by rationing, curfews, black market, a bit suffering.
The diet was mostly vegetarian and local, energy usage a small percentage compared to now. I can’t really imagine this, but my grandparents lived through it.
If you focus solely on domestic energy supply over the next 20 years (transition time), certain countries look to be in much better shape than others.
For example, the USA and Canada could get by if smartly managed.
Russia is in strong shape, and can pick who will be its best friend to supply- China, or Germany.
Norway and Australia are strong.
These countries are examples where collapse isn’t baked in the cake. Severe depression is surely possible given all the globalization of economic activity.
On the other hand there are countries who are on the verge of experiencing a population threatening energy shortfall in the next decade or two. They import an extremely high percent of net energy use-
example- Japan, Korea, and many of the European countries
China is better than most at making plans beyond 3 years [central planning]. They are taking a multi-pronged approach to the energy future-
Naval buildup to protect cargo ships from the mideast.
Belt and Road initiative, which will allow tanks to roll to the mideast and tanker trucks to roll from the mideast.
Big push on solar and wind.
Big push on coal plants.
Keeping the possibility of being Russias biggest customer open.
OFM, I foresee something similar to you. As petroleum declines, as weather events increase, and as climate changes, there will be significant changes. But for those who still have access to resources, many humans could disappear without the resource-wealthy feeling inconvenienced. Humans are not necessary for labor as they were in the pre-industrial age. So losing a lot of people will likely improve the prospects for those still standing.
And in the end humans will disappear anyway. Earth will go on in some form without us, until the planet itself ceases to exist.
Ask the Indigenous people of the Americas, or the Jews of Europe, for example. These tribes already experienced episodes of 90% or greater genocide.
You are talking millions. Baby Doomer is talking billions.
Secondly, this whole energy shortfall will play out over decades, and there will be some adaptation.
Ahhh yes, if only there were no other global environmental problems other than energy. The energy shortfall will only be a tiny part of our current ongoing collapse.
Prepping is futile
Myth: Well-prepared individuals, groups, and communities will survive our impending collapse and maintain healthy, fulfilling, and productive lives in its aftermath.
Reality: Those who survive our collapse will be those who can obtain sufficient life sustaining essentials—especially clean water and food—on a continuous basis, both during and after collapse. Those who store large quantities of these essentials and those who attempt to produce food, either individually or in communities, will be easy targets for the vast majority who have neither the foresight to store nor the skills to produce. No matter how remote or secluded your sanctuary, somebody will know about it; and they will come to call when they become desperate; and they will be well armed and devoid of compassion. You can prepare for a last stand, but you cannot prepare for post-collapse survival. Post-collapse Life Will Be Preferable to Our Industrial Lifestyle Paradigm
Myth: Industrialization has brought nothing but misery and degradation to the human race; our quality of life (and spiritual wellbeing) will improve substantially in a post-collapse world.
Reality: The post-collapse lifestyle awaiting the few who survive will, under the best of circumstances, share many attributes with pre-Columbian America. Unfortunately, the realities associated with subsistence level existence bear little semblance to the Hollywood accounts. Those who anxiously await our post-collapse world will be disappointed, assuming they live to experience it. The fact that nobody is opting to jettison the amenities afforded by an industrialized way of life in favor of a hunter-gatherer lifestyle today should be sufficient proof that our future way of life is not something to be anticipated. Industrialism is not inherently “evil” or immoral; it is simply physically impossible going forward.
Doomer, I know all this and I have known it for decades. But as I told my kids, I hope to be safely dead when it happens. If the collapse holds out for another decade, I will likely get my wish. I turn 81 this month.
But it tears my heart out knowing the horrible world my children and grandchildren will have to live in. And I hurt for the rest of humanity as well.
But I have always known that nothing could be done. Human nature, being what it is, just will not accept the coming disaster and take the necessary action.
So you, and I as well, are wasting our breath trying to tell anyone anything. It way, way too late for anything to be done.
“Secondly, this whole energy shortfall will play out over decades, and there will be some adaptation. For example, the USA could get by with 1/2 as much petrol for the next 20 yrs, while it tightens the belt and finds leaner ways to get by.”
Seems the US TPTB are more interested in conquest of nations that can export Oil. USA & its ME allies are pressing hard for war with Iran. Iran has Nukes, which significantly increase the risk of a global War.
Putin had a press conference this week signaling alarm bells that the world is on the fast track for World War 3.
I am convinced the world goes out with a bang rather than a Whimper (end of BAU). My best guess is that WW3 begins sometime between 2023 and 2030.
Baby doomer,
Alternatively there are some experts (Tony Seba for example) that believe the rapid expansion of EVs and AVs will make oil obsolete by 2035. Reality is likely to fall between the viewpoints of the pessimists and the optimists. Oil will peak around 2025 and the decline rate of World C+C output will be under 2% through 2035 with high oil prices leading to rapid development of oil resources and high extraction rates from producing oil reserves, while simultaneously accelerating the uptake of battery Electric vehicles (BEVs) for both personal transport and commercial land transport. By 2035 to 2040 (best guess of 2037) demand for oil will fall below the supply of oil for a medium URR scenario (3070 Gb of C+C). Supply will decline rapidly in response to falling demand for oil.
If there is economic collapse, demand for oil will fall and oil supply will not be a problem. Recessions are always possible, but typically proper economic policy leads to relatively rapid recovery as long as economists remember the message of Keynes who swept aside the classical Say’s Law Orthodoxy that was the prevailing view of economists in 1930.
Revised EV transition scenario where oil used in areas other than road transport is assumed to grow at 226 kb/d each year (29% of the typical 800 kb/d average annual rate of increase in C+C consumption from 1982 to 2018). The earlier scenario assumed the “other oil use” was fixed at the 2025 level. In the revised scenario oil demand is higher than supply from 2027 to 2036 and oil prices are likely to be high over that period (2027-2036) in the absence of a severe recession.
oil used in areas other than road transport is assumed to grow at 226 kb/d each year
It would be useful (assuming you have nothing else to do with your time…) to break out those other items. Aviation and seasonal agricultural consumption can be expected to grow, but lots of others won’t: asphalt for roads, heating oil, maritime fuel and petrochemical feedstock, for instance, are very price sensitive and have substitutes.
Nick G,
feel free. I don’t have hard numbers on the other uses, but note that I am focusing on C+C so petrochemical use is probably pretty small, asphalt can come from oil sands and bottom of barrel refining, the main area would probably be water transport and air transport and again water transport mostly uses bottom of barrel residual fuel.
Interestingly, if we look at BP data for the sum of jet fuel, fuel oil, and other (not middle or light distillate, or fuel oil) from 1995 to 2018 the trend has been an annual decrease of 100 kb/d each year on average.
So perhaps my initial model with demand for crude from “non-road consumption” assumed flat is not a bad guess. Of course trends can change, but fuel oil use has decreased quite a bit, the assumption that most middle and light distillate use (except jet fuel) is for road use is likely too simplistic, but data for World road use is hard to come by.
We do know that about 65% of C+C is used for diesel and gasoline in the World and that is the US about 86.9% of diesel and gasoline is used on roads (2017 data). If we assume the World is similar to the US (no data for World road use of gasoline and diesel fuel) that would suggest only 56.6% of crude plus condensate is used for road transport.
I had mistakenly assumed 70% of C+C was used for road transport for my EV transition model, so significant revision is in order for that model.
Nick G,
The assumption that fuel use other than road use continues to grow at 351 kb/d each year (44.4% of historical growth of 800 kb/d each year from 1983 to 2018). We get the EV transition model below.
Note that some of the fuel use is for the military and they may also transition to alternatives to gasoline and diesel. If we make that assumption, but assume other C+C use (about 35% of it) continues to grow we get the model below.
Alternatively if we assume the 35% of “other” C+C use (non-road and non-military) remains fixed at 2026 levels we get the following supply vs demand. In that scenario demand falls below supply in 2031 and remains below until 2078.
Both higher case and lower case shown on chart below, reality may be somewhere between these two scenarios.
Note also that high oil prices will likely reduce oil consumption to the level of the supply line up to 2042 (in the high demand case) beyond 2032 or 2043 (for low and high demand case respectively) oil price falls to a level that supply matches demand.
According to Greenpeace 2016:
in mb/d
22,3 car fuel
26,4 diesel/heating oil
6,7 aviation fuel
8,5 others (electricity generation ?? )
8,8 fuel for ships
17,1 chemical industry/construction….
https://www.greenpeace.de/sites/www.greenpeace.de/files/publications/oel-report-2016-greenpeace-20160108_0.pdf
Global oil demand will never peak for the simple reason that there will never be a post-oil era throughout the 21st century and probably far beyond. Even a wider usage of electric vehicles (EVs) into the global transport system will not change that outlook.
However, it can decelerate the rate at which global oil demand is growing but will never replace oil as the major transport fuel nor lead to a peak oil demand.
The projection by the IEA that there could be some 300 million EVs on the roads by 2040 is just a myth. Still, let’s assume hypothetically that it is possible.
Global oil consumption has already hit 100 mbd in 2018 and is projected to reach 120 mbd by 2040.
Currently, electric and hybrid cars combined number under 2 million cars out of 1.477 billion internal combustion engines (ICEs) on the roads worldwide, or a negligible 0.14%. This is despite support by significant government subsidies. The total number of ICEs is projected to reach 2.79 bn by 2040 according to US Research.
Let us assume hypothetically that we might have some 300 million EVs on the roads by 2040. By that time the world will be using 43.8 billion barrels a year (bb) of which 75% or 32.85 bb will be used to power 2.790 billion ICEs around the world. Bringing 300 EVs on the roads will reduce the global oil demand by only 3.53 bb (9.57 mbd) or 8% to 100.43 mbd by 2040.
However, I hasten to add that even 300 million EVs by 2040 is an impossibility. The reason is that current manufacturing capacity of EVs amounts to only 500,000. So it will take many decades to manufacture 300 million EVs.
Moreover, there will be a need for trillions of dollars of investment to expand the global electricity generation capacity in order to accommodate the extra electricity needed to recharge 300 million EVs.
Last but not least is that projections and figures offered by the IEA and Tony S masqueraded as research have been discredited time and again.
Baby Doomer,
The growth in Battery electric vehicles will be much higher than your guess.
From 2015 to 2018 the World plugin fleet grew at an average rate of 57% per year, I assume the rate of growth in plugin sales slows from 50% per year in 2019 to 15% per year in 2026 (a 5% decrease each year) and then continues to grow at 15% per year from 2026 to 2036 and the rate then slows as the market becomes saturated, after 2038 sales growth is assumed at 1% per year because 100% of personal vehicle sales will be EVs. Also assumed is the fleet size stabilizes at 1% growth rate and all personal ICE vehicles are replaced by 2055. The scenario also assumes commercial vehicles follow the path of personal vehicles delayed by about 10 years (the 2015 rate of decrease of personal ICEV fleet matches 2025 and so on so that all road transport moves to BEV both commercial and personal).
Note that Volkswagon (the largest personal vehicle manufacturer in the World) is going to start producing EVs soon, there are Chinese manufacturers and Tesla plans to have the Fremont, Shanghai, and another factory in Europe.
All auto manufacturers will be jumping on this bandwagon, trying to catch up to Tesla’s lead.
Do you remember thinking smart phones and cell phones were a dumb idea. I do.
Some people learn from past mistakes. 🙂
In 2018 in China plugin sales were over 1 million and are forecast at 1.8 million in 2019.
http://www.ev-volumes.com/country/china/
Probably 2 to 3 million plugin vehicles will be sold in 2019. Exponential growth can lead to pretty significant changes.
Also crude oil consumption was 82.43 Mb/d in 2018 (see EIA C+C estimates) NGL is growing rapidly, but I exclude NGL from my analysis.
See
https://www.eia.gov/totalenergy/data/browser/index.php?tbl=T11.01B#/?f=A&start=1973&end=2018&charted=12
Road transport uses about 70% of crude output or 58 Mb/d in 2018, by 2040 in my EV transition scenario I have 770 million personal plugin vehicles on the road and 24 million commercial EVs, the ICEVs left on the road will consume 46 Mb/d of C+C output, about 12 Mb/d less than in 2018. By 2071 oil used for road transport falls to 1.3 Mb/d.
Nobody in the industry mentions it, but we still are at electric car 1.0
Why – because nobody will buy a 1.0 without big discounts when 2.0 is at the gate.
Next generation will be solid state battery – double density with potential for more, no cobalt, less thermal management. Toyota will present them next year, according to a press release of them.
Version 3.0 will run on sodium solid state batteries. Less dense, but ultimative cheap. That’s the moment when gas cars get phased out even in Africa – nobody wants to buy expensive gas, but can get cheap (or even stolen) electricity.
I just did a quick and dirty spreadsheet as a thought experiment. Looking at the Monthly Plug-In EV Sales Scorecard at insideevs.com, global plug-in car sales were 2,018,247. The trend is that the ratio of BEVs to PHEVs is increasing as outlined by one Mark Larsen on the web page at the following URL:
http://www.casteyanqui.com/ev/usa_sales/index.html
The earlier report with data up to May 2019 can be viewed at the link below and has a graph showing the trend of increased BEV sales (graph below):
http://www.casteyanqui.com/ev/usa_sales_phev/index.html
So, back to the spreadsheet, I assumed that of the 2 million plug-in vehicles sold worldwide in 2018, half were BEVs. I looked at the growth rate for plug in vehicle sales globally over the past couple of years and it’s looking like about 60% so I used that figure. The spreadsheet extrapolates the addition of 1 million vehicles going forward growing at a rate of 60% per year. If that were to be sustained through to 2030, in 2029 we would see over 100 million EVs added to the global fleet with a cumulative amount of 281 million by the end of 2030.
If I understand him correctly, that is the sort of projection Seba is making, in addition to a vast reduction in private car ownership and an explosion of autonomous (self driving) shared transport or as he calls it transport as a service (TAAS). What Seba is suggesting is that there will be a bloodbath in the FF industries over the coming decade and that is why he says “this is not an energy transition, this is a technology disruption”. Even if one cuts the number of EV by 2030 in half (corresponding to an annual growth rate of 51%) it is still very ugly.
I am not saying that this is necessarily going to happen but of all the projections for solar and EVs I have seen, since he published his book in 2014, Seba’s projections have proved closest to the mark. The most aggressive other forecast for EV sales I believe is from Bloomberg New Energy Finance and even they have had to bring forward the point at which they think EVs will reach price parity with ICEs every year. See:
Electric Car Price Tag Shrinks Along With Battery Cost
Making predictions about the future are hard but, when it comes to the following statement:
“Global oil demand will never peak for the simple reason that there will never be a post-oil era throughout the 21st century and probably far beyond.”
My response is, “Never say never”. All I am saying is that folks who ignore the more optimistic projections regarding EV adoption, face the possibility that at some time in the not too distant future (next decade) they may have the rug pulled out from under them, so to speak.
EIA data for US Refinery Yields%, Lights vs Middles. And also API gravity input.
Chart https://pbs.twimg.com/media/D80K53YXUAMZCVv.png
EIA data for Inland Texas – Refinery Yields%, Lights vs Middles. And also API gravity input.
https://pbs.twimg.com/media/D80Mg6xXsAE4fyf.png
I don’t know enough about this, but it looks like the percentage yield of middles is holding up
The EIA data: https://www.eia.gov/dnav/pet/pet_pnp_pct_dc_nus_pct_m.htm
Rather than blending all of the LTO together. There could be 3 separate Permian LTO grades traded. Will this result in a lower API for WTI? And so will the $WTI discount to $Brent narrow because of this? The article doesn’t say…
West Texas Light (WTL) has an API gravity of 44 to 50 degrees
West Texas Condensate (WTC) has an API greater than 50 degrees
So far, there are actively traded markets for two distinct grades – West Texas Intermediate at Midland (WTI Midland) – the barrel most associated with the Permian – and West Texas Light (WTL), produced in the western Delaware sub-basin of the Permian. WTL is so light that it is nearly considered condensate, a type of oil that generally requires blending with very heavy crude for U.S. refiners to process it.
Other grades are not far behind. Plains All American’s Senior Vice President Jeremy Goebel said at a Houston conference two weeks ago that in two months’ time, the market will likely start trading West Texas Condensate (WTC), an even lighter oil than WTL.
Over the past year, volumes of WTL have risen, now making up nearly 10% of the Permian’s production as drilling grows in the Delaware Basin.
https://www.reuters.com/article/us-usa-oil-permian/as-permian-oil-production-turns-lighter-price-outlook-darkens-idUSKCN1T71B7
Two items that may predate you. WTI used to have a cast-in-concrete API of 39.6. For decades. That went away when shale oil started to occupy volume at Cushing. Up went WTI’s API.
The second is the definition of condensate. It used to be liquid produced by gas wells, but then it became liquid produced anywhere provided it was API over 45. And then . . . the number was nudged up to 50.
This is the sort of thing that makes too very close a focus on liquid flow dicey.
From
https://www.eia.gov/dnav/pet/pet_pnp_crq_dcu_nus_m.htm
U.S. API Gravity (Weighted Average) of Crude Oil Input to Refineries (Degrees)
Now find a plot of the API gravity of imported oil.
Watcher,
Using data at page below, I took the average weighted by output for US crude.
https://www.eia.gov/dnav/pet/pet_crd_api_adc_mbblpd_m.htm
Average API gravity for US C+C production is indeed increasing.
Wait, I just re-read your final paragraphs. 10% of Permian output is condensate? And we call it oil?
I’m telling you, there isn’t going to be any warning.
Probably not compelling data. The refineries import heavier oil to maintain middles flow outward. Doesn’t have to mean they are prying it out of LTO.
Some puzzling items from BP consumption numbers.
Bangladesh +14%. Pakistan -15%. That’s the sort of thing worth looking into, though the totals aren’t big.
Iran +2%. Iraq +6%.
KSA stayed under Japan, but only by 120K bpd
Kazahkstan consumption growth 12.4% Hmmm.
Norway +5.1% Finland +5.7%
Ecuador +7.6%
Peak demand???
Sort of like Wall Street who have said buy low sell high is off the table.
Now it’s buy high sell higher.
Isn’t Norway going all electric!? At 234K bpd (2018 average) Norway’s oil consumption has exceeded the 2013 peak of 230k bpd. By looking at the table, Norway’s oil consumption has been stable throughout the decade.
Norway was interesting, what is their EV adoption rate?
There shouldn’t be a country in the world that will have it as easy as Norway to lower consumption, and yet they are still increasing? Not even on plateau?. What does that tell us about the prospects of the rest of the world.
https://www.marketwatch.com/amp/story/guid/A4315A79-4290-4CA6-A4C9-45BE3636CD7C
Keeps going down, but not fast enough. May completions by RRC do not indicate they are going wild in the shale patch. It will, no doubt, go down for June and July. Based on activity and prices, so far, I’d guess that May could be up slightly, but my bet would be on a decrease in Texas production by year end. As Texas goes, so goes the US. Prices like this will create some BKs and acquisitions.
Their full year WTI price estimate for 2019 is way too high. Almost $60 when so far it was only above that for 1.5 months out of 5.5. It would have to start averaging in the mid-$60s soon and right now it is going the other way.
Attached is the latest, June, STEO projection for lower 48 onshore production. You can see how the May projection was a major increase over the April projection. The EIA has taken a second look at their May projection and revised it down for June. The biggest decrease occurs in Jan 2020, 160 kb/d. The second chart shows the decease relative to the May projection. Interestingly the Dec 2020 decrease is insignificant compared to the May projection. The production increase from Dec 2019 to Dec 2020 is 550 kb/d for the June projection. This is higher than the April and May projections of 360 kb/d and 420 kb/d, respectively.
Chart 2
U.S. Petroleum Balance Sheet
EIA pdf: http://ir.eia.gov/wpsr/overview.pdf
Saxo Bank chart summary
https://pbs.twimg.com/media/D83kYFNW4AAaFYJ.png
Imports https://pbs.twimg.com/media/D83lPUDWsAEVwkP.png
Oilytics chart summary
https://pbs.twimg.com/media/D83kl9pWsAANlv9.jpg
https://pbs.twimg.com/media/D83m_fOX4AEszKM.jpg
Oilytics Account -> https://twitter.com/OilyticsData
According to the IEA, an estimated 50 million electric vehicles will be in operation by 2025, and 300 million by 2040, compared to about 2 million vehicles currently on the road. That growth is expected to reduce global oil demand by 2.5 million barrels a day or about 2%. A factor of 6-to-1 easily offsets that reduction with increased demand from petrochemicals, trucks, shipping and aviation — areas the IEA says could lead to net demand growth of up to 14 million barrels a day.
All told, the IEA expects net oil demand to be 12 million barrels a day higher in 2040 compared to 2016.
https://www.scribd.com/document/409867009/IEA-Global-EV-Outlook-2017
EV’s have decreased global oil demand by less than 3% since 2011
https://www.bloomberg.com/news/articles/2019-03-19/how-much-oil-is-displaced-by-electric-vehicles-not-much-so-far
Tesla Model 3 Costs More To Charge Than A Gasoline Car
https://seekingalpha.com/article/4160351-tesla-model-3-costs-charge-gasoline-car
AAA: Cold weather can cut electric car range over 40 percent
https://www.apnews.com/04029bd1e0a94cd59ff9540a398c12d1
And please don’t cite sources that have EV in their address because that is an obvious bias and likely “conflict of interest” with the industry..
There are already more than 100 million electric vehicles on the road, cutting demand:
Electric scooters in China.
They all replace a car, going from A to B. In chinese cities even faster than with a car most times.
For your Tesla3 link: A supercharger is not for daily use, but long range travel. Normally you charge at home for your normal utility price. And most people don’t drive a hybrid – since it is expensive, too.
Baby Doomer,
http://fortune.com/2019/03/22/electric-car-showdown-china/
I own a model 3 and live in an area where heating Degree days averaged about 7700 for the past 5 years. There is some loss of range in winter. I averaged about 270 Wh/mile in January (coldest month last winter), in May the average was 232 Wh/mile, about a 16% difference.
Most charging is done at home where my cost is about 16 cents per kWhr and a full charge takes about 75 kWhr so costs about $12. The Car will go about 289 miles on average on a full battery (so far from Oct 4 2018 to June 2 2019 the average has been 259 Wh/mile) thus cost per mile is 4.15 cents per mile. A typical car gets about 30 miles per gallon and gasoline is about $2.70/gallon so about 9 cents per mile, a Prius might get you 50 MPG, that would be 5.4 cents per mile at $2.70/gallon. For the Prius to match the Tesla would require $2.05/gallon for gasoline.
I expect gasoline prices will rise.
Note that the IEA estimates are not very good.
I have never owned a high end car in the past Toyota Camry has been the nicest I have owned I the past, but the Tesla Model 3 is far nicer than the Toyota Camry.
IEA uses “total liquids” in its estimates a useless figure. All of these agencies do not recognize peak oil, but the EIA’s AEO is better because it gives a C+C estimate, that is the better figure to focus on because that is what produces the liquid fuel used for transport and is the product that will be short in 2025 and beyond. We are close to peak crude oil (C+C) now, it will likely only increase by 2 to 5 Mb/d between 2018 and 2026 a peak of 85 to 87 Mb/d.
Let’s say there are 500 million EVs on the road in 2040 and each drives 10,000 miles on average, that is 5 trillion miles, if we assume it takes 250 Wh for each mile, that would be 1250 TWhr of electricity for the year or about 5% of 2018 electricity output. Electricity output has been growing by about 2.5% per year so in 2040 electricity output would be 1.72 times higher than 2018 (assuming constant 2.5% annual growth) and the 1250 TWhr needed for a 500 million BEV fleet would be 2.7% of total electricity output. Much of this electricity would be used during overnight hours when there is plenty of charging capacity, typically a BEV is charged overnight when electricity usage tends to be low. Though as more solar power gets installed there may be cheap rates during the day and many may choose to charge at work while the sun is shining.
Hey Dennis
I have some magic beans I would love to sell you?
Hey, I am trying to sell him a bridge. Get outta here with your beans. 😉
I own that bridge in Brooklyn already. Have purchased several times. 🙂
Have all the beans I need.
IEA says 300 million EVs in 2040, my scenario suggests about 800 million, 500 roughly splits the difference, the IEA has done pretty poorly on new technology, see their predictions on PV solar. My guess is that their estimate will be easily surpassed.
Is there some reason you guys believe that a 2.5% annual growth rate in electrical output is not possible? That is the average rate over the past 10 years. For the past 20 years the rate of growth has been 3% per year.
https://www.investors.com/news/electric-cars-ev-costs-tesla-gm/
Article above says 40% to 50% share of market by 2040, 50% would be about 650 to 700 million personal vehicles.
Dennis you just cited biggest fake news sites on the internet..Here is an example.
Don’t Tell Anyone, But We Just Had Two Years Of Record-Breaking Global Cooling
Inconvenient Science: NASA data show that global temperatures dropped sharply over the past two years. Not that you’d know it, since that wasn’t deemed news. Does that make NASA a global warming denier?
https://www.investors.com/politics/editorials/climate-change-global-warming-earth-cooling-media-bias/
And here is the truth
The 20 warmest years on record have been in the past 22 years, with the top four in the past four years, according to the World Meteorological Organization (WMO)
https://public.wmo.int/en/media/press-release/wmo-climate-statement-past-4-years-warmest-record
The last five years have been Earth’s warmest since records began
https://www.technologyreview.com/f/612908/the-last-five-years-have-been-earths-warmest-since-records-began/
A typical car gets about 30 miles per gallon
Sadly, the average US car on the road gets about 23MPG. You’re thinking of new cars…
Take 3.2T Vehicle Miles traveled, divide by about 143B gallons of gasoline per year = 22.6MPG.
https://www.fhwa.dot.gov/policyinformation/travel_monitoring/19martvt/19martvt.pdf
https://www.eia.gov/tools/faqs/faq.php?id=23&t=10
26 mpg??? With all this speed limit in the USA?!!?
Not everyone is driving pickup truck.
That’s something something a few colleagues from marketing need with their “never under 100 mph” driving style.
I personal have 47 mpg Diesel (my consumption the last year), with a relaxed but not strictly slow driving style. Gas would be round about 20% more with the same car. Half of driving is Autobahn.
I don’t really understand why US cars are that thirsty. In my US-Vacation we had a Toyota Corolla with a strange engine not available in Europe.
Nominal much Power, and lots of cylinder capacity. And a stupid automatic drive – always switching gears in the worst moments. And nothing to see of all this power, accelerating sluggish like a fat cow.
This thing managed to consume 30 mpg on mainly US highways with their speed limit. That’s driving where the consumption meter in my cars shows round about 60 mpg – chugging with 50 mph around.
And it’s even a US car – a Ford Focus, engine not available in the USA.
“According to the IEA” they expect “net oil demand to be 12 million barrels a day higher in 2040 compared to 2016”. Based on the discussions in this very thread, where is this 12 million barrels supposed to come from? Synthetic fuels, produced using cheap surplus electricity from solar and wind? You yourself in your comment on 06/11/2019 at 5:06 pm suggest that this is highly unlikely.
As far as the IEA’s track record goes, below is one of my all time graphics, courtesy of a twitter feed at the following URL:
https://twitter.com/AukeHoekstra
Former NASA scientist and climate advocate James Hansen said “suggesting that renewables will let us phase rapidly off fossil fuels in the United States, China, India, or the world as a whole is almost the equivalent of believing in the Easter Bunny and Tooth Fairy.”
https://dotearth.blogs.nytimes.com/2013/07/23/jim-hansen-presses-the-climate-case-for-nuclear-energy/?_r=0
Solar and Wind produced less than two percent of total world energy in 2016 — IEA WEO 2017
https://www.iea.org/publications/freepublications/publication/KeyWorld2017.pdf
Renewable energy ‘simply won’t work’: Top Google engineers
http://www.theregister.co.uk/2014/11/21/renewable_energy_simply_wont_work_google_renewables_engineers/
Warning of shortage of essential minerals for laptops, cell phones, electric cars, solar panels, wiring
https://www.sciencedaily.com/releases/2017/03/170320110042.htm
Study predicts world economy unlikely to stop relying on fossil fuels
https://phys.org/news/2016-02-world-economy-fossil-fuels.html
At this rate, it’s going to take nearly 400 years to transform the energy system
https://www.technologyreview.com/s/610457/at-this-rate-its-going-to-take-nearly-400-years-to-transform-the-energy-system/
Air Pollution Casts Shadow over Solar Energy Production
http://pratt.duke.edu/about/news/solar-pollution
Germany Runs Up Against the Limits of Renewables
https://www.technologyreview.com/s/601514/germany-runs-up-against-the-limits-of-renewables/
Baby Doomer says: “Air Pollution Casts Shadow over Solar Energy Production”
The article says that “the pollution” is 92% dust. I guess that we should focus all of our efforts to remove dust from the air. It would free up valuable time if we could eliminate the chore of dusting, as well as making solar energy more efficient.
They also don’t work in very hot temperatures either
Desert sun in Qatar too hot for solar panels to work
https://www.thetimes.co.uk/article/desert-sun-in-qatar-too-hot-for-solar-panels-to-work-h23kmktbp
Why sustainable power is unsustainable
https://www.newscientist.com/article/dn16550-why-sustainable-power-is-unsustainable/
In the real world USA- no site has that problem (overheated panels).
They work great in Amarillo, Albuquerque, Ajo, Yuma, Mojave, Bakersfield, St George, Durango, etc.
If you are so despondent, what are doing wasting your time here?
Shouldn’t you be busy digging your hole?
Baby Doomer, and anybody else who posts on this site who links to Seeking Alpha about electric cars in general , and Tesla in particular, is either a troll or an idiot, or BOTH.
The seeking alpha ( not WORTH capitalization henceforth imo) link uses the super charger price of charging versus the very cheapest hybrid cars and current gasoline prices to come to the conclusion that you can buy gasoline cheaper for a car such as a Prius. It very likely vastly overestimates Tesla battery degradation, fails to recognize that a Tesla is a super car in terms of performance, and that an electric car with performance similar to that of a Prius would go farther on the same kilowatt hours, etc.
The BIGGEST single lie in that link is that supercharging is there for people who are taking long trips, or who get caught out in an emergency. Charging at home, or at a charger coming soon to your local big box store, or at your parking slot at your place of employment, will cost a HELL of a lot less, as much as two thirds less. Nearly all charging will be at home, or job locations, or shopping locations, with hardly any of it at superchargers, except in the case of ev owners who don’t CARE if it costs three times as much to charge up that way.
Range reduction in cold weather IS a real issue, but almost anybody who owns an electric car will still be able to use it in the usual way on a day to day basis…. and still pay a lot less for electricity to charge it than he would have to pay for gasoline to run a comparable conventional car. Furthermore, within a few more years, it’s reasonable to expect that heating the cabin will take half as much energy…… because the interior of a new electric car will be super insulated with one or another new kind of insulation.
Electric car factories and especially battery factories will run twenty four seven after the next oil supply crisis hits, and one WILL hit, because history is NOT over.
Anybody who wants a new electric car at that time will only get it by paying the dealer a ton of extra money for extras that cost the dealer almost nothing… because that’s the way the dealership model works. Tesla may ( probably imo will ) pull the same trick…….. simply by providing only tricked out cars, with lots of extras that bring in lots of money while costing hardly anything at the factory.
Laws will be passed right and left encouraging the purchase of new electric cars and discouraging the purchase of new conventional cars and trucks, especially larger ones that consume a lot of fuel.
And people that now bitch about slow charging and limited range and so refuse to consider electric cars will switch to bitching about gasoline rationing and stores out of gas, and change their tune in favor of electric cars.
The transition from gasoline and diesel in cars and light trucks may very well come to pass at rates anticipated only by such people as Tony Seba.
Diesel fuel for a big truck already costs about the same as the drivers hourly wage in lots of places, or even MORE. Business owners will switch to electric trucks as fast as they can put their hands on one, based on fuel cost savings alone, once they are widely available…… maybe as soon as five years from now. I’ve driven a dump truck for ten hours for days on end…. and put only two hundred miles on the odometer per day, waiting in line to either load or unload. A tractor trailer used to deliver to stores generally runs only a couple of hundred miles, or less, often a LOT less, per day.
Batteries are GOOD ENOUGH now to get the job done at least half the time, and before too much longer, battery powered vehicles WILL be cost competitive, without any subsidies.
And when bev’s get to be just twenty percent or so cheaper than they are now, there will be an AWESOME boom in the small scale solar energy field, as tens of millions of businesses and homeowners realize they can save a TON of money on purchased juice by charging up from their own little solar energy factory a substantial part of the time.
“50 million electric vehicles will be in operation by 2025, and 300 million by 2040”
The latter number seems not to be plausible, in 2020 there is a good chance that 40% or more of the new cars are EVs, this gives much more than 300 million for 2040.
Add busses, vans and trucks…..
2019-06-12 Rystad Energy estimate of world proven oil reserves
https://www.rystadenergy.com/newsevents/news/press-releases/United-States-cements-its-position-as-world-leader-in-oil-reserves/
Thanks Energy News,
The 2PCX estimate suggests a URR for World C+C of 3556 Gb, which seems to high to me. The 2PC estimate suggests a URR of 2570 Gb if we add cumulative C+C production of 1370 Gb through the end of 2018. My “medium estimate” of 3200 Gb for World C+C would imply about 600 Gb of cumulative discovery (including reserve growth), if the 2PC estimate by Rystad is correct. My high estimate of about 3685 Gb is a bit higher than the Rystad 2PCX estimate, my low estimate is about 2750 Gb for World URR, so in round numbers my estimate is 3200+/-500 Gb vs maybe 3100+/-500 Gb for Rystad.
In short, my estimate is in the same ballpark as Rystad’s.
And if you really believe the USA has 300 billion barrels of proven reserves, I have a bridge I want to sell you. Every bar on this chart is at least twice as high as it should be. Except Venezuela of course. But if they are not counting heavy oil why are they counting Canadian Tar Sands?
So OPEC + non-OPEC = ~ 1800 billion barrels?
Wasn’t Laherrere estimate more for URR ?
Yes, U.S having 300 billion barrels of economical recoverable or even technically recoverable oil is questionable to me.
Agree the US estimate may be too high. Perhaps they don’t expect Venezuela to ever recover from their political troubles.
The URR estimate by Mr Laherrere would be closest to the 2PCX estimate, he has 2800 to 3200 Gb based on an HL of C+C-XH of 2600 to 3000 Gb and an estimate for extra heavy oil of about 200 Gb. So the 2PCX estimate is about 350 Gb higher than Mr Laherrere’s high estimate. My estimate is a little higher than Mr Laherrere’s with 420 Gb of extra heavy and tight oil for my best guess (350 Gb of XH and 70 Gb of tight oil) and 2800 Gb of conventional oil for my best guess (about 3200 Gb) which is about 200 Gb higher than Mr Laherrere.
Bottom line is that we don’t know, that is why my models have a wide range from 2750 Gb to 3700 Gb encompassing both Mr Laherrere’s estimates and those of Rystad.
The easy oil is gone
Oil discoveries peaked in the 1960’s.
Every year since 1984 oil consumption has exceeded oil discovery.
In 2018 oil discoveries were about 9 billion barrels; consumption was about 35 billion barrels
Of the world’s 20 largest oil fields, 18 were discovered 1917-1968; 2 in the 1970’s; 0 since.
https://imgur.com/a/6dEDt
https://www.rystadenergy.com/newsevents/news/press-releases/oil-gas-exploration-winners-2018/
https://www.chron.com/business/energy/article/Oil-discoveries-in-2017-hit-all-time-low-12447212.php
Baby Doomer,
About 1370 Gb have been produced and a total of 2570 Gb has been discovered, another 200 to 800 Gb of cumulative discovery (new discoveries and reserve growth) is likely. Currently there is roughly 500 Gb of producing conventional reserves and another 430 Gb of resources to be developed if there is no future reserve growth or discoveries. Oil will peak and decline, when that occurs and how fast the decline might be is unknown.
The oil sands projection seems a bit unrealistic considering that oil sands take up 1/3 of Canada’s natural gas consumption.
“Natural gas is largely used in the oil sands to generate steam to inject into underground formations to thin the heavy, sticky bitumen crude and allow it to be pumped to surface. The growth in so-called “thermal” projects is the main driver behind increased oil sands demand for natural gas, the NEB says.
Environmentalists were quick to describe the oil sands industry use as a waste of a cleaner-burning resource that would be better used to heat homes, generate electricity or create plastics.”
https://www.bnnbloomberg.ca/oil-sands-production-using-nearly-one-third-of-canada-s-natural-gas-1.728578
What happens when there is no more natural gas?
Can they import the natural gas to continue production?
Iron Mike,
About the only option for a source is the US but the pipeline access to bring enough NG to the oil sands is lacking. The Permian has lots! but it’s all in Texas and New Mexico. Some may come from the Bakken but I don’t know.
There are two major plays, the Duvernay and the Montney, in Northern British Columbia and Alberta to the west of the oil sands, that supply NG and production is being expanded because of lots of interest from majors and smaller independents both, and they may be providing more in the future. I (blush) haven’t looked.
There is an NG play farther north in BC, the Horn River, but there’s a pipeline to the Pacific Coast for that one, to supply Asian demand.
Thanks for the info Synapsid. Interesting to see how they will play it.
The End of the Oil Age is Imminent!
Recently, the HSBC oil report stated that 80% of conventional oil fields were declining at a rate of 5-7% per year. This means that there will be an oil shortage of ~30 million barrels per day by 2030 and ~40 million barrels per day by 2040.
http://www.scribd.com/document/367688629/HSBC-Peak-Oil-Report-2017
What is mentioned far less often is that annual oil discoveries have lagged annual production since the 1980s.
https://imgur.com/a/6dEDt
Now, this problem has nothing to do with the recent decline in the oil price, which started in 2014. This has been an on-going problem for the past 30 years. Now, the IEA is predicting oil shortages by ~2020 due to declining exploration.
https://www.wsj.com/articles/iea-says-global-oil-discoveries-at-record-low-in-2016-1493244000
Here, the IEA blames this problem on the low oil price. But, this problem started in the 1980s. The problem is geological: we are running out of conventional cheap oil. Shale and tar sands are not the answer, either. Those resources are far too expensive, compared to conventional oil, because the global economy is based on cheap conventional oil. Expensive oil is not a replacement for cheap oil.
Based upon the HSBC report and the IEA, the End of Oil Age will start around ~2020: there will be a dramatic economic depression due to exhaustion of cheap oil. This will cause a global economic collapse.
The name Elon Musk has been well chosen; it defies categorization as to race, class, religion, etc.Ever met or even heard or read of an Elon, or a Musk? So rare a combination as to have no established profile.
People of a certain kind, created in large numbers by our education system, can project themselves onto the Elon image, and feel very pleased with themselves. ‘He’s young, cool, hopeful, clever and rich, cosmopolitan just like me,and will take us to another world now this sad old mud ball is nearly finished!’
We are witnessing one of the most brilliant propaganda creations, appropriate for late-stage industrial, mass, civilization!
It’s really quite staggering that the propaganda and mind-conditioning system is projecting Elon Musk as the man to solve ALL our problems, and that this is being pushed energetically on children in school.
The Soviet Union could not have done better: it’s Uncle Joe Stalin – he’d even pop up and fix your car if it broke down, with a cheery smile and a ‘No problem, Comrade!’ as he lit his pipe and waved you on your way.
The majority of people are so historically ignorant -and have been kept so – that they can’t see this for what it is.
Ok. I am pretty sure this is the same person who has been banned from the group in the past. He disappears then signs up again using a different name.
Time to put him on the hide list so I can scroll past.
Boomer II, I don’t think it’s so simple as to dismiss what Baby Doomer is saying. His manic posting style is overwhelming, but they’ve all been valid points. I will agree, however, that the mental fixation on the doom and gloom is both bad for one’s mental health and likely to sap any potential motivation one has to try and improve the situation. Ron and B. Doomer are probably right that a decent chunk of humans are likely to meet an untimely end soon, possibly this next decade (2020’s). I think everyone who reads this blog intuitively knows this is a distinct possibility, and fortunately we have this blog to come and talk about this issue with other folks, not that we don’t all probably have PTSD from this knowledge anyways.
But while we can look at apocalyptic die offs and genocides like the Native Americans and assume humanity as a whole will go that way as oil supply withers, it’s much more likely we’ll have a partial die off situation like Europe and Asia experienced as the bubonic plague swept through periodically from 1200-1700. Many cultures, from London to Constantinople to Mumbai, at times lost up to half of their populations and had their economies ground to a standstill for decades, yet managed to maintain longterm cultural and political continuity for the most part. A middle scenario somewhere between the apparent smooth transition outlined in Dennis’s graphs (despite his many qualifications, they still give the impression of an orderly transition) and the death of everyone predicted by B. Doomer et al is the more likely outcome.
Humans, as is the rest of life, are extremely resilient and adaptable. You can’t have your cake and eat it too, doomers – if there’s a big human die off, the environmental outlook becomes much better, especially since decentralized energy sources like solar are likely to rule the day in a less organized future (just look at rural developing countries – they all opt for decentralized power sources). And so far as not being able to do anything about your own survival, that’s not true either. Individuals who anticipate what the future will need, master skills in those areas (gardening, repair work, renewable energy, etc), and make themselves indispensable to their communities will invariably have the highest likelihood of survival, as folks like Richard Heinberg have been saying for ages. If your neighbors value you, they’re likely to go to some trouble to keep you alive. If you’re just a cranky old curmudgeon who uses the internet too much, I’m afraid your odds aren’t as good. And especially the folks with the remote in one hand and the gas pump in the other are not likely to fare well.
As an off topic finish (and a tip of the hat to George Kaplan, whose posts are sorely missed), if anyone is looking for a good peak oil read this summer and hasn’t come across David Mitchell’s Bone Clocks, I highly recommend it. The last hundred pages has – to me – a very realistic account of how we are likely to experience the next few decades.
https://www.theatlantic.com/entertainment/archive/2014/09/review-david-mitchells-bone-clocks-the-cloud-atlas-authors-meta-masterpiece/379445/
Agree with your statement Stephen.
In a different post I supplied the name of the person I think this is. He was banned from making comments by about six different websites.
That’s why I am hiding his comments here. He raved.
Also there was nowhere to go with his thinking. He wanted us to contemplate our doomed future. But if we accept his particularly grim, and coming soon, future, why bother to hang out with him in this forum? I think it would make more sense to spend one’s last years on earth being with loved ones, enjoying nature such as it is, etc. How fulfilling is it to talk over and over about death with strangers? Even religion provides an option — salvation, reincarnation, etc. There is nowhere to go with his ideas, so I’m not wasting energy on him.
In a way, he made his point to me. Listening to him was a futile activity.
Fair enough, good points.
EIA Lower 48 Crude Oil and Lease Condensate Production by Degrees API Gravity (kb/day)
Chart: https://pbs.twimg.com/media/D84lnMTXkAAmPCa.png
Change over 2 years: https://pbs.twimg.com/media/D84pmPCWwAEc0fY.png
EIA data: https://www.eia.gov/dnav/pet/pet_crd_api_adc_mbblpd_m.htm
US inventories week/week change (1000 barrels)
Crude Oil +2,206
7 oil products +132
Total (crude oil + 7 products) +2,338 (shown on chart)
Propane & Natural Gas Plant Liquids: +8,421
SPR 0
Line 13 Adjustment +4,130
Seasonal: Total (crude oil + 7 products) +66,872 year/year
Chart: https://pbs.twimg.com/media/D84ikccWwAobekj.jpg
Inventories: the sum of the USA + Fujairah + Japan (million barrels)
Chart https://pbs.twimg.com/media/D84jFmPWsAMgKQ_.png
Chart split Crude & Distillates https://pbs.twimg.com/media/D84jicSX4AEBDof.png
Fujairah https://pbs.twimg.com/media/D82NzIJXkAEqaOk.png
Japan https://pbs.twimg.com/media/D82OQCgW4AAVPnZ.png
What we are seeing in the increased, are mostly garbage oil. The increase in exports have been primarily from Mars. Oil inventories increase significantly from Delaware overage at API of 60, and the US has an overage of inventory. No, we have an overage of oil at 60% API. The world is still short, we just have a lot of high API oil in the US. Duh? Penalize the world, because the US is stupid beyond any possible explanation.
The Bear Flag pattern on WTI short term charts(5min chart-2hr chart) i spoke of last friday. Played out like a bear flag pattern does. Support is at around $45. This is trendline support. If you want to get real technical it a tad under $45 but the slope of this trendline isn’t extremely steep. So support will be at about $45 or just a tad higher for next 2 months or so.
I don’t see any reason price doesn’t visit this trendline. Price alway seeks out either support or resistance. It can hangout in between support and resistance for awhile. But professional traders make their entry and exits at or around support or resistance depending on what kind of candlestick pattern forms at or around support or resistance.
There is a certain amount of inside knowledge around every market event that happens and that knowledge gets traded. It shows up on price chart as either price was pushed into either support or resistance and those with inside knowledge traded accordingly at just the right time. Professional traders know what to look for. And don’t need inside knowledge. The algo’s that everybody seems to believe run the whole show are never in the market or hold trades long enough in the market to mean very much other than quick profits for their owners. They totally work within the parameters of technical trading. Smart traders don’t lose money to them. Because they don’t allow themselves to get into bad trades when price is in the middle of no man’s land between support and resistance on a chart.
Price will bounce off trendline support when it’s reached. Can price develope support at this trendline and then move higher as in back to $70-80 WTI? Well if the trendline holds that is exactly what price will do unless price tests this same trendline again on down the road and it fails.
But the overall picture points to a break of this trendline in my opinion. And if the larger overall technical pattern plays out. WTI in the low $20’s is what is coming. It would also be the time to buy.
I’m thinking it’s possible we get a pretty large dip in shale oil production that last 1-2 maybe 3 years followed by a pretty big rebound. When price actually does start to recover.
HHH.
I think we could see several shale BK if WTI stays here or goes lower for remainder of 2019.
I’m not just talking about the small fries like Sanchez, Halcon or Roan.
I could see Whiting, Oasis and/or QEP going down.
Also many of the service companies are on very shaky ground and could fall if we have another 2016 and rigs drop quite a bit.
This will move oil up for awhile
https://www.bloomberg.com/news/articles/2019-06-13/oil-tanker-on-fire-in-sea-of-oman-u-k-body-starts-probe
Aint gonna go up in all that scroll and answer one by one. Instead, will number 1 through 2 or 3 or 5 or whatever.
1) EVs are not allowed to manufacture their own measurement. If they lose range in winter, under absolutely no circumstances are drivers allowed to turn the heat down or stereo off. ZERO change from behavior in a gasoline car is permitted to get a right and proper measure of comparative range loss. This is the usual claptrap about how something works if only people would change their behavior.
2) Somewhere up there someone said China consumption is falling. I have seen this unfolding elsewhere the last 24 or so hours since the Bible was released. Denial and grief blah blah. China’s oil consumption rose over 5% last year. India’s oil consumption rose even more than that last year. Maybe it was gasoline burned hauling electric scooters to places.
3) I direct folks to a tab on the BP release. It tracks not just consumption, but product consumption, including middle distillates. You can see diesel and jet fuel.
I still don’t understand the fixation on EVs. I think they become an option as oil scarcity increases. I am less confident that they will be the reason for declining demand.
To me EVs make sense as a way to reduce carbon emissions more than as a way to reduce oil demand. I think recession will be the bigger reason for reduced demand.
I can imagine oil production tanking for a number of reasons. EVs aren’t at the top of my list.
I can imagine people buying fewer vehicles rather than substituting EVs for ICE vehicles.
So haggling over how well EVs replace ICE vehicles in terms of cost and performance misses the point to me.
EVs seem like a possible option for the middle class. But what if there’s no middle class anymore?
Boomer 2,
Some of us expect the price of EVs will fall and they will be cheaper than ICEVs. In addition autonomous vehicles will probably eliminate car ownership for most people. Companies will buy cars to go into the transportation business, no drivers needed. Car ownership will be for the very wealthy. All of the other stuff can happen, people may decide to reduce their mobility, but historical trends have been for increased mobility.
Of course trends can change and often do.
We have already seen that delivering purchases has been killing off shopping centers.
Now grocery stores and restaurants are pushing delivery very hard.
And teens are less interested in getting drivers licenses than they used to be.
I think we could slash many vehicle trips without reducing quality of life. It would be different, but not necessarily a deprivation. People apparently like getting stuff from Amazon more than driving to a store to buy it.
If we can get average passenger load in cars up to 3 or 4 then that will be a big economic boon to users and cause a large drop in fuel demand.
If the same is done with EVs the savings is even larger, the demand reduction for fuel even greater.
Both cause reduction in environmental harms.
B II’s question about what if there is no middle class points to reasons for car-pooling and increased passenger load in vehicles. It will make the vehicles more affordable. Reduce road congestion also.
Boomer 2 and Gone fishing,
I agree with both your comments. Seems it should be pretty easy to arrange car pools with a good smartphone app. Also transportation as a service doesn’t depend on either EVs or autonomous vehicles, but does lend itself to car pooling.
Autonomous vehicles will allow another passenger as an Uber currently requires one seat to be used by the driver.
“If we can get average passenger load in cars up to 3 or 4”
I think that it would be easier to fit a camel through the eye of a needle. First, that calculation needs to be distance weighted. In a small town, it is relatively easy to take 3-4 kids to soccer, baseball – whatever. In my experience, in a large metro area, it is virtually impossible to pool riders. In 16 years working in the Dallas-Ft. Worth area, only one year did I know somebody at work who lived within 2 miles of where I lived. Even then, we could not carpool. I was going to college 4 nights a week straight from work.
My recent (sparse) experience in large metro areas that have a dedicated car pooling lane that requires 2 or more in the car: it is usually 2, and the lane is usually not crowded.
I spend way too much time going different places in a vehicle. Much of it in areas where there isn’t convenient or flexible transportation.
It’s easier when you have a predictable schedule, but if you are running from place to place without much of a pattern, it is very hard to find rides.
So all that would need to change to save fuel: Homes closer to jobs. Way more public transportation. Fewer kids’ extracurricular activities that are beyond walking or biking distance or can’t be combined into carpools.
As affordable oil becomes scarce, we will become affected one way or another. The issue is how we plan to deal with it.
Boomer II
Study reveals that green EV incentives could actually be increasing CO2 emissions
https://phys.org/news/2017-06-reveals-green-incentives-co2-emissions.html
Are electric cars worse for the environment?
https://www.politico.com/agenda/story/2018/05/15/are-electric-cars-worse-for-the-environment-000660?cid=apn
Morgan Stanley Says Electric Cars Create More CO2 Than They Save
https://www.marketwatch.com/story/want-to-fight-climate-change-dont-invest-in-tesla-2017-08-17?mod=markets_twitter_new&link=sfmw_tw&mg=prod/accounts-mw
Electric vehicles emit more CO2 than diesel ones, German study shows
https://www.brusselstimes.com/all-news/business/technology/55602/electric-vehicles-emit-more-co2-than-diesel-ones-german-study-shows/
All of these links point to arguments that don’t make sense at face value. Electric vehicles have a lot in common with those fueled with liquid or gaseous fuels in that they all have bodies, suspension, brakes, steering, seats, headlights, signal lamps and many other components and systems. Where they differ is that EVs use a battery, electronic motor controller and electric motor as opposed to a fuel tank, fuel delivery/metering system, exhaust system and internal combustion engine. Why would the manufacturing of any one emit significantly more CO2 than the other?
When it comes to day to day operation, the emissions associated with EVs are closely linked to the emissions of the source of electricity which varies from place to place. Even so, I submit that a traffic jam with all EVs has to emit less than a traffic jam with all ICE vehicles.
At any rate, most of those stories have been thoroughly debunked for anyone who cares to do a cursory search for “—– debunked”. I would like to remind readers that Charles Koch backed efforts to push back against EVs have been exposed and I would not be surprised if these stories are part of those efforts. It leads one to wonder if those who chose to propagate this disinformation are also part of those efforts?
There is propaganda on both sides. EVs aren’t a silver bullet. The battery production produces a buttload of pollution and environmental destruction. That is a fact.
Excuse me for saying. But sometimes the way you speak of EVs it is almost as if you have a dog in the fight.
Similar to a hardcore Christian defending Jesus.
Iron Mike,
I am not sure anyone has claimed EVs are perfect, nothing is.
Is your contention that they are worse for the environment than ICEVs?
If so, I disagree.
Perhaps you are skeptical of mainstream climate science and believe the IPCC conclusions are completely wrong.
Skepticism is good, but ignoring the scientific consensus likely carries great risk.
Cars and car culture in general is just plain stupid, whether manifest as ICE or E.
It detrimentally affects city and town development (You mention walkability somewhere else in these threads, yes?) and human interaction between nature and people, creates sprawl, creates vast areas of pave-overs and parking lots; smashes into animals, kills/maims them and people, needlessly uses up/wastes resources and creates waste and pollution, and so forth. Cars are dangerous, fast-moving bubbles removing their occupants from many facets of reality.
At the very least, if you’re going to have the things, share your car or cars, if you don’t already, when you use it or them, or even when you don’t. Stuff it with people.
Last week, I was waiting on my bike for a traffic light to change and nearby was a women– the only person– in a ‘Flex‘ car. I said to her, pointing at her car, “It’s too big.”, and then decided to point up and say, “Climate change.”. She heard but didn’t respond until the light turned green and then, as she was pulling away, said, “Have a nice dayyy.”.
Caelan,
I mostly agree. In rural areas, life would be pretty difficult without a car.
At some point there will be more car “sharing” as TaaS takes hold and fewer cars, it will be easier to carpool/ share a ride to reduce cost.
Ignoring that highly factual numeric “buttload” number and well documented “fact”.
IM said “Excuse me for saying. But sometimes the way you speak of EVs it is almost as if you have a dog in the fight.
Similar to a hardcore Christian defending Jesus.”
Maybe Islandboy simply realizes that all or our butts and the lives of most creatures/plants on earth are in the crosshairs now, with renewable energy and EV’s as just one way to slow the massive changes that are occurring without forced austerity and purposeful killing of the population (already starting to happen).
What are you fighting for Iron Mike? Suppression of expression?
Actually I sort of do have a dog in this fight but not in the way most people would construe, having a dog in this fight. Like most people who participate on this blog I do not see Peak Oil as a theory or something that may or not be going to happen. I see Peak Oil as an inevitability, just like night follows day or everyone that is born will eventually die. If anything were to keep me up at night it would be the specter of Peak Oil.
Having said that, one of the reasons I read this blog is to keep an eye on one particular pet interest of mine, Ghawar. Matthew R. Simmons, author of Twilight in the Desert is reputed to have said, “As goes Saudi Arabia goes the world”. Since the Ghawar complex is responsible for around a third of Saudi oil production, my version of that quote is “As goes Ghawar goes the world”. Based on what I have learned from all the wonderful people on this blog and before it The Oil Drum, I believe a graph of production from Ghawar is going to look more like a shark fin than a bell curve. This belief is based a a graphic that was taken from a post by Stuart Staniford on March 26, 2007 at theoildrum.com:
Water in the Gas Tank
I also have read the section of The Hirsch Report where Hirsch wrote about Peak Oil mitigation and how long it is going to take to deal with the problem. I just watched a 2012 presentation that Hirsch gave at ASPO at the following link:
https://www.youtube.com/watch?v=PVoDYha8ZRM
My understanding from The Hirsch Report, reinforced by the video is that, his take is that Peak Oil is a transportation fuels problem and that it will take decades to change out the existing fleet of road vehicles, not to mention aircraft and ships for which no practical solution yet exists. As a result I choose to focus on what I see as measures that can be undertaken right now with a view to lessening the transportation fuels problem.
I also have the perspective of living on a fairly small island unlike the vast majority of the folks who participate here. Most islands have limited options for generating electricity and many still use petroleum based fuels to generate electricity. In the case of the island where I live, that is changing very slowly but, is about to experience a fairly significant step change by the end of this month when two new facilities are expected to be feeding power into the island’s grid. One is a 37 MW solar farm that my sources tell me, fed up to 30 MW into the grid during a test last week and the other a 190 MW combined cycle gas turbine, to be supplied with “Freedom Gas” by a Florida based outfit, New Fortress Energy.
The island’s peak demand is about 650 MW and another 120 MW CCGT was converted to use NG back at the end of 2016, making the portion of the island’s electricity fueled by NG 310 MW, almost half of the peak demand. There is also an existing 20 MW solar farm, 100 MW of wind, almost 32 MW of hydroelectricity and an estimated 30 MW (and growing) behind the meter solar PV. This is progress, going from more than 95% of electricity from petroleum based fuels to less than half in the twelve plus years since I became aware of Peak Oil.
This brings me back to EVs. Currently, I am aware of about twelve Nissan electric vehicles in the island, 9 Leaf cars and 3 eNV200 vans. This is an insignificant number but, there is increasing interest and just a couple of days ago press reports came out that the local utility plans to roll out public EV charging every 30km along major routes by the end of this year. If the island were to successfully transition it’s fleet of road going vehicles to electric power and further decrease the amount of electricity sourced from oil, it would be in a far better position when the effects of Peak Oil are undeniable. See what I’m getting at?
Finally, my training is in the field of electrical engineering so, EVs and solar PV are right up my street so to speak. That gives me a dog in this fight in a round about sort of way. I wish I had bought shares in Tesla back around the time of the IPO instead of buying up lots of PV with the funds I had available. It is a decision I sorely regret.
Hi Islandboy,
Last I read Ghawar was at about 3.8 Mb/d, so it is already in decline, the supergiants might see a sharkfin decline, but the data is not very transparent.
Twilight in the Desert was also my entry into Peak Oil, I read it in 2006 and then found the Oil Drum.
At some point output will peak, but the rate of decline is only likely to be steep when demand dictates in my opinion.
“At some point output will peak, but the rate of decline is only likely to be steep when demand dictates in my opinion.”
If I were as confident as you, I wouldn’t even be here! It is my concern that decline may turn out steeper and sooner than you think that drives me. We will have to agree to disagree.
I am with Ron in believing that we are just about past Peak Oil right now.
Islandboy,
Have you read any of Laherrere’s work?
In my lowest model (2750 Gb URR) with constant extraction rates, decline rate is fairly slow. Laherrere’s lowest recent estimate is 2800 Gb for World C+C URR.
https://aspofrance.org/2018/10/03/updated-extrapolation-of-oil-past-production-to-forecast-future-production/
If there is adequate demand it seems unlikely that extraction rates will decrease.
” wish I had bought shares in Tesla back around the time of the IPO instead of buying up lots of PV with the funds I had available. It is a decision I sorely regret.”
I think your PV investment will be much better than TSLA stock. Its going BK in less than 18 months.
“Its going BK in less than 18 months.”
And then this prediction/claim meets reality…..
The government just published the petroleum data for 2018 in the last couple of days. Below is a graph of Petroleum Consumption by Activity. The line for Electricity generation is going in the right direction while the line for Road & Rail Transportation is indicating a growing dependence on oil, the wrong direction IMO. I expect with the commissioning of the new 190 MW CCGT plant, we should see a huge drop in oil consumption for electricity generation starting next month. Unfortunately this data is released once per year (some time in June) so we will have to wait another year before we find out for sure!
Baby Doomer
The last German report has been slaughtered for being unserious and biased, favouring the diesel car.
True. That report compared diesel to EV cars being charged primarily by coal fueled electricity. It was written in an extremely biased manner, not even trying to be straightforward about the issue.
In the future, say beyond 2030,
most new vehicles will be electric, as by then the advantages of simplification of the systems will be obvious to all.
Its good, because the world will be well beyond peak oil by then.
The oil producers will be glad to know that the chance for many years of much higher oil pricing in the coming decade is highly likely.
“Manufacturing a mid-sized EV with an 84-mile range results in about 15 percent more emissions than manufacturing an equivalent gasoline vehicle. For larger, longer-range EVs that travel more than 250 miles per charge, the manufacturing emissions can be as much as 68 percent higher.
These differences change as soon as the cars are driven. EVs are powered by electricity, which is generally a cleaner energy source than gasoline. Battery electric cars make up for their higher manufacturing emissions within eighteen months of driving—shorter range models can offset the extra emissions within 6 months—and continue to outperform gasoline cars until the end of their lives.”
https://www.ucsusa.org/clean-vehicles/electric-vehicles/life-cycle-ev-emissions
Watcher,
Thanks, great find.
If we take light and middle distillates (see Regional Consumption tab) and divide by crude plus condensate production we get 82.7% for 2018. If we take the weighted average from 2008 to 2018 the light and middle distillates divided by C+C output is 80.5%. For 2000-2018 it is 78.6%. The trend for the natural log of light and middle distillate output is 1.62% per year from 2000 to 2018.
The long term trend from 1983 to 2018 is about 1.86%/year and more recently the 2007-2018 trend has had a 1.6% average annual rate of increase.
Oh, and another thing. From pretty much day 1 it was clear that nothing anyone says on a Blog is going to save the 6+ billion people who will die over the course of 3-5 years in the not very distant future. It’s useful to repeat that to yourself now and then.
By the way, given that jaw dropping Chinese surge in consumption, it would probably be a good idea to go back and find the information I posted some years ago about the optimal targeting on the Chinese east coast for interdicting oil imports. Details have likely changed by now. I remember at that time there were some large refineries not yet completed that surely are by now.
The India coast probably deserves similar attention.
This blog is turning into a competition between you, Ron and Futile Doomer to see who can be the most histrionically apocalyptic. Meanwhile, the world goes on, just like the day before. (except with more cars and people)
Greenbub,
I am pretty sure in each case they are concerned about the future of the planet, people express this in different ways.
Doomer’s posts are hidden to me. They are so similar to what Futilitist posted in the past (and who was eventually banned) that I don’t need to read them.
Ron’s posts I still read. Watcher has some theories I don’t agree with, but he posts enough useful info to keep me reading.
The next tanker attack in the gulf:
https://www.zerohedge.com/news/2019-06-13/2-tankers-damaged-after-suspected-torpedo-attack-near-strait-hormuz-oil-soars
Lot’s of smoke an mirrors in the newspapers – completely unknown which kind of attack and who was it. At least it turns the war clock some minutes up.
Re Exxon Valdez comment: The reports I have read say that one was carrying naphtha and the other methanol. Another report said that one of the ships was hit by a projectile rather than a torpedo. I have read previous reports that Israel may be a suspect in trying to start an attack on Iran. I would have thought that Iran would have too much to lose from this sort of attack at this time. Does anyone know if these were entering or leaving the gulf. I note that the damage was on the starboard side which would have been the opposite side to Iran if they were leaving.
NAOM
Reports indicate that Kokuka Courageous has a breach in the hull above the water line. That would seem to indicate a surface to surface projectile, like an anti-ship cruise missile for example, and not a torpedo or mine. Front Altair appears most heavily damaged.
“if Iran cannot export petrochemical products through the Persian Gulf, no-one will do this”. “Either everyone will export, or no-one.”
-Khamenei
except that he never said that. Its just more propaganda to start another war.
The Japanese tanker was carrying Iranian Oil, thus very unlikely to been attacked by Iran. Also today the US senate blocked the bill to prevent Arms sales to the KSA. Great timing don’t you think?
OPEC down to a five year low per secondary sources in May, lost 236k on net.
https://www.cnbc.com/2019/06/13/opec-oil-output-falls-to-5-year-low-in-may-group-warns-of-weak-demand.html
Russia was at 11.11 million in May but in early June was much lower at 10.87 million. All purported figures purportedly due to contamination problem fallout.
https://www.reuters.com/article/us-russia-oil-production/russias-oil-output-falls-to-3-year-low-due-to-contamination-crisis-idUSKCN1T52FK
Wonder how much of this reduction is voluntary?
Production from the 14-nation producer club fell by 236,000 barrels per day last month to 29.88 million bpd, according to independent sources cited by OPEC in its monthly report. It was the first time OPEC pumped below 30 million bpd since June 2014.
It looks like only Saudi Arabia’s cut was voluntary. Here’s the table…
OPEC production: https://pbs.twimg.com/media/D87-cBpVsAEOR3Q.jpg
Energy News,
Thanks, yes it looks like most of the drop is due to Iran. About 230 kb/d.
I’m aware self-reported and secondary figures diverge but how common is it for the trend to diverge too? Nigeria said they increased 41k but others say they declined by 92k? Is this common?
Interest dims in Oklahoma shale play as drilling results disappoint
NEW YORK (Reuters) – It promised to be the next great shale play, but an oil-and-gas-rich area of central and south Oklahoma has confounded many of the producers lured there, with one of its biggest champions warning that its business may struggle to survive.
In recent years, the SCOOP (South Central Oklahoma Oil Province) and the STACK (Sooner Trend, Anadarko, Canadian and Kingfisher) basins drew producers and private equity firms willing to wager billions of dollars on what many considered the next Permian basin, the largest and most prolific U.S. oilfield.
But while their many layers of oil mimicked the Permian, the region’s geology proved more inconsistent, undercutting results and making it a higher-cost U.S. shale area for producers.
Alta Mesa Resources Inc, which turned a $3.8 billion investment in the oilfield into under $30 million in just two years, last month said it may not be able to pay creditors.
https://www.reuters.com/article/us-oklahoma-energy-idUSKCN1TE1CE?utm_campaign=trueAnthem%3A+Trending+Content&utm_content=5d028a90b1a3150001dd1b53&utm_medium=trueAnthem&utm_source=twitter
“which turned a $3.8 billion investment in the oilfield into under $30 million in just two years”
That’s an ~0.01 amplifier of money.
The new mantra — as someone mentioned here on POB — is that crude oil has transformed from being a producer of wealth to a consumer of wealth.
I knew this comment was going to happen..I was going to say at the bottom someone will comment its a conspiracy by big oil..It never fails..lol
“Progress is not an illusion; it happens, but it is slow and invariably disappointing.” ― Orwell
not wanting to start consiparicy theories, but does iran have to gain from those attacks? it is one thing to supply arms to jemen, but this seems “odd”?
ZH is carrying a story this morning of the Japanese owner of one of the tankers saying that the ship was NOT hit by a mine.
The crew says they saw flying objects coming towards the ship before the explosion, and their damage was above the waterline. A mine would damage at or below the waterline.
The whole exercise looks less than competent to me. Probably not the Iranian Navy.
First mention of going to the UN in a long time. The prez campaigned on ending wars and starting no new ones. So far he has kept the 2nd promise.
His advisors seem inclined differently, but there was a quote today from Centcom saying it was not in US interests to have a war with Iran. I’m going to keep an eye on that commander and see if he’s removed.
The IEA expects non-OPEC supply to increase by 2.3M in 2020 from 1.9M in 2019:
Non-OPEC supply growth will accelerate from 1.9 mb/d this year to 2.3 mb/d in 2020. The US leads the gains, but solid growth also comes from Brazil and Norway.
https://www.iea.org/oilmarketreport/
Can someone tell me where all this new oil coming from next year? From what I see, the EIA and Rystad are expecting a moderation in US supply growth next year, not an acceleration. Not to mention, I don’t see how US shale can grow at all with oil in the low $50s…
Hell, it’s more than moderating this year, it’s flat. It’s not growing this year due to current price. Next year, it’s limited by internal growth, as there is no outside funding. Depends also, upon how much the majors eat up tasty, dying treats.
The only growth is in the imaginations of EIA and other pundits. Big shock coming, but won’t be apparent, because they just keep changing the estimates.
From the IEA monthly report:
“Seasonal refining activity will raise global throughput by 4.2mn b/d by August from May levels, according to the IEA, with the ramp-up concentrated in the western hemisphere.”
If refineries actually are going to increase throughput that much going forward – how exactly are “they” going to keep a lid on oil prices with supply dwindling from all sources? A large drain from commercial and/or strategic inventories just has to become visible soon.
https://oilprice.com/Latest-Energy-News/World-News/Exxon-Saudi-SABIC-Proceed-With-10B-Petrochemical-Plant-In-Texas.html
More building by Exxon to use Permian oil in the US. The only thing they plan on exporting is finished products.
More evidence that using the pending data file will get you close, but in no way very close. My last four wells were completed the end of April, resulting in about 9000 barrels produced. Recently, I’ve seen it in both the pending file, and now the production.
Just read where a shale driller announced intent to file BK and would wipe out $900 million of $1.6 billion debt.
If you gave me $900 million I am sure I could increase production too.
Note the most important word I typed above is “gave.”
Kind of like the service companies are “giving” away their services to shale. Check out the stock price of the largest shale contract driller, Nabors Industries.
Or read the stories of Roan Resources and Alta Mesa, both of which made billions of dollars worth less than zero in just a couple years or so.
The fact that most of the stripper wells guys have survived against this onslaught of free money is noteworthy.
But it isn’t over. We could still do great or still go bust. Long term price of oil could as easily be $30 as $60 or $80. No one knows.
Just read where a shale driller announced intent to file BK and would wipe out $900 million of $1.6 billion debt.
If you gave me $900 million I am sure I could increase production too.
Note the most important word I typed above is “gave.”
Kind of like the service companies are “giving” away their services to shale. Check out the stock price of the largest shale contract driller, Nabors Industries.
Or read the stories of Roan Resources and Alta Mesa, both of which made billions of dollars worth less than zero in just a couple years or so.
The fact that most of the stripper well guys have survived against this onslaught of free money is noteworthy.
But it isn’t over. We could still do great or still go bust. Long term price of oil could as easily be $30 as $60 or $80. No one knows.
Er, Shallow, while a repetitive viewpoint that you discuss is welcome, you may want to spread it out some?