A guest post by Ovi
Below are a number of crude oil plus condensate (C + C ) production charts for Non-OPEC countries created from data provided by the EIA’s International Energy Statistics and updated to February 2022. This is the latest and most detailed world oil production information available. Information from other sources such as OPEC, the STEO and country specific sites such as Russia, Brazil, Norway and China is used to provide a short term outlook for future output and direction for a few countries and the world.
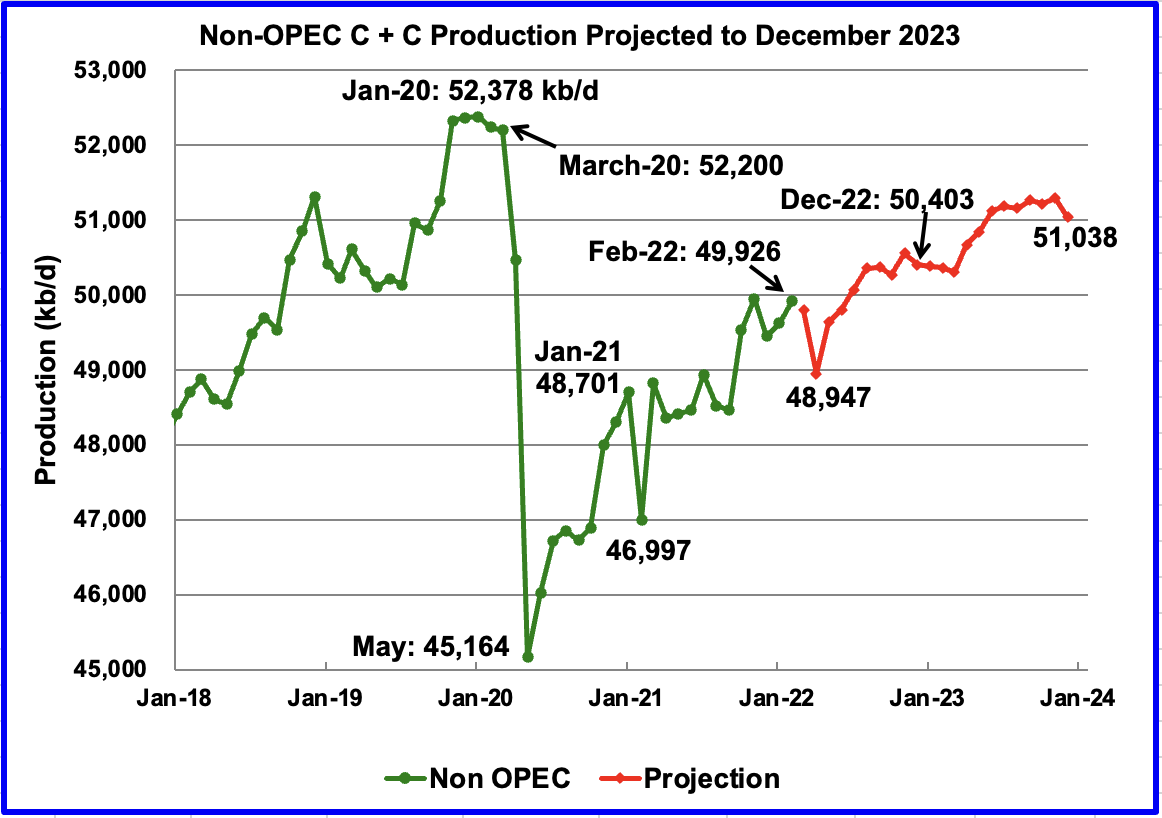
February Non-OPEC production increased by 303 kb/d to 49,926 kb/d. Of the 303 kb/d increase, the biggest increase came from Canada 225 kb/d. Offsetting the increase were decreases from Brazil 116 kb/d and China 92 kb/d. The Febuary 2022 output of 49,926 kb/d is 2,274 kb/d lower than the March pre-covid rate of 52,200 kb/d.
Using data from the June 2022 STEO, a projection for Non-OPEC oil output was made for the time period March 2022 to December 2023. (Red graph). Output is expected to reach 51,038 kb/d in December 2023. This is a 536 kb/d increase over the level reported in the previous report. Note the production drop of 848 kb/d to 48,947 kb/d in April in the red graph is associated with a production drop in the former Soviet Union.
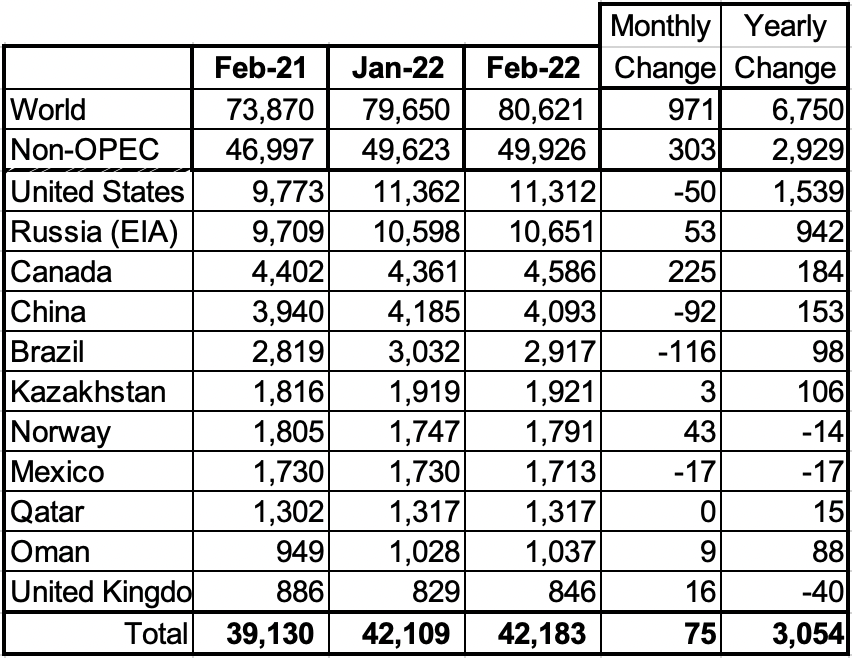
Above are listed the world’s 11th largest Non-OPEC producers. The original criteria for inclusion in the table was that all of the countries produced more than 1,000 kb/d. The UK has been below 1,000 kb/d since January 2021.
In February 2022, these 11 countries produced 84.5% of the Non-OPEC oil. On a YoY basis, Non-OPEC production increased by 2,929 kb/d while on a MoM basis production, it increased by 303 kb/d. World YoY February output increased by 6,750 kb/d.
Production by Country
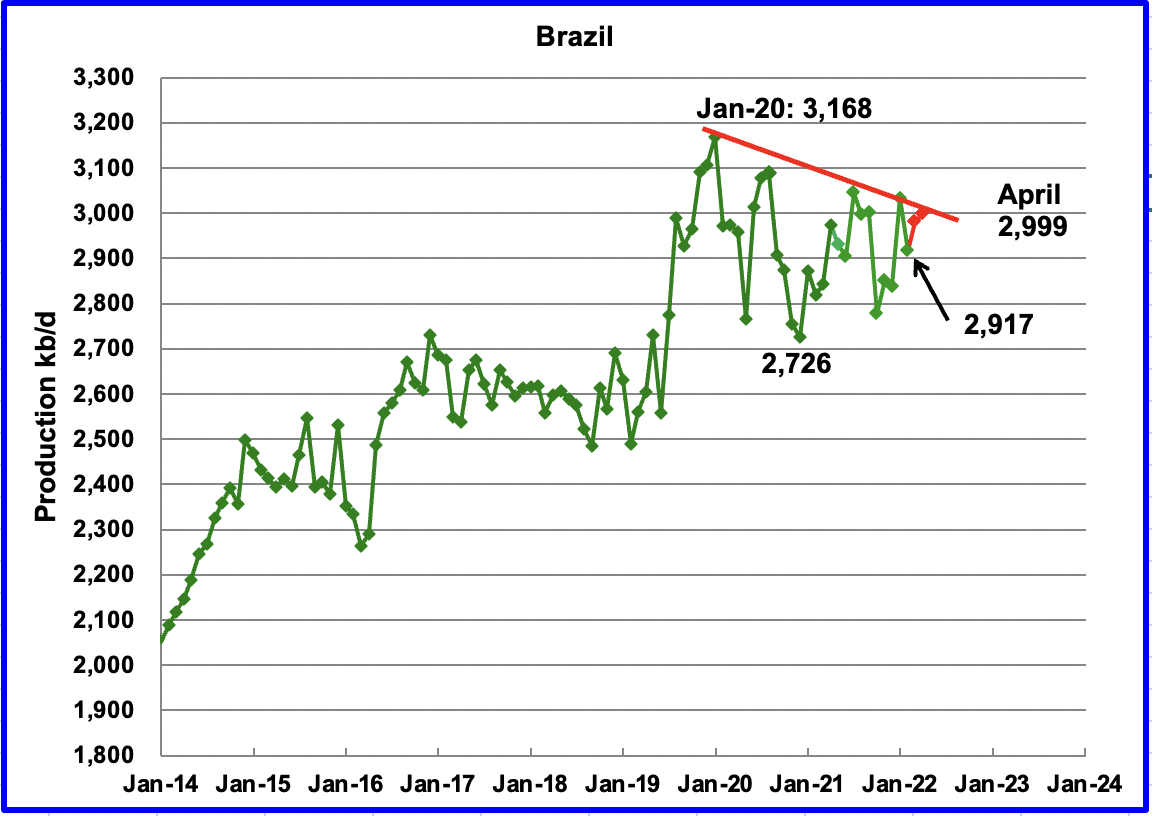
The EIA reported Brazil’s February production decreased by 116 kb/d to 2,917 kb/d. Brazil’s National Petroleum Association reported that April’s output increased by 18 kb/d to 2,999 kb/d, reversing February’s decline. (Red Markers).
The chart indicates that Brazil continues to experience difficulties in increasing its yearly output. However according to the IEA, production in 2022 is expected to increase. “Two major oil fields, Tupi and Buzios producing at 900 kb/d and 550 kb/d, respectively, accounted for approximately half of Brazil’s crude output last year. We forecast production will average 3.1 mb/d in 2022.”
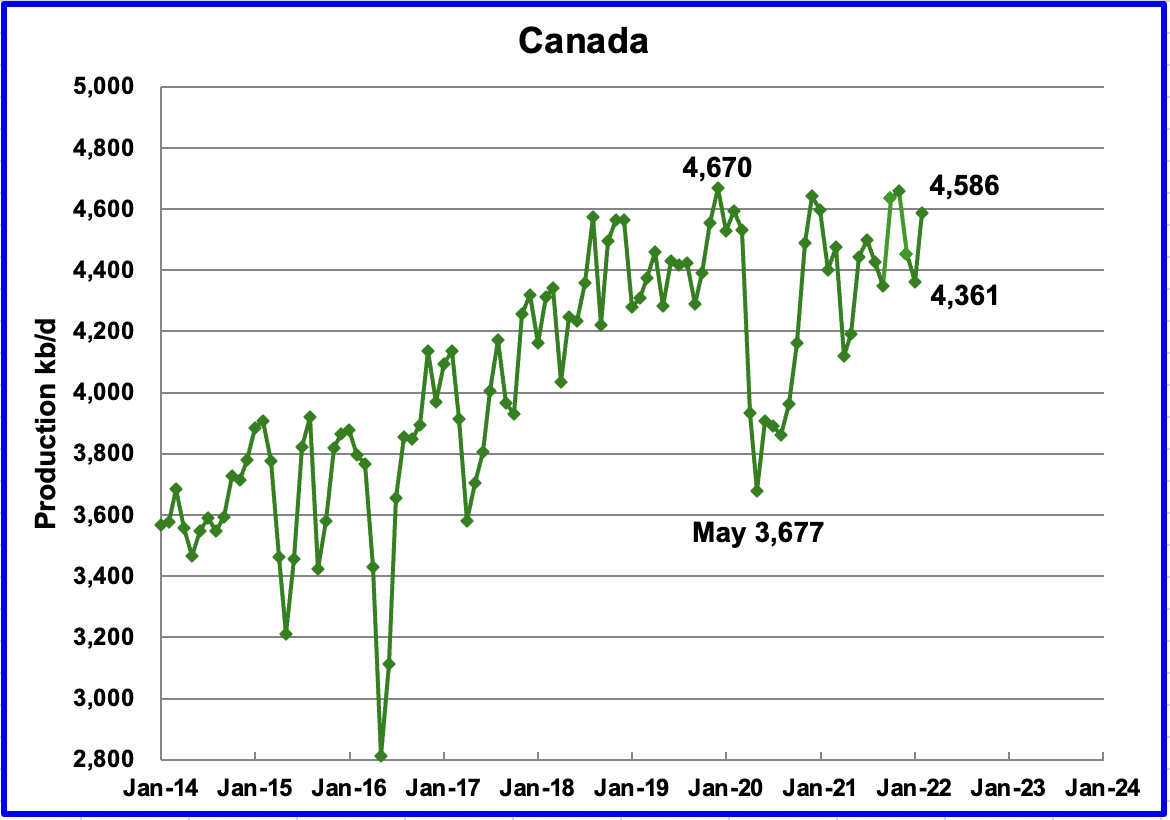
According to the EIA, Canada’s February output increased by 225 kb/d to 4,586 kb/d. The increase was mostly Bitumen production recovery after January’s extreme weather.
Cenovus to restart West White Rose offshore oil project
According to this source, Cenovus Energy Inc. plans to restart the West White Rose oil project off the coast of Newfoundland and Labrador after construction was halted in 2020 as energy prices plunged during the pandemic. (In the source site, a video of oil an analyst is shown where he says that $180 oil is inevitable.)
Cenovus said peak production is anticipated to reach approximately 80,000 barrels per day, 45,000 of which net to Cenovus, by the end of 2029.
West White Rose is located in the Jeanne d’Arc Basin, 350 kilometres east of Newfoundland and Labrador in approximately 120 metres of water.
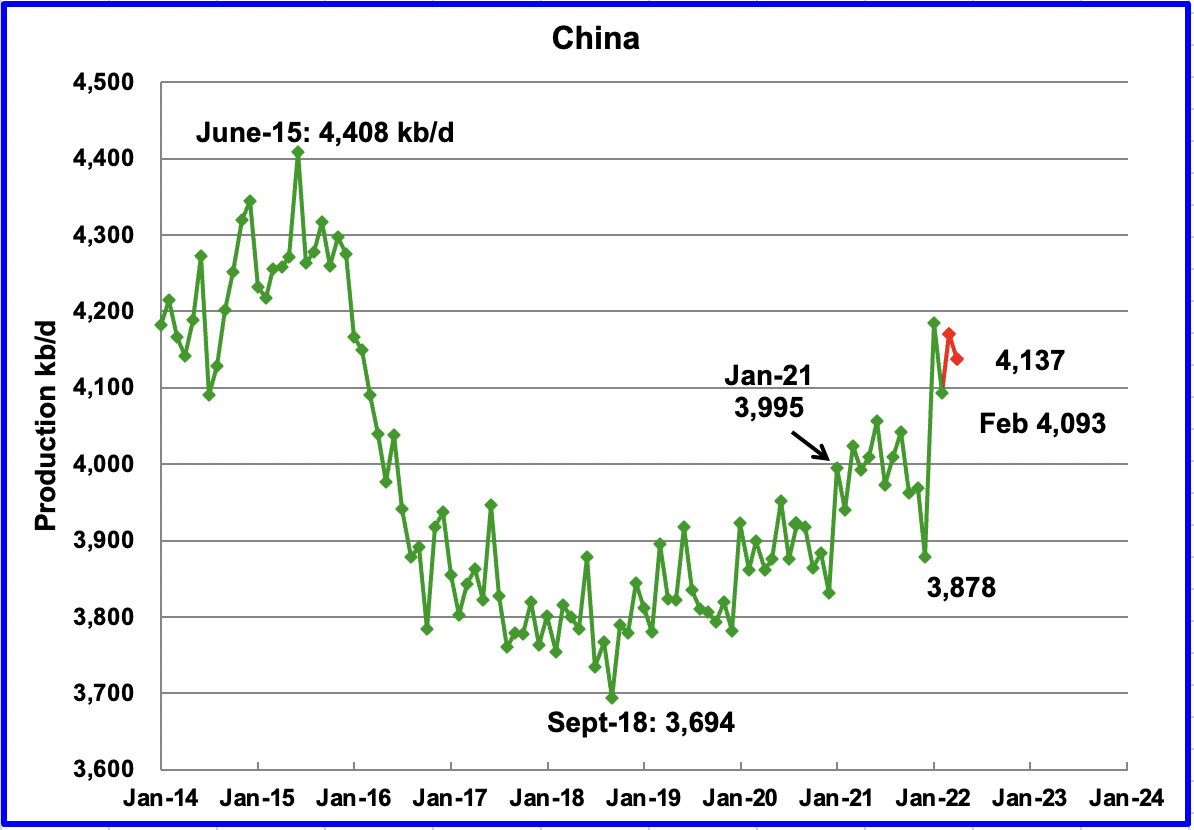
The EIA reported China’s output decreased by 92 kb/d to 4,093 kb/d in February. China reported that its output increased in March but dropped in April to 4,137 kb/d. (Red markers).
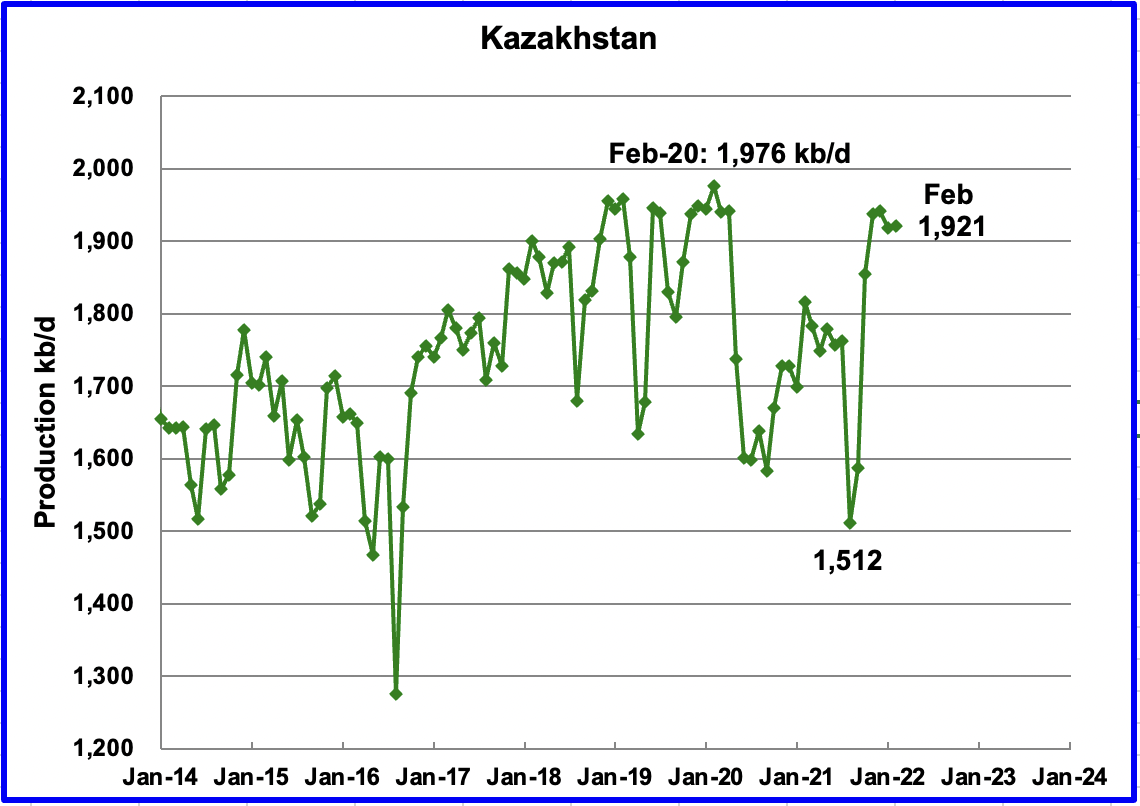
Kazakhstan’s output increased by 3 kb/d in February to 1,921 kb/d.
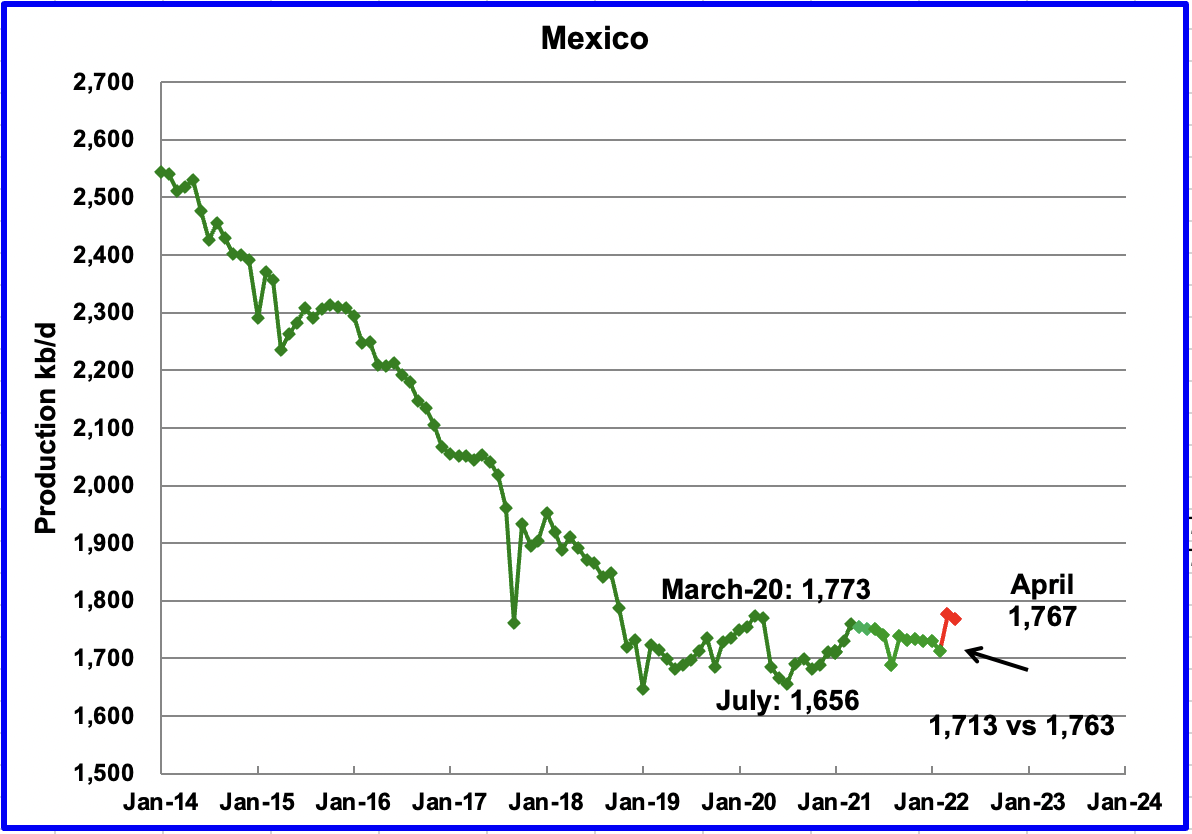
Mexico’s production as reported by the EIA for February dropped by 13 kb/d to 1,713 kb/d.
Data from Pemex showed that April’s output was 1,767 kb/d. However for some unexplained reason, the EIA reduces Mexico’s official C + C production by close to 50 kb/d each month. A possible explanation is that Mexico’s definition of condensate may be different than the EIA’s.
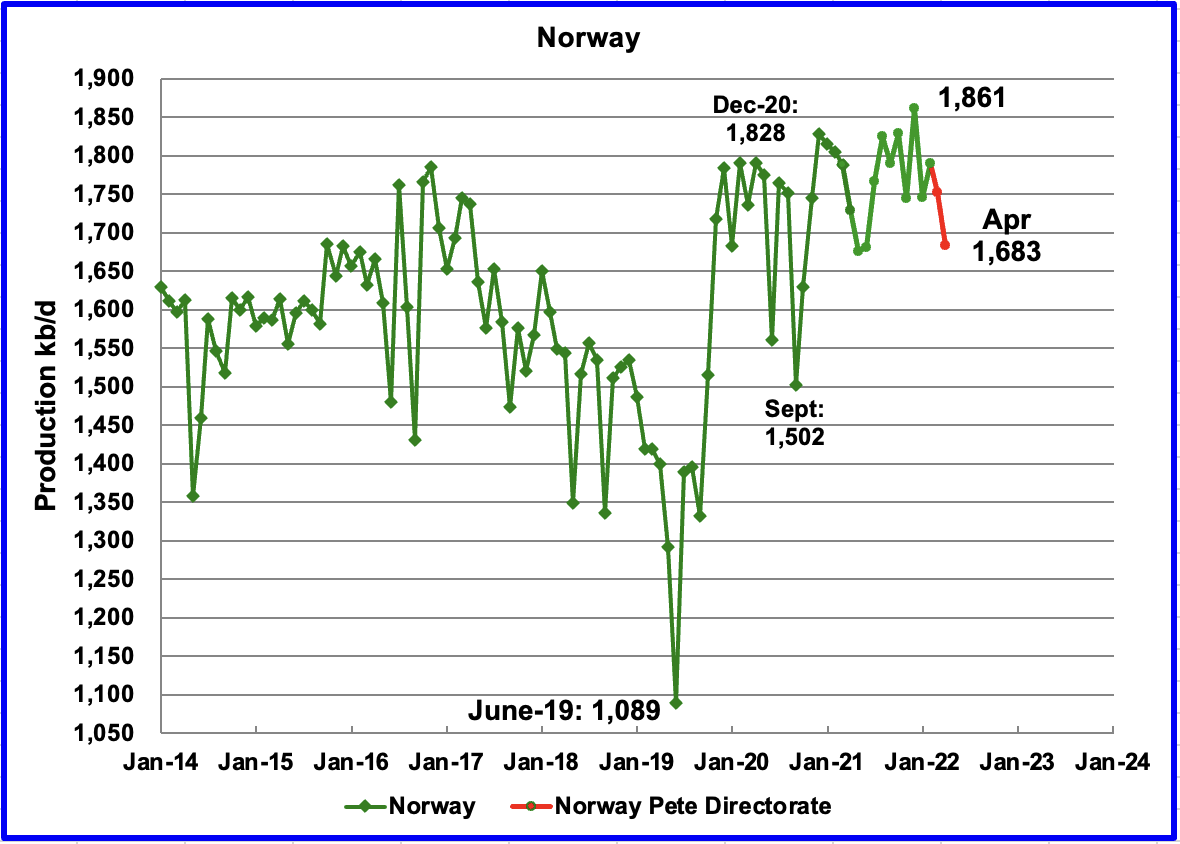
The EIA reported that Norway’s February production increased by 44 kb/d to 1,790 kb/d. The Norway Petroleum Directorate (NPD) reported that production decreased in March and again in April to 1,683 kb/d. (Red markers.). According to the NPD: “: Oil production in April was 10.6% lower than the NPD’s forecast and 5.4% lower than the forecast so far this year.”
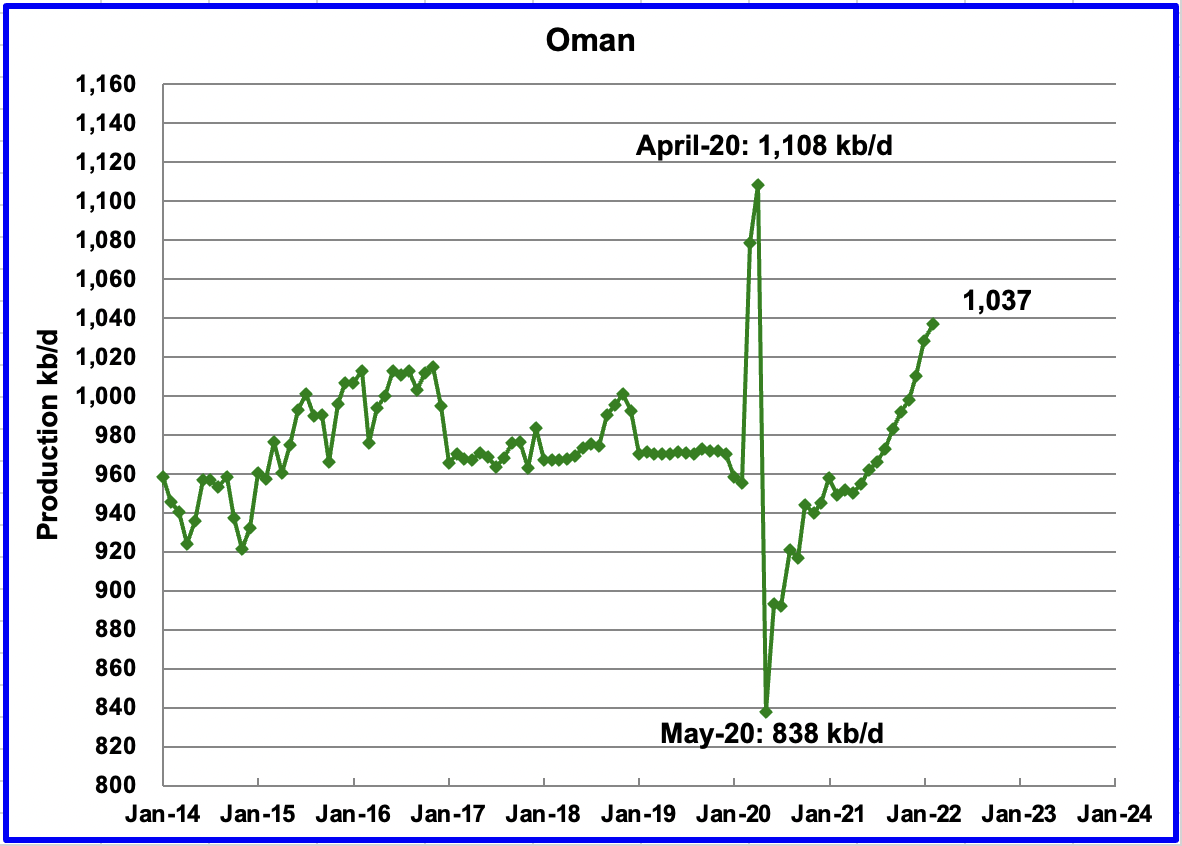
Oman’s February production increased by 9 kb/d to 1,037 kb/d.

February’s output was unchanged at 1,317 kb/d.
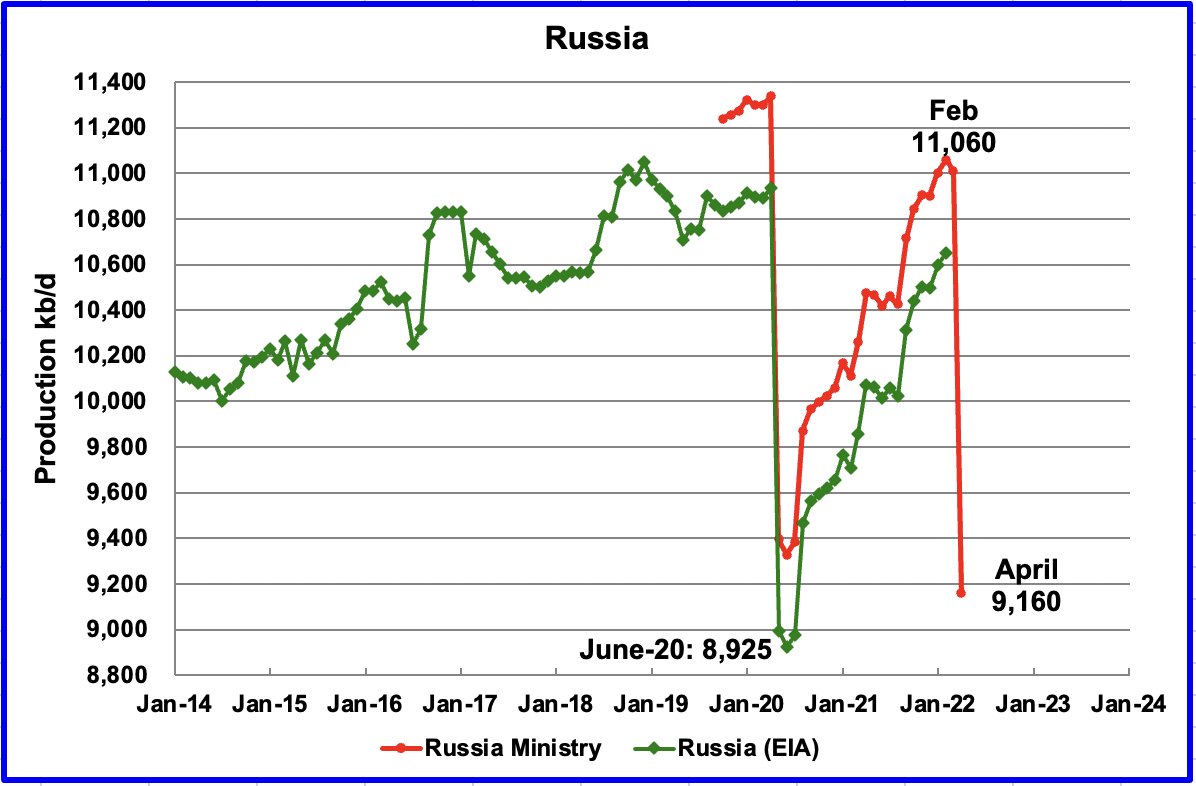
The EIA reported that Russian output increased by 53 kb/d in February to 10,651 kb/d. According to this source, April’s production decreased to 9,160 kb/d.
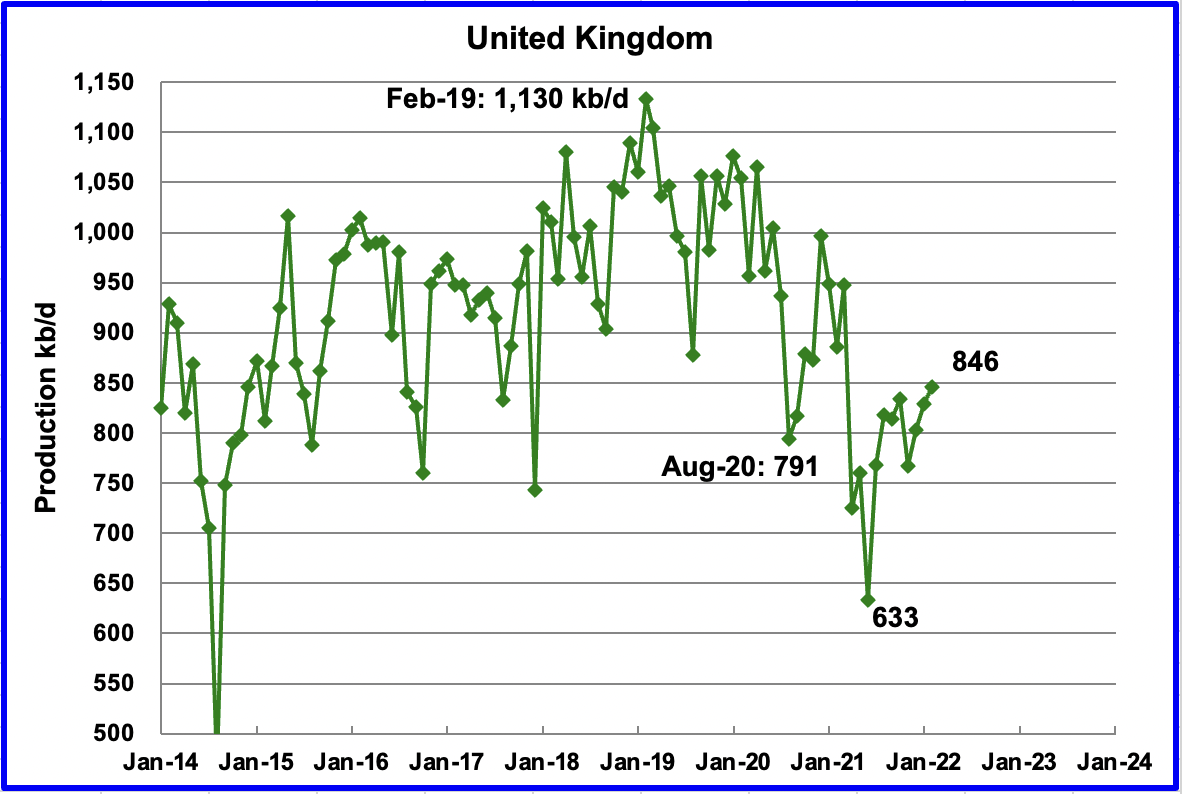
UK’s production increased by 16 kb/d in February to 846 kb/d. The chart indicates that UK oil production entered a steep decline phase starting in February 2019.
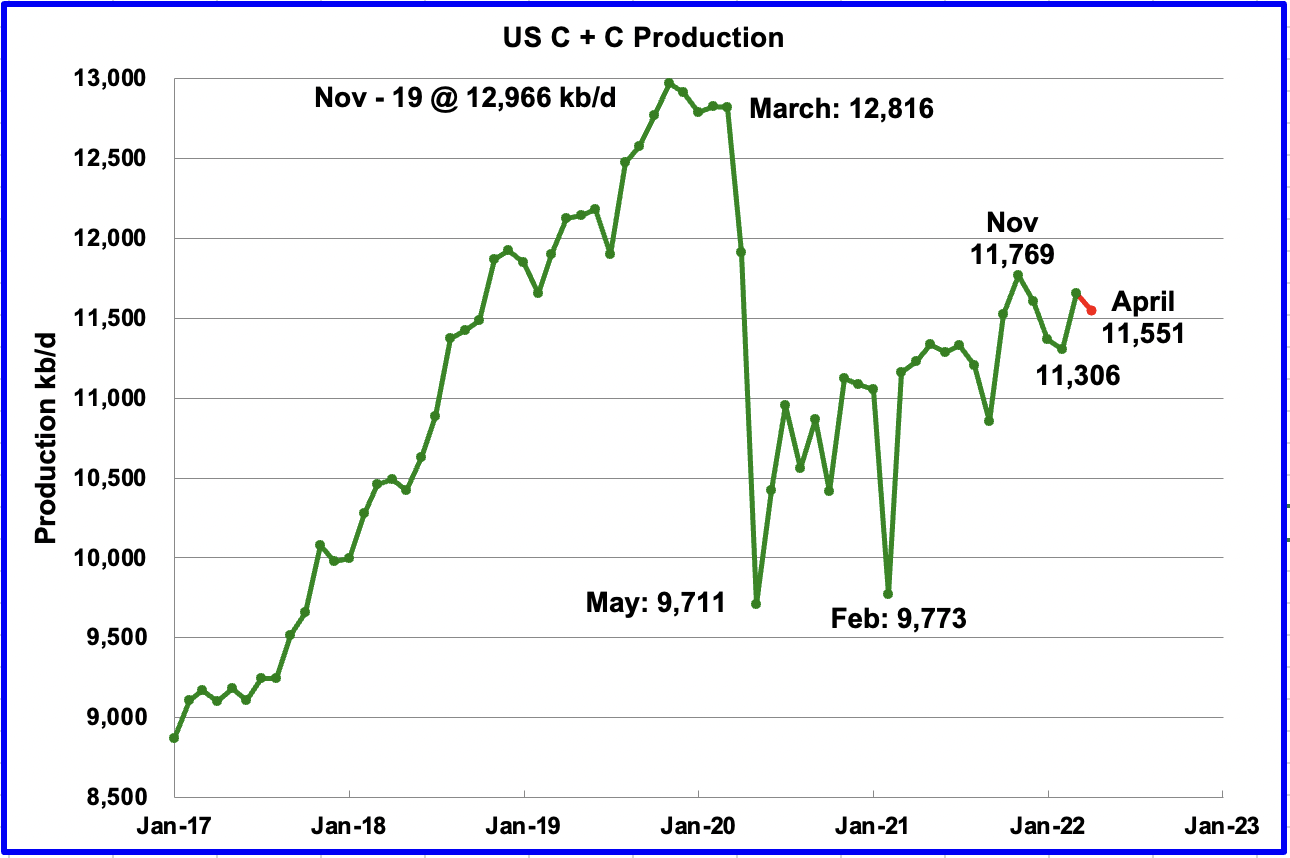
U.S. March production increased by 349 kb/d to 11,655 kb/d. Relative to November’s 2021 production of 11,769 kb/d, March is still 114 kb/d lower. The main increases came from Texas 147 kb/d, ND 66 kb/d and the GOM 75 kb/d. Note that the June STEO is forecasting lower April production of 11,551 kb/d primarily due to a production drop in North Dakota. (Red marker).
In the On-shore lower 48, March production increased by 284 kb/d to 9,525 kb/d but April dropped by 232 kb/d, according to the STEO.
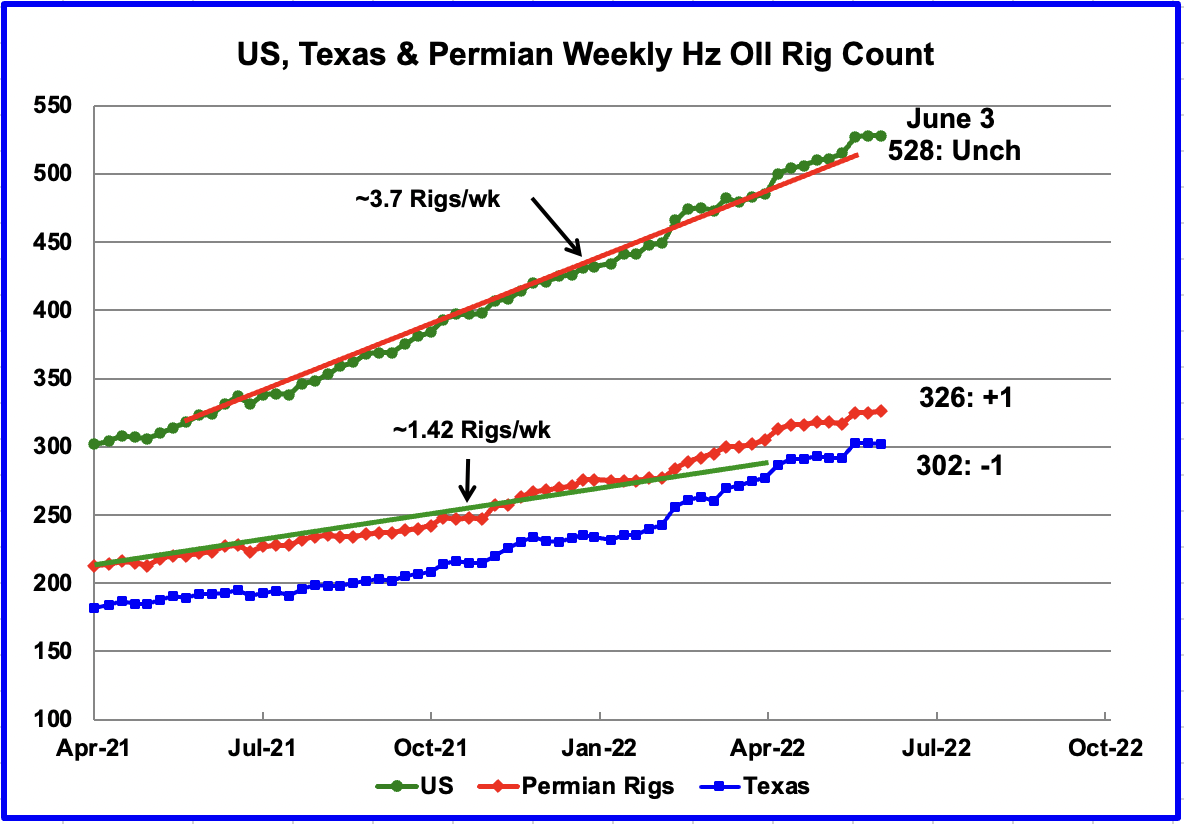
From the beginning of May 2021 to the end of April 2022, the US has been adding horizontal oil rigs at an average rate of close to 3.7 rigs/wk. The primary destination for rig additions appears to be the Permian and Texas.
For the week ending June 3, the US horizontal oil rig count was unchanged at 578. The Permian added 1 while Texas dropped 1.
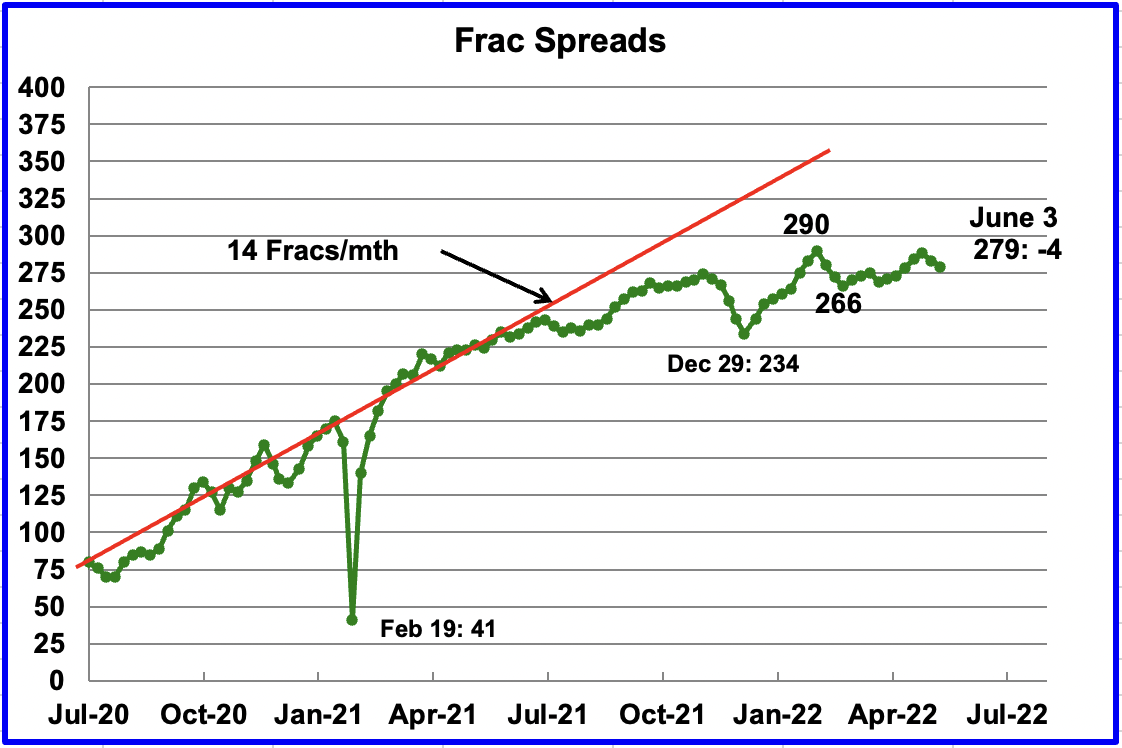
For the past few months, the growth in frac spreads has not been keeping up with the growth in rigs. During the last two weeks, the Frac spread count has dropped. In the week ending June 3, 4 frac spreads were decommissioned. In the week ending November 26, 274 Frac spreads were operating, 5 fewer than the latest week ending June 3. As noted in the US production chart above, relative to November’s 2021 production of 11,769 kb/d, March is still 114 kb/d lower. At the end of March there were 273 operational Frac spreads. This indicates that more Frac spreads are required to raise production.
Note that these 279 frac spreads include both gas and oil spreads, whereas the rigs information is strictly oil rigs.
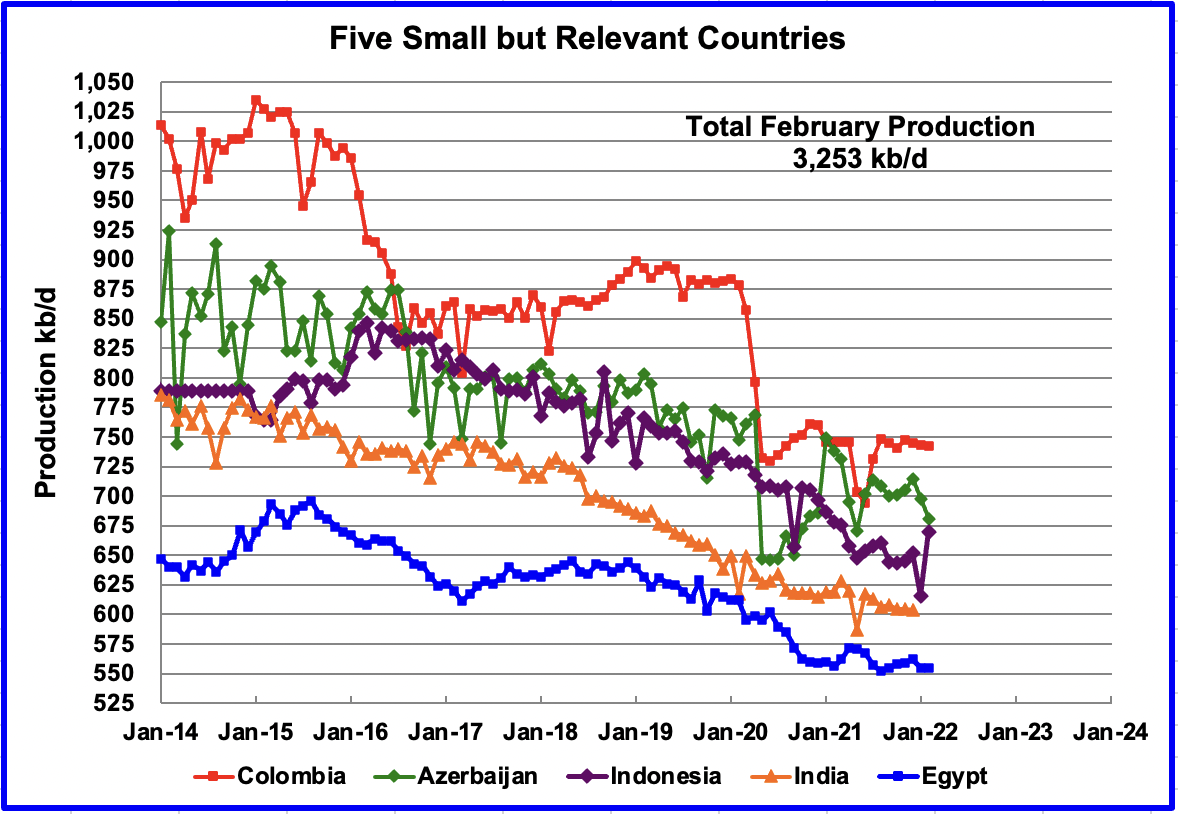
These five countries complete the list of Non-OPEC countries with annual production between 500 kb/d and 1,000 kb/d. Their combined February production was 3,253 kb/d, up by 37 kb/d from January’s 3,216 kb/d.
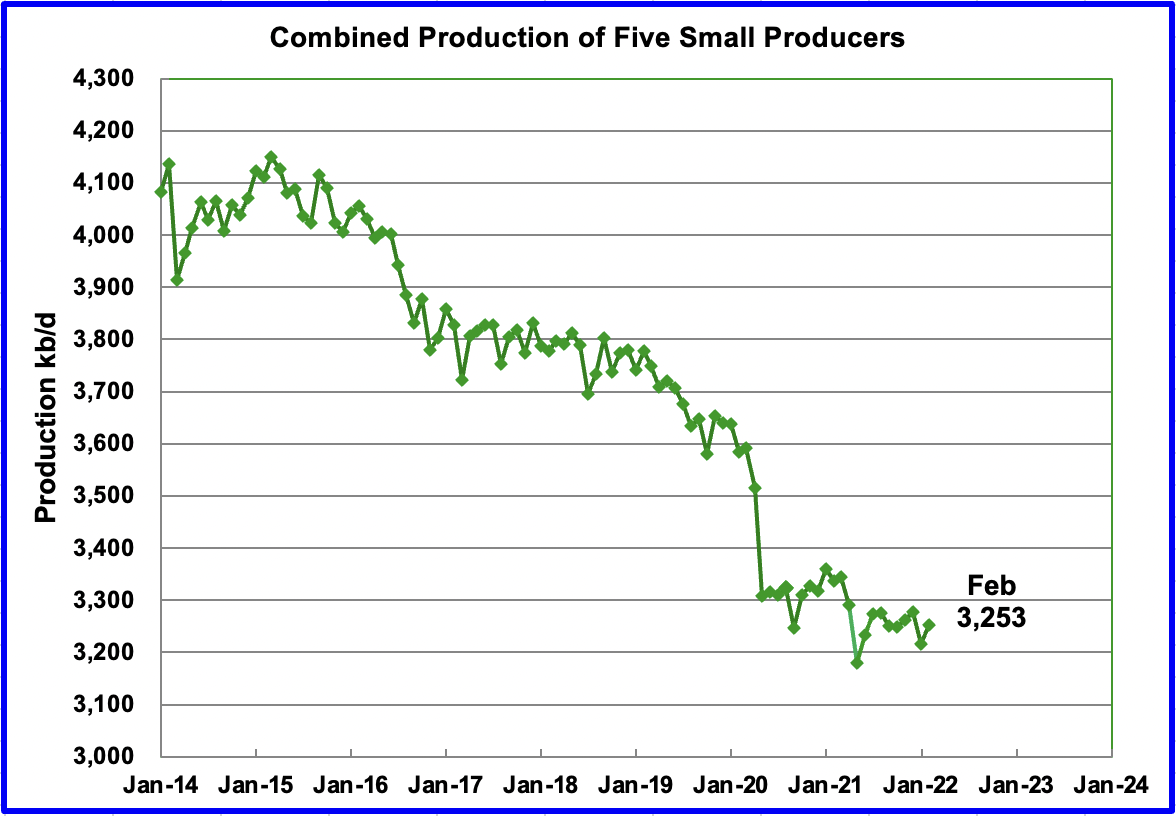
The overall output from the above five countries has been in a slow decline since 2015. The drop in May 2020 from 3,500 kb/d to 3,300 kb/d was primarily due to Colombia and Azerbaijan, 125 kb/d, which is a member of OPEC 10 +.
OPEC 10 + Production vs Commitment
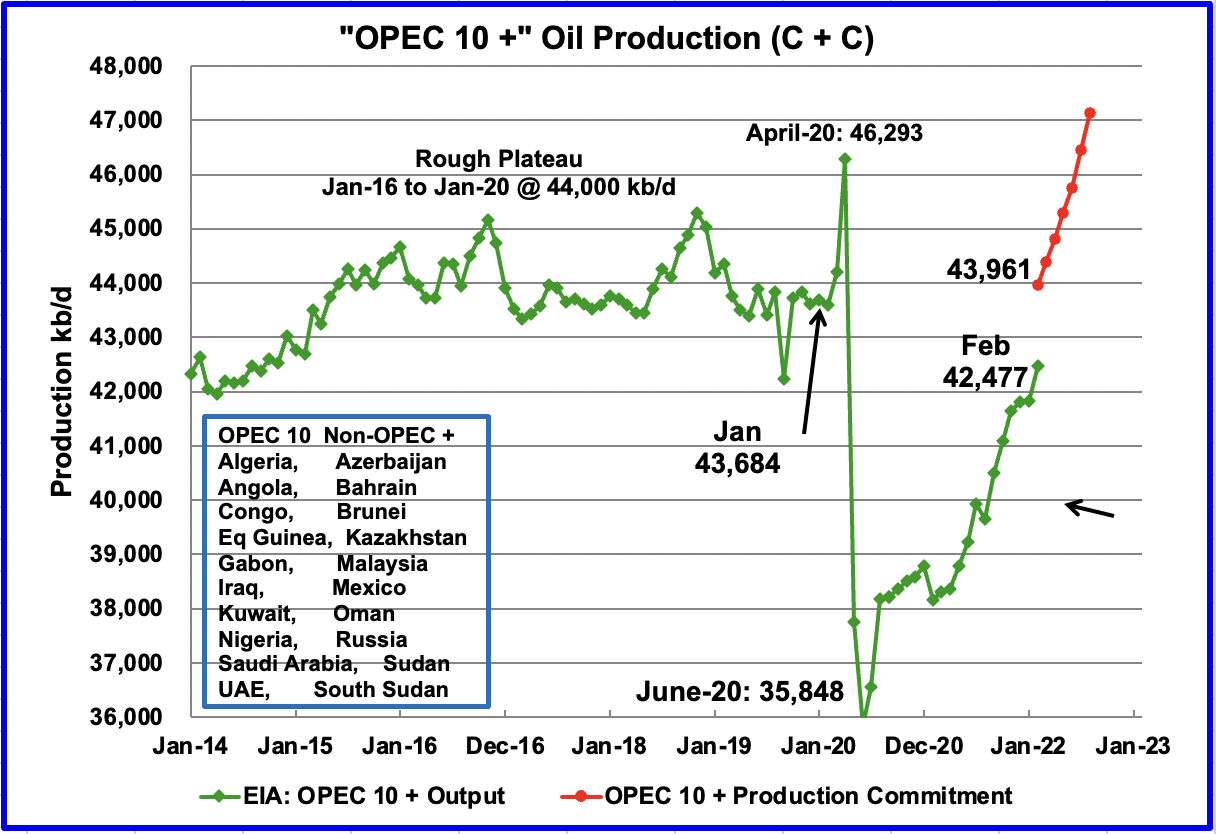
This chart compares OPEC 10 + production with their commitment. For February, the gap between production and commitments is approximately 1,484 kb/d of C + C.
To develop this chart some assumptions had to be made. The OPEC + 10 commitments are for only crude oil production, no condensate. While that information is available for the OPEC countries from the OPEC report, it is not readily available for the Non-OPEC participants. On the other hand, the EIA monthly production information is for both crude and condensate. To get an estimate for the OPEC commitments in terms of C + C, OPEC crude production was compared with EIA C + C production.
For the last six months, September 2021 to February 2022, the ratio of EIA C + C production data to the OPEC crude data was calculated. Over that period, the EIA C+C production was 7.5% higher on average than the OPEC crude values. To get the OPEC 10 + commitments in terms of C+C, (red graph above), this percentage was applied to the OPEC +10 commitments made from February 2022 to August 2022.
To check the 7.5% estimate, the IEA OPEC 10 + crude production reported in the February 2022 report was compared to the EIA C + C production. For January 2022, the IEA reported OPEC 10 + output was 39,480 kb/d. This indicates that using 7.5% to translate crude commitments to C + C commitments is low because the composition of the OPEC 10’s countries oil output is not not representative of the full OPEC 10 + countries.
While the OPEC + commitments from February to June ranged from 400 kb/d to 432 kb/d, the July and August commitments were increased by 50% over the June commitment to 648 kb/d. Note that the main purpose of these increases is to let those countries that can increase production increase their production while treating all members equally.
World Oil Production
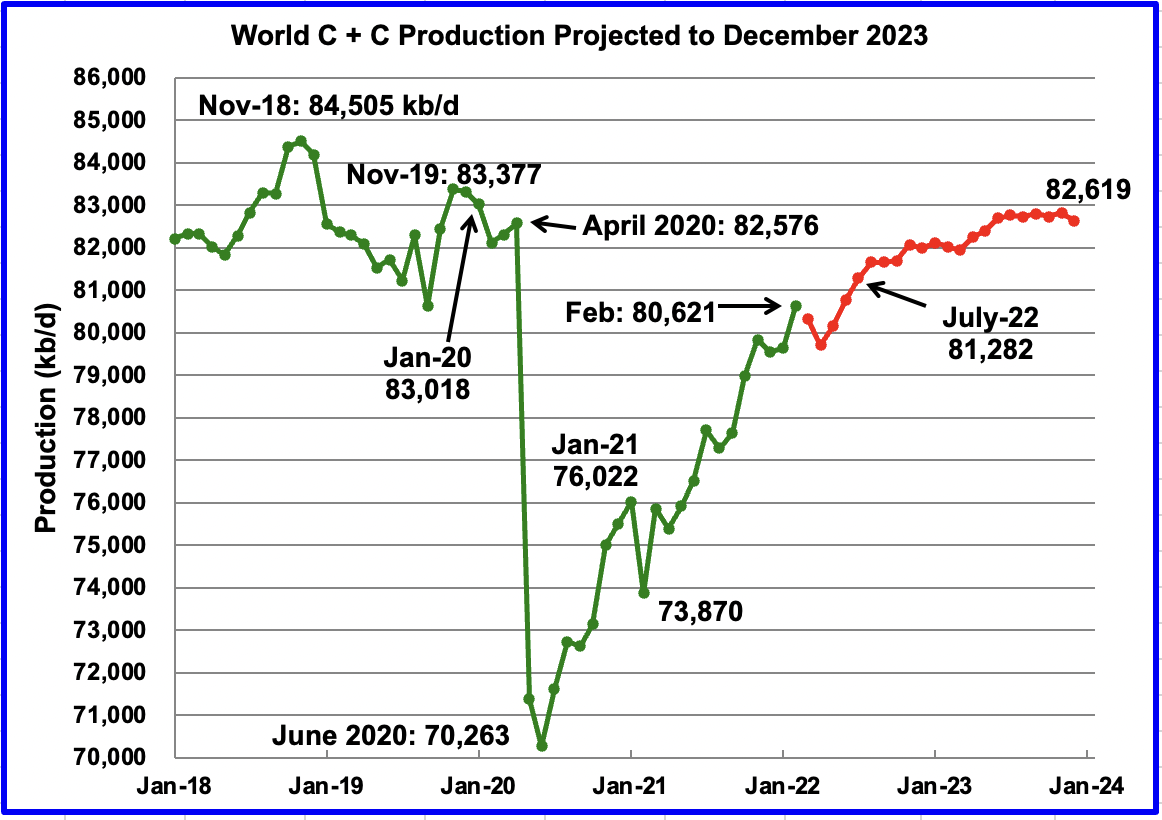
February’s world oil production increased by 971 kb/d to 80,621 kb/d according to the EIA (Green graph).
This chart also projects world C + C production out to December 2023. It uses the June 2022 STEO report along with the International Energy Statistics to make the projection. (Red markers).
It projects that world crude production in December 2023 will be 82,619 kb/d, 638 kb/d higher than projected in the May report. It is also 399 kb/d lower than the January pre-covid rate of 83,018 kb/d and 1,886 kb/d lower than the November 2018 peak.
Could the plateauing shown in the later half of 2023 be an early confirmation that peak oil occurred in November 2018 at 84,505 kb/d?
198 responses to “February Non-OPEC Oil Production Climbs”
Frac spread count looks flat for the complete year, I think drilling rig count is flattening out, too. And DUCs are still lowering – so no big records in production to expect.
It will be difficult to even stay flat end of the year, if the situation doesn’t improve.
I think the main reason is the supply chain chaos, mainly induced by the paranoid corona policy in China. Parts are hard to get.
The same there with wind energy – the government has big plans to boost wind energy, but you don’t get the mills. Companies like Vestas have problems even to stay flat production.
I think (haven’t read it) deep sea and sub salt ocean drilling will have the same spare part problem. So no wonder to expect here, too – and some lengthened maintainance intervalls.
Ovi, thanks for the great work, and especially that second to last chart “OPEC 10 Production vs Commitment”. With Russia likely down 2 M/d for the foreseeable future, OPEC will remain a good 5-6 million away from their goal of 47M, despite any recent pronouncements to the contrary.
Stephen
I think that getting reliable information out of Russia for the next six months will be difficult. Check the next two URLs. Is the Moscow Time normal Russian disinformation?
https://www.themoscowtimes.com/2022/06/03/russias-oil-output-up-5-in-may-vedomosti-a77880
https://www.reuters.com/business/energy/exclusive-russia-sees-its-oil-output-falling-by-up-17-2022-document-2022-04-27/
Hi Ovi, I doubt they are down two million yet, but over the course of the next year there will be a steady decline similar to what happened to Venezuela when sanctions were imposed. Take a look at what happened to car sales last month – down 83% because of a lack of parts that disrupted completion. I’m sure the oil and gas sector will be similarly affected as BP
and other majors finish their departures.
https://www.reuters.com/markets/europe/russias-may-auto-sales-down-835-year-year-says-aeb-2022-06-06/
This is a “heads up” to Stephen Hren. I didn’t see your name in the open thread and I know you view this page often.
I know that you have live/lived in the Durham, NC area, Durham Tech is planning on building dorms and is asking for input from the public. Here is the blurb:
Good afternoon,
You’re Invited! Durham Tech is proposing to build new affordable housing near campus and would like to make sure it meets the needs of students and the community as much as possible. Would you like to help shape the project? Your input would be very helpful!
Join Durham Tech, Bank of America CDC, Mosaic Development Group, and the Partnership for Southern Equity for an interactive event about the development and how it can best serve the community. We are looking forward to hearing from students, employees, partner organizations, neighbors, and our broader community to create an equitable development, at all stages of the process.
We will be holding initial community meetings on Zoom on Thursday, June 2nd, with two time options:
Thursday, June 2, 12:00 p.m. – 2:00 p.m. Register
Thursday, June 2, 6:00 p.m. – 8:00 p.m. Register
**
Here is a blub on the “second round”:
I hope you will be able to join one of our next meetings on July 19th. We will have 2 sessions, one at 12pm and one at 6pm, and will be focusing on elements of design and this is a great point to continue to lift in that discussion. We’d be glad to have you there. Here is the link to RSVP.
**
You are also invited to respond to this brief survey to help shape this development. Respondents will be entered to win a $25 gift card.
If you are not able to join the meeting but would like to be connected for updates or to get involved, sign up here!
Feel free to reach out with any questions or for more information.
All the best,
Maggie
***
Maggie’s email is:
[email protected]
I remember you attending an EPA-RTP seminar on what you did with your roof and solar including the Mud Ranch. I thought you might want to add your “two-cents” with respect to this project. I sent them a graph of the Exxon Peaking of Liquid Supply already.
Thanks the head’s up, PeterEV that’s supersweet of you! I’m still plugging away with the cob, if you want to check out what I’m up to lately: http://www.kthonik.com/coblog, or feel free to email me directly if you are in the area: stephenhren gmail. Cheers!
Dennis,
If you read this, this conversation should be transferred to the Open Thread.
I’m taking it offlist…
Reposting for no good reason from the previous article that timed it out quickly.
//////////////////////////////////////////////////////////
No idea why $140 is a magical number.
GDP is, in today’s US of A, largely dependent on G in the formula, which also buttresses C.
But G is done now. The stimmis are done. There ain’t gonna be an infrastructure bill, which assumes an Apocalyptic economic unfolding does not happen — because if one does, it is gubmint money, from the Fed or Congress that will intervene. Maybe via some panic Infrastructure bill. It will have to be that because Capitalism with a capital C failed in 2008. Everything happening since then has been created or borrowed (from the creator) money thrown into the system in somewhat desperate fashion. Capitalism won’t stop such an event.
A good exercise is to look at GDP, in dollars, not % growth or decline, and compare it to the total of QE and outright deficit in the relevant timeframe since 2008. The dirty secret is GDP grows a smaller number of dollars than the sum of the . . . intervention. That is a failed economy or failed capitalism, or both.
Suspicious LNG explosion. ZH says 3 weeks. We’ll see. One would think that would be low-balled.
Watching Columbia. Alleged $17B influx from a shipwreck. 800K bpd. Can fund more drilling.
Oil prices are so high that synthetic fuel based on solar energy will be cheaper if it gets much higher. More drilling may not make much sense.
We are approaching that tipping point already. Even as oil prices go through the roof solar prices are crashing (again). The infrastructure doesn’t exist though, and investment only makes sense if no replacement for liquid fuel is available. If battery production increases quickly enough to dampen oil demand and drive down prices, solar to fuel may never happen.
In the meantime the old three-ton-vehicle-at-the-coffee-macchiatto-drive-through-complaining-about-gas-prices model may need a rethink.
Ovi,
Great Update. It will be interesting to see if Nov 2018 was the ultimate peak.
I wanted to provide what I believe is a more Realistic Natural Decline Rate for the World’s Oil Fields. According to the data from the 501 Page Geological Survey of Finland Report on Peak Oil, Non-Opec fields were suffering an annual 14% decline rate (2000-2007) while Opec was declining only 5%. The reason for the higher Non-Opec decline rate is due to smaller fields that were discovered more recently and the inherent decline rate of smaller fields, especially OFFSHORE.
I decided to provide a “conservative 6% decline rate” for OPEC & NON-OPEC production minus the United States which was 76.6 mbd in 2021 and a more hefty 33% decline rate for the United States production of 16.6 mbd. The 16.6 mbd of U.S. production includes NGLs. While some may argue this is a bit high, I calculated this based on conventional onshore, offshore and tight oil.
The more REALISTIC estimate of the World’s Oil Decline rate shown in my chart below is based on a MID-CASE scenario, which is likely conservative.
While the Oil Industry analysts continue to REGURGITATE the 4-6% World Top Fields natural decline rate, the more Realistic figure is closer to 11% when we factor in the Non-Opec and U.S. Shale oil that suffers an enormous annual decline rate.
So, the world is likely losing over 10 mbd of oil each year, versus the regurgitated 4-5 mbd.
steve
I often state and will repeat that the 12 month average output od Worls C plus C is the more important parameter, monthly peaks are of little consequence in my opinion.
The current World peak for 12 month average World C plus C output is about 83 Mbpd. STEO for Dec 2023 about 400 kbpd less, but note the EIA is very conservative for their oil price prediction.
I agree, Denis. There will be a second peak. It is also of little interest, if that second peak will be slightly above or below the 2018 peak, if it will be a Dennis or a Ron peak (as a centered average). But I am sceptic that we will see more increase from there and I am even more sceptic referring to the demand side. We are approaching the middle of this decade with a soon to be huge gap between production and demand, and no mitigation or renewables will change that. While I suppose that in technical terms humankind will be able to work its way out, I really doubt that our global financial system will hold. It’s simply too growth orientated. This is just another nail in the coffin of the dollar as a world currency and things will become more local or rather multipolar. But this could be a chance, also for the US, to redefine everyones role in such a world. I just hope the transition will be productive and peaceful for the whole planet.
Westtaxasfanclub,
I agree with your last sentence and most of the rest. I think high prices might result in reduced demand for oil and natural gas as people move to heat pumps for heating and electricity for transport, wind and solar are very competitive at current natural gas and coal prices. It will take some time ( 10 to 15 years ) but the transition might occur with a lot of work and better long term decision making by governments. I do not expect this will be an easy task, it will be exceedingly difficult. It is also doubtful a free market system will accomplish the task quickly enough. Just as a free market was not chosen as the best system in World War 2 for the US economy. The current predicament will require a WW2 type effort, hopefully we will do the right thing sooner rather than exhausting all other possibilities prior to finding the correct path.
In the 1930’s it was clear that a big problem with fascism/nationalism in Europe was brewing, but it took severe bleeding crisis to bring this country to point where there was acceptance of a national strong effort to join the fight.
Similarly now, it is clear that we are “approaching the middle of this decade with a soon to be huge gap between [energy] production and demand,” globally. And yet most of the world is only making a weak effort to make proactive adjustments. Weak effort compared to what is necessary.
Like before, a full blown crises will likely be necessary to motivate people.
Higher prices for food and fuel, and areas with episodes of grid blackouts for example, are just the early affects of this decades problem.
Steve
The decline rates you are quoting are decline rates in the absence of drilling. Here is a statement taken from a SA presentation in 2006.
“Without “maintain potential” drilling to make up for production, Saudi oil fields would have a natural decline rate of a hypothetical 8%. As Saudi Aramco has an extensive drilling program with a budget running in the billions of dollars, this decline is mitigated to
a number close to 2%. When this 2% is applied to Ghawar it gives production close to 3.7 Mb/d which SA reported a few years back.
I track the production in 50 countries which have shown a steady decline with an occasional bump up when a new field comes online. See attached chart. This is what I would call a net decline rate since maintain drilling is carried out in many of these fields. Their decline rate is linear and close to 512 kb/d. Dennis and Ron have posted similar charts using a different group of countries and have reported linear decline rates closer to 600 kb/d.
http://csis-website-prod.s3.amazonaws.com/s3fs-public/legacy_files/files/attachments/061109_omsg_presentation_1.pdf
Ovi,
Thanks. That’s about a 4% decline rate (500/13500). An alternative way to look at decline is to take World nonOPEC C plus C and subtract combined output of US, Canada, Brazil, and Norway. Up to 2010 this output was increasing, but from 2010 to 2019 output devreased at an annual rate of 180 kbpd and at the end of 2019 the rate of decrease was about 0.6%.
at the end of 2019 the rate of decrease was about 0.6%.
Dennis, not to nitpick but I think you meant 6%, not 0.6%. The difference is quite important. 0.6% would be just a tad over one half of one percent.
Ron,
It is 180 divided by 29500 which is equal to 0.61%, just check on a calculator.
Taken from an Saudi presentation
Ovi, that was the state of Saudi estimates of their oil fields in 2006, sixteen years ago. I would submit that their depletion numbers would be considerably different today.
Also notice that the last paragraph refers to their then “decline” rates, and calls them “depletion” rates. That is misleading, to put it mildly. Decreasing their decline rates with massive infill drilling programs, which they did, dramatically increased their depletion rates. It would be nice to know what their actual depletion rates are today. But that is a Saudi top secret. We will only find out that number when it is obvious that their production is in serious decline. That will happen soon, no doubt.
Thinking about it, I doubt that they have any idea what their actual depletion rate really is. But they will soon become aware of that deep secret that they have even kept from themselves.
Ron
I am assuming that the third paragraph is correct in describing decline rates. I assumed that the fourth paragraph was a mistaken use of decline.
I am wondering what you mean by “Depletion Rate”. As best I understand the depletion rate is equal to their production rate I.e., close to 10,300 kb/d. What we don’t know is what that number converts into as a percentage. Are you wondering what their percentage depletion rate is.
No Ovi, depletion rate is something totally different from production rate. No, we have no idea as to what the depletion rate is exactly, but we can estimate. The depletion rate is the rate the oil left in the ground is being depleted. If Ghawar has 50% of its original oil left then it is 50% depleted. If the oil left in the ground in Ghawar is 10 billion barrels and one year later it has 9.5 billion barrels left, then its depletion rate is 5%.
That is totally different from the decline rate. If by infill drilling they pumped the same amount this year as last year, then their decline rate is 0%. They would have decreased their decline rate while at the same time increasing their depletion rate.
Ron
Your statement; “The depletion rate is the rate the oil left in the ground is being depleted.” This statement is saying “Depletion rate is equal to the production rate.”
What is not known is the depletion rate in percentage term.
Ron/Steve
I found a calculation I did back in 2019 when Armco published its IPO. In it on P89 it stated:
“The Company believes that the Ghawar field is the largest oil field in the world in terms of conventional proved reserves, totalling 58.32 billion barrels of oil equivalent as at 31 December 2018, including 48.25 billion barrels of liquids reserves. It has accounted for more than half of the total cumulative crude oil production in the Kingdom but still maintained a MSC of 3.800 million barrels of crude oil per day as at 31 December 2018.
Starting in 2003 when production was 5,200,000 barrels per day and declining production by 2% each year, we arrive at 3,840,000 barrels per day in 2018, as stated in their IPO.
Hello-I’m new here and usually just read but I have a question on this post
If Ghawar goes belly up then what does this mean for the world? How big is it compared to all the other fields?
Thanks
CB
Not sure if it is still the biggest field. As noted above in 2018 it was producing 3.8 Mb/d. If it continues declining at 2%/yr, in 16 years, 2038, it will still be producing 2.5 Mb/yr. It is still a very important field.
Great post ovi. Obviously production will never recover to what it was, and is following the curve perfectly.
It’s amusing dennis never mentions volumetric reserves, or even knows what that word means. Permian has a quadrillion barrels of dirt, 10% rock, 10% TOC, 10% soluble and 5% light. Obviously permian reserves are low.
As Dennis is mentally retarded he is too lazy to google any of these terms, but trivial math shows his reserve estimate is physically impossible and any toddler capable of adding numbers can show there’s not enough space for the oil. Dennis cited 10 trillion barrels of oil in permian which was obviously kerogen and refused to read the email by the author. Dennis doesn’t cite sources, he directly says stuff the source disagrees with.
Dennis
I think this is Mustang Mark
Ovi , Mustang , mule or donkey. Not important , if his observation is correct regarding the technicals . Prove him wrong . Agreed he has gone overboard with comments on Dennis
HIH
“It’s amusing dennis never mentions volumetric reserves, or even knows what that word means. Permian has a quadrillion barrels of dirt, 10% rock, 10% TOC, 10% soluble and 5% light. Obviously permian reserves are low.”
That statement is pure garbage. Dennis always quotes reserves in barrels of oil. Barrels are volume and DOE, aka Mustang, doesn’t know the difference. Also the rest of that statement is pure gibberish.
Hole in head,
There is no need to convince people the is not flat. If it is not understood, no words will convince.
Noticed typo,
was supposed to be: “There is no need to convince people the earth is not flat.” forgot earth the first time, sorry.
Ovi,
Thanks.
When you see crap like that from Mustang,
just mark it as spam.
Not worthy of wasting time on.
Dennis and Ovi , it’s your call . I am not a soil engineer so the POV was new and different and wanted to see if a discussion could be held . If you say it is junk and gibberish then I will not argue , both of you know more than me . Take requisite action . Apologize if I ruffled some feathers .
P.S ; Come to think DOE has not defended his post . Obviously you guys are correct .
“Permian has a quadrillion barrels of dirt, 10% rock, 10% TOC, 10% soluble and 5% light. Obviously permian reserves are low.”-
Completely irrelevant statement.
Not surprising to see Hole in head be tripped up by it.
And the rest is just fit for Fox news and no where else.
My estimate is for economically recoverable resources not reserves. It is based on the work of the USGS for undiscovered technically recoverable resources. Discovered resources would be the sum of 2P reserves, cumulative production, contingent resources, and future reserve growth. Note that the USGS 2013 mean estimate for undiscovered Bakken/Three Forks was pretty much spot on.
The same methodology was used for the Permian with a mean TRR of about 75 Gb,
my estimate for ERR is about 45 Gb for Permian basin, similar to F95 estimate for TRR.
The reserves are not static they increase as resources are developed.
Such sheer ignorance expressed in the below article really pisses me off.
Gas price records mean OPEC has to be cut down to size
A global oil exporting cartel led by Saudi Arabia and Russia, known as OPEC, has driven the world economy to the verge of collapse. Oil that ought to be – and was – priced at $70-80 barrel had been forced up over $100 even before Russia invaded Ukraine. OPEC has thus raised the prices of fertilizer, shipping, and food to astronomic levels, all of which threaten the well-being of billions of people and very lives of millions. And OPEC leaders have made it clear that they will enjoy inflated prices for as long as they can squeeze the rest of the world.
The idea that OPEC could end this crisis only if they would let their members produce as much as they could is stupid beyond belief. Every OPEC member is currently producing every barrel they possibly can. One has to be just down in the dirt stupid to believe they could increase production by 3 million barrels per day if they desired.
That being said the crisis is getting worse and will very likely lead to a worldwide recession. The only thing that could possibly be done, and it hurts me to admit it. But all sanctions on Russia, Iran, and Venezuela need to be lifted immediately. I know Russia is the devil incarnate, and so is Iran and Venezuela. But to save the world from a fate worse than death, the only solution is to allow every barrel that can be produced to be produced.
Ron,
In my opinion, this is actually better than what you usually get from Fox. They are usually saying that all Biden needs to do is “unleash” the US oil and gas industry, whatever that means.
But you’re right – the only countries that actually do have excess oil production capacity are the “bad boys” – Russia, Iran and Venezuela.
Bob , for once we are in disagreement . There is no spare capacity in the world .
Russia : Ron has well documented their peak and now the additional problems with sanctions .
Iran : They sell every drop they pump . How do you think they survived 40 years of sanctions ? When was last you heard of tankers offshore storing Iranian oil ?
Venezuela : An acronym is suffice ” FUBAR ” .
The music is playing but the party is over .
Respects .
Hole in Head,
Don’t you think sanctions have impacted oil production in these countries, which was Ron’s point? Iran is currently producing about 2.5 mmbopd, and was producing about 3.5 mmbopd before sanctions (back in the 2017/2018 time frame). Russia is currently producing around 9 mmbopd and was producing about 11 mmbopd (or 10.5, depending on the data source) before sanctions. I agree, Venezuela is FUBAR, but, at least the OOIP is there. If sanctions were lifted, and a bunch of other good things happen,, at least oil production could increase there.
Bob , no sanctions effect if any is marginal and within the daily day to day work .
Russia is already past the second peak when the sanctions were applied . That has been well documented over 2021 by Ron . They will loose production but it would probably be fields that were anyway approaching expiry date . Russia will not suffer production outages because of parts . Parts are an international market . If they don’t come from Houston to Moscow , they will come via Houston to Dubai to Moscow . Technical manpower , I don’t know but in this age of communication should be surmountable .
Iran are champion smugglers . Heck they bought nuclear plant manufacturing equipment right under the noses of the world agencies . They keep their 40 year old fighter planes working . Dubai is across the strait . One can get anything from there . Anyway the USA will not needle Iran too much . Taiwan war and the closure of the Strait of Hormuz by the Iranians is a nightmare for Washington . They produce maximum and they sell all of it . Smuggle it to Turkey or pass it off as Iraqi oil .
Venezuela is beyond redemption . Equipment has been cannibalized to keep whatsoever is still operational . Manpower is all gone . Too much time and money required to put Humpty Dumpty back again . Just not economically worth it .
Hole in head,
Russia was not expected to drop by 3 Mb/d until 2040 or so, Iran and Venezuela both saw significant production drops when sanctions were imposed.
In short, you are wrong, Bob is correct as usual.
Forecast for Russia from before invasion of Ukraine in 2022.
Iran, sanctions imposed in 2018.
Venezuela was falling apart economically even before sanctions were imposed in a number of steps from 2016 to 2019, but the gradual tightening of US sanctions over time saw Venezuelan output fall by 67% from 2016 to the start of the pandemic.
Interesting devolpment in India . Rosneft says no more cheap oil .
https://www.cnbc.com/2022/06/09/russia-doesnt-have-extra-oil-for-new-deals-with-2-indian-buyers-reuters-citing-sources.html
Some news on Sakhalin .
https://economictimes.indiatimes.com/industry/energy/oil-gas/ongc-videsh-says-oil-movement-from-sakhalin-1-project-disrupted-due-to-sanctions-against-russia/articleshow/92178122.cms
Dennis, can you explain why you think the state data is wrong? Why is EIA contradicted by producers own statements production is falling?
Baker,
The recent state data from the RRC is always incomplete, probably due to old methods of paper reporting that takes time to get into the digital data. This is well known. Eventually it becomes correct, but it takes about 18 months before it gets to 99.5% or better. Chart below compares current RRC data through Feb 2019 with data available in April 2019 (Feb 2019 was the most recent data available in April 2019).
The June 2022 data is from link below
https://rrc.texas.gov/oil-and-gas/research-and-statistics/production-data/texas-monthly-oil-gas-production/
US gas prices rise to a record $5 a gallon but Biden hedges on Saudi Arabia visit
US gasoline prices, a key driver of the highest inflation seen in the US in 40 years, hit a record $5 a gallon on Saturday. There was little to suggest they would drop anytime soon but, also on Saturday, Joe Biden said he had “not yet” decided if he will travel to Saudi Arabia, a week after opening the door to a possible trip.
fyi in the UK
3.79 ltrs to US gallon and £1.00 = $ 1.23 todays rate
standard ron 95 E10 here is £1.759 ltr so thats $ 8.20 per US gallon
desiel in london reported to have reached £ 2.49 so thats $11.61 per US gallon
most of our fuel price is taxes btw. £ 0.5295 per ltr plus 20% vat
also – $ 5 / 3.79ltr = $1.32 per ltr 1.32 / 1.23 = £1.07 per ltr
In other words, fuel is dirt cheap in the US.
Yep–
But I look at the idiots driving a F250 with bewilderment.
I know a guy here in Canada who complains that it costs him $300 to fill up the tank on his massive pickup truck. Well why did you buy that thing in the first place?
In BC it’s about $2.23/liter, some of the F250 FFV have an 182 liter tank, so that would be $400 for a full tank, the standard tank is 129 liters so, only $287 to fill that.
Hightrekker,
It would be interesting to see how many F250s would be idle in the US if gasoline reached $8.20/gallon (similar to current petrol price in UK). The price in California is currently about $6.40/gallon.
https://www.gasbuddy.com/usa
Another guy I know has a huge diesel powered RV with an 800 liter tank. At the moment diesel here in British Columbia sells for around 2.30/liter, so that’s $1840 to fill up the RV! He claims that motels would cost even more but I’m sceptical.
I haven’t heard how the RV industry is doing lately but it can’t be good.
Driving a Dinosaur makes one wonder.
And I’m often way more down a dirt road in Oregon than these clowns.
And I’m in a Yaris.
Dennis,
Do you have any comment.
https://www.ft.com/content/2d92c841-0a66-464a-9762-02994ac41f7d
FOS,
Sound about right, public tight oil companies are growing slowly and the smaller private companies are growing more quickly, it takes time to ramp up output in any case, maybe those oil companies like the high prices and see no reason to expand output and drive oil prices lower, I think it is mostly pressure from investors for high returns that is leading to slow growth.
For the past 6 months based on Baker Hughes rig count data, the US horizontal oil rig count has increased at an annual rate of about 43% per year, by October to December we might see this reflected in higher tight oil output increases as there tends to be a 4 to 6 month lag in changes in rig count to changes in output.
link to an article here for those like me who do not subscribe to FT
https://worldnewsera.com/news/finance/stock-market/us-oil-producers-ignore-bidens-rallying-call-to-drill/
OPEC announces a huge increase in production. And prices immediately increased after the announcement. Why? Because no one believed a damn word of it. OPEC is losing all credibility, and they have to know that. Why are they deliberately doing that? I have no idea about that one.
OPEC+ Fails To Meet Output Target Once Again
In April, OPEC alone missed its target by 2.7 million barrels daily.
SNIP
OPEC+ agreed last week to boost production in July and August by 648,000 bpd instead of the originally agreed 432,000 bpd. Some observers took that to mean success for Western diplomacy, but the market reacted in what was perhaps a counterintuitive, at first glance, way, with prices actually rising after the announcement.
Ron so you think oil price is rising because there is not enough supply? Then why cnbc saying it’s because there is not enough refineries?
Zirbat,
High prices at the pump are due to both high prices for crude oil and limited refinery capacity see
https://www.eia.gov/todayinenergy/detail.php?id=52718
Crack spreads have tripled from about 50 cents per gallon to $1.50 per gallon while the cost of crude has increased by about $1/ gallon, the crack spread has increased due in part to limited refinery capacity, but also due to fewer product imports and relatively low stock levels of finished petroleum products.
Zirbat, that makes no sense at all. If the problem was not enough refineries then the price would drop through the floor as crude oil backed up and storage overflowed because of the lack of refineries to take the crude. It is a shortage of crude oil that is causing the price of crude ot be so high.
Frac spreads April 2021 to June 2022, rate of increase about 5 per month on average over that period (4.76/month). The straight line is an ordinary least squares estimate through the frac spread data from April 1, 2021 to June 10, 2022, the slope of the line is about 4.76 frac spread increase each month.
Again, an update for motor vehicle sales in the areas USA, EU, UK, India and China.
The x-axis is the price of Brent converted to the energy content of a barrel of oil.
The y-axis is car sales per month.
Each data point is the average of car sales of the last 12 months.
The maximum of car sales has been in 2018.
The higher the oil price gets, the lower get the sales, with a delay of some months.
Much of the recent drop in car sales is partly due to lack of supply of new motor vehicles (in 2021 and 2022). Part of it is surely explained by increased fuel prices.
The price of a good is not determined by its energy content. One can claim that only energy matters, but it remains an unproven hypothesis.
Note that the world is too complex to boil down to a single word or concept.
Energy is important, so are materials, labor, technology/knowledge, water, soil, air, and the ecosystem.
Displaying the price of oil in BOE instead of USD, gives a lot of insight. For example, look at the increase of car sales in 2013 and 2014. This happened at an oil price of about 14 BOE.
In 2021, the increase of sales happened at about 6 BOE, and at 7 BOE the sales numbers went down.
In eight years (2013-2021) the BOE limits for car sales increase went down by eight points, from 14 to 6 BOE. Approximately, each year the “Power Limit of Oil” goes down one point.
“Power Limit of Oil” might not be the best expression, but at the moment i have no other.
In 2027 the “Power Limit” will be 0 BOE. Why do i have the impression, that the future of the car industry looks bleak ?
Berndt , yes . It is not only bleak it is now existential . The following industries are already in an existential crisis .
1 . Mining
2. Commercial aircraft manufacturing
3 . Oil and Gas ( E & P for the moment )
4. Ship building .
Automotive manufacturing has joined the list . Reasons are many , how about affordability (< 20% of the Europeans can buy a new car ) and other factors as Dennis has postulated . This is death by a thousand cuts but yes your conclusion is correct " Why do i have the impression, that the future of the car industry looks bleak ? "
Peak cars 2018 . Peak oil (C+C) 2018 . Coincidence ?
P.S : As I write the second hand car lots in Belgium are empty . Dealers complain they can't get hold of used cars to sell .
Oil and Gas in an existential crises? You mean the Energy industry whose equity is up 80% YTD? And whose product is super rare right about now?
TWOCATS , E & P part of the business in special because there is nothing worthwhile to explore . After satellite imaging etc the world is fully mapped out and not discovering any major deposits . Why is the everybody complaining about lack of investment ? Saudi’s , Americans , Europeans all in unison ? Several years we have seen companies selling assets and then using the funds to do share buybacks , No new refineries , pipelines cancelled , Why are not students joining courses in petro engineering ? Obviously they see the future as bleak . Current share value has nothing to do with this . The oil industry is notorious for going thru a boom and bust cycle regularly .
HIH,
many countries deliver monthly data for their car industries. This gives an accurate data set for examinations.
After setting up the thermodynamic equations, i was in need for data to calibrate the results. Because some of the input parameters are not exactly known, it was necessary to calibrate the output. Oil price data and car data are well known and adequate for calibration.
Peak oil is caused by net energy and physics (both govern economics), not by geology. If the net energy decreases, the infrastructure used for oil consumption must deteriorate. Cars are a main part of the consumption infrastructure. So it is not coincidence, that peak oil and peak car at the same point in time.
https://mishtalk.com/economics/over-twenty-million-households-struggle-to-pay-energy-bills-it-will-get-worse
20 million struggle paying energy bills heading into blistering summer…..
Peak avocado,
Sometimes the struggle leads to wiser decisions. I saw an old friend at a funeral recently who I hadn’t seen for a couple of years, when I told him I recently got a Tesla Model Y he said he likes his GMC Yukon. The price for a mid range Yukon is $5000 more than my Model Y, it gets about 16.5 MPG on average, So about 30 cents per mile for Yukon at $5/gal and 3.25 cents per mile for my Model Y (@ 13 cents per kWh and 4 miles per kWhr) a difference of 26.75 cents per mile. Over 150,000 miles thats a savings of 40k for the Model Y vs the Yukon.
My friend is not struggling, he is doing very well and is not worried about energy costs.
Those that are cannot afford a model Y, but they could buy a used leaf or a used prius, the Chevy Bolt and Hyundai Kona are quite affordable. Corollas, Civics, and almost any hybrid will be better than a pickup truck.
“Sometimes the struggle leads to wiser decisions”
Without a doubt.
https://www.market-ticker.org/akcs-www?post=246094
combined with smoldering inflation in non-discretionary items…it can lead to civil unrest as well.
Peak avocado,
Inflation is better than a depression in my opinion. Deficit spending during an economic downturn is sensible, the alternative is 25% unemployment which we saw due to a balanced budget philosophy between October 1929 and March 1933. Inflation will be brought under control, likely due to a recession caused by higher interest rates. If we have to choose between 8% inflation and 8% unemployment, I would choose 8% inflation. A nice balance might be 4% unemployment and 4% inflation, that might be a good place for the Fed to aim initially.
Dennis,
My only criticism of you is you have a very strong appeal to authority, in almost everything you post.
You were constantly parroting the FEDs claim that inflation is transitory. While a whole bunch of ‘youtube economists’ with no economic background were saying no it isnt transitory. Who ended up being correct, and is there any accountability ?
A true sign that economics is not a science, its more akin to alchemy.
Iron Mike,
Generally the future direction of the economy is difficult to predict, economists are often wrong about the future. It is a far more difficult field of science when no controlled experiments can be performed and when knowledge of the theory changes behavior of people leading to a change in outcome that makes the theory incorrect.
Yes the Fed was wrong on inflation, predicting the past is not really hard to do.
We can also find You tube “scientists” that tell us the earth is flat. I don’t believe everything I read.
I am pretty sure I have said often that I cannot predict the future, though perhaps you missed it. It is still true, as soon as I say otherwise, no one will listen.
Note that I do make best guesses, based on models with underlying assumptions that I lay out. If the model or assumptions are incorrect the best guesses are also very likely to be wrong.
Dennis,
Those youtube scientists claiming the earth is flat can be shown to be demonstrably false from multiple avenues and one does not need to appeal to authority to see the false claims, since simple observations or experiments can be done by individuals on any point on the earth to show its curvature.
The big difference here is accountability. The FED makes decisions based on economic theory which affects a lot of people, not just nationally but internationally. Let me give you a specific example. The governor of the reserve bank of Australia (RBA), is on a 1 million dollar/year salary, and they consistenly get every prediction wrong on almost every economic metric. The new government in Australia is calling for an independent review of the RBA so hopefully some bloody day these overpaid good for nothing bureaucrats get some accountability. But i am not holding my breath.
You mostly only believe what you read based on your appeal to authority, whether its the USGS or the FED, the world bank, BIS, OPEC etc. They are your overlords and at times it feels like you treat their words as gospel.
No i haven’t missed the many times you said its impossible to predict the future, but regardless of this you continue to peddle the appeal to authority because of the “mathematical models” they present to justify their overleveraged salaries.
Let me ask you this as an example. If economic models the FED uses is consistently wrong and continues to give bogus outputs why should the FED even exist?
Iron Mike,
I was only referring to models I use for estimates of oil output. Perhaps you know everything, I do not nor have I made any such claim. I evaluate the estimates by those who know more than me on a subject as best I can, I do not appeal to authority, I simply cite the sources of my limited knowledge so others can assess for themselves.
For example Bob Meltz thinks the BOEM estimates are far from the mark, his mid case estimate is less than what the BOEM claims for the discovered resource (including expected reserve growth of already discovered resources.) So in this case we have two authorities, the geoscientists at the BOEM and Bob Meltz. My guess is the team of scientists at the BOEM and USGS have access to a fair amount of data that they use in their evaluation and some of it may be proprietary data that cannot be shared.
It does not matter how much you pay someone, it does not give them foresight. We live in a world where future events cannot be known, especially in the field of economics. If you ever expect economic predictions to be correct, you will continue to be disappointed.
In fact, I didn’t think it necessary to point this out, but whenever I point to an economic forecast by anyone, the Fed or any Central Bank, It is an unstated assumption that the forecast will be wrong in almost every case.
I will continue to report on what major agencies such as the EIA, OPEC, IEA, etc report, without this there would not be much to discuss. Most of what I focus on is historical data and past trends, which often change in ways that cannot be predicted (much of this due to changes in economic output). The exception is resource estimates where I use estimates by a number of different authorities for World conventional oil, use Canadian government estimates for oil sands, and USGS estimates for tight oil resources combined with my own economic analysis. My analyses are very likely to be incorrect.
On why the Fed should exist, check your history, perhaps read some Milton Friedman, Keynes, Paul Samuelson, etc. Economic theory is not perfect, but the models are useful in my opinion, despite what you believe.
Inflation is mostly due to a lack of supply due to the Pandemic including a lack of energy supply, the Fed expected things would get sorted out more quickly than they have, future lockdowns in China due to their zero covid policy is difficult to model. The Russian invasion of Ukraine was also unexpected. I wouldn’t think that anyone would expect these events to be predicted in advance.
Dennis,
We’ll obviously agree to disagree. You have little to no criticism of the system. So basically in your opinion an individual can sit in a position of power and make predictions and be consistently wrong with 0 accountability.
Regarding the existence of the FED, Milton Friedman was in favor of abolishing it. Siting a consistently poor performance. So not all of your economist heros were in favour of the FED.
https://www.youtube.com/watch?v=m6fkdagNrjI
Iron Mike,
I have lots of criticisms of “the system”. Poor regulation of pollution and poor policies used to address externalities in general, especially in the US. Free market only allocates resources efficiently in a perfectly competitive economy. Such an economy exists only in introductory textbooks, monopoly and oligarchy exist in the real World and this market power must be addressed by governments, but usually it is not. Friedman is not my hero, his work is influential and many economists who were inspired by Friedman and other University of Chigago economists are part of what I consider the “free market fundamentalists” that never approve of any government regulation and espoused policies of lax regulation and low tax rates for the wealthy that have led to the GFC and a widening income disparity in the US.
Paper linked below has an interesting discussion of Friedman’s views.
https://www.federalreserve.gov/econres/feds/files/2018013pap.pdf
In any case, many of these older theories in economics get replaced by newer theories.
Friedman did not think the Fed should be abolished, simply that it should allow for consistent growth in the money supply consistent with the natural rate of inflation, he opposed interventions by the Fed to try to manage economic output as it would tend to increase instability rather than decrease it.
Modern monetary theory may not agree with this, I am not up on the latest stuff.
On accountability, the Fed cannot predict the future, so any expectation that they can is silly in my view. Inflation is largely due to fiscal policies that may have been overdone andsupply disruptions. To blame those on central banks is misplaced.
Friedman did not think the Fed should be abolished
Come on Dennis don’t waste my time. I clearly linked a video with Milton Friedman clearly saying he was always for abolishing the FED.
Iron Mike,
You are correct. I don’t watch videos. Found an interview from 1992 where Friedman says abolishing the Fed is a good idea. Not clear how money supply is controlled in that case.
Friedmans philosophy was one of no government intervention in the economy. In my view that would be a disaster.
In fact the rise of free market fundementalism inspired by Friedman and others has been the source of many problems.
Dennis,
I am not saying Milton Friedmann is right about free market economics and the Chicago school of thinking. But the FED is an utter failure.
Government interventionist economics have done nothing but exasperate existing problems. Now investors/companies only expect booms without the busts because at the sight of the first issues daddy government will come and bail them out. If thats your idea of good economics then we see things very differently.
So are you all for privatising profits publicise the losses, because thats effectively what government intervention in economics is.
I don’t watch videos.
You are seriously missing a tremendous source of information. Over half of my research time is spent watching YouTube videos. I subscribe to the YouTube Premium so I do not get any advertisements. If there is anything you wish to know about, there is a video covering it. Anything you wish to repair or figure out how to operate, there is a video covering it. If these things were available 60 years ago I would be a lot smarter than I am today.
Iron Mike,
Well you seem to agree with Milton Friedman it seems. I do not.
The Fed is not perfect, but I don’t expect them to control what they cannot control and I also do not expect that they can predict the future. Perhaps the economy could operate better without a central bank in a perfectly competitive market world.
We do not live in such a World, we live in an imperfect world and my guess is that will always be true.
Your argument essentially boils down to market solutions are always best and the government should only enforce laws and provide for the common defense and no more, everything else is government interference and takes away our freedom.
It is all Chicago school talking points. I disagree with most of it especially when carried to its extreme right wing conclusions.
If you prefer a large degree of income inequality and severe depressions (see 1929-1933) then no government intervention in the economy is definitely a good idea.
Dennis,
I don’t have any fixed views. Ever since I’ve been alive there has been government intervention which equate to policies you agree with.
It seems to me your views are very contradictionary. On the one hand you acknowledge wealth inequality and economic policies which causes such tensions in society. On the other you support the very same policies which cause wealth inequality and social issues.
You need to step back and make up your mind. Either you do want government intervention or not. Government intervention always again i repeat always entails fat handouts to corporations. Which in essence causes wealth inequality. If you cannot see that, then you are conditioned by university economics classes.
Again you assume i am with the Chicago school or Austrian school bla bla, those policies have never been implemented when i am alive so i cannot say how effective they are. I am only critical of the system i see before me, which includes the FED who is an institution who causes nothing but wealth inequality and see the world in a miopic way due to their economic conditioning, or out of pure malice i don’t know.
We can always agree to disagree, but fact remains for me, your arguments are full of contradictions.
Iron Mike,
Our social system is imperfect and there are many problems. As I see it wealth inequality in the US became much more pronounced after 1980 when Chicago school policies becomae more dominant in the US. The US Fed was established in 1913, after the Franklin D Roosevelt administration many policies were implemented by the US government which led to greater income equality in the US. These included Social security and Medicare, the ability for workers to Unionize and a highly progressive income tax. Starting in 1980 the US income tax became far less progressive, unions were curtailed, and the finance and banking industry were deregulated, this was done by the legislature and executive branches, not the Fed which is independent so that politics are kept out of the central bank policy (in my view that is a good thing).
We disagree on the source of society’s problems and that the government is the source of all ills in society, unfortunately the government is not perfect, just like the people who elect their representatives are also imperfect. The wealthy have a lot of power and unfortunately this wealth is used to extend this power to influence the government, but the government can also be a check on the power of the wealthy, it just depends on who is elected. Generally in the US, the Republicans tend to support the wealthy and the Democrats less so, though in fact all are influenced by money in politics which is relatively unfettered in the US.
Chart below shows changes in ratio of top 20% income share to bottom 20% income share in the US. Note the steady increase since 1980.
All of my life there has been government intervention, but to a lesser and lesser degree especially since 1980. In the decades from 1960 to 1980 there were some positive developments in the US with the Voting rights act (Federal government forcing states to allow minorities equal access to the ballot box) and the Clean air and clean water acts and formation of the Environmental Protection Agency. With the Reagan revolution there was a move to deregulate as much as possible, under Clinton this continued with the deregulation of the financial and banking industry.
A major question is was there too much or too little government interference? You seem to believe it was too little, I think it was the reverse. Government intervention will always be imperfect as government officials also lack perfect foresight. The alternative is to risk a Great Depression which likely would have occurred if the government sat on its hands in 2008 and 2009 and as Milton Friedman and the Austrian school would have advised.
Be careful what you wish for. A free market does not result in income equality, only a well regulated capitalist economy can accomplish that. Income inequality is much less pronounced in the advanced economies of West Europe and Scandanavia than in the US.
Yea 1980s probably after Ronald Reagans neoliberalism agenda. I agree with that if that is what you are referrring to.
Iron Mike,
Yes that is what I meant.
I do not agree with many of the policies implemented over the period since 1980, the main movement in the US for less government interference rather than more, exactly what the Chicago school was asking for, though they would have gone further and got rid of all government spending except military spending, law enforcement and judicial system spending.
Not a society I would care to live in personally.
Dennis,
What i meant is that i agree with you, 1980s neoliberal policies with less government and regulation exasperated wealth inequality. We finally found a common ground.
What we disagree on is that i don’t like the FED at all. I rather government control monetary policy as they do fiscal policy.
The only part of the chicago school i agree with is their criticism of the fed.
Mike- “make up your mind. Either you do want government intervention or not. ”
No, its not just black or white. There are a hundreds shades of grey between those two extreme choices you present.
The devil is in the details on this, just like so many other big decisions a civilization has to make.
Government control over the national bank is a bad thing history has proven.
It’s like a small kid beneath the cookie jar – it can’t resist long until it has the hand in.
Government control over the national bank is a bad thing history has proven.
History has proven no such thing. In fact, history has proven the exact opposite. Well, in the USA anyway. I cannot speak for Germany.
In the days before FDIC, (Federal Deposit Insurance, enacted June 16, 1933) banks would routinely go bust. That was one of the major causes of why the Great Depression started off so bad. The lifetime savings of ordinary people was wiped out when a run on the bank caused the bank to collapse.
The FDIC was the best thing that ever happened to depositors as well as the banks that held those deposits.
And make no mistake, the 2008 collapse of financial institutions was a failure of federal control, not the cause of the collapse. Since then government controls have tightened so such a collapse cannot happen again. No more liar’s loans, no more bundling junk mortgages so they can be upgraded to investment-grade bonds. Hopefully, with tighter government controls, we can avoid another 2008-type collapse.
https://www.market-ticker.org/akcs-www?post=246120
“Anyone who thinks “inflation will moderate” over the next 12 months has rocks in their head”
PPI is scorching.
PPI leads the CPI. So CPI is going up again in the next report.
Peak avocado,
PPI is running around 10%, CPI around 9% within margin of error, also PPI is lower than it was in March, again probably within margin of error.
Higher interest rates may bring inflation down by reducing economic growth rate.
As always the future remains unknown, both to those with and without rocks in head.
Don’t forget this: https://www.nasdaq.com/articles/a-third-of-families-earning-%24250000-live-paycheck-to-paycheck
Among other things. The cost of fuel going up means people will simply be unable to get to work, or their discretionary spending becomes nil.
This presentation would suggest that various weather systems are lined up for this hurricane season to be as bad or worse than the last two years in the Gulf of Mexico. Previously there was extensive lost production but the coastal refineries got away fairly unscathed, maybe this year will be different.
https://www.youtube.com/watch?v=_DWfr2A7lcI
George,
I agree this could be a problem for the US as much of the refinery capacity is concentrated on the Gulf coast.
IRONIC! NORWAY IS BUILDING A MASSIVE WIND FARM TO BOOST OIL PRODUCTION
In a huge twist of irony, Norway is building the world’s largest wind farm — to power offshore oil and gas fields.
If you’re raising your eyebrows at this point, we are too.
The project called Hywind Tampen is set to be constructed and operated by Norwegian energy giant Equinor, who also happens to be drilling for oil and gas in the area.
It’s a rather confounding development for the country, which is currently the most fossil fuel-dependent industrialized democracy in the world.
I don’t understand why you think this is a surprising or ironic development Ron.
Many parts of the energy supply systems of the world use forms of energy other than their product in the process of production. As I’m sure you know refineries use electricity, and that may come from
coal, hydro, wind, solar, nuclear, natural gas sources- not just from diesel generators, for example.
Hickory, it’s a copy and paste directly from the article. I always post such articles in italics to show that it is a copy and paste and not my words or opinion.
Got it.
I think that article author is just trying to be sensational for catching reader eyes.
“It’s a rather confounding development for the country,”
Not confounding at all.
Strange price action today:
Stocks down hard, bonds down hard – and oil shooting back into green under great volatility. Something is breaking here – I expect more chaos the next days.
Especially oil being such stubborn high under the harbinger of a big recession is strange. Real estate will be strangulated by higher interrest when this continues – and this should take oil and energies lower.
When looking at the big chart, interest rates are at breaking out of the 30 years down trend – that would be a financial earth quake.
In Germany commercial transactions on the real estate marked already cratered by more than 50%.
Is the answer in this article?
– A strong US dollar has historically put downward pressure on oil prices, but that hasn’t been happening lately.
– The US dollar has strengthened to a 20-year high, while crude prices have skyrocketed.
– “It’s a double whammy for everyone outside the US,” an economist told Insider.
A strong US dollar has historically put downward pressure on oil prices as contracts for the commodity are typically priced in the greenback. But that hasn’t been happening lately.
This year, the dollar has strengthened roughly 8.5% to a 20-year high against the world’s other major currencies, as the Federal Reserve winds down the easy-money era and tightens policy.
At the same time, crude prices have surged 62% in 2022 as Russian supplies disappear from the market, global stockpiles shrink, and demand ramps up amid the rebound from COVID restrictions and the start of the summer travel season.
“It’s a double whammy for everyone outside the US,” Aleksandar Tomic, economist and associate dean at Boston College, told Insider. “Other countries have to pay even more for barrels [of crude] because they are dealing with the rising dollar and rising oil prices. The US is dealing with just the rising prices.”
https://www.yahoo.com/entertainment/us-dollar-oil-prices-breaking-121500333.html
=======================
That historical dollar-oil price relationship now appears to be broken. Crude has risen 70% in the past year, and currently trades at about $120 a barrel. At the same time, the dollar has gained 10% since mid-2021. That’s creating balance-of-payments crises in many oil-importing nations, particularly in Africa, Latin America and Asia. Malawi, one of the poorest nations in Africa, recently devalued its currency by 25% in a single day.
https://www.washingtonpost.com/business/energy/in-the-oil-market-the-strong-dollar-is-the-worlds-problem/2022/06/08/acec9ba8-e6e8-11ec-a422-11bbb91db30b_story.html
Roe,
My guess is 2 to 3 years. Possible that a recession could delay that, but I expect about a 200 kb/d annual increase in Texas output over the next 2 to 3 years.
Roe
Dennis thinks a few years. I think a little longer, if ever. Something has changed the thinking in Texas/Permian companies. Two trends are starting to show up in Texas and the US.
First the completion rate is starting to slow in the Permian. (See chart). Drilling is starting to increase to make up the slowing use of DUCs. Not sure if the new areas being drilled are Tier 1. Note in chart below from HIH that production per rig is dropping.
Secondly the Farc spread count increase is also slowing. Seems to parallel the completion rate.
Throw in hurricane season and one can see the challenges.
I just met with some of my old team drilling in the Permian. The privates are the ones drilling the most and as they relayed to me “they are running out of inventory”. The companies with the most inventory are drilling the minimum to harvest cash, pay down debt and pay dividends. I would be careful about making predictions regarding production increases in a very precarious economic environment. Natural gas prices while still high, fell out of bed this morning. I think the overall health of the economy in the next few years coupled with volatile prices should place a governor on production increases.
I know Dennis believes that the drilling inventory in the Permian is infinite but I have seen lots of pressure communication between wells and between stacked pay zones within certain areas. I believe this will inevitably impact the rate of production growth and certainly impact decline curves.
Nat gas price will be down until end of year – a big LTO export facility burned down. So less export capacity.
And yes, when a big whale sits on 30% of the best wells and drills only slow, all these grow curves are void.
Big concerns normally work like this – stretching out the lifetime of a field to 30-50 years. They need less infrastructure this way, resulting in higher margins. It’s a big difference building an internal 2 mbpd infrastructure to rock down your leases in 15 or less years, or earn a lot of money with a 0.5 mbpd infrastructure.
Even with risk management – less money invested, less risk.
Eulenspiegel.
The problem with drilling slowly is the tight oil producers may miss their window of opportunity. At some point demand will fall more quickly than supply (my guess is around 2030), at that point the price of oil starts to fall and it may happen very quickly as large middle east producers may start producing all out trying to increase their market share. For the producers that have decided to take the “go slow” approach, they will have a lot of resources that will become stranded assets at lower oil prices.
A better approach might be to produce as much as they can while oil prices are high rather than wait for oil prices to decrease. In the mean time, the private companies that have some locations to drill are wise to continue completing wells in my opinion.
The window is 8 to 15 years to produce the oil profitably, stretching out the life of the field to 30 years (from today) won’t work, by 2035 oil prices may have fallen to under $50/bo (in 2022 US$) tight oil wells are not profitable at that oil price level (over the full life cycle from spud to plug).
Eulenspiegel was referring to ‘go slow’ on Natural Gas drilling (not oil)
I don’t think the US is going slow, rather it is going extremely fast on nat gas production.
Even to point of being a big exporter of LNG.
“Dec 21, 2021 — The United States is expected to become the largest exporter of liquefied natural gas (LNG) by 2022, surpassing Australia and Qatar.”
https://www.reuters.com/business/energy/us-be-worlds-biggest-lng-exporter-2022-2021-12-21/
Dennis- the window of profitability/demand for Nat Gas is not going to subside by 2030. Far beyond that i suspect, in fact I consider the demand for Nat Gas to remain very high indefinitely.
Timing will be different for oil- which i think you were referring to.
Hickory,
Perhaps correct, seemed he was referencing LTO Survivor’s mention that companies with the most tight oil well inventory are going slow, but natural gas price was also mentioned so it could be either. I think LTO Survivor mentioned natural gas price because a significant amount of income comes from natural gas and associated liquids at current price levels.
I am not sure how quickly demand for natural gas might subside, coal prices are also high and the combined high prices for fossil fuel might lead to an acceleration of ramp up in wind and solar deployment, so we could see demand for natural gas an coal start to decrease before long. Consider the fact that US prices for natural gas have been below the World level due to a lack of export capacity, as more LNG facilities come online the cost of natural gas in the US will rise to the European price minus about $5/MCF, currently in Europe this is about $25/MCF due to supply disruption, but it will likely settle at around $20/MCF in Europe (assuming Russian Ukrainian conflict remains unresolved) which suggests US natural gas may rise to $15/MCF. At that price for natural gas wind and solar will be very competitive and will replace a lot of natural gas fired and coal fired power plants. This could occur as early as 2030, but more likely by 2035.
LTO Survivor,
Thanks for the information.
No there are not an infinite number of well locations in my scenario, it is about 70k wells drilled after Dec 2021, with about 33.8k wells completed from Jan 2010 to Dec 2021, a total of about 104k wells. The scenario has roughly 44 Gb total tight oil output from the Permian basin (close to USGS F95 TRR estimate, without any assessment of probable reserves, contingent resources or potential reserve growth, essentially all of these would be a part of undiscovered TRR). Perhaps few of the potential locations are in the hands of privately held tight oil companies, I don’t have enough data to know. The current Permian completion rate is about 436 wells per month (May 2022 estimate from EIA DUC report).
In my opinion this scenario is quite conservative.
Hubbert curve tells us little at this point, one can pick a random curve, but it means almost nothing at this stage. Typically to get a rough estimate requires annual production divided by cumulative production to reach about 0.05 and 0.1 at minimum. Permian tight oil is at about 0.16.
If we consider a Bakken HL when annual production divided by cumulative production as at about 0.14 (a bit less than current Permian tight oil aP/CP) we get an estimate of 3.5 Gb, but current cumulative production is already 4.5 Gb, so that is clearly wrong, Current data gives an HL estimate of about 7.3 Gb for Bakken, note that this is more than 2 times the early Bakken HL estimate. Currently the early Permian data (with aP/CP at 0.16) suggests a URR of 33 Gb, my estimate is about 44 Gb based on well profiles and reasonable estimates of future well locations.
Chart with early (wrong) Bakken HL estimate below.
Frac chart up to June 10
Ovi,
If one looks at the rig productivity it increases after a down turn in output as in 2015 and 2020, then it dips and then rises again. Frack spreads are increasing more slowly, perhaps due to other supply constraints.
I would be very surprised if Texas doesn’t surpass previous peak by end of 2025 unless the coming recession is severe. That is impossible to predict.
Completion rates may be slowing due to fewer DUCs, but if rigs continue to increase we may soon see the stock of DUCs increase and perhaps completion rate will rise at that point.
ROE , Texas I don’t know but yes US peak 2019 at 12,98 mbpd . Take it to the bank .
Roe,
It’s rare to see someone quote Mustang, so I suspect you’re Mustang under a different name now?
Have you managed to understand Betz’s Law yet?
There is a dollar shortage and it’s about to be an acute dollar shortage.
When the Eurodollar curve inverted late last year it start on out the curve in the blues. 2024-2025 contracts. The yield curve inversion has worked its way down to the reds and almost the whites.
Whites are the shortest duration contracts. Comparable to the 2 and 3 month T-bills. If we were talking about US treasuries.
Last week the whites were only two basis points from being inverted. That is like 2 month treasuries being inverted to the 10 year treasury.
Eurodollar market where the actual money that runs the global economy is created is screaming global recession/depression.
TSHTF . Another 1.1 mbpd is gone .
https://oilprice.com/Latest-Energy-News/World-News/Libya-Loses-11-Million-Bpd-As-It-Shuts-Down-Nearly-All-Its-Oil-Fields.html
Libya’s oil is diesel rich
Production per rig in barrels per day in the top 3 shale basins according to EIA:
It’s all over but the crying. OPEC has no more spare capacity. World March production, if it is higher than February production, will be the high for the year. Well, that is my opinion anyway.
Oil Prices Spike As OPEC Reveals Production Loss For May Bold mine.
Not only did OPEC not lift its production as agreed for the month of May, its production actually decreased, according to OPEC’s latest Monthly Oil Market Report released on Tuesday.
Meanwhile, the group stressed that oil demand could be stymied by Russia’s invasion of Ukraine. That point, however, did little to assuage the market’s fear that OPEC’s spare capacity has been overstated, with Saudi Arabia and the UAE the only members that have any room to increase production. That extra production from The Kingdom and the Emirates, however, has been offset by an even greater decline in production from Iraq, Libya, and Nigeria.
OPEC produced a total of 28.508 million bpd in May—down 176,000 bpd from April 2022. The reason for the decline are decreases in production in Equatorial Guinea (-2,000 bpd), Venezuela (-2,000 bpd), Iran (-20,000 bpd), Iraq (-21,000 bpd), Gabon (-32,000 bpd), Nigeria (-45,000), and most notably—Libya (-186,000 bpd), according to OPEC’s secondary sources.
Saudi Arabia’s directly reported production was 10.538 million bpd.
These losses were partially—but not completely—offset by gains in Saudi Arabia, which increased production by 60,000 bpd, reaching an average of 10.424 million bpd; the UAE, which saw an increase of 31,000 bpd, and Kuwait, which saw a 27,000 bpd increase.
For the 10 OPEC members that had assigned quotas for May 2022 totaling 25.589 (which exclude Iran, Venezuela, and Libya), May’s actual OPEC member production was 24.541—a 1.048 million bpd shortfall from OPEC’s stated allowances.
The market reacted to the data with a rebound in oil prices. At 9:14 am ET, WTI had risen 1.27% to $122.50, while Brent crude had risen 1.33% to $123.90 per barrel.
And here we go with hurricane season for the next 4-5 months:
https://www.naplesnews.com/story/weather/hurricanes/2022/06/15/tropical-updates-national-hurricane-center-waves-storms-forecast-path-depression-next-name-bonnie/7631909001/
US tight oil and DPR, with projection based on DPR minus 745 kb/d (March conventional in tight oil regions)
Iron Mike, if your wish to abolish central bankers someday came true
-what mechanism would serve as a replacement to occasionally provide the brakes or the accelerator to economies of various countries, or should things just run along like a dramatically more wild roller-coaster?
-do you think there is any chance that removing central banking will happen in the next 50 years, or is it just a discontent talking point? I ask since it seems to me that so many people simply want to have someone to blame, rather than having some reality based alternative plan.
Personally, I think most of the blame for the lack of perfection in the management and performance of national economies lies elsewhere.
Hickory,
I don’t exactly know to be honest, perhaps the government should set interest rates not some ‘independent body’ with unknown interests in which the people have literally no say in.
Looking at Oxfam statistics regarding wealth inequality. There is absolutely no doubt a big factor has been central bank policies which feed into the inequality directly. So again i don’t know whether central banks will be removed but if the gap keeps widening you can rest assure at one point social upheavel will force people onto the streets.
I ask since it seems to me that so many people simply want to have someone to blame, rather than having some reality based alternative plan.
So what you saying? We shouldn’t even critique the institutions which are directly responsible for wealth inequality? Come one this is the first step, know thy enemy.
Personally, I think most of the blame for the lack of perfection in the management and performance of national economies lies elsewhere.
Where? So you are saying the amount of billionaires wealth gain in the pandemic while the middle class was shat on wasn’t due to the FED policy ? Come on now wow.
Iron Mike,
The Fed has little influence over income distribution, much of the income inequality is due to tax policy, at least in the US. The fact is the government has little control over the economy and though the Fed has some influence, decisions by the legislature on taxes and government spending also have a large role to play. Conservative orthodoxy suggests any government action on the economy only makes things worse, you seem to agree with that philosophy. I do not.
Dennis,
The Fed has little influence over income distribution
Sorry but that is absolute bullshit. You telling me monetary policy has not exasperated wealth inequality with near zero interest rate policies ? I am sorry i totally disagree with you. You are an apologist of a vile organisation that increases wealth inequality. It may surprise you that I am not the only one who thinks so.
I have no problem with fiscal policy implemented by the government for people who need it, KEYWORD “PEOPLE” not fucking corporations. So stop using words like “conservative” or “right-wing” to politicise the discussion, it’s weak as shit.
Did you agree with the government bail outs during the GFC ? If you do/did, you and I have zero common ground regarding this discussion.
Iron Mike,
Yes we very much disagree. The government actions taken during the GFC were imperfect, in my opinion government actions are never perfect there are a lot of competing interests and not everyone is pleased with the outcome.
Given a choice between no government intervention and a resulting Great Depression and government bailouts of large industries that reduce the number of people thrown out of work in the absence of those bailouts, I would choose the latter in every case.
Does a 25% unemployment rate sound like a better option? For the alternative see 1929 to 1933. We see which is the lessor of two evils differently.
Dennis,
I will always be against giving public money to corporations. Why? Because it gives bad precedence. It tells corporations, hey its okay to gamble your money and lose, daddy government will always come and bail you out. So these companies that really should go under and wipe the slate clean, leaving the prudent companies and or setting the ground for better corporations to be sown. It also gives insentive to existing companies to save for a rainy day and be responsible. Darwinian evolution in the corporate world is a good thing, and government shouldn’t interfere with their “natural selection”.
Giving money to people. Sure by all means. People who need to make ends meet.
So we will agree to disagree. But we do have some common ground in some areas I think.
Iron Mike,
In most cases I think handouts to corporations is a bad idea, but in an economic crisis your idea does not work well. Basically that was exactly the philosophy adhered to in 1929 to 1933, it might work somewhat better today due to a social safety net.
Many of the large financial corporations are linked, especially in 2008 due to poor financial regulation. If the government had not stepped in the entire financial structure would have come crashing down and taken the World economy with it.
If this had not been the case we could have let all the companies fail that were troubled, generally I agree the government should not be bailing out large corporations, but in some instances it may be necessary.
Dennis,
I assume you are referring to “too big to fail” corporations. It should never get to that point, which is part of the problem in my opinion.
If a corporation is deemed “too big to fail” then it should be broken up, otherwise we are dwelling in a corporatocracy.
Iron Mike,
I agree. A problem in the financial industry, particularly in 2008 was that many financial companies were linked by CDOs and other fancy instruments. This is the reason that deregulation is a bad idea. I also agree large companies should be broken up, but legally it is difficult to accomplish, the only big companies that have been broken up in the US were Standard Oil and AT&T as far as I remember. Unfortunately powerful lobbying efforts make it difficult to accomplish in practice. In principle I agree anti-trust action should be pursued more aggressively, in the World as it is this does not occur, but I agree that it should.
When it comes to wealth inequality, almost the entire issue is decided by and regulated by the laws of the country (senate/parliament etc). For example- tax distribution, minimum wage, education opportunity policy, estate taxation, capital gain tax rates, business incentives or disincentives, laws restricting or enabling discrimination, for example.
The Central bankers don’t have very much influence on these key factors.
To focus on the central bankers as the primary determinant in regard to wealth distribution is a false narrative.
The Fed has a lot of control on the throttle vs brakes, but has close to zero control of the steering wheel.
The biggest problem that I see with the Fed is that it almost always has trouble ignoring the political scene. The 4 year election cycle and political winds cannot be completely ignored, after all the Fed is comprised of individuals with personal notions, and they are exposed to very vocal attempts at swaying their determinations. ex- “How Trump’s Attacks on the Fed Have Made Its Job Harder
Mar 19, 2020 — WASHINGTON — President Trump has spent two years publicly attacking the Federal Reserve and undercutting its chair, Jerome H. Powell….”
The other big problem is the inability to accurately predict the future of this complex organism (the economy).
Hickory,
Regarding Trump badgering Powell, it was for him to cut interest rates so the stock market can go higher so he can brag to the rest of the country and the world how good of a president he is with the economy.
Powell eventually gave in and did that now we have asset bubbles as a result of their monetary policy.
Yes. Its a good example of how the Fed struggles to ignore the political situation and pressure of the country, and focus only on the economic situation. It is a constant struggle, and nothing new.
No one knows how to fix this, as far as I know.
Hickory,
Sorry for repeating myself, but in my opinion the FED should go. Its nothing but a purely unelected bureaucracy. The government should be able to do what they do with oversight, as far as I am concerned they are a completely unnecessary corrupt organisation. But that’s just me.
I think that in general central bankers make much better decisions than do legislatures, who are made up partisan individuals most of which have very limited business or economic experience, and even those who do are heavily influenced by special interests, lobbying, and their bosses.
As a result legislative bodies are poorly qualified to make financial decisions or to perform regulatory oversite- short or long term.
That should be all of our bigger concern.
Hickory —
Your list leaves out two of the biggest causes of poverty in America — car culture and healthcare.
I would argue that forcing Americans to travel by cars connecting single family housing units is the main driver of poverty (and homelessness) in the country.
Medical bills are well documented as the leading cause of bankruptcy.
That was not the topic of our discussion.
But to your point- no one forces Americans to travel or house themselves as they do.
Its been a collective choice.
I suggest that these topics of the ‘Fed’, and wealth inequality, etc are better held on the other thread.
Money is a value system. The most powerful way to alter the value system is money creation. I refer to my comment: https://peakoilbarrel.com/us-january-production-drop-surprises/#comment-737969.
I think the only reason people have accepted our monetary system is economic growth which is coming to and end. The goals of the monetary system should be completely reconsidered and a better design implemented. Some interesting thoughts in this direction can be found here:
https://ubiresearch.org/the-relative-theory-of-money-in-detail
I also recommend the books of David Graeber.
Schinzy , David was one of his kind . Out of the league . I support your recommendation .
Graeber– one of my favorite anarchists
From the WSJ:
Natural-Gas Prices Plunge After Extended Outage at Texas LNG Facility
One of the biggest U.S. LNG exporters says fire damage will prevent it from returning to full capacity until late this year
https://www.wsj.com/articles/natural-gas-prices-plunge-after-extended-outage-at-texas-lng-facility-11655235895?mod=hp_lista_pos1
“U.S. natural-gas prices plummeted after an LNG shipping facility in Texas said a fire last week would knock out the facility until late this year, greatly reducing export capacity.
Natural-gas futures for July delivery fell more than 16% to end Tuesday at $7.189 per million British thermal units, the latest whipsaw move in the market for the power-generation and heating fuel. Futures prices for deliveries through February shed at least 10% on the day, suggesting greatly diminished fears about shortages this coming winter.
Natural gas has been a big driver of inflation this year, with the highest prices in years adding to the cost of heating, cooling and powering homes and businesses as well as manufacturing steel, cement, glass, plastics and fertilizer. Prices had hit $9.60 just before the fire at the LNG plant on Wednesday, which was about triple what gas cost a year earlier. Since the fire, prices have dropped 25% from that intraday high. ”
Wonderful how in effect one company increases the prices for everybody else – but that is unconstrained capitalism for you.
rgds
WP
North Dakota oil production was down, in April, by 222,640 barrels per day to 900,640 barrels per day. They had two blizzards in April.
ND Monthly Oil Production Statistics
Ron
The DPR and LTO groups have known, maybe I should say should have known, of this weather related drop and there is no sign of this huge drop in the May LTO report and none in latest June DPR report. It will be interesting to see what the LTO report shows next week.
Makes one wonder where they get their info from.
Yeah, and the problem carried over through the first week in May. So May will likely be down also but not nearly as much as April.
We all know that the DPR’s forecasts are not worth a bucket of warm spit.
Ron,
Lynn Helms said things only got back to normal by June 1, so yes May will also be lower than “normal”, which Helms considers to be 1.1 Mb/d for North Dakota, he did not venture an estimate for May, just less than normal so in the 900 to 1100 kb/d window, perhaps 1000 kb/d.
estimate for May, just less than normal so in the 900 to 1100 kb/d window, perhaps 1000 kb/d.
Perhaps 1000 kb/d? Damn you are an optimistic soul. Lynn helms is not nearly so optimistic. This article was posted yesterday, June 14.
Daily oil production plummets amid April blizzards
Oil production fell as low as 300,000 barrels per day during the second blizzard in late April — a 70% drop relative to the start of the month, according to Helms. It had rebounded to more normal levels by mid-May but did not fully recover until the beginning of this month, meaning May’s production figures also are likely to be impacted, he said.
“The entire month of May we had a hangover from the big blizzard party,” Helms said.
Ron,
I watched the video of the Directors cut, he said things returned to normal by June 1, which he said normal meant 1.1 Mb/d, in April output was 0.9 Mb/d. Helms did not make an estimate. It seems doubtful that May’s output will be as low as April when there were two blizzards, so I picked a number between 0.9 and 1.1 Mb/d. Perhaps 1 Mb/d is optimistic, we will know in about a month.
Dennis, all I meant to imply was that Helms gave a very pessimistic estimate of May’s production. Of course, he did not mean it would be as low as April’s production. A very reasonable guess at to May’s production would be about 950,000 barrels per day. That would be my guess. I have total confidence that my guess will be closer than yours.
Rethinking North Dakota oil production. They had 93 wells completed in February, 53 in March, and 33 in April. May was a terrible month according to Lynn Helms so we can expect completions to be down in May as well. We already know May will well down from February, though not quite as much as April, but what will the lack of new wells do to June and July production? No effect? I seriously doubt that.
Click on graph below to enlarge.
Ron check the June report where they give a completion estimate for May it is 53 wells, the same as March when output was 1123 kb/d.
Directors cut June
I will stick with my 1000 kb/d guess for May 2022 for North Dakota output, we will see if your 950 kb/d guess is closer next month.
Dennis, from the archives of the Director’s Cut:
Completed wells;
November 60
December 65
January … 75
February. 90 Premliminary
Dennis, the 1123 kb/d in March, did not come from wells completed in March. All that came from wells completed previously. Also, even though 53 completions in May is quite low compared to earlier months, it is still subject to revision.
Director’s Cut Archive
Click on graph below to enlarge.
Ovi,
The most recent month for the tight oil estimate might be model based as there really isn’t other information out there for the April tight oil output estimate when it came out on May 22. We knew about the April blizzards, but any guess on output would have been just that, the next tight oil update will reflect the recent North Dakota data for April. Bakken/Three Forks was down by about 215 kb/d in April.
https://www.dmr.nd.gov/oilgas/stats/historicalbakkenoilstats.pdf
Dennis
The only thing that makes sense for the LTO and DPR is that they are model based. Regardless, there must be some way to insert updated data.
As for “We knew about the April blizzards, but any guess on output would have been just that….”
In the March US update, Helms gave a good timeline on the outages. Based on that info, I made the following estimate in the ND section of the report.
“A rough estimate of what North Dakota production could be in April was made using the above information. The projected production is expected to be close to 860 kb/d, a loss of 240 kb/d.”
Ovi that was an excellent guess, the guys at the EIA must not be as smart as you. They might just base the most recent month on the DPR minus an estimate of conventional in the DPR regions in order to be consistent from month to month. Once they have hard data as was published today they update the estimate.
That’s my guess. You could email them and ask.
The DPR is model based, that is known, the most recent month of the tight oil estimate may simply be based on the DPR model or some other internal EIA model.
IEA oil market report June 2022: https://www.iea.org/reports/oil-market-report-june-2022
Summary: Commercial stock build in the short term but unless there is severe demand destruction/depression, next year looks challenging as China and non OECD reopens.
*Observed global oil inventories increased by 77 mb in April. OECD industry stocks also rose, by 42.5 mb (1.42 mb/d), helped by government stock releases of nearly 1 mb/d. At 2 669 mb, OECD industry stocks were nevertheless 290.3 mb below the 2017-2021 average. Preliminary data for May show total OECD stocks building by 6 mb.
*World oil demand is forecast to reach 101.6 mb/d in 2023, surpassing pre-pandemic levels. While higher prices and a weaker economic outlook are moderating consumption increases, a resurgent China will drive gains next year, with growth accelerating from 1.8 mb/d in 2022 to 2.2 mb/d in 2023. In contrast to 2022 when the OECD led the expansion, non-OECD economies are set to account for nearly 80% of growth next year.
will be interesting to see if SPR drawdowns continue at current pace.
https://www.reuters.com/business/energy/us-sell-up-45-mln-bbls-oil-reserve-part-historic-release-2022-06-14/
Jeff , ” will be interesting to see if SPR drawdowns continue at current pace.”
The answer is already provided .
The good thing is that the SPR is bottomless….
Rgds
WP
The piggy bank is being emptied .
85% of…SPR [sales] have been medium-sour…By …October…only 179 mmb of [it will remain]..
“The news of an extended outage at the US Freeport LNG terminal is a major issue for the Asian LNG market, exacerbating tight global market fundamentals as regional term customers of the terminal will be forced to seek alternative supply in competition with European buyers…”
https://www.spglobal.com/commodityinsights/en/market-insights/latest-news/natural-gas/061522-extended-outage-at-us-freeport-lng-a-disaster-for-asian-lifters
I think that really says it’s a disaster for European buyers. Asia will get theirs.
Both regions are going to be competing on price and for cargoes, and for deployment of new importation capacity build out.
That’s what your boy Putin hopes, but there is no reason whatsoever to expect it is true.
Trying to win a war of attrition against the whole world is incredibly delusional.
IEA Sees World Oil Supply Struggling to Meet Demand in 2023
(Bloomberg) — Global oil supply will struggle to meet rising demand next year, meaning consumers will continue to face tight fuel markets, the International Energy Agency said in its first assessment of 2023.
A resurgent Chinese economy will bolster consumption, while tighter sanctions on Russia will curtail oil output, the agency forecast in its latest monthly report. The OPEC+ coalition of producers would need to deplete its spare production capacity to historically low levels to satisfy demand, it said.
“Global oil supply may struggle to keep pace with demand next year, as tighter sanctions force Russia to shut in more wells and a number of producers bump up against capacity constraints,” the Paris-based IEA said on Wednesday.
In 2023, growth in global demand is set to accelerate to 2.2 million barrels a day, while non-OPEC+ supplies will expand by 1.9 million a day. World consumption will average 101.6 million barrels a day, surpassing pre-pandemic levels, the IEA said.
https://www.bnnbloomberg.ca/iea-sees-world-oil-supply-struggling-to-meet-demand-in-2023-1.1779127
D Coyne said:
It is all Chicago school talking points. I disagree with most of it especially when carried to its extreme right wing conclusions.
If you prefer a large degree of income inequality and severe depressions (see 1929-1933) then no government intervention in the economy is definitely a good idea.
Totally agree Dennis, thank you.
“North Dakota oil production was down, in April, by 222,640 barrels per day to 900,640 barrels per day. They had two blizzards in April.”
Impossible. Only windmills don’t work in the cold.
Latest Art Berman video for those who might have missed .
https://www.youtube.com/watch?v=ERDdrdHTCzk&t=153s&ab_channel=Wealthion
Items not in the US MSM.
1) The LPR and DPR in Ukraine, and an oblast north of Kherson’s oblast (outside the DPR and LPR), have all had their authorities inform the citizenry that any and all debts owed to Ukraine banks are declared discharged, including interest accrued. At first glance this looks like total disaster for the relevant banks, but of course, a central bank can create infinite money and hand it out. One would expect the current Ukraine government to request reimbursement from the EU, US, UK.
Regardless, a hearts and minds moment for the populace.
2) https://www.tatratrucks.com/trucks/customer-segment-catalog/defence/more-trucks/8×8-high-mobility-heavy-duty-fuel-tanker-18-000-liters/ This is the generic Tatra company fuel truck of which Russia (and Ukraine) have 1000s. That’s about 4800 gallons stored and transported per truck on non highway locales. No restraints on fuel type. A typical US truck stop underground diesel tank holds 20K gallons ( 600 to 40,000 from manufacturer).
3) Oil not produced is oil still in the ground for grandchildren. KSA for many years operated under the philosophy that elevated price harmed their customers and risked destroying customer societies. Those years are ended. Their SWF is all the money they will ever need. They have no reason to care about customer societies. One wonders if the thought of oil sanctions on KSA ever gets past the laughter stage.
Regarding the price of oil, in the past, collapsing stock markets have drawn the price out of the oil market as investors lose their shirts and cash in everything. Oil sells to pay off lost income, and that disappeared money never returns.
The on-going smash in crypto now hitting the big ones like bitcoin, 50% down since April’s recent partial recovery, might be a factor, or a straw in the wind.
Widespread estimates of a world or advanced capitalist country recession in 2023 can result in speculators drawing in their horns now, bringing forward the date ever more rapidly.
How do you calculate future oil barrel price when viewing the seesaw of potentially falling oil production verses potentially falling amounts of free flowing speculative capital?
Right now I’m less sure about a soaring oil price ($150, $200) than I have been for the last 12 months.
With regards to oil prices in the future, even the most experienced among us are blindfolded monkeys throwing darts at a dart board. I would say -$50 to +$500 would be a good range lol
Peter
About 5 comments up, I posted a Bloomberg article regarding oil supply having difficulty meeting demand in 2023. I think a lot depends on oil staying the sweet spot of $100/b to $110/b for demand to keep increasing and beginning to stress the supply side. IMO, as oil crosses into the $120/b and above it start to slow the economy and US gasoline demand starts to drop. Combine the current high gasoline price in the US, $5/gal, along with rising interest rates and the economy gets hit with a double whammy. So I think if oil climbs to 130/b and above, and gasoline prices continue to increase, a recession and a drop in oil to back below $100/b is almost guaranteed.
Not sure if today’s surge in WTI is a delayed response to Libya’s oil production drop.
IEA Sees World Oil Supply Struggling to Meet Demand in 2023
(Bloomberg) — Global oil supply will struggle to meet rising demand next year, meaning consumers will continue to face tight fuel markets, the International Energy Agency said in its first assessment of 2023.
Yes, Ovi, it was your comments that triggered mine. You’re right and my thoughts are additional factors. But even so, a short lived spike in prices up to $150, or even higher, is possible, triggering increased demand destruction, but as I intimated, I’m much less sure of this given the last week or two of economic data, leave aside it being sustained for a period. To put it quantitatively, (and keeping in mind Stephen’s point,) I felt that prices of $120 – $150 were on the horizon for up to six months before the factors we’ve discussed kicked in and sent prices spiralling downwards. Now I’m imagining a downward trend starting now-ish, perhaps to $100, perhaps $80. Ok, all wild speculation.
Outside the US high prices at the pumps are hurting even more. In Oslo unleaded 95 octane gas is now 10$/gallon (27kr/liter). The dollar is about 12% stronger than a year ago and the gas price probably 60-70% higher (than a year ago). The Euro is also losing terrain against the dollar, but less compared to almost all other currencies.
Demand destruction is happening at 120$/barrel especially since refining margins are so high. And I guess a lot of the demand destruction is happening in China, India and most places in Asia where a big part of the consumption takes place. Some of the destruction is short term, but even more eventually medium term (1-2 years) or long term.
If refinery margins were weak and the dollar was getting weaker instead of stronger; we would probably need more than 150$ oil for the same demand destruction effect. That is not happening though.
“Our product, our rules. We don’t play by rules we didn’t make”
(said Miller, boss of Russian gas giant Gazprom ,at the St. Petersburg economic forum.)
https://www.market-ticker.org/akcs-www?post=246142
“No more subsidies for the fossil fuel industry. No more drilling on federal land. No more drilling including offshore. No ability for the oil industry to continue to drill. Period. End.”
That’s what candidate Biden said, and he made good on his promise as soon as he was inaugurated.
Such a position also means nobody will invest in refining capacity, particularly when you have states such as California which have banned the sale of passenger vehicles using petroleum-based fuels starting in 2035 and all trucks (medium and heavy duty), where possible, in ten more years.
That’s simple: Capital cost for improvements and new construction have to be recovered over decades of time and the service life of equipment like that is typically 30, 40 or more years. If you tell me there will be no demand for the product in 10 years you have quadrupled the capital cost recovery required each and every year from now until then and that in turn means the price will wildly escalate and nobody may buy. There is no reason for a private concern to take that risk and you cannot compel them to do so.>
Any body have any idea what is roiling the oil market this morning
At 11:17 EST, WTI is $110.88/b. -$6.71/b
Must be expectation of upcoming generalized economic slowdown/recession.
And perhaps the notion that a negotiated settlement in Ukraine could happen someday .
Hickory
At this point good guess as any.
Another opinion. Statement my Novak at end of quote.
“The main concern for oil at the moment is macro. There’s a growing sentiment that the global economy will slow in the months ahead, perhaps dramatically. There are few assets more-sensitive to global growth that oil. There’s also a changing series of beliefs around Russia and whether they can get oil out. Yesterday foreign minister Novak sounded a confident tone.”
Yup, that was my feeling yesterday. I’d have been out on Thursday if I’d have had any money in there in the first place. But still there’s a great deal of volatility in the markets, so, who knows what next week will bring.
Dollar strength is catching up with some folks and they are being forced to deleverage their positions in oil futures.
I’m pretty sure I’ve said this before but there is 2-3 times the amount of US dollar denominated debt outside of the US as there is inside the US.
As these debts are defaulted on. Due to current dollar shortage. Supply of dollars will fall faster than demand for US dollars falls.
How much stuff breaks as the dollar index goes to 120.00 or 150.00?
The answer is everything. Oil will get deleveraged all the way back to $20 or less and everyone will be sitting around wondering WTF just happened.
Oil Bears Burst Back Onto The Scene
Oil prices plunged on Friday morning as fears of a recession outweighed growing geopolitical threats to supply.
Fears of a recession are driving prices lower. And I think folks have good reason to be afraid.
This is a good read. Gasoline consumption is starting to fall due to high prices.
https://wolfstreet.com/2022/06/16/as-gasoline-prices-spike-demand-destruction-spreads-with-long-term-implications/
Peak US gasoline consumption?
That is a notably event in the history of civilization, like when steamboats outnumbered sailing ships crossing the Atlantic.
Shale doesn’t actually matter. Opec is declining.
The US is raiding its oil piggybank to the tune of 1M/day. It’s suppose to stop in October but that’s one month before US elections. Here’s a good WaPo article about it:
https://www.washingtonpost.com/business/energy/the-us-is-depleting-its-strategic-petroleum-reserve-faster-than-it-looks/2022/06/17/3b899c40-ee04-11ec-9f90-79df1fb28296_story.html
Africa is suffering from increasing political turmoil and will likely be an unreliable supplier of oil for some time:
https://leadership.ng/pipeline-closures-plunge-nigerias-oil-production/
https://www.reuters.com/markets/commodities/libyan-oil-output-collapses-after-wave-closures-2022-06-14/
Convo with TX oil and gas lawyer.
Talk of Eagle Ford getting new attention. Some newly relevant significance of proximity to coast.
New posts up
https://peakoilbarrel.com/opec-update-june-2022/
and
https://peakoilbarrel.com/open-thread-non-petroleum-june-18-2022/