A guest post by Ovi
All of the oil (C + C) production data for the US state charts comes from the EIAʼ’s Petroleum Supply monthly PSM.
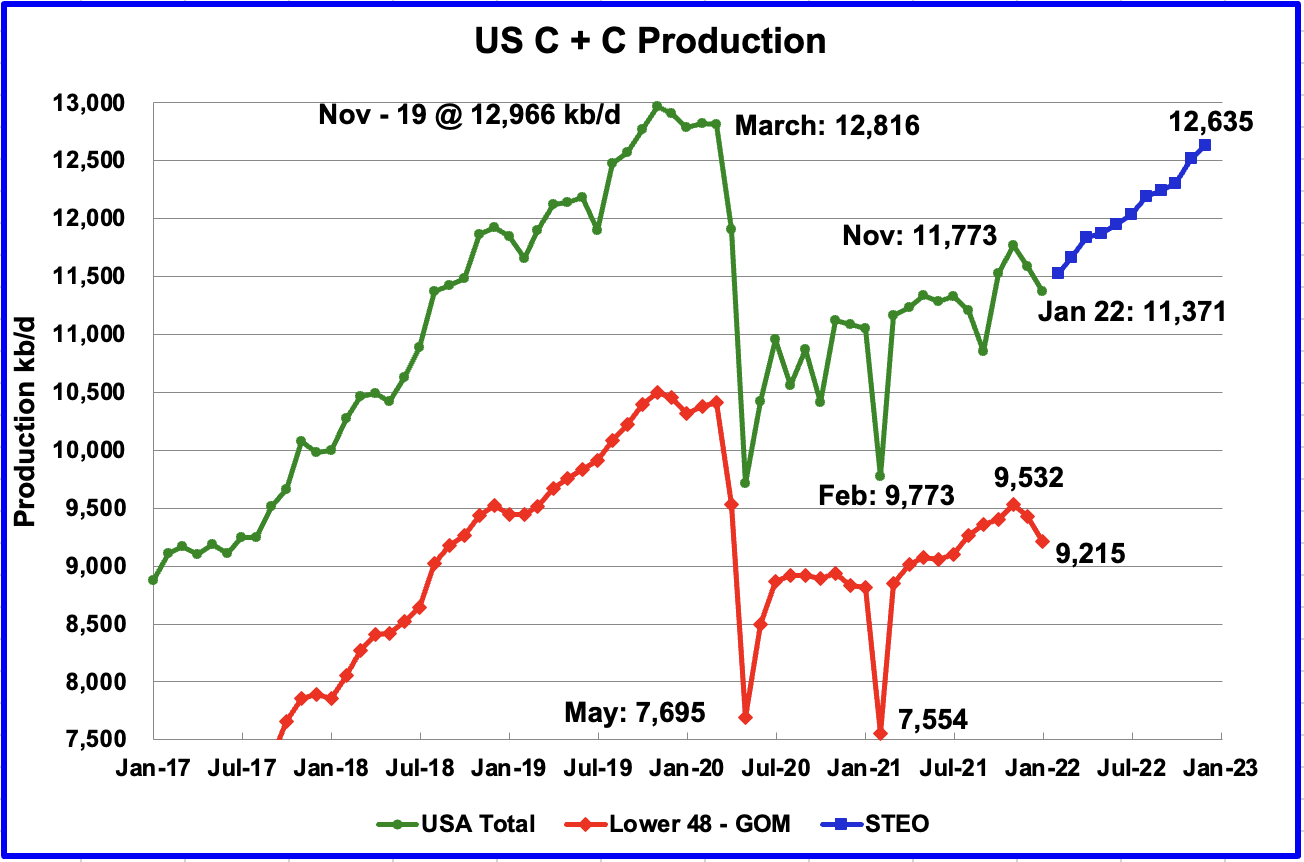
U.S. January production decreased by a surprising 216 kb/d to 11,371 kb/d. In December production dropped by 206 kb/d. The main declining states were Texas 120 kb/d, New Mexico 31 kb/d, and ND 24 kb/d. Of the top 10 states, only Colorado increased its production.
The data points in the blue graph, taken from the February 2022 STEO, are production forecasts for the US from February 2022 to December 2022. Output for December 2022 is expected to be 12,635 kb/d, a revision of 245 kb/d higher than was forecast in the February STEO report.
While overall US production was down, a clearer indication of the health of US onshore oil production can be gleaned by looking more closely at the On-shore L48 states. In the On-shore lower 48, January production decreased by 211 kb/d to 9,215 kb/d. The On-shore L48 decrease accounts for the majority of the drop in US production.
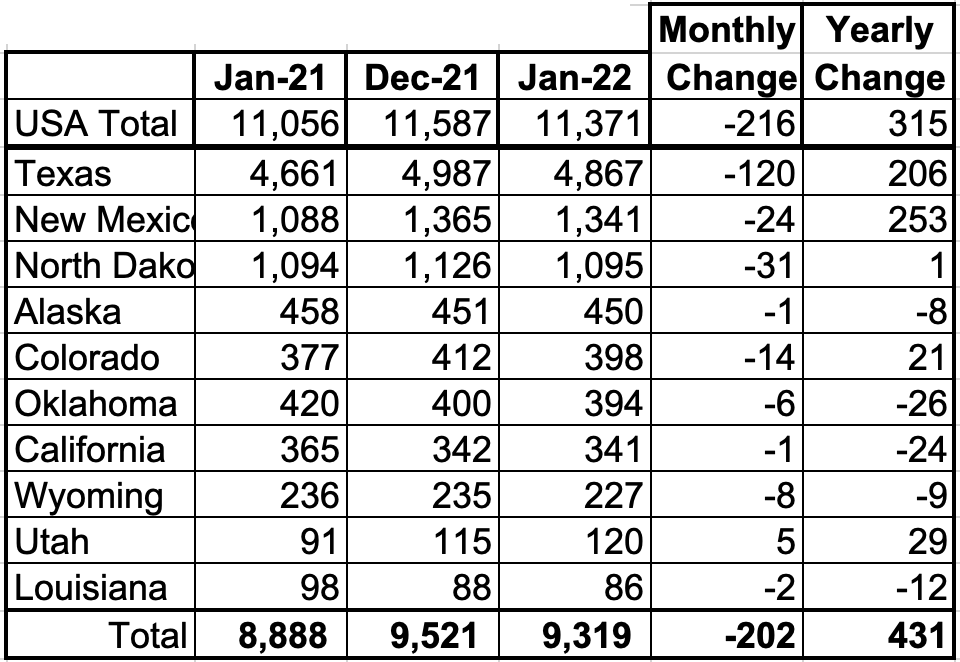
Listed above are the 10 states with the largest US production. These 10 accounted for 82.0% of all production out of a total production of 11,371 kb/d in January 2022. Note that all of the above states, except Colorado, dropped, some more than others.
On a YoY basis, US production increased by 315 kb/d or on average 26.3 kb/d/mth.
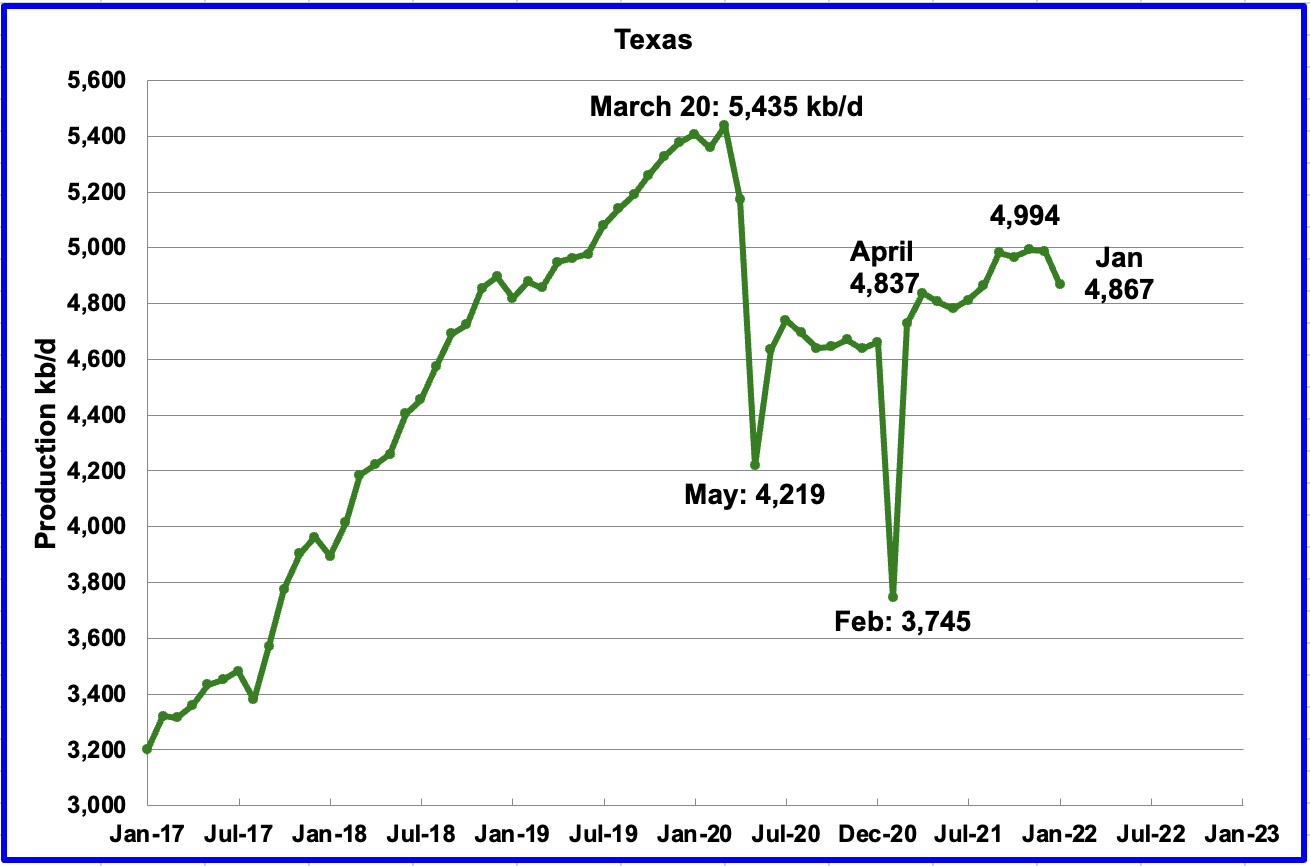
Texas production decreased by 120 kb/d in January to 4,867 kb/d from 4,987 kb/d in December.
In September there were close to 205 Hz oil rigs operating in Texas. By the last week of January, 235 oil rigs were operating, an increase of 30 rigs and production remained essentially flat from September to December and then dropped by 120 kb/d in January.
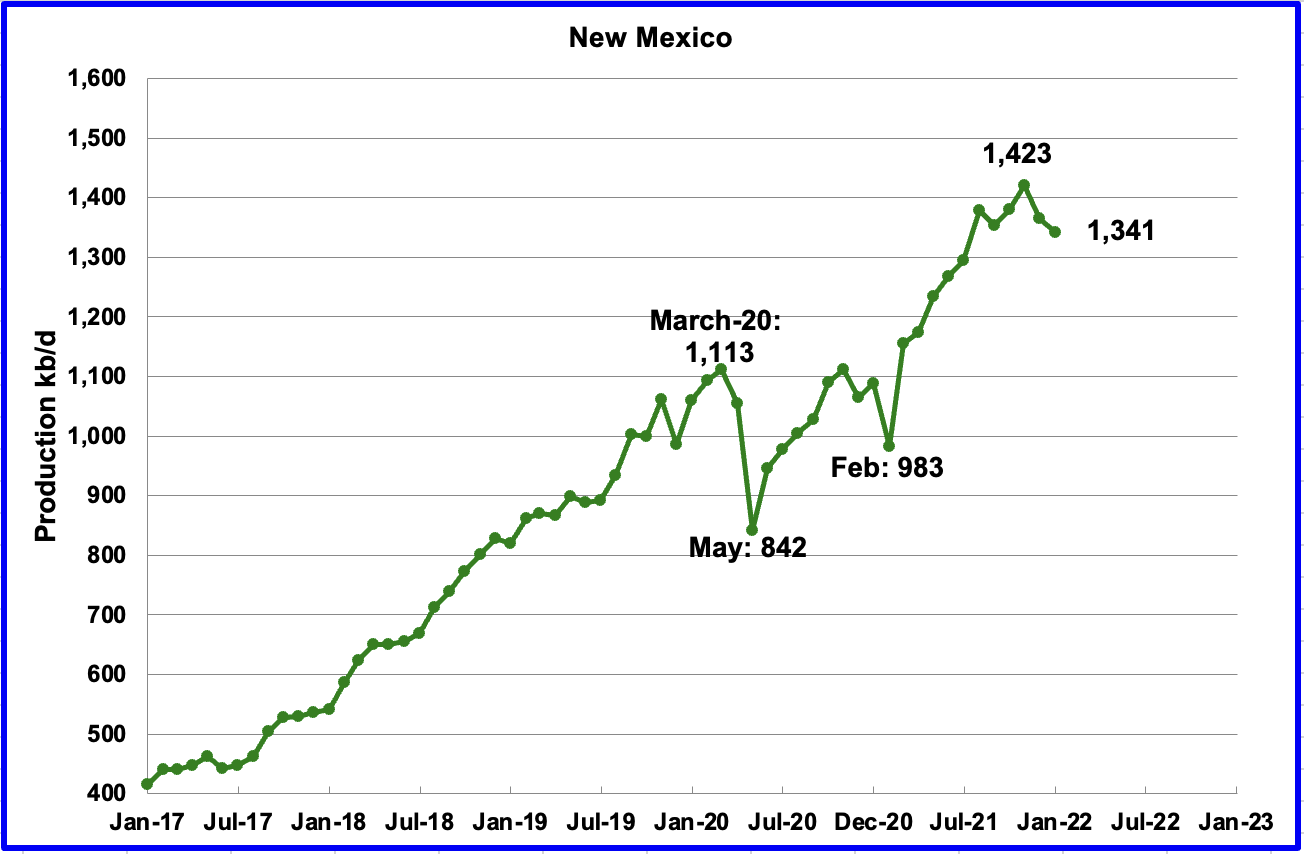
January’s New Mexico production dropped by 24 kb/d to 1,341 kb/d. From the beginning of December to the end, frac spreads dropped from 271 at the beginning to 234 at the end. By the and of January, frac spreads had rebounded to 261, still down 10 from the beginning of December.
The January drop in production in Texas and New Mexico could be related to the lower number frac spreads operating at the end of December and January than at the beginning of December. In addition, Texas experienced bad winter weather in December and January which spilled over into New Mexico. A strong winter storm brought heavy snow and bitterly cold temperatures to parts of New Mexico in the first week of February.
While summer hurricanes are a well known weather phenomenon that affects GOM production, winter storms may be a new factor to consider when forecasting December to February production in Texas and New Mexico.
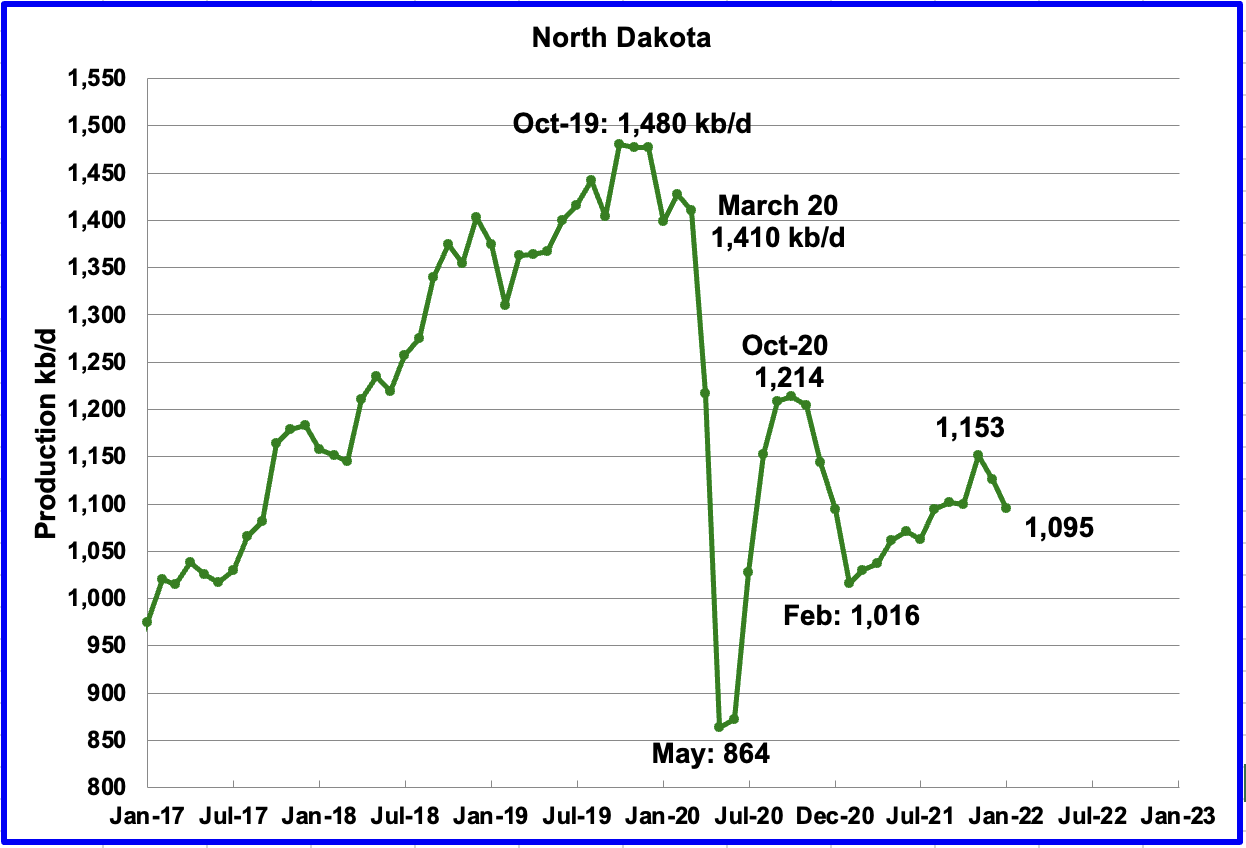
According to the EIA, North Dakota’s December output was 1,095 kb/d, a decrease of 31 kb/d from December. North Dakota’s Department of Mineral Resources reported a bigger drop in January in the Bakken.
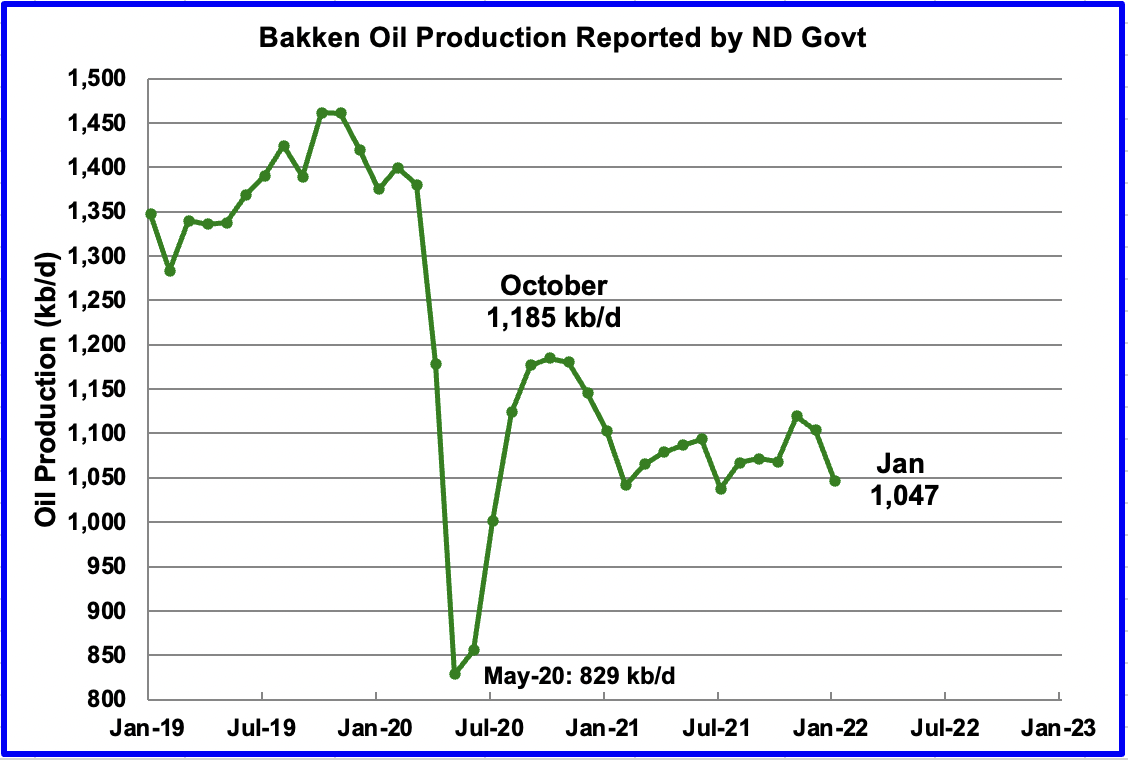
According to the North Dakota Oil and Gas division, January production in the Bakken fell by 57 kb/d.
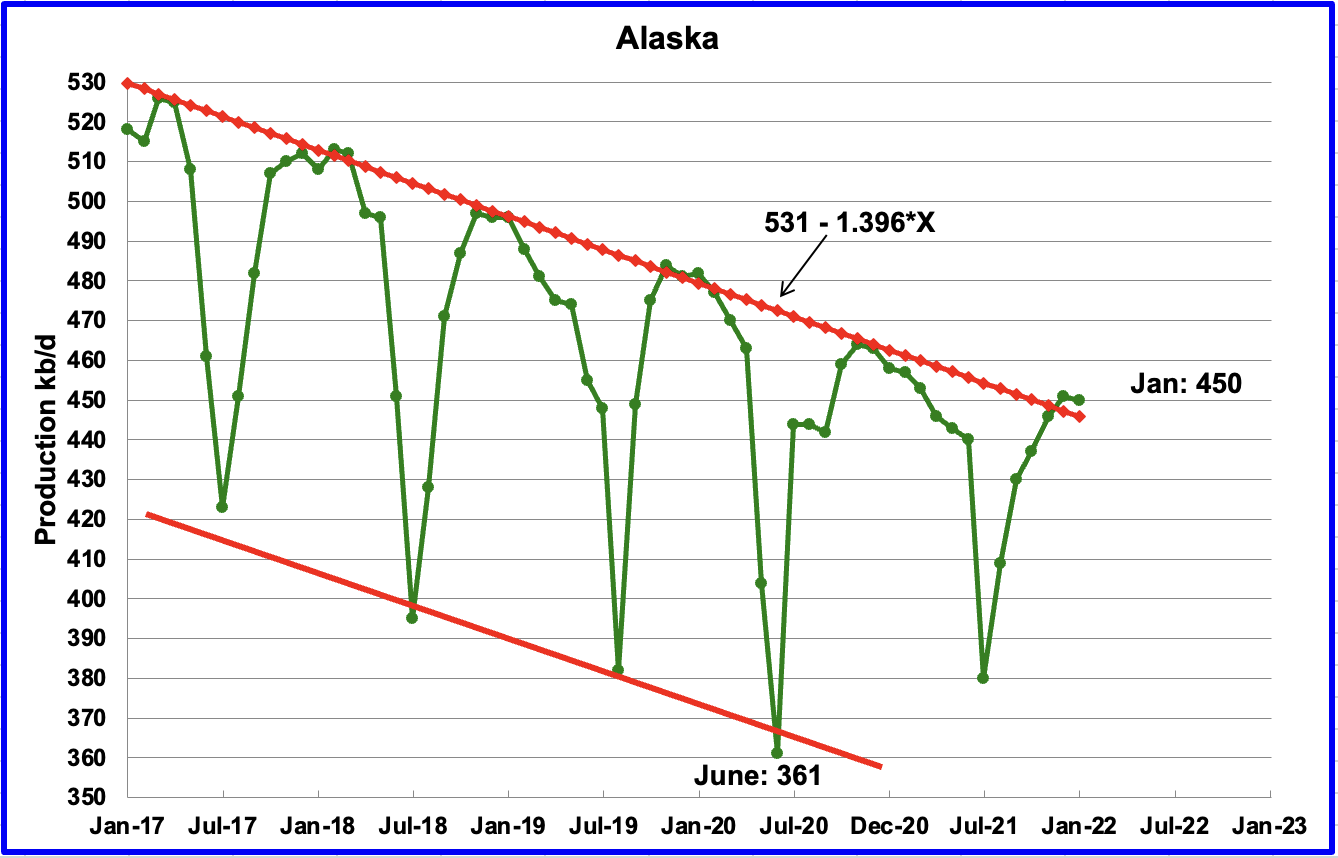
Alaskaʼ s January output decreased by 1 kb/d to 450 kb/d.
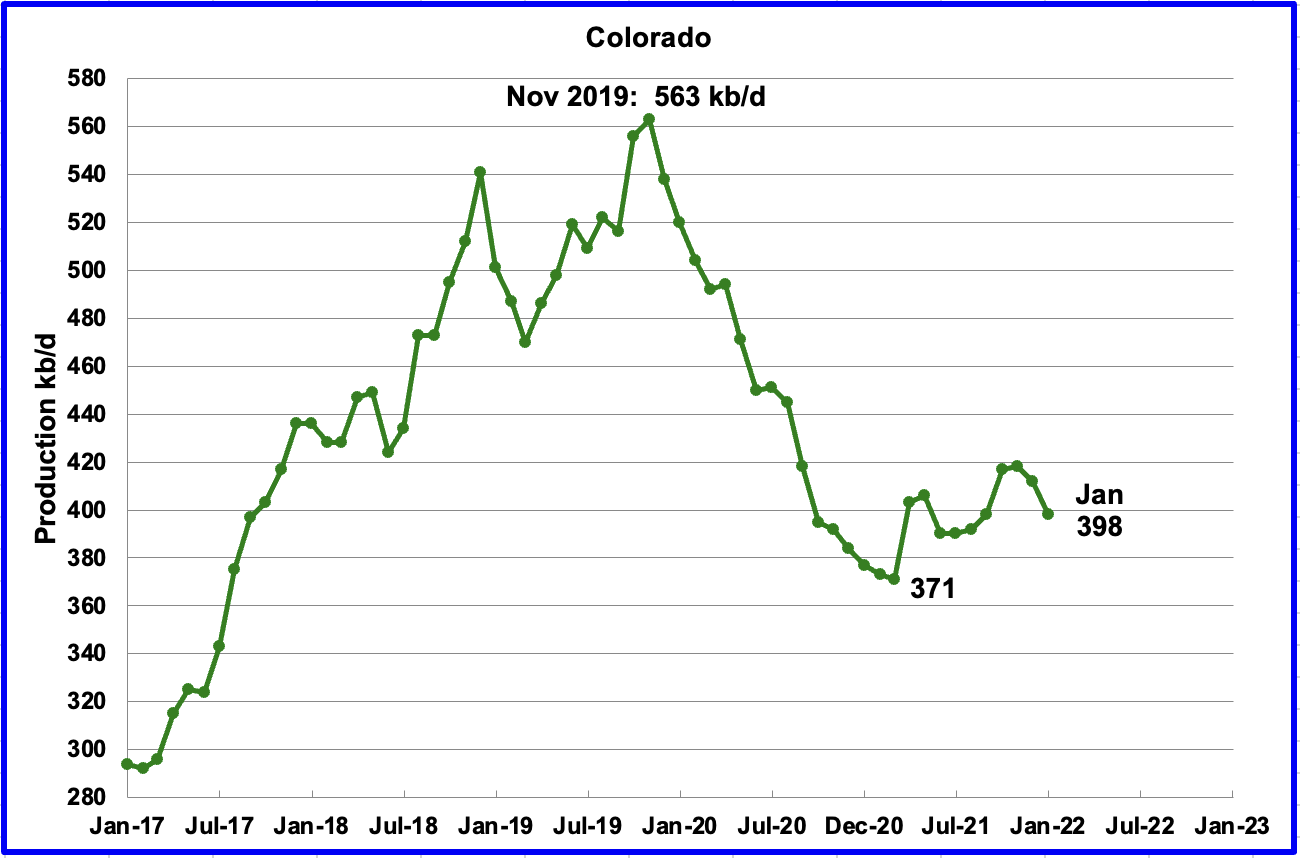
Coloradoʼ s January production decreased by 14 kb/d to 398 kb/d. However, it should be noted that December’s output was revised up from 393 kb/d to 412 kb/d.
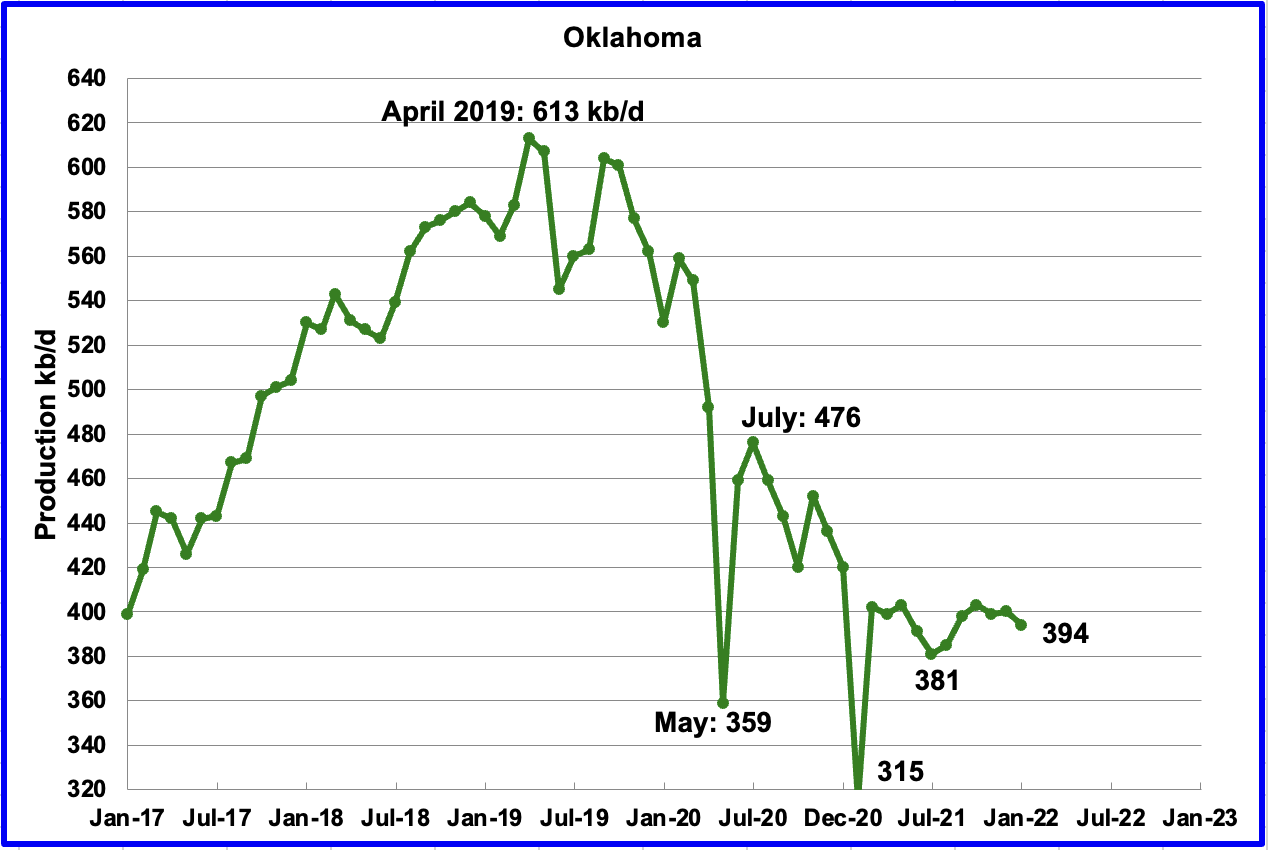
Oklahoma’s output in January decreased by 6 kb/d to 394 kb/d. Its output has remained essentially flat since March even though its rig count increased from 17 in March to 48 in January.
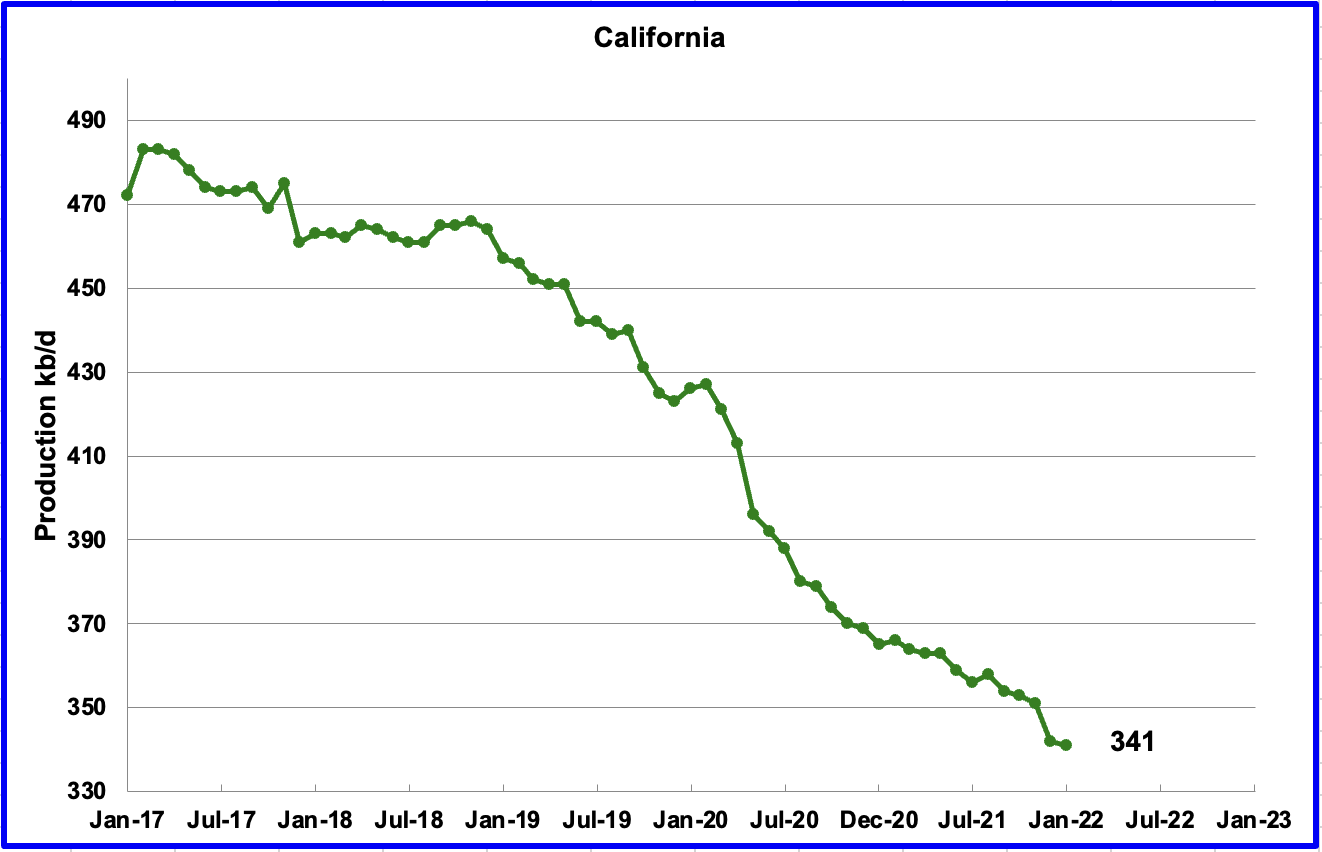
Californiaʼ s slow output decline continued in January. Output decreased by 1 kb/d to 341 kb/d.
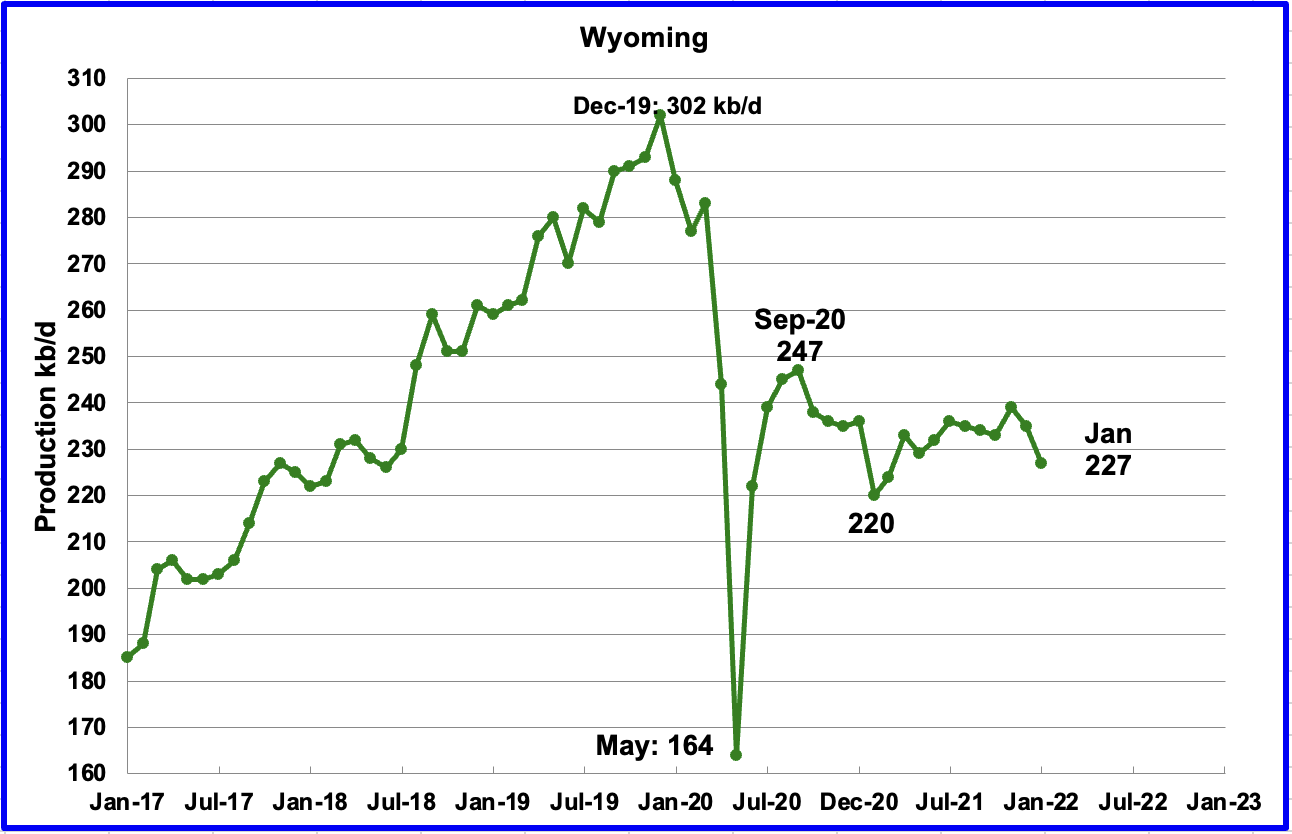
Wyoming’s production has been in a slow unsteady decline since September 2020 when output was 247 kb/d. In January 2022 output decreased by 8 kb/d to 227 kb/d, down 20 kb/d from September 2020.
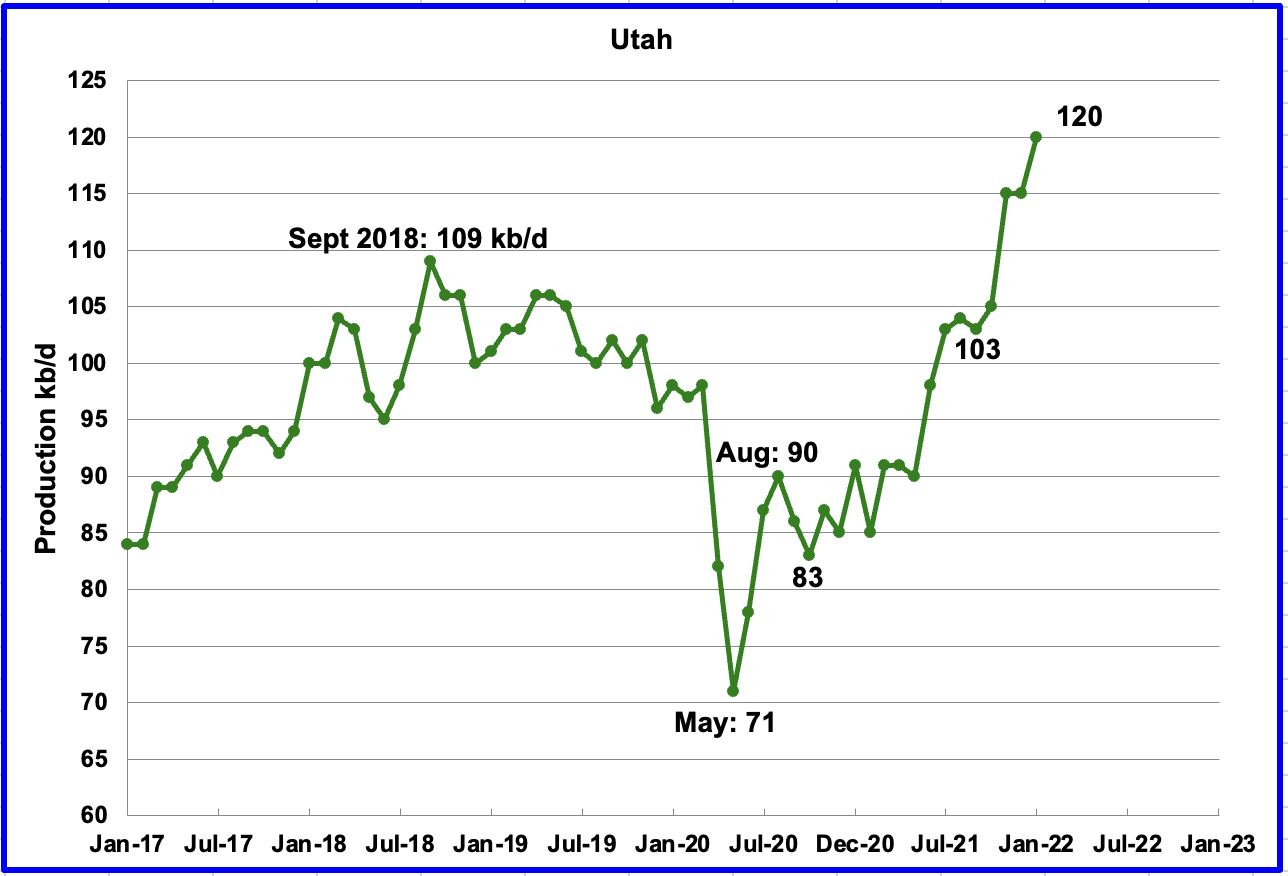
Utah’s production increase from the low of May 2020 continued. January’s production increased by 5 kb/d to a new record high 120 kb/d. Utah began to increase its Hz rig count from 6 in October 2021 to 8 in February.
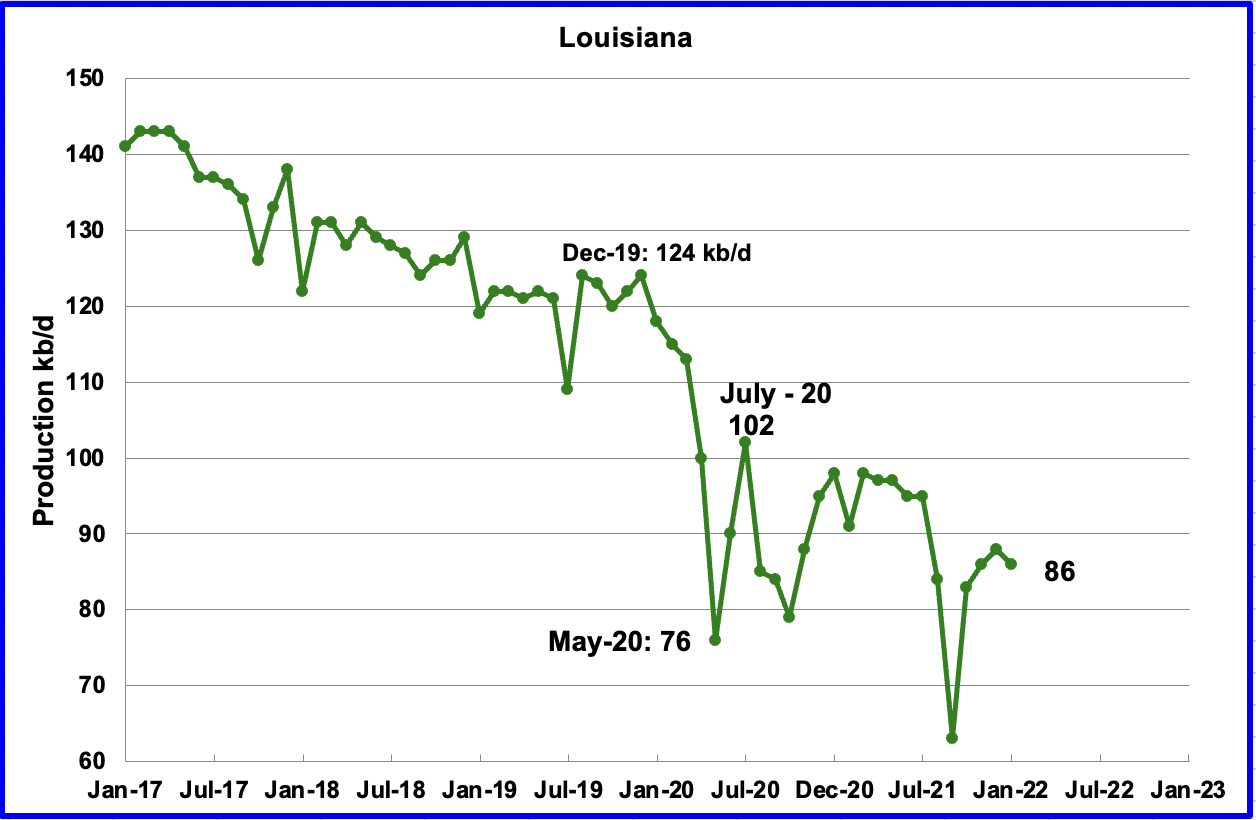
Louisiana’s output decreased by 2 kb/d to 86 kb/d in January. Louisiana was one of the hardest hit states by hurricane Ida in late August. January’s output decrease indicates that Louisiana’s slow recovery is complete.
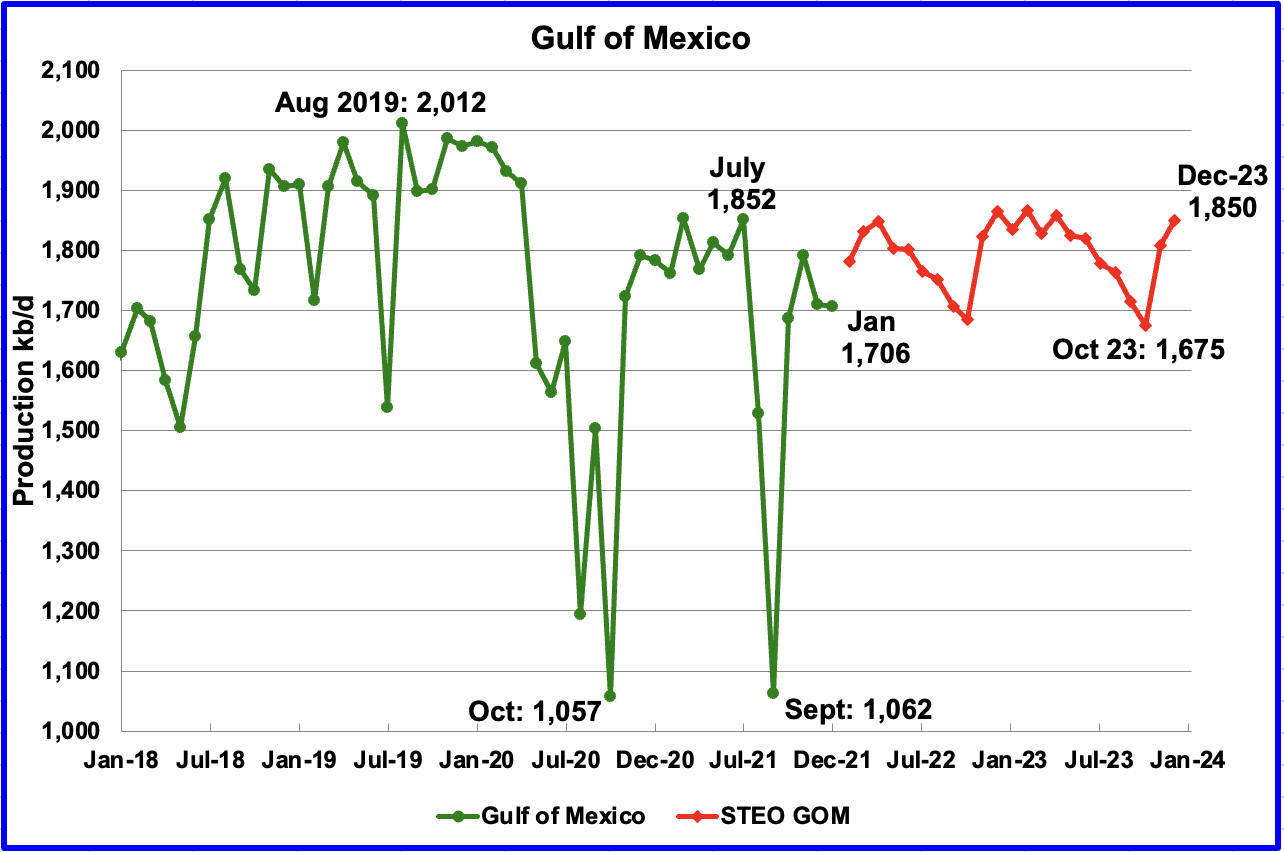
Production from the GOM was essentially unchanged in January. It decreased by 4 kb/d to 1,706 kb/d. If the GOM was a state, its production would normally rank second behind Texas.
The March 2022 STEO projection for the GOM output has been added to this chart and projects output will be 1,850 kb/d in December 2023 with a local high of 1,865 kb/d in December 2022. This is 147 kb/d lower than the previous high of 2,012 kb/d in August 2019.
A Different Perspective on US Oil Production
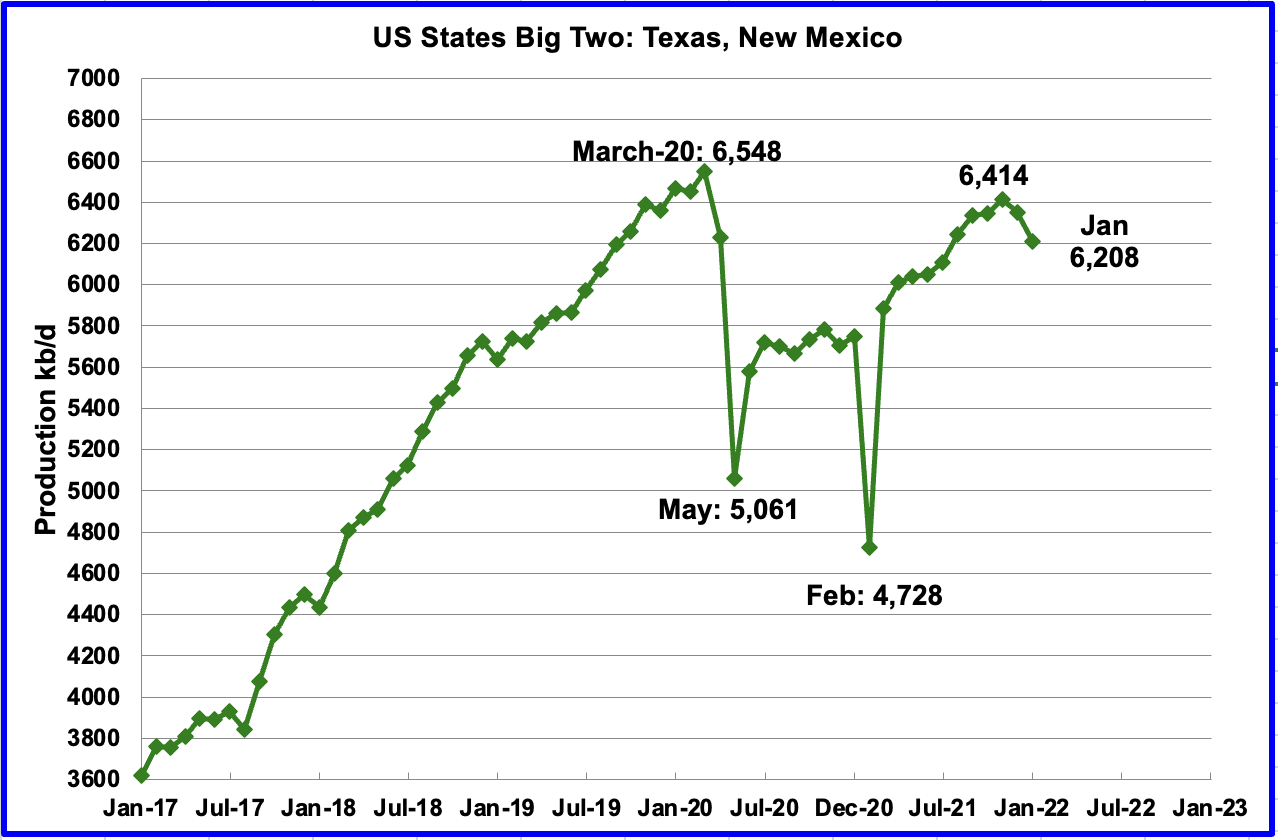
The Big Two states, combined output for Texas and New Mexico.
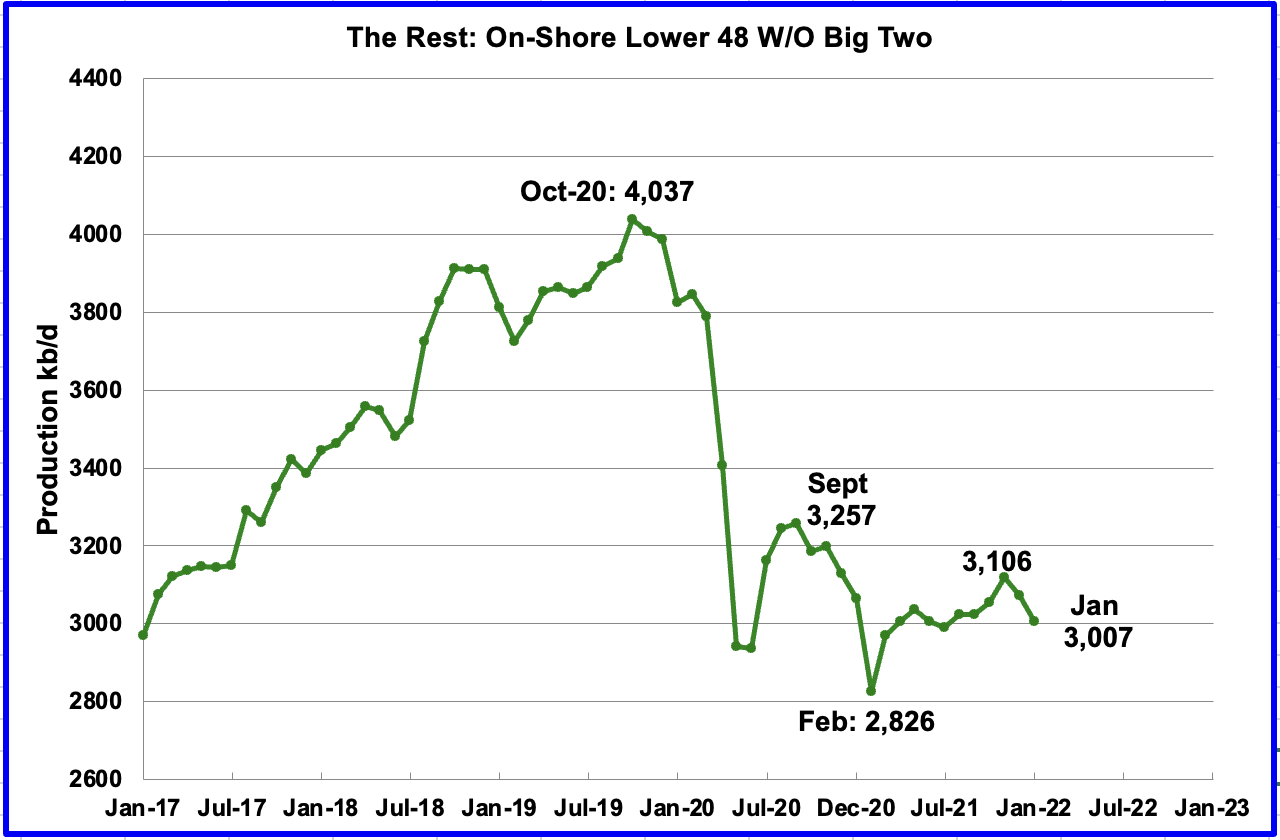
The Rest
To get a different perspective on US oil production, the above two charts have broken US state production into two groups, “The Big Two” and the “On-Shore L48 W/O Big Two” or The Rest.
January production declined again in the Big Two states. Output dropped by a combined 144 kb/d, with the majority coming from Texas, 120 kb/d. Possible contributing factors to the drop in January were bad weather, slow restarts associated with Christmas holidays and a lower number of frac spreads.
Rigs and Fracs
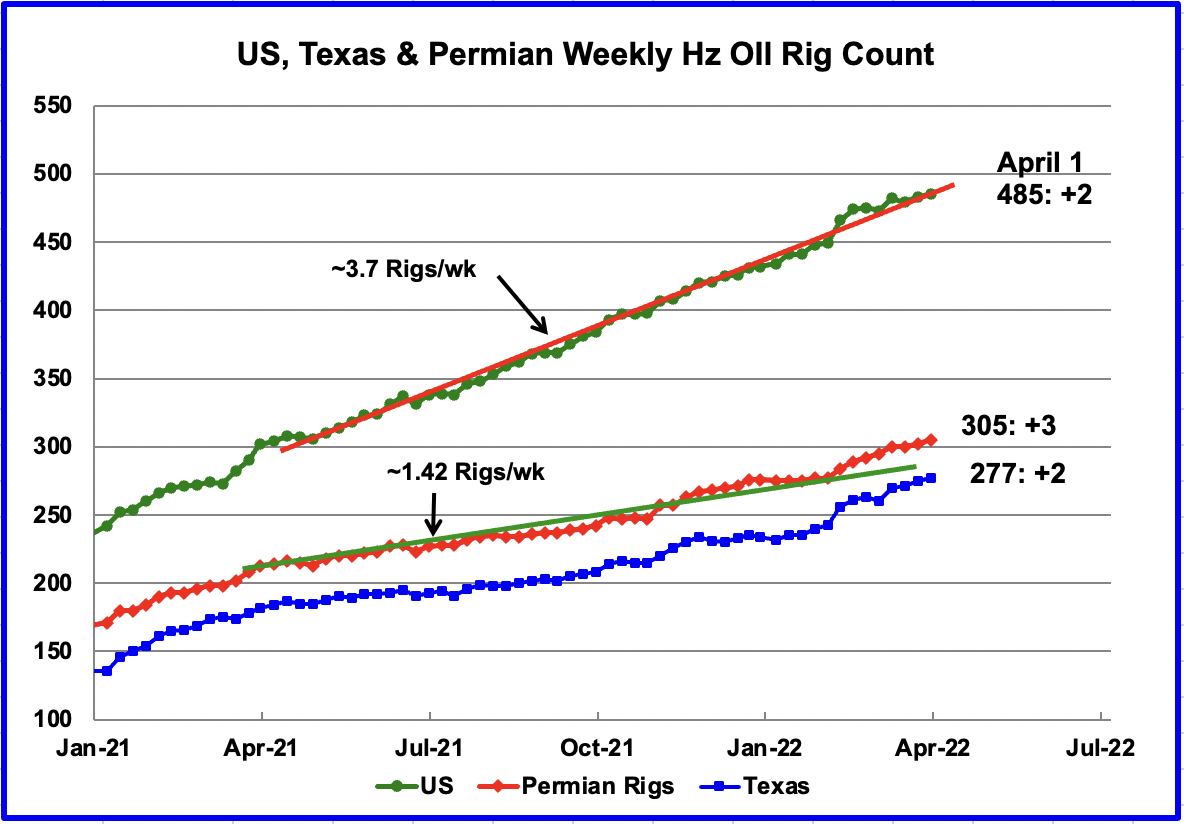
The US total Hz oil rig count for the week ending April 1 was 485, an increase of 2 over the previous week.
From the beginning of April 2021 to April 2022, the US has been adding Hz oil rigs at a rate of close to 3.7 rigs/wk. Over the period April 2021 to October 2021, the Permian added 1.42 rigs/wk, indicating that rigs were being added in other basins. However drilling activity in the Permian has been increasing since February 2022.
Since the first week February, the addition of Hz rigs in the Permian basin accelerated over the average rate as the red graph broke away to the upside from the green trend line. In the week ending April 1, the Permian Hz oil rig count increase by 3 to 305. The average rate of adding rigs from February to April 1 is close to 3.5 rigs per week.
Since the beginning of the year to the week ending April 1, the rig count in the NM Permian has bounced around 91 +/- 2. In the week ending April 1, 90 rigs were operational in the NM Permian. Over the same period, rigs in the Texas Permian increased from 183 to 305, an increase of 22. This indicates there are higher quality drilling areas in the Texas Permian.
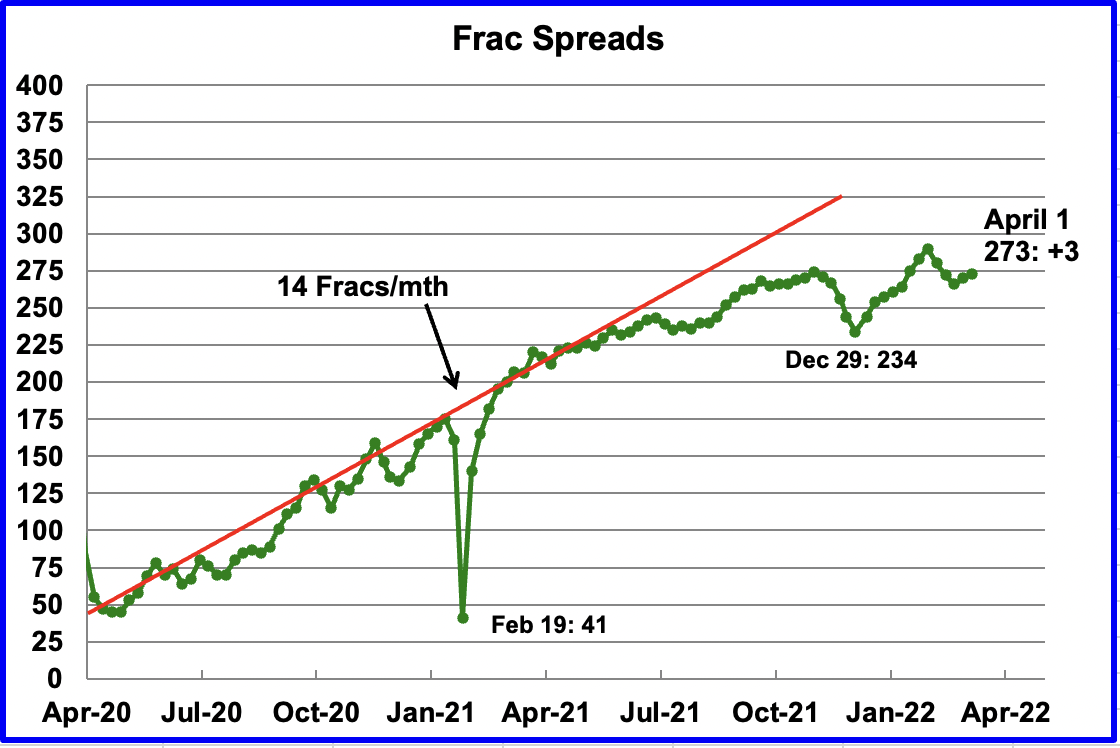
During December 2021, 37 frac spreads were decommissioned primarily due to the holidays and the total dropped to a low of 234 at the end of December. During the month of January, 27 frac spreads were reactivated and in February an additional 29 were added for total of 283.
As of the week ending April 1, the frac spread count had declined to 273, an increase of 3 from the previous week and down 10 from the middile of February. Also note it is 2 higher than the frac spreads operating in the week ending December 3, 2021.
Note that these 273 frac spreads include both gas and oil spreads, whereas the rigs information is strictly oil rigs.
WTI
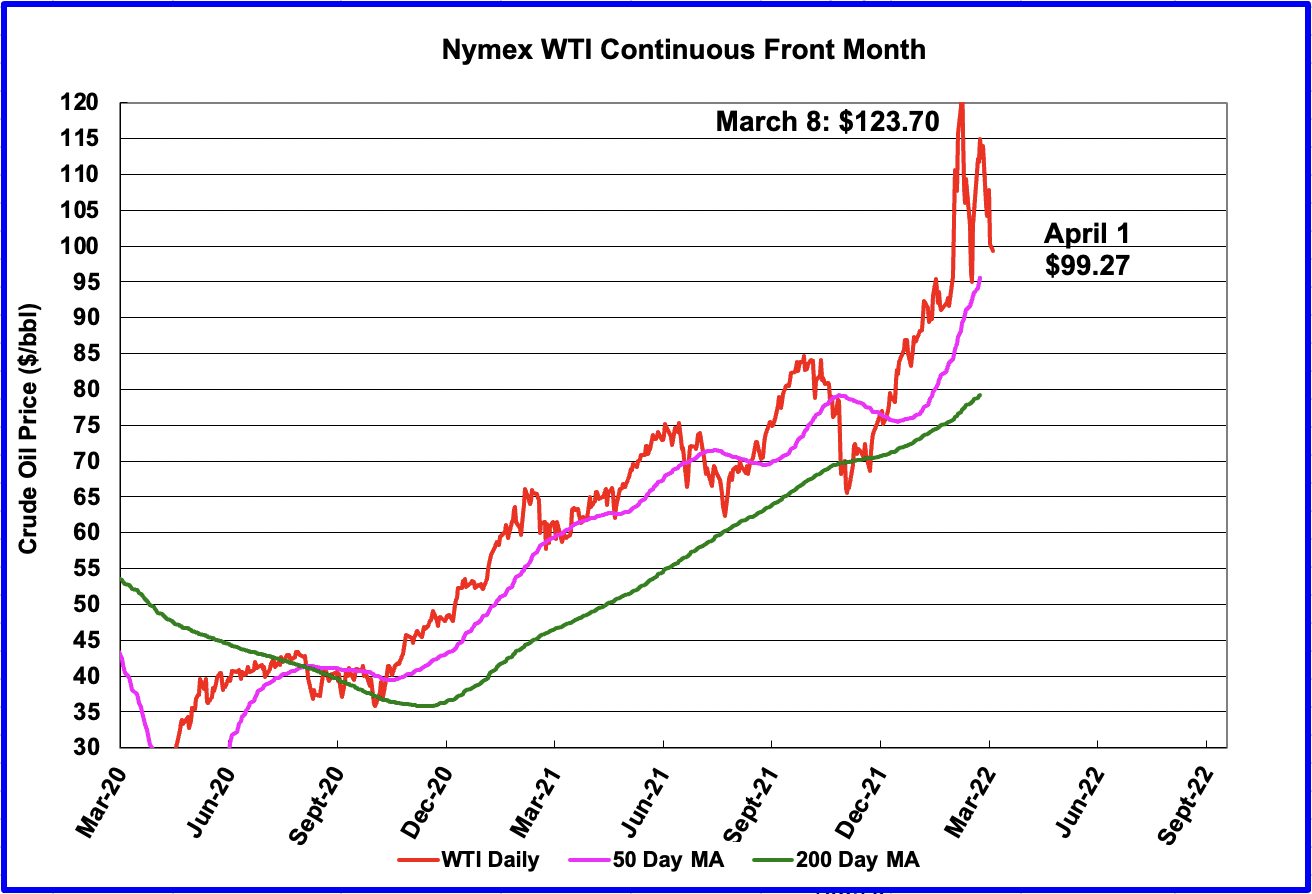
The WTI May contract settled on April 1 at $99.27/bbl. The price drop in the last few days occurred after the US announced it would release 1 Mb/d from the SPR over a period of 180 days.
1) Short Term Energy Outlook (STEO)
The March 2022 STEO provides projections for the next 24 months, starting with January 2022 to December 2023, for US C + C, OPEC and other oil production related parameters of interest.
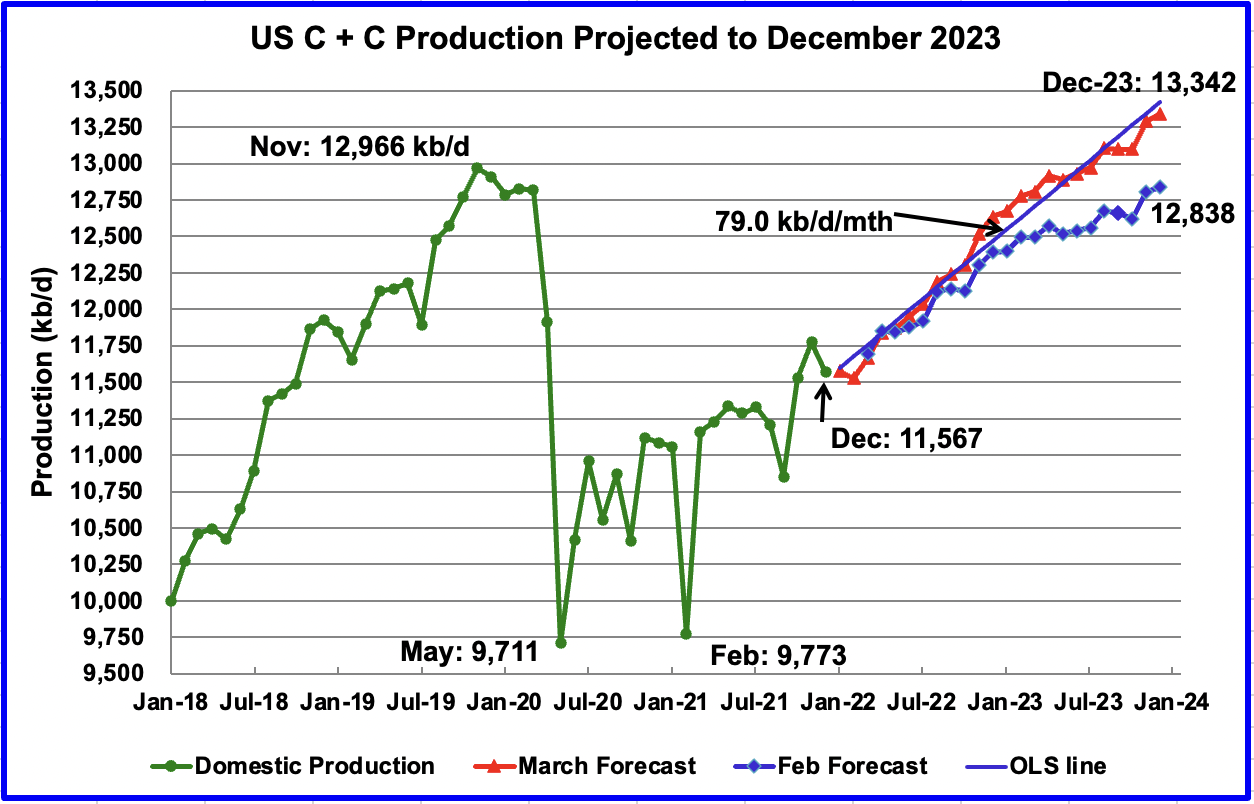
The March 2022 STEO has significantly revised upward its projected US oil output from January 2022 to December 2023. December 2023 has been revised up by 504 kb/d from the previous February 2022 STEO. The increase is probably related to the oil price increase shown in the WTI price chart further down. The projected price for WTI for December 2023 has been increased from $62/bbl to $79/bbl.
The biggest change in output occurs during 2022. The increase from January 2022 to December 2022 is 1,059 kb/d over these eleven months or 96.3 kb/d/mth. Almost unbelievable. From January 2023 to December 2023, production increases by 669 kb/d.
Note that the STEO is projecting essentially flat production for January and lower for February. While January actually dropped, it is encouraging to see that the STEO was not forecasting a January increase. The reason I note this is because the DPR and LTO sections below both show increasing January and February production.
Using only the projected data and fitting an OLS line through the January 2022 to December 2023 data, the STEO is forecasting production will increase at an average rate of 79 kb/d/mth, ending at 13,342 kb/d in December 2023. The average rate in the previous February report was 50.3 kb/d/mth. If the December 2023 output is achieved, it will be 376 kb/d higher than the November 2019 record.
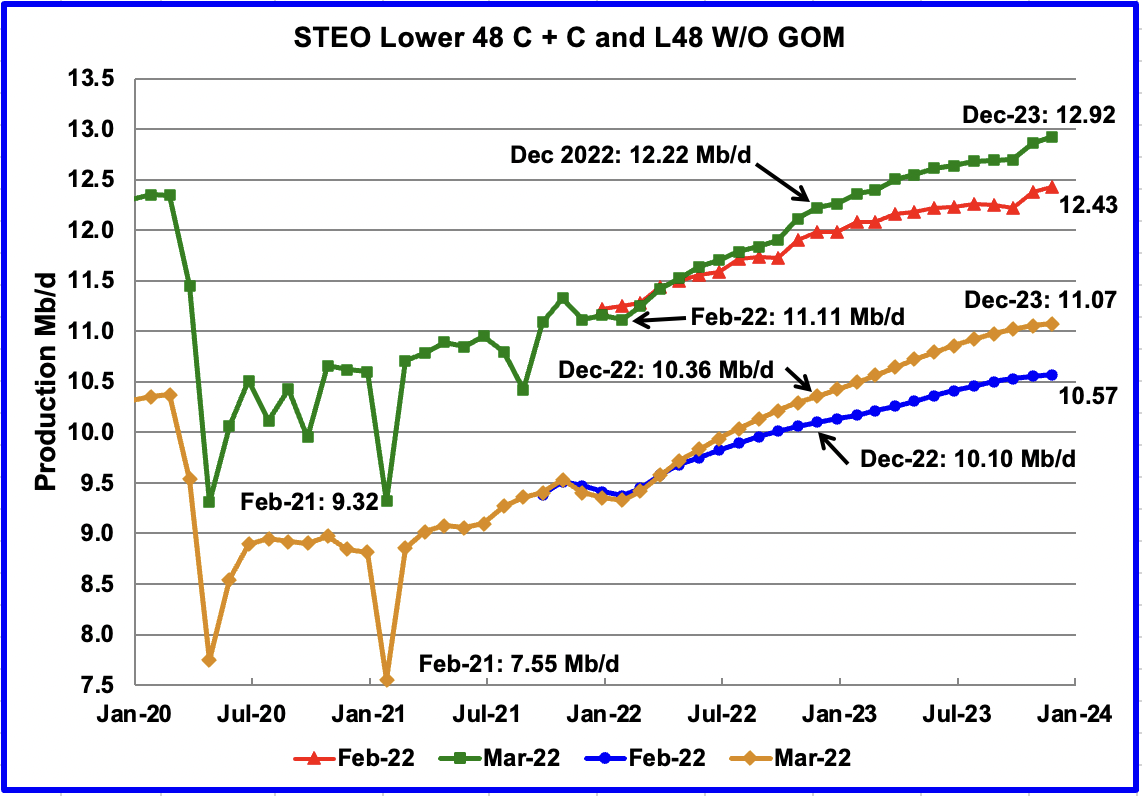
This chart compares the STEO’s forecast from the February report with the current March 2022 report to better illustrate the big change in the EIA’s forecast. For the Lower 48, the December 2023 output has been revised up by 490 kb/d from 12.43 Mb/d to 12.92 Mb/d.
The February STEO output projection for the Onshore L48 states has also been revised up to show increased production in 2022 and in 2023. The output projection for December 2023 has been increased by 500 kb/d to 11.07 Mb/d from the previous forecast of 10.57 Mb/d. From the orange graph, one can notice a definite slowing in the production rate in the later half of 2023. Is this a hint of possible further slowing in monthly production increases beyond 2023?
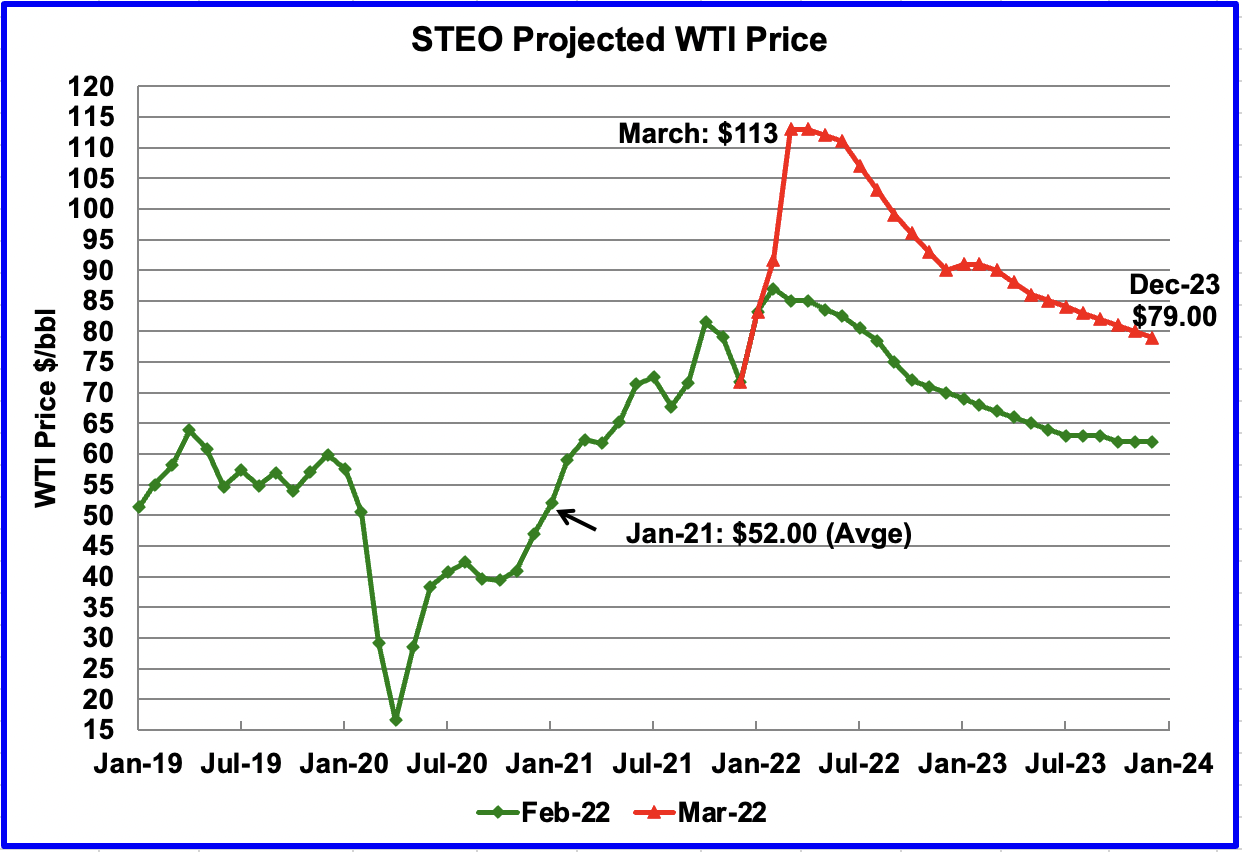
The March 2022 STEO oil price forecast continues to show a steady decline from the EIAs new March peak of $113/bbl to $79/bbl in December 2023. Essentially the EIA is continuing to forecast that the only direction for the price of WTI going forward is down to $79/bbl.
The May contract settled at $99.27 on April 1, $12.73/bbl lower than the EIA’s forecast of $112.00/bbl average for the May contract.
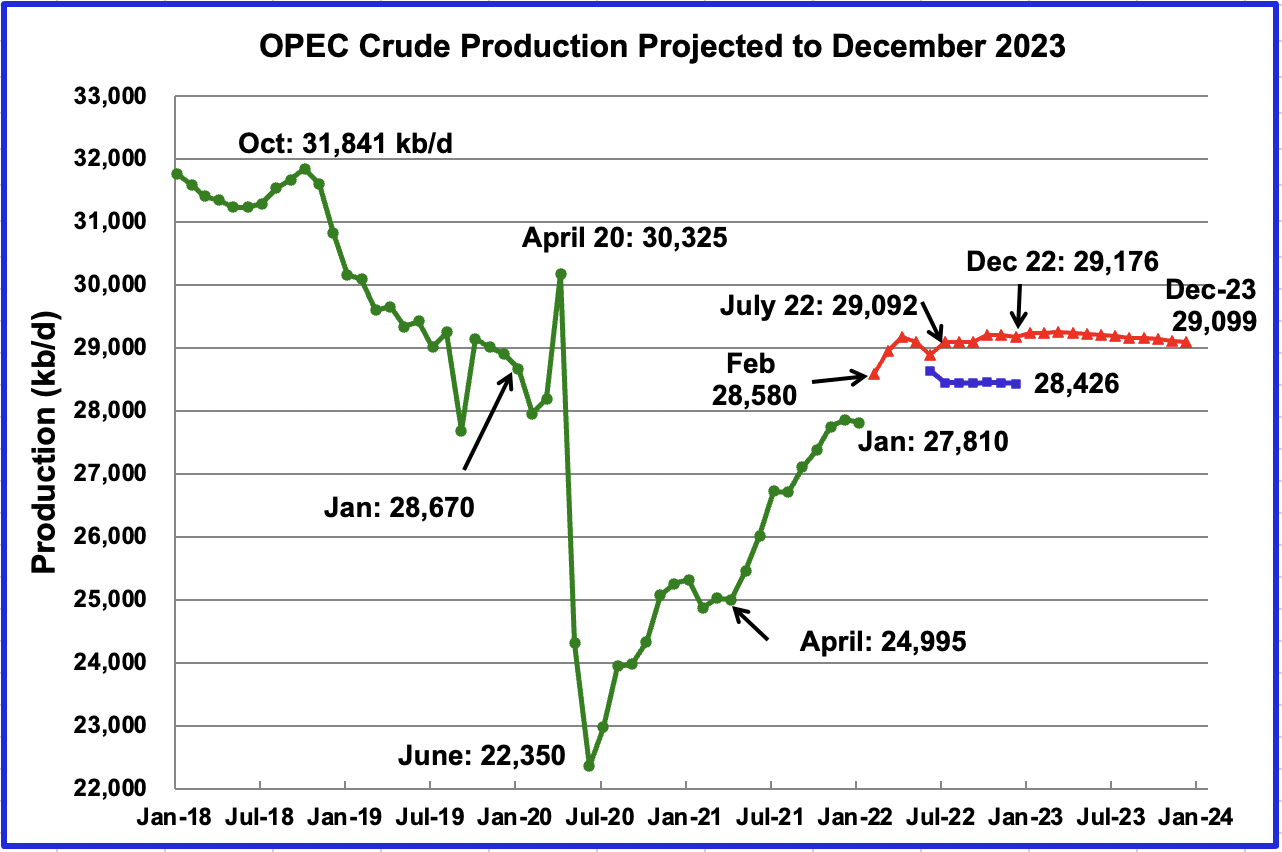
This chart shows the STEO’s March forecast for OPEC crude output from February 2022 to December 2023 compared to their December 2022 forecast. (Blue markers). Output for December 2022 has been increased by 750 kb/d in going from the December report to March. This is an additional increment of 200 kb/d over the February report. It is not clear if this increase is expected due to expected decreased Russian production associated with sanctions on Russian oil.
OPEC’s output is projected to increase from January 2022 to July 2022 by 1,366 kb/d to 29,176 kb/d. After July 2022, output remains essentially flat at slightly above 29,000 kb/d out to December 2023.
For February 2022, the EIA STEO forecasts OPEC production to be 28,580 kb/d. Actual February production as reported by OPEC was 28,473 kb/d, lower by 107 kb/d.
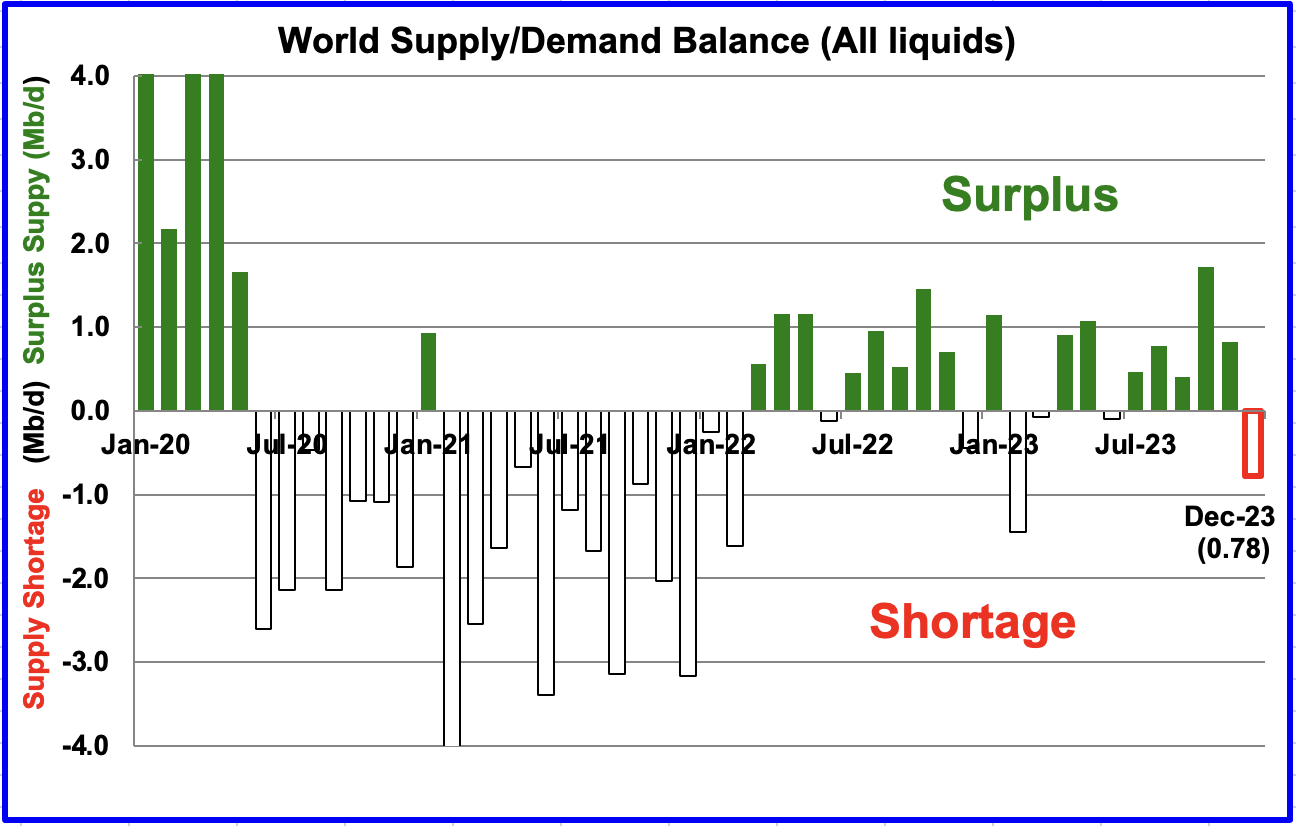
This chart shows the historical world supply/demand balance up to January 2022 and after that, the EIA’s forecast out to December 2023.
From February 2022 to December 2023, the STEO is forecasting an average monthly surplus of close to 421 kb/d, 457 kb/d lower than last month’s average. The sanctions on Russian oil and increased prices could see a big revision to this forecast next month.
2) Drilling Productivity Report
The Drilling Productivity Report (DPR) uses recent data on the total number of drilling rigs in operation along with estimates of drilling productivity and estimated changes in production from existing oil wells to provide estimated changes in oil production for the principal tight oil regions. The March DPR forecasts production to April 2022 and the following charts are updated to April 2022.
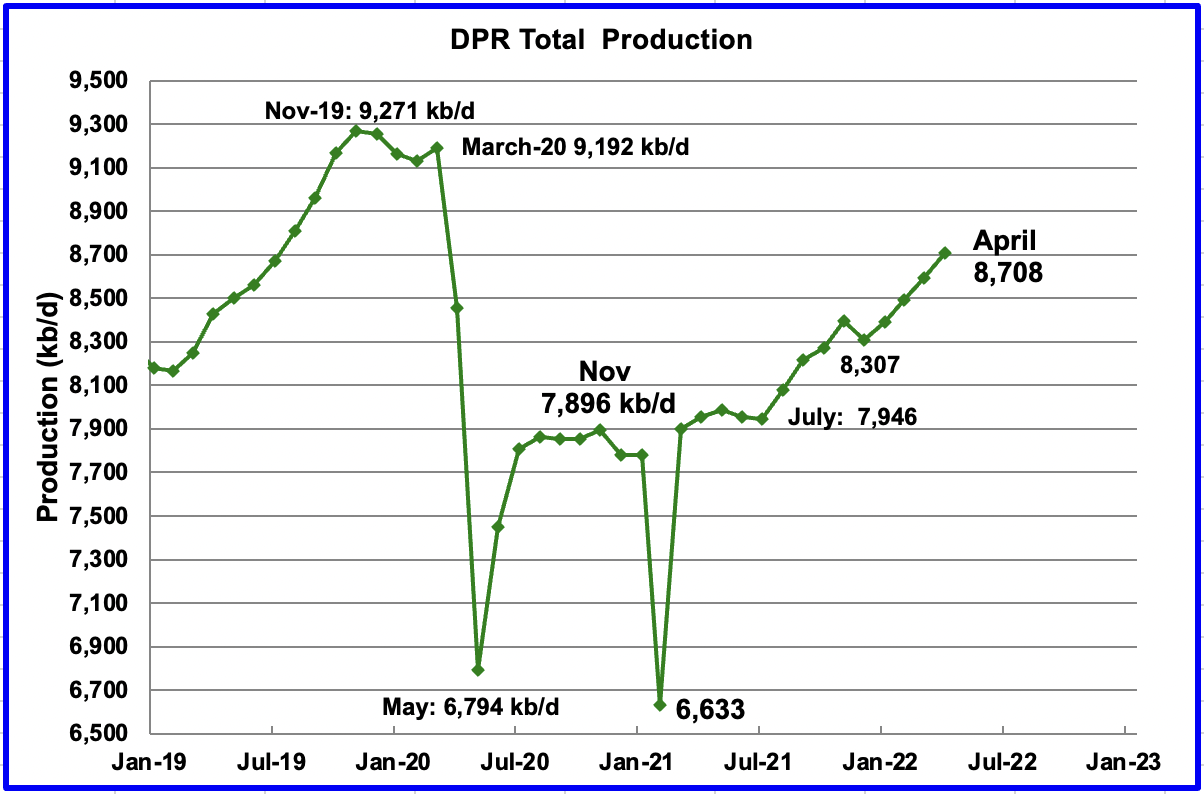
Above is the total oil production projected to April 2022 for the 7 DPR basins that the EIA tracks. Note that DPR production includes both LTO oil and oil from conventional fields.
The DPR is projecting that output for April 2022 will increase by 117 kb/d to 8,708 kb/d. From December 2021 to March 2022, output in the DPR basins is forecast to increase by 401 kb/d or by an average of 100 kb/d/mth. Note that this monthly production rate is close to the STEO rate of 96.3 kb/d projected for all of 2022 in the STEO section above.
Did April production really increase? In the February DPR report, March output was projected to be 8,707 kb/d. The March report revised March output down to 8,592 kb/d and April is now only 1 kb/d higher at 8,708 kb/d than the original February forecast.
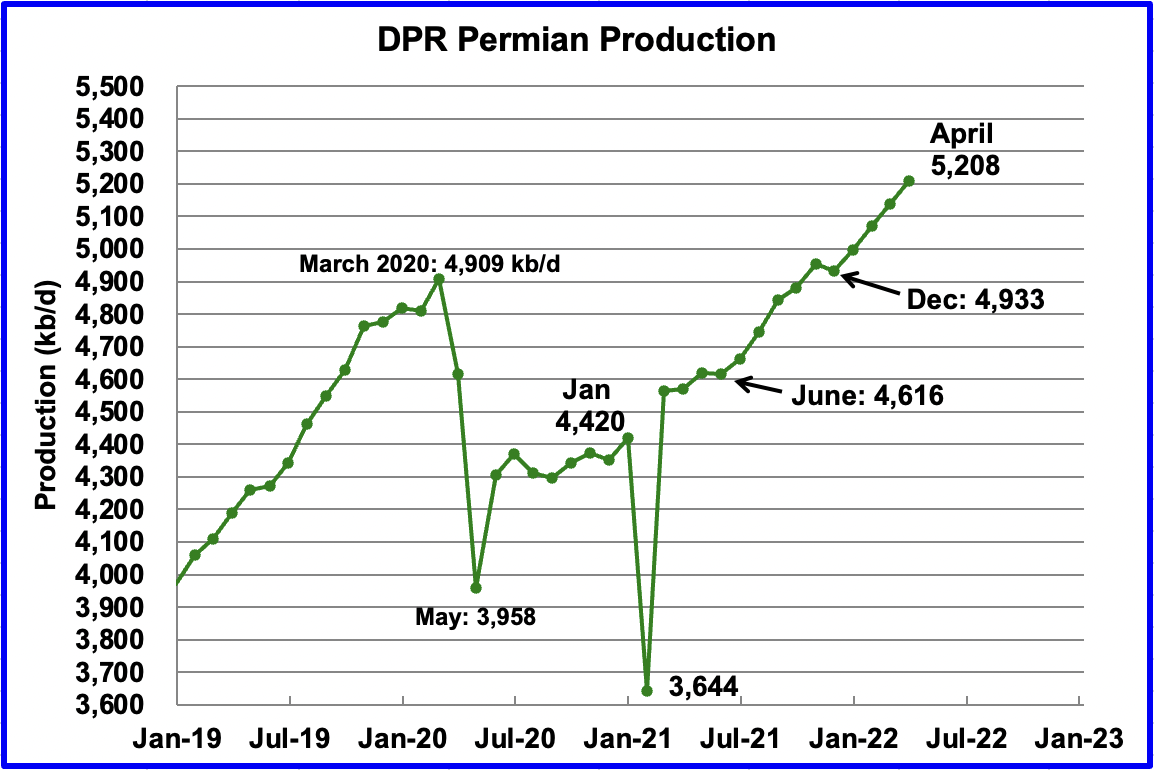
Permian output exceeded 5,000 kb/d in February 2022 and continues to increase. In April, production increased by 70 kb/d to a new high of 5,208 kb/d. From December to April, production is forecast to increase by 275 kb/d or at an average rate of 68.8 kb/d/mth. If the Permian were part of OPEC, at 5,208 kb/d it would be the second largest producer after Saudi Arabia.
Due to revisions, April’s Permian output is just 3 kb/d higher than the DPR’s March forecast of 5,205 kb/d reported in the previous February report.
During February, 343 wells were drilled and 429 were completed in the Permian. The completed wells added 340 kb/d to February’s output for an average of 793 kb/d/well. The overall decline was 268 kb/d which resulted in a net increase of 72 kb/d. Of the 409 completed wells, 338 were required to offset the decline. It is the completion of the additional 91 DUCs, over and above those drilled, that accounts for the increase in the production in the Permian.
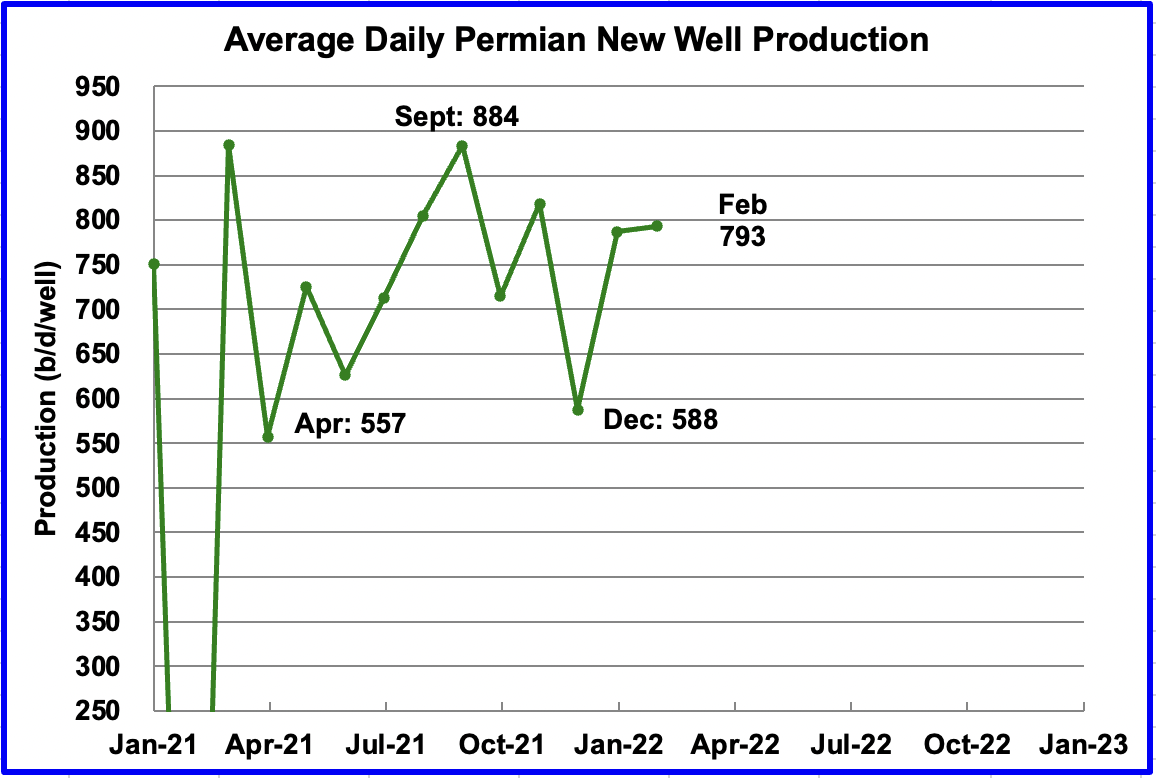
This chart shows the daily production from the average new Permian well tracked on a monthly basis. The daily output for new Permian wells was divided by the number of completed wells, as reported in the DPR and DUC reports.
For instance, during February, new wells produced 340 kb/d from 429 wells for an average of 793 b/d/well. The DPR back checks their earlier estimates and it appears that the average first month output is close to 800 kb/d. December dropped due to bad weather in Texas. Well production data is only available up to February to make this estimate.
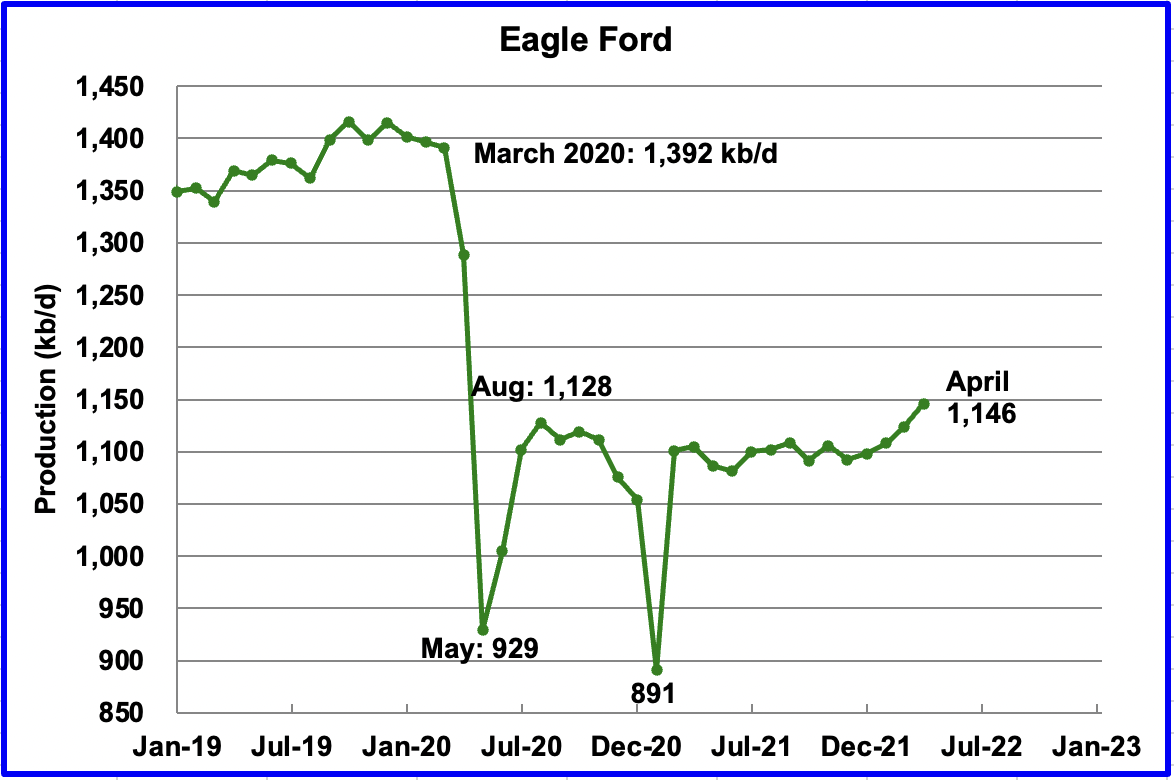
Output in the Eagle Ford basin has been showing an increasing trend since January 2022. For April, output is expected to increase by 23 kb/d to 1,146 kb/d. Since the beginning of the year, 9 rigs have been added for a total of 47, which explains the increasing output.
Again April’s output is the same as was reported for March in last month’s report.
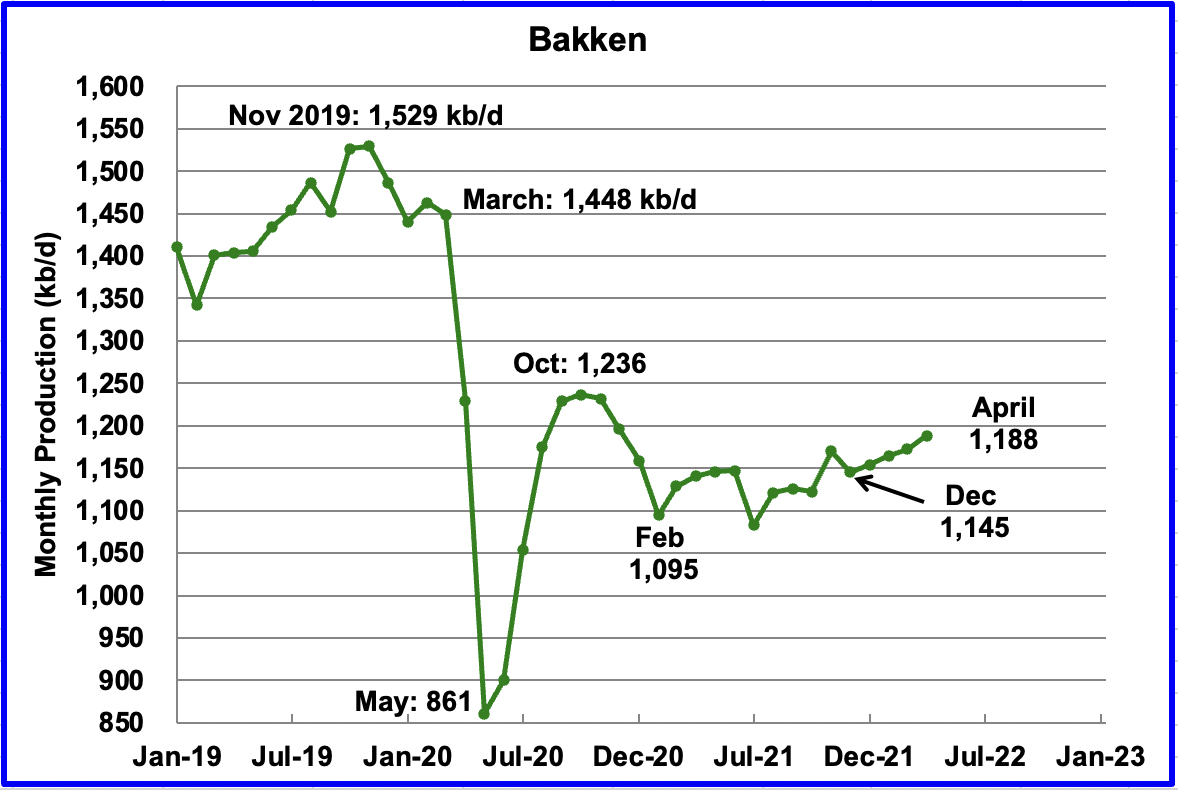
The DPR forecasts Bakken output in April to be 1,188 kb/d an increase of 16 kb/d over March. In this case, April production is 10 kb/d lower than was forecast for March in the previous report.

According to the North Dakota Oil and Gas division, January production fell by 57 kb/d. Note this drop is not shown in the DPR chart above.
According to this Source, Helms said the prospects of North Dakota returning to being No. 2 in oil production “are slim to pretty far away.”
Helms reported last month that New Mexico has replaced North Dakota as No. 2 in oil production.
As of January, North Dakota has 16,856 (preliminary number) producing wells. The month before the state had 17,200 producing wells.
Helms said the number of well completions has been volatile since the pandemic as the number of active completion crews dropped from 25 to one, then increased to 11 this week
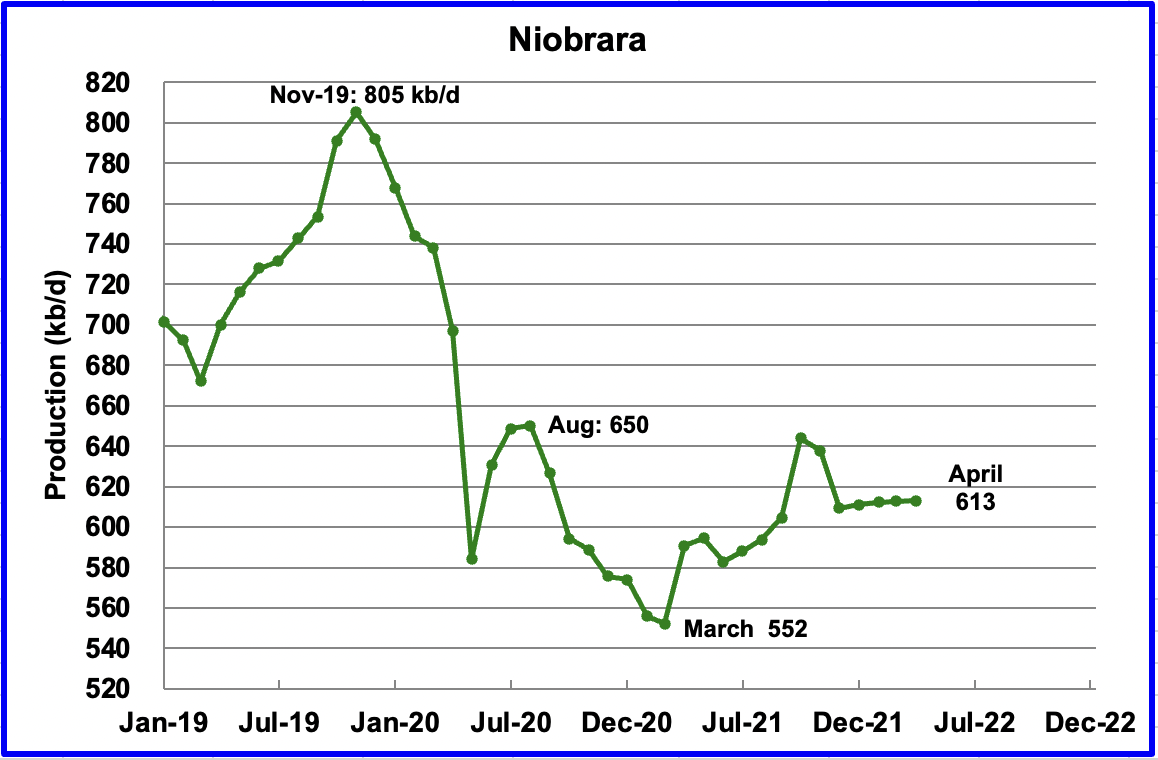
Output in the Niobrara is now showing signs of starting to plateau at 613 kb/d.
DUCs and Drilled Wells
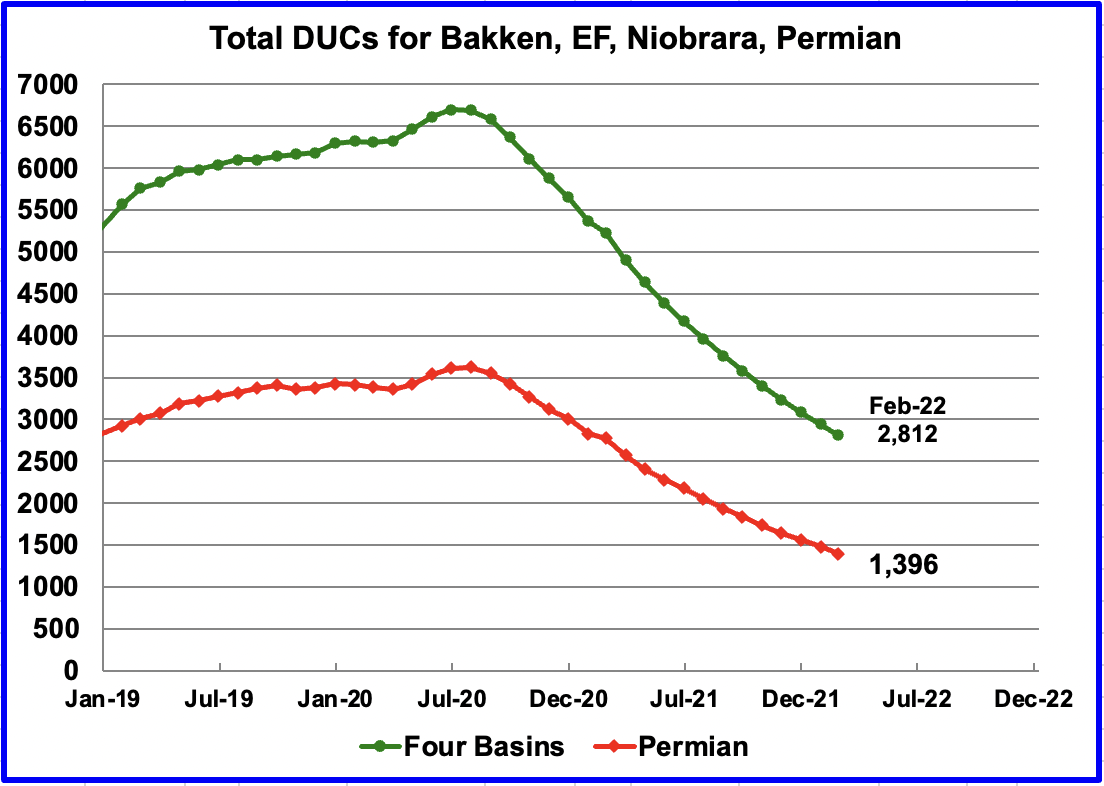
The number of DUCs available for completion has continued to fall every month since July 2020. Prior to July more wells were drilled than were being completed.
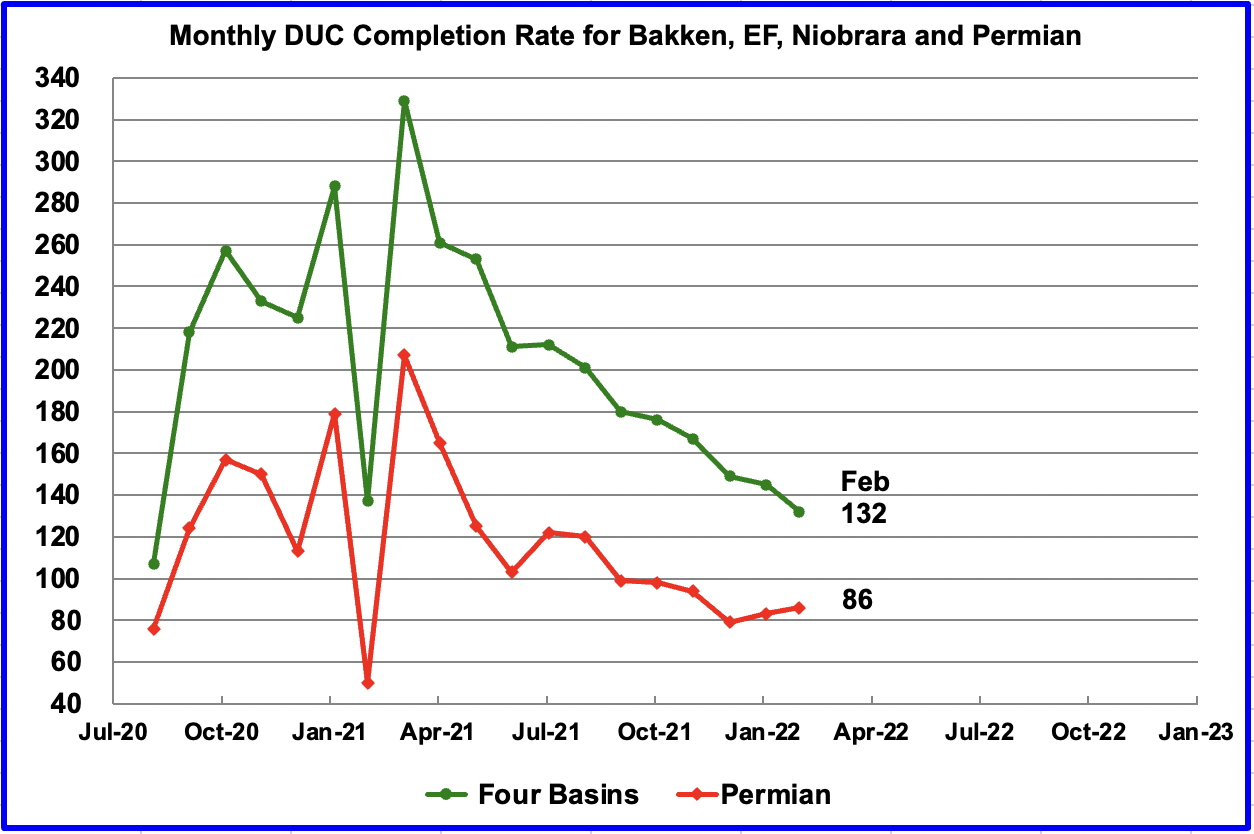
In these four primarily oil basins, the monthly completion rate of DUCs started to slow after peaking in March 2021. For example, in March 2021, 329 DUCs were completed. In February 2022, 132 DUCs were completed.
However in the Permian the trend has changed. The completion of DUCs has increased for the last two months. In February 86 DUCs were completed, up 3 from 83 in January.
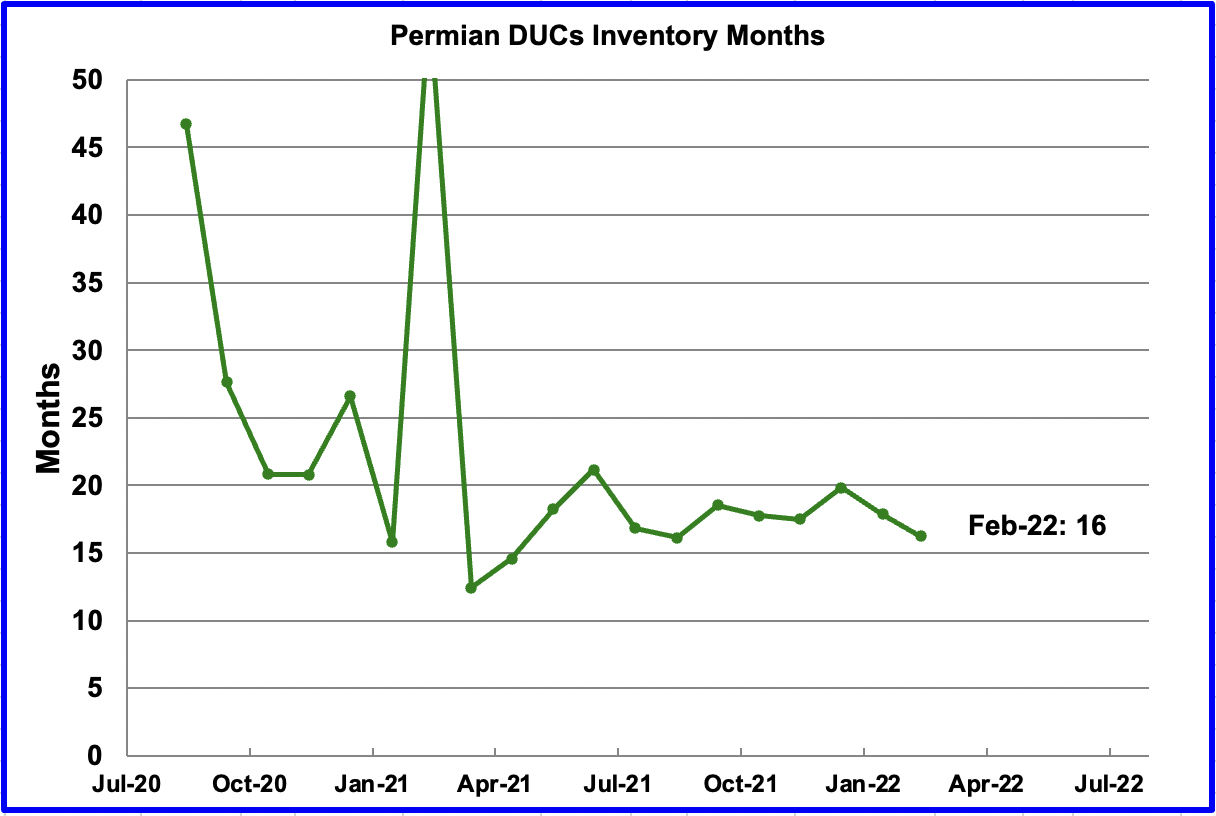
If Permian DUCs were to be completed at the latest rate of 86 DUCs/mth, that translates into 16 months of inventory, assuming the remaining 1,396 are all commercially viable. Interestingly, this 15 to 17 months supply of DUCs has remained fairly constant since July even though the number of DUCs continues to drop every month.
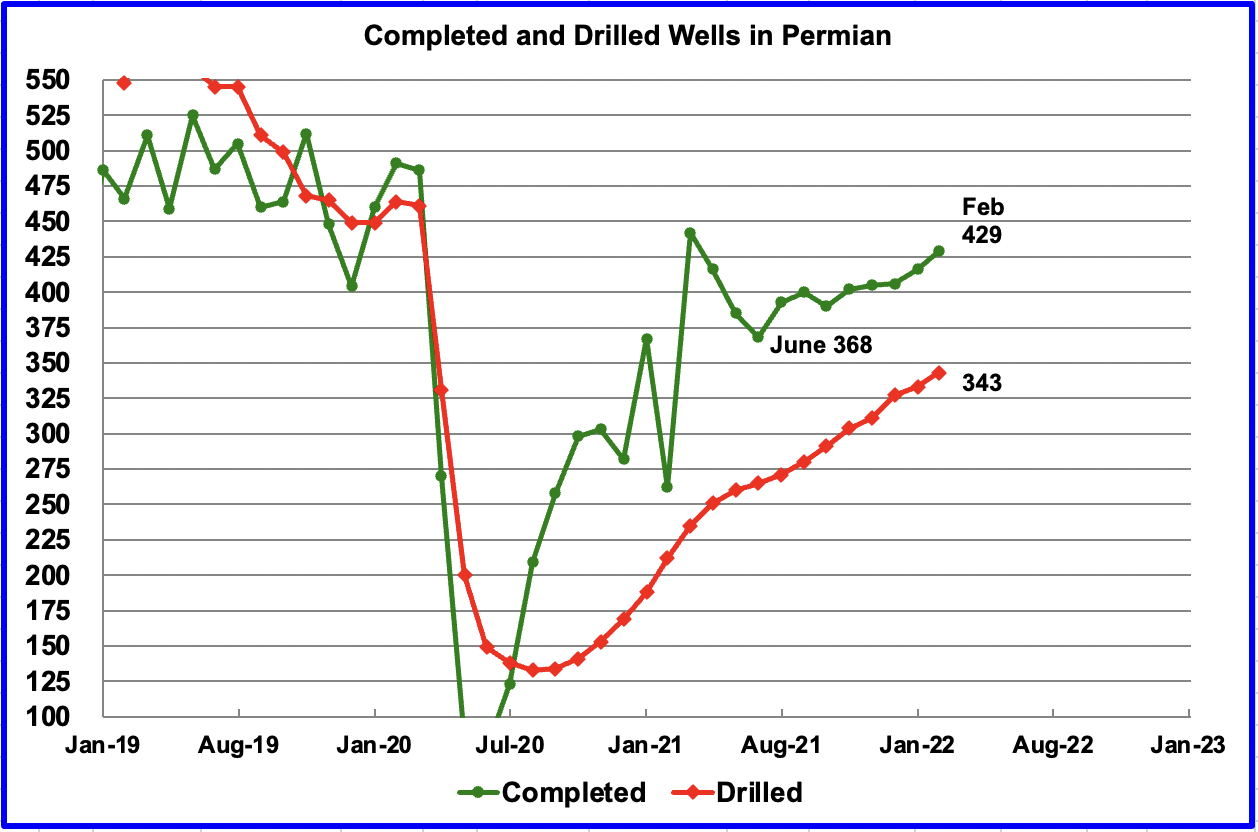
In the Permian, the monthly completion of wells has been increasing since the low of 368 in June. In February 429 wells were completed, 13 more than in January. Over the same time, 343 new wells were drilled an increase of 10 over January.
3) LIGHT TIGHT OIL (LTO) REPORT
The EIA’s LTO database provides information on LTO production from seven tight oil basins and a few smaller ones. The March 2022 report updates tight oil production to February 2022.
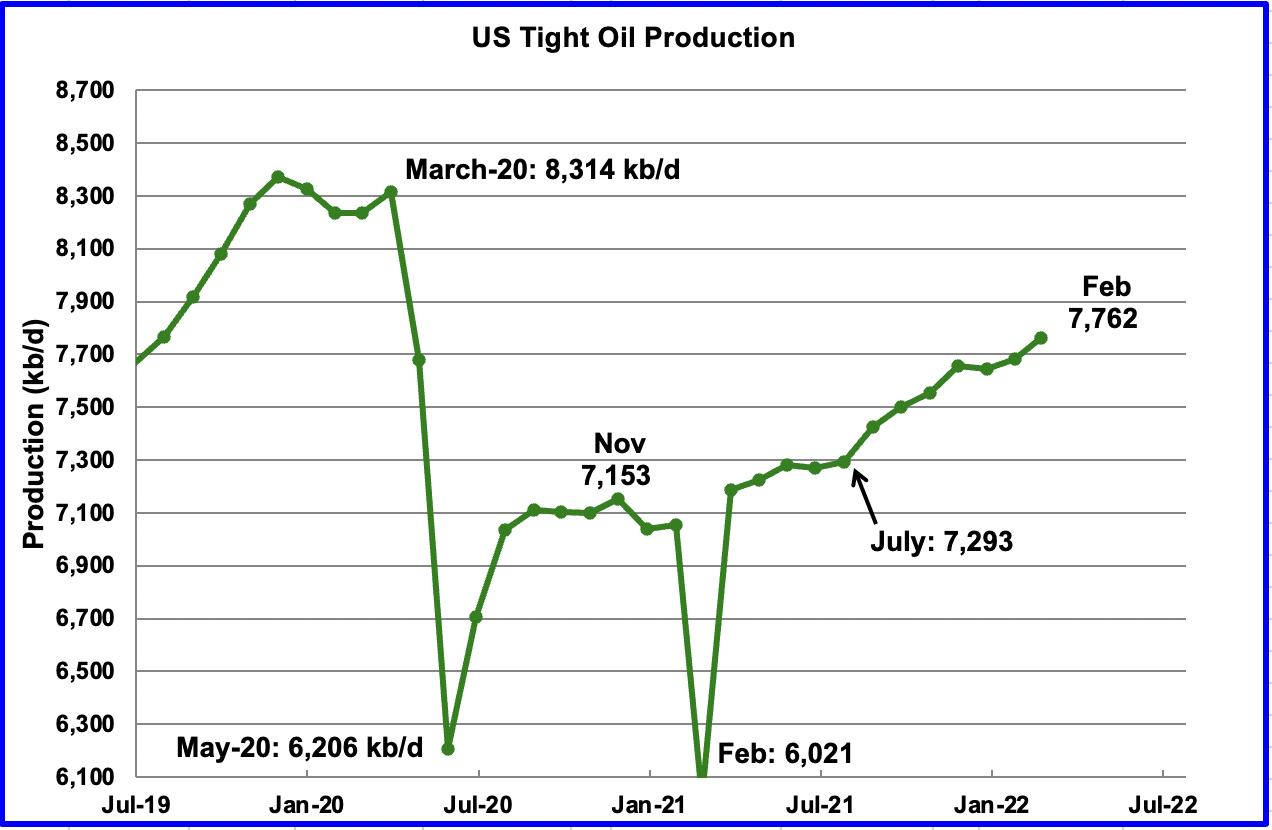
In contrast to last month’s report, the March LTO report has made minimal revisions to the previous production numbers. February’s LTO output increased by 78 kb/d to 7,762 kb/d. From July to February, output increased by 469 kb/d or at an average rate of 67 kb/d/mth.
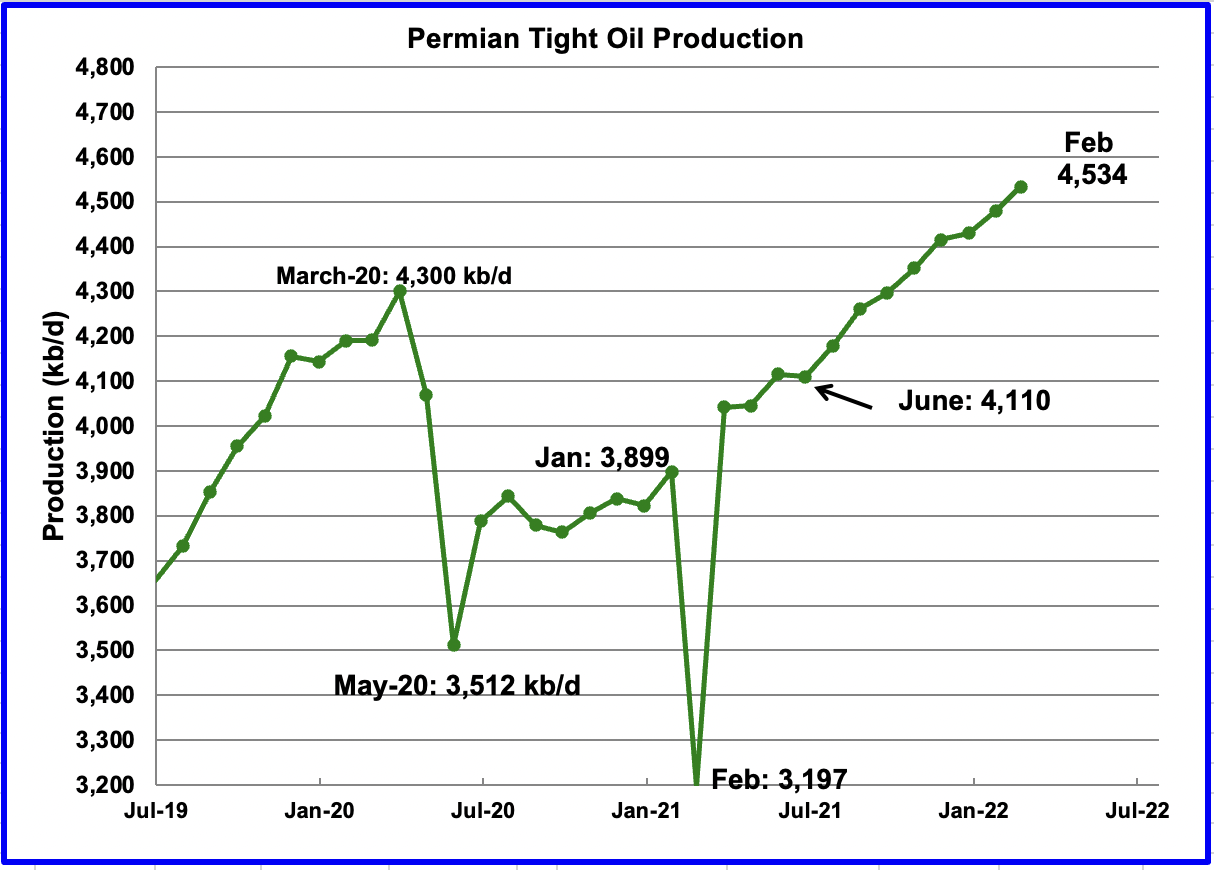
Permian LTO output first reached a new high of 4,352 kb/d in October 2021. February’s output increased by 64 kb/d to 4,534 kb/d and is 234 kb/d higher than the previous high of 4,300 kb/d in March 2020.
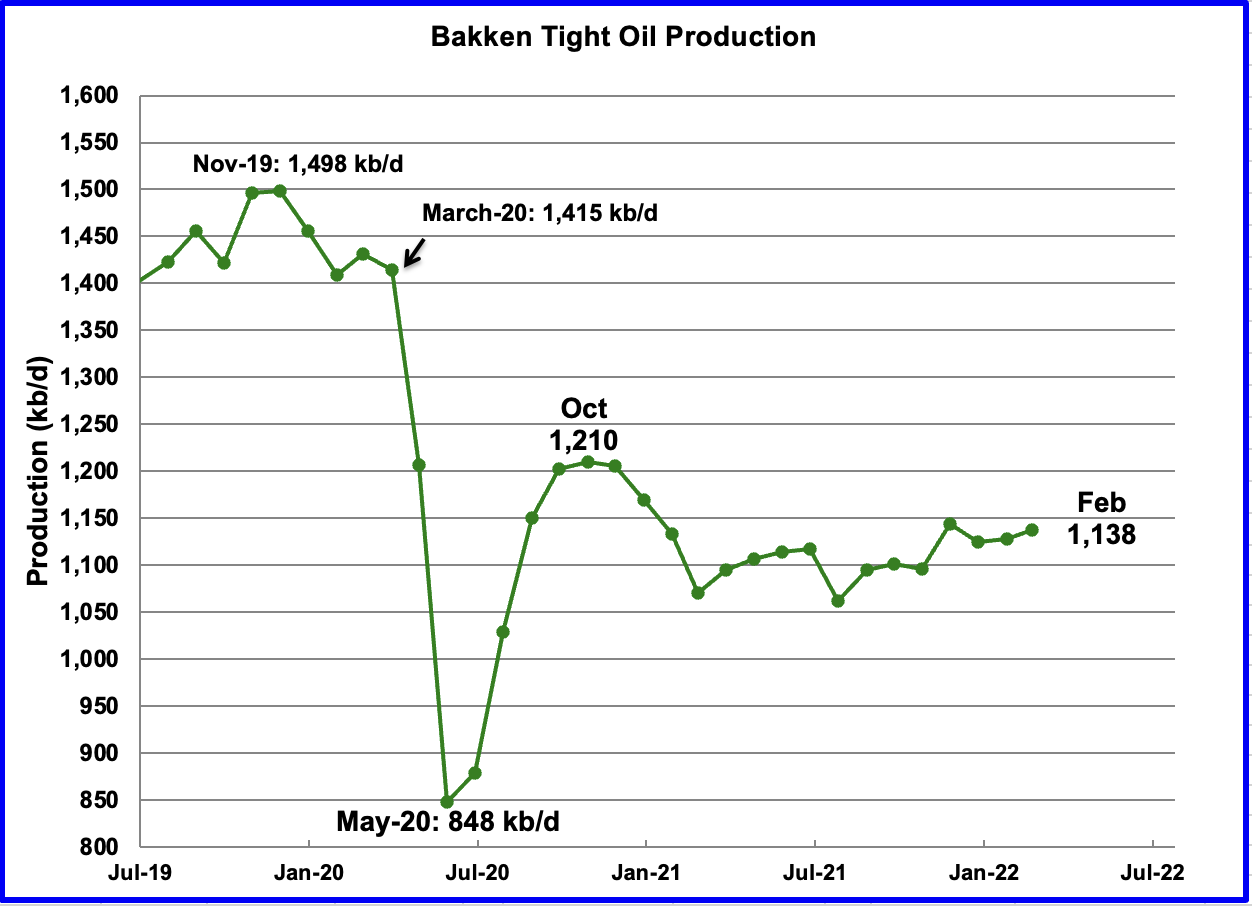
The Bakken’s February output increased by 10 kb/d to 1,138 kb/d. Note it is still below the October 2020 level of 1,210 kb/d.
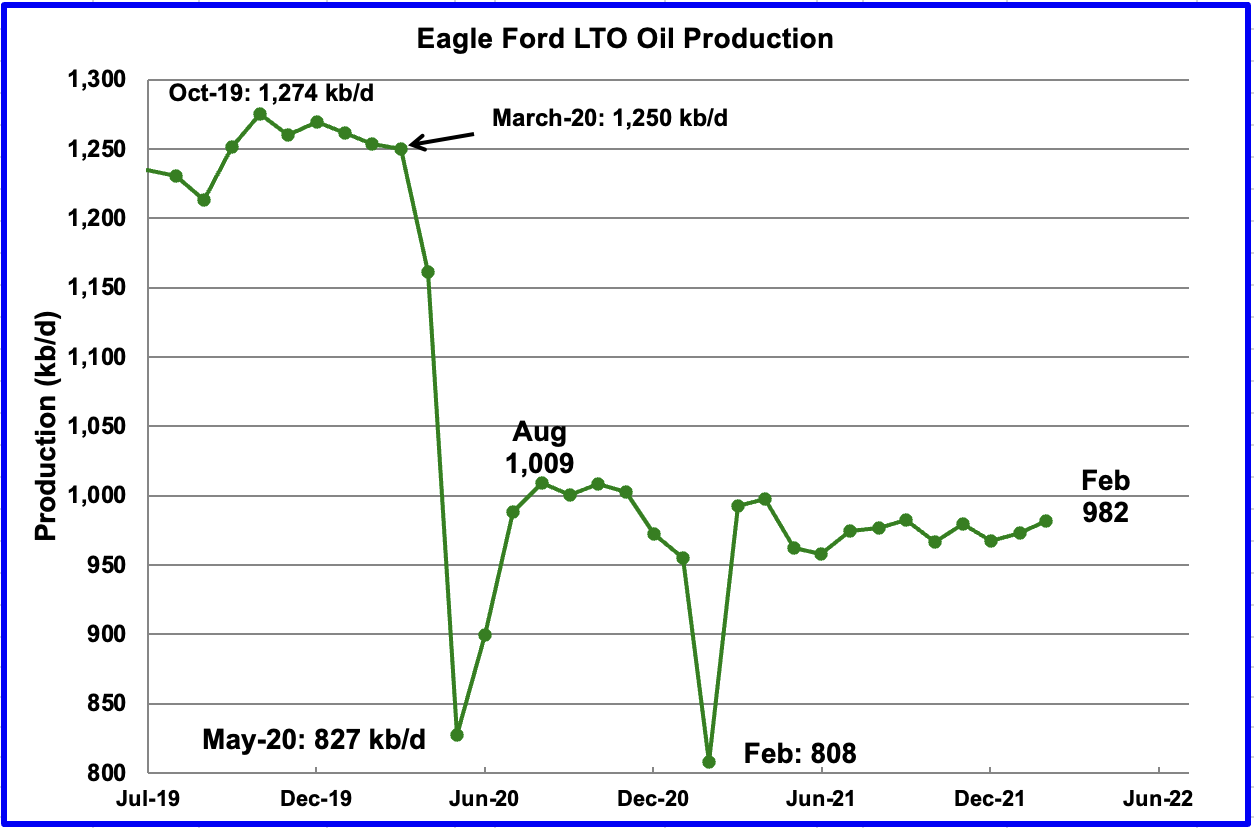
Production in the Eagle Ford basin since February/March 2021 has been essentially flat. Are the drillers doing this intentionally or is it just accidental?
The Eagle Ford basin produced 982 kb/d in February, which is lower than the August 2020 output of 1,009 kb/d.
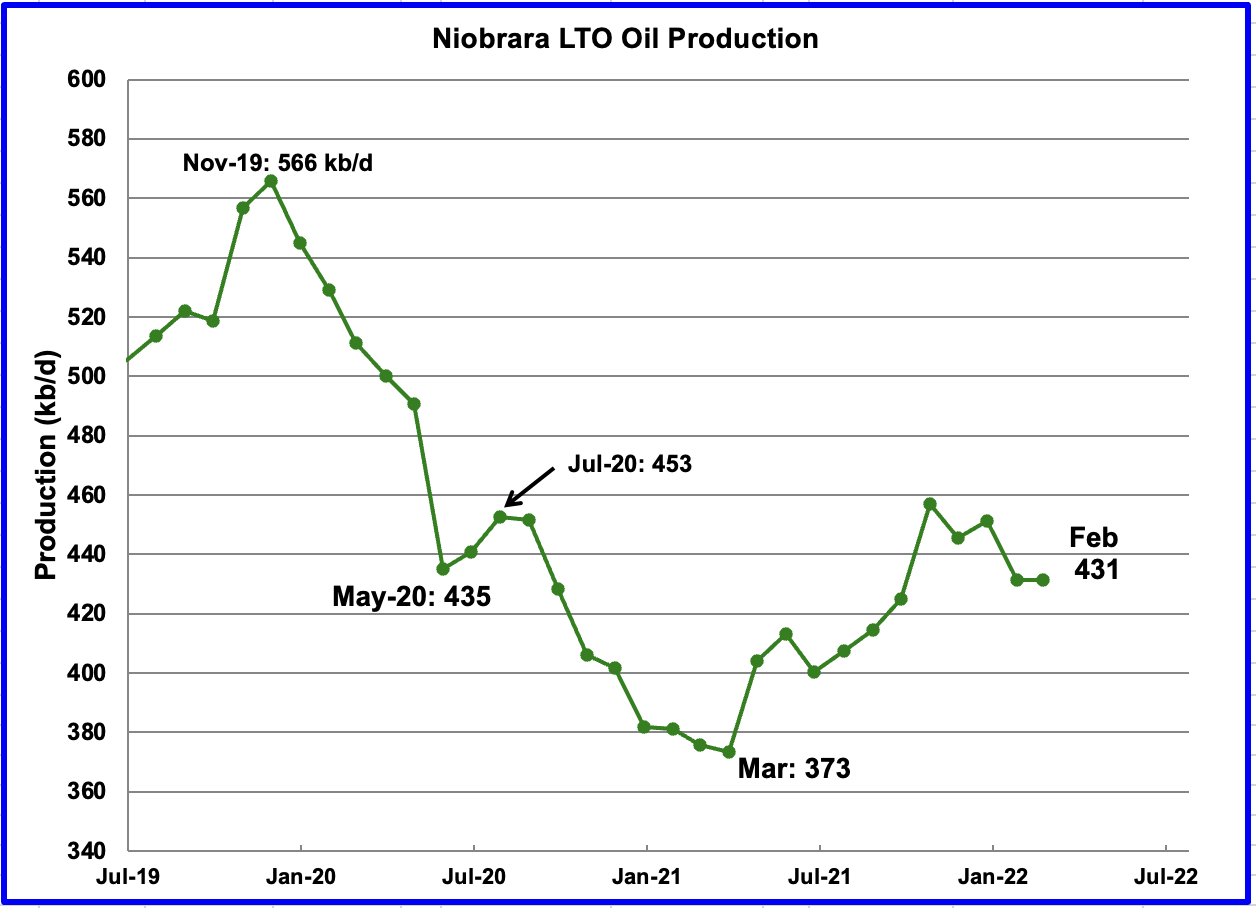
After increasing production from March 2021 to October 2021, output in the Niobrara began to drop in November 2021. February’s output was flat at 431 kb/d.
From July to March, the rig count in the Niobrara increased from 10 to 14.
On-Shore L48 Conventional Production
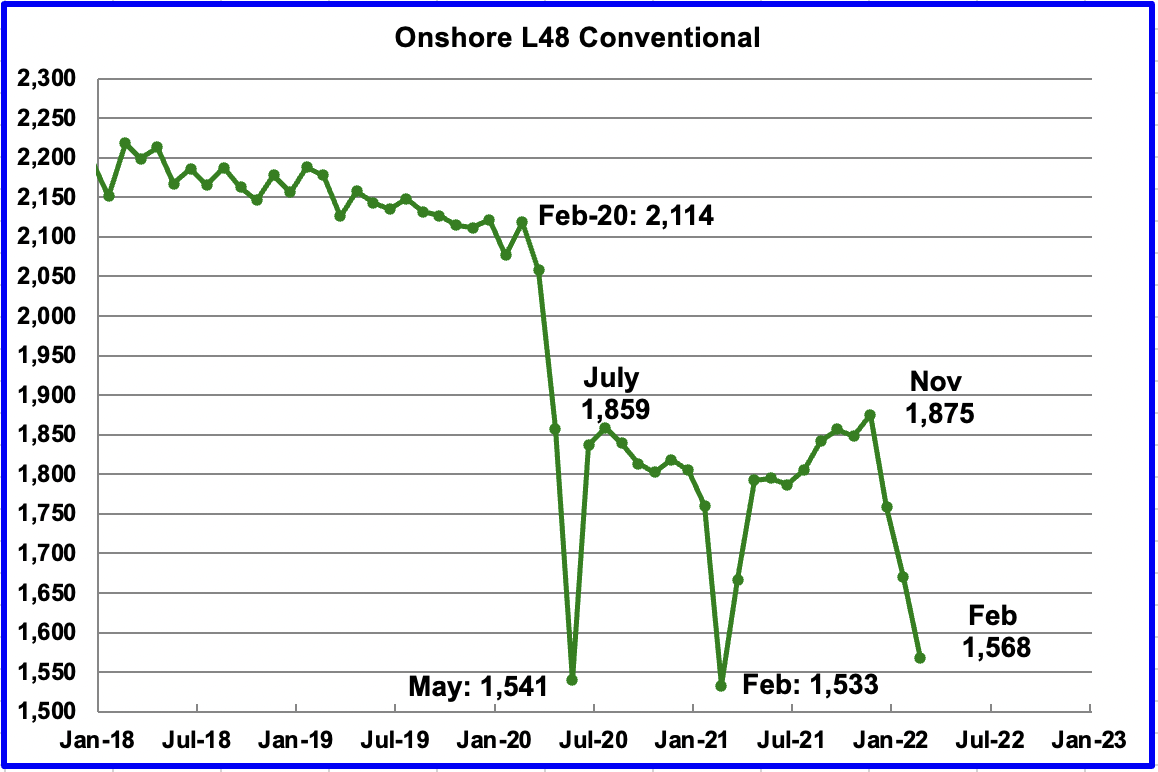
Conventional oil output in the Onshore L48 declined by 102 kb/d in February to 1,568 kb/d. This estimate is based on a combination of the expected February LTO output and the March 2022 STEO report that has a forecast for the US On-shore L48 output for February 2021. Data up to November 2021 is actual EIA production data.
If the real production number for January were to be used, conventional oil output would be lower than the February output shown. However a note of caution is in order. This chart is derived by subtracting two large numbers which are subject to revision, particularly the latest months, which greatly affects the output after November.
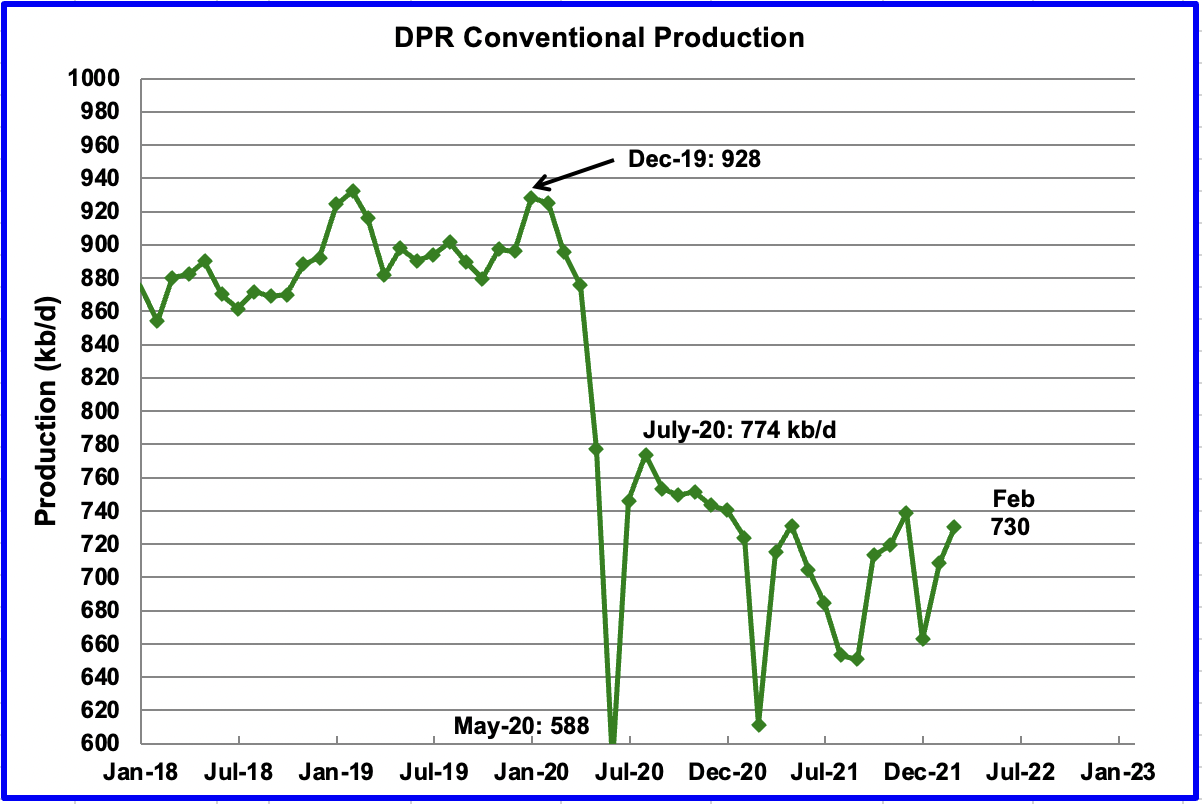
This chart shows conventional oil output in the DPR fields. It was obtained by subtracting the LTO basin data from the DPR data. The chart shows that the large decline of conventional oil in the US, shown in the previous chart, is not associated with the DPR basins.
As noted above, this chart is derived by subtracting two large numbers which are subject to revision.
204 responses to “US January Production Drop Surprises”
https://mishtalk.com/economics/mishtalk-tv-with-the-head-energy-trader-at-price-futures-group
Can Biden lower the price of gas?
Wait, does the American government still dictate wages and prices? I remember Tricky Dick Nixon’s Cost of Living Council, run by Donald Rumsfeld and his lapdog Dick Cheney, but I’m pretty sure Jimmy Carter swept away all that central planning crap.
It looks like Biden’s idea is along the lines of “buy low sell high”, which makes sense to me. The price will sort itself out, or not.
Shocker!! . Pressure depletion exists. Running harder to stay in place. As usual great post Ovi. Thank you for your contributions.
LTO Survivor
Thanks for the encouragement.
I am conflicted with with the pressure drop explanation, poorer drilling areas and other reasons provided by many to fully explain the production drop that keeps appearing for the Permian/Texas. The conflict comes every time I look at the info posted for Permian output at Shale Profile and the EIA DPR/LTO reports.
Below are the latest two charts for the Permian from Shale Profile. The first one shows the peak production for the second month. The 2020 wells averaged 835 barrels per day. For 2021, the average was 905 barrels per day. I have no idea if the increase is from longer laterals or from better quality drilling counties.
The second chart shows Total barrels at various months. Comparing 2020 with 2021, It appears that the 2021 wells are as productive the 2020s and do not show the improvement shown in the peak production chart.
Appreciate that I know nothing about oil production in the Permian. I am just trying to sort out the number of opinions I see here and the ones on Mike’s website regarding the Permian’s future.
My basic problem is I see essentially constant year over year production from Permian wells at Shale Profile and many opinions indicating the Permian is finished.
Throw in the big drop in December and January production numbers for Texas/NM and it becomes a bit difficult to sort out which factors provide the best explanation
Chart 2
Ovi,
As you know lateral length has increased so output per lateral foot has not increased since 2018, it has decreased slightly. Unfortunately I don’t have recent data.
Here is the most recent post that I found with lateral length info for entire Permian. A rough approximation is 5000 foot laterals in 2015 with roughly a linear increase to 10000 feet in 2021 or an increase of 833.3 feet per year.
https://shaleprofile.com/blog/permian/permian-update-through-august-2021/
This data could be used to normalize for lateral length (but we need to estimate from the chart).
Ovi,
I no longer have the higher-level membership for Shaleprofile, but when I looked at the Permian wells in 2021, we can clearly see in the chart that Fluid and Proppant levels increased significantly. Furthermore, the laterals have doubled from one to two miles, while the proppants and fluids have more than doubled since 2016.
With the spike up in Fluid and Proppant levels in 2021, this is the RED QUEEN SYNDROME in pure technicolor style.
steve
Found a chart on Permian lateral length from Rystad
https://www.rystadenergy.com/newsevents/news/press-releases/Permian-new-well-productivity-set-to-breach-1000-boepd-in-2022-on-record-lateral-footage/
Using estimates from that chart and data from shaleprofile for wolfcamp, bonespring and spraberry formations in Permian at 12 months I can normalize for lateral length for 12 month cumulative output per 1000 feet of lateral from 2015 to 2020. Chart is below.
Note that in 2015 the average 12 month cumulative per 1000 foot of lateral was about 15960 barrels per 1000 feet of lateral and in 2020 the average 12 month cumulative per 1000 feet of lateral was 18975 barrels. The average annual rate of decrease from 2016 to 2020 was about 191 barrels per 1000 feet of lateral and if that rate continues in the future it would take 16 years for the rate to reach the 2015 level. Some of the decrease may be related to longer laterals being less efficient at recovering oil compared to shorter laterals, though the cost savings in capital cost per barrel of oil recovered makes the longer laterals attractive from a profit maximizing perspective.
Activity in the Permian HZ play has been led lately by small private companies who can actually make money at these price levels; they have raised industry money on fair to good economics and are mostly out of debt. But their acreage positions are small and increasing D&C costs are changing those economics now; none of that activity will last. DUC’s are still being completed, but that won’t last either. Normalizing well parameters matters, as has been stated. Again, initial potentials and how a well is produced is an operational elective, often designed for maximum front end cash flow.
EVERY top ten producer in the Permian is suffering from poorer well quality and declining EUR’s in their core areas, many significantly. As the gentlemen suggests, that is a direct function of over drilling and pressure depletion. My instincts tell the THAT is a far better explanation for the reduced activity of large public companies than the lame excuses they make up. Those core counties and core areas are the window into the future, not technically recoverable, imaginary oil in USGS goat pasture. If that was doable out there in the frontier, at $110/$5 they’d be all over it like white on rice. They’re not, they’re still high grading core areas for poorer wells. There’s only one explanation for that.
In the mean time, America exports 2 times more tight oil to foreign countries every year, most of it FROM the Permian… than the TOTAL volume of oil stored in the entire SPR system.
America is speeding to a red light.
Thanks Mike,
Was it and unusually cold January this past winter (2022)? You are there in Texas (though the state is huge so you may only know your area as far as weather), I am not, but no weather events that I remember came close to the Feb 2021 event in January 2022.
No, not at all.
Thx Mike
Mike,
Does it seem like conventional oil output in the onshore Texas/New Mexico/ Louisiana area decreased by about 14% in Jan 2022? This seems unlikely from my perspective, but as you know I know far less than you and may be missing something obvious.
Let’s see if these numbers are getting corrected in the next report – I think the latest month always is a bit prelimitary.
I don’t belive in such big swings without an explanation – cold weather, big maintaince, main pipe blowing up, the usual stuff. At least they still where drilling and fracking.
I was just a couple of hundred miles due west of the Permian, in New Mexico. There we had an exceptionally mild January. In fact, it was an exceptionally mild winter.
Thx Ron,
Thought you were in Southeast.
I was in the Southeast until July of last year. Then I went back to New Mexico. But two weeks ago I moved back to the Southeast. I now live in Huntsville Alabama with my son who recently lost his wife to heart failure. Sometimes I think I have come home to die. But I do hope to live a few more years. Anyway, I do not expect to ever move again, but you never know.
Ron,
Sorry to hear about your daughter-in-law. Enjoy your family.
Mike,
There has been some discussion that longer laterals will tend to reduce EUR per 1000 feet of lateral, but that the reduced total D and C costs per 1000 feet of lateral makes the longer lateral wells attractive from a profitability stand point. At some point an optimum average lateral length may be determined in the Permian Basin, and the EUR might stabilize in the core areas. It would be interesting to see the normalized well profiles in the North Dakota Bakken/Three Forks, because I think the average lateral length has been around 10000 feet for many years in that basin and looking at well profiles we still have not seen much deterioration in cumulative output. That basin is getting pretty long in the tooth and I have been expecting to see average new well EUR decrease since 2012, 10 years later and I am still waiting. See link below for “not normalized” Bakken Well profiles
https://public.tableau.com/shared/XQCCN9HZG?:toolbar=n&:display_count=n&:origin=viz_share_link&:embed=y
Great work ovi . Lot of different calculations . Can’t be more transparent . Muchos Gracias .
HIH
Thanks. Much appreciated.
My thought . The SPR release is now going to be a permanent feature until and unless Pentagon steps in and puts a stop . For politicians ” Short term pain for long term gain ” does not work .
The SPR release is now going to be a permanent feature until and unless Pentagon steps in and puts a stop .
HH are you under the impression that the Pentagon has its Commander in Chief… in the Pentagon? No, the Pentagon’s Commander in Chief resides in the White House and only he dictates SPR releases.
Or perhaps you had a military coup in mind. Not likely. Every military officer in the Pentagon is at least twice as smart as Donald Trump and none would dare try such a stupid stunt as the Donald tried to pull off.
Ron , I understand the technicality you are getting at . What if Miley and Austin were to tell Biden that the SPR was needed by the armed forces ( say for a war in South China Sea) and should not be released for public usage . ? You think Biden would overrule them ? Technically he can , but practically I think the chances are extremely low . Reading the media, there are two forces at work on the Ukraine question . The neocons who would like NATO to get directly involved vs Miley and Austin who want to keep out . Luckily Biden is listening to the latter .
“Or perhaps you had a military coup in mind. Not likely. Every military officer in the Pentagon is at least twice as smart as Donald Trump and none would dare try such a stupid stunt as the Donald did.”
No , Ron nothing like this . The people would rise against such an attempt . Yes the opioid crisis , paid for MSM along with fakebook and stuff has numbed the people but still enough sane people who would revolt in case of a coup . I have still faith .
What if Miley and Austin were to tell Biden that the SPR was needed by the armed forces ( say for a war in South China Sea).
Really now? War in the South China Sea? Do you actually think the generals or the Secretary of Defense would propose such a war to Biden? Anyway, if such a war were probable, Biden would be way ahead of them with knowledge of the world situation.
No, there is not a snowball’s chance in hell that the Pentagon will tell Biden to stop pumping oil from the SPR.
Ron , you misunderstand me again “Really now? War in the South China Sea? Do you actually think the generals or the Secretary of Defense would propose such a war to Biden? ”
Did I say USA will start a war ? What if China goes across the Taiwan straits ? This is Xi Ping’s call not Biden’s . Beijing holds the aces . Long supply chains are over and the story of the blue fleet with the aircraft carriers is over . Hypersonic missiles are the new boys in town . USA can be reactive but not proactive. It is not in a position to initiate any action in the South China Sea . It will loose a war in that region . Several simulations and even the Rand Corporation have said the same . Who provides intelligence info to Biden ? Surely not Hunter . It is the MIC . Hypothetically Biden overrules Miley and Austin , all it will take is a leak and it is the end of his presidency . Next in line ” Cackling Harris ” , replace her and then we have 80 yrs old Nancy Pelosi . I have posted often that my inspiration were Edison, Ford , Carnegie , Sloan , Paine , Vidal , Mencken etc but the current leadership is a disaster , however ” the people get the leadership they deserve ” . Who am I to argue ? So to to put in the word to your “No, there is not a snowball’s chance in hell that the Pentagon will tell Biden to stop pumping oil from the SPR. ” Well they told Biden keep NATO out of Ukraine and Biden listened . Men in uniform matter .
” Well they told Biden keep NATO out of Ukraine and Biden listened . Men in uniform matter .
So that is why NATO did not storm Ukraine. The US Generals advised against it, or else we would be in the middle of Ukraine right now. I sure hope Biden and the rest of NATO keep an open line to the Pentagon, they will definitely need to know what to do next. 🤣
Ron . During the last days of Trump when he was showing extreme signs of eccentricity and looked he would start a war with China Pentagon stepped in . Miley called up his counterpart in Beijing and assured him that nothing will happen under his watch . This is public knowledge . Men in uniform matter .
https://apnews.com/article/donald-trump-china-united-states-michael-pence-joint-chiefs-of-staff-caba520490ba574393f1cb6d1e961dba
No sir . Canada tar sands are not the savior . Excellent analysis .
https://www.resilience.org/stories/2022-02-16/a-case-study-of-fossil-fuel-depletion/
Nice read, a great intro and fleshing out of the concept of resource depletion. The takeaway that he shows ineluctably:
As time passes:
Wells produce less oil;
Wells are depleted more rapidly;
A greater share of production is met by recently drilled wells.
Also a thought/question on the tar sands specifically:
Since they are so dependent on cheap natural gas and nat gas is becoming more of a global market, especially with the war in Ukraine, could there a tipping point where gas prices in Alberta get too high and all tar sands are suddenly uneconomical?
The article appears to exclude Canadian tar sand production, instead focusing on the type of production no longer relevant in terms of overall Canadian oil production. An amusing idea, focus of what doesn’t matter rather than one of the largest resource plays on the planet. As far as saving the planet, no, the Canadians probably couldn’t do that by themselves, but between them and a coherent Venezuela could probably handle any overall underlying decline globally through at least mid-century, if not longer.
Reservegrowthrulz,
Not clear that oil sands can be developed as quickly as depletion may occur, but after 2035 it probably will not be needed in any case as oil demand will likely be falling faster than supply, oil prices will drop and new oil sands development will no longer be profitable. Most forecasts I have seen for Canada (from the Canadian government or CAPP) do not anticipate rapid development of oil sands resources.
An old adage of drag racing. Speed costs money. How fast do you want to go? Resource development is about the same. Canadian tar sands sitting more at the marginal end of the spectrum than not, this adage would be quite applicable.
Of course, if the supposition is that demand will fall then the entire equation changes to one of knocking off the marginal barrels through lack of investment and the usual depletion until natural decline matches the rate of demand decline. The point being, scarcity in terms of oil production between now and mid century isn’t the main issue, unless someone wants to pile other assumptions on top of the equation, wars, environmental legislation with teeth, geopolitical decisions, artificial mechanisms (sanctions with teeth on the usual suspects) etc etc. The CER most certainly doesn’t project the rapid development of their tar sands. And the country also has the potential of activating legislation to artificially limit it as well, making it quite interesting a scenario, price and environment and laws of the do-gooders against the desire of First Worlders to just keep sucking down the crude.
Out of curioisty, you don’t model these types of effects do you, your systems are more technically oriented and you have to install assumptions of production change on a sort of ad hoc basis?
Reservegrowthrulz,
I mostly focus on land transport demand for crude and associated products. I model how fast the world transitions to electricity in land transport (with a fast and slow transition) for simplicity I assume the rest of World demand remains constant at the 2019 level (likely a poor assumption, but looking at major crude oil product categories at BP and subtracting gasoline and diesel, the consumption of the rest (excluding LPG and ethane) had been relatively constant from 2008 to 2014, I assume this situation might return. Over 1999 to 2019 the average annual rate of increase was 127 kb/d (using OLS on data), so I could use that for the increase in non-land transport oil demand.
I assume supply tends to match demand when I do my model subject to resource constraints and the historical time from discovery to producing reserves.
The bottom line is that it is likely supply exceeds demand after 2035 in a low supply scenario and by 2030 in a high supply scenario (fast transition/low demand scenario in both cases).
RG ” An amusing idea, ” . Yes , till it isn’t .
Some maths . The real oil in the USA is
Conventional 1.5 + GOM 1.7 + Alaska 0.5 + LTO (Total minus exports ) 2.3 = 6,0 mbpd
Total consumption is 20 mbpd
Where will this 14 mbpd going to come from ? Further note that 6.0 mbpd will continue to decline . Draining the SPR will not work .
+ 24 hrs and still no responses ‘. Can I conclude that the USA is in a pickle but refuses to acknowledge this ? Denial the first stage of grief .
Hole in head,
Tight oil output in Jan 2022 was 7684 kb/d, US exports of crude were 3347 kb/d, the net for tight oil would be 4.34 Mb/d, add conventional, GOM , and Alaska (3.7 Mb/d) and the total is 8.1 Mb/d.
US inputs of crude oil to refineries was 15.45 Mb/d in Jan 2022, net imports of crude were 3.04 Mb/d and net exports of petroleum products was 3.6 Mb/d, about 15.4 Mb/d of finished petroleum products were supplied in Jan 2022, and about 1.4 Mb/d of gasoline and diesel were net exports, of the 15.5 Mb/d, 8 Mb/d was gasoline, 4.1 Mb/d was diesel, and 1.4 Mb/d was jet fuel, the rest was less important miscellaneous products so 13.5 Mb/d minus the net exports of 1.4 Mb/d for about 12.1 Mb/d of the important stuff consumed. A large piece of the petroleum products is LPG (3.9 Mb/d) and not really related to crude oil (essentially these are NGL which is a byproduct of natural gas production).
The US has been an oil importer for a long time. This is not a new problem.
Also note that until recemtly the oil market had excess stocks of oil that it was draining back to normal levels (from March 2020 to Jan 2022). Now the market is undersupplied and stocks are below normal levels. At some point oil prices rise to a level such that stocks will build back to the 5 year average level, or this seems likely based on past history.
OK , Dennis 8 mbpd as you say . Still required 8 mbpd of crude at refinery level . Consumption is 20mbpd of finished products . Did the 16mbpd refining capacity produce 20 mbpd of finished products ? How can output be more than input ? The laws of Physics prevail . This means that US imported 4 mbpd of finished products . Correct me if I am on the wrong track ?
Hole in head,
Keep in mind these numbers are volume not mass and barrels of different products have different densities (crude>diesel>jet fuel>gasoline>NGL in density terms).
Of the 20 Mb/d of total petroleum products about 4 Mb/d is hydrocarbon gas liquids, so the amount of finished products that are based on crude is about 16 Mb/d and of that about 1 Mb/d is biodiesel and ethanol, so the real number is about 15 Mbpd and of this about 1.5 Mb/d of gasoline and diesel are net exports so the amount consumed in the US is really about 13.5 Mbpd.
product supplied (NGL 2840 kb/d in 2019, gasoline=9300 kb/d in 2019, diesel=4100 kb/d in 2019, jet fuel=1740 kb/d in 2019 for 15140 kb/d total supply in 2019
https://www.eia.gov/dnav/pet/pet_cons_psup_dc_nus_mbblpd_a.htm
gasoline net exports (700 kb/d in 2019)
https://www.eia.gov/dnav/pet/pet_move_neti_a_epm0f_IMN_mbblpd_a.htm
diesel net exports (1100 kb/d in 2019)
Subtract net exports (1800 kb/d) from product supplied in 2019 and we get 13340 kb/d of product consumed in the US in 2019.
Also about 980 kb/d of biofuels were fed into the refining process in 2019 along with 16560 kb/d of crude oil,
https://www.eia.gov/dnav/pet/pet_pnp_inpt_dc_nus_mbblpd_a.htm
of that crude net imports were 3819 kb/d.
https://www.eia.gov/dnav/pet/pet_move_neti_a_epc0_IMN_mbblpd_a.htm
Tks , Dennis for the breakdown . A lot of fog to be cleared in many areas .
Hole in head,
Your basic idea that the US will need oil for some time is correct, eventually a lot of the oil demand will be replaced with EVs and the US likely has enough natural gas to make the transition to wind, solar, hydro, geothermal, and nuclear power for most electricity production. The faster this can be accomplished the lower we can keep atmospheric CO2 concentration, better government policy will help, fewer old white guys in the US Senate would help.
Ovi. Great work!
I note you and Dennis discussing US lower 48 onshore conventional. It might be too much work, but most of the larger states have free oil production data.
You might discuss this analysis with Enno Peters. He might have some thoughts on how to use this data to analyze US lower 48 conventional.
Unfortunately we are living in a short term thinking world. It seems analyzing US conventional over its long history might be of some relevance?
Few (outside this blog anyway) appear to realize how much more quickly the US is plowing through shale compared to US lower 48 conventional. It took over 100 years for US lower 48 conventional to peak? I assume that peak occurred in 1970/1971?
Also, not a lot of consideration as to how much smaller of a geographic area shale is compared to lower 48 conventional. Especially when it comes to production growth.
It’s also bizarre to see politicians who were “leave it in the ground” flip to “drill baby drill.” I really didn’t expect that to happen.
Ron, what are your thoughts on how the Democratic leadership has completely flip flopped? I’m pretty disappointed with them. We need somebody to level with the American people that we do not have unlimited oil reserves. Even the Democrats now seem to think we should just hammer the hell out of what remaining shale we have, and that it will last for decades. It seems to me they have fallen into the Republican’s false narrative of unlimited shale?
Of course, when the EIA puts out ridiculous long term forecasts, maybe we should accept that?
I usually don’t want to get into the politics, but this SPR reserve is a big, big deal. Who would have thought in April, 2020 we’d be set to take the SPR to a level not seen since 1983? In April, 2020, the Democrats in the House blocked filling the SPR to the top with $20 oil because that would have been a “Big Oil Bailout!” Geez. That sure doesn’t look good now.
Mike and I discuss the politics a little, he being an R and me being a D (although I’m not sure that I’m anything anymore). I think we agree that somebody in Washington needs to get more serious and long term focused on oil.
The Democratic Party must stop demonizing everyone who works in the fossil fuel industry. A much better approach would be to level with the American people. The message should be, we are going to need every drop of oil and every btu of gas. We need to make it last as long as possible. We need to produce, transport and burn it in the most environmentally responsible way as possible. We need to transition to other energy, not just for environmental reasons, but because we really have to due to lack of future supply.
Isn’t telling the truth the best approach in the long run?
Shallow sand,
Does the winter weather explanation for falling conventional oil output sound reasonable? In the Northeast the winter was fairly mild, not sure about your neck of the woods and maybe Mike S can comment on Texas. The report that Ovi found about cold weather in Jan in Texas did not sound severe, it sounded like a normal winter cold spell that would not affect production in any way.
By my calculation Jan 2022 showed a 14% drop in L48 onshore conventional crude output from the December level, does that sound like what was happening in the conventional L48 onshore oil business in January?
My guess is that either the tight oil estimate or the US C plus C estimate in the PSM will be revised significantly in the future. A small drop in January due to low temperatures may be common, but 14% seems unusual.
Chart below uses PSM data (first link below) and official US tight oil estimates(second link below).
https://www.eia.gov/dnav/pet/xls/PET_CRD_CRPDN_ADC_MBBLPD_M.xls
https://www.eia.gov/energyexplained/oil-and-petroleum-products/data/US-tight-oil-production.xlsx
L48 minus GOM is US total C C minus Alaska minus Federal GOM. Then I subtract tight oil from this to get conventional output. The last data point is Jan 2022.
Often the oil production data lags by a year or so (Texas and Oklahoma and many others) before is is mostly complete. So getting a real time answer is difficult.
Usually the PSM is pretty good as the 914 survey of about 375 of the largest oil producers in the nation covers at least 85% of output in most states and in the larger states like Texas and New Mexico the coverage is probably close to 90% of output being reported in the 914 survey (in Texas it is about 88.5% of output and in New Mexico about 94%.)
The problem is the rest of the output is assumed to follow the large producers in a relatively stable relationship. If we get a situation where small producers are increasing output while larger producers are holding steady or cutting back on output then we can get a mismatch in the estimate by the EIA. This is likely what has occurred in December and January. In the future as better data comes in the estimates will be revised.
Longer term chart starting in Jan 2000 to show how unusual such a drop on L48 onshore conventional is.
We have good explanations for April/May 2020 (negative WTI oil price), and Feb 2021 (severe winter storm in Southwest). There is not a good explanation for the drop in Jan 2022 in my opinion.
Shallow Sand
I agree.
Short term political thinking and lack of understanding about the range of energy issues is the overwhelming theme of our countries approach since atleast the last 50 years.
Boom and Bust cycle of resource development and lack of a longterm energy policy are good examples of the failure to understand and failure to institute good industrial policy.
The use of the SPR currently is a mistake in my eyes, should be reserved for emergency use- critical shortage.
Not for shortterm market smoothing.
The shortterm thinking makes both parties look foolish, but our system rewards that. Politics is the ultimate Boom and Bust industry. It makes for poor policy.
If our system rewarded longterm thinking we would be in better shape.
Not sure how to get there.
I’m not interested in a 20yr dictatorship. I would fight it hard.
Hickory. Agree.
Shallow Sand
Thanks for the encouragement. I have gone to many State sites but have not had much luck in finding oil production data.
I think that laying out a truthful practical two prong approach on how to best use the remaining US oil and gas and the need to plan a practical transition over a reasonable time frame is what required. Unfortunately, laying out such a plan would supply more fodder and crazy counter claims for the GOP that it would result in more confusion and division. I fear the US is so divided these these days that I cannot see how things can improve going forward. Hope I am wrong.
I think that Putin’s goal of splitting/dividing the US has been very successful, unfortunately. When you see Americans cheering for Putin, I often wonder if I am in a nightmare. How can such intelligent people in the House and Senate put their own personal gains ahead of the great American dream. Totally confusing to me.
Ovi , “When you see Americans cheering for Putin, I often wonder if I am in a nightmare. How can such intelligent people in the House and Senate put their own personal gains ahead of the great American dream. Totally confusing to me. ”
No sir , you are not in a nightmare . The public maybe numbed but they are not stupid . They know which side the bread is buttered . As to the Congress and Senate got me thinking about a movie ” The Aviator ” starring Leonardo Di Caprio (Howard Hughes) . Here in the incident Caprio meets a senator who is a lobbyist for Boeing . The senator has his hands in his coat pockets . Caprio says ” Hi senator , nice to know for a change you don’t have your hands in other people’s pocket ” . Relax . If you are confused it is a good sign . This means that your heart and your head are in alignment . Be well . Always your well wisher .
Ovi.
Go to Texas RRC PDQ.
You can obtain Texas oil and gas production data for free. I think you’d be able to separate horizontal from conventional.
Other states also have free data last I looked, including ND, Utah, Colorado, Wyoming, Montana and Kansas. New Mexico and Oklahoma didn’t have as accessible data, as I recall. I also think California has free public data.
Enno Peters sets forth his sources on shaleprofile.com. Take a look at those. States publish both conventional and horizontal.
Conventional is a lot more work to compile, but maybe looking at a few states could help?
Shallow sand,
The RRC PDQ does not have an easy way to distinguish horizontal from vertical well output without going through the individual records of 300,000 wells. A skilled programmer like Enno Peters can accomplish this, for mere mortals with his incredible skills, it is a very time consuming process.
That is why it costs 3500 dollars per year to access his database.
I have not looked at other states, but my guess is that it is just as difficult to access the data, it is all there, but pulling the data together in a way that is useful to look at the big picture requires a subscription to Enverus or shaleprofile. I know I don’t have the money for this, I will not speak for Ovi.
Dennis.
I know to get something you could publish like Enno does would be much work.
I just thought by maybe looking at counties that don’t have shale, or subtracting shale from the total, you might see something.
Shallow sand,
Yes I get your idea now. shaleprofile suffers from the same problem of lagging data due to its source for Texas data (RRC). Using the supply estimate at shaleprofile for Texas tight oil and subtracting from EIA data is the best I can do with my limited skill (I am far less talented than Enno Peters). Chart below shows that result.
Shallow sand,
One way to do this would be to combine Texas data for total output and subtract shaleprofile data for texas, that is probably the best we could do, but only the data up to about Jan 2020 would be complete, the Texas data is still very much not up to date.
Chart below has RRC data and EIA data for Texas C plus C in kb/d.
Ovi,
the resident Putin sympathizer on PeakOilBarrel has on this thread called for the US military to assert a form of military rule/martial law on US energy resource (SPR).
He is not a citizen of the US and i consider this meddling in the internal affairs of this country,
and given the war of words, minds, and cybernetworks that Russia has engaged against this country, I take offense to this kind of activity. And it certainly not the first from him.
Its not my site, but if it was- I’d give him notice of 2 strikes on this political activity against a nation to which he is not local. Three strikes and you’re gone.
He is free to be against the US ,NATO, Ukraine, and sovereignty of countries and democracy. But keep your political work out our of house.
Shallow Sand —
The truth is that people working in the oil industry are a tiny and shrinking minority of America, and most of them are getting screwed by the industry. There’s a saying in Appalachia, “The company gets the coal, and the miners get the shaft”. It’s not much different in the oil industry.
As to the message to the American people, it should be “Stop wasting energy.”
Yes. I am not inherently a pessimist but I believe the war in Ukraine is just the beginning of a prolonged world war fighting over control of scarce resources.
Yes – and the only way out is to get rid of the stuff.
On the short way it is everything that helps and is fast. Developing own ressources blocked by processing Nimbys (Germany now will drill for gas), Solar and WInd development is fast, too and can reduce peaker gas demand – and on the long run something like thorium or fusion plants can provide energy independence (or at least you can stockpile for 10 years or more, making wars about the stuff obsolete, too). Or additional a new international clean hydrogen infrastructure – where every sun rich country can take part, not only these few with good hycdrocarbon ressources. Or everything at once.
This is a way out of the end of fossil age.
On the other hand – Russia is the least country on the world who needs to expand military to get hydrocarbon ressources. Prospectors in this huge country will be much more effective. This war is more about dictators hobbies.
Have to concur with the resource driver but doubt this is a hobby war… I suspect it is driven by Russia’s existential concerns about its own fossil fuel export future.
Quote from part of a recent post:
Control of Ukrainian pipelines and resources are a natural complement to Russia’s known, strategic, aim of buying into and controlling Eastern Mediterranean fossil fuel exporters. Think: gangster drug kingpin (but the drug is fossil fuels). Take out the competition and take over his patch (literally = Ukraine). Offer ‘protection’ to Eastern Med development and exports (explaining Putin’s military support propping up the Assad regime in Syria).
See:
https://www.thisnannuplife.net/why-war-why-now/
Spriv, re Syria, check out Tartus, Russia’s only Mediterranean port eg:
https://en.wikipedia.org/wiki/Russian_naval_facility_in_Tartus
Dennis.
Cold weather is the only thing I can think of.
I know Texas has a reporting lag, but haven’t followed that for awhile. Has that gotten any better? Might be good to look at TX counties that have a fair amount of conventional, but no shale?
Shallow sand,
Did it seem to you that the past winter was colder than normal? In my area it was warmer than normal, but perhaps not true in Texas. If there was a severe event like Feb 2021, I think it would have been in the news. Maybe I missed it? The weather explanation doesn’t really explain it in my opinion. Was there a big drop in conventional output in your region in January?
Dennis
Here is another link. The headline sounds good but I could not get the article.
https://www.washingtonpost.com/nation/2022/01/19/texas-winter-storm-power/
Ovi,
That was a forecast, seems it was not really a big deal in the actual event.
Dennis.
We had an average winter.
TX and NM had a cold snap.
Ovi and shallow sand,
Report from NOAA for Jan 2022 at link below
https://www.ncei.noaa.gov/access/monitoring/monthly-report/national/202201
A pretty normal Jan for temperatures in Texas at about the long term average.
There was a lot of worry about cold weather after the disaster in Feb 2021, but there were no severe cold weather events in Texas in Jan 2022 that I can find on the internet.
Maybe Mike Shellman or someone else who lives in Texas can confirm this. Was Jan 2022 and unusually cold month in Texas relative to normal January weather in Texas?
From what I can tell the answer is no.
Dennis.
I looked and the cold snap in the Permian was the first week in February. So cold weather isn’t the explanation for January, at least for that basin.
Shallow sand,
They know how to handle cold in ND, so probably not there. I think for the most part it was an average to warm winter in oil producing areas.
I think the explanation is a bad estimate by the EIA for Jan 2022, we will know more in the future as the data gets revised, probably around May 1.
Let the games began . ” Dancing with wolves ” is different from ” Dancing with the bear ” . 🙂
https://www.zerohedge.com/energy/gazprom-halts-gas-shipments-europe-critical-pipeline
This happened already before the war. North Stream I is still running full bore, fullfilling the contracts.
Otherwise we would see the mother of all stock crashes here in Europe, and emergency laws at every corner. I wouldn’t rule out this still can happen.
The problem is even deeper: Even when deliveries continue, this is only the base contract with no addons. Winter started with only 65% storage capacities, and even when the russian contracts are fullfilled completely Europe needs extra gas from LTO.
One question: Is it possible to cross the Atlantic with a gas pipeline? North Stream II is completely submerged in the baltic sea – but this is shallow. It would be much more efficient than these cooling / expanding at huge energy losses.
THE ENERGY CLIFF: Real Or Fantasy
Many of you may have already seen this chart of the Global Oil Production Profile WITH and WITHOUT Debt. This chart came from one of Nate Hagen’s YouTube videos.
I bring this to the attention of the group for discussion because I believe the dynamics of Debt are overlooked in regard to the oil industry and overall economy. Nate suggests that debt has brought on unconventional, unprofitable oil (in BLACK) and also brought forward oil from the future to increase production on an annual basis (say to 100 mbd) than would have been otherwise if debt was not used.
Global debt has doubled since the 2008 Financial Crisis from $150 trillion to $300 trillion. With the world now reaching RESOURCE LIMITS, it seems to me that growth is over and with rising “REAL INTEREST RATES” a lot of this debt is not serviceable or sustainable. Thus, we soon see the Debt Bubble Burst.
This would be bad for the Oil Industry because one person’s debt is another person’s asset. When Debt and Assets POP, then investment in the oil industry grinds to a halt or declines considerably.
This makes sense to me, but I would enjoy other comments.
steve
This is an excellent point.
In our monetary system, debt is how money is created.
Conjectures:
1. Creating money to buy a good increases the price of that good.
2. Creating money to produce a good decreases the price of that good.
In the 10 years ending in December 2019, a great deal of money was created to extract oil. According to the preceding conjectures, this increased the quantity of oil produced while decreasing its price.
According to Christopher Leonard who wrote “The Lords of Easy Money” the Federal Reserve created $900 billion between 1914 and 2008. Between 2008 and 2021, the Federal Reserve created $3.5 trillion. Clearly this money creation had an effect on oil extraction. I think central banks have backed themselves into a very tricky position. Will they continue to create money at the same rate, or will they reign in money creation?
Schinzy,
I agree with your view. The central banks are stuck between a rock and a hard place.
The whole system is based on ever expanding credit and consumers of that credit in the form of debt.
I cant see a soft landing from this debt binge the world has been hooked on. Humans seem to be laugh now cry later type species.
Schinzy,
Money velocity has dropped as much of the money created is in th accounts of the wealthy unspent.
Money velocity in US at link below
https://fred.stlouisfed.org/series/M2V
Money turns over at about half the rate in 2021Q4 as it did in 1997Q4. The problem of too much debt is generally much ado about nothing. Developing economies have more access to cerdit facilities than in the past and have taken on more debt. If people are worried about government debt, they can vote for representatives that will raise taxes or cut government spending (or both).
In the US, typically Republicans want to cut both taxes and spending and generally they have caused increases in Government debt when they hold the executive branch.
Link below is US Federal Debt to GDP ratio
https://fred.stlouisfed.org/series/GFDEGDQ188S
Notice the rise from 1980 to 1992 during 12 years with a Republican in the White house, Clinton actually brought debt to GDP down while in office. Bush 2 saw a rise in government debt to GDP and Obama a big rise due to GFC. Note how Trump did nothing to Debt to GDP (it did not decrease but remained flat until the pandemic) and the big spike during the pandemic was mostly during Trump’s last year in office (2020). Debt to GDP has mostly been decreasing while Biden has been in office (2021 Q1 and first full quarter in office was 2021 Q2)
Steve,
Do you have any thoughts on the (apparent) demise of the petrodollar system and how this is likely to play out? I’m a total ignoramus of financial matters but as a long retired geophysicist still try to follow significant trends in the petroleum industry, likely a machoistic hobby.
No doubt that without ready access to easy credit that boom cycle of oil development would have been much slower, and thus have longer legs. Easy credit and very little regulation is how we do these things in the US. Gives very high growth for a short time. Its like the recurrent real estate boom and busts we have seen.
I tend to be much more conservative on these kind of things, preferring a slow and steady course. But that attitude doesn’t get you a seat at the table of decision makers in this country. And it doesn’t give you as fast growth in the economy. Like driving 45 instead of 70mph. Slower, but getting better overall range.
Most everyone jumps on board when the opportunities look exciting, and so the price we will always pay is bust.
This current disruption to global oil trade as a result of the Russian invasion serves as a fast forward glimpse to scenario that we should expect with increasing severity during this decade. If anyone needs any more warning, sorry this is it.
I agree with Mike- exporting oil and gas, other than to balance grades for refining purpose, is extremely shortsighted. You wouldn’t run a company like that (for long). But owners of the resource are eager to reach as many customers and as fast as possible, and we have very little in the way of energy or industrial policy/regulation in this land of revolving door leadership and partisanship above all else. Could you have imagined a politician in Texas in 2013 telling the oil industry that development of the Permian was going to be curtailed to a gradual pace by heavy regulation mechanism? They would have been shown the door quick, to put it politely.
And so like the Europeans and many poor importing countries are currently experiencing, we will learn to wean ourselves from high oil consumption the painful way, gradually moving toward energy poverty. Energy poverty can move you back a couple hundred years on the standard of living scale, and drain your wallet quick.
I think energy poverty if it does come to fruition, especially in countries who had enjoyed the higher standard of living that that energy has provided would led to war, whether ‘civil’ or otherwise.
We are all drug addicts as far as abundant cheap energy is concerned. Withdrawal symptoms from that addiction is unimaginable.
Hence rehab (renewables) might be a softer landing. But even then the overshoot dilemma has to be addressed.
Very unpredictable how this will all play out.
oil is to american democracy as silver was to Athens and the Roman republic. Once that source of wealth delcined both Rome and Athens declined, so will American and Western democracies .
my 2 pennies worth , and enjoy the sun set whilst you can , here have some popcorn
interesting times ahead
Forbin
Forbin and Iron Mike , your head is correctly placed above your shoulder . Both of you say the things that “are ” and not the way ” they should be ” . Collective madness is called sanity in todays world . Both of you dodged that . Kudos .
Steve at current oil prices, no new debt is needed in tight oil plays, well can be financed from operating cash flow with plenty left over to pay down debt and pay out dividends. Under $75/bo in 2021 US$ this might no longer be the case, but with short oil supply I doubt we see an annual oil price of $75/b or less in 2021 US$ in the near future (next 8 years).
No; not even close.
https://www.oilystuffblog.com/forumstuff/forum-stuff/cash-flow-capex
Mike,
Wow a 35% increase in D+C cost, I think in the past you have suggested average D+C cost in the Permian at around $9 million. So today your estimate would be about $12 million? Do I have that right? Possibly $13.5 million for full cycle capital cost (from spud to P&A).
At $75/bo at wellhead in 2021 $ and $3.50/MCF for natural gas and $26/b for NGL, the average 2019 Permian basin well has cumulative net revenue of about $13.6 million (2021 $) over the first 31 months of production. The discounted net revenue over the life of the well using a 27.5% annual discount rate is $14.2 million (2021$) over the life of the well (assuming P&A at 20 bopd). Cumulative barrels of crude is 420 kbo, cumulative natural gas is 1.9 BCF and cumulative NGL is 158 kb over the 157 months the well produces. The cumulative net revenue over 157 months is $24.4 million in 2021$.
Link to spreadsheet with hyperbolic well profile at link below (average 2019 Permian Basin well)
https://peakoilbarrel.com/wp-content/uploads/2022/04/hyperbolic-well-permian2019new.xlsx
Cumulative barrels of oil at 24 months for model is 216 kbo. Terminal decline at 13% per year begins at month 72, month 22 to 71 use Arps hyperbolic fit to data as in spreadsheet.
No oil here in Germany, but one of our customers got the building of a new warehouse delayed because of steel shortage + extreme price increase.
Yes, costs have gone up considerably. They do that sometimes in real life.
https://www.forbes.com/sites/daneberhart/2022/04/02/supply-chain-woes-inflation-crimp-us-producers-growth-potential/?sh=16d24e7d505d
The Haynes and Boones poll/chart, however, was relative to where CAPEX to drill tight oil wells is coming from, in real life, and clearly shows that credit/debt is still an important part of the tight oil business model.
Thanks Mike,
At Pioneer news release linked below
https://investors.pxd.com/news-releases/news-release-details/pioneer-natural-resources-reports-fourth-quarter-and-full-year-0
it is indicated that capital spending might be as high as 3600 million with 505 wells completed, if we assume all of the capital spending is for these new wells and supporting infrastructure, that would be $7.13 million per well, if we assume costs have increased by 35% that would increase well cost to $9.62 million. Note that I use an average well cost in my models of $10.5 million in 2021$, slightly higher than the 9.62 million. Pioneer also claims that 2022 wells will be paid for with forecasted operating cash flow.
Mike:
We just called our local supply store for a quote on 2 3/8” steel tubing.
$4.78 per foot for used tested, drifted. They don’t have any in stock right now.
No quote for used, tested “Louisiana gas pipe” which we understand is tubing that was new API when first used, has only been in a gas storage well, and was tested. They haven’t had any of this in stock for so long they had no current quote.
$7.50 per foot for new limited service. Just 1,200’ in stock.
$9.39 per foot for new API. Just 1,800’ in stock.
Pre-Covid we were paying roughly 1/3 of these prices, maybe a little more than 1/3. We used to buy a lot of the gas pipe for around $2.60 per foot as I recall, without pulling bills out.
Also, we used to pay $375 for rod jobs and $550 for tubing jobs on wells under 1,000’. Now the minimum is $575 for rod jobs and $850 for tubing jobs. They also seem to be adding other charges to those bills.
To get under 1,000’ of 2 3/8” tubing tested at the well was $175. It’s now $300.
To heat a 100 or 115 tank of oil used to be $300 and is now $450.
A 140 barrel fiberglass water tank delivered to the tank battery in county was around $4,000 and is now around $6,000.
We bought some used but reconditioned Jensen pumping units just last year for $2,500. Now they are $5,000.
One that hasn’t went up too bad yet is downhole chemical. Was $993.44 per drum including tax, now $1,080.40 including tax.
All of the above are pre-tax. The prices quoted unless otherwise stated are pre-COVID.
SS, all very familiar here in S. Texas and the same for everyone in W. Texas drilling HZ wells. OPEX is up +40%, D&C costs a solid 35%.
But that, and this… https://ycharts.com/companies/PXD/total_long_term_debt
is real, and relevant; best discuss it where it matters.
Hi Shallow sand,
What has happened on the revenue side? Have costs increased so much that it is no longer profitable to produce?
Other well cost estimates from EOG and Devon below, seems the range is $6 million to $8 million per well for CAPEX.
EOG forecasts 570 wells in 2022 at 4500 million, about $7.9 million per well
https://investors.eogresources.com/news/news-details/2022/EOG-Resources-Reports-Fourth-Quarter-and-Full-Year-2021-Results-Announces-2022-Capital-Program-Declares-1.00-per-Share-Special-Dividend/default.aspx
Devon expects to complete about 330 wells using about 2050 million, about $6.2 million per well (about 75% of spending expected to be in Delaware basin).
https://s2.q4cdn.com/462548525/files/doc_financials/quarterly/2021/q4/Q4-2021-DVN-Earnings-Presentation.pdf
Shallow sand,
When I adjust my spreadsheet to evaluate breakeven wellhead price for average 2019 Permian well with CAPEX increased by 35% (to $11 million per well from large producer average of around $7 million per well) and increase OPEX by 40% (based on Mr Shellman’s estimates for cost increases), I get the following.
Payout at 60 months, breakeven at $57/bo at wellhead with natural gas assumed to sell at $3.50/ MCF at wellhead and NGL sells for 35% of wellhead oil price.
Payout at 36 months at $62/bo at wellhead with same NG and NGL assumptions as above.
Assuming we use a 10% nominal annual discount rate, cumulative discounted net revenue is equal to capital cost plus 300k for P&A cost (in 2021$) at a breakeven price of $49/bo (with same NG and NGL assumptions for price as given in example one above), where I assume the well is shut in at 20 bopd.
If we assume the well continues to produce while net revenue is positive, the breakeven oil price falls as low as $48.30/bo and the well produces for 228 months and is shut in at 8.89 bopd with cumulative output of crude at 450 kbo, natural gas cumulative is 2259 million cubic feet and cumulative NGL is 187 kb.
Mike,
Yes Pioneer issued a lot of debt in early 2021 at very low interest rates and had taken on on significant debt with the merger with Parsley Energy in 2021, they are also paying out a very high dividend which is what their shareholders want. As interest rates rise they may decide to pay down their debt we will know more in February 2023.
The $2.5 billion of debt issued at 0.75% due in Jan 2025 (0.75 B), 1.125% due in Jan 2026 (0.75 B), and 2.15% due Jan 2031 (1 B) was used to retire Parsley and Jagged Peak debt at 4% to 6%.
Details at news release linked below
https://investors.pxd.com/news-releases/news-release-details/pioneer-natural-resources-announces-pricing-public-offering-7500
Seems a smart move to reduce interest payments.
Dennis.
I am just reporting actual costs in our field.
We are still doing a lot better financially despite the expense increases.
There isn’t any drilling going on in our field as of now. Maybe that changes this summer. We have no plans to drill in 2022. We have discussed drilling in 2023. Will see how oil prices and costs go this spring and summer.
Shallow sand,
Nice to hear that you are doing well, it would be nice if costs did not rise, but as Mike said, we live in the real world. Hope Mike is doing well also.
No big projects are possible without debt. Only small stuff – and LTO is ironically such small stuff possible.
Normal oil projects are investing billions or double digit billions of $, before one drop oil is produced. And all European societies since the median age had their economies grown on debt.
No single merchant was rich enough to supply a south sea expedition, or a new ore mine. Or not crazy enough to put all of his wealth in this one risky thing. Sharing risk and taking up money was the key for economic development. The stock market and more modern credit system was developed hand in hand for this reason.
I would claim withoud credit there still would be no oil market – all the oil industry wouldn’t have developed.
When an oil company is big enough, it can finance smaller projects by taking credit by itself. This looks like financing from cash flow, but in most big companies this is internally regulated as a credit with a cost / repay calculation. This is done to avoid too much unprofitable projects.
Eulenspiegel,
I was referring specifically to Permian basin tight oil production. Large projects (Arctic or deepwater offshore) are carried out by oil majors who have very good access to credit markets at relatively low interest rates. Smaller producers in tight oil basins can ramp up output at 10% per year by self financing from operating cash flow.
Shift from corn to soya . What does that do to the biofuel production needed as an additive or blending ?
https://finance.yahoo.com/finance/news/u-farmers-pivot-corn-soy-163048486.html
Will Liebig’s law of the minimum decide our fate ? An interesting article .
https://www.resilience.org/stories/2012-01-04/there-more-it-oil/
Kurt Cobb also focuses on the Liebig’s law and self sufficiency of nations .
https://resourceinsights.blogspot.com/2022/04/easier-said-than-done-national-self.html
Unfortunately the true horrors of war and atrocities committed by the retreating Russians is becoming apparent. I expect a policy shift by the West in all things, not just energy.
Lightsout , I will refrain from the first part to avoid fallout . But the second part ” I expect a policy shift by the West in all things, not just energy ” . Question ? What policy shift is possible ? From now over a year I am looking at problems from a three lens perspective which are Overshoot , LTG and Liebig’s law working in tandem . Always I have hit a dead end . The only solution is de growth . De growth is the only way out with minimum damage . Damage there will be no matter what path we choose . How do we convince the 7 billion that the party is over ? Read the link I just posted for a better understanding . Tks .
Dennis . In the ‘ Annual Energy Outlook ” post we had an exchange about the NG situation for industry in Germany and its effect . Here is a link you will find informative . The chief of BASF has come out and said that at 50% capacity utilisation he will have no alternative but to shutdown the world’s biggest chemical complex . That would be disastrous for the downstream industries . No paints , dyes inks, water purifying chemicals etc . I hope sanity will prevail . This announcement was made after the” Roublegas ” decree from Moscow . So very latest .
https://thehitc.com/german-industry-raises-alarm-about-energy-rationing-plan/
Hole in head,
As I said before, the nations of Europe will decide what policy is best both short term and long term. As I have suggested, Russia may be losing its best natural gas customer over the long term, that is their choice.
Dennis , ” Russia may be losing its best natural gas customer over the long term, that is their choice. ” Let me turn it at 180 degrees ” EU may be losing its best natural gas supplier over the long term ” . Ever hear about the Power of Siberia the new pipeline to be ready by 2025 to bring gas from Russia to China ? The choice is not for Moscow to make but Brussels . The world is ” peak gas ” . Who will get what is for Moscow to decide and not Brussels . Beggars can’t be choosers .
Hole in head,
An exchange is an agreement between buyer and seller, Russia is not the only gas producer, it may be that China and India will get the Russian gas, this is up to the nations involved. There may be plenty of natural gas on the market by 2025 relative to demand for natural gas. As wind, solar, hydro, geothermal and nuclear power expand the market for natural gas may shrink, we will see.
Gas and oil for gold.
The Bank of Russia, their Federal Reserve central bank, has officially offered to pay 5000 (created from thin air) rubles for 1 gram of gold. That establishes a floor for the price of gold. As long as an infinite source of money (any central bank) is willing to pay that, it can’t go lower. This extrapolated. Comex says gold is worth some number of dollars and that defined the ruble to USD (also created from thin air) exchange, which is stronger now than pre-invasion.
There is not much that can be done about that. No one will argue with an infinite source of money. Comex might try to manipulate the USD price of gold lower, but they would have to also try to manipulate the value of the ruble lower, and they would face an infinite source of money in that. No private exchange will try this, and the Fed does not have such a mandate. It would be very hard to keep such a thing covert.
GAZPROM wants rubles. Europe wants to pay in Euros. The loophole that will allow all this to happen is European buyers can indeed pay in Euros provided they open an account with GAZPROMbank. This bank is currently not sanctioned, since the energy complex was generally not sanctioned. So Euros can be deposited at that bank by the gas buyers, and the Euro/Ruble conversion will align with the price of gold, and will be determined at the Moscow FX. Note this maneuver also ensures that bank can’t be sanctioned.
Europe has generally already agreed. This allows their leaders to say they defeated Putin’s decree that they must pay in rubles, but that’s not what is happening. The gold maneuver has essentially defined the currency exchange ratio and trading won’t affect it, unless the trading is in gold — and that is a global matter with huge buyers in China and India.
It would seem inevitable this will take place with oil, too.
Watcher , thanks for going behind the curtain .
I think the folk at the RCB worked out the gold for rubles loophole precisely to avoid a trade stand off. Settle NG and Oil (or anything Russia exports and prices in rubles) in gold and no one has to deal with fiat they don’t want/don’t need/can’t use and above all DON’T TRUST.
Perhaps step one towards a new world reserve currency based in part on gold and other reserve currencies.
Check out Zoltan Pozar’s perspectives on Bretton Woods III here:
https://www.youtube.com/watch?v=q0EahFBruFA
Gold likely is head down and way down as the global bubble in dollar credit unwinds. How many times have I heard the term that you can’t taper a Ponzi scheme.
Well they did taper it and are hiking rates.
The average time between the first rate hike and the first inversion of the yield curve is 18 months.
It happened in 2 weeks this time.
Oil has a small window of time where prices can go higher and only if the Russian oil in Black Sea ports backs up and wells are forced to shut in.
We are facing straight down the barrel of a global dollar shortage. Where the dollar absolutely steam rolls the value and price of everything.
Think of it as a margin call on everything.
Well, they tapered to neutral less than a month ago and raised 0.25%. Let’s see if they can make it an entire quarter before we all exclaim how miraculous the Fed move is.
And how does dollar credit unwind hurt gold? How are you viewing gold? As inflation hedge? etc.
Global 10 year yields likely peaked last week. Judging by price action in German bunds and the yen crosses. Japanese yen follows yields. As yields rise it weakens as it is a low yielding funding currency. Yields fall yen strengthens.
Yield curve is likely to get a whole lot more inverted from here on. As FED continues rate hikes. US likely will already be in recession by 3rd or 4th rate hike.
Oil has a little more time to make new highs. But it won’t last even if it does make new higher highs.
I definitely wasn’t expecting this massive push in bond yields, but I believe you were. Do you think US 10Y has also likely peaked?
The rise in yields in my view was a reflationary move from post Covid recession and it was the weakest reflation we have ever seen after a recession. Think about it. US government spent how many trillions and the best we could do is tag 2.5% on the 10 year for about a day.
Problem is in order to spur money creation via loans made in real economy we need lower interest rates. Higher rates cut off the creation of money. FED can’t raise rates without causing a recession.
Oil is in a bubble. Bid up by cheap credit. And when the credit gets turned off the bubble deflates.
It’s not a pure price bubble – there are a lot of signs of real shortage. At least with oil products, aviation fuel shortage at the US east coast, Diesel rationing in Australia, Diesel shortage in Europe.
At the moment SPRs are already emptied – they have to be refilled sometimes again, creating new demand pressure.
Only a depression will stop this in short term by destroying demand – the FED can create a depression as easy as creating money out of nothing.
Thanks HHH // Eulen – We are seeing Disinflation in some commodities – like Lumber and Palm Oil. Crude, as you correctly said, has Real World shortages, so you would think that is adding a premium and keeping it inflated. I mean, we are 14 years into the blowing of the largest bubble in human history, so in some sense, it’s ALL a price bubble at this point. You wouldn’t know it from the euphoria of the broad indices (which still haven’t recaptured highs from Nov and Jan), but we are moving into a slow down, and with the Fed tightening and high oil prices, that’s only going to add to upcoming broad market and commodity Disinflation. I imagine this is one more head-fake to draw in retail bag-holders before Q2 reality sets in.
Special for my friends in Germany . Courtesy and permission of Dimitri Orlov Author of ” Reinventing Collapse ” , The Five Stages of Collapse ”
Europe doesn’t have any contracts for Russian natural gas
I promised to stop writing on this subject until something significant happened, and an entire day went by without anything significant, but now there’s this. German-language media has already been going crazy lately about future purchases of oil and natural gas. Since Germany is included in the list of “unfriendly countries” by Russia, it, like all the EU states, will only be allowed to purchase Russian natural gas for rubles, and not for euros or US dollars. And now comes this bit of news, which should make the German talking heads go super-double-crazy: Germany will be left without Russian gas because its contract is not with Gazprom but with its subsidiary Gazprom Germany, which Gazprom has abandoned.
Barely a day or two ago, German officials were loudly declaring that their contract with Gazprom provides for payment in euros or dollars, and therefore Germany will not pay for Russian gas in rubles. That ought to make everything perfectly clear. However, Germany’s gas supply contract is with Gazprom Germania GmbH, located in Berlin, and not with actual Gazprom, headquartered in St. Petersburg! Do the German authorities even know that these are two completely different organizations?
Gazprom Germania GmbH is the headquarters of the diversified conglomerate Gazprom Germania Group, which includes 40 enterprises operating in more than 20 countries in Europe, Asia and North America. Until Friday, it was a 100% subsidiary of the Russian Gazprom. On Friday, Gazprom pulled out of Gazprom Germania and no longer has anything to do with its former Berlin subsidiary. With that, Gazprom Germania has lost any connection to Russian gas. Worse yet, it is believed to be insolvent and likely to go bankrupt within a few weeks, at which point it will be liquidated. All of its customers will now be forced to buy gas from Gazprom Russia and it pay in… rubles. No rubles—no gas!
Having imposed anti-Russian sanctions as demanded of it by Washington, Germany has already frozen Russian foreign exchange reserves. The country’s largest gas storage facility in Rehden (Lower Saxony) is only 0.5% full—an all-time low. Until this Friday, this vault, as well as a number of other facilities located at key points in Germany’s energy infrastructure, indirectly belonged to Russia’s Gazprom—but not any more! If earlier the German government threatened to nationalize Russian gas assets on its territory, now such threats have become hollow. Germany has nothing more that it can threaten to steal from Russia to force it to keep the gas flowing.
Instead, Germany’s representatives now have to fly to St. Petersburg and negotiate a new deal with Gazprom directly, in rubles. Except that they can’t do that either! According to the Energy Charter and the Third Energy Package of the European Union, every single supplier of energy resources to the EU is required to be part of the EU legal system—perhaps not directly, but definitely through subsidiaries such as Gazprom Germania GmbH. Thus, all of Gazprom’s contracts with buyers from the European Union were signed by Gazprom Germania GmbH and its other subsidiaries. It could not have been otherwise, for otherwise the contracts would be outside the jurisdiction of the European Union and the Europeans considered this unacceptable.
But now the Europeans will need to come to Russia and sign contracts under Russian law, with payment stipulated in rubles. Of course, the European Commission will never agree to this… and now we have to wait impatiently to see just quickly this “never” will come to an end.
By the way, Rosneft Deutschland, the German subsidiary of the Russian oil giant Rosneft, is now also an orphan. It seems that Russia’s former partners (now “unfriendly nations”) are being moved not just to the gas ruble, but also to the petroruble. Given the current shortage of diesel fuel in Europe, the prospect of a petroruble is becoming much clearer than Europe would like.
Europe would like.
9
35
Suggest a visit to https://boosty.to/cluborlov
Sounds to me like the oil and gas fields that connect to the Black Sea are likely to backup and be shut in like I thought they might.
Maybe we do get that moonshot to $200 before recession kicks in.
HHH , I have pointed this out earlier , there are no ports of loading for oil or gas in the Black sea . Most of the supply of oil and gas to EU is thru pipelines . The LNG facilities are way up North out of harm’s way. All are on the North Coast of Russia and that is not the war zone . The major buyers of Russian oil are now China and India and their routing is not in the war zone . Black sea ports are important for wheat exports from Ukraine but not for Russia . Russia can still get it’s production of wheat via rail to any country in Eurasia . What we should be looking at is fertilizers and 2023 . Hug your bag of NPK ? Toto from TOD days .Hat tip to Laplander who recovered this quote . You my dear friend are missing the trees for the woods .
P.S : There are no volunteers for starvation .
Hole in head.
Never heard of the CPC terminal?
Lightsout , My mistake ,I mixed it it up with the BTS pipelines that go via Turkey . Thanks for the correction .
HHH , there is a new problem , it is legal . See what Dimitry Orlov has to say .
Oh , the webs we conceive when we start to deceive . The West is now trapped in it’s own web . This is like the FED , trapped . What was the movie ” No way out ” starring Kevin Costner and Gene Hackman . I loved Gene .
Paul Krugman’s take on Russian Rouble recovery
https://smartagain.org/2022/04/01/why-russia-is-defending-the-ruble/
Dennis , I did not read the article . No need . I have been following him from many years . You will say he won the Noble Prize for Economics . Ok accepted . Obama won the Noble prize for peace . What did he do ? Accelerated the war in Iraq , Afghanistan and then started new wars in Syria , Libya and Yemen . Sorry Dennis as my favorite comedian ( realist , satirist ) George Carlin said ” It is a club and you ain’t in it”
Hole in head,
You might learn something, he is a very good economist, but if you think you know more, that’s fine.
The analysis is good.
Agree –
Baby / bathwater.
rgds
WP
I have to say that Paul Krugman’s idea of minting a $1T coin should be emulated here in Europe.
Actually, we need several. One for surging gas prices; another for inflationary pressures on our pockets; and last but not least an especially weighty one to assist in the reconstruction of Ukraine.
I suggest 10 Troy oz Platinum/Iridium, piedfort.
Saves an awful amount of time and effort trying to expand the economy:
https://www.nytimes.com/2021/10/01/opinion/biden-coin-democrat-republican-debt-limit.html
Jonathan,
The 1 trillion coin idea was a silly idea to get around a silly law that limits debt that can be issued to keep the government solvent, no such law should have ever been passed and a new law should be passed eliminating the debt ceiling in the US. In Europe I do not believe they have such a silly requirement so no trillion dollar coin would be needed.
Quite so, Dennis. But as David Collum, in his 2021 Year in Review wrote:
“Fiscal Policy. Milton Friedman aside, there are many causes or at least influences on inflation. Drunken politicians are spending with no breaks and no guard rails. Since the beginning of government, it never runs in reverse. Federal debt is up sixfold in 20 years (9–10% annualized). Trillions spent on foreign wars, bank bailouts, and, most recently, lockdown freebies are wracking up quite the bar tab. The monetary muftis call it stimulus, but that is just a euphemism. Free money may temporarily pull consumption forward, but it isn’t holistically stimulative except in the most exceptional of circumstances. The dumbest idea (at least until the advent of NFTs) was the trillion-dollar platinum coin first proffered by the legendary purveyor of bad ideas, Paul Krugman. You mint a one-ounce coin, stamp it with “$1,000,000,000,000”, and declare the problem solved. That idea stinks so bad my dog wouldn’t roll in it. It was resurrected this year.”
A fine Pt/Ir coin for 1T€ could be hand carried to Russia for its o&g and avoid sanctions, if not customs.
Jonathan Madden,
You and Mr Collum seem to either have not read or not understood what Krugmann wrote in that piece. The problem that would have been solved was the immediate default of the US government on its debt which is what may have occurred if the debt ceiling was not raised.
This seems a good idea to some conservatives who would like to starve the government of any funds (with the exception of the US military budget). It makes for great theater and lots of Senators and Congresspersons get media attention and is a big waste of time.
Not raising the debt ceiling so that laws passed in Congress can be funded would result in default on US government debt and would cause a financial crisis.
Perhaps Mr Collum thinks that is a better idea, but the financial crisis in the US would quickly spread worldwide and most people prefer to avoid that.
For more information on why Mr Collum is wrong read some Paul Samuelson or Keynes.
“Perhaps Mr Collum thinks that is a better idea, but the financial crisis in the US would quickly spread worldwide and most people prefer to avoid that.”
Very true, although a small number of people would like to see a big financial crisis.
As long as they have advance warning and can blame someone else.
U.S. Wants More Oil From Canada but Not a New Pipeline to Bring It
Biden administration officials are seeking ways to boost oil imports from Canada, people familiar with the situation say, but with one big caveat—they don’t want to resurrect the Keystone XL pipeline that President Biden effectively killed on his first day in office.
https://www.wsj.com/articles/u-s-wants-more-oil-from-canada-but-not-a-new-pipeline-to-bring-it-11649163668
Can someone post a summary of this article.
Some background. The Canadian PM and the Ministry of Environment are trying to shut down the oil sands because of CC and also limit their expansion. Pipeline capacity to the US is limited because Obama and Biden killed Keystone XL twice plus fierce opposition from activists.
Michigan Governor Whitmore wants to shut down Line 5 which supplies both Canadian and US. Refineries. The Biden administration does not want to ask Whitmore to back off . Canada has invoked a treaty which says governments cannot interfere with oil flows between Canada and the U.S. and the case is stalled in court.
Enbridge wants to build a tunnel under Line 5 where it crosses the straits of Mackinac and reroute the pipeline through the tunnel. The US army has been asked to do a full environmental review of this proposal, adding more delay to building the tunnel.
Beware of the fickle finger of fate.
As far as you know Ovi, is there actual constraint on getting Canada oil transported from the production sites to refineries or export terminals? Is oil production, or industry growth, being curtailed because of lack of export capacity?
Hickory,
I don’t think there is a lot of pipeline capacity from Alberta to either the Pacific or Atlantic coasts, or not nearly enough, capacity is also limited to connect with US pipelines to move Alberta crude to the Gulf coast, that is the reason that the Keystone XL pipeline was proposed.
It was likely a bad move to shut it down, Biden kind of shot himself in the foot on this one, he could have “studied the issue” and let it remain bogged down in the courts in the mean time. He made this “bold move” to appease the left wing of the Democratic party, usually not a good idea.
Better to have negotiated with Republicans and get an agreement on Build Back Better (or some compromise) in return for approval of the Keystone XL, I suppose it might still be an option, but it is a bad look politically at this point, so it probably won’t happen.
Iraqi production is also falling substantially and OPEC+ won’t come within a country mile of producing its quota:
https://oilprice.com/Energy/Crude-Oil/Iraqi-Oil-Production-Sinks-Far-Below-Quota-In-March.html
“ Iraq produced just 4.15 million bpd in March.
Iraq’s crude oil production was down by 112,000 bpd last month.
Most OPEC members continue to underperform in reaching their agreed-upon targets.”
I read somewhere they planned a big maintaince pause on one oil field to increase it’s capacity. Perhaps this is now.
Blast from the past for those who found out last month where to put ukraine on the map and who didn’t give a shit about what happened there in the last 8 years.
https://archive.ph/NAXCc#selection-491.0-491.100
Head of Stratfor, ‘Private CIA,’ Says Overthrow of Yanukovych Was ‘The Most Blatant Coup in History’
Friedman further says that “The Russian authorities can not tolerate a situation in which western armed forces will be [in Ukraine] a hundred kilometers from Kursk or Voronezh [in Russia]”, and that the goal of the U.S. is to “maintain the balance of power in Europe, helping the weaker party,” which he says is Europe. He furthermore says, “The United States considers the most dangerous potential alliance to be between Russia and Germany. This would be an alliance of German technology and capital with Russian natural and human resources.” So: the U.S. is trying to antagonize Germans against Russia. This will weaken both of them. However, that would be not a “balance of power” but an increasing imbalance of power in favor of the United States.
Remember that Kommersant is considered a ” liberal ” paper in Russia.
The biggest loser of this is the EU whose economy is gonna be sacrificed.
Like Nuland said Fuck the EU!
https://www.youtube.com/watch?v=bdygnTrrGVI
Another one bites the dust .
https://www.tirebusiness.com/russia-war-ukraine/michelin-suspending-production-some-european-plants
A must watch 6.27 minute video on Russian oil. If you think Russian oil is just going to keep flowing, you had better think again after watching this video. Actually, this video came out two weeks ago. But if it has been posted here before I missed it. But even if it was posted before, it need another look.
Russian Oil’s Vanishing Act
And another 4 minute video from the same Russian oil analyst.
Russian Refineries’ Reduced Runs
So that’s behind the coordinated SPR release. And this release isn’t very “loud”, to not stir up panic buys.
4 mbpd missing on the market – and when they have to stop production in some fields, it will be hard to restart as far as I know from Shallow on conventional fields.
That’s looks for high oil prices the next years to come – even when this crisis resolves – and it won’t be fast I think after the massacres – at the end all the SPRs will have to refill, putting new stress on the system.
The Strategic Petroleum Reserves may not be refilled.
It will be every expensive.
Thanks Ron,
I agree these are well worth watching.
Watched them. Back in March when they came out.
4% reduction of global supply would have spiked oil to $200. Didn’t happen. The guy is likely bogus.
Why do you have to inspect every mile of pipeline, and if you did, why isn’t that done daily anyway by small airplane, as is done for Alyeska? It was that assertion that set off bogus warning signals. The original talk about this video some weeks ago was that such an activity faced leaks requiring months to repair. Alaska reports about 900 leaks per week and they don’t stop anything.
As for indemnification, anyone can indemnify anything. It doesn’t have to be Lloyds. In fact, if Chinese insurance winds up the indemnity, it will stay that way after the war. This is going to lose that business permanently.
Watcher, I am a little puzzled by your reply. The man did not say 4 million barrels per day was offline; he said it would likely happen soon. And it likely will. But I don’t think it will drive prices to $200 a barrel. I don’t know where you pulled that one from.
And the pipelines in Siberia bear no resemblance to the Alaskan pipeline. Every inch of the Alaskan pipeline is insulated and heated: The lines are warm to the touch and even warmer to the wallet — at current prices, about $30 million worth of crude flows through the station daily. Alyeska heats oil at Pump Station One to 100 degrees Fahrenheit, with a goal of keeping it above 37 degrees by the time it reaches the export terminal at Valdez, Alaska. The Alaskan pipeline is shut down for maintenance only in the summer. It would likely be disastrous if it were ever shut down over an entire winter.
And about those 900 leaks per week in Alaska? Along the pipeline??? Got a link for that bit of weekly disaster? I damn sure need one.
One more thing. I found this guy extraordinarily knowledgeable and articulate.
Ron,
I agree. There are often comments from people with very little oil industry knowledge. Likely that is true in this case.
https://www.csmonitor.com/2006/0809/p02s01-usgn.html This quoted 500 per year and it’s old. There was a study I stumbled on extrapolating that number to 900/week for much smaller magnitude leaks, some of them underground, in order to get the quote up. It was some envirowacko with agenda study. Didn’t save it, will find it. None of which really matters because there is no reason to think Russia doesn’t have the same tech for detection (and helicopters or small planes).
The guy said 4 mbpd would soon be offline. If the market believed that to be so, $200 is reasonable. Didn’t happen so the market don’t believe it. Oh, there was also a breathless announcement that output levels took 30 years to reach Soviet levels. Probably easier to make a case for all that by assessing the odds the Soviets quoted higher than reality.
Now about that indemnification, which is what really matters.
Found this while looking for Watcher’s 900 weekly leaks along the Alaskan oil pipeline. Bold mine.
Leak is latest of Alaska’s pipeline woes
Some 500 spills a year occur in the Prudhoe Bay oil fields and along the 800-mile, three-decade-old pipeline system. August 9, 2006
When oil began flowing south from Alaska’s North Slope to the port at Valdez nearly 30 years ago, it was a new era for US energy production and distribution. From the start, it was a technologically daring and politically controversial project. As evidenced by this week’s shutdown of a portion of pipeline in the Prudhoe Bay oil field due to a spill, it remains so today.
Despite what industry supporters say are more environmentally friendly ways of detecting and extracting oil from the North Slope today, the means of transporting the liquid gold south is old and – critics say – becoming dangerously decrepit. In some places pipeline walls have lost as much as 80 percent of their thickness as a result of corrosion, industry officials say.
If it was that bad in 2006 it must be ready to collapse now.But I would bet most of the leaks, about 9.5 per week, not 900, are in the Prudhoe Bay oil fields, not along the pipeline. But if any are reported along the pipeline, they must be repaired immediately. Any oil spills cannot be tolerated along the pipeline.
Cool, yes that was the original thing. It was grabbed by some enviros and they did projections of tiny leaks out of the compromised pipes. They wanted it all shut down, of course, and elevated the number. I think to something like 898.7 or something, to impress with precision. I will get around to finding it.
And . . . I think the guy relied on hoses feeding the pipes to get his numbers up. There was something about housing around connections and micro leaks there. blah blah
Canada Approves Controversial Bay du Nord Oil Project
Megaproject off eastern Newfoundland may go into production as early as 2028
Norwegian oil company Equinor and its partners plan to develop the oil field at the Flemish Pass, about 500 kilometres east of St. John’s. Bay du Nord will be the first project to move the offshore oil industry into such deep waters, with drilling to go more than a kilometre underwater.
The Equinor plan is to use a massive floating production, storage and offloading vessel, commonly known as an FPSO, capable of producing up to 200,000 barrels daily.
https://www.cbc.ca/news/canada/newfoundland-labrador/bay-du-nord-approval-1.6410509
This field contains an estimated 300 million barrels of oil.
One Billion Barrels Possible
Norway energy giant Equinor first proposed the Bay du Nord development for the Flemish Pass Basin, about 500 kilometres off the coast of St. John’s, four years ago. Originally set to tap up to 300 million barrels of oil over a 30-year lifespan, Bay du Nord could produce closer to one billion barrels through potential tie-in projects because of nearby discoveries in 2020.
https://www.theglobeandmail.com/politics/article-ottawa-approves-bay-du-nord-oil-development-off-coast-of-newfoundland/
Ovi , anything new offshore is now not going to be devolped . Too expensive ( unaffordable) . It will remain underwater .
Dennis.
I continue to be interested in examining Lower 48 conventional.
I have been reviewing a lot of conventional assets that are for sale. A lot have recently come on the market due to the oil price spike.
One package I was looking at has a lot of Grayburg and San Andres wells in Reagan and Crockett Counties, Texas. As I recall, those are shallow wells.
I noticed many of the wells were shut in. I also noticed that the seller had AFE’s for doing workovers on some. I was seeing over $20k AFE for things like repairing a down hole pump, a tubing leak or parted rods.
These AFE seemed extremely high for shallow conventional wells.
Maybe due to supply shortages and labor constraints, costs have gotten so high in some basins that shallow, low volume wells just aren’t being timely worked over, thus resulting in a production drop despite high prices.
Maybe someone here who knows something about those kinds of wells in those counties could comment? I assume those wells are 3-4,000’? $20k seems extremely high for routine workover?
Thanks for the info Shallow Sand.
I knows far less than you, Mr Shellman would obviously know infinitely more than me.
Hope he will enlighten us.
Or you could pose the question at oily stuff.
I did ask him about the apparent drop in conventional, but may not have been clear.
Shallow sand,
Found some info on San Andres formation, see link below
https://www.co2conference.net/wp-content/uploads/2016/12/8-Worrall-Manzano-Platang-Field-Horizontal-Play.pdf
depth is about 4600 feet (4300 to 5000 feet).
I have no idea what this means in terms of costs, but I assume deeper wells are more expensive to maintain.
Note these depths are in the Delaware basin, Midland may be different, Grayburg is 2400 to 2800 feet deep in Midland. San Andres is mostly in central basin platform (between midland and delaware basins and is about 1300 feet thick, it is beneath the Grayburg and would be at least 2800 and perhaps more than 4000 feet deep (not sure how much rock is between Grayburg and San Andres.
You no doubt know most of this.
https://www.enverus.com/permian-basin/midland-basin/
https://ngmdb.usgs.gov/Geolex/UnitRefs/GrayburgRefs_8470.html
This last paper
https://onepetro.org/SPEPBOGR/proceedings/65PBOR/All-65PBOR/SPE-1145-MS/159724
gives an estimate of 1500 feet to 6000 feet for San Andres.
Last link is interesting, but no depths given
https://www.beg.utexas.edu/resprog/permianbasin/data/posters/FuhrmanMascho_field/FMU_SanAndres_poster1_1.pdf
Dennis. Was able to hear from some pros in the area.
Those wells are less than 3,000’. Makes sense given the size of the pumping units, which was info provided.
Dennis, highly anecdotal. Would be cool if we could hear from boots on the ground in the Permian regarding the status of conventional production there.
Shallow Sand,
Yes it would be great to hear from anyone in Texas about the apparent drop in conventional oil output (14%) in Jan 2022. Did the pros in the area confirm that those AFE’s you referred to above were reasonable estimates currently in that part of Texas?
Dennis.
Yes they did. Rig rates are extreme.
I am finding out in the Permian that the service companies have mostly “went big” and there simply aren’t enough rigs to service the thousands upon thousands of stripper wells.
Apparently $15k at minimum to get a rig. That simply won’t work for a shallow well making 1-2 barrels per day, of which there are tens of thousands throughout the Permian Basin.
It sounds like shale is sucking up all the resources in the Permian, making operating conventional there very difficult.
I’d like to hear from others on this. I sure hope we aren’t destroying our conventional base, that just makes things even more dicey as we plow through the remaining Tier 1 shale locations.
I am seeing a lot of conventional Permian production hitting the market all of the sudden. Not sure why, maybe service issues are forcing this?
Russian oil production down to 10.6 million bpd on March 31st.
Russia delays publication of monthly oil and gas output data, clients say Bold mine.
April 4 (Reuters) – A Russian analytical unit affiliated with the Energy Ministry did not publish monthly oil and gas output data on April 2, according to two clients, the first delay in years amid reports of a production decline.
The Energy Ministry and CDU TEK, which describes itself a permanent member of the task force for monitoring production and consumption of oil products in Russia, did not respond to requests for comment.
CDU TEK usually publishes monthly oil and gas production data on the second day of each month.
Russia’s Interfax news agency, citing CDU TEK, said in a note to its clients on Monday that publication was delayed amid ‘technical issues’ experienced by the data provider.
According to two industry sources familiar with the data, Russia’s oil and gas condensate production fell to 11.01 million barrels per day (bpd) in March, from an average output of 11.08 bpd in February.
On March 31 output hit its lowest daily level since September at 10.6 million bpd, the sources said.
Russia struggled to place some of its barrels last month amid cancellations by buyers.
https://oilprice.com/Latest-Energy-News/World-News/Russia-Sees-Steepest-Oil-Production-Decline-Since-May-2020-In-Early-April.html
Russia could lose 30% of its oil output within weeks, IEA warns
London (CNN Business)Russia could soon be forced to curtail crude oil production by 30%, subjecting the global economy to the biggest supply crisis in decades — that is, unless Saudi Arabia and other major energy exporters start pumping more.
The world’s second-largest crude oil exporter could be forced to limit output by 3 million barrels per day in April, the International Energy Agency warned on Wednesday, as major oil companies, trading houses and shipping companies shun its exports and demand in Russia slumps. Russia was pumping about 10 million barrels of crude per day, and exporting about half of that, before it invaded Ukraine.
“The implications of a potential loss of Russian oil exports to global markets cannot be understated,” the IEA said in its monthly report. The crisis could bring lasting changes to energy markets, it added.
Canada, the United States, the United Kingdom and Australia have banned imports of Russian oil, affecting roughly 13% of Russia’s exports. But moves by major oil companies and global banks to stop dealing with Moscow following the invasion are forcing Russia to offer its crude at a huge discount.
Big Western oil companies have abandoned joint ventures and partnerships in Russia, and halted new projects. The European Union on Tuesday announced a ban on investment in Russia’s energy industry.
The IEA, which monitors energy market trends for the world’s richest nations, said that refiners are now scrambling to find alternative supply sources. They could be forced to reduce their activity just as global consumers are hit with higher gasoline prices.
There is a lot more to this article if you care to read it. But 30% of their production is 3 million barrels per day. That is very serious!
Middle East is not the place to look at for European re-supply
https://www.vortexa.com/insight/middle-east-is-not-the-place-to-look-at-for-european-resupply
OPEC+ crude production falls as sanctions take bite out of Russia: S&P Global survey
https://www.spglobal.com/commodity-insights/en/market-insights/latest-news/oil/040722-opec-crude-production-falls-as-sanctions-take-bite-out-of-russia-s-p-global-survey
Nigerian oil minister admits OPEC is tapped out:
“If there is anything we can do to produce more, OPEC will be the first to produce more. But unfortunately, this capacity doesn’t exist in most OPEC countries,” he told Anadolu Agency.
https://oilprice.com/Latest-Energy-News/World-News/Nigeria-Says-OPEC-Is-Out-of-Spare-Capacity.html
Another indication that we are probably post peak is this from JPT: https://jpt.spe.org/is-it-twilight-for-deepwater-us-gulf-megaprojects, proposing that the GoM may be seeing the last few stand-alone (i.e. 50+kbeod) projects.
Wow, that’s big news.
With USA struggling to raise production and Russia’s issues, we were relying on OPEC’s spare capacity to bridge the gap. If confirmed, OPEC’s unability to raise production would mean peak oil is way passed.
Lately, market tightness has been mitigated by China’s lockdown but that could end soon.
From a French perspective, I expect the next few months to be grimer than this spring.
HHH, who will buy the treasuries ? Japan current account deficit , Europe current account deficit . Middle East and China are surely having two thoughts after confiscation of Russian reserves . Any thoughts ?
Regulatory answer for that. Financial institutions will be required to hold a lot more government debt on their balance sheets. They will have to sell something else to do it though.
FED is going to crush inflation via recession/depression. We going to get a massively strong dollar that wipes out any advantage higher oil and commodity prices give producers.
FED is hiking rates into an inverted yield curve. They have never to my knowledge done that.
Everyday it seems we are teetering towards a “Synchronized System Failure” (David Korowitz) . China collapsing due to Covid , Europe collapsing because of war and USA collapsing at the end of the financial bubble cycle . All in unison . A perfect storm .
Dennis. Another thought on US Lower 48 conventional.
When oil prices first took off around 2005, many publicly traded MLP were formed to operate lower 48 conventional production. I think all of these went bankrupt post 2014 crash, although that was a long, drawn out process.
I recalled some of the assets they operated in Texas and looked those up. Production has really dropped, and there seems to also be a much steeper drop following the 2020 crash.
Again, all anecdotal, which I know I do too much of.
Just maybe too little investment in conventional fields. I know where I am that has been the case, and I have mentioned that here many times.
Makes me think we could really see Russian oil production fall and not recover, given its similarities to US lower 48 conventional.
I have seen some state Russian oil was like US lower 48 conventional was in the 1960’s development wise. This was stated about ten years ago. So, has Russian oil now hit where US lower 48 was in the early 1970’s?
I have also seen some claim Russia can grow a lot more.
Thanks shallow sand,
Anecdotal evidence is fine, we just add it to the statistical evidence we have from the EIA, shale profile, and RRC.
Seems unusual that it would happen all at once in a single month. I have the impression from you that despite the lack of investment in your area, the conventional output has been declining very slowly (with the exception of the negative oil price event in April 2020 when there may have been a temporary steep drop in output as production was held back due to uncertainty until June 2020. I may have this wrong, please correct me, there was also the big drop in Feb 2021 due to the severe winter storm in the Southwest and loss of power in much of Texas that month ( for 10 days maybe, I forget the details). My guess is that there might have been a small drop in conventional onshore L48 output in Jan 2022, but likely only 25% (or less) of the level indicated by current EIA estimates. We will know more by June 2, 2022 when current estimates have been revised and will likely be more accurate.
Dennis.
I’m having trouble understanding the reasons for the choppiness.
I’ve had a little more discussion with some pros in the Permian. Rig rates are extremely high, to the point where it would be tough to pay that kind of $$ to repair a stripper well. I know if those rates were the norm in our field, it would be cost prohibitive even now.
April, 2020 damaged conventional lower 48 it appears. I have reviewed a lot of Texas leases, and for the ones that appear to have been shut in during April-May, 2020, very few have returned to anywhere close to before that collapse.
Shallow sand,
Interesting thanks. Using shale profile tight oil supply estimate for Texas and subtracting that from The EIA estimate for Texas suggests that from April 2021 to December 2021 Texas conventional was pretty steady at 670 to 710 kb/d, the drop in January may just be a poor estimate for that month by the EIA. Thank you for providing such great inside information that only an oil pro could get.
LNG factoids:
There exist about 550 ships in the world that carry LNG.
They have a wide range in cargo capacity from 40K cubic meters to 260K cubic meters.
The vast majority of these are deployed to Asia
On a typical 20 day trip, 6% of cargo boils off to gas, despite best efforts at insulation
The newest (few) ships have reliquification facility to slow this, that are powered by either
oil or natgas
Europe is looking to replace 175 billion cubic meters per year of gas from Russia
At an average capacity of, post boil-off . . . call it 175K cubic meters per ship this is 10,000
deliveries per year from whatever source having available excess capacity beyond current sales.
Note there are about 20 European LNG ports and only 3 (all in Spain) are not already operating at capacity. 5% of Russian gas arrives in Europe by LNG so not much import capacity is freed
10,000 deliveries with all 550 ships already employed full time, mostly to Asia.
Someone has not thought this situation through for winter 2022/2023
Watcher , you are correct . Europe is commiting ” harakiri ” . The leaders of the West are
1. Joe Biden ( the lesser said the better )
2. BoJo ( badly needs a haircut , needs to zip up his trousers and needs change from a belt to suspenders to keep his pants up )
3 . Scholtz ; Who is he ?
4. Macron , the midget .
5 . Ursula whatsoever head of EU . Gynecologist , mother of 7 children . Overshoot ? She did it .
The people get the leaders they deserve .
Pepe Escobar on the suicide of Europe . Interesting is the intricacies of a LNG shipment pointed out in this article .
https://thecradle.co/Article/columns/8853
I found this interesting from the article of Pepe Escobar . The complexity of the transaction .
”It was up to Chinese energy expert Fu Chengyu to offer a concise explanation of why the EU drive of replacing Russian gas with American LNG is, well, a pipe dream. Essentially the US offer is “too limited and too costly.”
Fu Chengyu showed how a lengthy, tricky process depends on four contracts: between the gas developer and the LNG company; between the LNG company and the buyer company; between the LNG buyer and the cargo company (which builds vessels); and between the buyer and the end user.
“Each contract,” he pointed out, “takes a long time to finish. Without all these signed contracts, no party will invest – be it investment on infrastructure or gas field development.” So actual delivery of American LNG to Europe assumes all these interconnected resources are available – and moving like clockwork.
And what of Russia? How much of the pipeline gas now going to Europe can go elsewhere- what alternative unused pipeline or liquefaction/port facility capacity do they have for export?
I’ve not found much good information on Russian alternatives.
“Ferreira says that Russia’s only realistic option for gas [export to] in Asia will be via existing or new pipelines between China and western Siberia. “That’s going to take a while. So there is no short-term solution for Russian gas. You’re going to have to shut it in,” he said.
https://www.dw.com/en/if-europe-is-done-with-russian-energy-where-will-moscow-sell-its-oil-and-gas/a-61386880
Currently Russia has LNG export capacity equal to about 5.1% of the gas it sends to Europe via pipeline. And that capacity is already fully utilized. It takes a long time (and money) to ramp up production and shipping, as Watcher pointed out.
How long does it take to build new pipeline capacity of that magnitude?
Where else can Russia sell?
Well, let’s first keep in mind no one in Russia is going cold this coming winter, or will have a starvation problem. Once you recognize that, you realize that things not sold to Europe means they don’t collect some pieces of paper with ink printed on them, created from thin air by the ECB.
But beyond that, there is China. Projected consumption to 430 billion cubic meters for 2022 with domestic production at about 150. Building LNG ports hand over fist. (Note 5% of Russian gas to Europe arrives as LNG, so Russia certainly has LNG liquification facilities to send ships to China). China’s gas consumption growth is mind boggling. As of now, their pipeline imports (all from Russia) is about 60 billion cubic meters and projected to 100 by 2025.
Now let’s look at India. 70 billion cubic meters consumption this year, about 45% of that covered by domestic production. So they will import 31 billion cubic meters. Combination of Iran and Qatar, mostly LNG. If Qatar wants to help Europe, then Russia will bid to replace them and get friendly preference over Australia.
Russia will make less money from gas. Not zero. Not even close to zero. No one will starve. No one will freeze. People are making big errors in judgement with this demonization of Russia. I can’t even imagine how they could apologize their way out.
So it sounds like the Russian gas production that flows to Europe will either keep flowing as it is now, or Russia will have to shut about 95% of it in.
Tough choices for everyone.
Hickory,
My guess is that it will continue to flow in the short term, as other nations ramp up LNG export capacity and import capacity is built in Europe, along with more LNG tankers (a long term process) Europe may move away from Russian natural gas while Russia may build new pipelines or install LNG export capacity to send their natural gas elsewhere (India, China, Africa, etc).
It will take a long time to ramp up gas export capacity/facilities.
At this point, I don’t see an easy out of this conflict for either country.
It will flow; watch what they do, not what they say. As the saying goes, who cries Uncle first.
Yep.
“People are making big errors in judgement with this demonization of Russia. I can’t even imagine how they could apologize their way out.”
Yeh, I can’t imagine how Putin could apologize his way out of his epic and cruel mistake.
People will see it as a hollow and feeble gesture.
Another possibility to to defeat them so totally that they are the ones apologizing. (minus Putin)
The whole “USA to the rescue with LNG” is complete bonkers. New world scale LNG facilities take about 5yrs to build from permit to “in-service” and cost billions of dollars even before the latest inflation. We’re designing a tiny liquefier to reliquefy boil off gas and it was originally quoted at $40M during FEED but the price is now up to $68M with the latest inflation data.
One company who does stand to do well with this is Venture Global. They have something like 70MTPA worth of LNG projects in planning and construction phases. They should have little trouble getting firm takeaway capacity for the rest of it now. But even plaquemines still has a long row to hoe before it makes first liquid.
My favorite part of it is that it’s going to have a large impact on US gas prices for heating and electric generation. We’re already exporting about 1.5 days worth of our entire shale gas each week. This will only increase and cause prices to rise toward the world market. Might be a good time to consider solar for your home before the kwh hikes really start.
The problem we are running into know is the facilities are all poaching each other’s employees. It’s a niche industry with zero US experience up until recently so anybody with experience can write their own ticket.
Interesting re poaching. This is always an amusing thing when one hears that PetroChina or Rosneft lack drilling expertise or fracking expertise. An ad in Houston Craigslist offering double pay solves that pretty much instantly.
But the general error here is this talk of planning for the future and what happens in X years.
No. The future is NOW. Europe is going to freeze in 8 months unless they find some way to apologize for their behavior towards Russia, and that certainly seems inconceivable right now. Hell, it seems inconceivable any time in X years time. None of their politicians could dare such a thing without getting voted out.
I see no solution. Maybe beg for charitable donations of gas from Russia, but there certainly will be a price of some kind.
What were they thinking? How could they make this error?
My specialty as an EE is islanded isochronous generation control systems (which covers many LNG facilities). In early may I have to go spend a week at one of our smaller liquefaction facilities because they are being forced to tear out their entire GCS because….it runs Russian firmware. To be fair, the system is crap and it’s had problems for years now but things are getting out of control (literally and figuratively maybe). Apparently it’s a state department directive for CEI I’m told but I’m sure there are some capital equipment tax write-offs tied up in the whole deal so it saves some money.
Europe is going to freeze in 8 months unless they find some way to apologize for their behavior towards Russia
That’s some ardent Putin apologetics, enough to earn you a gold star as a Hero of the Russian Federation.
Invading the Ukraine was a defacto declaration of war against Europe. Fantasies about forcing Europe into submission by freezing the populace to death are unlikely to bear fruit.
The belief that terrorizing the civilian populace can win wars is a common error made by overconfident invaders, usually as a compensation for military weakness.
So an EU delegation and the clown BoJo come down to Kiev to meet Zelensky by train . F*** , I thought Kiev was under siege . There are supposed to be bombings and artillery fire in that area . If it is so safe that these guys can come in by rail then what the heck are the 10 million refugees running away from ? Make’s me go hmmm .
Hole in head,
You have not been paying attention.
Correcting the math:
Lng to gas ratio is 600, so your tanker transports round about 100 million cubic meters.
So it’s “only” 1700 tankers per year, absolute possible and addional capcities to asia are free. Giving onshore capacities (Netherlands, Norway and some small ones) and a little coal replacement 1000 should be enough.
They are driving with gas, so most tankers use the boil off to power the engines instead of using oil. But keeping more gas is better, especially when they have to wait somewhere.
So no apocalyse here, just a little chaos like everywhere.
Thanks Eulenspiegel,
Many seem to forget that LNG is much lower volume than piped gas, this mistake is repeated often here, thanks for catching that. An average ship caries about 150,000 cubic meters of LNG, this gas expands by a factor of 600 when changing from liquid to Gas state so to 90 million cubic meters per tanker and about 150 billion cubic meters of natural gas imported per year, so about 1667 tankers per year needed about 5 per day, it is unclear if Europe has the import capacity needed.
Article below suggests about 150 BCF of regasification capacity throughout Europe, and about half of this was used in 2020, so about 75 BCF of excess capacity enough to meet half of the gas received by Europe from Russia. Longer term, Europe can cut consumption of natural gas and increase output from wind, solar, nuclear power, and coal to reduce dependence on Russian natural gas until more LNG import capacity is built.
https://storymaps.arcgis.com/stories/3f3ff30bf1804150878f128aa5e63552
LOL .
OPEC does not have the capacity to boost production according to the Nigerian minister.
https://www.aa.com.tr/en/economy/opec-does-not-have-capacity-to-boost-production-nigerian-minister/2558693
Watch what they do, not what they say. We will soon see what they can do.
Shunned Oil Piling Up Off China as Virus Outbreak Worsens-
“Tankers carrying 22 million barrels of Russian, Iranian and Venezuelan oil are piling up off China, according to Kpler, as the country battles a virus outbreak that’s sapping demand and causing logistics problems. China has been one of the only buyers of sanctioned Iranian and Venezuelan oil over the last few years. The world’s largest crude importer is also still taking Russian supplies that are being largely shunned since the invasion of Ukraine. The trade in the discounted oil is now being disrupted by the country’s worsening virus outbreak , with waiting times to unload ships increasing. Kpler estimates that daily oil demand will drop by at least 450,000 barrels in April, mainly due to falling consumption of gasoline and jet fuel, according to Jane Xie, a senior oil analyst at the data and analytics firm in Singapore. “The ongoing lockdowns in China are definitely having a..”
China is on verge of outright deflation. They have massive debt bubbles teetering on implosion. They need to cut interest rates. But yields in China are about to fall below yields in US now.
Which is a problem for China. Hot money flows into China in search of yield. Bids up the yuan. That is going to reverse. And eventually they will have to sell their FX reserves mainly dollar’s in the form of US treasuries to defend their currency peg.
We can add deflationary shock coming out of China to the headwinds oil and other commodities are facing. Inflation will likely disappear a lot quicker than people are counting on.
I see the supply chain chaos here.
Tankers piling up means tanker leasing prices shoot up into the sky, oil transport is disrupted. Projects can’t be finished because some small gadget from China got stock in Shanghai.
I see already big construction delays from companies here – that’s inflationary. It’s all a big mess. And part of this mess are the China corona policy (not corona itself). As here – the corona quarantines of tested but without symptom workers creates a lot of chaos, too.
HHH,
China can choose not to defend the currency peg and let their currency float like most major economies.
How long before we hit bottom ?
sustainable ?
Hole in head,
When the area under the curve above the x axis is equal to the area below the curve after the curve falls below the X axis then stocks will be equal to the level on December 2019 (which were relatively high at the time which was the reason thatt OPEC had cut production starting in Jan 2019 and that oil prices were relatively low during 2019.
Also not that high oil prices and lock downs in China will tend to reduce consumption of oil while encouraging more rapid development of oil resources.
Despite the title on the chart, stocks are not critically low by long term historical standards, note that the recent 5 year average stock level was pushed up by the huge increase in 2020 as well as the surplus in 2015-2017.
In Jan 2016 the previous 5 year average (2011-2015) for days of forward supply for OECD commercial petroleum stocks was 58.5 days( from March 2016 MOMR by OPEC). In January 2022 the days of forward supply for OECD commercial petroleum stocks was 59.3 days (from March 2022 MOMR by OPEC.) Stock levels for the most recent month reported (Jan 2022) are not critically low, they have returned to roughly normal levels from a severe surplus in 2020 due to the pandemic crash in oil consumption.
Note also we do not have good visibility on oil stocks held by the non-OECD, China and India probably hold considerable oil stocks that do not get reported.
Chart from November MOMR report suggests that in September 2021 World Oil stocks were about 7500 to 8000 million barrels, OECD commercial stocks were about 35-40% of the total.
New posts will be up later today.
A new thread reporting on Non-OPEC production has been posted.
https://peakoilbarrel.com/non-opec-december-oil-production-drifts-lower/
A new Open thread Non-Petroleum has been posted.
https://peakoilbarrel.com/open-thread-non-petroleum-april-9-2022/