A guest post by Ovi
Below are a number of crude oil plus condensate (C + C ) production charts for Non-OPEC countries created from data provided by the EIA’s International Energy Statistics and updated to December 2021. This is the latest and most detailed world oil information available. Information from other sources such as OPEC, the STEO and country specific sites such as Russia, Brazil, Norway and China is used to provide a short term outlook for future output and direction for a few countries and the world.
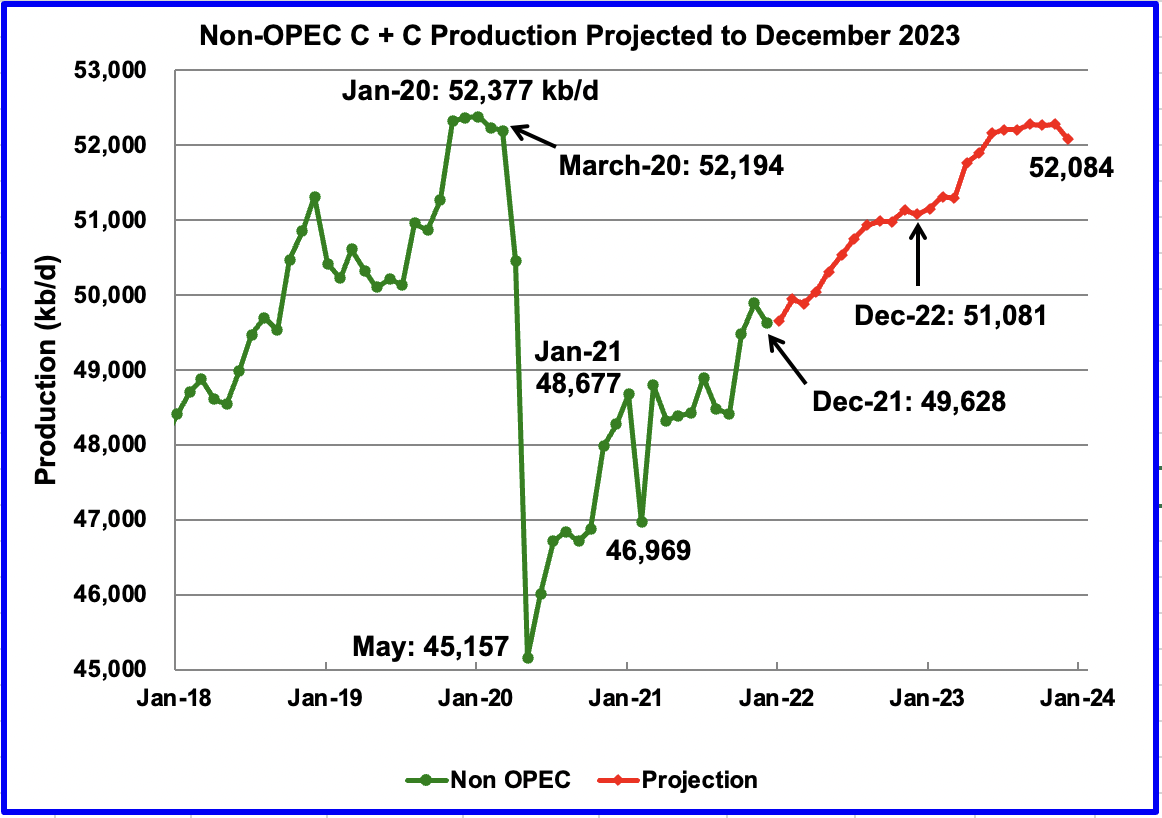
December Non-OPEC production decreased by 261 kb/d to 49,628 kb/d. Of the 261 kb/d decrease, the biggest decreases came from the US 205 kb/d, Brazil 113 kb/d and China 91 kb/d. Offsetting the decreases were increases from Norway, 117 kb/d and Guyana 86 kb/d.
The December 2021 output of 49,628 kb/d is 2,566 kb/d lower than the March pre-covid rate of 52,194 kb/d.
Using data from the March 2022 STEO, a projection for Non-OPEC oil output was made for the time period January 2022 to December 2023 (Red graph). Output is expected to reach 52,084 kb/d in December 2023, which is 293 kb/d lower than the January pre-covid peak of 52,377 kb/d.
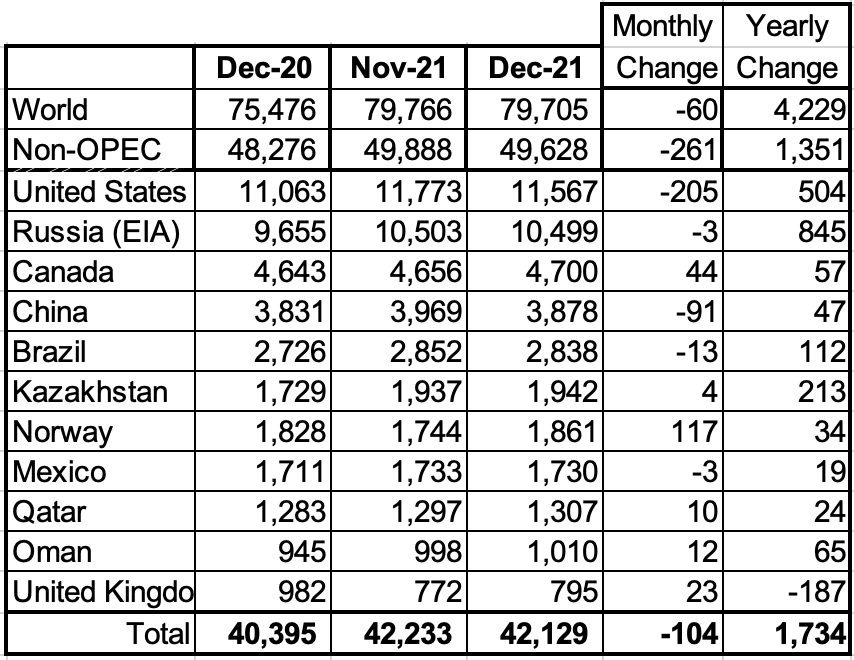
Above are listed the world’s 11th largest Non-OPEC producers. The original criteria for inclusion in the table was that all of the countries produced more than 1,000 kb/d. The UK has currently fallen below 1,000 kb/d.
In December, these 11 countries produced 84.9% of the Non-OPEC output. On a YoY basis, Non-OPEC production increased by 1,351 kb/d while on a MoM basis production it decreased by 261 kb/d to 49,628 kb/d. World YoY December output increased by 4,229 kb/d.
Production by Country
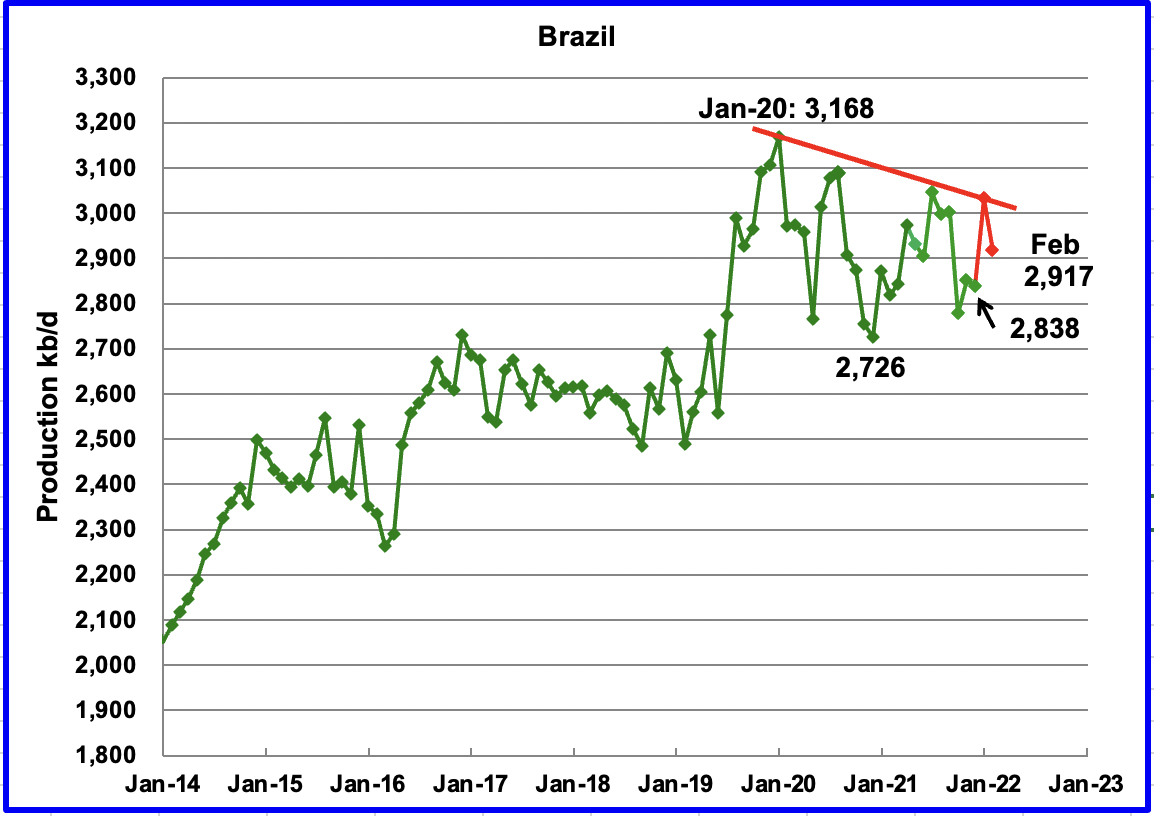
The EIA reported Brazil’s December production decreased by 13 kb/d to 2,838 kb/d. Brazil’s National Petroleum Association reported that February’s output declined to 2,917 kb/d after January increased to 3,032 kb/d. (Red Markers).
Brazil continues to experience difficulties in increasing its yearly output. However according to the IEA, production in 2022 is expected to exceed 3,000 kb/d.
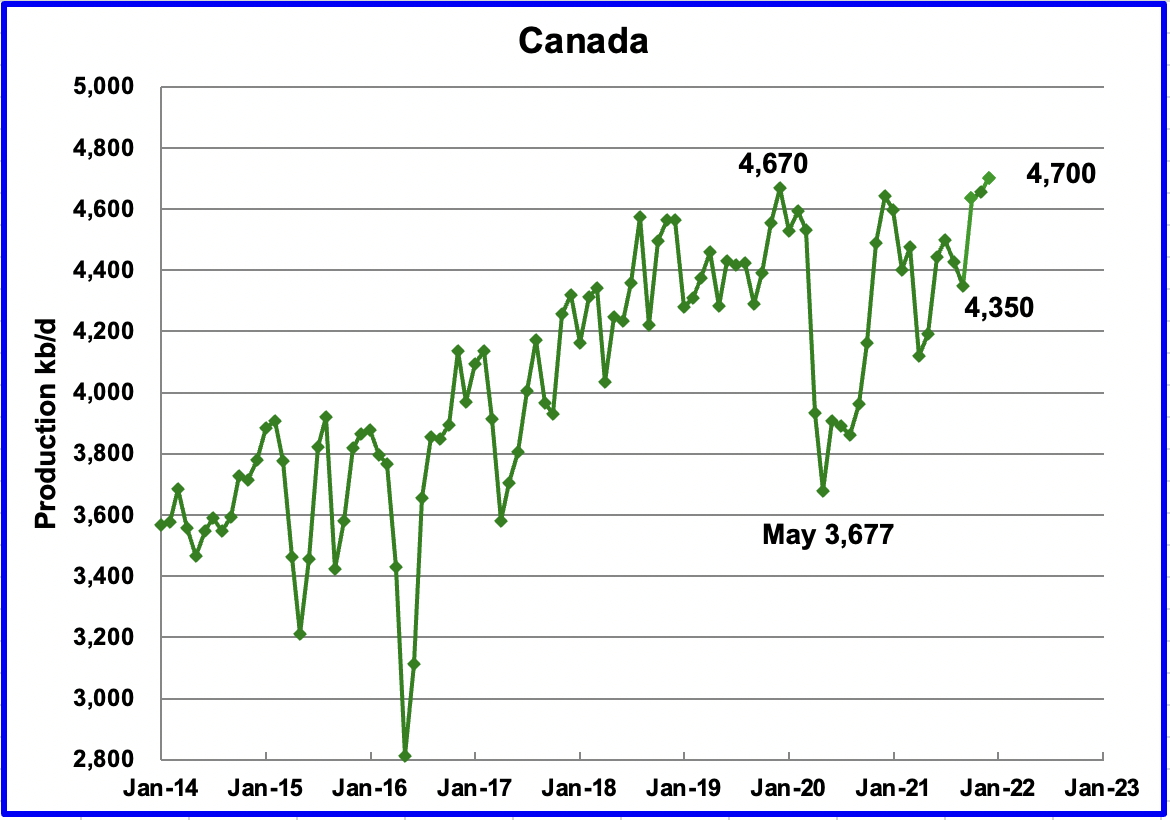
According to the EIA, December’s output increased by 44 kb/d to 4,700 kb/d.
There appears to be renewed US interest in resurrecting the Keystone XL pipeline project as a means of enhancing US energy security. In this regard, Senator Manchin will be visiting two oilsands producers in the week of April 10.
“Senator Joe Manchin of West Virginia and chairman of the United States Senate Committee on Energy and Natural Resources will visit Alberta between April 11 and 12. The Alberta government says the visit is to “learn about the province’s responsible energy sector and to discuss North American energy security.”
While there have been a number of calls to revisit the Keystone XL decision, many don’t realize the capital investment that TC pipeline made to the project and lost it all. Contributing to the loss were the numerous court challenges they faced, which they would face again. Also many proponents don’t realize that the Capline pipeline (See below) which was reversed is possibly a better alternative to Keystone XL.
The constraints put on Canada’s export capacity by the cancellation of Keystone XL were mitigated by the start up of Line 3. The upgraded Line 3 pipeline which added close to 400 kb/d of export capacity started operating in December 2021. Another pipeline, the expanded Trans Mountain pipeline will get Canadian oil to tidewater and is expected to be completed by end 2023. It will have a nominal capacity of going from approximately 300,000 barrels per day to 890,000 barrels per day.
“A reversed Capline would open a significant new route for Canadian oil to the key Gulf Coast processing hub, experts say, adding as much as 1.2-million barrels a day (b/d) of new transport capacity to a market already buoyed by increased crude-by-rail shipments and major additions along established pipeline corridors. Capline currently ships crude north about 1,020 kilometres from St. James, La., to Patoka, Ill. Keystone XL, by contrast, plans to ship 830,000 bpd.
“I think the refineries in Louisiana would be interested in accessing heavy Canadian crude through that means,” said Afolabi Ogunnaike, a Houston-based analyst at energy consultancy Wood Mackenzie. “The challenge is, is there sufficient capacity to get the crude into Patoka?”
A New Canadian oil Field
The Norwegian oil company Equinor and its partners plan to develop the oil field at the Flemish Pass, about 500 kilometres east of St. John’s. Bay du Nord will be the first project to move the offshore oil industry into such deep waters, with drilling to go more than a kilometre underwater.
The Equinor plan is to use a massive floating production, storage and offloading vessel, commonly known as an FPSO, capable of producing up to 200,000 barrels daily.
According to this source, the Bay du Nord development for the Flemish Pass Basin could contain up to one billion barrels.
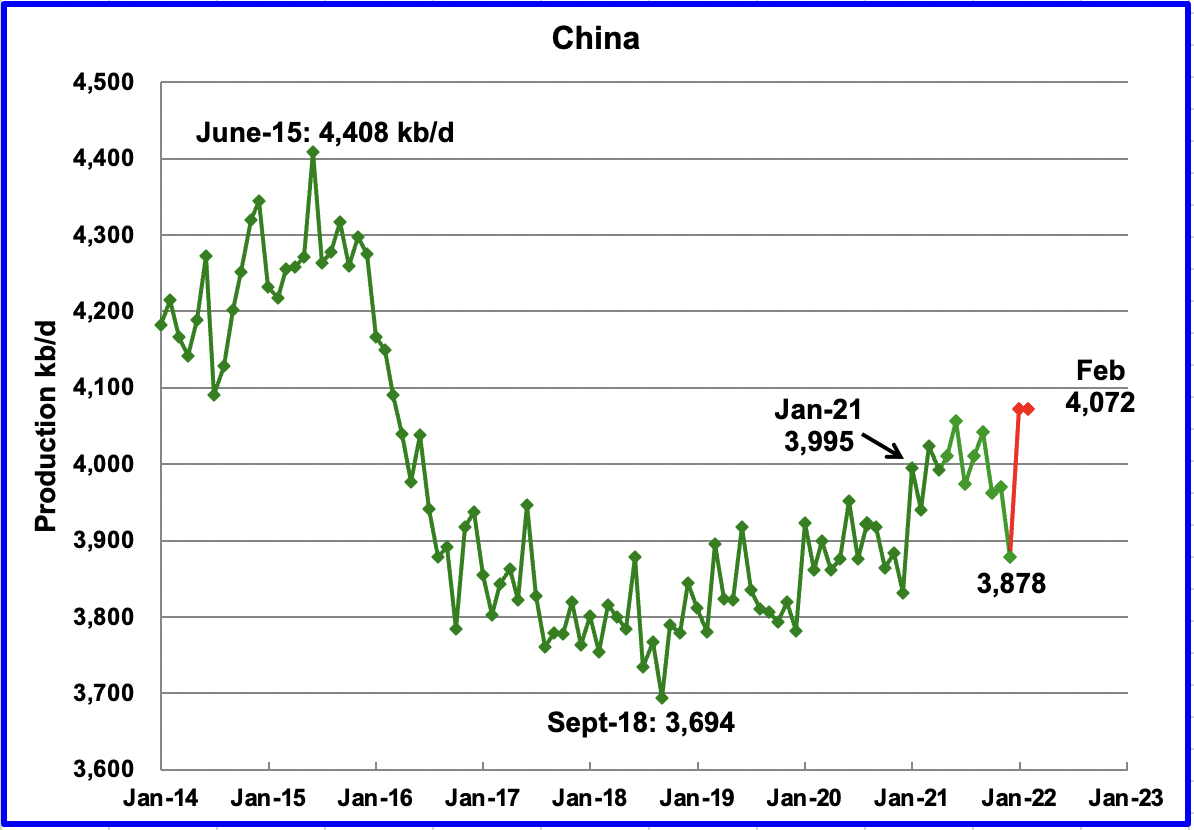
The EIA reported China’s output decreased by 91 kb/d from 3,969 kb/d in November to 3,878 kb/d in December. January’s output rebounded to 4,072 kb/d in January and held steady in February. (Red markers).
A sidebar: Close to the 22nd of every month I access the Chinese National Bureau of Statistics to get their crude production for the previous month. The information is no longer available. December was the last month when the information was provided. Will China’s oil production information now become a state secret?
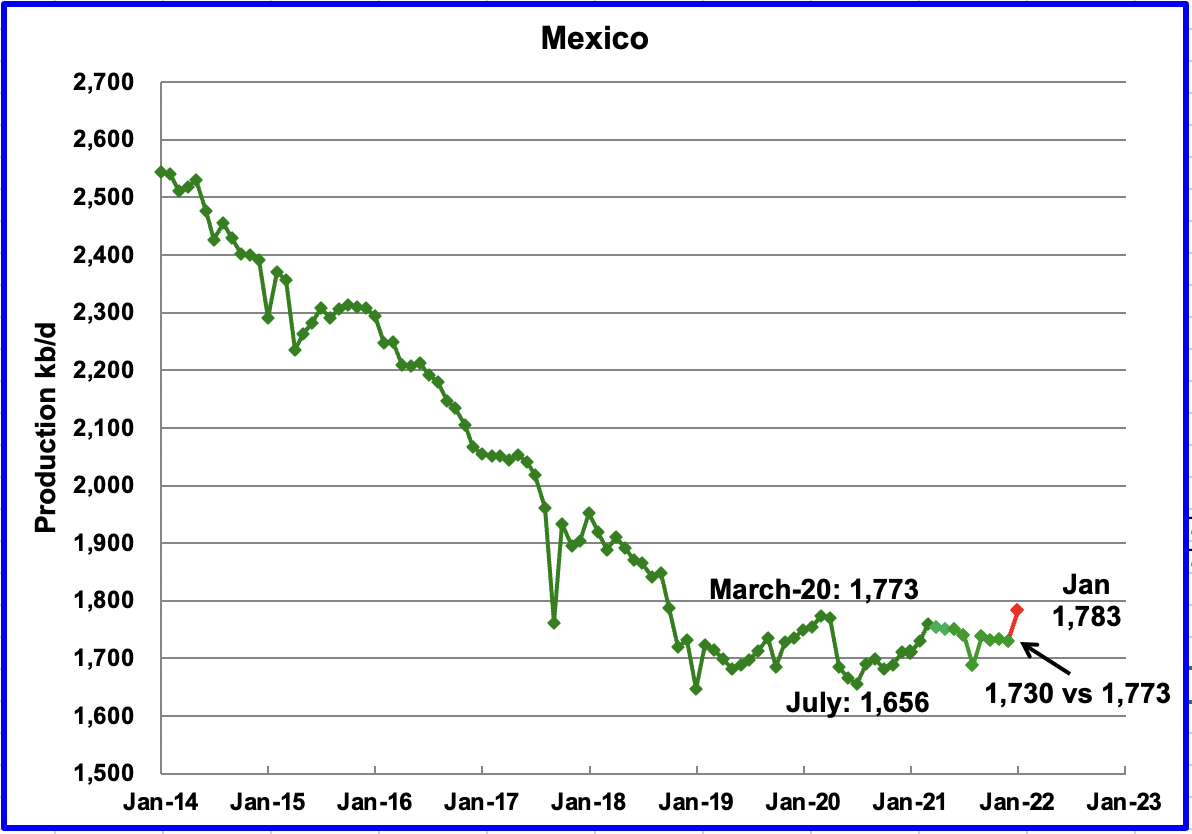
Mexico’s production as reported by the EIA for December decreased by 3 kb/d to 1,730 kb/d.
Data from Pemex showed that December’s output climbed to 1,773 kb/d and was essentially unchanged for January at 1,783 kb/d. (Red marker). However for some unknown reason, it appears that the EIA reduced Mexico’s official December C + C production by 43 kb/d. For November, the EIA decreased Pemex’s output by 38 kb/d. The January output of 1,783 kb/d may again be reduced by the EIA to something in the area of 1,743 kb/d.
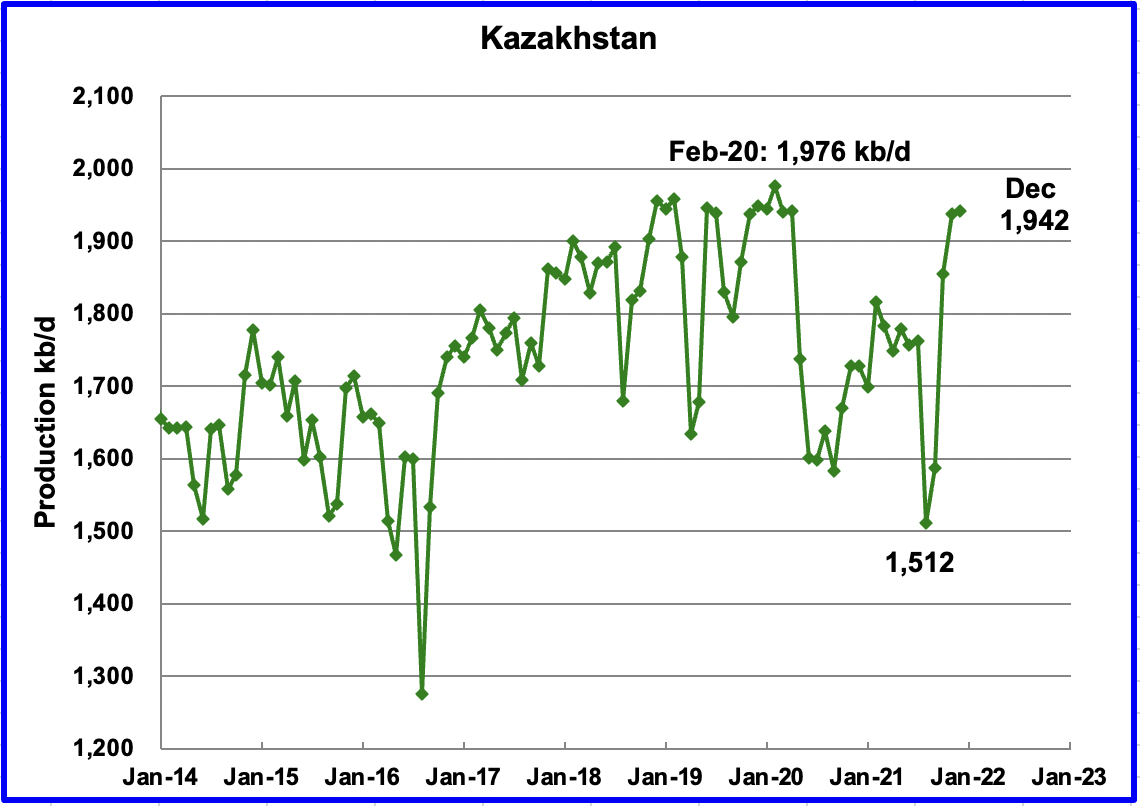
Kazakhstan’s output increased by 4 kb/d in December to 1,942 kb/d following the end of maintenance in the Tengiz field. December was the highest output since May 2020. The small increase in December was expected since it is close to its former peak output of 1,976 kb/d.
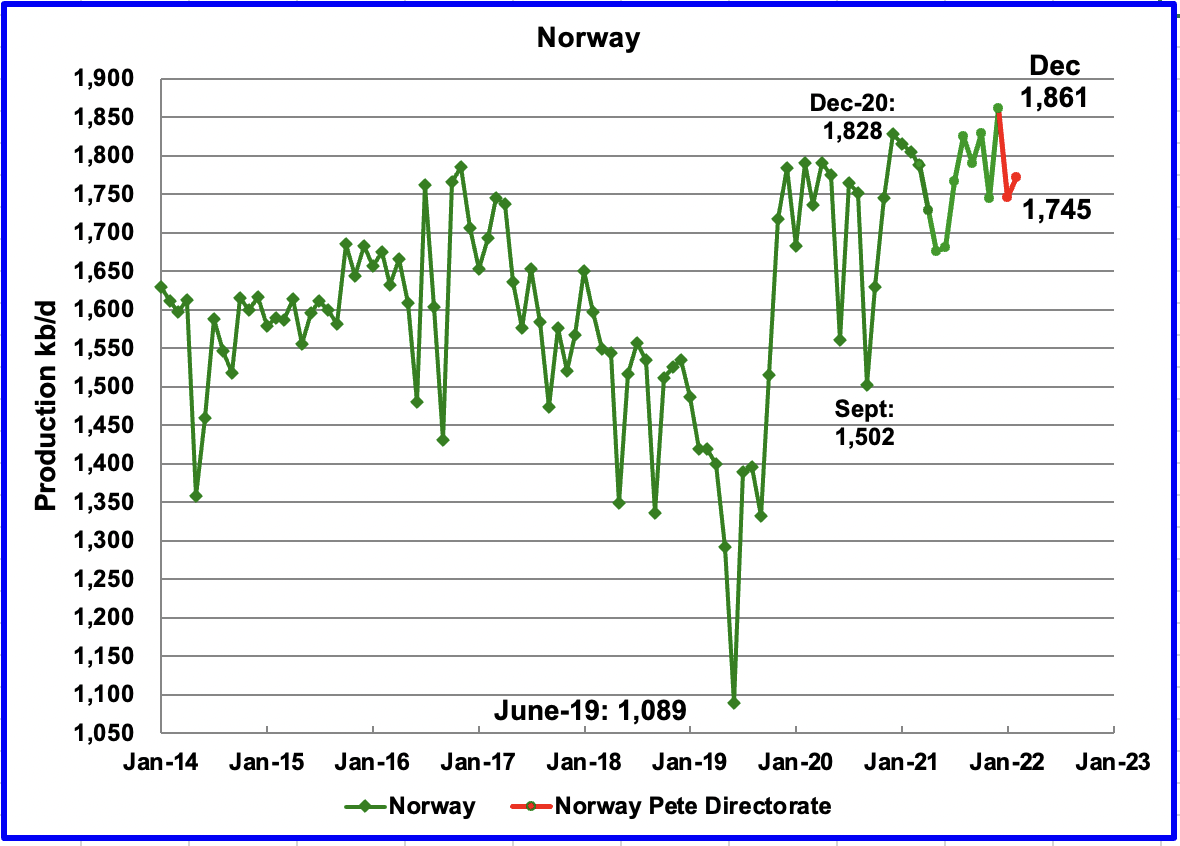
The EIA reported that Norway’s December production increased by 117 kb/d to 1,861 kb/d. The Norway Petroleum Directorate (NPD) reported that production in January decreased to 1,745 kb/d and then increased to 1,772 kb/d in February. (Red markers.)
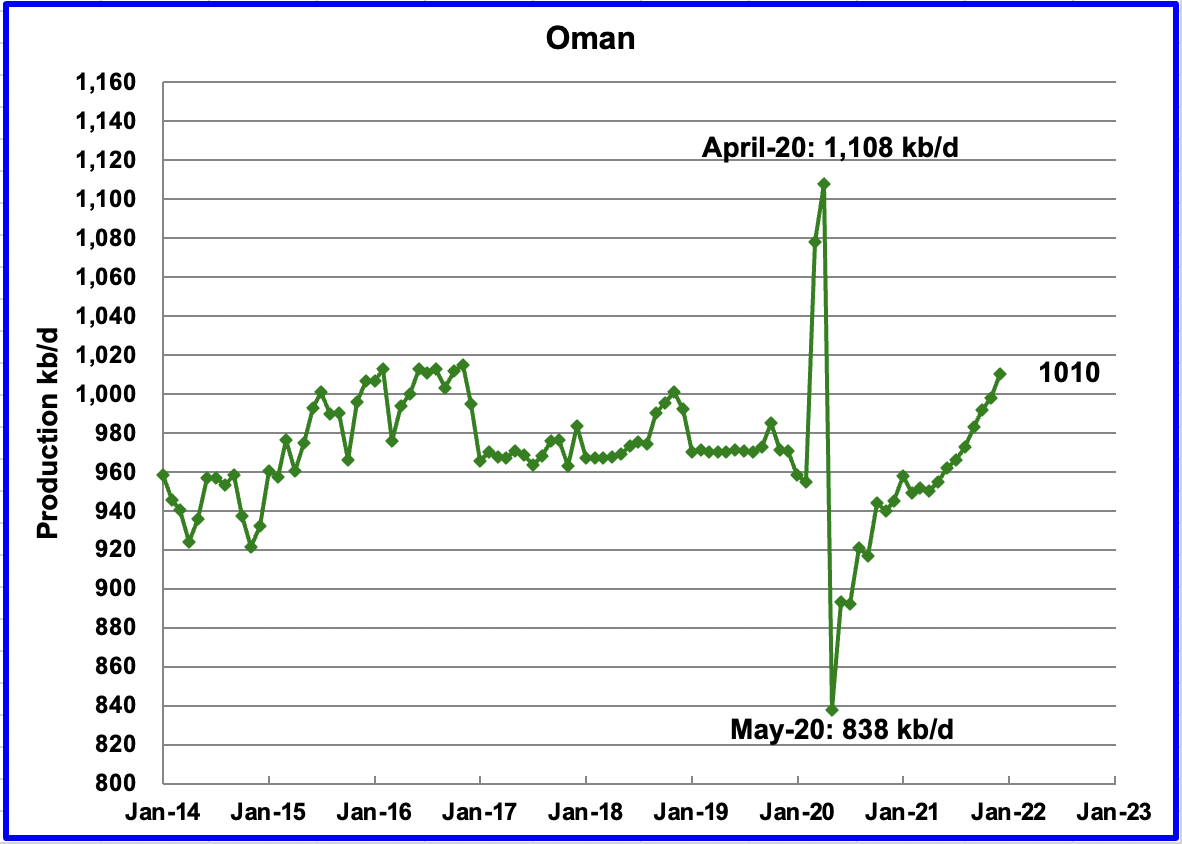
Oman’s December production increased by 12 kb/d to 1,010 kb/d.
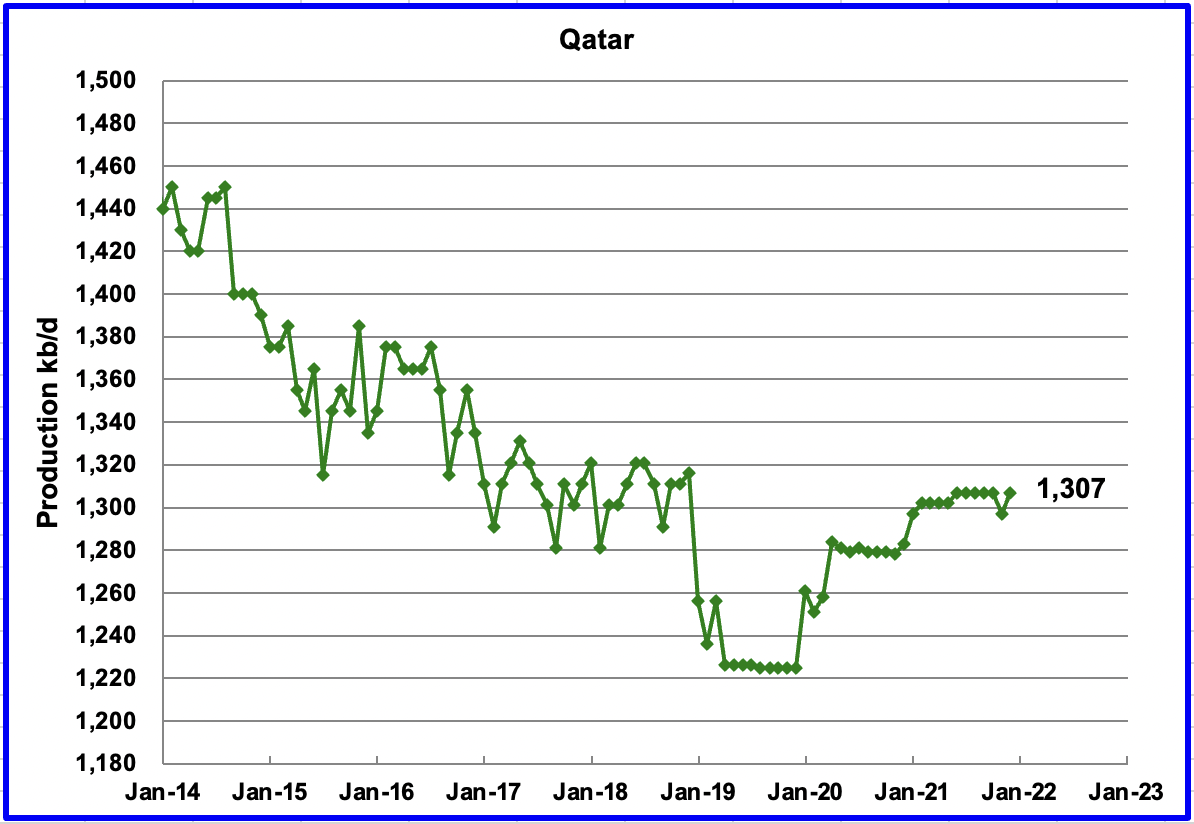
December’s output increased by 10 kb/d to 1,307 kb/d.
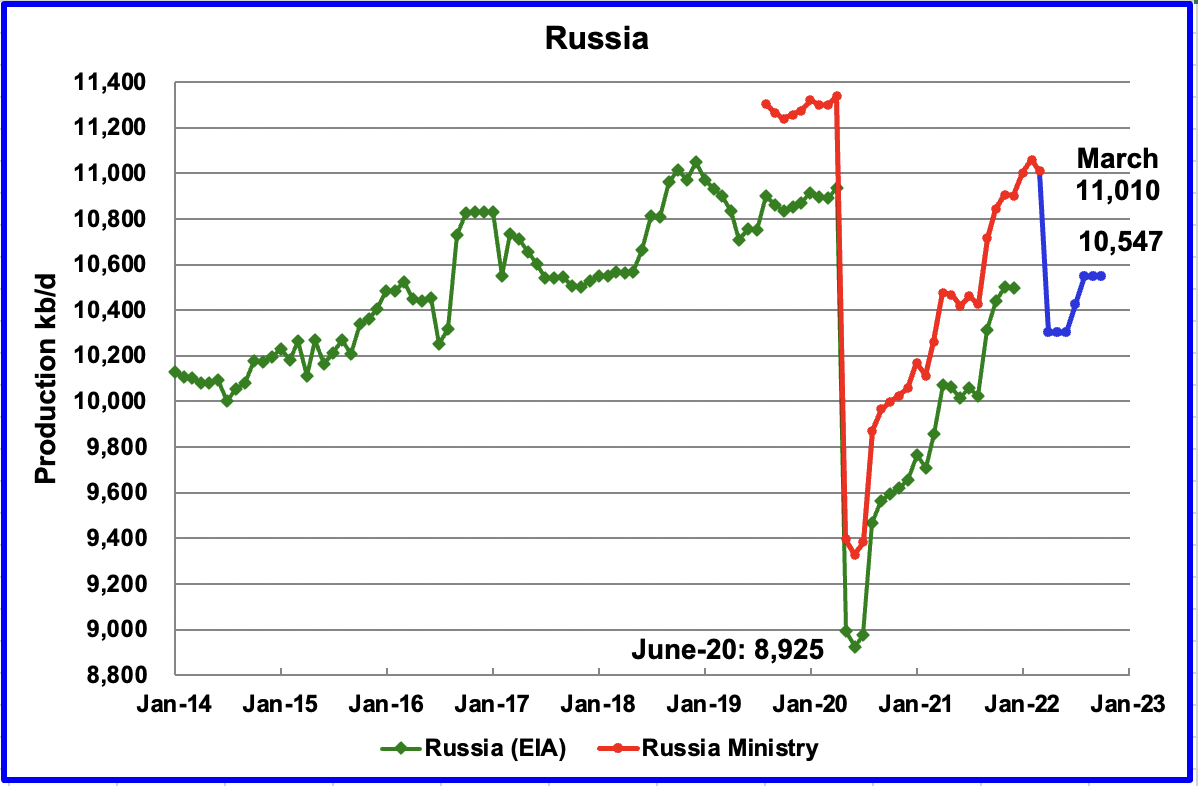
The EIA reported that Russian output decreased by 3 kb/d in December to 10,499 kb/d. According to this source, March’s production decreased by 50 kb/d to 11,010 kb/d. The blue graph represents the STEO’s forecast for Russian production up to October 2022 and beyond due to the imposition of economic sanctions by the U.S. and many other countries.
The Rusian C + C forecast was made by comparing the ratio of the STEO’s all liquids output with the Russian Ministry C + C output over the period October 2021 to February 2022. Russian C + C production was close to 97.5% of the STEO all liquids data. That percentage was used to generate the Blue graph.
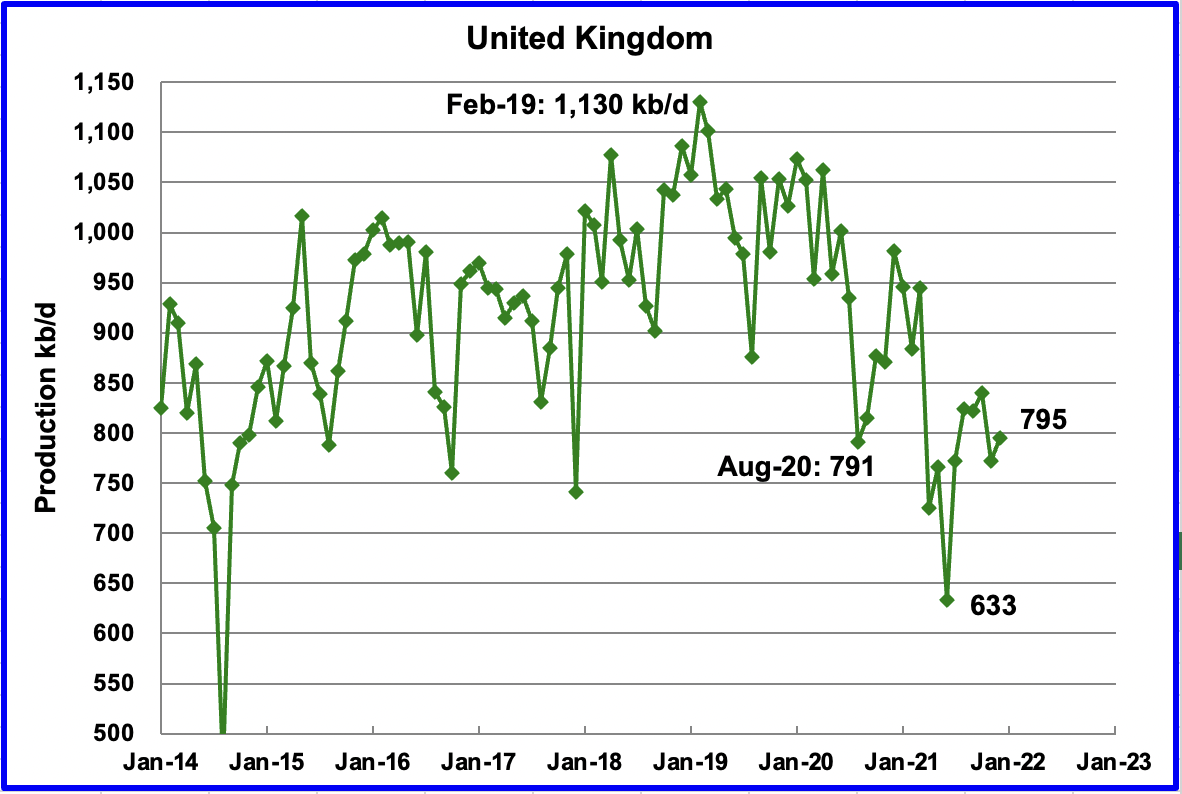
UK’s production increased by 23 kb/d in December to 795 kb/d. The chart indicates that UK oil production has entered a steep decline phase.
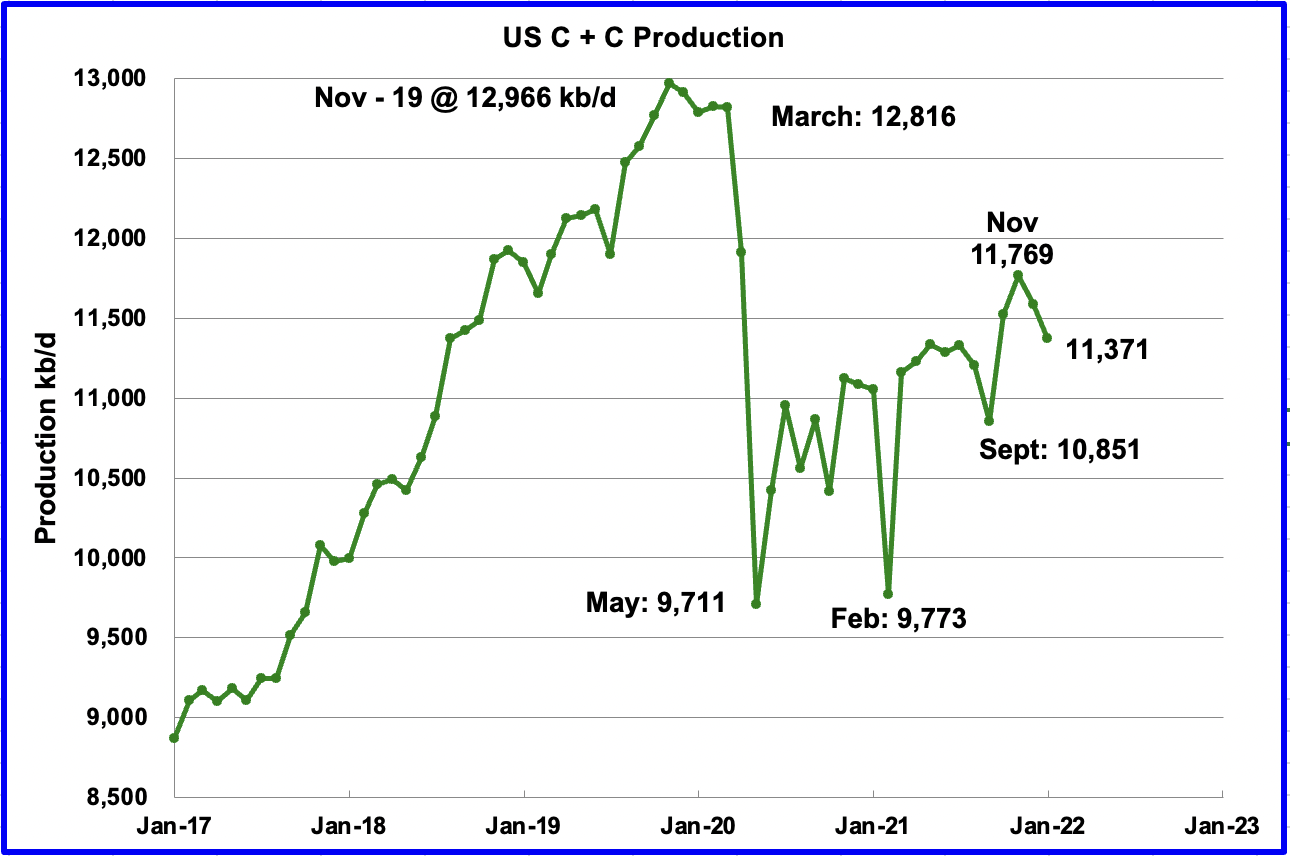
U.S. January production decreased by a surprising 216 kb/d to 11,371 kb/d. In December production dropped by 182 kb/d for a combined total of 398 kb/d from November to January. The main declining states were Texas 120 kb/d, New Mexico 31 kb/d and North Dakota 24 kb/d. Of the top 10 states, only Colorado increased its production. It is not clear if weather, geology or other issues contributed to the decline.
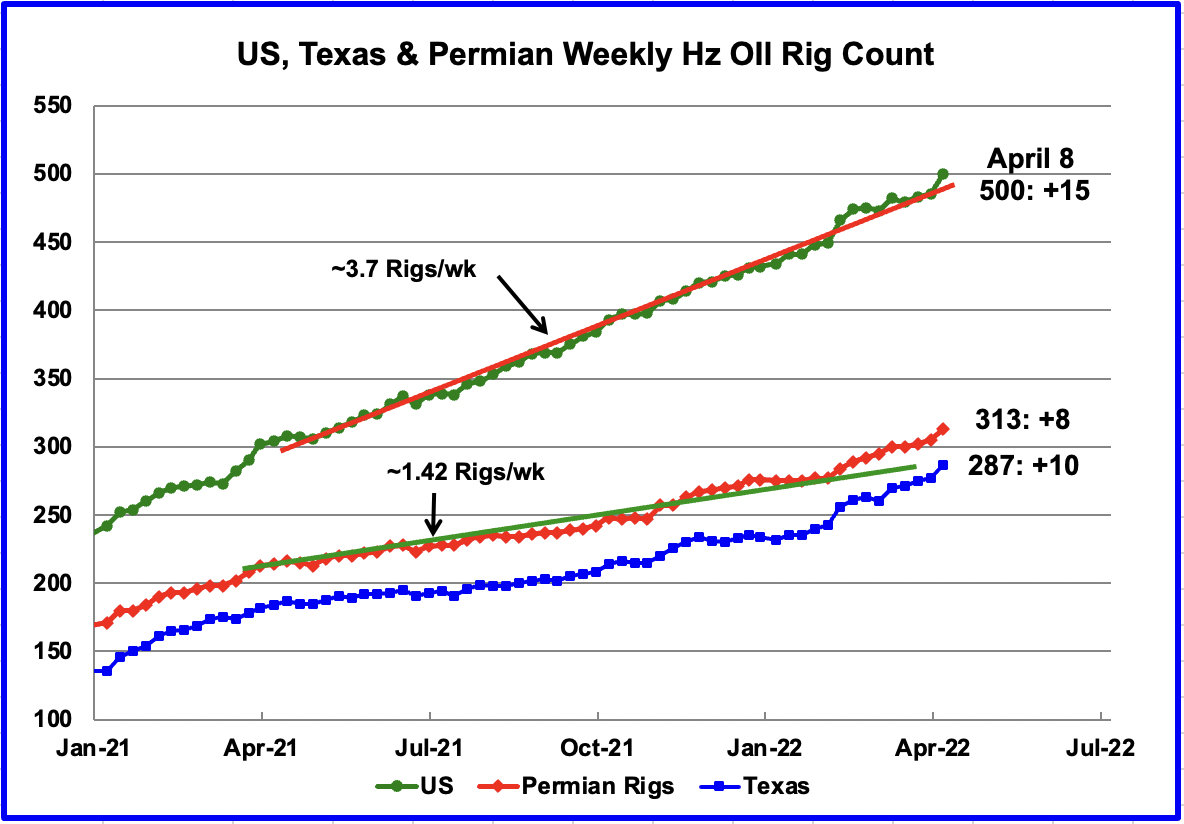
Something is changing/happening in the Texas Permian with regard to rigs.
From the beginning of April 2021 to the end of January 2022, the US has been adding horizontal oil rigs at an average rate of close to 3.7 rigs/wk. However since the beginning of February, rig additions have accelerated in the US and particularly in the Texas Permian.
For the week ending April 8, 15 horizontal oil rigs were added in the U.S. for a total of 500. Permian rigs increased by 8. In Texas, the rig count increased by 10.
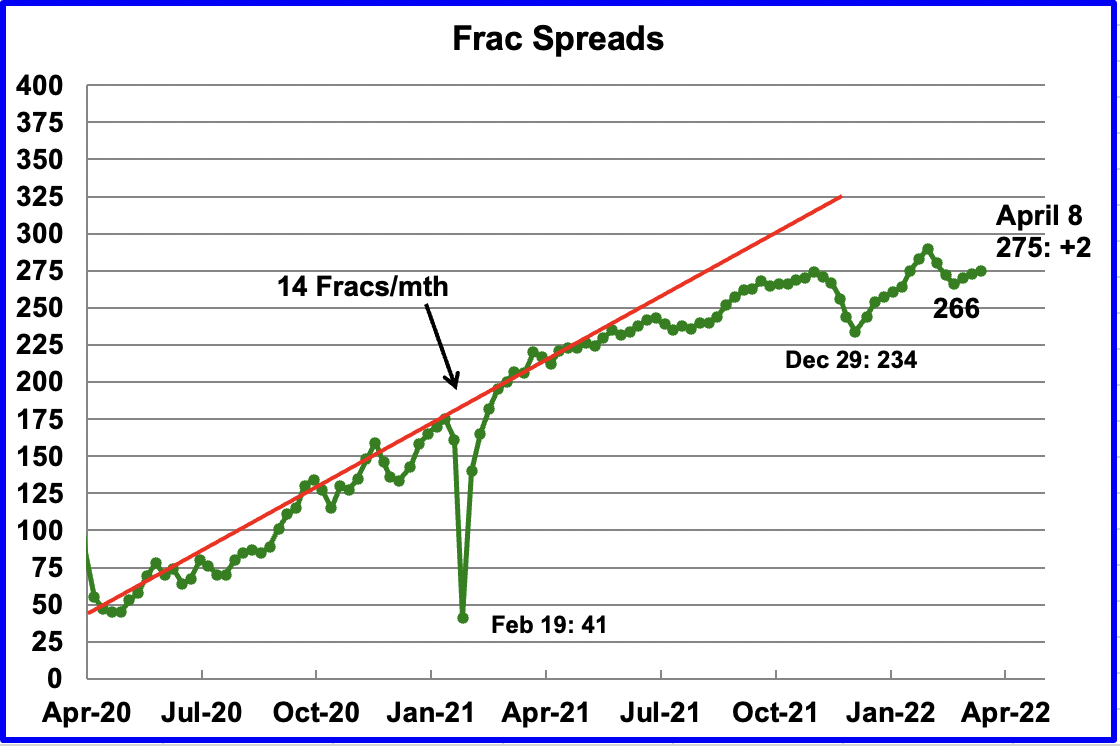
The growth in frac spreads is not keeping up with the growth in rigs.
Frac spreads hit a high of 290 at the end of February and dropped to a low of 266 in the week ending March 18. Since then 9 frac spreads have been added for a total of 275 in the week ending April 8. The graph appears to be indicating a slowing of frac spread additions with a possible plateau in the 275 region.
Note that these 275 frac spreads include both gas and oil spreads, whereas the rigs information is strictly oil rigs.
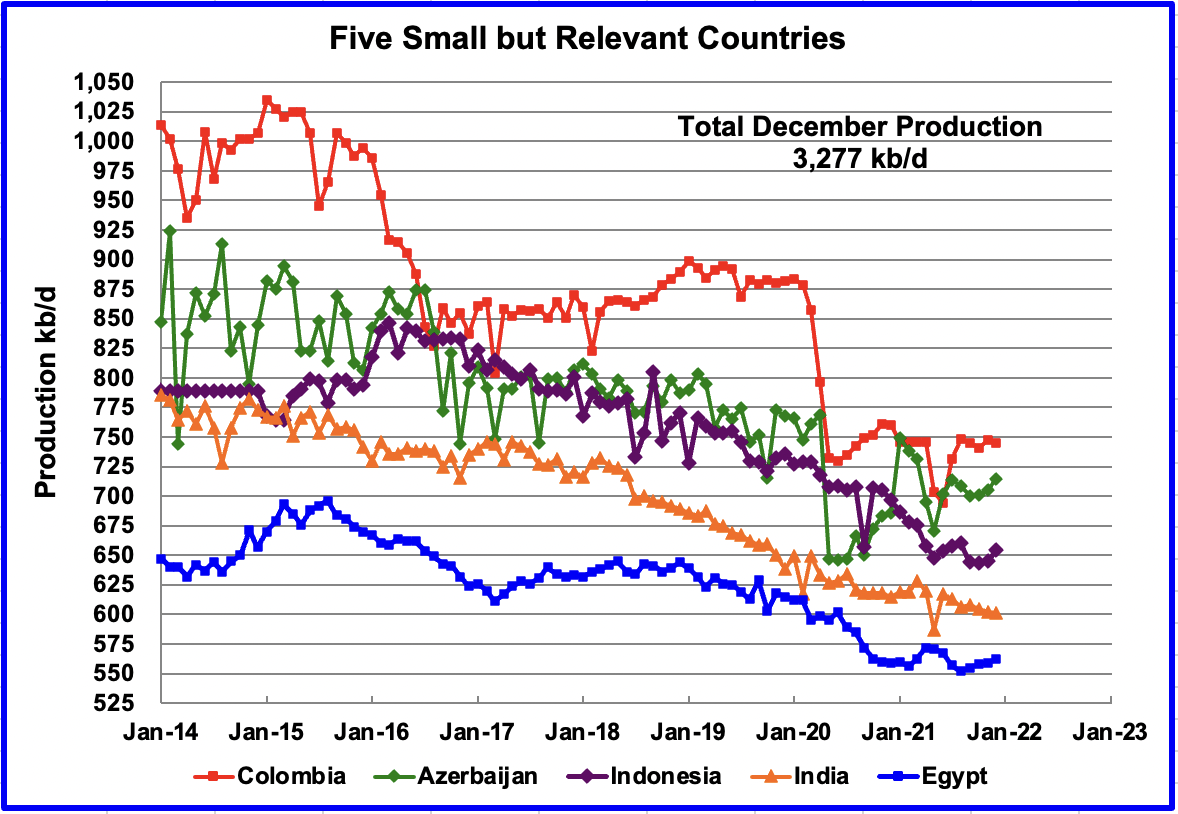
These five countries complete the list of Non-OPEC countries with annual production between 500 kb/d and 1,000 kb/d. Their combined December production was 3,277 kb/d, up by 17 kb/d from November.
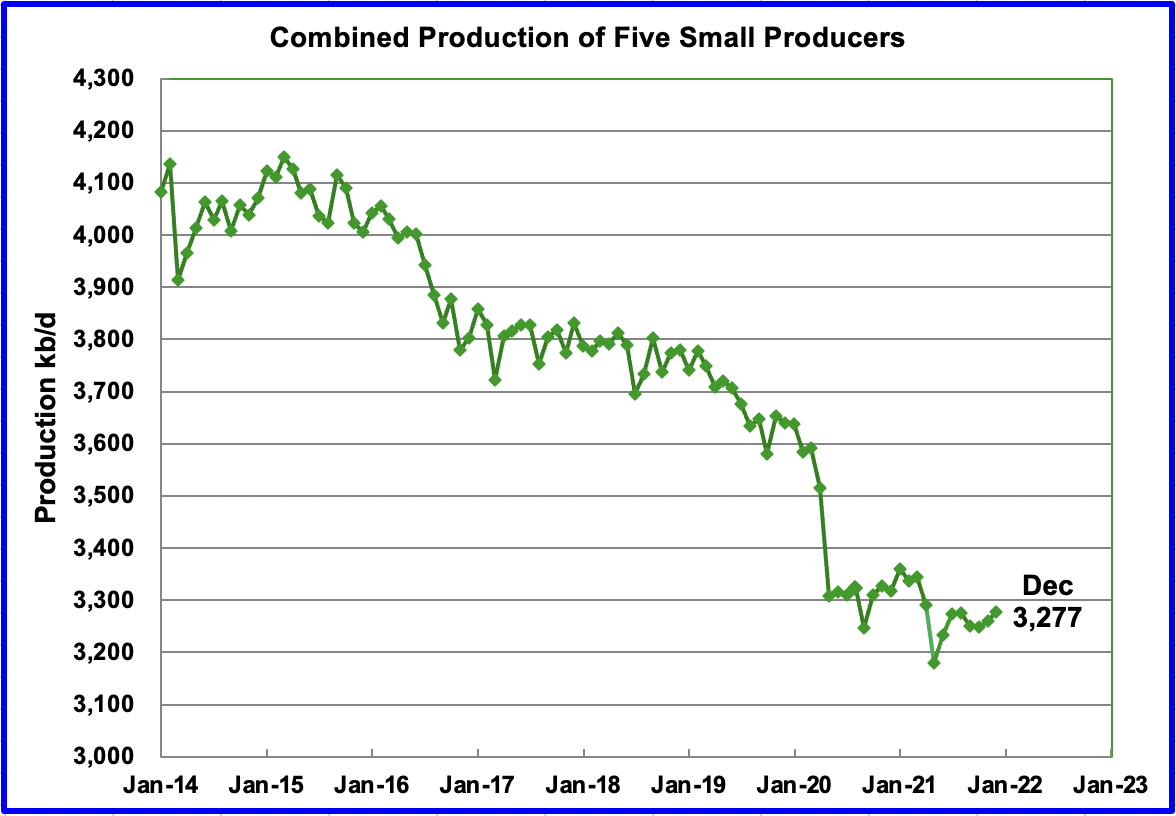
The overall output from the above five countries has been in a slow decline since 2015. The drop in May 2020 from 3,500 kb/d to 3,300 kb/d was primarily from Azerbaijan, 125 kb/d, which is a member of OPEC + and Colombia.
World Oil Production
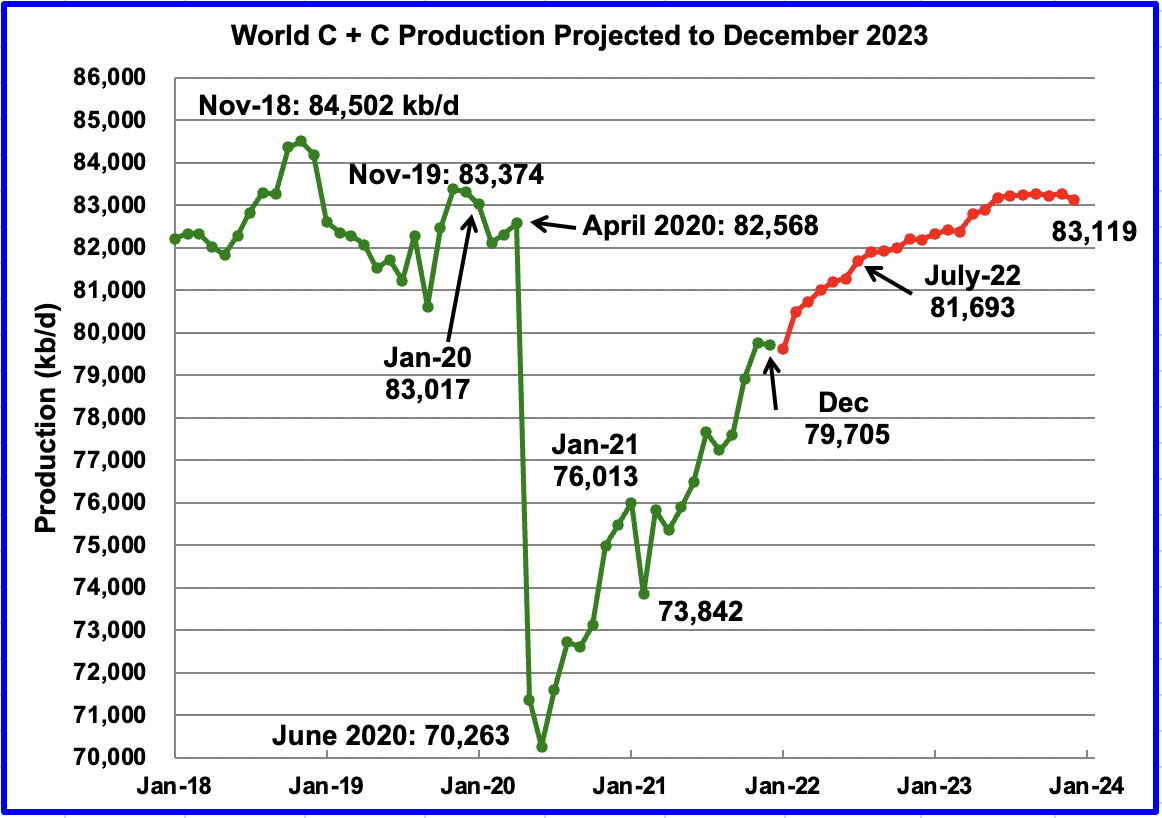
December’s world oil production decreased by 60 kb/d to 79,705 kb/d according to the EIA (Green graph). The 60 kb/d decrease was a combination of 3 large decreases, Ecuador 239 kb/d, US 205 kb/d and China 91 kb/d offset by Norway’s increase of 117 kb/d and many more with output below 100 kb/d, such as Guyana 86 kb/d.
This chart also projects world C + C production out to December 2023. It uses the March 2022 STEO report along with the International Energy Statistics to make the projection. (Red markers).
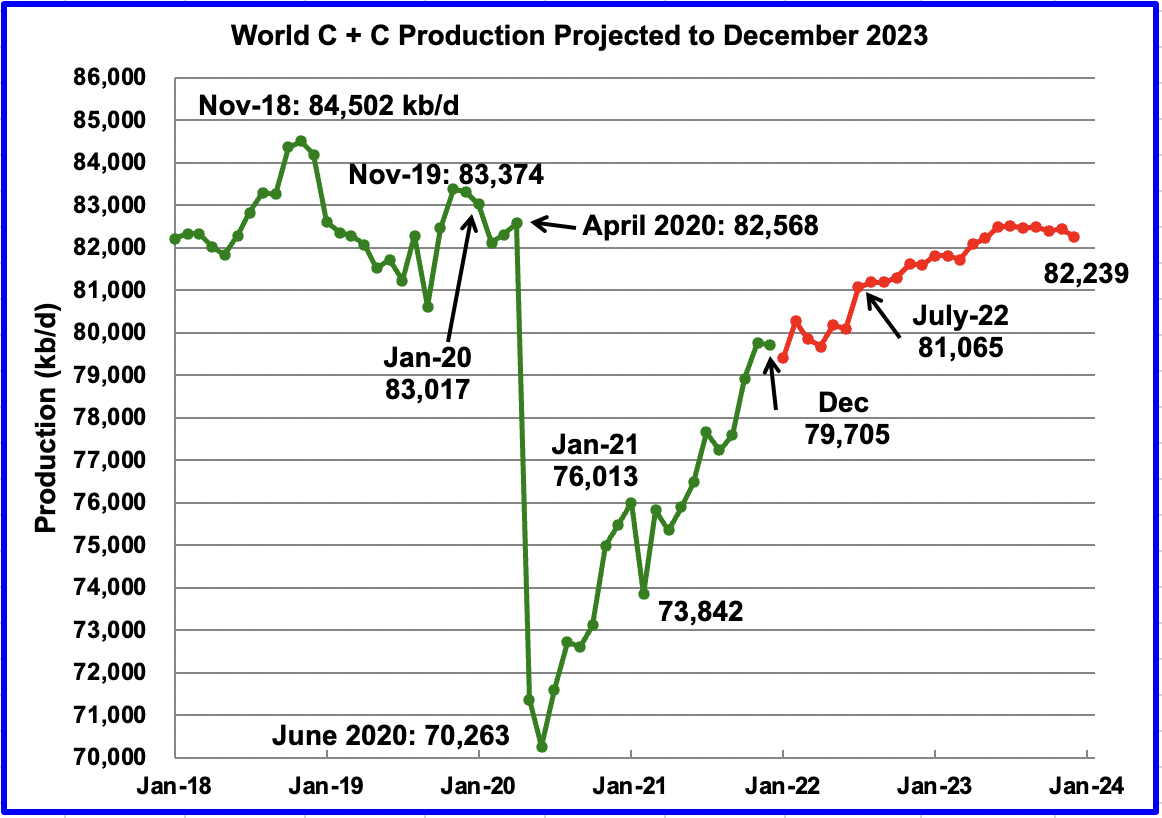
This chart has been updated using the April STEO. The previous one used March. Nothing else was changed. December 2023 has been revised down by 880 kb/d. Note this chart and comment were added on April 12. The original post went up on April 9.
It projects that world crude production in December 2023 will be 83,119 kb/d, 173 kb/d higher than projected in the March report. It is also 102 kb/d higher than the January pre-covid rate of 83,017 kb/d and 1,383 kb/d lower than the November 2018 peak.
Could the plateauing shown in the later half of 2023 be the first indication that peak oil occurred in November 2018 at 84,502 kb/d?
229 responses to “Non-OPEC December Oil Production Drifts Lower”
Hickory
In the previous post you asked the question below. I did not see it because I was preparing this Non-OPEC post. I think I answered part of your question in the current Canada section.
“As far as you know Ovi, is there actual constraint on getting Canada oil transported from the production sites to refineries or export terminals? Is oil production, or industry growth, being curtailed because of lack of export capacity?”
As for the question “Is industry growth being curtailed?”, the answer is no and yes. Governments are expert at talking out of both sides of their mouth.
“Earlier this week, it (the govt) green-lit the proposed Bay du Nord oil project off the coast of Newfoundland and Labrador, largely on the basis that it will have low per-barrel production emissions relative to most Canadian oil extraction. Almost simultaneously, Environment Minister Steven Guilbeault sent a letter to Suncor Energy Inc., advising that its planned expansion of its Base Mine in Alberta’s oil sands is currently on pace to be rejected because of its relatively high emissions intensity.”
https://www.theglobeandmail.com/business/commentary/article-ottawa-is-getting-closer-to-a-vision-for-canadas-green-economy-future/
In the meantime the US is asking Canada to increase its oil production.
Thank you Ovi for keeping track of all this, and the explanations. Excellent job continues.
So useful to get a peek beyond the soundbites otherwise available.
I wonder if there will be much demand from Europe for ship borne heating oil imports or will they be able to shift back to coal more readily , in attempt to make up for Russian nat gas if it gets cut off.
Thanks Ovi,
Great post and presentation of the data at hand.
Regarding your question at the end.
Obviously it’s too early to say whether it is. I am skeptical because there seems to be plenty of complex chain hydrocarbons left to be produced in my opinion. The only impedance i see is possibly lack of funding as this geopolitical commodity is a risky one for more expensive producers, and banks might not want to venture down that line. They might be more inclined to invest in renewables as there might be more incentive to do so.
This is all pure speculation on my part.
Iron Mike
Thanks for the encouragement. Much appreciated.
The banks in Canada are under pressure to not finance oil and gas projects. At open board meetings, protesters put questions to executives as to why they are financing specific projects. For the trans Mountain pipeline, the company asked the government not to disclose which insurers were providing coverage so that the insurers could avoid protests. One or two companies refused to renew TMX’s insurance.
Great post
According to Planes All American the Calpine reversal went into service January 2022.
Ervin
Thanks. It will be interesting to see if Capline increases competition for WCS and decreases the differential with WTI. Last summer the differential expanded from $14/b to $20/b as many Midwest refineries started maintenance. More recently the differential has dropped into the $12/b to $14/b range. WCS is preferred for refining into diesel.
Ovi,
Often the differential is roughly the transport cost.
WTI has low tranport cost to Gulf coast refineries, have you seen estimates for transport cost by pipeline from Alberta to US Gulf coast?
Great job Ovi,
Some think the peak 12 month average of World C plus C is a better metric for the peak. The highest level to date is about 83 Mbpd in Oct/Nov 2018 for centered 12 month average.
The reference case for the EIA IEO has World output at 83.6 Mbpd in 2025 and 85.9 Mbpd in 2030. These estimates seem reasonable based on resource estimates by Jean Laherrere in my view.
Dennis
Thanks.
Those estimates do seem reasonable. However to get to those production levels, all of the fields will have to be in production on the same month. Simple timing could be a problem because wells need maintenance. Throwing in an unknown decline rate of between 500 kb/d/yr to 800 kb/d/yr along with restrictions on investment, will make it hard to displace November 2018 as king.
Ovi,
Fields see maintainence, weather, wars etc, this has been true the last 40 years and will be true the next 40.
From 1982 to 2019 the average annual rate of increase in oil output was 800 kb/d, some periods it was faster than this as the rate has slowed and increased due to supply gluts or shortages and movements in oil price as a result.
I expect output will return the the 1982 to 2019 trend by 2024 or 2025, then output will increase more slowly until the final peak (2027-2029) followed by slow decline until prices drop due to demand falling faster than supply in 2033-2035 period. Output has increased quite rapidly the past 18 months, this will slow but still rise fairly steeply maybe an annual rate of 2500 kb/d for 18 to 24 months and then return to the historic rate or less, depending upon demand and oil price.
Dennis
Based on the world oil chart, The EIA is expecting world oil production to increase by 3,500 kb/d between December 2021 and June 2023. Looking at your OPEC chart, OPEC could possibly supply 2,500 kb/d. Considering how drilling rigs are being added in the US recently, it could come up with more than half of the remainder, even though many of our participants are skeptical. So getting back to producing 83,000 kb/d by midyear 2023 seems possible. However after that, based on the EIA numbers you quoted, production growth slows to somewhere around 350 kb/d/yr ±50 kb/d/yr.
If demand growth is higher than that, the supply side will be very stresses and only a high price oil scenario will curb demand along with a possible recession.
Looking at your OPEC chart, OPEC could possibly supply 2,500 kb/d.
Looking at my OPEC chart, OPEC is pretty close to its peak right now. The OPEC big 5, Saudi, UAE, Kuwait, Iran, and Iraq are already above their pre-covid collapse. If Iran sanctions are lifted then the big 5 could increase production by 1 million billion barrels per day. The rest of the big 5 are within .5 million bp/d of their max. The other 8 will continue their decline.
I don’t believe OPEC will ever reach 30,000K bp/d again regardless of what happens with Iranian sanctions.
So getting back to producing 83,000 kb/d by midyear 2023 seems possible.
Not even close. Your world chart shows the EIA’s STEO prediction for world production to be 81,693,000 production in July 2022. I will be shocked if they are within 1 million bp/d of that in July. Have they completely forgot about Russia? And as far as OPEC goes:
Nigeria Says OPEC Is Out of Spare Capacity
OPEC does not have the additional spare capacity to lift crude oil production much more than it is doing today, Nigeria’s Petroleum Minister Timipre Sylva told Anadolu Agency on Friday.
“It is not something that you can open a tap for at this point. You must have the additional capacity, the idle capacity to bring on, but it takes a lot of work and a lot of investment for it to have additional production,” the Nigerian minister told the Turkish news agency in an interview.
Many OPEC producers, including Nigeria, are currently pumping at the peak of their capacities, Sylva noted.
“If there is anything we can do to produce more, OPEC will be the first to produce more. But unfortunately, this capacity doesn’t exist in most OPEC countries,” he told Anadolu Agency.
Nuff said!
Ron,
We need to look at OPEC output in December 2021, that is the correct comparison. But generally I agree that aside from Iran, OPEC is pretty close to capacity at present, Iran might be able to add 1200 kbpd from their Feb 2022 level and yes Russian output may decrease further if the war in Ukraine is not resolved.
My expectation is that oil prices will be high at least until 2025 and perhaps until 2035 unless there is a severe World recession due to high prices and tighter money supply to reduce inflation. Difficult to predict but turbulence ahead, fasten seat belts.
I understand your point Dennis, but my point is we will only have to wait until July or August to see how far off the EIA’s prediction is. I am betting their July estimate for world production is about one million barrels per day too high.
They have world oil production increasing by about two million barrels per day between December 2021 and July 2022. They have it divided about half and half, one million bp/d for OPEC and the same amount for non-OPEC. That just ain’t gonna happen in either case.
Ron,
I tend to agree, but note we won’t have June output numbers for the World until Oct 1, 2022, so we will know then. The STEO forecasts are often wrong, just like mine.
I tend to agree, but note we won’t have June output numbers for the World until Oct 1, 2022, so we will know then.
Naw, we will have OPEC June output in July and also a pretty good idea of what the rest of the world is doing. We will know by July 2022, within a small margin of error, what is happening.
Ron,
We will know some nations output (OPEC, US, Russia), but to me the International Data from the EIA is definitive and that data for June will be published in early October.
Ron
“The OPEC big 5, Saudi, UAE, Kuwait, Iran, and Iraq are already above their pre-covid collapse.”
Looking at Dennis’ last post, the only one that may be above pre pandemic levels is Saudi and it all depends which date is selected. OPEC is committed to adding close to 250 kb/d/mth. In about six months their commitments will be close to their pre pandemic output. At that point we will know the state of affairs with Saudi and the other producers.
I think the early clue will come in comparing Saudi production from secondary communications with direct. If the gap keeps getting bigger every month, then I would say “Houston we have a problem”.
Ovi,
Note that I quoted the reference scenario which assumes low oil prices under $70/b in 2021 $ from 2023 to 2025. The high oil price scenario for the IEO sees higher output in 2030 (86.4 Mbpd), but in 2025 only 83.2 Mbpd which is less than the reference case.
The IEO was published in Oct 2021, at that time STEO only went to Dec 2022 and had World crude at about 81.3 Mbpd in Dec 2022 assuming 79% of World liquids are crude (July 2021 level).
Annual 2022 World crude at 79.8 Mbpd. So IEO forecasting growth of 1000 kbpd for World crude annual rate of increase from 2022 to 2025 in Oct 2021.
No expectation of Russian invasion of Ukraine at that time.
In any case all these forecasts tend to be wrong.
Ovi,
The STEO also publishes annual estimates, I used those for comparison to IEO (which gives annual output estimates) this gives about a 3 Mbpd increase from Dec 2021 to mid 2023, with about 1.6 Mbpd increase from mid 2022 to mid 2023.
Also note that the ratio of World crude to World liquids has been decreasing over time. You should consider looking at this for future estimates.
Chart below uses the trend in the ratio of World Crude to World liquids (International energy estimate for crude and STEO estimate for World liquids) from 2017 to 2021 (annual data) extended to 2023. That estimate is combined with STEO World liquids for World crude estimate as shown in chart below (estimates for 2022 and 2023).
Dennis
The outlier in the world liquids to crude ratio is the US and it is very unsteady. See chart. Currently the US is producing close to 5,700 kb/d of NGL and 11,600 kb/d of C+C, for a ratio of 0.49. This has nothing to do with the world oil projections. It is just to clarify what is in the chart.
So before the world projection is made, the US all liquids is removed from the world all liquids production data. Similarly the US C + C is removed from the EIA world data. That ratio is then used to project future production. That ratio is very stable around 0.85.
Ovi,
Thanks for the clarification.
Ovi,
Chart below has an alternative estimate based on trend of ratio of World C pus C to World Liquids from Jan 2017 to Dec 2021 and then extended to Dec 2023. The ratio is then multiplied by World liquids estimate of STEO from Jan 2022 to Dec 2023 to develope the World C plus C estimate.
Ovi,
Here is World minus US crude to liquids ratio from 1980 to 2021 (note the data for total liquids for the US needs to be corrected from 1980 to 1992 by adding non crude liquids to crude).
Not very stable apparently. I agree however using this is better than including US as we have the AEO and STEO to give us US future estimates and that can easily be subtracted from the World total. The only thing I would change is the assumption that the crude to liquids ratio is stable as it is not historically,
Dennis
I think it is more appropriate to use a short term trend to project out one or two years, especially since the pandemic. Even your chart shows a flattening since 2020.
Attached is short term 4 year chart that shows some oscillatory variation and the drop from the pandemic. To reduce the variability, a trailing six month average is used to project out to December 2023. (Red graph) Since July 20, the average has wandered between 0.85 and 0.86.
Different ideas on how to analyze a situation gives differnt answers. However these projections are not a scientific exercise where the third decimal point counts. I think the best we can expect from these analyses is to end up in the right section of a football stadium. If we are lucky, we might even get close to the right row. Regardless, they won’t be right but could be close and possibly better than doing nothing.
Ovi,
Yes I agree we cannot get a precise estimate. As to which way to do the projection is best is a matter of different opinion, I think long term trends tell us more and I am more interested in long term vs short term projections.
Also note the data wanders below and above the trend line, so there will be some periods where the slope is less steep or more steep than the trend line.
Note also that the short term trend is actually steeper than the long term trend. For 2017 to 2021 the trend is -0.0044 and for the long term trend it is -0.0023 (this is the slope I used for my chart). If I had chosen the short term trend, the ratio of crude to total liquids would have dropped much more steeply.
Chart below has output based on the long term trend, and yes there is seasonal variation (which suggests to me that the 12 month average makes more sense than 6 month averages. I simply use the annual data from 1980 to 2021 for the trend. Chart below is the result.
To me this projection seems very optimistic, especially in the next 6 months (1.2 Mbpd increase in 6 months). The increase over the next 18 months (July 2022 to Dec 2023) looks more reasonable (1.6 Mbpd), the increase over 24 months from Dec 2021 to Dec 2023 also seems reasonable (2.8 Mb/d over 24 months), but the month by month details will likely be wrong.
Ovi,
The estimate changes to chart below when we use the short term (4 year) trend in the change of crude to all liquids for World minus US.
Dennis
I am not clear on the process you are using. In the above chart the ratio shown is World C plus C W/O US / World liq W/O US.
That ratio is then used to estimate World C plus C W/O US out to December 2023. Then the US C plus C production from Tab 4atab in the STEO projection out to December 2023 is added back in to come up with the estimate.
The April STEO comes out tomorrow. Will be interesting to see how that changes things.
Ovi,
The only difference is that you assume the ratio for World wo US crude to total liquids is fixed at some level (85.5%?), I assume that ratio continues to decrease either at the long term rate (0.22% per year) or at the short term rate (0.44% per year) for World wo US crude to liquids ratio.
To calculate an average annual growth rate between 1982 and 2019 is meaningless. In that period the West Siberian oil fields peaked mid 80s leading to the collapse of the SU, the North Sea peaked resulting in oil prices leaving the $20/b band, global crude peaked in 2005, leading to the financial crisis in 2008/09 and the start of money printing which financed the unconventional shale oil, China peaked, Ghawar peaked and now Russia. My latest post:
Asia peak oil update Nov 2021 data
https://crudeoilpeak.info/asia-peak-oil-update-nov-2021
Matt,
If we use short term such as 2015 to 2019, the decrease in the crude to total liquids becomes larger by roughly a factor of 2.
The growth rate is used to estimate the growth in demand for crude oil which has been fairly steady at about 800 kb/d per year from 1982 to 2019. This does not assume that growth in demand will be met with increasing supply, but simply that oil prices are likely to remain high as was the case for 2011 to 2014.
Dennis, can you reference where Jean does resource estimates? All of his work I’ve ever seen has been fitting curves to production or discovery histories and calling that resources, rather than actually doing the economic, engineering and geologic analysis to work from the bottom up on resource estimates.
Reservegrowthrulz,
Jean Laherrere’s estimates tend to be conservative and are mostly based on production history.
An analysis of this type in 2018 based on 35 large producers at link below, URR is 2800 to 3000 Gb.
https://aspofrance.files.wordpress.com/2018/08/35cooilforecast.pdf
I take the high end of his estimate because typically they have been revised higher over time. His estimate for extra heavy oil is only 250 Gb, so about 2650 Gb for conventional resources (if we assume tight oil ends up being around 100 Gb).
Unfortunately there are not many analyses that pull all of the information together.
One example from 2014 is at link below
https://royalsocietypublishing.org/doi/10.1098/rsta.2013.0179
They show an IEA estimate for conventional crude oil of about 3500 Gb, I doubt that much will be produced as prices will fall after 2035, stranding a lot of the potential resource, particularly extra heavy oil.
There is also older work by USGS such as
https://pubs.usgs.gov/fs/fs-062-03/FS-062-03.pdf
and
https://pubs.usgs.gov/fs/2012/3042/fs2012-3042.pdf
These studies suggest about 2600 Gb of conventional oil, if we assume 233 Gb of undiscovered conventional plus conventional oil reserve growth in the US after 2012.
I use an estimate of 2800 Gb for World conventional oil URR as my best guess and total World URR of around 3000 Gb due to peak demand around 2030-2035.
Thanks for the reference. I thought maybe he had begun doing something different than in the past, but apparently not.
Concerning regassification noted in previous thread that reduces 17K deliveries to 1700ish.
It may be fewer than that. The conversions apparently vary region to region (for some sort of Asian requirement) but the numbers I just looked at say 400ish delivery trips, not 1700. Someone should check this.
This uses 1 million tonnes of LNG = 1.379 bcm of gas, and a 100K cubic meter ship carries 349,904 metric tonnes.
This would I suppose do two things. If someone can charter enough 20 day trips to carry it there, and serve their other customers without breaking long term contracts, it is at least possible, but the other side of the coin is 5% of Europe imports from Russia are currently LNG, so Russia clearly has LNG cryo facilities already. This matters because China’s voracious appetite gets quite a lot of piped gas already from Russia, but they also have built LNG receiving ports on their coast for gas from other sources. Those other sources may supply Europe, if they want to break long term contracts with China.
If they do, Russia’s LNG abilities should be able to replace them along the Chinese and Indian coasts. https://en.wikipedia.org/wiki/Yamal_LNG This is 20 bcm/yr and they have 16 Russian indemnified icebreaking LNG carriers listed on the wiki. Did not find their capacities. Yamal is not their only LNG train array. They were already exporting 30 million tonnes (40 bcm) per year prior to Yamal.
Regardless, there is no long term in this matter. It’s 7-8 months. These problems must be solved by then.
No one needs to starve or freeze. The ECB could print up several trillion Euros and fund evacuation of all of northern Europe to southern countries, with money reserved to pay rent for spare rooms in Italian or Greek homes. By next year all the problems will be solved, of course, and they can go home.
And when they get home, probably have votes of no confidence in Parliaments to throw out whatever party required this of them.
All of the active facilities in the US already have customers and most are in Asia/India. We could divert all our LNG to Europe and this would be a fair bit of gas, but the existing customers obviously still need the gas they’re contracted for so where does that come from? If we diverted all our LNG to go to Europe as part of some national decree instead of asia we’d have to force majeure the existing firm takeaway customers and pay substantial fines and face legal issues.
Yes Russia already has liquefaction plants. They’ve been plagued with problems for years though as they’re in very harsh/cold environments and they also used motor-drive compressor trains which were causing a lot of issues. Hopefully those have been resolved but the weather issue remains.
Your average world-scale regasification import terminal can vaporize 1-2bcf per day. Not sure how many Europe already has that are connected to interstate pipeline. If they aren’t already built they’re years away. Import terminals are much simpler to build and operate than liquefaction plants but they still use the same natural resources and personnel so competition is fierce.
Neither LNG or new pipelines are particularly realistic solutions to Europe’s gas problems this year. That is why they are focusing on cutting consumption. The real question is who will accept the cuts, industry or households.
Italy has the biggest problem. The quickest solution is probably solar, because nothing installs faster. But they are in talks with North African gas producers.
Algeria has a pipeline in place to Europe. It is already sending 20 bcm/yr and is claimed to have an additional 10 bcm capacity (which seems rather unlikely, Algeria would sell 30 instead of 20 if they could). Regardless, that connects to Italy and Italy has asked for that as a fix, for Italy (which is amusing). 10bcm would solve 10 of the 175 bcm problem.
American contracts to Asian customers being long term, breaking those because there is a choice to do so does not seem like force majeure. The ships did not sink, they were revectored. Doesn’t matter too very much. There will be fines in those contracts and the Fed can print up whatever is required.
The Yamal Russian facility’s current customer is Japan.
As for solar, 8 of the top 10 solar companies in the world are in China, and neither of the other 2 are in Europe. China has no reason to help an enemy solve a problem.
https://www.ship-technology.com/projects/christophe-de-margerie-class-icebreaking-lng-carriers/
Description of one of those 16 (as of 2019) ice breaking LNG carriers for Yamal facility. 170K cubic meter capacity. Built by South Korea Daewoo. China has ordered 5. S. Korea seems to dominate building of these. The article says routes west are ice free year round. Only routes to Europe clog with ice part year.
It occurs to me the 550 LNG carrying fleet of the world are not all friendly to Europe. That fleet may be smaller for the purpose analyzed.
I assure you, if we suddenly diverted our ships to Europe that would be considered force majeure by our asian customers. The shippers will sometimes arbitrage gas depending on who is paying the most for it but if we said aww shucks sorry all your contracted gas goes to Europe there would be major ramifications. Not sure who got the idea that we could just break contracts without ramifications, clearly not an industry person.
LNGuy,
Isn’t there some spot cargos of LNG? I can’t imagine that 100% of capacity is booked under long term contracts.
There have been quite a few articles like this in that past several months. Probably a pretty small percent of the market I assume-
“LNG Tankers Diverting Mid-Voyage for Premiums in Europe, Where Prices Keep Setting Records”
https://www.naturalgasintel.com/lng-tankers-diverting-mid-voyage-for-premiums-in-europe-where-prices-keep-setting-records/
D Coyne, most export facilities are set up such that they don’t actually own the gas, their firm contracts are a take or pay service to just liquefy the gas for the shipper. Export facilities don’t want exposure to commodity prices so it’s in their best interest to just get paid to provide the liquefaction services to the shipper – shipper has to provide the gas to the facility via pipeline (from shale basins, for example). Once it gets loaded into a ship the the export terminal is done with it and couldn’t care less what happens after that.
So naturally the shippers are going to go where the price is highest assuming they don’t have firm contracts with import terminals requiring delivery (some do, some don’t).
The point I was trying to make of course is that if gas going to Asia gets diverted to Europe then Asia still has to get the gas from somewhere. There is a fixed amount of export capacity and it’s almost impossible to bring more online on short notice, especially going into the summer season in the US when the liquefaction process is less efficient. It just rachets up prices which is what we’re seeing almost daily in the US markets.
Thanks LN Guy . You confirmed what I had posted on the old thread . The complexity that goes into getting LNG from the gas field to the gas stove .
The complexity of the transaction .
”It was up to Chinese energy expert Fu Chengyu to offer a concise explanation of why the EU drive of replacing Russian gas with American LNG is, well, a pipe dream. Essentially the US offer is “too limited and too costly.”
Fu Chengyu showed how a lengthy, tricky process depends on four contracts: between the gas developer and the LNG company; between the LNG company and the buyer company; between the LNG buyer and the cargo company (which builds vessels); and between the buyer and the end user.
“Each contract,” he pointed out, “takes a long time to finish. Without all these signed contracts, no party will invest – be it investment on infrastructure or gas field development.” So actual delivery of American LNG to Europe assumes all these interconnected resources are available – and moving like clockwo
thanks LN Guy,
Yes the bottle neck is liquification capacity, it will take time for more to come online.
In the mean time demand will be reduced due to high NG prices and alternative forms of energy will be brought online more quickly because profits will be higher for those projects due to higher electricity prices. There may also be some building refits to increase efficiency as again the high energy prices will reduce payback periods.
Watcher —
As for solar, 8 of the top 10 solar companies in the world are in China, and neither of the other 2 are in Europe. China has no reason to help an enemy solve a problem.
Production of new solar panels is expected to hit 500 GW / year by the end of the year. By comparison, there is about 390 GW of nuclear capacity currently available.
It’s not clear who is supposed to buy all those panels. It think it’s a pretty safe bet that quite a bit of them will end up in Europe. Anyway, I wouldn’t bet on shortages.
The idea that China is going to abandon the European market in favor of Russia’s failing Spain-sized economy seems about as delusional as Putin’s new plans to put a man on the moon.
Watcher,
The International Gas Union publishes an annual, data/graphic rich report that provides virtually all the timely info anyone may need in these matters. (IGU World LNG Report).
The 2021 publication is available online at ~50 pages with a 20 page appendix.
Simple conversion tools are 35 and 600 when going from ‘Murican to metric (cubic feet to cubic meters) and changing gaseous into liquid.
Your Boil Off Gas percentage may be a bit high, and the small residual heel (for tank pre-cooling purposes) combined takes a common ship’s capacity (175,000 cubic meters natgas in liquified state) to 3.2/3.5 Billion cubic feet delivered.
The proposed additional 15 Billion cubic meters of liquified natgas sent to Europe from the USA equates to a little over 500 Billion cubic feet annually (530 Bcf) out of a yearly total US LNG export of 4 Trillion cubic feet. (113 Billion cubic meters).
For some size context, that is a little over 2 weeks production from the Appalachian Basin.
As stated, virtually all US LNG exports are fully contracted out.
However, as Pakistan has discovered (Bangladesh also, I believe) some contracts can be unfulfilled supply-wise by the supplier paying a (15%?) penalty. With the huge run up in pricing of LNG, several trading companies have simply paid the penalties and re-directed ships to more lucrative markets.
As an aside, Watcher, your long running warnings about diesel shortage preciousness is now playing out in real time.
It remains to be seen if the corollaries of your energy-deprived scenarios manifest in the coming months.
You are 100% correct, IMHO, that the Europeans are facing exceptionally daunting conditions as next winter approaches.
Watcher hats off to you . When Coffee says you are 100% correct you can take an extra sip of whatsoever you are drinking at this hour . 🙂
Ovi,
Lot’s of great stuff, thanks! Regarding Canada – is that an all-time high for Canadian oil production?
Also, thanks for the commentary on Keystone and other Canadian pipelines. I’ve had a hard time trying to piece together that story. Do you think Canada may get to the point where they have more oil transport capacity to the US than their fields, mainly the oil sands, can deliver? (I think that’s the question the Wood Mac person was asking).
Bob
Thanks. Yes the 4.7 Mb/d is a new high that surpassed the previous high of 4.67 Mb/d just before covid hit.
Below is a summary from a 2019 forecast by the Canadian Association of Petroleum Producers. Clearly there has been a change from then but it gives one an idea of what would be possible without constraints and a stable oil price going forward.
You will see that it states a potential volume of 6.3 Mb/d in 2035 of which 4.25 Mb/d is oil sands. Note the 6.3 Mb/d includes diluent, about 30%. It is required to dilute the oil sands so it can be shipped via pipeline. That would reduce the oil sands crude of 4.25 Mb/d to close to close to 3 Mb/d and the 6.3 Mb/d to 5.0 Mb/d. I have read other articles which indicated Canada could get to 5.5 Mb/d. However in today’s CC and investment constrained world, I would not bet on the 5.5 Mb/d.
The combination of Line 3 and TMX will provide all of the takeaway capacity that Canada needs for the next three or four years. I think that Canada could add about 100 kb/d/yr to current production for the next 3 or 4 years. However after that I think the CC constraints and the government of the day will limit further production increases.
While TMX will add capacity, I think its main benefit to Cdn oil producers will be to increase competition and price for WCS from Asian refineries. You will note in the section on takeaway capacity, only two out of five pipeline proposals survived.
In addition to the pipeline capacity, Canada has transported close to 300 kb/d via trains to the US.
Production and Supply
Although overall Canadian crude oil production is expected to increase by 1.27 million b/d by 2035, this represents a 1.44% annual increase. Total production will increase by an average of three per cent annually until 2021, then slow to an average growth rate of one per cent annually. Oil sands production is expected to reach 4.25 million b/d by 2035 from 2.9 million b/d in 2018.
Total western Canadian supply (which includes diluent volumes) is expected to reach 6.34 million b/d in 2035, from 4.66 million in 2018. For comparison, in 2014 CAPP projected total supply from Western Canada would grow to 7.5 million b/d by 2030, incorporating an annual growth rate of more than double the current forecast.
Market Access
Major pipeline projects such as Northern Gateway and Energy East have been cancelled, and the Enbridge Line 3 Replacement project, the Trans Mountain Expansion project and TC Energy Keystone XL project continue to face challenges. All three pipeline projects were delayed in 2018 while price differentials reached record highs, resulting in the Alberta government implementing a production curtailment program.
As a result, Canadian producers are faced with insufficient takeaway capacity for crude oil. This limits Canada’s ability to serve existing markets in Canada and the U.S., and prevents Canada from accessing emerging overseas markets. The lack of sufficient pipeline capacity has forced Canadian producers to increasingly rely on rail to get crude to market. This is neither a long-term nor comprehensive solution to the lack of pipeline capacity.
https://www.capp.ca/wp-content/uploads/2019/11/2019_Crude_Oil_Forecast_Markets_and_Transportation-338794.pdf
Ovi,
The CER also has a forecast from 2020 at link below
https://www.cer-rec.gc.ca/en/data-analysis/canada-energy-future/2020/results/index.html
I pulled the chart below from link above. The reference scenario (assumes no action on climate change) has 2035 output at about 6.8 Mbpd and 2040 output at about 7 Mb/d, with roughly a plateau at around 7 Mb/d from 2040 to 2050. The evolving scenario (assumes some action taken to reduce carbon emissions) has output at about 5.8 Mbpd in 2035, roughly 1 Mbpd lower than the reference scenario.
Great info in the chart.
I suspect that the accuracy of the projections is probably much better than is applicable to the projections of most other countries.
Hickory,
Perhaps, but the future is difficult to predict, demand may fall below supply by 2032 and oil sands may become unprofitable and might drop steeply after that point, also difficult to know what policies will be chosen by future government officials, the lower projection up to 2032, may be pretty good imo.
Dennis
There is a lot of potential in Canada and I think that 6.0 Mb/d is easily achievable. I am not clear how much would come from mining and how much from SAGD.
However today the governing factor is the government in power and its anti oil sands stance. Prior to getting elected in 2019, the current prime minister said “The oil sands have to be shut down.” at an informal street meeting. Once those comments appeared in the news he quickly changed that to mean oil sands production need to be slowly phased out.
I will repeat the news clip I put in the reply to Hickory at the top
“Earlier this week, it (the govt) green-lit the proposed Bay du Nord oil project off the coast of Newfoundland and Labrador, largely on the basis that it will have low per-barrel production emissions relative to most Canadian oil extraction. Almost simultaneously, Environment Minister Steven Guilbeault sent a letter to Suncor Energy Inc., advising that its planned expansion of its Base Mine in Alberta’s oil sands is currently on pace to be rejected because of its relatively high emissions intensity.”
Suncor is the second biggest oil sands producer and is being told that they cannot expand their base mine to produce more oil.
Two years ago Teck withdrew its application for $20B Frontier oil sands mine.
They withdrew the application because of the increasing hostile environment that they were facing, even though they claimed that it was a low intensity GHG project. If it would have been disallowed it would have been difficult to reopen the application. They made a smart decision to withdraw.
They also worked with indigenous communities who approved the project and would benefit their nation. Getting indigenous approval is difficult and the industry now works to get them on board.
https://www.cbc.ca/news/canada/calgary/teck-frontier-1.5473370
Below is an interesting clip from the above article reporting on the cancellation.
“In July 2019, a joint federal-provincial review panel recommended the mine be approved, saying the economic benefits outweighed what it described as significant adverse environmental impacts.
However, a January report from the Institute for Energy Economics and Financial Analysis made the case that Teck’s application showed a “reckless disregard for the facts regarding oil prices in Canada.”
The joint-review panel relied on a long-term oil price projection of more than $95 US per barrel provided by Teck, the IEEFA wrote, about $40 US higher than current prices and around $20 US higher than other forecasts.”
Looks the the panel got the Oil Price right, $95/b. I don’t think they thought it would be there by 2021/22.
This article gives an idea of what was happening with protests in Canada in 2020
https://www.cbc.ca/news/canada/calgary/teck-fontier-oilsands-mine-reaction-1.5473986
“Lindsay also pointed to the blockades that have sprung up across the country, jamming national rail networks in protest against a natural gas pipeline in B.C., as having a significant impact on the company.”
Ovi,
Thank you for all the time and effort you put into providing the quantitative summaries and trenchant commentary. Agree with Watcher that Europe could be facing an economic crisis far sooner than alternative sources of energy can be implemented. As Tim Watkins has documented at his site, Consciousness of Sheep, the UK was in a precarious energy situation prior to the economic assault on Russia. How long can this go on? The USA stayed in Afghanistan killing people for 20 years, long after it was clear that the Afghanis would never accept Western occupation or become a puppet state. What if Russia digs in the same way? Any predictions to future oil production seem, as Dennis Coyne frequently points out, guaranteed to be incorrect, probably wildly so.
Brian
The only thing I do is convert cold EIA numbers into fancy charts. Yes the projections are going to be wrong, that is why we keep updating them every month. However I don’t think they are wildly wrong. At this point, I think the maximum error is about 2 Mb/d on world oil production, possibly on the low side. What do they say, “If you want to forecast, forecast often.”
You note in your comment above that Afghanis would never accept Western occupation or become a puppet state.
I think it is interesting to compare the current Ukraine situation with Afghanistan.
The US trained 320,000 Afghan soldiers to defend their country and the freedom they were given from 75,000 Taliban who wanted to run Afghanistan in their way. We know what happened there. The Afghani soldiers did not want to defend their country and women to be free.
Compare that to what is happening in the Ukraine. They have an army and volunteers that are dedicated to preserving their way of life and identity against an overwhelming force that is filled with a large number of soldiers not interested in taking over another country.
No one outside Russia knows anything about Russian soldiers. No one knows anything of any atrocities or massacres. Roughly 2/3 of humanity have voted either neutral or side with Russia. The world is not outraged by anything. Ignore everything in the media, both MSM and .RU. Pay attn only to oil and gas.
It is the first war being fought with perfect satellite reconnaissance for both sides. This is likely more significant than anything else.
The US exports big numbers of weapons. So does Russia. The trashing of Russian weapons in MSM derives from that. The .RU sources laugh derisively at Patriot vs S-400. Ukraine is a big weapons Expo.
Watcher , your POV is correct . The Kinzhal strike by RU proved that they have the hypersonic missiles that are accurate and can strike the target even before they come on the radar . NATO will not go to war directly because it will show that all NATO weapons are useless against the S 400 and other advanced systems devolped by the RU . What are Slovakia , Baltics , Germany etc shipping to Ukraine ? Soviet era armory and tanks which are past expiry date and nothing but tin cans . RU must now do an exhibition of it’s Kaliber and all the world will be knocking at it’s door .
P.S : Why is NATO not doing a a ” no fly zone ” ? Simple answer , the F16 , F22 and the F35 will face the S 400 and be annihilated. This means the end of a major part of MIC . Lockheed , Raytheon , etc
I live in Warsaw, about 150 km from the place where Russian bombs fell. The main train station is full of refugees. There is an atmosphere of terror and fear. I would not wish anyone to be in their place. And believe me, they’re not actors.
In Poland, gas storage facilities are 66% full. So we won’t freeze. https://agsi.gie.eu/
In Gdańsk, the oil transshipment terminal has sufficient capacity to immediately replace the Druzhba oil pipeline. The problem is the type of crude oil for the Płock refinery (we need heavy crude oil). We are aware that Russia’s export capacity will collapse in 10 years, so maybe it is better that we immediately sign new contracts with other suppliers (Saudi, maybe Iran, Iraq, UAE).
The S 400 (old designation S300 PMU3) is nothing else than the modernized S 300 that NATO countries have. Russia also doesn’t have many 40N6E missiles. Most of the launchers use old missiles. The F 35s don’t fly over Ukraine because nobody wants a nuclear war. We sent old Soviet equipment because the Ukrainians know how to use it. I know India bought the S 400 but I don’t consider it a good investment. But the fact is they are cheap.
This is my first comment so I would like to welcome everyone and thank all the authors for the excellent posts on the site.
Regards
Piotr
Piotr
Thanks for an on the spot and realistic report. Much appreciated.
Hi Piotr,
Thanks for the contribution to clarify the situation abit.
In your opinion is it possible that Russia might resort to using chemical weapons to win the war ? Or is it more likely that there will be a ceasefire and diplomatic resolution to end the war ?
Piotr s , . You are posting here for the first time . So let us get things in order . I am anti war . I have lost my immediate family in the Indo Pak wars . However I am not going to close my eyes to reality . So Russia’s capacity will collapse in 10 years ? How about Europe will collapse in 10 months . ? Gazprom has reduced the pressure of gas provided to Europe to the MOL . Poland does not buy gas directly from Russia but by the reverse flow of gas via Germany . It pays a premium to Germany for the gas . Stupid . Today is 66% full but we have to see the status when winter begins . This is the start of spring . Come winter I assure you when Brussels and Berlin call up Moscow no one will pick up the phone . The West did not sanction Russia , Russia sanctioned the West . Now to the S 400 . Why did Erdogan who is the No 2 supplier of manpower to NATO buy the S400 in spite of warnings by Washington ? He got input that the S 400 is superior to the Patriot . Same in India . The DoD( India) works with the DoD Israel . India was one of the first buyer of the Israeli spyware ” Pegasus ” . Well the DoD Israel told India S 400 is better than Patriot . Now it gets interesting . India is a member of the Quad ( India, Australia, USA, UK) an organization to contain China . USA is pushing India to buy the Patriot . The problem . 50 % of the military hardware of the Indian armed forces is of Soviet origin , so the S 400 fits into the system better than the Patriot . Nuland was in India regarding the Indian abstaining from sanctioning RF at the UN . She was told to return by the next flight available . Next was Lindy Truss Foreign Minister UK she was also shown the exit . Why ? The next man coming in town was Yang Yi foreign minister of China for whom a red carpet was rolled out . Connect the dots . Welcome to the blog . Hope to see more inputs from you .
Hole in Head,
Poland has been building the gas pipeline Baltic Pipe for many years to cut itself off from Russia. It will start operating from the new year. Long-term gas contracts with Norway are signed. We have additional contracts with Qatar and the USA. We don’t have to worry about gas for 10 years. The contract with the Russians expires at the end of the year and would not be extended. Regardless of the situation in Ukraine.
Do you think that if F 35 were as bad as you describe, Germany (new buyer), Israel, Japan, Korea would order several hundred of this type in total? These countries could choose the F 15 EX (Israel and Japan use the old versions of this type) but chose the F 35.
Turkey has tested the S-400 air defence system against drones and F-16 fighter jets at low altitudes. According to Turkish media, the Turkish military has identified some deficiencies against a slow-moving object at a low altitude.
https://www.globaldefensecorp.com/2020/02/01/turkey-exposed-fatal-flaws-in-russian-made-s-400-surface-to-air-missile/
Sorry for off topic.
HinH ” Why is NATO not doing a a ” no fly zone ” ? Simple answer , the F16 , F22 and the F35 will face the S 400 and be annihilated.”
Is this an example of very poor grasp on reality or part of guileful disinformation campaign?
Iron Mike,
Personally, I think that the Russians want to exhaust Ukraine’s armies and economy. They want to force them to sign an unfavorable peace treaty.
Hickory,
The Russians always try to convince foreigners that their equipment is the best and that their army is the strongest. In fact, the war in Ukraine showed the truth about their army. However, “Russia is never as strong as she looks; Russia is never as weak as she looks.” (Attributed to multiple individuals, including Winston Churchill.)
Hicks , F35 is a joke . The biggest scam and boondoggle paid for my the US taxpayer . This is ” an aero plane that can’t fly straight ” . F16 and F22 ? They have never faced SAM ( surface to air missiles ) . Never ever (NEVER EVER) since they were first put in service . Shooting innocent civilians in Iraq and Afghanistan and facing only shells from anti aircraft guns is a different ball game compared to SAM’s . Challenge . Employ a ” No fly zone ‘ over Ukraine . Let us walk the talk . NATO is past expiry date just like EU , etc .
Piotr- Agree
“the Russians want to exhaust Ukraine’s armies and economy. They want to force them to sign an unfavorable peace treaty”
Its a race to the bottom.
-good to hear from you. we are lucky to hear things from your perspective/location
So Russia wants to sign a treaty that is unfavorable ? So what do you expect ? Play buddy, buddy after loosing thousands of their soldiers . Guys this is war . Let us stop pretending . Did Japan or Germany sign a treaty that was unfavorable to them ? There are no options when you loose the war . The victors call the shots .
I wrote a book about the F-35. You can download it here:
https://www.archibaldforcurtin.com/downloads/American%20Gripen%20The%20Solution%20to%20the%20F-35%20Nightmare.pdf
It is a complete dog. In the USAF its nickname is ‘Fat Amy’. The USAF just cut its order by 33% because they have the NGAD coming.
Pioter . You can build your pipeline but their is no gas simple . USA is running in empty and Mr Shellman has warned about it several times . Qatar is sold out to the hilt and so is Norway . The world is “peak gas ” . Asia will outbid Europe for all LNG . Europe is against China , Taiwan , South Korea , Japan and India . All these countries have The demand and the money . Face reality . Don’t get taken by false promises .
https://www.reuters.com/business/energy/us-gas-storage-emptied-by-exports-europe-asia-kemp-2022-04-08/
As to India’s purchase of the S 400 . Here is the link .
https://indianexpress.com/article/explained/s-400-purchase-air-defence-system-india-us-relation-7626388/
Regarding the fighter jets Mr Archibald has explained the situation regarding the F35 . My understanding is that currently the French Rafael and the Israeli Mirage are the best in their category . Don’t have any info on what the Russkies and Chinese are doing .
HiH,
Shale gas is a completely other game than oil. Mr. Shellman is in the oil field, not the pure gas plays. We would need a real gas man working in the fields here for inside informations.
Gas is much better for fracking – since it doesn’t clot the fractures like a liquid. So the gas wells deliver factor 2-3 more BOE than the oil wells, making their EROI much better. Hell, Germany could frack itself for round about a third of it’s gas demand – but this won’t happen, even when the hell freezes over.
Several OPEC countries want to expand gas export, in the median sea are several untapped new fields. Gas is not scare for the next few decades – only current gas production capacity.
And here another pork cycle looms – when everyone expands gas production capacity because of sky high prices and demand – this can lead to a big gas glut in 5 years. Many LNG facilities will run on low load then.
Eulen , perhaps LNG Guy can chip in .
Hole in Head,
We are perfectly aware in Poland that gas production in Norway will decline. But not dramatically. Some of the deposits in Norway belong to Polish oil companies. So I would not be afraid of gas supplies to Poland. At least for the next 10 years. This is due to a multi-year policy of diversification from the supply of fossil fuels.
https://www.oxfordenergy.org/publications/norwegian-gas-exports-assessment-resources-supply-2035/
Besides, we still produce a lot of coal. And we have the 9th largest coal reserve in the world. Even the European Commission looks more at coal now. At least for now.
No one outside Russia knows anything about Russian soldiers. No one knows anything of any atrocities or massacres.
Oh, okay, those videos of the dead bodies of men, women, and children were all staged? Is that what you are trying to say Watcher? Were no hospitals or schools bombed? Was the train station not bombed? Or could you be mistaken? Could someone know there are war crimes happening?
The truth is just the opposite of what you state. No one inside Russia knows what is happening in Ukraine. Their government is preventing any of what’s going on in Ukraine from being given to the Russian Public.
However if you mean everyone can know but just don’t care, you should make that clear. Because that is not how your comment comes off. It appears that you are saying that the news of what is happening in Ukraine is not being broadcast to the world. If so, you are mistaken. While it is true that some people are more concerned about the price of oil than the deaths of the inniocent population in Ukrain, that is far from true about everyone. People in Europe are horrified about what is happening, just as most people in America.
Yes, we are afraid and shocked because we are human but also because we, in Europe, are afraid of being next in line after Ukraine.
Anyone know the latest on CN Rail & those bitumen pucks?
Biden looks for ways to increase Canadian oil imports without adding pipelines
https://seekingalpha.com/news/3820901-biden-looks-for-ways-to-increase-canadian-oil-imports-without-adding-pipelines
Last I heard Capline was reversed and doing about 200,000 barrels a day.
https://www.spglobal.com/commodityinsights/en/market-insights/latest-news/oil/010722-capline-pipeline-reversal-fully-online-with-extra-canadian-crude-capacity
Just took a quick look at annual US net imports of crude oil in 2021. The total was 3130 kb/d of net imports of crude oil to the US in 2021 and net imports of crude oil to the US from Canada was 3445 kb/d in 2021. Imports of crude oil from Russia in 2021 was 199 kb/d and from OPEC imports were 796 kb/d in 2021.
imports
https://www.eia.gov/dnav/pet/pet_move_impcus_a2_nus_epc0_im0_mbblpd_a.htm
net imports
https://www.eia.gov/dnav/pet/pet_move_neti_a_ep00_IMN_mbblpd_a.htm
crude by rail
https://www.eia.gov/dnav/pet/pet_move_railNA_a_EPC0_RAIL_mbbl_a.htm
about 152 kb/d of Canadian crude oil was imported by rail in 2021. So the bulk of the crude moves through pipelines from Canada to the US (about 95.5% of the total Canadian net imports of crude oil are by pipeline, if we assume very little is imported from Canada by ship or barge).
Hi Dennis, thx for the info and references. I was considering that perhaps some Canadian oil is piped to BC coast and sent on ship to California refineries. Perhaps Canada will do more of that once more pipelines reach their west coast.
I found this Canadian link that states interesting export stats for Canadian oil; “In Atlantic Canada, tankers are used to deliver offshore production to Europe and U.S. PADDs I and III”
https://www.cer-rec.gc.ca/en/data-analysis/facilities-we-regulate/canadas-pipeline-system/2021/crude-oil-pipeline-transportation-system.html
Survivalist,
Thanks, I couldn’t find that info at the EIA. My guess that little is transported by ship seems to be incorrect. In 2020 7.8% of Canadian exports were by water, 87.6% by pipeline and 4.6% by rail.
Survivalist
Attached is some strange/surprising info regarding the current Trans Mountain pipeline. The majority of its oil is shipped to Puget Sound for shipping to Asia and to the many refineries in Washington state.
At one time much of it went to California via ship. Then California brought in the Clean Fuel Standard which required that the Carbon content of gasoline had to include the carbon used to produce the crude. Its real intent was to shut down the import of oil from the oil sands. It worked because oil sands had a higher carbon content associated with production. Since then it has dropped and continues to drop.
Table showing where the oil goes.
Both California and Washington state refineries used to receive much of their oil from Prudhoe Bay. To some extent, Alterta oil sand production has now replaced Alaska oil production for these refineries.
Dennis
Attached is a monthly chart of Cdn oil exports to the US. As you can see it parallels Cdn oil production shown above. Exports peaked just before the pandemic hit, dropped with the pandemic and have now started to climb again as Cdn production rises again. I think the US will take as much oil as Canada can export because of the current $12/b to $14/b discount to WTI.
Rail exports to the US recently have been in the range of 130 kb/d. I think that they go to closer mid western refineries as opposed to Texas. Attached is a table that shows rail capacity reached over 400 kb/d in early 2020. Once it was clear that Line 3 would start operating in Late 2021, rail exports stated to slow from 200 kb/d in early 2021 to the current 130 kb/d.
Rail Shipments
Thanks Ovi & Dennis et al. I really appreciate all the input & info.
Ovi,
In your frack spread chart, I see a slowing increase in frack spreads from June 2021 to April 2022, to roughly an increase of 7 per month, a plateau at 275 frac spreads is not really indicated by that chart imo.
An alternative to frack spread data is to look at DPR completion data for tight oil focused basins (Anadarlo, Bakken, Eagle Ford, Niobrara, and Permian). The trend from May 2021 to Feb 2022 is a monthly rate of increase in tight oil well completions of about 10 per month. I expect this to continue if oil prices remain high.
Also note that completions in Appalachia and Haynesville have been flat to down since October 2021, so the slow down in the rate of increase in frack spreads may be due to a slower rate of increase in natural gas focused frack spreads.
Data from DUC data spreadsheet at page linked below
https://www.eia.gov/petroleum/drilling/
Dennis
Not knowing how many frac spreads are for oil and gas is a problem. My view that frac spreads may plateau in the 275 range is strictly my eye ball impression which I use a lot. Also attached is a chart showing frac spreads vs rigs. Rigs are increasing at a much faster rate than frac spreads. Since December, 75 rigs have been added in comparison to 8 frac spreads.
I wonder if the frac spread crews are more efficient now than in the past or is it difficult to get people to work in the oil fields in general. I wonder if any of our participants know what is happening with staffing frac spreads and are they getting more efficient.
Ovi,
You may want to glance at some of the articles describing so called ‘simul fracs’. This technique was introduced about 2 years ago and is rapidly gaining in acceptance throughout the industry.
Essentially, it is a near doubling of completion activity (as measured in stages completed per day) while using the same number of – possibly slightly more/larger – pumping units per completion crew.
It is optimal with 4 wells, and average stages per day is about 14, up ftom 8.
A few companies have hit or exceeded 20 stages in a 24 hour period.
As was stated a few months back on one of your posts … there is a growing disconnect between historical metrics (rigs/frac spreads) and production as Super Spec rigs routinely drill 5,000 feet plus per day (over 11,000 is the record), and lateral lengths are increasing with the oil boys catching up to the gassers with 15,000 foot laterals becoming routine.
150,000 feet of lateral drilled/completed with 10 wells offers enormous savings over a 15 well approach.
This is increasingly becoming an arena for the Big Boys.
Coffeeguyzz
Interesting info. I keep thinking what really can they do better. You have provided another front for improvement.
Coffeeguyzz,
Note that although output per well increases with longer laterals, we also see lower output per 1000 feet of lateral as lateral lengths increase. Nobody is increaseing the number of acres in existence, so the longer laterals (say 15000 feet vs 10000 feet) simply means 2/3 fewer potential drilling locations, if it becomes “routine”, last I heard it is about 10 to 15% of wells drilled in the Permian basin that are more than 12500 feet. You call this “routine”, I call it a small fraction of wells completed.
Ovi,
The important figure is oil focused frac spreads vs horizontal oil rig count, we have one number, but not the other.
My chart was an attempt to focus in on the information we do have (tight oil completions). The lag in the data between rig counts and completions makes the relationship tricky, there is roughly a 4 to 6 month lag between changes in rig count and changes in completions as there tends to de a delay between the start of drilling and a well being ready to start production (maybe 5 months as a rough guess on average).
In any case the frac spread count data we have available does not tell us how many frac spreads are oil directed, this takes some guessing.
It may be a bit cheaper to drill longer laterals, but more oil is left in the ground with this approach (less output per acre).
Dennis
“The important figure is oil focudes fac spreads vs horizontal oil rig count, we habe one number, but not the other.” I agree with this and also mentioned it in my response.
Your chart shows increasing completions per month but we don’t know why. Is it efficiency or more frac spreads. I wonder if any of our participants knows how many completions per month a frac spread can do. Coffeeguyzz info implies they are getting more efficient. However at some point, as oil rigs keep increasing, frac spreads will begin to increase. I was just intrigued by the four month interlude/flatness.
Ovi,
Probably a combination of better frack spread efficiency and possibly a decrease in gas focused frack spreads while oil focused frack spreads increase (though this is speculative as we do not have the data on the oil/gas frack spread split). We do have data on oil rigs and oil completions, which is why I chose that angle.
Ovi,
In your chart I think you may use horizontal oil rigs, but the frac spreads are oil and gas so it should really be horizontal oil and natural gas rigs on x axis.
Dennis
Yes, to be consistent that makes sense. However. that would only stretch out the X axis and not change the Y axis. So the 75 rig change from December would just get bigger without adding any info on frac spreads. I am curious to see the relationship between frac spreads and oil rigs as the rigs increase. It is surprising to me that 75 rigs get added over 4 months while only 8 frac spreads are added. Looking for some insight and explanation.
In going from 250 rigs to 425, there was a quasi linear increase in fracs. That relationship broke down in December. At some point, fracs will begin to increase. Will the new rate be the same as the previous one. If it is lower, that could imply that frac crews are getting more efficient.
Ovi,
I imagine the explanation is that a lot of the frac spreads were working on excess DUC inventory, as that inventory decreases more drilling rigs are needed to keep DUC inventory at the desired level.
The frack spreads increased to the level needed for the oil companies to complete the number of wells for their capital spending plans, once that is achieved there is no longer any need to increase the number of frack spreads.
Yes the x-axis gets stretched, but the slopes might change as there may been a change in the ratio of oil to gas focused frack spreads. One cannot tell until we do the chart.
Here are all horizontal rigs vs frack spreads from February 7 2020 to April 22, 2022
Dennis
I am trying to find a new/different trend in the rig vs frac relationship that has developed since 2020. In that case old data should not be brought in because the times have changed. Your data clearly shows that. I have posted a similar graph many moons back, again using only oil rigs.
As I said in the post above, adding in all rigs would just stretch the X axis. See attached graph. Note the key dates for peak fracs have not changed.
Ovi,
Seems to me producers think they have adequate frack spreads employed for existing DUC inventory and capital spending plans. Rig count may be increasing more quickly than frack spreads so that the DUC inventory can be increased before any significant increase in frack spreads might resume in the future.
Also of interest is the relationship between frack spreads and well completions (using DPR DUC spreadsheet). Chart below has April 2021 to Feb 2022 (last data point from DPR) to avoid the winter anomoly in Feb/March 2021 (big drop and then rebound in frac spreads due to severe storm in Feb 2021). For each frac spread added on average about 1.9 more wells get completed due to the increase in frac spreads.
Dennis ,Ovi . Your thoughts .
http://davecoop.net/seneca.htm
Hole in head,
We will see in a few years if it is an accurate projection, my guess is the odds are about 1 in 1000 that output will be less than 33 Mbpd in 2040 as projected in that chart.
Chart below has my best guess for World C plus C.
Dennis, shouldn’t there be a dip in your chart starting around April of 2022? I know it’s a 12-month average but this dip should be very noticeable.
Ron,
Possibly, but I don’t try to make short term predictions, I just wait for the data, the chart shows annual average output. When I have annual average output data for 2022 (likely on April 1, 2023), the forecast will be updated.
Currently the guesses for World C plus C annual average output from 2022 to 2028 in Mbpd are 80.4, 81.8, 82.6, 83.4, 84.1, 84.4, and 84.5.
Putin is working hard to bring Russia closer to a seneca type decline.
HIH
It is an interesting Seneca cliff function that he has created. However there is not enough down side data to really asses how good the fit is. Also the cliff goes to zero production in 2044. More realistically there could be a cliff over a period of 5 to 10 years and then after that, oil production might follow some exponential decline.
The cliff will start to rear its head in Saudi Arabia and other ME countries when the oil water interface gets within a 1/2 to 1/3 of the field depth away from all the Hz wells that produce the oil. In other words, for the second case, that area of the field where the hz wells are located is 2/3 water and 1/3 oil. At that point the interface becomes unstable and starts to get broken because the water is pushed by the driving pressure faster towards the well than the oil and the well output is a mixture of water and oil. In Simmons book, he mentions that water shut off valves are installed on the maximum contact wells.
I recall reading an article a few years back where it said that 6.9 Mb/d of water were being pumped into Ghawar and Aramco was recovering 4.6 Mb/d of oil. Clearly the oil/water interface must be very unstable in many places. The last reported official production for Ghawar was 3.8 Mb/d.
According to the source below, Ain Dar produced dry oil up to 1999. It produced dry oil for 48 years. Many articles claim that Ain Dar is now watered out.
“The first oil discovery at Ghawar took place in 1948 with the successful drilling of Ain Dar No. 1 discovery well, which was later commissioned as a production well pumping at a rate of 15,600 barrels per day (bpd) in 1951. The well continued to produce dry oil without any water contamination until 1999.”
https://www.nsenergybusiness.com/projects/ghawar-oil-field/
Thanks Ovi and Dennis for your inputs . I am going to save this chart for future discussion and see how good the forecast was .
HiH,
That kind of drop implies a world wide catastrophe around 2023-2025. You are talking about an end of civilization type scenario, quite unlikely in my opinion.
In contrast Dennis’s projection is BAU with high oil prices assumed. More likely. Dennis is playing it safe lol
Hey, an end-of-civilization scenario is underway right now. It is just happening so slowly that very few people seem to notice. I just happen to read the following lines just before I read your post.
“Philosopher David Griffen recently issued this dire warning:
I believe the human race now faces the greatest challenge in its history. If it continues on its present course, widespread misery and death of unprecedented proportions is a certainty. Annihilation of human life and of millions of species of non-human life as well is probable. This is so because of polluting technologies, economic growth-mania, out-of-control population growth, global apartheid between rich and poor nations, rapid depletion of non-renewable resources, and proliferation of nuclear weapons combined with a state of international anarchy that makes war inevitable and sufficient measures to halt global ecological destruction impossible.”
Ron,
I agree with that philosophers words. But if its happening slowly or at a gradual pace we will never see a seneca type cliff scenario that the chart in HiH link shows.
The way i see it is basically this. The current economic system has many moving parts and is inherently complex. Now humans have been more destructive to the environment since the advent of agriculture.
Industrial civilization increased that destruction exponentially. Now the million dollar question might be, how much more can we destroy until a part of the economic system which affects the other parts is completely broken AND cannot be replace by human ingenuity or innovation.
No one knows that answer. Again my point is if its a slow grind until slowed economic growth or essentially reduction in maybe GDP/capita, we will never see a seneca cliff. Seneca cliff type scenario implies exponential rate of degrowth, it will be extremely chaotic if it comes to fruition.
Iron Mike , the chart is not made by me but by Dave . I think Ovi has done a very good explanation . On a personal front I have a bet with Dennis of oil $ 25 by 2025 . I foresee a deep recession that will be never ending . To keep BAU beyond 2025 seems unsustainable . Further I am not looking at total production but ELM( Export Land Model ) and the quality of light oil that will be available for blending with the extra heavy oils . These are where I presume the cracks are going to appear first . Russian sanctions will directly effect ELM . A small hole can sink a big ship and our credit fueled financial system needs continuous growth . The conundrum is that there will be no growth but degrowth and ” The end of growth is the beginning of collapse ” . I am going to post a comment by Petro in 2016 . Very interesting bullet points . All are requested to comment on that .
Petro says:
01/17/2016 AT 2:26 PM
Thank you for enumerating my sentences and inserting spaces between them!
Very synthetic and concise of you…
Be well,
Petro
answer is in 2 parts:
-Macro-view, or overall “picture” and,
-Micro-view, or why crude or specific densities of it sell for -$?).
Macro-view:
1, going to get worse, much worse. please do not “quote” me on that
2, every/any other forum/site/media/book/paper/publication/presentation etc.,
etc., etc., they confuse and make you “foggy”.
3,Don’t seek solutions.There aren’t any
4,forget about supply/demand, market fundamentals.
5, Normal economic and fundamentals do NOT work anymore.
6, Everybody in the world is producing full capacity as prices go to $0.
7, Oil above $60-$70/brl kills the economy; Oil below $50-$60/brl kills your business.
8, Demand/supply and market fundamentals worked before, when we had plenty of sub $10/brl oil
up until 10-15 years ago but not anymore
9, Because we are left with “Bakken and 10-mile-under-sea-Horizon” type of oil. That
works only with high yield (aka: junk bonds) paper financing
10, That is why you see shale/tar and other production going exponential ONLY after 2008-2010 (hint: TARP1,
TARP2, QE1…QE99…) even though fracking is a 50-60 year old technology
11, Was never use and/or improved before because it did not make economic and financial sense
12, QE99…ZIRP… was used to finance Chesapeake, Occidental and a lot of others
13, Peak Oil will not come as the consequence of physical constraints (i.e no more oil in the ground.).
14, Peak Oil shall follow financial collapse (already in progress) in very short order.
15, (we) will never see $100-$150/brl oil under NORMAL market conditions because the problem is a
demand/affordability/debt collapse problem – NOT a oversupply/glut problem.
16, Over supply production is consequence of the “last man standing” to take out the higher cost oil
by producing at full capacity so the price per barrel goes >$0
Therefor prices will go lower
17, The prices will then spike as the result of financial-economic-political collapse, and/or war,
and/or natural-climate calamity, and/or all of the above.
18, we are now entering a deflationary wormhole (death spiral )remotely similar is Roman Empire
during 4-5 century AD.
and as Petro stated
…presented in short of detail and extremely simplistically
Still wtg on micro view I guess
Corrections anyone ?
Forbin
REPLY
Iron Mike , here is the post from 2016 . Obviously English is not Petro’s mother tongue and Forbin had assisted in getting the points in order . Forbin is still commenting which is encouraging .
The part “similar is Roman Empire
during 4-5 century AD. .”
This just reminded me of Mike B and his posts on the collapse of the bronze age . Mike B , long time no posts . Hope u r ok .
Hole in Head (and anyone else wishing to save comments),
The date and time stamp above each comment is a hyperlink to that comment. That means that you can right click the hyperlink and save the link and then paste it into a text file. This enables you to provide a link to the comment you are quoting in addition to giving the time stamp. I still recommend saving the text of the comment in the event that for some reason the hyperlink fails.
I will add that discovering the major Emacs mode org-mode has made managing data and links one whole hell of a lot easier for me.
Thanks Schinzy for the tip . I always wondered how Dennis and others linked to the old posts . Time for an old dog to learn some new tricks . 🙂
HiH,
I give you credit for putting your neck on the line and making semi-precise predictions.
So your view is 2025 WTI = $25/barrel.
And around the same type we enter a terminal decline in real GDP ? Is that correct?
I honestly don’t know whether you are right or wrong. My simple view which most people on this blog will probably agree with is if we are talking about a seneca cliff type scenario (whether in human population or real GDP), the simple obvious view is if the energy component is removed from both those metrics then we will see that happen. In other words. If there is a seneca cliff in energy production/consumption real GDP and a lagging effect on human population will follow suit.
I completely agree with you on the economic system needing continuous lines of credit to grow otherwise it collapses, that much is obvious.
Iron Mike , we have been in a terminal decline but for the 1% . Flipping overpriced houses to each other and shuffling paper ( stock buybacks etc) is not growth . The real economy has not grown . Peak cars was 2017 . Considering housing and cars are the two major components of “real” output we were nowhere . Housing has been bubbleconmics fueled by the zero rate interest policy of the FED . Peak all liquids was/is 2018 and hence no growth in supply . The world got blindsided because we hit peak oil, peak gas and peak coal in unison = peak energy .This was not envisaged . We got caught with our pants down . For me ” peak ” means not only production but end of ” cheap, abundant and affordable ” energy . I was intrigued by Petro’s comment(2016) so I had saved it ( have many others ) . I have saved the Dave post for future reference .
Heavy truck sales in the U.S. are a “very good leading indicator of economic activity, with 65% of the dollar value of North American freight moved by trucks. But new truck sales have been falling sharply, now at -23% on an annual basis. New auto sales are falling at a similar rate. Truck and auto sales combined are falling at a rate previously only associated with recessions.
https://www.energyintel.com/00000180-19ad-d278-a7c8-7ded42d20000
OPEC plus managed to increase output by 86,000 barrels last month
Alexander Shpilman: The ban on oil supplies from Russia will lead to a violation of the global balance and this will not be allowed
April 12 / 07:55
Nizhnevartovsk. In the face of uncertainty caused by unprecedented pressure on the Russian fuel and energy complex, everyone is wondering how the industry will develop, its trade relations and the future of large projects that involve not only large teams, but entire cities. In an interview with the Neftyanka Internet resource, Alexander Sokolov, director of exploration at PETROGEKO LLC, in particular, suggested that oil production in Russia will fall from 524 million tons (2021 level) to 350-400 million tons in 2023. At the same time, the main sequestration will take place in Yugra, where about 40% of Russian oil is produced today. This is connected not only with the rejection by the West (about 100 million tons of oil per year), but also with a serious reduction in domestic consumption (15-20 million tons). Thus, for example, in Yugra, after the reduction, production will reach the annual level of 165 million tons. In this situation, the oilmen will be faced with the choice of which projects to close: the old fund or the new one. As for gas, the geologist believes, the situation is even worse, because we do not have the infrastructure for its long-term storage. And, finally, according to Sokolov, the entire current assessment of reserves should also be called into question.
An expert of the GKZ, the Central Committee of the Kyrgyz Republic and the Oil and Gas Information Agency, Ph.D. Sc., Honored Geologist of Yugra Alexander Shpilman:
– It is quite simple to estimate the total loss of Yugra’s oil production as a result of the OPEC + decision. Daily production in Yugra in April 2020 is 658 thousand tons. Year on year 658 × 365 = 240 million tons. In February 2022, production amounted to 623 thousand tons. Year on year 623×365 = 227 million tons per year.
The difference is 13 million tons in 22 months, or about seven million tons per year, which is 3% of annual production. Approximately the same pace has been the natural decline in oil production in the Khanty-Mansi Autonomous Okrug-Yugra in recent years. We can say that the total effect of OPEC+ decisions for Yugra in two years is almost zero.
The main factor in reducing or increasing production is the price of oil. Now a barrel is above $100, which indicates a shortage of oil on the world market. If any events lead to an excess of oil production, the price will fall to $30-40 per barrel, and, apparently, then OPEC + will again decide to reduce total production.
Since the price of oil is now high, it is a mistake to make a forecast about a decrease in oil production, in my opinion. In my opinion, in 2022, oil production in Russia will be > 500 million tons, in Yugra > 200 million tons. The forecast of oil production in Yugra, made by me and the specialists of the TsRN of the Khanty-Mansi Autonomous Okrug-Yugra in 2008, is still being confirmed: at present and in 2022 – 212 million tons of oil.
The reason for this optimistic forecast is as follows. There is a world balance of oil consumption, and the replacement of supplies from Russia with raw materials from another country means for Europe that the shortage will arise elsewhere. The world balance will be restored after some time.
Russia still has hydrocarbon resources. This is new oil, new gas, which has yet to be discovered by prospectors.
As for long-term forecasts, in 2050 the Yura will reach the production line of ~150 million tons per year, and Russia will produce about 300 million tons per year, which corresponds to the level of domestic consumption now. This prediction, by the way, I did earlier. And I do not think that it will be significantly revised. That is, in principle, both the authorities and the oilmen in the Khanty-Mansi Autonomous Okrug have always understood that production will be reduced, regardless of additional external factors, due to a reduction in the resource base.
If we talk specifically about recoverable oil reserves, then these are official data – about 15 billion tons. These are proved reserves, i.e. discovered and profitable for development and production. There are other numbers, but you need to be an expert in the field of reserves estimation to understand and appreciate the subtle differences. Every year, the reserves are incremented and provide the current level of oil production in Russia >500 million tons of oil per year.
As for gas, the resource base is even better here. Proven reserves ~50 trillion cubic meters with production of ~700 billion cubic meters per year. As well as with oil, there are also higher estimates of reserves, but it is necessary to clarify the degree of exploration or study of them. We export about 200 billion cubic meters of gas per year. Gas liquefaction technologies have made it more mobile. In principle, we do not need to think how much they will buy. We must first of all provide heat and energy for the needs within the country, our homes and factories. Then the question of selling it will not be acute.
In my opinion, in Russia it is urgent to declare the era of hydrocarbon energy until 2050, to forget this fight against the carbon footprint, invented and not scientifically substantiated.
Hydrocarbon gas is not the curse of Russia, but the happiness and future prosperity of our country. I would only worry about the figures for domestic gas consumption in Russia. Here, every percentage increase is our development.
Alexander, you forgot to consider that industrial sanctions against Russia will remain in place until it withdraws from all of Ukraine (yes, that includes Crimea) and learns to live within its borders.
This will have a very long term affect on production capacity and access to markets.
“carbon footprint, invented and not scientifically substantiated”
Nice quote from the 1970’s.
Hickory.It is quite possible that sanctions will always be in place. I do not imagine that sanctions will force Russia to do anything. The development of events in Ukraine is difficult to predict.
As for the carbon footprint, I agree with you on this. I think that it is not invented and is really present. With the cessation of hydrocarbon production, its value will decrease. But I agree with the author of the article that it is given too much importance.
However, in connection with the sanctions, I think the carbon footprint will increase.
“However, in connection with the sanctions, I think the carbon footprint will increase.”
Because of countries resorting to coal rather than using nat gas from Russia?
Yes, of course. I meant it.
On this we agree.
The sanctions will do one thing for sure: Prevent them building leeding edge high tech weapons in big quantities.
For them you need stuff from the whole world around. And their chinese “friends” don’t need to have them armed up to the teeth – it’s more a raw material province to them. They can keep low tech weapons, but China doesn’t need an armed up to the teeth neighbor direct at a 1000s mile border. A bit weak is more perfect.
They can do what they like, but they have to do it with more low tech stuff. They can switch to war economy – then we’ll have to crank up weapon production here, too.
And that’s the big problem of Russia anyhow. They could have sold their raw material, , switch so some aviation and nuke tech – selling nuklear plants world wide. But no, they need an imperium.
Old aunt NATO was getting tired anyway, European countries very loathly to put much in military – no threat from this side. Making an invasion into Russia with a few hundred tanks, most of them build in the 80s with some strap on gadgets??
Now they will build new material, drones, rockets and stuff. A rude wake up call.
They better kept on selling their stuff and paying their internet trolls and secret service operations, as everyone does. Some bribed politicans bring more than 100 jets.
“The sanctions will do one thing for sure: Prevent them building leeding edge high tech weapons in big quantities.”
—–
I doubt it. Even in the USSR, at that time they were able to create the S300 and Tochka U using domestic technologies. Now I think there are more possibilities. However, I can’t judge for sure.
Alexander,
One should not mix up the USSR military capability and how it compared with the West at the time with Russia’s capability as of today. I was very impressed by the tech developed by USSR back in the days. In some areas, USSR managed to developed weapons years ahead of the west and at a fraction of the cost too. The S300 is probably a good example, particularly the vector trust. Russia as of today is a different story. Its military industry seems to mainly enrich a handful of people and it is incapable of producing high-tech equipment in high volume that actually works on the battleground. There is much hype on the new tech and the upgrades. It looks nice in military parades in Moscow and worked well against civilians, for example in Syria. Ukraine is different as it is armed and united.
The hyped upgrades on the old soviet equipment are a joke too. Take for example the reactive armour on the battle tanks. It was supposed to stand against modern western portable missile systems like the NLAW. It does not.
A speculation from my side: in the old days USSR scientists and engineers believed in the “system” and worked loyally. Today’s kleptocracy system is a different story.
I do not know how this will end, no one does. But, I stated a week into the war that Putin will not get control of a majority of Ukraine and that he has managed to unite the west (and Ukraine) in a way many though was impossible. I still hold this view. Hole in head called me names and claim that Putin will get control of at least 2/3 of the country.
A speculation in the energy issues and carbon emissions. The higher energy costs may very well reduce economic activity to the extent that CO2 emissions reduce or at least do not increase as much as projected. Food and fertilizer issues are perhaps the biggest short-term problems for other countries as of now.
Nothing to see here. Russia cuts off access to its oil statistics. I’m sure that’s because everything’s hunky dory:
https://www.reuters.com/business/energy/russia-says-limiting-oil-data-access-protect-local-market-2022-04-14/
Oil rises on OPEC warning and easing of Shanghai COVID curbs
LONDON — Oil prices climbed on Tuesday as Shanghai’s relaxation of some COVID-19 restrictions eased concerns about Chinese demand and as OPEC warned it would be impossible to replace potential supply losses from Russia.
So OPEC is now admitting that they’re tapped out.
OPEC is reduced to Saudi, Kuwait, UAE, Iran and Iraq
Is anybody keeping up with Venezuela these days?
If so, please post anything relevant about the state of the oil industry.
Thanks.
I wonder what this means about the reliability of OPEC secondary sources:
https://www.spglobal.com/commodityinsights/en/market-insights/latest-news/oil/033122-opec-votes-to-stop-using-iea-production-data-to-assess-quota-compliance-sources
It is often the case that those who prepare reports are competent workers, but when the higher ups do not like the conclusions, they and the politicians to whom they answer change what is written. Thus OPEC might think that IEA is no longer impartial, and rely only on private units. But this is a possible explanation and not necessarily why it has happened.
Schinzy,
Probably means very little, they have dropped IEA and added WoodMac and Rystad. They have about 7 different secondary sources and simply take the average of those 7, seems reasonable.
The EIA’s Short-Term Energy Outlook just came out. They have Russia dropping 700,000 bpd this month, April, to 10.59 Million bp/d, then dropping by a lesser amount each month before reaching 9.65 million bp/d in December 2023.
That is total liquids, not C+C.
Victoria sure did a good job.
The EIA seems to think that Non-OPEC less USA has peaked. Well we know OPEC has peaked or very nearly peaked. So I guess it’s up to the good old USA to save the world from peak oil.
Somehow I don’t think we can do it.
The below chart is total liquids, not C+C.
World Oil C+C production has been updated in the original post above. The original chart has been left for comparison with the new chart. December 2023 C+C output has been reduced by 880 kb/d.
Dennis, after seeing the updated chart, you can see why discussing the third decimal place when making forecasts is not worth the effort.
Note that those readers, outside of our participants, who see this post through other sites will not see this update unless they click at the bottom where it usually says “Original post”.
Saudi down 250 kb/d in March according to EIA.
https://twitter.com/staunovo/status/1513915237447122950
EIA sees OPEC-13 crude oil production fell by 0.36mbpd m/m to 28.22mbpd in March. M/M changes: Saudi Arabia -250k, Nigeria -110. EIA forecasts OPEC-13 production averaging 28.80mbpd (was 28.94) in 2022 and 29.37mbpd (was 29.18) in 2023.
Any word on why the Saudi production dropped in March?
Frugal
Recall that a rocket from Yemen hit one of their refineries
“The assault on Yasref facilities has led to a temporary reduction in the refinery’s production, which will be compensated for from the inventory,” it said, referring to Yanbu Aramco Sinopec Refining Company, a joint venture between Saudi Aramco (2222.SE) and China Petrochemical Corporation (Sinopec).
https://www.reuters.com/world/middle-east/saudi-led-coalition-says-four-houthi-attacks-hit-targets-kingdom-no-casualties-2022-03-19/
A hit on a refinery shouldn’t create a production decrease.
Much possibilities: Put it in tanks (SA storage level is very low at the moment – they have more than 100 million barrel tank space), export it directly on the spot market for quick cash at the current prices.
According to the OPEC MOMR Saudi production increased by 54,000 barrels per day in March. Where are you getting this information?
Ron
I am wondering if Frugal meant to ask why is the SA output increase so low? Under their commitment, they should be adding between 100 kb/d/mth and 115 kb/d/mth. The attack on their refinery caused the March short fall.
Dennis
I am not sure what your point is here. I know that refineries do not produce oil but they accept it and refine it.
Here is a quote from the article.
“The assault on Yasref facilities has led to a temporary reduction in the refinery’s production, which will be compensated for from the inventory,”
Please stop making such picayune comments. Its adds nothing to this boards elevated discussions.
Where are you getting this information?
From EIA:
Table 3c. OPEC Crude Oil (excluding condensates) Production
Pollux,
The STEO is a forecast of future output which is often incorrect. As Ron pointed out OPEC reports (from secondary sources) that Saudi crude output increased by 54 kb/d in March.
This may be evidence that Saudi Arabia might be approaching capacity as they were supposed to increase output by 105 to 110 kb/d. Even in the direct communication table in this month’s MOMR the Saudis say output increased by 75 kb/d. In fact as a group (leaving out Iran which does not report direct communication) the secondary sources (less Iran) have OPEC output increasing by 50 kb/d, while the direct communication table adds up to a decrease of 75 kb/d. Much of this decrease comes from Iraq at -112 kb/d based on direct communication.
Ron has estimated that OPEC will struggle to reach 29 Mbpd of crude output, this data suggests he is correct.
The STEO is a forecast of future output…
Dennis, note the release date of STEO for the March number:
Release Date: Apr. 12, 2022
Also, note that STEO does not have any Saudi specific number of future output (April, May, and so on):
Table 3c. OPEC Crude Oil (excluding condensates) Production
But why does EIA “forecast” a fall by 250 kb/d to 10 mb/d in March when their quota is 10.331 mb/d?
Dennis, note that crude exports (until January) from Saudi is still lower than Avg 2017-2021. Also something to follow.
Vaca Muerta Argentina Shale
November 2021 number, oil 557K bpd, highest national number in 9 years
gas same month 128M cubic meters/day — LNG import facility proposed closed 2019, is finishing closure
$1.5B pipeline govt approved from Vaca Muerta to Buenos Aires and from there north to a province currently supplied by Bolivia
Source unclear, IMF
Talk of an LNG export facility. Likely bogus. Subordinated to gas pipelines underway headed west and north. They are on the road to eliminating Latin America as a customer for Qatar or the US.
U.S. Senator Joe Manchin’s visit to Alberta cheers Jason Kenney’s government
Alberta Premier Jason Kenney took Manchin on a tour of oilsands facilities near Fort McMurray on April 11, and then the senator attended an energy roundtable on April 12 with diplomats and business leaders from Canadian energy and pipeline companies.
The collegial visit from Manchin is a stark contrast with other headline-grabbing oilsands tours of recent years from celebrity activists, including Jane Fonda, who visited in 2017, or dignitaries such as South African Archbishop Desmond Tutu, who called for a boycott of fossil fuel producers ahead of his trip in 2014.
In January, Canada exported almost 4.6 million barrels per day of oil and other petroleum products into the United States, about 56 per cent of all imports. Officials on both sides of the border have said they’re looking for ways to boost those numbers to help the U.S. and its allies fulfil their energy needs.
“The (Keystone) XL pipeline is something we should’ve never abandoned,” Manchin said, acknowledging that while the Keystone XL brand is “probably gone,” the project could potentially be reconfigured or rerouted in some form.
Alberta’s energy minister, who previously worked for Enbridge and the Canadian Energy Pipeline Association (CEPA), said Manchin’s visit is the most successful such visit she has seen in her 15 years of working in the sector.
“When you hear those words: ‘the United States needs Canada’ – I think that’s the most successful trip, the most successful dialogue that I’ve heard to date,” Savage said.
https://financialpost.com/commodities/energy/oil-gas/u-s-senator-joe-manchins-visit-to-alberta-cheers-jason-kenneys-government
Russian oil output falls below 10 mln bpd, lowest since July 2020 – sources
April 12 (Reuters) – Russian oil and gas condensate production fell below 10 million barrels per day (bpd) on Monday to its lowest since July 2020, two sources familiar with data said on Tuesday, as sanctions and logistical constraints hampered trade.
Russian oil production has been under a massive downward pressure amid sanctions from the West over Moscow’s role in Ukraine.
The United States introduced its ban on oil imports from Russia last month, while sanctions on Moscow’s financial institutions made it hard to process payments for Russian oil.
Sources said Russia’s average oil output fell to 10.32 million bpd on April 1-11 from 11.01 million on average in March, a decline of more than 6%.
OPEC told the European Union on Monday that current and future sanctions on Russia could create one of the worst ever oil supply shocks and it would be impossible to replace those volumes, and signalled it would not pump more.
Russian Deputy Prime Minister Alexander Novak said on Thursday that Russian oil production may decline by 4% to 5% in April from March due to problems with insurance and usage of vessels.
The sources said, output fell further to 9.76 million bpd on Monday alone, according to Reuters calculations, the lowest since 9.37 million bpd on average in July 2020, when output and demand were dented by the spread of coronavirus.
One of the sources also said that Russian largest oil producer by output, Rosneft (ROSN.MM), has registered the largest decline in output, which fell to 2.87 million bpd on April 1-11 from 3.35 million bpd in March.
My input:
Russian oil production is falling, not just because countries have stopped buying, but also because all the foreign service comapnies have pulled out. Halliburton, Schlumberger, and Baker Hughes have all pulled out of Russia along with Shell, BP, and ExxonMobil. Russia is without the expertise to do its own drilling and maintenance. Russian oil production will keep falling and will not return until they have competely pulled out of Ukraine.
One might wonder what countries were the major importers of Russian oil (2020)
Of the top ten- 38% was purchased by China
The other 62% was purchased by various European countries, Korea and Japan.
Here is an interesting question facing heavy truck developers
I can see both sides of the discussion. However if a commercially viable solid state EV battery becomes reality, the battery wins.
Truck Makers Face a Tech Dilemma: Batteries or Hydrogen?
Under pressure to cut emissions, truck manufacturers are choosing between batteries and hydrogen fuel cells. Wagering incorrectly could cost them billions of dollars.
Truck makers are divided into two camps. One faction, which includes Traton, Volkswagen’s truck unit, is betting on batteries because they are widely regarded as the most efficient option. The other camp, which includes Daimler Truck and Volvo, the two largest truck manufacturers, argues that fuel cells that convert hydrogen into electricity — emitting only water vapor — make more sense because they would allow long-haul trucks to be refueled quickly.
Battery-powered trucks sell for about three times as much as equivalent diesel models, although owners may recoup much of the cost in fuel savings. Hydrogen fuel cell vehicles will probably be even more expensive, perhaps one-third more than battery-powered models, according to auto experts. But the savings in fuel and maintenance could make them cheaper to own than diesel trucks as early as 2027, according to Daimler Truck.
Proponents of hydrogen trucks argue that their preferred semis will refuel as fast as conventional diesel rigs and weigh less. Fuel cell systems are lighter than batteries, an important consideration for trucking companies seeking to maximize payload. Fuel cells tend to require fewer raw materials like lithium, nickel or cobalt, which have been rising in price. (They do, however, require platinum, which soared in price after Russia invaded Ukraine. Russia is a major supplier.)
There is a 3rd possibility, small batteries and online recharging. “Road trains”. Siemens is working on it:
https://press.siemens.com/global/en/feature/ehighway-solutions-electrified-road-freight-transport
We have the test installation here 50 miles away on Autobahn 5. They use railway technology, so it’s not everything developed new.
Eulenspiegel
Difficult to visualize miles and miles of trolley wires on highways.
I don’t think it’s a solution for the USA.
Here in Europe the distances are shorter and the main routes more full. When, and only when, they choose this variant here they will use it on the main routes and give the trucks a battery for 50 miles to drive to the logistic centers, or bridge a gap with a failure. And for the first time the trucks will keep it’s diesel engine.
It is a rather low tech and robust, trolley busses works. The main issues seems to be legal/develop standards. It will also require upgrades on the grid and this can be costly in some areas. Perhaps it is suitable in Germarny? In regions with weak grids and heavy trafic it might be more costly.
They don’t use the tech from trolley busses, they took the tech from railway. That’s even more robust – Transrapids drive up to 400 Km/h with this tech, or big freight trains have engine heads that pull 10 MW.
It’s not that much of a dilemma, because a hydrogen truck is an electric truck. Hydrogen vehicles are battery driven because fuel cells can’t deliver the sudden surges of power that vehicles require. So most of the drive train is the same tech.
Actually another option is a battery/fuel cell hybrid
Alimbiquated/Stephen
A battery in an integral part of the Fuel cell power system. A fuel cell vehicle requires a battery to start/warm the fuel cell, especially on cooler and below zero temp days. The battery is required to bring the fuel cell up to operating temps. Also the protein exchange membrane has to be moistened, especially if the outside temp is below freezing. It also is sued to capture braking energy. It is just a question of the battery size required. The size may be determined by the extra power required for max acceleration to get the vehicle up to speed.
If you want instant power for overtaking etc. you also need a battery or a capacitor, since a fuel cell works best at a constant, fairly low (relatively) power output.
But the battery/capacitor can be charged during periods of less power needs, so no problem really.
That’s just a starter battery.
https://www.sciencedirect.com/science/article/abs/pii/S136403212030410X
Stephen
It is more than a starter battery.
“Battery and fuel cells are promising alternatives owing to high efficiency and low (even zero) local emissions. However, they are limited by either the low capacity or sluggish dynamic response. These shortcomings can be overcome by the hybridization of battery and fuel cells,”
The fuel cell has sluggish dynamic respond. The battery compensates for that,
“Red Apple Group Chairman and CEO John Catsimatidis – Oil Is Infinite”
Here is a gem from the folks at Fox News. Looks like CEO Catsimatidis believes oil is constantly made, not from dinosaurs: https://video.foxnews.com/v/6300750950001#sp=show-clips
Always enjoy new sources of comedy and laughs.
steve
Oil from the Earth is formed from ancient biotic sources and is absolutely finite. Stupidity, ignorance and exaggeration is infinite. Amazing how the news channels allow such bullshi+ to be unchallenged on their broadcasts!
The guy is a pig but he said North America could do 15 million barrels/day, which is not a lie because North America includes Canada and Mexico. Yet, USA consumes 20 per day.
The USA consumes around 20 million bp/d Total Liquids. And that is about exactly the amount of Total Liquids the USA produces. The EIA labels this production Total petroleum and other liquids (Mb/d) and they label our consumption Petroleum Products Supplied. Look it up. It is about a wash almost every month.
We import some stuff and we export about the same amount. Basically, it’s a wash.
Ron
It may be a wash in terms of volume. It is not a wash in terms of energy. The NGPLs have a lower energy density than gasoline and more lower than diesel and jet fuel.
For example conventional gasoline has an energy density of 116,090 Btus per gallon, while propane has an energy density of 84,250 Btus per gallon. That translates into 1.38 gallons of propane containing the same amount of energy as one gallon of gasoline. Similarly for ethanol.
There are also higher C>4 components in NGPLs that have higher energy density than propane but are all less than gasoline and diesel.
An interesting exercise for someone.
Ovi, Yes, NGLs and other liquids have a different energy content than crude oil and condensate, or more correctly, the products they produce. However how much of each do we produce and how much of each do we consume?
I don’t have those figures but I would bet it’s pretty close to a wash. That is I would bet we consume about as much C+C as we produce and that we consume about as much NGLs and other liquids as we produce.
But if you have those figures, and if they are quite different, I would not argue with you.
Ron
Attached is a weekly EIA report.
For March 25, the top 4 products, which are high energy content products, accounted for 70% of product supplied. For March 18, it is 72%. Difficult to know what products are in Other Oils, but I would guess it is products primarily between C4 and C6 since the EIA breaks out C3, i.e. propane.
So the US is producing 11,700 kb/d of high energy crude but using 13,368 kb/d (88%) of high energy products for March 25. For March 18 the comparable numbers are 11,600 and 15,229 (76%).
As a rough guess, it looks like the average weekly energy deficit could be somewhere between 15% and 20%. Something a bit of belt tightening could address. Canada and Mexico become valuable partners
I have chosen those two weeks to cover your range of 20,000 kb/d
Crude oil imports destined for further refining are redefined as domestic sources and so add to the net export column — this is an accounting gimmick that doesn’t reflect USA oil extraction accurately. This stuff is “extracted” from the refinery LOL.
I have long maintained that IEA and EIA data is contaminated (Useless ) . For me the PPS( Petroleum Production System ) is oil producers , pipelines , refineries . From Ghawar to the tank of six pack Joe in Montana is the key . If six pack Joe cannot get or afford it then the oil in KSA = sands of Arabia . A chink in any will lead to a collapse at the petrol pump . The weakest link are the refineries . You cannot defeat ” Liebig’s law of the minimum” . The chain is as strong as it’s weakest link .
I also love the smoke screen ” refinery gains ” . What is that ? My s*** converted into f****’s ? 🙂
P.S : Output cannot be greater input . Physics is the champion .
Hole in head,
Different types of fuels have different densities, the explanation is not very difficult.
The reports are done in volume rather than by mass. There are no physical laws that say volume in is equal to volume out. And even mass in is not equal to mass out if some mass is converted to energy as occurs in nuclear reactions, but that is not really relevant in refinery operations.
Paul
What is being compared here is US production of C + C (Line 1) with Product Supplied, lines 27 to 30. The increase in lines 27 to 30 is largely due to Line 6, imported commercial crude oil.
Ovi, I have no problem with your data. Thanks.
USA exports ~3 million barrels/day of crude oil
https://www.eia.gov/todayinenergy/images/2021.07.20/main.svg
USA produces (i.e. extracts) ~12 million barrels/day of crude oil
https://www.naturalgasintel.com/wp-content/uploads/2021/03/us-annual-crude-oil-production-20210309.png
So USA has 12-9 = ~9 million barrels/day to themselves to consume, out of the 20 million barrels of oil the USA burns daily. This chart breaks it down into components.
https://www.eia.gov/todayinenergy/images/2021.08.05/chart2.svg
Those essentially add up to 20 million barrels, so the “refinery gains” do look massive, unless the bookkeeping trick is used. Hey, I am just looking at the numbers as they are being presented .
(up to 6 million barrels/day could be NGL, but that means the deficit is still 5 million, w/1 million refinery gains to play with)
Paul the exact data can be found here.
World Oil Production
The data is from August through December 2021. You don’t have to guess, It is right there for you to copy.
Yes, the point is 3 million is exported and because that produces a deficit we need to import at least that much to make up for it. I also want to keep the ethanol and biofuel out of the discussion, because of the misguided view that we are a tremendous net exporter of extracted fuel.
Refining output is larger than input. An easy to understand explanation. Most products are lighter than crude.
The total volume of products refineries produce (output) is greater than the volume of crude oil that refineries process (input) because most of the products they make have a lower density than the crude oil they process. This increase in volume is called processing gain. The average processing gain at U.S. refineries was about 6.3% in 2020. In 2020, U.S. refineries produced an average of about 45 gallons of refined products for every 42-gallon barrel of crude oil they refined.
https://www.eia.gov/energyexplained/oil-and-petroleum-products/refining-crude-oil-inputs-and-outputs.php
Ovi, I have been following oil production and consumption since about 2002, so of course, I know all that.
That being said, the US could consume 6.3% more products than C+C produced and it would be a wash. That is the crude we produce would match exactly the products consumed counting the refinery process gain. If we produced 1881.5K barrels per day and consumed 2000K bp/d it would be an exact wash.
I think we actually do at least a 100k better than that, so it’s not a wash after all.
Ron
We are back to the same discussion, Volume vs Energy, WTI has a API gravity of close to 40 vs LTO of close to 46. LTO contains less energy than a reference WTI barrel which is used to make gasoline and diesel. Heavier Mexican and Canadian crudes are preferred for making diesel.
“The production of light tight oil (LTO) in the U.S. has grown substantially in the last decade. Thus, a prevailing question in the oil refining industry is whether oil refiners can adjust to the increased supply of light crude oil. This study addresses this question using a long-term optimization model for the global oil refining industry. We operate the model over two-year recursive optimization horizons from 2017 until 2030, taking post-coronavirus crude oil supply projections from Rystad. The estimated API gravity of the projected LTO supply is 46. Products’ demand projections are taken from the International Energy Agency but are adjusted for the recent demand reduction due to COVID-19.”
https://www.google.com/url?sa=t&rct=j&q=&esrc=s&source=web&cd=&ved=2ahUKEwibpai7sJv3AhXLVs0KHbFuC8AQFnoECDMQAQ&url=https%3A%2F%2Fwww.kapsarc.org%2Ffile-download.php%3Fi%3D74213&usg=AOvVaw3UFotOXO2j5hwEXCQoJe9V
Guys , I don’t care what EIA , IEA etc post . I stick by my earlier post the only real oil in the USA is
Conventional + GOM + Alaska + LTO ( minus exports ) = about 6-7 mbpd . The rest is smoke and mirrors . You like the fuzzy warm feeling with the lies , be my guest . But don’t complain when the TSHTF . Truth like cream always rises to the top .
You’re right. Summing state-by-state, and subtracting exports, it comes out over around 6 million barrels per day.
https://worldpopulationreview.com/state-rankings/oil-production-by-state
But add in offshore and it is 7.5 million.
Total liquids US production also includes about 1 million bpd of corn ethanol, production from roughly 40 million acres of prime farmland.
(sidenote- solar/ev could produce more net transport mileage on well less than 100,000 acres, for comparison)
But the etrhanol production analysis is not quite that simple since it takes a large amount of diesel to produce that corn crop (and nat gas for processing).
I don’t know the net liquids energy balance, but it is not all that favorable.
OECD Oil Inventories. Outlook keeps increasing, actual inventories dropping
Russia says limiting oil data access to protect local market
April 14 (Reuters) – Russia’s Energy Ministry is limiting access to its statistics on oil and gas production and exports, it said on Thursday.
The ministry “is limiting the distribution of information, which could be used as an additional pressure on the Russian market and its participants,” it said.
The ministry unit which compiles the data, the CDU TEK, did not publish monthly data on April 2, according to two clients, in the first such delay in years.
SNIP
“For now, we assume (April) losses will grow to an average 1.5 million bpd for the month as Russian refiners throttle back further and buyers shy away,” the Paris-based body said.
“From May onwards, close to 3 million bpd could be offline as the full impact of a widening customer-driven voluntary embargo on Moscow comes into effect.”
The Russian shut-in is proceeding more slowly than the IEA predicted last month, when it forecast that the 3 million bpd loss would take effect from April.
Russia through June 2022 according to the above prediction.
https://www.nytimes.com/live/2022/04/14/world/ukraine-russia-war-news/putin-admits-sanctions-have-hurt-russias-oil-and-gas-sector
HZ wells and laterals for Dummies . Mike S has still a sense of humour .
https://www.oilystuffblog.com/single-post/think-this-hz-shit-is-easy?postId=032114f9-0ca8-4dff-84d2-5ee5336330d4&utm_campaign=1b5502b6-7db3-4d12-9bd2-4aee9272b297&utm_source=so&utm_medium=mail&utm_content=6b497a8e-53c4-4b50-9e39-284e924e1036&cid=fa335351-37bb-44a6-9899-f8c34b4a0f81
Hole in head,
Thanks. Great stuff from Mr Shellman.
That one is a gem! Too stoopid to understand half of it but worth the read nonetheless
Thank you, Stephen. And HIH and Dennis. To predict the future of oil and natural gas in America its important to recognize its NOT just data, NOT just numbers; its all very, very complicated and, like life itself, it changes every minute. I received an AFE today for a one well Wolfcamp lateral in downtown Midland, <15K feet long, $15MM total D&C. There will be 1,000 different RI owners in that drilling unit, some owning RI under their town homes. Even at $100 oil it will struggle to have an ultimate ROI of 150%. OPM makes smart people, stoopid.
We are all being bombarded these days with lies; on one side its the lie of abundance, and energy independence…just give us (tight oil and gas) more money and you, the American consumer will be fine. On the other side, the side that implies we can get rid ourselves of fossil fuels tomorrow easily, without economic or ensuing emotional pain…that is a far more dangerous lie. Other people's money makes not so smart people, more stoopid.
Both sides lay claim to the moral high ground; neither or correct. They are both lying.
Be ready.
Thanks for reading my stuff.
I think Putin reads http://www.oilystuffblog.com
His right hand man agrees with you
https://www.reuters.com/article/us-oil-sechin-idUSKCN0VJ0RB
That is a compliment Mike S….Putin is a horrible human but talented.
thanks for your great work!!
PS: I saw your blog referenced on http://www.market-ticker.org the other day. Good work!!
Mike,
Yes it is no doubt very complex. The numbers are useful, but the perspective of those who know what oil production entails is more important. I do the best I can with the information available. I do not have the skill of Enno Peters to pull all the data together, or the money to pay thousands of dollars per year to access all of the information he has put together. I make do with what is avaiable for free at the shaleprofile.com blog. I also try to incorporate what I learn from you.
The average D & C cost I use for a 9500 foot lateral in the Wolfcamp is about $10.3 million (in 2021 $) or about 1084 $/foot, for a 15k lateral that would be $16.26 million, if we assume there was no cost savings (on a per foot basis) compared to the 9500 foot lateral, based on your report it seems there may be some cost savings as you report 1.26 million less than what I would estimate. That is good to know.
Thanks for that information.
Elsewhere you have suggested that much of the Delaware and Midland basins is unlikely to be profitable.
In the chart below the low scenario assumes onlyabout half of the prospective net acres (as outlined in the USGS mean assessments for TRR) is actually utilized (about 25 million of 50 million net acres). This scenario has a URR of about 44 Gb with about 70k wells completed after 2021, this is close to the F95 TRR estimate of the USGS for Permian basin. The 62 Gb scenario assumes only the best benches (highest EUR per acre based on USGS mean estimate) are developed, the highest scenario uses the USGS mean estimate and other estimates shown are averages of the various scenarios (53 Gb is average of 44 and 62 Gb scenarios and 57.5 Gb is average of 53 and 62 Gb scenarios). All scenarios assume maximum completion rate is about 800 wells per month.
I made no “report” to you; it was a simple comment about a one well lateral in downtown Midland. There is no information to take from an AFE for one well unless you have the benefit of the actual AFE. You don’t. I do.
I have NEVER remotely suggested that wells were not profitable in the Permian at $100/$5. I have said, repeatedly, that cash flow is not “free” when ones assets are still encumbered by massive, and ever increasing debt and that net cash flow is not the same as profit.
A top down analysis of future tight oil supply from the Permian using TRR resource estimates per square mile is foolish and a waste of time. Its also misleading to people actually worried about their oily future.
Mike,
I have used many of your comments which give tidbits of information. Do you believe the USGS F95 resource estimate for the tight oil in the Spraberry, Wolfcamp, and Bonespring formations of the Permian basin is unreasonable?
For those unfamiliar with the terminology (Mike obviously knows this) an F95 estimate is one that has about a 95% probability that the actual resource that is technically recoverable is larger than the estimate. Or put another way, the probability that the technically recoverable resource will be 44 Gb or less is about 5%.
A correction, the 44 Gb scenario assumes a maximum completion rate in the Wolfcamp, Bonespring, and Spraberry formations (as a group) is about 650 wells per month from 2026 to 2028, with a gradual ramp up to that level from 400 wells per month in April 2022 to 650 wells per month over a 52 month period.
Using a 35% increase in D&C costs and 40% increase in operating expense, the average 2019 Permian well has cumulative net revenue of 21 million over its life (shut in at 20 bopd) in real 2021 $ at a wellhead oil price of $70/b0, natural gas at $3.50/MCF, and NGL at $24.5/b all prices in 2021 US$. This is for a well with a lateral length of 9500 feet and EUR of 420 kbo, 2259 MMCF natural gas, and 187 Kb NGL over 157 months.
At 36 months cumulative net revenue is 12.6 million in 2021 $.
I expect we will see debt levels decrease at current oil price level. Perhaps oil companies will be so poorly managed that all free cash flow will be paid to shareholders as dividends and debt levels will never decrease, I think oil company CEOs that may hold large amounts of stock in the companies they run, are unlikely to follow that stategy. Shareholders would be wise to require 50% of the earnings of CEOs and other high level management to be paid out in stock options so that their stake in the company is high enough that they run it well.
Note that both positions that you outline I agree are not realistic, there is another position that claims that fossil fuel resources are limited (in the case of the Permian basin perhaps 44 Gb of crude oil) and that only with great difficulty will we be able to transition to alternative sources of energy and that we should get to work on that problem and utilize the resources available as efficiently as possible.
Dennis/Mike
This is a wide ranging video on the oil market. Covers many topics. At what price does crude affect the economy. Russia. OPEC spare capacity. Real market for crude vs Paper market. At 27:30, he addresses US Shale. Peaks in 2 or 3 years.
Be interested in knowing if anyone has any background on the main speaker.
https://t.co/mw7Dc7rQ0k
2022 Oil Production Increase Expected by the IEA
World oil supply in 2022 has the potential for a Saudi-driven gain of 6.2 mb/d if OPEC+ fully unwinds its cuts. Oil output from OPEC+ could rise this year by 4.4 mb/d, resulting in reduced effective spare capacity in 2H22 of 2.6 mb/d, held primarily by Saudi Arabia and the United Arab Emirates. Non-OPEC+ growth of 1.8 mb/d in 2022 will be led by the United States.
This not seem to account for any production drop from Russia.
Ovi . Just for your info Fatih Birol believes in ” abiotic oil ” . 🙂
Well the IEA’s Oil Market Report – April 2022 came out 10 days ago with a slightly more reasonable report. But still unreasonable in my opinion.
Global oil supply rose in March by 450 kb/d to 99.1 mb/d, led by non-OPEC+. Russian oil supply is expected to fall by 1.5 mb/d in April, with shut-ins projected to accelerate to around 3 mb/d from May. Despite the disruption to Russian oil supplies, lower demand expectations, steady output increases from OPEC+ members along with the US and other non OPEC+ countries, and massive stock releases from IEA member countries should prevent a sharp deficit from developing.
Global refinery throughputs are forecast to increase by 4.4 mb/d from April to August due to new capacity and normal seasonal gains. This would allow product inventories to see the first build in two years, offering some respite to the tight market. Overall, 2022 runs are forecast to gain 3 mb/d y-o-y, but will remain below 2017 levels.
Peak crude Russia?
Will Russia ever get back above 10 Mbpd?
I seriously doubt that Russia will ever produce 10 million bp/d again. But it is a lead pipe cinch that they will never produce 11 million bp/d again.
Have Schlumberger, Halliburton, and Baker Hughes announced their withdrawal from Russia current operations,
or a just halt to any new project investment/involvement?
I’ve seen mixed messaging on this.
“The current sanctions against Russia ban new investments of U.S. and EU companies in Russia’s energy, but they do not restrict the existing operations, according to FT.”
Schlumberger, Halliburton, and Baker Hughes’s pullout of Russia was their own decision but they were definitely influenced by sanctions. The below article is a month old but it is the only thing I could locate right now.
Baker Hughes joins oil rivals in pausing Russian operations
NEW YORK — Baker Hughes, a major U.S. oil services company, added its name Saturday to the growing list of U.S. companies that are pulling back from Russia in response to Moscow’s war against Ukraine.
Baker Hughes made its announcement one day after similar moves by oil rivals Halliburton Co. and Schlumberger. The steps from the Houston-based businesses come as they respond to U.S. sanctions over Russia’s invasion of Ukraine.
In its statement, Baker Hughes, which also has headquarters in London, said the company is suspending new investments for its Russia operation and is complying with applicable laws and sanctions as it fulfills current contractual obligations. It said the announcement follows an internal decision made with its board and shared with its top leadership team.
“The crisis in Ukraine is of grave concern, and we strongly support a diplomatic solution,” said Lorenzo Simonelli, chairman and CEO of Baker Hughes.
Halliburton announced Friday that it suspended future business in Russia. Halliburton said it halted all shipments of specific sanctioned parts and products to Russia several weeks ago and that it will prioritize safety and reliability as it winds down its remaining operations in the country.
Schlumberger said that it had suspended investment and technology deployment to its Russia operations.
“Safety and security are at the core of who we are as a company, and we urge a cessation of the conflict and a restoration of safety and security in the region,” Schlumberger CEO Olivier Le Peuch said in a statement.
Another link to Mike S blog . Puncturing the 100 years of Natural gas myth .
https://www.oilystuffblog.com/forumstuff/forum-stuff/100-years-of-us-natural-gas-my-ass
The problem of Europe and Russian gas supply . LNG imports are not the answer . A real assessment .
https://doomberg.substack.com/p/measure-twice-sizing-europes-natural?s=r
The flip-side of European nat gas imports from Russia pipelines (roughly 155 bcm/yr as of 2021)
is the dependence of Russia on European customers for its nat gas exports.
Russia has no alternative path for its nat gas to reach world markets, over the next 3-7 years minimum.
As of 2021 Russia exported 210 bcm/yr via pipeline with 155 going to Europe.
The new Power of Siberia pipeline sent 10 bcm/yr to China, and this is planned to be upgraded to 38 bcm/yr
over the next few years.
There is no pipeline facility to divert the other 120+bcm/yr from Europe to other customers.
Russia exported roughly 40bcm/yr via LNG in 2021, operating at full capacity.
Surely it will attempt to increase that capacity.
It will be expensive, and difficult to accomplish rapidly even without the headwinds of sanctions isolation.
The supplier is dependent on the customer, just as the customer is dependent on the supplier.
LOL .
“The tragedy of modern war is not so much that the young men die but that they die fighting each other–instead of their real enemies back home in the capitals.”
–Abbey
Exactly what the German Army was doing in WW2 – heading to Baku until the NAZI maniac leader Hitler redirected the armies to Stalingrad where they were annihilated.
I’m surprised the relentless rise in natural gas prices hasn’t gotten more media attention. Electricity prices will be rising quite a bit this summer. Maybe recession will cause the prices to crater before winter but if not it’s going to be interesting. And with a la Nina I’m expecting a hot dry summer especially in the middle of the country so this summer could prove interesting as well.
We’ve only had prices this high three times in history and all three times there was a collapse in prices for one reason or another.
Lnguy, it seems like nat gas export levels have finally reached a point where it is turning into a globally priced commodity, what’s your opinion on that?
I agree, that’s where things are going. As with oil though Americans got used to cheap natural gas when it was a stranded commodity. Now it’s not. Prices for heating and electricity are going to go up, possibly significantly. To me this will have a major impact on the suburbs and exurbs especially in winter. Which again is why I’m sort of perplexed why it hasn’t been discussed more broadly in the media. Honestly I feel that high CH4 prices are more inelastic and more impactful than gasoline prices. You can buy smaller cars and not drive as much, but turning the thermostat down in winter can be more dangerous.
How do the Japanese heat their homes?
One room at a time. Is this the answer for America also. Need to buy a couple of electric heaters.
Japanese people usually heat their homes one room at a time. In general, homes do not have central heating in Japan, because many Japanese believe it is better to keep yourself warm than heating a whole house. In old times people had one hearth in a central place called an irori (いろり). This hearth would also be used to cook and smoke food. It even helped protect the house itself by drying out the wood with its heat thus preventing rot, fungus, and wood disease. Thanks to the heat of the irori many homes have been beautifully preserved. If you see an irori it usually has a fish decoration somewhere. This figure symbolically protects the house against the fire of the hearth.
https://wattention.com/why-are-japanese-homes-so-cold-during-winter/
Another Option.
https://brightside.me/wonder-curiosities/japan-doesnt-have-central-heating-this-is-how-they-survive-in-winter-its-ingenious-41555/
Don’t invite too many neighbours over.
Makes too much such for an American audience.
Yet my husband and I have lived in an old Maine farmhouse for decades with just that approach to heating. In the fall, we fire up our kitchen range with coal, and as the winter arrives, we add a wood stove to the parlor, then in sub-zero we light the woodstove in the bedroom and covert the parlor stove to coal. We’ll burn two coal stoves through March, with the whole upper story of the house closed down. In spring, we reduce the number of stoves and convert back to wood, gradually shutting down heating in May, unless a cold snap forces us to fire up a woodstove again. As backup, we have a couple of kerosene stoves and plug-in heaters.
Flexibility isn’t just for gymnasts.
LNguy,
A lot of people buy heat pumps, which can reduce natural gas use for home heating. As natural gas prices increase, solar, wind, hydro, nuclear, and geothermal energy all become much more competitive in the power market and will displace some use of natural gas in the supply of electricity.
It will take time and in the mean time we will see higher electricity prices.
Yes we do not have natural gas in our area (aside from the millions of barrels of it we liquefy but have no access to for residential ironically). So we use heat pumps to heat in the winter. Some have propane backup heat but ours is electric. On our old builder grade heat pumps when it was in the 20s and 30s the aux heat would kick on and the meter would spin so fast. We now have two new trane XVi series and they so much nicer. I’m not sure the aux heat ever kicks on and they run at low compressor speeds most of the time. The air is much warmer too.
Of course they were $12K a pop so I’m not sure about payback on that investment.
These have come a long way in the last few years. My firm did our first large scale residential project with VRF heat pumps about five years ago. Now this approach comprises about 80% or our new construction projects.
The early generation had quite a few problems during low temperature performance and we had to work around this with some creative natural gas backup. By about 2019 new compressor technology had pretty reliable performance down to “code minimum” which in our area is -10F.
There is still a risk during very cold days that the system performance drops off precipitously. During the polar vortex there were many catastrophic failures of these systems which caused pipes to burst.
It’s still an excellent path forward for new construction, or those who can afford it.
I’m designing a small passive house for my family and will be using the technology. With wood heat option as a backup for pleasure, resiliency, and emergency. Climate zone 5.
But for most areas outside of climate zone 5 and 6 these systems are excellent.
Natural Gas Prices highest in 14 years this Monday
https://oilprice.com/Energy/Natural-Gas/US-Natural-Gas-Prices-Hit-Highest-Level-In-14-Years.html
Dennis, you think I explained this poorly, but it’s that simple. Tar and condensate are not oil. The dumbell effect is crushing and middle distillates are declining faster than overall production.
By opecs own statements their production will peak in September and then billions will die over the next few years.
Are we looking at the wrong parameter = production of oil ? Diesel is critical and things are not encouraging . Removal of Russian oil is accelerating the shortages and making trucking too expensive .
https://comedonchisciotte.org/le-sanzioni-nato-e-limminente-carenza-mondiale-di-gasolio/
https://extra.ie/2022/04/07/news/fears-diesel-will-run-dry
Ribren , where were you all these years ? Thanks for what you posted . At least I have one supporter for my argument . The world is missing the trees for the woods . Very few here understand that 80% of the world’s protein are thanks to the Haber Bosch process of converting methane into ammonia . Muchos Gracias , Amigo . Welcome to the only blog that has a civilized conversation on the future of mankind .
In my neck of the woods. While the prices of diesel and gas have fallen in last few weeks the spread between diesel and gas has widened. From $1.20 to $1.31
Libya Closes Biggest Oil Field and Warns of More Shutdowns
(Bloomberg) — Libya’s oil production has fallen by more than half a million barrels a day as a wave of political demonstrations engulfs the OPEC member’s energy industry.
The Sharara field in the west of the country, which can pump 300,000 barrels each day, was closed after protesters gathered at the site demanding Prime Minister Abdul Hamid Dbeibah quits, according to people familiar with the matter. That came after the nearby El Feel deposit, with a daily capacity of 65,000 barrels, was halted for the same reason.
https://financialpost.com/pmn/business-pmn/libya-shuts-biggest-oil-field-warns-of-painful-wave-of-halts
New posts are up
https://peakoilbarrel.com/opec-update-april-2022/
and
https://peakoilbarrel.com/open-thread-non-petroleum-april-18-2022/
Most of the DUCs left are Dead DUCs. Bold mine in the article below.
EIA: Number Of DUCs Falls To Lowest On Record”>
The number of Drilled but Uncompleted Wells sank to its lowest level ever recorded, according to the Energy Information’s latest Drilling Productivity Report published on Monday.
The number of Drilled but Uncompleted Wells—also known as DUCs—fell to 4,273 in March 2022, according to the latest figures. This is down from 42% since the beginning of 2021.
The falling DUC count is due to more fracking than drilling—depleting their DUC inventories rather than drilling new wells is typically more cost effective. As shareholders continue to demand great fiscal restraint even in today’s higher oil-price environment, DUCs would naturally be favored.
With more than 4,000 DUCs still active, it may seem like there is little cause for concern, even with losing nearly 50% of the DUC inventory since the beginning of last year. But that DUC count has long been debated. Not due to the accuracy of the figure itself, but because wells that remain in the uncompleted phase for more than two years are considered dead DUCs.
Most analysts agree that 95% of all wells drilled are completed during the first two years. That means any wells still left uncompleted after that time are extremely unlikely to be completed—ever.
Back in June of last year, Rystad Energy estimated that the total number of live DUCs was just 2,380—that was when the EIA had estimated the overall DUC count was more than 6,100. Since then, the total DUC count, per the EIA, has dropped by 1,827, or 30%. Assuming that the majority of those that were completed were live, that leaves U.S. shale with precious little to frack.
The method with which the EIA calculates DUC wells has been called into question well before the dwindling fracklog.
By Julianne Geiger for Oilprice.com