Bakken Update, Is Production Slowing Down?

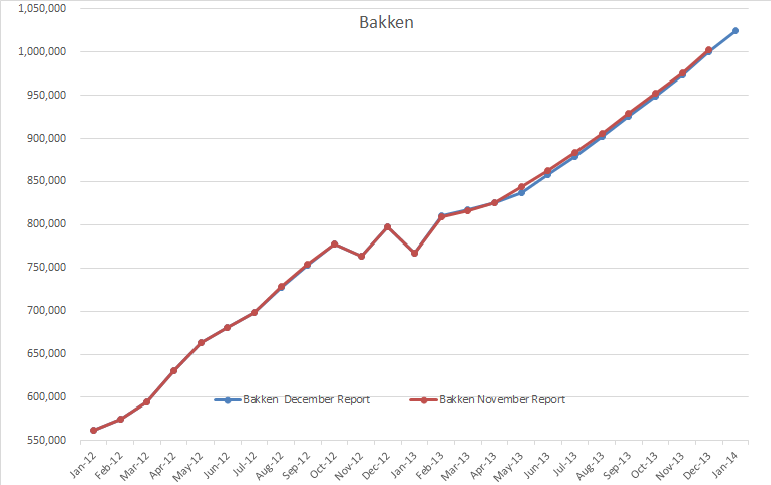
The Bakken production data published by North Dakota is out with October production data. ND Monthly Bakken Oil Production Statistics (Bakken Only) and ND Monthly Oil Production Statistics (All North Dakota).

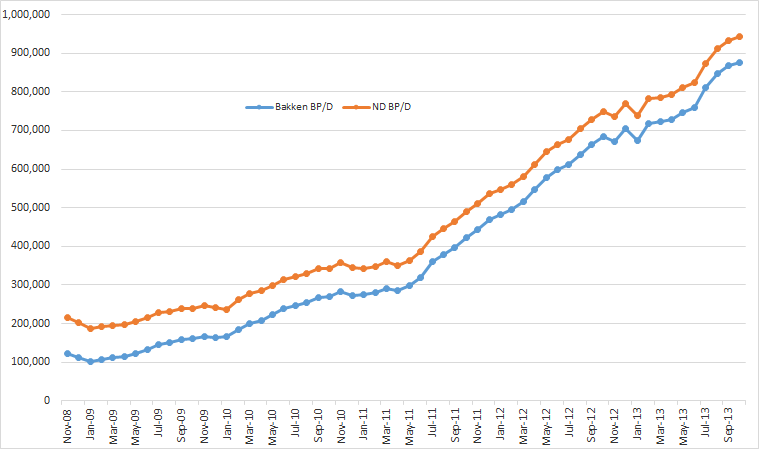
The below chart is North Dakota Bakken barrels per day and All North Dakota Barrels per day. As you can see it’s mostly Bakken and very little “the rest of North Dakota.

Bakken Barrels Per Day


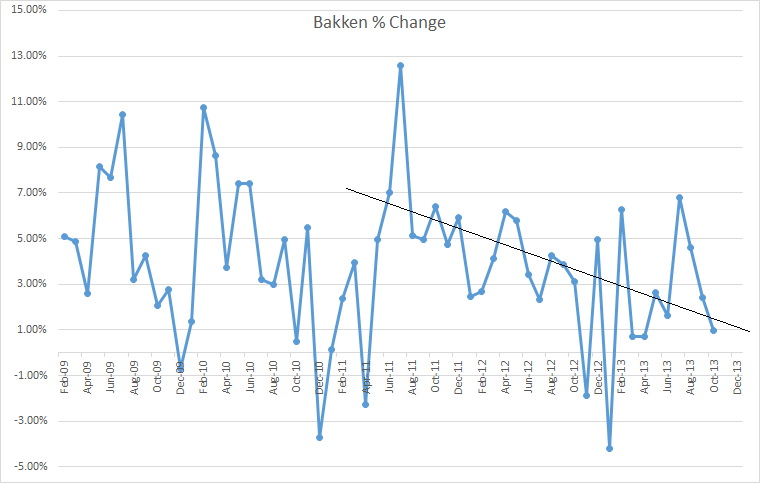
It looks like there is a pattern developing. I charted the month to month percent change in the chart below with a line indicating a possible trend.

Bakken Percent Change

Read More

EIA Shale Oil Drilling Productivity Report

The new EIA Drilling Productivity Report has just been published with their shale oil production and prediction numbers out through January 2014.

I have discovered something very strange about their numbers. But first here is the Bakken data. I have shortened the time frame to just two years in order to better show what is happening. I have plotted what the EIA reported last month along with what they reported in this last report. The data is in barrels per day.

Bakken AAA

There was extremely little revision in the data from the report last month.

And now Eagle Ford Production in barrels per day.

Eagle Ford

Eagle Ford was revised downward and like the data, the revisions were extremely linear. But the dead give away was when I plotted the percent change of from month to month.

Read More

JODI, Canada and the IEA’s Position On Peak Oil

The JODI data came out a few days ago. Below is JODI World Total C+C with EIA data used for countries not reporting to JODI. I use EIA data also for Venezuela and Iran because JODI uses data reported by these two countries which is political and inflated by about one million barrels per day by Iran and half a million barrels a day by Venezuela.

The data is in kb/d with the last data point September 2013.

JODI World Total

Notice that JODI has a new world high in July just like the EIA had but down 976,000 barrels per day from July to to September.

JODI has Non-OPEC at about 350,000 barrels below the peak in December 2012.

Jodi Non-OPEC

I don’t put much stock in the JODI data but I do find it interesting look at occasionally. And since it is usually almost two months ahead of the EIA data it does give me some idea of where production will be two months ahead of the EIA report.
Read More