Please place all general comments not related to petroleum in this thread.
Month: August 2018
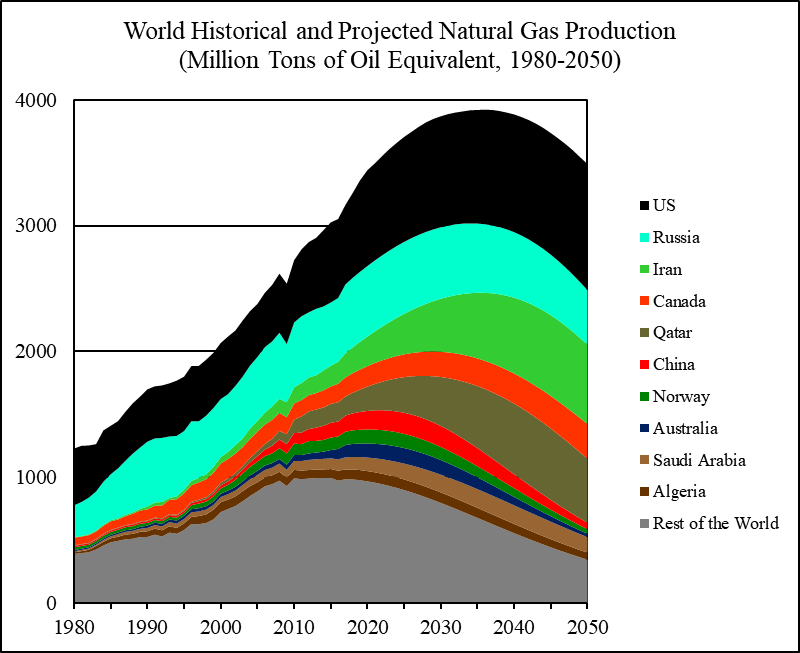
World Natural Gas 2018-2050: World Energy Annual Report (Part 3)
A Guest Post by Dr. Minqi Li, Professor
Department of Economics, University of Utah
E-mail: minqi.li@economics.utah.edu
August 2018
This is Part 3 of the World Energy Annual Report in 2018. This part of the Annual Report provides updated analysis of world natural gas production and consumption, evaluates the future prospect of world natural gas supply and considers the implications of peak natural gas production for global economic growth.
Natural gas is in a relatively early phase of depletion. According to the German Federal Institute for Geosciences and Natural Resources, world cumulative natural gas production up to 2016 was 117 trillion cubic meters, world natural gas reserves were 197 trillion cubic meters, and world natural gas resources were 643 trillion cubic meters (BGR 2017, Table A-15). BGR defines “resources” as “proven amounts of energy resources which cannot currently be exploited for technical and/or economic reasons, as well as unproven but geologically possible energy resources which may be exploitable in future” (BGR 2017, Glossary). According to the BP Statistical Review of World Energy, world natural gas reserves at the end of 2017 were 194 trillion cubic meters (166 billion tons of oil equivalent).

World Historical and Projected Natural Gas Production, 1980-2050
Open Thread, Aug 7, 2018
General Comments not related to Petroleum in this thread.
U.S. & World Oil Production and ExxonMobil Outlook
Here are the latest oil production numbers from the EIA. All data is in thousand barrels per day unless otherwise noted.

The USA through May 2018. The upward surge has stalled for the last two months. US production was down 30,000 bpd in May.

It is a little astonishing how close the Texas chart resembles the USA chart. Texas is, by far, the USA’s largest producer. As Texas goes, so goes the USA. Texas production was up 20,000 bpd in May.
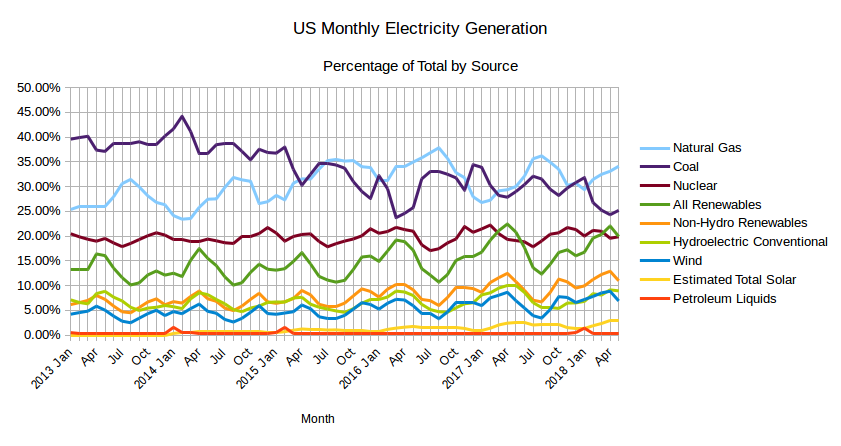
EIA’s Electric Power Monthly – July 2018 Edition with data for May
A Guest Post by Islandboy


The EIA released the latest edition of their Electric Power Monthly on July 24th, with data for May 2018. The table above shows the percentage contribution of the main fuel sources to two decimal places for the last two months and the year to date. Read More