A Guest Post by Dr. Minqi Li, Professor
Department of Economics, University of Utah
E-mail: [email protected]
August 2018
This is Part 3 of the World Energy Annual Report in 2018. This part of the Annual Report provides updated analysis of world natural gas production and consumption, evaluates the future prospect of world natural gas supply and considers the implications of peak natural gas production for global economic growth.
Natural gas is in a relatively early phase of depletion. According to the German Federal Institute for Geosciences and Natural Resources, world cumulative natural gas production up to 2016 was 117 trillion cubic meters, world natural gas reserves were 197 trillion cubic meters, and world natural gas resources were 643 trillion cubic meters (BGR 2017, Table A-15). BGR defines “resources” as “proven amounts of energy resources which cannot currently be exploited for technical and/or economic reasons, as well as unproven but geologically possible energy resources which may be exploitable in future” (BGR 2017, Glossary). According to the BP Statistical Review of World Energy, world natural gas reserves at the end of 2017 were 194 trillion cubic meters (166 billion tons of oil equivalent).
World Historical and Projected Natural Gas Production, 1980-2050
This report uses official reserves, official projections, or energy research institution estimates to establish the ultimately recoverable natural gas resources for the world’s ten largest natural gas producers. For the rest of the world (the world total less the ten largest natural gas producers), this report uses Hubbert linearization to establish the ultimately recoverable natural gas resources.
Figures are placed at the end of each section.
Natural Gas Consumption by Major Economies, 1990-2017
According to the BP Statistical Review of World Energy, world natural gas consumption was 3,156 million tons of oil equivalent (3,670 billion cubic meters) in 2017. Between 2007 and 2017, world natural gas consumption grew at an average annual rate of 2.2 percent.
Figure 1 compares the historical world economic growth rates and the natural gas consumption growth rates from 1991 to 2017. The natural gas consumption growth rate has an intercept of -0.01 at zero economic growth rate and a slope of 0.992. That is, natural gas consumption has an “autonomous” tendency to fall by about 1 percent a year when economic growth rate is zero. When economic growth rate rises above zero, an increase in economic growth rate by one percentage point is associated with an increase in natural gas consumption by 0.99 percent. R-square for the linear trend is 0.49. In 2017, world natural gas consumption grew by 2.7 percent, a rate that is 0.1 percentage points below what is implied by the historical trend.
Figure 2 compares the per capita natural gas consumption in relation to per capita GDP for the world’s six largest national natural gas consumers and the European Union.
The United States is the world’s largest natural gas consumer. In 2017, the US natural gas consumption was 636 million tons of oil equivalent (740 billion cubic meters), accounting for 20 percent of the world natural gas consumption. The US per capita natural gas consumption declined from 1.94 tons of oil equivalent in 1996 to 1.69 tons of oil equivalent in 2006. The US natural gas consumption has tended to grow since then. Per capita natural gas consumption was about 2 tons of oil equivalent in 2016 and 1.95 tons of oil equivalent in 2017.
The European Union is the world’s second largest natural gas consumer. In 2017, the EU natural gas consumption was 401 million tons of oil equivalent (467 billion cubic meters), accounting for 13 percent of the world natural gas consumption. The EU per capita natural gas consumption peaked at 898 kilograms of oil equivalent in 2005 and declined to 678 kilograms of oil equivalent by 2014. In 2017, the EU per capita natural gas consumption recovered to 782 kilograms of oil equivalent.
The Russian Federation is the world’s third largest natural gas consumer. In 2017, Russia’s natural gas consumption was 365 million tons of oil equivalent (425 billion cubic meters), accounting for 12 percent of the world natural gas consumption. Russia’s per capita natural gas consumption grew from about 2 tons of oil equivalent in 1997 to 2.62 tons of oil equivalent in 2011. In 2017, Russia’s per capita natural gas consumption was 2.53 tons of oil equivalent.
China is the world’s fourth largest natural gas consumer. In 2017, China’s natural gas consumption reached 207 million tons of oil equivalent (240 billion cubic meters), accounting for 6.6 percent of the world natural gas consumption. From 1990 to 2017, China’s per capita natural gas consumption surged from 12 kilograms of oil equivalent to 149 kilograms of oil equivalent, which is still substantially below the per capita natural gas consumption levels of advanced capitalist economies.
If China’s per capita natural gas consumption continues to follow its historical trend in relation to per capita GDP, China’s per capita natural gas consumption will rise to 532 kilograms of oil equivalent by 2050 (when China’s per capita GDP is projected to rise to about 50,000 dollars). China’s population is expected to peak before 2030 and decline to 1.36 billion by 2050. Given these projections, China’s natural gas demand will rise to 722 million tons of oil equivalent by 2050.
Iran is the world’s fifth largest natural gas consumer. In 2017, Iran’s natural gas consumption reached 184 million tons of oil equivalent (214 billion cubic meters), accounting for 5.8 percent of the world natural gas consumption. From 1990 to 2017, Iran’s per capita natural gas consumption skyrocketed from 364 kilograms of oil equivalent to 2.27 tons of oil equivalent.
Japan is the world’s sixth largest natural gas consumer. In 2017, Japan’s natural gas consumption was 101 million tons of oil equivalent (117 billion cubic meters), accounting for 3.2 percent of the world natural gas consumption. Japan’s per capita natural gas consumption peaked at 825 kilograms of oil equivalent in 2013. In 2017, Japan’s per capita natural gas consumption was 794 kilograms of oil equivalent.
Canada is the world’s seventh largest natural gas consumer. In 2017, Canada’s natural gas consumption was 100 million tons of oil equivalent (116 billion cubic meters), accounting for 3.2 percent of the world natural gas consumption. Canada’s per capita natural gas consumption increased from 1.97 tons of oil equivalent in 1990 to 2.49 tons of oil equivalent in 2000. Per capita consumption decreased to 2.21 tons of oil equivalent in 2009 and rose to the all-time high of 2.71 tons of oil equivalent in 2017.
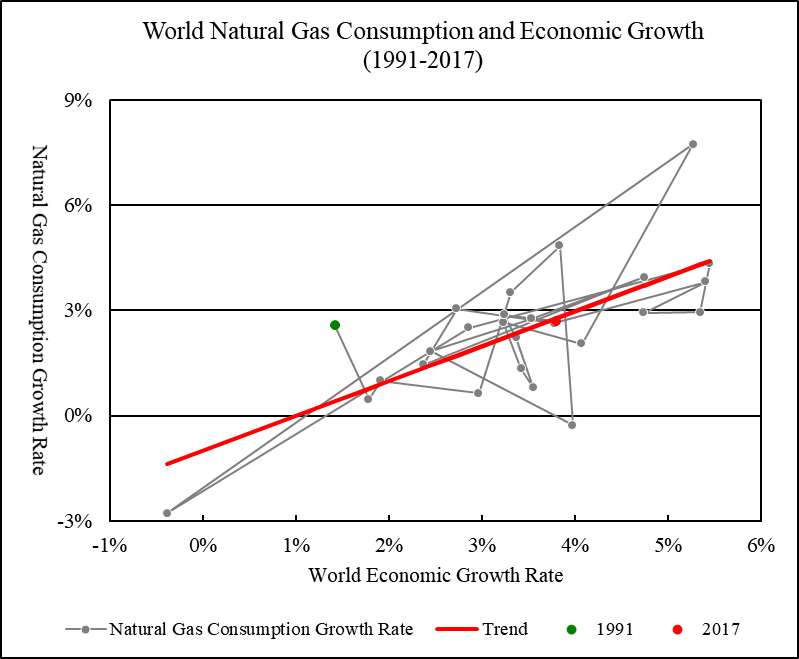
Figure 1 World Natural Gas Consumption and Economic Growth, 1991-2017
Linear Trend: Natural Gas Consumption Growth Rate = -0.010 + 0.992 * Economic Growth Rate (R-square = 0.490)
Sources: World natural gas consumption from 1990 to 2017 is from BP (2018). Gross world product in constant 2011 international dollars from 1990 to 2016 is from World Bank (2018), extended to 2017 using growth rate reported by IMF (2018, Statistical Appendix, Table A1).
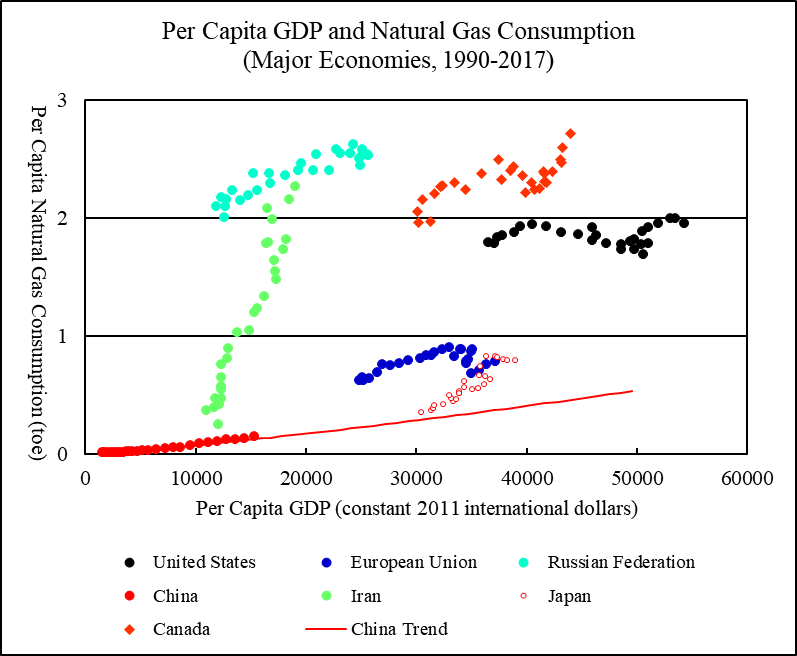
Figure 2 Per Capita GDP and Natural Gas Consumption, Major Economies, 1990-2017
Sources: Per capita natural gas consumption and per capita GDP are calculated using data for natural gas consumption, GDP, and population. National and regional natural gas consumption from 1990 to 2017 is from BP (2018). National and regional GDP from 1990 to 2016 is from World Bank (2018), extended to 2017 using growth rates reported by IMF (2018, Statistical Appendix, Table A1, A2, and A4). National and regional population from 1990 to 2016 is from World Bank (2018), extended to 2017 by assuming that the 2017 population growth rates are the same as the 2016 growth rates. To project China’s per capita natural gas consumption, a log-linear relationship is estimated between the per capita natural gas consumption and per capita GDP for the period 1990-2017. China’s GDP and population projections from 2018 to 2050 are from EIA (2017, Reference Case, Table A3 and Table J4), adjusted to make the projected GDP and population levels in 2017 matching the levels reported by World Bank (2018).
The United States
The United States is currently the world’s largest natural gas producer. In 2017, the US produced 632 million tons of oil equivalent of natural gas (735 billion cubic meters), accounting for 20 percent of the world natural gas production.
The US conventional natural gas production peaked in 1971 when total natural gas production was 505 million tons of oil equivalent. Since 2005, the US natural gas production has experienced a spectacular expansion because of the shale gas boom. The US Energy Information Administration projects that the US natural gas production will rise to about 1 billion tons of oil equivalent by 2050 (EIA 2018, Reference Case, Table A1).
The US cumulative natural gas production up to 2017 was 31.2 billion tons of oil equivalent (cumulative production up to 2007 is from BGR 2009, Table A 4-2, extended to 2017 using annual production data from BP 2018; 1 trillion cubic meters of natural gas = 0.86 billion tons of oil equivalent). Applying Hubbert linearization to the annual production to cumulative production ratios implied by the projected US natural gas production from 2041 to 2050, the US ultimately recoverable natural gas resources are estimated to be 147.2 billion tons of oil equivalent and the remaining recoverable natural gas resources are estimated to be 116 billion tons of oil equivalent. By comparison, the US “proved” natural gas reserves at the end of 2017 were reported to be 8.7 trillion cubic meters (7.5 billion tons of oil equivalent) (BP 2018).
Figure 3 shows the historical US natural gas production and the future production projected by EIA.
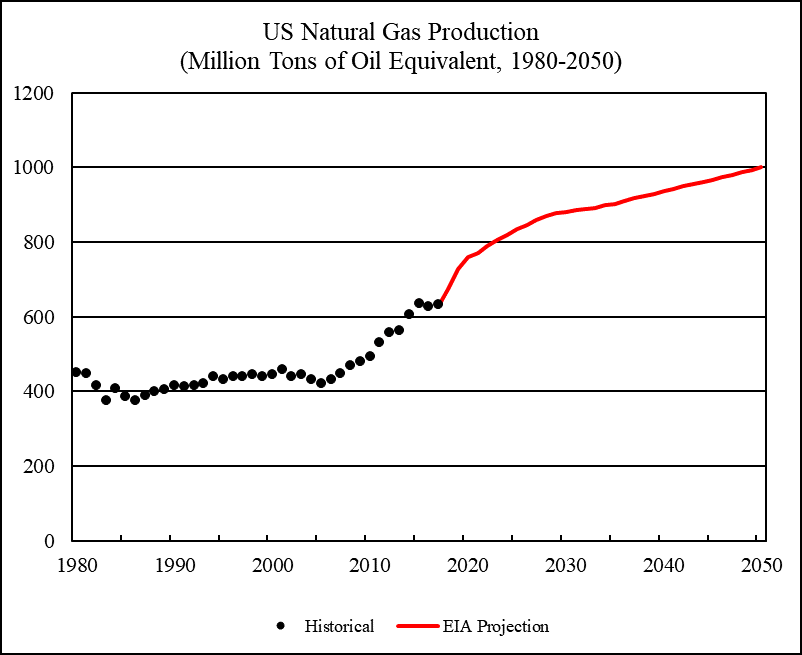
Figure 3 US Natural Gas Production, 1980-2050
Sources: The US historical natural gas production from 1980 to 2017 is from BP (2018). Projected US natural gas production from 2018 to 2050 is from EIA (2018, Reference Case, Table A1), adjusted to make the projected natural gas production level in 2017 matching the production level reported by BP (2018).
Russian Federation
The Russian Federation is the world’s second largest natural gas producer. In 2017, Russia produced 547 million tons of oil equivalent of natural gas (636 billion cubic meters), accounting for 17 percent of the world natural gas production.
This report assumes that Russia’s ultimately recoverable natural gas resources are the sum of historical cumulative production and the official reserves. Russia’s cumulative natural gas production up to 2017 was 20.1 billion tons of oil equivalent (cumulative production up to 2007 is from BGR 2009, Table A 4-2, extended to 2017 using annual production data from BP 2018; 1 trillion cubic meters of natural gas = 0.86 billion tons of oil equivalent). Russia’s official natural gas reserves at the end of 2017 were reported to be 35 trillion cubic meters (30.1 billion tons of oil equivalent) (BP 2018). The ultimately recoverable natural gas resources are estimated to be 50.2 billion tons of oil equivalent.
Based on the above assumptions, Russia’s natural gas production is projected to peak in 2026 at 572 million tons of oil equivalent. Figure 4 shows Russia’s historical and projected natural gas production.
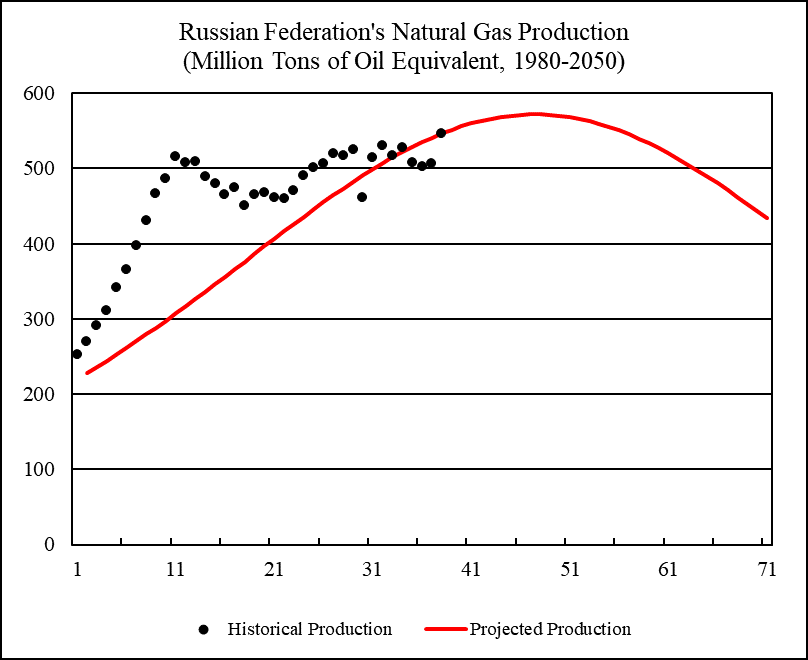
Figure 4 Russian Federation’s Natural Gas Production, 1980-2050
Sources: Russia’s historical natural gas production from 1985 to 2017 is from BP (2018). For 1980-1984, Russia’s natural gas production is assumed to be 71.3 percent of the Soviet Union’s total natural gas production. To project Russia’s natural gas production, I used a logistic curve assuming the ultimately recoverable resources are the sum of cumulative production and official reserves. The parameters are calculated so that the projected annual production equals the actual annual production in 2017.
Iran
Iran is the world’s third largest natural gas producer. In 2017, Iran produced 193 million tons of oil equivalent of natural gas (224 billion cubic meters), accounting for 6.1 percent of the world natural gas production.
This report assumes that Iran’s ultimately recoverable natural gas resources are the sum of historical cumulative production and the official reserves. Iran’s cumulative natural gas production up to 2017 was 2.6 billion tons of oil equivalent (cumulative production up to 2007 is from BGR 2009, Table A 4-2, extended to 2017 using annual production data from BP 2018; 1 trillion cubic meters of natural gas = 0.86 billion tons of oil equivalent). Iran’s official natural gas reserves at the end of 2017 were reported to be 33.2 trillion cubic meters (28.6 billion tons of oil equivalent) (BP 2018). The ultimately recoverable natural gas resources are estimated to be 31.2 billion tons of oil equivalent.
Based on the above assumptions, Iran’s natural gas production is projected to peak in 2046 at 645 million tons of oil equivalent. Figure 5 shows Iran’s historical and projected natural gas production.
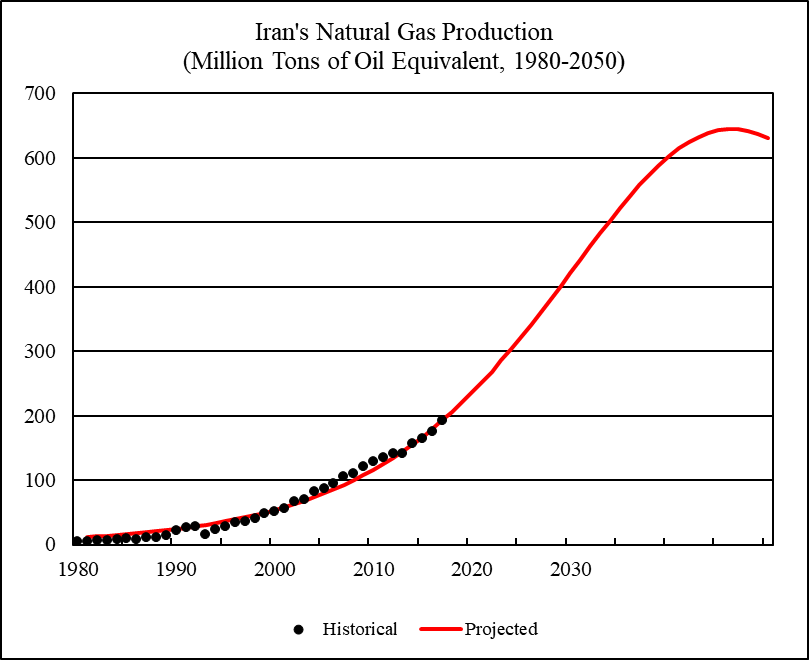
Figure 5 Iran’s Natural Gas Production, 1980-2050
Sources: Iran’s historical natural gas production from 1980 to 2017 is from BP (2018). To project Iran’s natural gas production, I used a logistic curve assuming the ultimately recoverable resources are the sum of cumulative production and official reserves. The parameters are calculated so that the projected annual production equals the actual annual production in 2017.
Canada
Canada is the world’s fourth largest natural gas producer. In 2017, Canada produced 152 million tons of oil equivalent of natural gas (176 billion cubic meters), accounting for 4.8 percent of the world natural gas production.
Canada’s conventional natural gas production peaked in 2002 when total natural gas production was 155 million tons of oil equivalent. Since 2010, Canada’s natural gas production has resumed growth driven by the shale gas boom. Canada’s cumulative natural gas production up to 2017 was 5.6 billion tons of oil equivalent (cumulative production up to 2007 is from BGR 2009, Table A 4-2, extended to 2017 using annual production data from BP 2018; 1 trillion cubic meters of natural gas = 0.86 billion tons of oil equivalent). Canada’s “proved” natural gas reserves at the end of 2017 were reported to be 1.9 trillion cubic meters (1.6 billion tons of oil equivalent) (BP 2018). The “proved” natural gas reserves are evidently too conservative as an estimate of Canada’s remaining recoverable natural gas resources.
The German Federal Institute for Geosciences and Natural Resources estimates Canada’s ultimately recoverable natural gas resources to be 46.4 trillion cubic meters (39.9 billion tons of oil equivalent) (BGR 2017, Table A-15). Using the BGR estimate as Canada’s ultimately recoverable natural gas resources, Canada’s natural gas production is projected to rise to 276 million tons of oil equivalent by 2050. Figure 6 shows Canada’s historical and projected natural gas production.
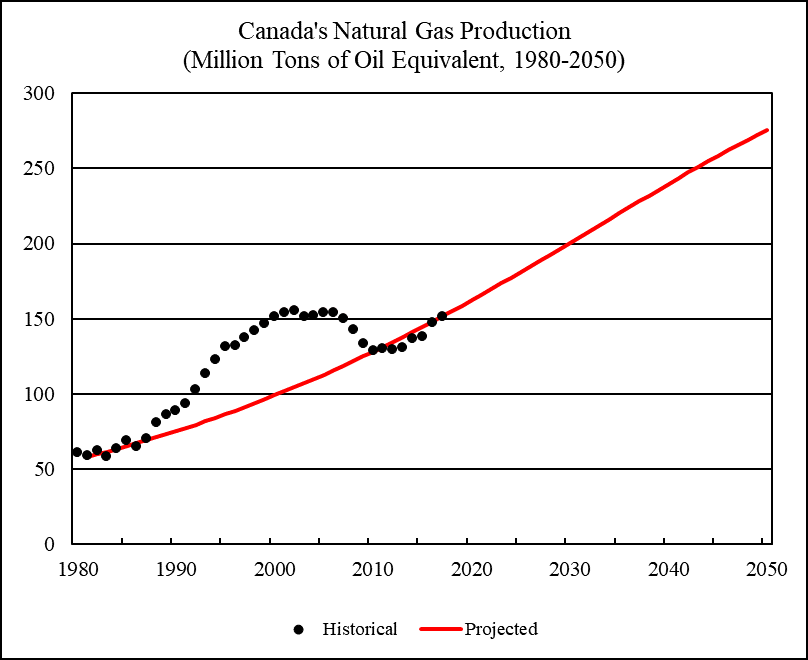
Figure 6 Canada’s Natural Gas Production, 1980-2050
Sources: Canada’s historical natural gas production from 1980 to 2017 is from BP (2018). To project Canada’s natural gas production, I used a logistic curve using the ultimately recoverable resources estimated by BGR (2017). The parameters are calculated so that the projected annual production equals the actual annual production in 2017.
Qatar
Qatar is the world’s fifth largest natural gas producer. In 2017, Qatar produced 151 million tons of oil equivalent of natural gas (176 billion cubic meters), accounting for 4.8 percent of the world natural gas production.
This report assumes that Qatar’s ultimately recoverable natural gas resources are the sum of historical cumulative production and the official reserves. Qatar’s cumulative natural gas production up to 2017 was 1.7 billion tons of oil equivalent (cumulative production up to 2007 is from BGR 2009, Table A 4-2, extended to 2017 using annual production data from BP 2018; 1 trillion cubic meters of natural gas = 0.86 billion tons of oil equivalent). Qatar’s official natural gas reserves at the end of 2017 were reported to be 24.9 trillion cubic meters (21.4 billion tons of oil equivalent) (BP 2018). The ultimately recoverable natural gas resources are estimated to be 23.1 billion tons of oil equivalent.
Based on the above assumptions, Qatar’s natural gas production is projected to peak in 2043 at 573 million tons of oil equivalent. Figure 7 shows Qatar’s historical and projected natural gas production.
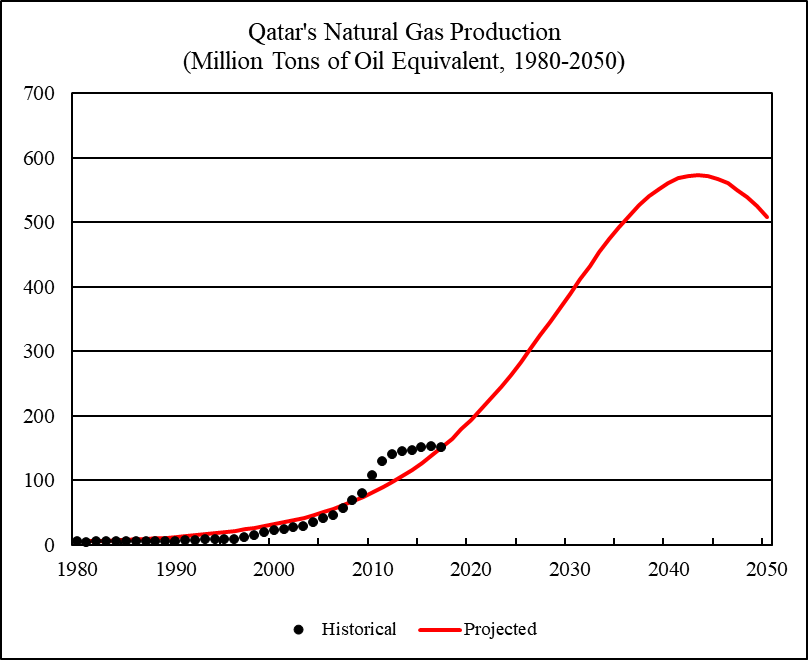
Figure 7 Qatar’s Natural Gas Production, 1980-2050
Sources: Qatar’s historical natural gas production from 1980 to 2017 is from BP (2018). To project Qatar’s natural gas production, I used a logistic curve assuming the ultimately recoverable resources are the sum of cumulative production and official reserves. The parameters are calculated so that the projected annual production equals the actual annual production in 2017.
China
China is the world’s sixth largest natural gas producer. In 2017, China produced 128 million tons of oil equivalent of natural gas (149 billion cubic meters), accounting for 4.1 percent of the world natural gas production.
This report assumes that China’s ultimately recoverable natural gas resources are the sum of historical cumulative production and the official reserves. China’s cumulative natural gas production up to 2017 was 1.7 billion tons of oil equivalent (cumulative production up to 2007 is from BGR 2009, Table A 4-2, extended to 2017 using annual production data from BP 2018; 1 trillion cubic meters of natural gas = 0.86 billion tons of oil equivalent). China’s official natural gas reserves at the end of 2017 were reported to be 5.5 trillion cubic meters (4.7 billion tons of
oil equivalent) (BP 2018). The ultimately recoverable natural gas resources are estimated to be 6.4 billion tons of oil equivalent.
Figure 8 compares China’s historical and projected natural gas production and consumption. China’s natural gas production is projected to peak in 2027 at 170 million tons of oil equivalent. China’s natural gas consumption is projected to rise from 207 million tons of oil equivalent in 2017, to 358 million tons in 2030, 538 million tons in 2040, and 722 million tons in 2050. Under the projections, China’s net natural gas imports (consumption less production) will rise from 78 million tons of oil equivalent in 2017, to 191 million tons in 2030, 427 million tons in 2040, and 671 million tons in 2050. This will be equivalent to 21 percent of the world natural gas production in 2017.
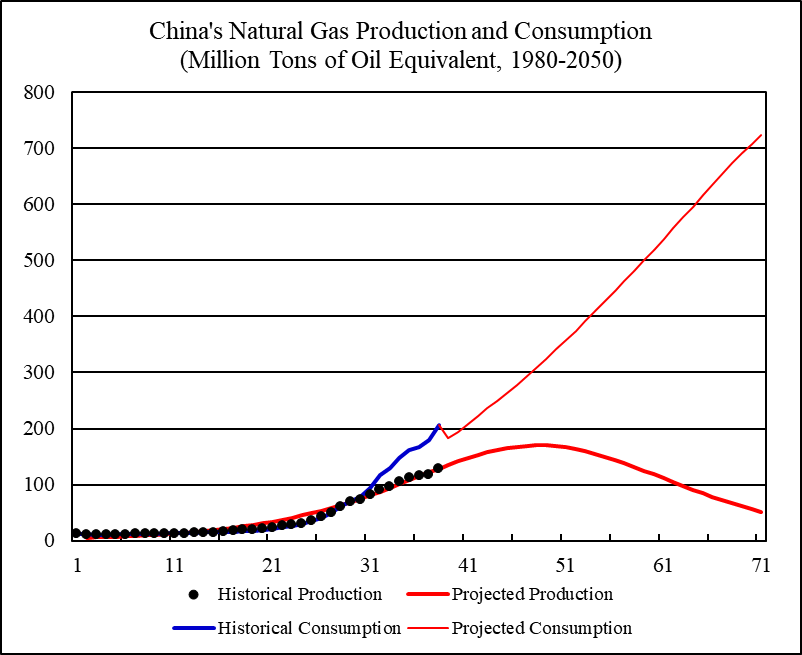
Figure 8 China’s Natural Gas Production and Consumption, 1980-2050
Sources: China’s historical natural gas production and consumption from 1980 to 2017 is from BP (2018). China’s future per capita natural gas consumption is projected by assuming that per capita natural gas consumption will grow in accordance with the historical relationship between per capita natural gas consumption and per capita GDP (see Figure 2). Future natural gas consumption is then calculated using per capita natural gas consumption multiplied by the projected population. China’s population projection from 2018 to 2050 is from EIA (2017, Reference Case, Table J4), adjusted to make the projected population level in 2017 matching the population level used by this report.
Norway
Norway is the world’s seventh largest natural gas producer. In 2017, Norway produced 106 million tons of oil equivalent of natural gas (123 billion cubic meters), accounting for 3.3 percent of the world natural gas production.
Norway’s cumulative natural gas production up to 2017 was 2 billion tons of oil equivalent (cumulative production up to 2007 is from BGR 2009, Table A 4-2, extended to 2017 using annual production data from BP 2018; 1 trillion cubic meters of natural gas = 0.86 billion tons of oil equivalent). Norway’s official natural gas reserves at the end of 2017 were reported to be 1.7 trillion cubic meters (1.5 billion tons of oil equivalent) (BP 2018). The official reserves are probably too conservative as an estimate of Norway’s remaining recoverable natural gas resources.
The German Federal Institute for Geosciences and Natural Resources estimates Norway’s ultimately recoverable natural gas resources to be 6.1 trillion cubic meters (5.2 billion tons of oil equivalent) (BGR 2017, Table A-15). Using the BGR estimate as Norway’s ultimately recoverable natural gas resources, Norway’s natural gas production is projected to peak in 2023 at 113 million tons of oil equivalent. Figure 9 shows Norway’s historical and projected natural gas production.
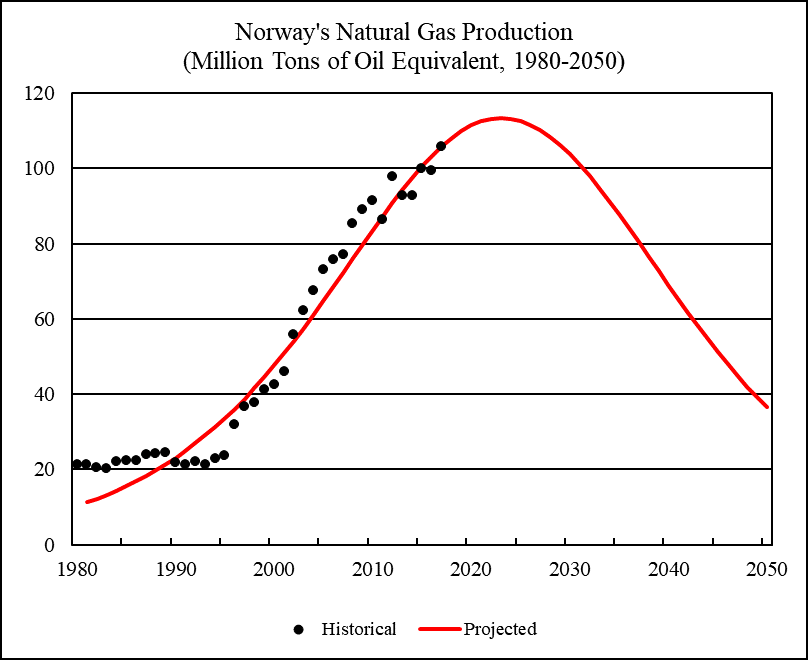
Figure 9 Norway’s Natural Gas Production, 1980-2050
Sources: Norway’s historical natural gas production from 1980 to 2017 is from BP (2018). To project Norway’s natural gas production, I used a logistic curve using the ultimately recoverable resources estimated by BGR (2017). The parameters are calculated so that the projected annual production equals the actual annual production in 2017.
Australia
Australia is the world’s eighth largest natural gas producer. In 2017, Australia produced 98 million tons of oil equivalent of natural gas (114 billion cubic meters), accounting for 3.1 percent of the world natural gas production.
This report assumes that Australia’s ultimately recoverable natural gas resources are the sum of historical cumulative production and the official reserves. Australia’s cumulative natural gas production up to 2017 was 1.2 billion tons of oil equivalent (cumulative production up to 2007 is from BGR 2009, Table A 4-2, extended to 2017 using annual production data from BP 2018; 1 trillion cubic meters of natural gas = 0.86 billion tons of oil equivalent). Australia’s official natural gas reserves at the end of 2017 were reported to be 3.6 trillion cubic meters (3.1 billion tons of oil equivalent) (BP 2018). The ultimately recoverable natural gas resources are estimated to be 4.3 billion tons of oil equivalent.
Based on the above assumptions, Australia’s natural gas production is projected to peak in 2026 at 124 million tons of oil equivalent. Figure 10 shows Australia’s historical and projected natural gas production.
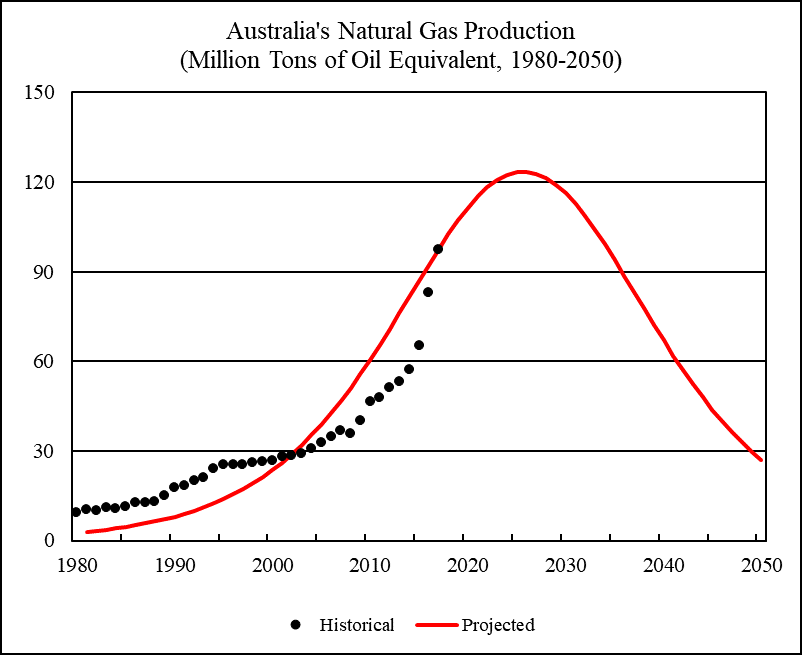
Figure 10 Australia’s Natural Gas Production, 1980-2050
Sources: Australia’s historical natural gas production from 1980 to 2017 is from BP (2018). To project Australia’s natural gas production, I used a logistic curve assuming the ultimately recoverable resources are the sum of cumulative production and official reserves. The parameters are calculated so that the projected annual production equals the actual annual production in 2017.
Saudi Arabia
Saudi Arabia is the world’s ninth largest natural gas producer. In 2017, Saudi Arabia produced 96 million tons of oil equivalent of natural gas (111 billion cubic meters), accounting for 3 percent of the world natural gas production.
This report assumes that Saudi Arabia’s ultimately recoverable natural gas resources are the sum of historical cumulative production and the official reserves. Saudi Arabia’s cumulative natural gas production up to 2017 was 1.8 billion tons of oil equivalent (cumulative production up to 2007 is from BGR 2009, Table A 4-2, extended to 2017 using annual production data from BP 2018; 1 trillion cubic meters of natural gas = 0.86 billion tons of oil equivalent). Saudi Arabia’s official natural gas reserves at the end of 2017 were reported to be 8 trillion cubic meters (6.9 billion tons of oil equivalent) (BP 2018). The ultimately recoverable natural gas resources are estimated to be 8.7 billion tons of oil equivalent.
Based on the above assumptions, Saudi Arabia’s natural gas production is projected to peak in 2037 at 149 million tons of oil equivalent. Figure 11 shows Saudi Arabia’s historical and projected natural gas production.
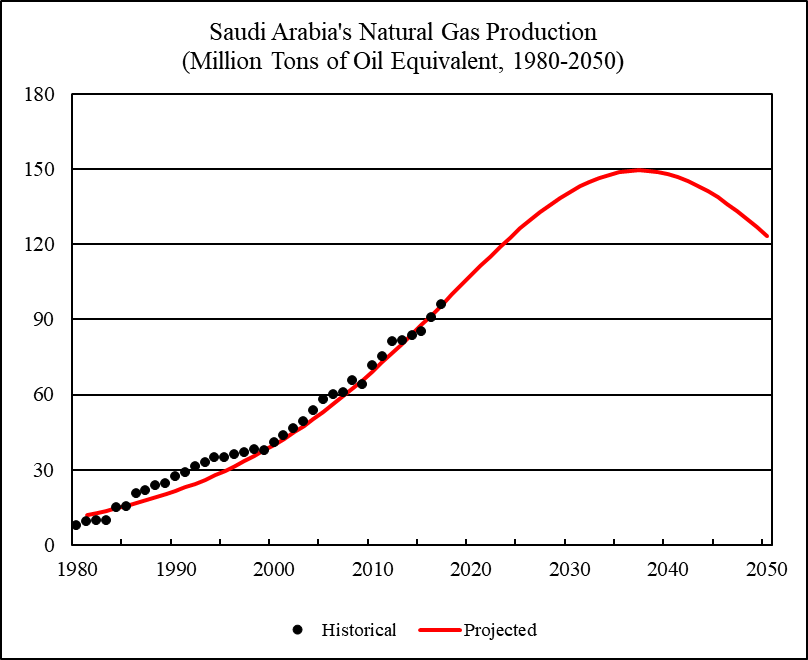
Figure 11 Saudi Arabia’s Natural Gas Production, 1980-2050
Sources: Saudi Arabia’s historical natural gas production from 1980 to 2017 is from BP (2018). To project Saudi Arabia’s natural gas production, I used a logistic curve assuming the ultimately recoverable resources are the sum of cumulative production and official reserves. The parameters are calculated so that the projected annual production equals the actual annual production in 2017.
Algeria
Algeria is the world’s tenth largest natural gas producer. In 2017, Algeria produced 79 million tons of oil equivalent of natural gas (91 billion cubic meters), accounting for 2.5 percent of the world natural gas production.
This report assumes that Algeria’s ultimately recoverable natural gas resources are the sum of historical cumulative production and the official reserves. Algeria’s cumulative natural gas production up to 2017 was 2.2 billion tons of oil equivalent (cumulative production up to 2007 is from BGR 2009, Table A 4-2, extended to 2017 using annual production data from BP 2018; 1 trillion cubic meters of natural gas = 0.86 billion tons of oil equivalent). Algeria’s official natural gas reserves at the end of 2017 were reported to be 4.3 trillion cubic meters (3.7 billion tons of oil equivalent) (BP 2018). The ultimately recoverable natural gas resources are estimated to be 5.9 billion tons of oil equivalent.
Based on the above assumptions, Algeria’s natural gas production is projected to peak in 2027 at 85 million tons of oil equivalent. Figure 12 shows Algeria’s historical and projected natural gas production.
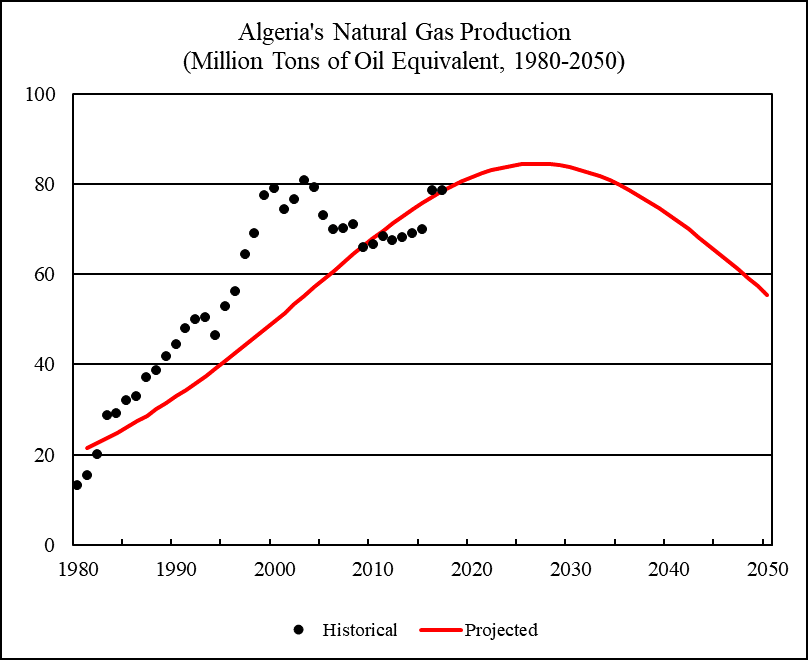
Figure 12 Algeria’s Natural Gas Production, 1980-2050
Sources: Algeria’s historical natural gas production from 1980 to 2017 is from BP (2018). To project Algeria’s natural gas production, I used a logistic curve assuming the ultimately recoverable resources are the sum of cumulative production and official reserves. The parameters are calculated so that the projected annual production equals the actual annual production in 2017.
Rest of the World
Rest of the world is defined as the world total excluding the ten largest natural gas producers. In 2017, rest of the world produced 985 million tons of oil equivalent of natural gas, accounting for 31 percent of the world natural gas production. Rest of the world’s natural gas production has been on a plateau since 2010. In 2015, rest of the world’s natural gas production reached 996 million tons of oil equivalent, the highest level in history.
Figure 13 projects rest of the world’s annual production to cumulative production ratios against the historical cumulative natural gas production from 1980 to 2017. Hubbert linearization is applied to the annual production to cumulative production ratios from 2009 to 2017. Regression R-square is 0.963. Where the downward linear trend meets the horizontal axis indicates that rest of the world’s ultimately recoverable natural gas resources will be 61.9 billion tons of oil equivalent. Rest of the world’s cumulative natural gas production up to 2017 was 33.3 billion tons of oil equivalent. Thus, the rest of the world’s remaining recoverable natural gas resources are estimated to be 28.6 billion tons of oil equivalent. The parameters from the Hubbert linear trend are used to project rest of the world’s future natural gas production. Figure 14 shows the rest of the world’s historical and projected natural gas production.
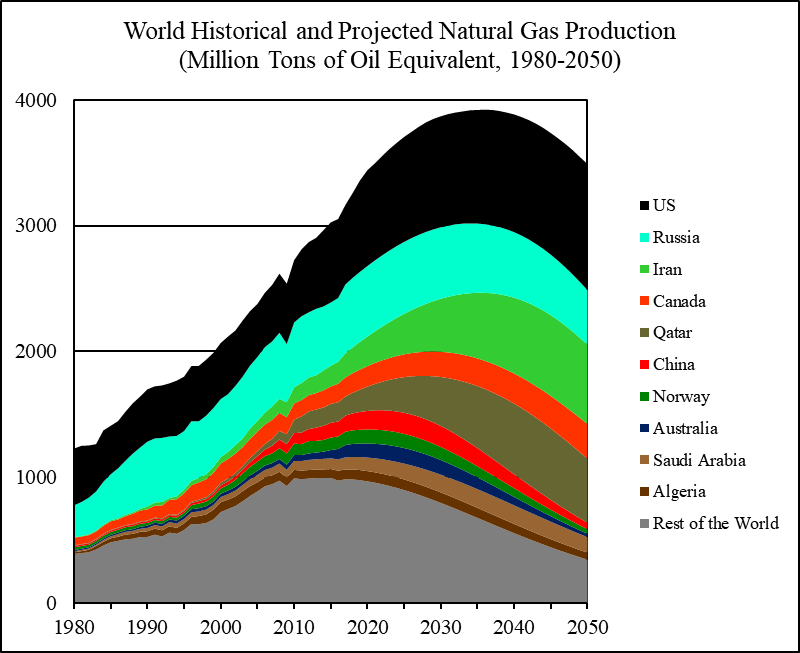
Figure 15 shows the historical and projected world natural gas production. World cumulative natural gas production up to 2017 was 103 billion tons of oil equivalent. World ultimately recoverable natural gas resources are estimated to be 384 billion tons of oil equivalent. World remaining recoverable natural gas resources are estimated to be 281 billion tons of oil equivalent.
World natural gas production is projected to peak in 2036 at 3,921 million tons of oil equivalent and decline to 3,489 million tons of oil equivalent by 2050.
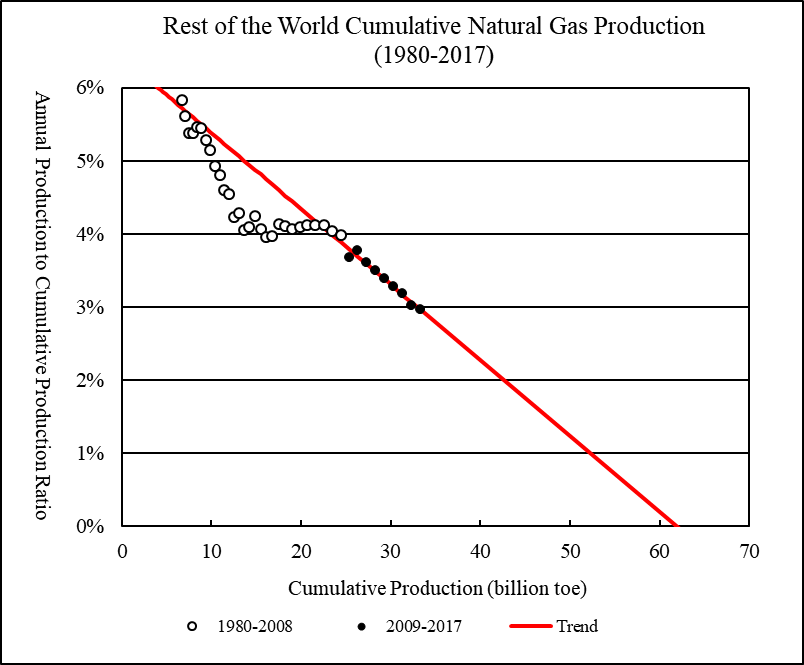
Figure 13 Rest of the World’s Cumulative Natural Gas Production, 1980-2017
Sources: Rest of the world’s cumulative natural gas production up to 2007 is from BGR (2009, Table A 4-2). This is used as the reference point. Cumulative production ending in other years is calculated using annual production data reported by BP (2018).
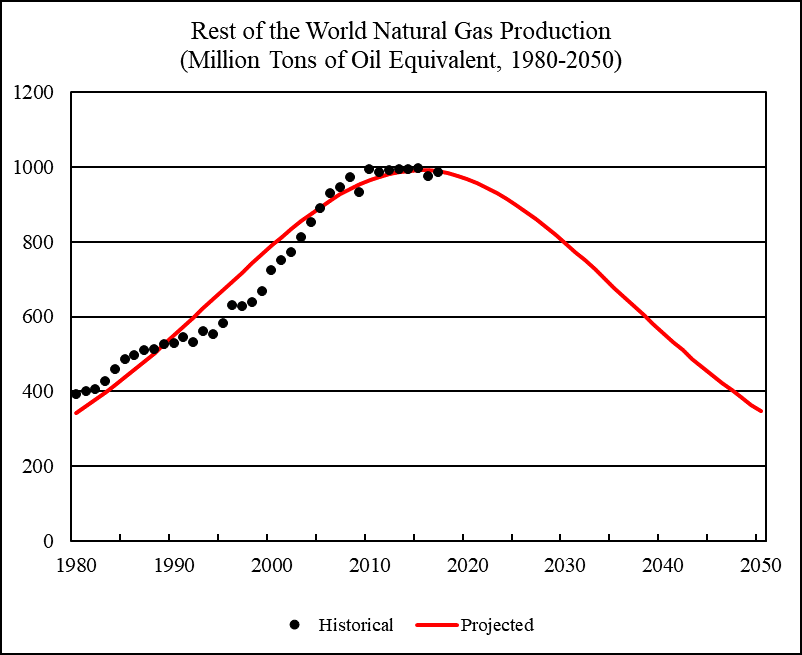
Figure 14 Rest of the World’s Natural Gas Production, 1980-2050
Sources: Rest of the world’s historical natural gas production from 1980 to 2017 is from BP (2018).
Figure 15 World Historical and Projected Natural Gas Production, 1980-2050
Sources: Historical natural gas production from 1980 to 2017 is from BP (2018).
References
197 responses to “World Natural Gas 2018-2050: World Energy Annual Report (Part 3)”
Interesting, I have little to no knowledge on gas production. How does the Vaca Muerte (dead cow) fit in?
Vaca Muerta would be part of “Rest of World”.
I have a difficult time conceptualizing the gas, but this looks significant.
https://www.epmag.com/producers-set-sights-vaca-muerta-1690866
Ok, not so significant, after conversion.
Updated Shock model for World Natural Gas URR=19,000 trillion cubic feet or 450 billion tonnes of oil equivalent. Peak is about 4090 Mtoe per year in 2038 with a plateau between 4050 and 4090 Mtoe/year from 2033 to 2043.
My old post from 3 years ago (July 2015) is at link below
http://peakoilbarrel.com/world-natural-gas-shock-model/
I have updated case B to account for output data from 2015 to 2017 (in 2015 I only had data through 2014).
I have assumed a maximum extraction rate of 4.6% of producing reserves and that the extraction rate continues to increase at the average rate of increase from 2002 to 2017 until the maximum extraction rate is approached.
Chart below has model output only from chart above converted to Mtoe/year instead of TCF/year, to make comparison with Dr Li’s estimate easier.
Mtoe=million tonnes of oil equivalent and TCF=trillion cubic feet.
Actually, fairly comparable.
Guym,
Yes,
I think the BP numbers may be dry gas and I am using gross minus reinjected gas, dry gas is roughly 90% of the gross minus reinjected on average from 1980 to 2017. So for my peak of roughly 4100 Mtoe/year, the dry gas output would be about 3700 Mtoe/year, which is slightly less than Dr Li’s estimate.
Clearly there are a wide variety of possible projections, depending on multiple factors such as natural gas prices, geology, and technology and the assumptions one makes about all of these factors in the future.
The rate of development of natural resources might increase or decrease, extraction rates might accelerate or decelerate and URR might range between 300 Gtoe and 600 Gtoe, the future output path is of course unknown, but we can create possible scenarios with concrete assumptions about future rates of resource development and future extraction rates.
Dennis, that’s very interesting.
Yes, BP gas number is for dry gas
The BGR total original resources (cumulative production + reserves + resources) are 957 trillion cubic meters or 823 billion tons of oil equivalent.
So a URR of 384 billion toe implies a recovery factor of 47%, roughly comparable to the recovery factor of my oil URR estimate. My oil URR compared to BGR total original resources implies a recovery factor of 48%
Minqi,
Does the BGR estimate include speculative resources like Gas hydrates and EOR applied to shale gas?
Steve Mohr did a pretty comprehensive analysis of all fossil fuel in his PhD thesis in 2010 (link below) and his high estimate for natural gas was a URR of 600 Gboe, the BGR estimate seems unreasonable to me.
https://www.dropbox.com/s/pqzqkbueso6papm/Steve%20Mohr%20Thesis.pdf?dl=0
An Update by Steve Mohr et al in 2015 at link below
https://www.sciencedirect.com/science/article/pii/S0016236114010254?via%3Dihub
I also did a brief post on Steve Mohr’s 2015 paper at link below
http://peakoilbarrel.com/projection-of-world-fossil-fuel-urr/
A comparison of various tables in BGR report suggests that the natural gas resources cited above includes shale gas, tight gas, and coalbed methane but excludes aquifer gas and gas hydrates.
What “EOR applied to shale gas” are you considering? I have never seen anything viable applied large scale to conventional gas. Doing it to shales sure looks difficult.
Fernando,
My mistake thanks. The name is enhanced oil recovery, so not applicable to natural gas.
Would you agree that the BGR natural gas resource estimates (assuming these are TRR estimates) seem a bit on the high side?
Dennis, im not sure. I need to read the german report and get back to you.
Thanks Fernando
Just took a look at US producing reserves for natural gas from EIA data from 1996 to 2016 (only data I have available), the average extraction rate for US natural gas is about 13% over this period with a range of 11% to 15%. An alternative World Shock Model with 540 trillion cubic meters (19,000 TCF) or 450 million tonnes of oil equivalent and higher future extraction rates is presented below, this is likely to be too optimistic, where my previous scenario may be a bit on the pessimistic side in my opinion. Reality may fall between these two scenarios if the URR estimate is roughly correct and there is no major depression through 2100 (too optimistic an assumption in my view).
Hi Dennis, I guess you meant 450 “billion” tonnes of oil equivalent
Minqi,
Thanks for the correction.
Yes it should have been 450 Gboe, rather than 450Mboe. Only off by three orders of magnitude. 🙂
Various forecasts for US production from the EIA’s Short-Term Energy Outlook – Table 4a.
Chart: https://pbs.twimg.com/media/DkA_DB6XsAAIBG5.jpg
EIA STEO: https://www.eia.gov/outlooks/steo/
The International rig count is without the USA or Canada and so I had a look at world oil production without the USA or Canada
https://pbs.twimg.com/media/DkAjnFJXcAAEwdL.jpg
Definitely a two to three year lag between high rig count, and increased production. Need a lot more rigs counted.
https://oilprice.com/Energy/Energy-General/90-Oil-Is-A-Very-Real-Possibility.html
Nick has it nailed. Iran losses as the same time they realize US production is not as expected. Just going to take some time to absorb. Meanwhile, inventories go down.
I was curious how much it costs to liquefy and ship nat gas.
Found this example from 2017 but not sure how accurate it is-
Henry Hub $3.45/MMBtu
Liquefaction charge $2.25/MMBtu
Total = $5.70
Shipping to Japan via Panama canal = $1.10/MMBtu thus destination cost of $6.80
I assume there may be a cost at the destination for re-gasification for the network distribution?
On the Projected Graph, The US (black graph) is the only country with the majority of UNCONVENTIONAL NG with a rapid decline. Conventional and Unconventional are different beasts. So the US slice is valid only if sweet spots are maintained as well as drilling and fracking rates. seems like they are not comparable.
I know there is a lot of untapped unconventional gas. I have no idea if the price is ever going to cause more drilling to capture it. Most shales have some similarity to the Eagle Ford. Easily, two thirds of the Eagle Ford is hardly being drilled, because they stay mostly in the oil window. The two windows with limited drilling, are the gas/condensate window, and the pure gas window. Gas window stretches all the way to Mexico, and beyond. Little activity in the Barnett shale, either. The only one I know of that is actively seeking gas is Apache in their Alpine High, which also has some oil, and is a low lying fruit.
How much of Canadian natural gas is used in the oil sands?
George Kaplan,
Good Point.
https://www.neb-one.gc.ca/nrg/ntgrtd/mrkt/snpsht/2017/04-03ntrlgslbrtlsnd-eng.html?=undefined&wbdisable=true
According to page above about 25% of Canadian natural gas demand is the Alberta oil sands. In 2016 about 2.4 BCF/d went to oil sands. Output for Canada was 16.6 BCF/d, so about 14.4% of Canadian Natural gas output was used to produce oil sands in 2016. Canada produced 6 BCF/d more than it consumed in 2016, based on BP data.
Yeah, that’s important. I recall some yrs ago examination of how much nat gas refineries were using — and certainly Suncor and the oil sands.
That could be a heads up of sorts for Minqi Li. Nat gas doesn’t have the variance (as best I know) that oil does in terms of assay.
It might seem complex enough to just try to keep track of production and consumption and where either is happening, but oil is not all created equal and that would be a sort of qualitative granularity all the other analysis doesn’t have.
EIA weekly out. Crude down marginally, and finished stocks up marginally. Big news is they re-benchmarked the production down 100k. It is now at 10.8 million. Only about 100k to 150k over actual, now. So, they have split the difference. STEO for August will look a little different. Each month until the end of the year, it will decrease.
Of course, price is down, because we have analysts like this:
https://oilprice.com/Energy/Crude-Oil/Oil-Falls-Despite-Crude-Inventory-Draw.html
Production was reported as 10.8, not slightly less than 11 million. Can’t even read what she is reporting on.
And the STEO was changed, as it reports average US estimated for the year to be down .1 million for 2018, and down .1 million for 2019 to be 10.7 and 11.7 respectively. Small changes over time will not catch the analysts’ eyes. It will probably end up being 10.5 by year end, and closer to 11 next year, as actual. 2020 will be a different story, and I couldn’t come close to guessing on that.
And, we have adjusted to a .3 million barrel a day build in 2019, from a .7 million barrel a day build. Poppycock! The STEO is overstated by far more than .3 million barrels a day, by itself, and doesn’t consider any Iran drops, or anything else, for that matter.
http://ir.eia.gov/wpsr/overview.pdf
https://www.eia.gov/outlooks/steo/pdf/steo_full.pdf
Despite the decrease in oil inventories, the price of oil falls mainly due to the decrease in the demand of refineries in China. Serious symptoms of recession. Personally I think that prices will fall instead of rising, despite lower oil production.
https://www.nasdaq.com/article/oil-falls-as-concern-grows-over-chinese-refinery-demand-20180808-00747
That’s pretty confused to me. Supply from Iran is likely to drop by a million barrels a day. US is nowhere near expectations of what they are supposed to supply, and can’t get there until close to 2020. But the major concern is that China is only consuming 300k more than last year, and 120k more than last month.
Oil Prices Slide As China Imposes 25% Tariff On U.S. Oil
https://oilprice.com/Energy/Energy-General/Oil-Prices-Slide-As-China-Imposes-25-Tariff-On-US-Oil.html
The idiot continues to do Putin’s dirty work
HuntingtonBeach,
China has removed crude oil from the list of announced sanctions.
Is this all a ruse until midterms? Are we going to get coal in our stocking come Christmas when oil goes from 70 to 85 dollars in a short time frame? If there are any shut downs due to hurricanes we could get some huge inventory drops.
US weekly ending stocks August 3rd
Crude oil down -1.35 million barrels
Oil products up +1.01
Overall total, down -0.34 (shown on chart)
Natural Gas: Propane & NGPLs up +2.9 (not included in chart)
https://pbs.twimg.com/media/DkGchLxXsAEeJg3.jpg
A weekly measure of inventories
https://pbs.twimg.com/media/DkGdEs4WsAEe_vc.jpg
Chart of China’s crude oil imports (7.33 barrels per ton)
General Administration of Customs
https://pbs.twimg.com/media/DkEDGB4X0AAVKN2.jpg
Why does Xi Jinping have to tell the oil companies to increase production and reserves – did they not know that already? Targeting more shale gas is understandable though given that it can be extracted in an economic sound way. The shale gas reserves in China are huge but somewhat difficult to produce I have heard.
BEIJING (Reuters) – China’s state energy giants pledged this week to expand domestic oil and gas exploration and production and increase in particular natural gas supplies following an instruction from President Xi Jinping to boost national energy security.
https://www.reuters.com/article/us-china-oil-xi/china-state-firms-to-expand-domestic-oil-gas-exploration-after-xis-call-idUSKBN1KT1B1
The new chinese communist party economic model is a hybrid. They adopted capitalism with central direction and controls, a system which is still in flux. I think they look closer to Mussolini than Lenin.
someone was saying that China has now excluded US crude oil imports from tariffs, is that right?
Crude oil is exempted according to Argus. Not sure if that includes condensate, but all other products are due for 25% import tax.
China will impose a 25% tax on most energy commodity exports from the U.S. starting Aug. 23, including oil products, liquefied petroleum gas and coal, but is exempting crude oil, Argus reports.
https://www.argusmedia.com/en/news/1731873-china-drops-us-crude-from-tariff-retaliation-list
The weekly oil production estimate of the EIA with respect to the US falls by 100,000 barrels. It stands at 10.8 million barrels. Despite this, despite the fall, the price of the barrel fell by 3.5%. The crash is on the way
https://www.eia.gov/dnav/pet/hist/LeafHandler.ashx?n=PET&s=WCRFPUS2&f=W
Crash in supply means higher prices. If higher prices cause an economic collapse, the timing of this will be later imho.
If oil gets to $130/b or higher, perhaps there will be a recession, though $110 to $120/b was not a problem for most of the World from 2011-2014 and World GDP is considerably higher today so it might take $150/b to cause problems. I don’t foresee a 12 month average price of $150/b occurring before 2023, though I do expect we will see a gradual increase in 12 month average Brent oil price in 2017$ by about $12/b each year on average over the next 6 years. On a monthly basis there will no doubt be quite a lot of price volatility as the market adjusts to the reality of the coming peak in oil output in 2023 to 2027.
Historically, major global recession tended to happen when oil spending as % of world GDP (current US dollars) rose by about three percentage points within a relatively short period of time. This was the case for 1972-1974 (from 1.2% to 4.4%), for 1978-1979 (from 3.8% to 7.4%), and for 2003-2008 (from 2.2% to 4.8%).
During 2011-2013, world oil spending was close to 5% of world GDP but did not represent a significant increase relative to the 2008 price peak, though world economic growth for these years were relatively sluggish.
In the current business cycle, oil spending as % of world GDP reached the lowest point in in 2016 (2%).
World GDP is currently about 80 trillion dollars (current US dollars). Nominal GDP will grow in the next few years because of underlying economic growth as well as inflation and world nominal GDP is also sensitive to exchange rate. Ignore exchange rate changes, world GDP in current US dollars may be about 93 trillion dollars by 2020 (assuming 5% annual growth rate from 2017 to 2020).
5% of 93 trillion dollars is 4.65 trillion dollars.
World oil consumption in 2017 was 98 million barrels per day (BP definition). If world oil consumption rises by 1.5 million barrels per day per year, it will be 102.5 million barrels per day by 2020. Annual consumption will be 37.4 billion barrels.
4650/37.4 = 124 dollars
This back of envelope calculation confirms Dennis’s estimate that a 130 dollar per barrel oil price in the next few years is likely to lead to a global recession.
Interesting elaboration. Tariffs, and their resulting inflationary results maybe something else that could pressure a recession? Not buying some things from China is not an option. In the for instance of steel pipes for the oil industry, there is not only the tariff, but US manufacturers immediately raised their prices for pipe. $130 oil price would cause great pain in any country, other than those net export countries. Tariffs get passed through to the consumer, too.
Few yrs ago there was speculation that the nature of shale had changed the impact of oil on GDP.
The extrapolation would be if a lot of money is spent on oil, it’s going to the shale drillers/suppliers and truckers and the enormous spike in employment that comes from such frantic drilling trying to counter legacy decline rates.
And so, history need not be informative.
Again.
The statistics are getting smeared because nowadays “oil” includes an ever increasing amount of NGL. I usually look at worldwid refinery inputs to figure out whats real oil and whats the “other stuff”.
Fernando,
I agree and use EIA data for World C+C. See
https://www.eia.gov/totalenergy/data/browser/index.php?tbl=T11.01B#/?f=M&start=200001&end=201804&charted=12
April 2018 World C+C output=81821 kb/d
2017 average World C+C output was 80937 kb/d
based on EIA estimates
Dec 2017 World C+C was 81470 and Dec 2016 World C+C was 81728 kb/d, so output decreased from the end of 2016 to the end of 2017 by 250 kb/d and has increased in the first 4 months of 2018 by 250 kb/d, if that rate continues for all of 2018 we would see World C+C output rise by about 750 kb/d in 2018. Also note that the trend in World C+C output from 1983 to 2018 is an increase of 800 kb/d on average each year, so if the output trend from Dec 2017 to April 2018 continues we may match the long term average increase in output (where supply will match demand over long periods) in 2018. If the consumption increase of C+C (input to refineries) is much higher than 800 kb/d in 2018, we may see oil prices continue to rise, likewise if supply growth is below 800 kb/d we would also be likely to see oil prices increase in the absence of a World recession.
Difficult(nay, impossible) to predict future recessions or oil prices, that much most people agree on.
Dennis, if we use Minqi Li’s reasoning, correct his oil rates to account for NGL and other sources, the result is about $136 per barrel.
I have a hunch that oil prices will be pushing beyond that $130 to $140 per barrel barrier by 2040. This starts favoring electric vehicles, hybrids, renewables, nuclear. Their growing market share cuts fossil fuel use, and the net temperature difference between an extended Paris agreement and a path controlled by market forces is slim. Something like 0.3 deg C.
This is why it makes more sense to develop lower cost nuclear and geoengineering to accelerate the carbon sinks. Im even thinking we need to research genetically modified birch and other trees which can extend taiga into tundra. Having treess with thicker and taller trunks should help a lot.
I mention it because the tree outside my dining room has started growing again after many years, it has more branches, more leaves, and i can no longer see the swimming pool.
Fernando,
It is not clear that if externalities (such as the risk of an accident) are included for nuclear that it is actually lower cost.
If we had a better understanding of the Earth System, then geoengineering might make sense.
The rather high likelihood of unintended consequences that may follow any attempts at geoengineering makes this worse than nuclear power from a cost perspective when potential externalities are included.
Solar, wind, geothermal, hydro, waves, batteries, and greater efficiency are probably the safest and lowest cost (including externalities) approach.
Better access to education foe women and access to birth control and equal rights for women would go a long way to reducing the total fertility ratio (TFR) which would eventually reduce pressure on the environment as population peaks in 2070 and then declines as the TFR for the world falls to 1.5 or less, population could fall to under 2 billion by 2300 and in 2500 we can stabilize the planets population at around 1 billion (or whatever number makes sense as we will know much more in 400 years).
If something like the Mohr et al (2015) medium (case 2) scenario (leaving out kerogen and gas hydrates) proves correct and we also see lower cost wind, solar, hydro and nuclear replace much of fossil fuel use after 2040, then emissions between RCP2.6 and RCP4.5 (call it RCP3.55) might keep the planet at a relatively reasonable temperature, if ECS is close to 3C per doubling of atmospheric carbon.
Safer in my view to try to keep anthropogenic carbon emissions at 850 Gt or less from 1750 to 2500. This goal will be difficult to achieve, perhaps impossible.
Cant understand geoengineering unless its researched and piloted. However, the warmist community has control of research institutions, and they have clear political aims: “social justice”, dedevelopment, socialism (aka horrible dictatorships and poverty), enforcing a vegetarian diet, and of course killing bad oil companies.
However, i think a bit of reason is starting to prevail over dogma. For example, the recent hothouse earth paper has a very subtle suggestion to “study carbon sink efficiency enhancement” or words to that effect.
So i imagine, if the world hasnt fallen in the hand of a bunch of vegetarian commies, we will see dogma defeated and geoengineering research will be funded, as it should, because reason will have won and the power elites will all agree they ain’t about to stop oil from being produced.
Fernando,
Research into better understanding of the earth system makes sense. When that is accomplished then geoengineering might be worthwhile research.
I am not advocating stopping oil production, the market will do that as cheaper forms of transport drive down demand for oil to the point that oil prices fall and much of the expensive resources are no longer economically viable.
This is basic capitalism, vegetarianism not really part of the picture.
I really like my pet ideas: 1. Genetically modified birch and other trees which can be seeded or planted in the taiga-tundra boundary. The taiga is moving north, might as well have taller trees which thrive in 500 ppm CO2.
2. Seeding the ocean to increase the number of critters able to take carbon and make carbonate. This may require dumping iron, calcium, and magnesium minerals.
3. Building a pilot nuclear powered ice resistant floating platform to pump sea water up in the air inside but close to the sea ice boundary. That should promote heat release to the air, and form ice crystals. It should be a very effective ice making machine in winter.
2. Seeding the ocean to increase the number of critters able to take carbon and make carbonate. This may require dumping iron, calcium, and magnesium minerals.
Really bad idea! I’d recommend learning a little more about marine biology, marine ecosystems, ocean acidification and how marine organisms make carbonate…
http://www.noaa.gov/resource-collections/ocean-acidification
Carbonate ions are an important building block of structures such as sea shells and coral skeletons. Decreases in carbonate ions can make building and maintaining shells and other calcium carbonate structures difficult for calcifying organisms such as oysters, clams, sea urchins, shallow water corals, deep sea corals, and calcareous plankton. The pteropod, or “sea butterfly,” is a tiny sea creature about the size of a small pea. Pteropods are eaten by organisms ranging in size from tiny krill to whales and are a major food source for North Pacific juvenile salmon. When pteropod shells were placed in sea water with pH and carbonate levels projected for the year 2100, the shells slowly dissolved after 45 days. Researchers have already discovered severe levels of pteropod shell dissolutionoffsite link in the Southern Ocean, which encircles Antarctica. Pteropods are small organisms, but imagine the impact if they were to disappear from the marine ecosystem!
A better bet for geoengineering is storing carbon in topsoil. It’s cheap and easy. Topsoil could easily store enough carbon to trigger an ice age. Arid regions all over the world a plagued by flash floods, which release huge amounts of carbon by stripping off topsoil.
All you need to do is build check dams in the gullies and dig ditches on the contour lines. A little tree planting helps too, but nature will do most of the work. No science fiction technology required.
Most important rain harvesting and flood prevention bring local benefits as well as global ones, which means they have a realistic chance of being implemented.
Soil Microbes convert Soil carbon into CO2:
http://environment-ecology.com/ecological-design/255-biosphere-2.html
“Daily fluctuation of carbon dioxide dynamics was typically 600 ppm because of the strong drawdown during sunlight hours by plant photosynthesis, followed by a similar rise during the nighttime when system respiration dominated. As expected, there was also a strong seasonal signature to CO2 levels, with wintertime levels as high as 4,000-4,500 and summertime levels near 1,000 ppm. Many suspected the drop in oxygen was due to microbes in the soil. The soils were selected to have enough carbon to provide for the plants of the ecosystems to grow from infancy to maturity, a plant mass increase of perhaps 20 tons (18,000 kg).[19] The release rate of that soil carbon as carbon dioxide by respiration of soil microbes was an unknown that the Biosphere 2 experiment was designed to reveal.”
Best option is start planting lots of evergreen trees in cold areas to let the trees sequester carbon. Preferable a non-monocrop so planted areas don’t get devastated by insects & disease. Different plants will have different defense systems thus making it hard for one disease or insect to spread like wildfire. Also planted trees should include fire breaks.
Trees could be planted by aircraft, or semi-automated drones. Planted trees also serve as a future timber resource (capital recovery).
That said, this is largely pointless as developing nations are cutting\burning forests, Mangroves and Peak Boggs, to make way for aquaculture. The more land that is cleared for ag. the bigger the populations are supported. The Indonesian bog fires alone,have released more CO2 that all of Japan annually.
That said the real elephant in the room is increasing risk of another global war. The 2020’s will seem a difficult decade as debt, demographics and resource depletion are all likely to create a really bad crisis. Lots of unhappy people select charismatic leaders that make grand promises, that depend on empire conquests.
Minqi,
Perhaps correct, but a flaw in your analysis is using the BP consumption numbers which includes about 17 Mb/d of output that is not C+C (NGL, biofuels, CTL, GTL), where it is only C+C that sells for something close to the Brent price.
Better to use EIA C+C data for the World, a spike in prices might cause a recession, but it is likely to be temporary in my opinion as oil output is increasing through 2025 and while a plateau is maintained, possibly until 2030. When oil output starts to decline the World economy may have difficulty adjusting and when the markets finally come to the realization that peak oil is real the World economy may fall into a depression, (2030 to 2035 time frame). In the mean time economists need to re-read Keynes so the mistakes made by Europe in response to the GFC will not be repeated. Fiscal austerity by governments in the face of inadequate private investment is the basis for a repeat of the mistakes made by the US in 1929 to 1932.
Dennis
The recession has already started, not due to peak oil, but due to massive debt on a national and personal level.
https://www.theguardian.com/business/2017/sep/18/uk-debt-crisis-credit-cards-car-loans
wages have fallen in real terms for most people and many people paid for things with debt. Most cars are now sold on a loan and return basis.
http://www.autoexpress.co.uk/car-news/consumer-news/99331/concerns-grow-over-uk-subprime-car-finance-deals
People are spending less and as a result many, many stores are closing down.
https://www.express.co.uk/pictures/pics/10035/High-streets-retailers-shops-close-closures-pictures
Many banks are vulnerable, they closing branches everywhere in order to protect themselves.
We had 2 branches in our small high street, they are both gone.
https://www.independent.co.uk/news/business/news/uk-bank-branch-closures-which-research-natwest-hsbc-a8399041.html
A country with a strong economy and very low debt levels could cope with $150 oil. Unfortunately there are not many countries like that.
Councils cannot afford to fund care homes.
https://www.express.co.uk/news/uk/959234/care-home-crisis-uk-government-elderly-care-bankruptcy
Only people with money can afford private homes, at a cost of £50,000 to £80,000 per year and this in no way guarantees good treatment.
https://www.telegraph.co.uk/science/2018/03/21/abuse-neglect-present-nine-10-care-homes-survey-shows/
Peak oil will be the final nail.
Peter,
Problems in the UK are self-inflicted due to poor policy leading to economic uncertainty. The UK is not the World.
Using IMF data for 2010 to 2017, World real GDP (PPP) grew at about 3.5% per year on average and World nominal GDP (PPP) grew at about 4.9% per year on average over the 2010 to 2017 period.
If we consider the longer term trend in World real GDP growth rates (PPP) from 1985 to 2017, the average annual growth rate was 3.6% per year.
Dennis
One could say every country’s difficulties are self inflicted.
You have mentioned GDP as if it is the most important matrix of measuring the global ecnomy. It is not.
The United States debt is out of control and is consuming more and more tax just to pay the interest.
https://www.thebalance.com/the-u-s-debt-and-how-it-got-so-big-3305778
https://www.thebalance.com/interest-on-the-national-debt-4119024
The United States deficit is extraordinary.
https://www.marketwatch.com/story/us-deficit-now-projected-to-top-1-trillion-starting-next-year-2018-07-19
The government effectively steals $1 trillion from future earnings to pay 25 million government workers an average salary of $40,000 per year.
Great trick borrow loads of money reduce unemployment and increase GDP. and fool some of the people all the time!
The interest of the debt is an astounding $310 billion. And this is at a time of the lowest interests in the history of the world.
When the price of oil goes up, inflation will start to move northwards and the Fed will respond with interest rises.
You will see then that the United States is as much of a basket case as Spain and Italy.
Trump is also driving China and Russia closer together along with Iran and others. They will circumvent the Dollar dominance and the dollar will fall in value.
US debt is fine, though higher taxes would make sense while the economy is doing well to pay off some government debt. Trump’s trade policies are definitely a problem and eventually the resulting trade wars might lead to a recession.
GDP is not a perfect measure, but in other comments I have shown total debt levels (both public and private non-financial company debt) and BIS (Bank for International Settlements) data does not show that there is a problem.
Much of the increase in World debt has been in emerging economies, China, and India which historically have not had very good access to credit. As these countries develop and have better access to credit markets their debt to GDP levels will approach that of the OECD and World debt to GDP will increase. That’s a major part of the story for increased debt levels from 2002 to 2017.
How would you propose we measure World economic output without using GDP?
Dennis says US debt is fine.
There is one born every minute
Dennis thinks that a government that has to pay 25,000,000 people $40,000 a year with money that does not exist is fine.
You did say it is fine did you not Dennis?
If you honestly calculate inflation at what it really is 4-6%, GDP growth is flat as a pancake the last decade. Look at health care, rent and other basic necessities that the US government doesn’t correctly account for. Why is that? Oh yeah to keep the COLA for Social Security to a bare minimum.
Peter,
Yes I did. Read some main stream economics.
Try
https://www.bis.org/publ/arpdf/ar2018e.htm
Hah, hah. The OASDI has no debt, has huge investments and a surplus at the end of each year. All deficits are funded by multi-trillion dollar investments, so no debt occurs.
Asset reserves are close to $3 trillion and yearly income is about $800 billion.
Asset reserves are generally higher at the end of the year than the beginning.
The US is being gaslighted by it’s own citizens and by foreigners. Most citizens have no clue what the truth or reality is and they just hear the bullshit
Total income 2017 was 825.6 billion dollars mostly from income taxes.
Total expenditure was 806.7 billion dollars.
Asset reserves at the end of 2017 was 2891.8 billion dollars.
So no more bullshit about money that does not exist. It is sheer lies that stupid and agenda driven people spread around to satisfy their delusions and agendas.
AdamB,
The core inflation data is pretty good.
See
http://www.thebillionpricesproject.com/usa/
Gonefishing,
Thanks. I agree.
For those like me that don’t know the acronym OASDI see
https://en.wikipedia.org/wiki/Social_Security_(United_States)
In short,
OASDI = Social Security
If funds run short, more money will be collected or benefits will be cut back or both.
Peter,
The U.S. exports worthless paper and bombs that’s about it. Oh yeah and high as hell API oil.
GF I had to look up the term gaslighted. But it’s you who are being gaslighted. It sounds like you have look at the numbers (825B, 806B) reported as “off balance sheet” in the US budget and taken these as the beginning middle and end of Social Security spending (SSA). Since you use the term OASDI, you pretty much have to include DI spending, which brings the 2017 outlay to $945B. SSA spending can also be taken to include SSI which in 2017 brought outlays over the $1T mark for the first time.
As 2017 spending is now widely reported, it is easy to look up.
As far as the “multi-trillion dollar investments” of the Social Security trust fund, it sounds like you imagine this being managed like an endowment, or a sovereign wealth fund, which actually holds real assets. Is that what you think? In reality the money was spent and replaced by a marker. It’s a very important marker, and I do not expect the US govt to ever default on it, but that’s all it is. The marker earns a guaranteed rate of return (you can look it up at treasurydirect.gov, currently abt 2.7%) similar to a T bill or note. Unfortunately for budgetary purposes, those earnings must by paid by the treasury. The money will either come out of the general fund, which is already in deficit so there’s really no extra money there, or the treasury will sell notes to raise the money. As stated this is not a problem. The Fed will buy the notes if no one else will.
But it’s not as if there is an independent source of revenue here, like IBM corporate bonds, or German treasuries, held by the social security trust fund. It’s a zero sum game, where the US will borrow from itself as much money as is necessary to make ends meet. And interest in one pocket, is being withdrawn from the other pocket. If you don’t understand these basics of US financial policy, and you think “foreigners” are spreading disinformation, you’re just being a dumbass.
A lot of good posts here. I am leaning towards a somewhat low oil price “ceiling” for a recession to trigger, maybe 110-120 dollars/b. Countries accustomed to low interest rates (most really) are subsceptical for inflationary pressure that would make it difficult keep interest rates from rising damaging the economy. Also, some of the asian high growth countries would have a hard time with 100+ oil prices if the dollar stays this strong ahead. A recession in some small countries that start to infect the larger ones after a while could be a scenario.
All kinds of sudden supply shocks with a prolonged spike in oil price would most likely trigger a recession once we are around 100 dollars/b territory.
I would say that even with less than 100 dollars a barrel. We may even be witnessing the trigger of everything with top prices of $ 70 a barrel. It is not the same 130 dollars, with a world economy without debt, without derivatives, and with interest rates at 5%, than a world economy in which central banks can not lower interest rates (They are now at 0%) , and an over-indebtedness that prevents procrastination. By logic, today, maximum oil prices have to be less to enter recession. Read Steve Ludlum.
PD: Countries like Turkey, Venezuela, Iran, Argentina or Nicaragua are in recession. I would point out that on the way to China they are, and I am looking forward to the fracking industry in the USA …
Monsieur George,
From BIS data, World Debt to GDP has not changed a lot from 2002 to 2017. Lots of economies with debt to GDP above the average are doing ok, for mortgage lending 3 to 1 debt to income is considered viable, probably would work for the World economy as well. So current levels of World debt to GDP with a ratio of 2.44 to 1 is not likely to be a problem, the debt can be serviced.
Note chart below is in % so 100% would be debt to GDP is a 1 to 1 ratio, 200% is 2 to 1 ratio and 300% would be a 3 to 1 ratio (a common rule of thumb for mortgage lending).
Where is natural gas used? According to the IEA Key World Energy Statistics (2017)
Distribution of Natural Gas Primary Consumption, 2015
Electricity Generation 28%
Industry 18%
Transportation 3%
Residential, Commercial, and Agriculture 21%
Non-Energy Use 5%
Intermediate Uses and Losses 24%
In the oilfield it is used for lighting up the area by flaring the useless stuff? Or, you may have that included in other losses.
I haven’t seen a field flaring gas regularly since 1988. And I dont see a reason to allow such flaring nowadays, except in very remote low rate fields.
Fernando,
Have you been to the Permian basin lately? From what Mike Shellman says, natural gas pipeline constraints have led to operators flaring all the natural gas that they are allowed, after that they have to shut in production or I assume there are fines.
They should not be allowed to flare. Its the 21st century, and they can and should plan ahead for gas handling. Flaring is like a restaurant owner saying he has to throw garbage out the front door because he doesnt have a garbage container in back.
Fernando,
I agree as does Mike Shellman the flaring is wasteful and should be reduced as much as is feasible.
You and Mike would know better than me what is possible.
The best approach is to drill wells from pads. A pad can take say 24 wells (the trick is to make sure the wells dont have kinks and super tight turns). Its possible to drill and produce if the wells are spaced right, the lines are buried, and the pad surface is covered with a competent material.
The pad design includes a test separator, and depending on the area, other equipment. I prefer to have several pads hooked up to a satellite where gas is separated, dried, and compresssed a bit to send it to a plant. The design rate is x, and say up to 100 wells can be drilled over the years to keep facilities full. I like to keep the same people, rigs, crews etc working for years, because they can be trained like football teams, which allows them to improve, cut costs, raise production, etc. its also useful to keep drillers around so you can hit their bonus when they drill a crap well full of doglegs.
The #2 use is surprising.
2018-08-08 HOUSTON (Reuters) – U.S. shale producers that spent the last year promising to control capital spending and adhere to strict financial controls are finding the lure of higher oil prices irresistible.
Pioneer this week said it would expand its 2018 budget by around $450 million, with roughly 60 percent of that due to rising costs and around 35 percent stemming from increased production activity.
https://www.reuters.com/article/us-oil-shale-usa/lured-by-higher-oil-prices-u-s-shale-producers-boost-capex-idUSKBN1KT2OG
WTI Midland (Argus) vs. WTI Cushing
August 7th – is the highest the futures curve has been in 2019 since I started watching it – I’ve not heard any news to explain it.
CME -> https://www.cmegroup.com/trading/energy/crude-oil/wts-argus-vs-wti-calendar-spread-swap-futures_quotes_settlements_futures.html
Chart https://pbs.twimg.com/media/DkJbTpSWsAAD-Df.jpg
Probably less oil produced. My guess. You have some Pioneers, but half of the production comes from small producers. I have read in some articles, that there is still, maybe, 200k per day improvements in pipelines due toward the later half of 2018, and the first half of 2019. I don’t expect that will create a mad dash for new oil, rather helping decrease the spread is more likely. The bigger pipelines seem to be moving the expectations of completions to a little later in 2019 and 2020. That 11.7 barrels per day expectation by the EIA for 2019 is looking less likely every day.
This sounds like the extra 220 kb/day that you mentioned. PAA’s Sunrise Expansion project to Cushing, it could start in the fourth quarter 2018.
https://seekingalpha.com/article/4196140-plains-american-pipeline-lp-paa-q2-2018-results-earnings-call-transcript?part=single
Good read, yes that is what I was talking about. Also, note the big pipeline, that was originally expected to come online in the early first quarter of 2019, has been moved back two months, already.Probably, no new big pipelines until the last quarter of 2019, or later.
2018-08-09 (Bloomberg) The number of “completion crews” has declined in the Permian (since early June, but only down to the early May level)
Chart https://pbs.twimg.com/media/DkKg9YzW0AADrgw.jpg
They will continue to drill for DUCs and completions. They have to in order to keep production amounts level. The magnitude of activity for level, or slightly increased production, is not that far away from increasing production. These wells have high first year declines. Most of which comes in the first six months.
Nice data, the only rational response from independent producers without access to pipeline capacity is to stop completions until the spread from Midland vs. WTI is bearable. I am not following this closely, but it seems like a pretty hard stop for some companies addicted to “the hamster wheel” of activity.
https://oilprice.com/Energy/Crude-Oil/EIA-US-Oil-Production-Growth-Is-Slowing.html
He is getting better each day on his reporting. Now, he states that pipelines are not the only reason for slower growth than expected out of the Permian. What I said over a year ago. All these new pipelines are an overkill. I just don’t think that all of the growth expected out of the Permian is possible. Over time, probably. Not 2 million more in a short time. Too much activity required. The oil is there, the peak won’t be as high as expected.
Guym,
I agree many of these oil pipelines may not be needed, makes more sense to develop the resource slowly so that the pipelines can remain at full capacity for a longer period, it would be better to ramp to 4 Mb/d and remain at that level for 5 years than to ramp to 6 Mb/d and only remain near that level for 2 or 3 years, a lot of capital will be wasted on excess pipeline capacity if the ramp to 6 Mb/d is attempted in the Permian basin.
The smart pipeline companies will not be fooled by investor presentation hype, they should consult with Enno Peters or Mike Shellman.
My models suggest perhaps another 2 Mb/d by 2022 is possible (so that’s about 4.5 years as I only have data through June 2018). In June 2018 Permian LTO output was 2647 kb/d according to EIA estimates, I think 4500 kb/d by June 2022 is possible so 1850 kb/d over 4 years or about an average annual increase of 462 kb/d in Permian output from 2018 to 2022.
A better plan would be an increase to 4000 kb/d (337 kb/d increase each year) as the pipelines would remain full for a longer period as the plateau at 4000 kb/d could maintained for a longer period. It would also help with various constraints on labor, sand, trucks, water, etc. and perhaps help to keep costs down.
A master plan for E&Ps. Coordination of who gets what may be a problem? 2 million may be possible, the oil is there, but each increment will take massively more activity levels. Water, sand, rails, crews, roads, trucks, truck drivers, and more. Just don’t see it, myself
Guym,
What do you think is doable? Note I suggest 4500 kb/d which is a bit less than a 2 Mb/d increase and about 500 kb/d annual increases which is less than the 2017 increase. The 4000 kb/d “plan”, which could be done by the RRC as they make the rules, only requires under a 400 kb/d increase each year over 4 years, seems like that could be easily handled by Permian infrastructure, but perhaps not.
Do you consider 4 years a short amount of time? Note that over the past 4 years Permian output has grown by about 400 kb/d each year on average. In the past 12 months the growth rate was 775 kb/d, I agree that rate of growth is not likely to be maintained. I do think half that growth rate (400 kb/d) may be reasonable.
It has grown that much each year, I know. I have read other articles that state Permian growth was slowing due to constraints prior to pipelines clogging. Each 400k increase level requires more activity level than just the same as last year, or production would decrease due to the high levels of first year declines. At some point, it requires an activity level that the boondocks of the Permian can not support. Activity levels are also somewhat price dependent. At the right price, you can overcome many problems.
I would make a wag, and say that, at the current oil price, the production increase in the Permian would stall at around 500k more. At a higher price, which both of us project, it could increase to 2 million given enough time. 4 years is enough time, given enough highly paid truck drivers, who will travel over completely torn up roads. Or, there will be long lines of slow moving traffic waiting for construction crews to repair the torn up roads. Big Sirkorsky helicopters might be economically viable, at some time. Zoo time.
I don’t see the RRC getting involved in setting up any restrictions.
Guym,
I agree, not likely RRC will intervene. However, the pipeline companies may decide there is not enough long term output to make their projects viable, so they may be the limiting factor.
If they build too much pipeline capacity they will lose their shirts.
I imagine there is quite a bit of tax revenue from the increased oil production and some of that revenue can be used to rebuild and upgrade the roads.
Permian Basin scenarios below have low price case with oil price rising to $80/b by 2019 and a medium price case with oil prices going to $115/b by 2025 (2017$ in both cases). The dotted line is the average of the low and medium price cases and the dashed line (read on right axis) is completions per month.
Based on my modelling (well profiles based on data from Enno Peters at shaleprofile.com) in June 2018 roughly 390 wells were completed in the Permian basin, the completion rate only needs to increase to 446 completions per month by late 2019 for the average scenario to happen (4030 kb/d in 2022).
These scenarios assume the TRR for the Permian matches the USGS mean estimate and I have assumed the parts of the play not yet assessed will have a mean TRR of 8 Gb. Permian TRR=36 Gb.
Lol. We do not see it much differently. The pipeline companies see 2.5 million more coming out. Your model sees a little over one million if prices rise. I agree, not much more, if any. Which estimate is right? Well, I don’t stand to lose billions if I am wrong.
As to the roads, the State will repair them. Oil companies better get used to the snails pace the State has in repairing them.
Guym,
The high price case has a peak in 2024 at 4800 kb/d, about 2200 kb/d higher than June 2018 (this does not include Permian conventional output, only tight oil). This may be a bit less than expected from the pipeline companies, but often they speak in terms of total Permian basin output which is 300 to 500 kb/d higher than the tight oil portion.
Dennis, if the Permian is peaking in 2022 (and I assume all USA tight oil also), who do you think will be pumping so much more oil to delay a world peak until 2025-2030? I’m just not seeing who will be able to step up to fill the gap by then, with so many other producers likely falling into the post-peak column in the interim. I just want a list, no charts please and thank you.
When the USA peaks, the world peaks. End of Story.
Hi Ron,
In 2017 OPEC and Russia were restricting output and we had declining output from Venezuela and Libya due to political problems, at some point the political crises in Venezuela and Libya may be resolved and output could increase from those nations.
In the mean time oil prices will rise and there will be more output from OPEC, Russia, Brazil, and Canada that may fill the gap after the US peaks, China might also figure out how to produce tight oil at some point.
Dennis, When and if Venezuela overthrows Maduro, little will change for at least a decade. Venezuela’s theft of contractors assets will keep them out for a decade or so. In the meantime, Venezuela does not have the talent or equipment to increase production. And Maduro will likely be in power for another decade at least.
The situation in Libya is unlikely to get much better any time soon. And the problems in Nigeria are only going to get worse.
Russia is at or very near her peak. Even with the last two months increase, Russia is still producing less than she did at the end of 2016.
China? You have to be joking.
Brazil may produce a few more barrels but not very many more. Not enough to make any difference whatsoever.
Only Canada has the potential to produce a lot more oil. But even if they do increase, that will not be enough to overcome the decline in the rest of Non-OPEC.
That leaves the rest of OPEC. Today, OPEC is producing less than they did in June, July and August of 2008. Everyone always talks about what OPEC can produce but they have pretty much been spinning their wheels for 10 years now. OPEC is just not going to save our ass. That is all wishful thinking.
When the US peaks the world peaks.
“When the USA peaks, the world peaks.”
Is there any sense predicting anything? I don’t believe you, I don’t believe Dennis, I don’t believe Minqi. I certainly don’t believe the EIA or CERA.
The lesson I gleaned from the peak oil clusterfuck of ten years ago is that — while it is glaringly obvious that oil will peak one day — the data is so horrendous that no one knows when it will happen.
There is now as much a chance that predictions will err on the tardy side as on the premature side.
You were the one who introduced me to those MRC horizontal wells used in Saudi Arabia, to the inevitable prospect that the water leg will reach those bottle-brush-like straws resting atop the oil column, to the fact that the end could happen suddenly and without warning.
Ten years ago, I was stupid enough to think I could be prepared for it.
Michael B, get over it. If a man predicts he will be dead before he reaches the age of 75, and he is still alive at 80, so his prediction was wrong. Therefore we can infer that he will never die. Bullshit.
Who predicted the shale oil boom. Nobody! Not the peak oilers nor the cornucopians. But we do know that oil production will peak just as we know the 80-year-old man will die even though his prediction was wrong.
I make predictions because I enjoy doing it. If you have a problem with that then don’t bother reading my comment. But don’t tell me I am wasting my time because I have not one other goddamn thing to do with my time. And I just love spending my time doing this.
Hi Mike,
I see a prediction as more of a prediction than a guarantee.
In what year were we never able to pump enough oil to keep up with demand? Answer: 2017. Isn’t defining the year of peak oil anticlimactive?
Guym,
In some sense supply is always is equal to demand if we think of suppy as production plus refinery inputs that are pulled from inventory and consumption as total input to refineries.
When inventory starts to become lower than normal (or the trend indicates this is likely) oil price rises, when the reverse is true the price of oil falls.
My guess is that higher oil prices will lead to more output from OPEC Russia, Brazil, Canada and may slow the rate of decline in China, Norway, and Mexico, possibly LTO resources will be developed in China and Russia as oil prices rise towards $150/b in 2025.
Note that the rate that reserves are developed in OPEC and many other places is far lower than the US, UK and Norway, extraction rates from producing reserves is also quite a bit lower for the World than for the US (6% vs 12%) so there is potentially higher output as oil prices rise.
Note that I only expect that under a plateau scenario that peak output might be maintained until 2030 and that this might occur with an earlier peak such as 2023 with output roughly flat from 2023 to 2030, the more likely case is roughly flat output from 2023 to 2027 with the actual peak in 2024 to 2026 (impossible to narrow the window more than 3 years in my view).
Those refineries that don’t have enough input will not convince people in those countries that they don’t have a demand for it. Sometimes, I get too used to free markets, and forget what happens when it is not so free.
Stephen Hren,
My “medium” oil price case is quite conservative.
A higher oil price case would peak later and resources might be higher or lower than the mean USGS estimate plus my WAG of 8 Gb for parts of the Permian basin not yet assessed by the USGS (this 8 Gb estimate is particularly uncertain, it might be 1 Gb or it might be 20 Gb, I will adjust when I have more information from the USGS or others.
In any case, a high price scenario for the medium TRR case that goes to $150/b by 2025 has a peak in 2024 at 4800 kb/d for my assumed rate of well completions over time, but note that these assumptions could be modified to allow a plateau due to higher rate of well completion.
In addition I have assumed that new well EUR starts to decrease in Jan 2019, that assumption could also be modified and the peak would be later in that case. That is the reason the peak is impossible to predict. There are multiple assumptions underlying the model any or all of which could be modified and change the result.
A delay in the start of new well EUR decrease due to larger sweet spots than I have guessed from Jan 2019 to Jan 2023 actually moves the peak to an earlier date due to steeper decline later and a faster rise in output, the peak in that case is 2020 with much higher output at 5860 kb/d, overall ERR is actually slightly lower at 28 Gb (vs 32 Gb for previous case) due to a thinner tail after the peak. The two cases are both Med TRR and medium price cases with only the start date for EUR decrease changed and the rate of decrease adjusted so that TRR for both cases is 36 Gb, ERR varies based on economics (all economic assumptions the same for both cases, but the mathematics works out differently as assumptions change for new well EUR decrease rate).
Also note my expectation is that the 2019 EUR decrease start is far more likely than the 2023 case. Chart legend incorrect 2025 should be 2023 for second case.
Countries that could increase output by 2023
Saudi Arabia
Kuwait
Iraq
Iran
Canada
Brazil
Russia
China
Nigeria
Libya
There is also a high price case which peaks in 2024 around 4800 kb/d, but that requires prices to rise to $147/b by 2027 from $67/b in Jan 2018, basically about $9/b increase in real price of oil (2017$) over 9 years for high price case then oil price remains at $147/b until 2041 then declines to $80/b in Jan 2073.
The high oil price case actually seems like the most reasonable guess to me.
Dennis, thanks for the this, I appreciate the list. It’s worth noting, however, that many of these countries could be substantially lower by 2023, thus contributing to the overall decline rather than saving our collective ass. To push a peak back to 2023 requires, imho, everything to go right.
I see a peak in 2022 for the following reasoning. Permian will probably peak in 2022, because of the pipeline delays. In the interim, sometime in 2019 (probably January), more interest will be thrown into other shale plays, because prices will support it. They will continue to rise up to 2022, making the peak growth higher than what the Permian could give by itself. Causing the peak shale to be at 2022. The peak will not be sharp, maybe extending into 2025, after which it will have a sharper decline. Just my wag. EOG is already hot about expanding Wyoming, as the Permian chokes.
https://seekingalpha.com/amp/article/4195653-eogs-game-changing-update-wyomings-powder-river-basin
And while it has not said anything, yet, it will probably schedule more Eagle Ford wells than 2018. Cheatapeak will probably do more in Wyoming, as it has weak holdings, elsewhere.
Stephen Hren,
Libya, Venezuela, Iran and Nigeria might be lower, but my guess is that Iraq, Kuwait, Saudi Arabia and other Persian Gulf oil producers can make up the difference. Brazil, Canada, and Russia will probably be higher.
I took a quick look at the data that’s out there for China’s tight oil and it looks like the EIA is probably overestimating the resource, my guess is a TRR of 5 Gb or less, not really enough to move the needle, so take China off the list, I agree with Ron we won’t be seeing higher output from China.
Deepwater offshore is a big question mark in my mind at oil prices of say $150/b (2017$), there might be some contingent resources that are viable at higher oil prices.
Also the substantial resources in the Middle east may be developed more quickly at $150/b, possibly this will be enough to keep output growing through 2025.
Consider that IHS in 2011 estimated 2P reserves plus cumulative C+C+NGL at about 2600 Gb (does not include extra heavy oil in Canada and Venezuela), reserve growth and discoveries by 2025 are likely to be another 400 Gb, which would coincide with the USGS estimate of 3000 Gb for World conventional URR (I only exclude “continuous resources” such as tight oil and oil sands from the conventional category). I use the conservative estimate of 2800 Gb for conventional crude (C+C only) with a peak in conventional crude in 2021 when cumulative C+C output is 1400 Gb, decline is gradual with conventional output falling by 600 kb/d from 2021 to 2025, increased output from tight oil and oil sands keeps World output rising until 2025.
Guym,
As I think the high oil price scenario is more likely, that scenario implies a peak for the Permian in 2024. I have not run the numbers in the other LTO basins with the high price scenario, but the 2022 estimate sounds about right, maybe 2023 for a US tight oil peak.
Hi Ron,
Perhaps you are right about Libya, Venezuela, and Nigeria, or not. They certainly have the potential to produce more in the future, when that will happen, I don’t know, some time after 2025 perhaps.
Supposedly there is potential for shale oil output in China, just as we were surprised how quickly tight oil developed in the US, we might also be surprised how quickly China might develop their tight oil resources. Russia might surprise on the upside with higher oil prices there also might be more deep water resources developed with higher oil prices.
On OPEC, there hasn’t been any need for them to develop their resources aggressively as it simply would have driven oil prices too low, an extended period of oil at $120/b and higher is likely to increase the speed with which Saudi Arabia, Iraq, Iran, and other Persian Gulf producers develop their substantial oil resources.
It might also lead to an increase in the extraction rate from producing reserves.
For all of these reasons I think the World peak might not coincide with the peak in US output, though my best guess is that US output will peak in 2023 and the World peak will follow within a couple of years (2025). The falling output for many OPEC and non-OPEC producers will make it too difficult to keep World C+C output rising, by 2026 or 2027 it is likely that World C+C output will be in decline, in my opinion.
I don’t see the Middle East countries being inclined to produce faster, that doesn’t seem to have been the case in previous price spikes, and it is not really in their interest to drive the price back down. Iran and Iraq will be producing what the political situation (domestic and international) allows, Kuwait and UAE are likely to just be steady rolling, raking the cash in hand over fist – they can alway claim they are too small to produce much more. That leaves the Saudis, and in June they produced 10.7M/d but were not able to hold it into July, so were likely just pumping from storage.
I believe that by summer 2020 when the US presidential election is coming upon us, and gas prices are a big issue, this will be what everyone is talking about – who has any extra oil?! It will be “political peak oil”, whether the actual physical production peaks a year earlier or after…
Stephen Hren,
When oil prices rise to over $120/b, OPEC producers will see the writing on the wall, if they don’t produce as much as they can to keep oil prices from rising further, their oil will become worthless. They will develop and extract their resources as quickly as is feasible, likely beginning around 2020, in fact, at that point OPEC falls apart and they will be competing with each other for customers.
For the GoM EIA STEO is about 100 kbpd average annual too high this year, 300 to 350 too high for next; for exit rates it’s more like 300 too high this and 400 to 450 next.
Looking it up in the tables, that makes your average for 2018 about 1.6, and for 2019, about 1.51 to 1.56. Exits at about 1.51 for 2018, and exits for 2019 at around 1.43 to 1.48. I was using 1.7 as an average for 2018, which is pretty much being beat up, now. For 2019, I have no clue, as I pretty much rely on you for that.
Some anecdotal stats on the almost complete shut down of lower 48 onshore vertical well drilling.
Summary of activity since 1/1/2015 for our little field.
For context,
Over 750 active leases, over 4,500 active production and injection wells in the field as of 6/30/2018.
Since 2015, less than 30 new production and injection wells drilled and completed.
2017 2 new production 2 new injection wells drilled and completed.
2018 1 new production well drilled and completed to date.
This field is one wherein OPM is rarely used. Operators here generally own 100% of the gross working interest in leases and use their own $$ to develop. In some instances, two or three will go in together on a project, again, using own funds.
The 2015-2017 price collapse was brutal. 2018 prices certainly helping, but suspect it could take 2-3 years of stable prices above $60 WTI for enough financial recovery and confidence to see a resumption of drilling activity.
Another issue seen here is aging of the workforce. Very few young people interested in working in the field given the recent downturn and consensus view in media that oil is a dying industry. The idea that oil production is a dying industry is a new dynamic, not something that was out there after the busts of 1986, 1998 or even the 2008 financial crisis.
Just some information from one small field not in a “shale” area. Suspect themes are similar elsewhere?
Thanks Shallow sand,
What happens at $75/b for WTI in your field? I imagine we will be there some time in 2019.
Interesting, but no doubt true for this type of investor: “could take 2-3 years of stable prices above $60.” There are huge inherent risks in drilling. Add to that computer trade risks, and it simply is not worth the risk. The computers are not programmed to ascertain if we have approximated peak oil, obviously. Hopefully, they have been programmed to factor in backwardation, or we are in deeper dung than I thought. Is the program taking EIA inventory levels, or IEA inventory levels? Or, does it consider inventory levels at all? Pretty scary. At these prices, some oil companies can eke out a small profit, with little or none left for extra capital to expand, or explore. The market is now controlled by computers, and they are improving the world? How much were computers responsible for the 2008 crash? According to my meager calculations, the economy and banks could have absorbed the mortgage losses, it was the derivatives, and their trade that killed it. Did someone program into the computers that we need oil?
Noting how you’ve signed onto the new oil definition of “stable” for prices.
Up is stable. Down is volatile.
What I was trying to convey is we would likely see more drilling in 2020 if oil stays in a tight range and averages $60, than if it hits both below $40 and above $80 and still averages $60.
$75 would result in more drilling, I suspect, but again that will not happen immediately. Very small field with self funding operators.
One thing that seems more certain, when rigs hit a high in our field, it is time to batten down the hatches. The highest year for new wells since WW2 was 1985. The highest year for new wells since 1986 was 2014.
Hi Shallow sand,
Let’s assume oil prices rise to $75/b and remain in the $70 to $80/b range for 12 months say from Sept 2018 to Aug 2019 (or perhaps gradually rise beyond this range to $90/b), would you still be waiting until 2020 to start drilling new wells?
Looking at weekly WTI spot prices, the chart is ugly over the past 17 years, not a low risk proposition by any means.
We have short term ugly (2008) and butt ugly (2014). Every one is afraid of the butt ugly one.
I did a search on the RRC site for new verticals for oil permits to date, compared to 2017. Current prices are not stimulating new verticals much. Around 680 for 2017, and around 700 for 2018. Subtracting out the Permian districts, which was 300 for 2017, and 280 for 2018, it gives about 380 for 2017, and about 420 in 2018. I really don’t expect that to change a whole lot. Verticals can return a better profit over time, but it usually takes longer than a year to recoup capex. Horizontals, on the other hand, better recoup capex fast, or they are in the danger zone. Verticals, no doubt, involve greater risk, as they pretty much know the horizontal areas by now. As prices rise, there will be more smaller companies that don’t have the capex of the big guys, and verticals may become more appealing. I keep an eye on the Eagle Ford district some, and the verticals drilled for other fields are usually done by the smaller operators.
Everyone tends to overlook the smaller operator. It’s probably why EIA missed the Permian projection so badly. Nobody asks them, because they are so big in numbers, and each contributes only a small amount in production. Yet, about 50% of the drilling within the Permian comes from the smaller operator.
What’s the nearest big town? I have a son in Round Rock, in the solar power industry, but they are starting to struggle, so he may be looking for something different.
Dennis asked what is a better way of assesing true global growth other than GDP.
https://www.investopedia.com/terms/g/gdp.asp
On a simple level a Country GDP is like a person’s income. A person earns £40,000 and spends all of that, his personal GDP is £40,000 per year.
What Dennis has done, is bought into the government lie that borrowing does not matter and you can count all the borrowing each year as GDP.
So for Dennis if a person earns £40,000 and also spends £4,000 on credits cards that they cannot afford to pay back. Dennis would say that person’s GDP is £44,000 per year.
For a while that person feels richer, he can pay people to clean his windows and maintain his garden but gradually the debt interest takes more and more of the person’s future wages. Gradually he will be seen as a greater risk and the loans he gets will be high interest.
At the moment the United States is borrowing $700,000,000,000 more than it gets from taxes. Where does this money come from?
https://www.youtube.com/watch?v=qIxhsF6JLEA
https://www.youtube.com/watch?v=2nBPN-MKefA
It is simply brought into existence by a government issueing billions of promises that it will pay in dollars in dollars plus interest to those who buy them.
So at the moment the American people due to government borrowing feel reasonably well off. The government borrows $800,000,000,000 to pay for over 20 million workers. Does anyone really think this debt spiral can simply carry on?
If the United States goverment were to balance to budget the average working person would have to pay $8,000 more in taxes.
There are some stupid economists who advise the government that debt does not matter. They remind me of the economists in the 1920s who said the only way for stocks to go is up.
Some people never learn.
It is not just governments that are in debt.
https://www.bloomberg.com/news/articles/2018-07-10/global-debt-topped-247-trillion-in-the-first-quarter-iif-says
If we take away debt from global GDP we get a better ideas of how well the world’s economy is doing.
The starck reality is the global economy has only grown on debt.
Hi Peter,
Nope.
If a person’s income is 40,000 dollars per year. That is their income.
Nowhere did I say that debt=income.
Nor is GDP=debt.
https://fred.stlouisfed.org/series/NYGDPPCAPKDWLD
https://fred.stlouisfed.org/series/SPPOPTOTLWLD
You are correct that the debt to GDP ratio has grown from 2002 to 2017 (based on BIS data)
World Real GDP (in constant 2010$) has increased (note that real GDP is the measure I use which adjusts for inflation).
I note you did not suggest an alternative to real GDP to measure output. Debt is not a problem as long as it can be serviced, as I suggested you should grab a book on money and banking and do some reading.
Or you could read a classic for a dollar such as
https://www.amazon.com/Books-John-Maynard-Keynes/s?ie=UTF8&page=1&rh=n%3A283155%2Cp_27%3AJohn%20Maynard%20Keynes
World Real GDP in 2010$ increased from 22.5 trillion in 1973 to 80 trillion in 2017. Average growth rate from 1973 to 2017 for World Real GDP was 2.9% per year.
No economist says debt doesn’t matter.
What some say is that debt at reasonable levels is not a problem.
Just as a young family (say in their 30s) with an income of $100k per year and no debt could easily service a mortgage of $250k, typically lenders will allow mortgages up to 3 times income, the World income (approximately equal to World GDP) can support debt up to 3 times GDP. The World in 2017 was at approximately 2.5 to 1 for the Debt to GDP ratio, debt beyond 3 to 1 is likely to be a problem.
I agree with the BIS that governments should either cut spending or raise taxes or both to reduce levels of government debt while the economy is doing well as is currently the case for the World as a whole.
The time when reducing government spending (or raising taxes) is during the boom, during a recession this is a very bad idea as smart economists have shown (see Keynes or read Paul Samuelson.)
https://www.econlib.org/library/Enc/bios/Samuelson.html
https://www.amazon.com/Economics-Paul-Samuelson/dp/0073511293
Yep, as long as you have a expanding economy——
However, that is not always a given.
We shall see, won’t we?
Hightrekker,
So far the economy has mostly been expanding since the Great Depression, except for 2009 World real GDP has increased every year from 1960 to 2017, you are correct that this might change in the future and in that case debt could be more of a problem. The future may be very different form the past, as has always been the case.
Yep–
As is a concern for all, the huge bonus of energy is about to dwindle.
It has made growth possible.
Without hashing out the details, I’ll say that I do not share the optimism of Dennis on debt. I acknowledge that he may have a far better understanding of the big picture than I. Alternatively he may be influenced by his training in ways that make the analysis jaded. That happens even to experts at times.
Regardless, my concern is that we may be heading for the big double wammy- that is peak of oil at the same time as a financial crises. The financial crises may very well be marked by escalation of interest rates, currency fluctuations, or other ramifications that will result in loss of capital to the energy industry for things like oil drilling, nat gas transport, wind and solar deployment, battery and grid work, and ev rollout.
This could severely exacerbate the geologic constraints of oil and gas, and the long tail plateau that has been charted may look a lot more like drooping manhood. The risk for this scenario is mid range, IMHO.
Academia entrenched in theories, models and what-if scenarios, often with a sense of superiority over others, can seldom relate to real, practical life. Personal debt is eating America from the inside out, like worms; massive personal debt will stop oil demand in its tracks at a certain level in the near future and make a mess of Dennis’ models about the future.
https://www.oilystuffblog.com/single-post/2018/06/18/Growth-Based-On-Debt-Is-Unsustainable-Artificial. The credit/debt scheme in the US shale oil phenomena will ultimately be the death of it. Higher oil prices will not fix it unless those prices are very high, and very stable, for a very long time. Then I am not even sure. The role that shale oil will play in our hydrocarbon future is not price sensitive, it is low interest, outside capital sensitive. The shale industry, upstream to down, is now totally dependent on credit/debt for growth. It will not end up working out.
Here is a good article on the ramifications of rising GOR in the Midland Basin: https://www.linkedin.com/pulse/great-gas-up-permian-gathers-steam-scott-lapierre/ This sort of thing is happening in all three basins and the shale oil industry is doing a fair job of covering it all up. Remember, in the Permian, there is NO place to put associated gas now other than in the atmosphere. The BOE metric, a brilliant, useful tool of the shale industry, has everybody hoodwinked, even, I fear, the midstream industry. Would you borrow money to lay more pipe for an industry getting gassier, who’s future is entirely based on ITS ability to borrow more money? Me neither.
Thanks for the link Mike, I hadn’t seen Scott’s latest, although he has written on this subject before. Scott seems to know what he is talking about and backs it up with data. If he is correct, and such theory becomes somewhat accepted in engineering circles, we could see some substantial declines in tight oil drilling.
Of course, I know that you and others have looked at the EUR’s from some of the tight oil drillers presentations and compared them to Enno’s data and come up wondering why drilling is continuing at its current rate given the apparent disconnect between projections and results.
Still, tight oil production is a relatively new thing, and PE’s tend to take their clients wishes in account if they can. But if the production just isn’t there, I believe they will eventually be data constrained. So, if data continues to come in that backs up Scott’s assertion of early and rapid transition to terminal decline, I believe the Petroleum Engineers will eventually and, perhaps by the 2018 year-end evaluations, they will adopt those curves in their third party engineering estimates. If they do the party could be over.
DC, that is all well said, and I concur. Like you, many of us believe that EUR’s were, and still are being exaggerated by a factor of 35% or more. According to Enno’s work even current higher productivity does not appear to support higher EUR’s. The in-house hooey that the SEC allows and reserve base lending the shale industry needs has always been one of the key components in the shale phenomena.
There is something like $80-90B of refinancing coming due over the next 18 months and I can’t IMAGINE, not in my wildest dreams, that anybody wanting to loan those yahoos more money won’t insist this time on 3rd party reserve audits. They are going to find that 70% of these guys owe way more than they are worth and meet the definition of insolvent. Again, you are correct, sir.
Mike and DC,
At what point does high GOR become a problem, Enno’s data shows that for the Permian as a whole the GOR has been pretty steady from 2012 to 2017 (from 3 to 3.5).
Looking at the data, I don’t see the issue.
Decline rates in year 6 are about 15%.
Dennis
You are still taking GDP at face value even though it includes all debt. You are doing exactly what you said you were not doing. Exactly the same as taking the credit card spend and adding that to a person’s earnings.
If you buy a new house with cash or buy it with debt, the 2 transactions are very different. In the first case you own it, in the second case the bank owns it. In the first case there is no debt nor interest to pay back. In the second case there is debt and interest to pay back and that impacts on a family finance in many ways. Yet both are considered as GDP there is no distinction made by government. Nor you so it appears,
I did put forward an alternative, which is quite simple. Real GDP growth is GDP minus global debt. This would give us a truer picture of sustainability.
Economic downturns are much much worse due to debt.
If a family has no debt then a recession has a much smaller impact than for a family with debt. Debt that is serviceable in boom years can destroy families, businesses and countries in a recession.
One thing for sure I don’t need to read the simplistic economic theories you have bought into. It is that sort of rubbish that caused 2008.
Also GDP takes no account of who is spending the money, a person buying a luxury yacht for £500 million for cash or a thousand families struggling to buy their first house with heavy mortgages.
https://www.cnbc.com/2018/01/22/wef-18-oxfam-says-worlds-richest-1-percent-get-82-percent-of-the-wealth.html
The global economy is very fragile because there is too little money in the bottom 60% to keep things going during a downturn.
Real GDP growth is GDP minus global debt.
That would be scary for our capitalist friends.
Grow or die!
Peter, Dennis, et al.,
I may have missed this in the discussion, but I have a poor understanding of how interest rate(s) is set and how it affects asset value and inflation.
Post 2008 central banks made a concerted effort to sustain cash flow and, implicitly, trust. To do this they implemented a programme of reducing rates and buying non-liquid assets, Q.E. This had the understandable effect of pushing up values of various asset classes including prime housing and irreplicable luxury items such as art works.
I would like to gain a better handle on why this has not, as yet at least, led to high inflation in everyday goods and services.
The mechanism employed is a monetary tool that has kept the show on the road, at the ‘expense’ of massively increased, but presently cheap, debt.
Is there a well-founded model that describes what happens next, if i) energy is abundant, and ii) energy is in short supply?
The interest rate and QE tools must have taken a toll on the reserves of the world to accommodate high oil prices. Part of that price is increased debt, which is part of this discussion, to which I add the question of how interest rates come in.
Jonathan
The reason why QE and low interest rates have not caused inflation in the general economy is because all the money created by Q.E. went to financial institutions.
http://positivemoney.org/how-money-works/advanced/how-quantitative-easing-works/
The money went into buying government bonds, stocks and shares. So most people never saw any of it and hence why the stock markets are doing so well even though many companies earnings are not that great.
Also with the destruction of the unions, workers are no longer able to group together and demand a pay rise.
https://www.theguardian.com/business/2017/jul/12/uk-pay-squeeze-real-wages-tuc-unemployment-ons-figures
In the last 10 years pay has fallen in real terms, so there is no wage inflation.
The only inflation we see is in luxury cars, works of art etc. This is because the only massive increases in salary has been restricted to the top 1% who now own nearly half of global wealth.
https://www.economist.com/finance-and-economics/2017/11/16/the-rich-get-richer-and-millennials-miss-out
The rich have also invested this new money in housing and land. Those who own several hundred properties have done well. Not so good if you need debt to buy your first home.
Peter, thanks for this. It seems that polarisation of wealth, as cash spun out of thin air during a crisis, is non-inflationary in the short term. Higher rates going forward, along with reversal of QE, will supposedly contain rising demand and prices.
An impending oil production shortfall may cause a significant reduction in growth, and another period of monetary easing.
Hi Peter,
I will go with the experts on economics.
You can make up your own theory.
GDP is economic output.
So only a newly built home would count as GDP.
Whether the home is paid for with cash that was saved by the buyer or saved by someone else and then lent to the buyer, has no effect on economic output.
As I suggested, you don’t umderstand money and banking.
You seem to think you understand this better than economists.
I think you may be incorrect.
In the mean time, the debt is not likely to be a problem at current levels for the World.
I do agree paying down government debt is smart when the economy is close to full employment. This allows more room for fiscal policy action when a recession occurs.
Most economists would agree with that policy.
Note for the medium TRR and medium price Permian model all debt is paid off by 2027, after that the Permian basin as a whole remains cash flow positive.
GDP is total goods and services?
Good and services require some kind of activity?
Activity of any kind requires energy.
Either you get more energy or you get more efficient if you want GDP to increase.
Why do I never seen energy mentioned when people talk about economics? I would think that it would be a primary concern.
Fossil fuel energy will decline at some point. Economics seems to believe that “the market” will adjust and inventiveness and innovation and technology will find replacement energy. However, the details never seem to be articulated.
Small wonder. Fossil fuels, oil in particular, in the 20th century were:
– cheap
– available in vast quantity
– of very high energy density – both by weight and volume
– easy to transport and process fluids
The replacements? Easy – if you simply declare that the externalities that your economics needs are always available in the quantities needed and that the aforementioned inventiveness, innovation and technology will always deliver them, in the amount required and at the rate required, as the need arises.
Colour me doubtful.
Paul Isaacs,
Externalities explained at link below.
https://en.wikipedia.org/wiki/Externality
As energy becomes scarce it will become more expensive and will be utilized more efficiently.
In general fossil fuel energy mostly becomes waste heat (about 60% on average), wind, solar and hydro power have much lower thermal losses so far less is needed. There is plenty of solar and wind energy, just a matter of utilizing it.
The build out of wind and solar energy to replace declining fossil fuel output will require quite a bit of economic output.
This energy transition from fossil fuels to wind, solar, hydro, and nuclear power is likely to occur over the 2025 to 2050 time frame.
If private and public debt become too high relative to GDP, interest rates will rise reflecting the higher risk of default, as the interest rate rises people will be less likely to borrow and will utilize credit more efficiently.
10 year treasury rates 1953-2018
https://fred.stlouisfed.org/series/GS10
30 year mortgage rates 1971-2018
https://fred.stlouisfed.org/series/MORTGAGE30US
A medium TRR and medium price scenario results in all Permian drilling debt being paid off by 2024. Cumulative net revenue rises to 381 billion in constant 2017$ by Dec 2030 for the Permian tight oil producers. Note that at this point all debt has been paid and the average Permian producer is cash flow positive. The medium oil price scenario in constant 2017$ has oil prices rising to $113.40/b by 2027 and remaining at that level until 2041, then oil price gradually declines to $82/b by the end of 2070 (linear rise and linear fall in oil prices). Price starts at $67/b in Jan 2018.
There is plenty of solar and wind energy, just a matter of utilizing it.
JUST a matter of utilizing it.
Aye and that is the rub.
Just never just rolls off the tongue of an engineer. I am in my 6th decade as an engineer and “just” has never worked for me.
Oil is dense, renewables are diffuse. Oil is its own storage, renewables not so. Oil is an easy to transport and process liquid, renewables are not. Oil used to flow of its own accord out of wells, renewables need significant infrastructure for collection.
We have been off-grid for 15 years. We use about 6 KwHr/day. Wood heat. Hot water from wood stove and solar collectors. That is a very long way from the average North American house. Our wood alone probably requires about 10acres to be sustainable – that is the “diffuse” reality of renewables.
Oil 100×10^6 = 10^8 barrels/day @ 1600 KwHr/ barrel = 1.6×10^11 KwHr/day
300watt solar panel = 300wHr/hr in full sun @average 8 hours of sun per day ( very generous capacity factor ) = 2.4KwHr/day
To replace current daily oil consumption.
JUST 1.6×10^11 / 2.4 = 7×10^10 solar panels – minimum.
Paul Isaacs,
It will take time, it is simply a fact that we cannot use fossil fuel that is not produced. As fossil fuels deplete and become scarce relative to demand, wind, solar, EVs, etc will be a cheaper alternative.
They will gradually ramp up and replace fossil fuel.
Just as a person in 1900 would not have imagined that automobiles would outnumber horses used for transport in the future, the same can be said for changes in the types of energy that will dominant in the future.
I imagine you have seen lots of changes over your life that you may not have foreseen.
That is certainly the case for me. Things are likely to change as rapidly or perhaps more rapidly in the future.
Hello Dennis,
I know it looks terribly pedantic but there is only energy – kg * ( m/sec ) ^2. Energy has no “types”.
Fossil fuels are energy storing chemicals. The energy is stored in the electric field of the chemical bonds. It is released as heat when the bond is broken. A battery also stores energy in chemical bonds but it is released as free electrons when the bond breaks. A solar panel does not store energy but, as in the case of a battery, it converts energy from a light photon to free electrons.
The electric field is currently our major source of energy. There are only 3 other fields in physics that could be sources of energy. The strong nuclear field, the weak nuclear field and the gravitational field.
Heat and electricity ( free electrons ) from the electric field are the main source of the energy that we use to do work.
From an engineering point of view:
the gravitational field is very weak and so large amounts of mass ( as in pumped storage ) are needed to make a working system;
the weak nuclear has no known engineering application. It emits neutrinos which are useless for engineering purposes;
the strong force, both fission and fusion, present large engineering challenges. They have been somewhat overcome but they have obvious dangers and will likely never benign.
In an engineering sense, we currently rely on heat as our main energy source ( combustion engines, gas turbines, nuclear reactors ) because it the easiest source of energy to turn into an engineered source of controlled energy – and consequently a heat engine to do work. The electrical energy we have is predominately a conversion from heat energy.
Currently, burning fossil fuels is our main source of heat.
They will not be so in the future. That means we will have to find other sources of heat or free electrons if we are going to continue to build engines/motors to do work.
My point is not that doing so is impossible. My point is that we have nothing comparable to the energy of oil, nothing comparable to the daily volume of oil and nothing comparable to the engineering utility ( combustion engines ) of oil.
We also have nothing comparable to molecular bonds for storing energy in the electric field.
The future is quite restricted in an engineering sense. We must use the electric field as our energy source. In all likelihood we will have to store energy in chemical bonds.
As you outline, the electric field in photons from the sun is our most probable source of energy.
However, after all these years, I can assure that utilizing those photons to continue power ( energy/day; an oft neglected requirement in discussions of energy ) today’s infrastructure will be a formidable challenge.
As but a single example, the Haber-Bosch process uses fossil fuel as both a source of heat and hydrogen to produce nitrogen fertilizer. That industrial process is now so vast that it is responsible for about 1/3 of the nitrogen atoms in a human body. Converting Haber-Bosch to solar panels is an absolutely daunting engineering challenge. Just generating the hydrogen feedstock on an industrial scale is an enormous problem.
From an old engineer’s perspective, I can’t see our daily energy consumption remaining at current levels. I also can’t see having the energy storage capacity to have that level available 24 hours a day. I don’t see the transition as being merely replacing fossil fuels with another energy source. I see the transition as one to a much less energy intense society.
If we are very lucky, we will have an advanced technology that uses no more than the power of late coal era – 1870 to 1890.
Regards,
Paul Isaacs
Paul Isaacs,
The challenge is formidable, but my main point is that much of the energy stored in chemical bonds is wasted (roughly 60%), so only 40% of the energy becomes Work, the losses are much lower when wind and solar energy are utilized.
Further heat that is used for heating buildings and water can be provided with air and ground source heat pumps, far more efficient (2 to 5 times less energy needed). In addition buildings can be designed better so that thermal losses are far lower and some het can be provided by passive solar.
The challenge is great, but I agree that it is not impossible.
Many old and young engineers have devised solutions to overcome these challenges.
When it is realized that the nearly exclusive focus on fossil fuels is a dead end, engineers will focus on non-fossil fuel energy sources to meet the challenge of providing adequate exergy to society.
Human sewage converted to fertilizer is one solution to reducing energy needed for fertilizer.
Dennis
You can go along with the experts who failed to see the 2008 crises on the horizon. All these experts were very clever in telling us why it happened after the fact.
I go with the experts who warned of these risks BEFORE it happened.
My experts are saying that the economy of America is only staying afloat by massive debt creation. And if you think this is other people’s money it shows how little you know of how debt is created.
Do yourself a favour stop repeating your uneducated responses and go away and spend some time learning about how money and debt are manufactured.
https://www.youtube.com/watch?v=DyV0OfU3-FU
You may think that a Dollar has some set value. Well $300 some while ago could buy a house, now you need $400,000 of them to buy the same house.
A person some time ago would have to work 15 years(after tax and average living costs) to buy that house, now they have to work 35 years.
The massive issuing of debt has gradually devalued the Dollar, but slowly enough so most people like you don’t even realise you are being robbed by your own government.
Peter,
I know very well how economics works, try some reading rather than you tube videos.
Here’s a bio on Mike Maloney
https://goldsilver.com/about-mike-maloney/
He is far from an expert.
Try a basic macroeconomics textbook then work up to intermediate macroeconomics and then a book on money and banking.
I am not going to try to teach you economics.
You won’t learn much from Maloney, he’s a gold bug.
Hint, there’s nothing special about gold or other highly priced metals except that their supply is limited.
It is pretty obvious a dollar has no set value, it changes over time, well understood and measured by governments and also independently see
http://www.thebillionpricesproject.com/
Hello Dennis,
Sorry, there was no “reply” to your last message.
Thank you for the discussion.
You may be correct but I urge you to not underestimate the engineering challenges involved. Renewables are a much more difficult hill to climb than was oil.
Regards,
Paul Isaacs
Peter keep in mind the Gold bugs think there is an economic crisis coming next week. This started when the US went off the gold standard, eventually there was bound to be a crisis, even a broken clock is right twice a day. 🙂
Hmmm, Dennis. Upthread you said US debt was not a problem, and yet here you propose a reasonable debt level to be 3 X income.
In the case of US revenue of 3.3 trillion, this means a reasonable level of debt would be 10 trillion, whereas the reality of US debt is already twice that. Indeed the US is not capable of servicing its current spending level, at its current level of income. No estimates from the CBO, BIS, white house, or any 3rd party institution indicate anything but increasing amounts of US govt debt, year after year.
Your friendly neighbourhood mortgage banker assesses more than straight income to debt. They will try to assess what are the other demands on that person’s income. There are plug-in estimates for such things as food, utilities, and transport based on family size, in addition to the other claims on income like student loans and revolving (credit card) debt. The banker is trying to tease out the more relevant figure of disposible income.
In the case of the US govt, the banker would have to assess that there is in fact no disposible income left at present. Going back to your young family with 100K income – you stipulate 100K income and NO debt. Not exactly a sound analogy is it?
Duanex,
I am using World data from BIS for total credit to nonfinancial private companies, households, and governments.
In 2017 the ratio was 2.5 to 1 for the World for total credit to GDP.
Basically GDP is roughly equal to income.
I am not going to do the analysis for every nation.
http://www.bis.org
Feel free to do so.
> Feel free to do so
I did. And it was 6 to 1 for the USA. Apparently you agree with this calculation, though you don’t want to say so. USA GDP is accepted to be around $20 trillion. The math is simple, and you do much more complicated analyses all the time.
DC: “World income (approximately equal to World GDP) can support debt up to 3 times GDP”
DC:”US debt is fine”
Oh the cognitive dissonance. Personally, I don’t find the analogy of a young family’s income, and US tax revenues, to be all that strong. The young family’s income cannot be raised as needed, whereas US tax revenue can be, at least theoretically. But it is odd to propose metrics and then ignore them.
Duanex,
You are doing the analysis differently.
Using BIS data for the US the debt to GDP is 2.5 to 1.
GDP is approximately equal to income.
Duanex,
The question I am addressing is what debt level (total debt both public and private) is sustainable. Banks typically allow debt to income ratios up to 3 to 1. A nation’s income is approximately the same as it’s GDP (true when trade and capital account deficits are close to zero). For the World this approximation is close to exact as long as there is no interplanetary trade.
You seem to be stuck on public debt only, not really the way to do the analysis, total debt public and private is more important.
It seems to me you should use government revenue, not GDP, when calculating income vs government debt. If you are using GDP then you should compare it to the nation’s entire debt, i.e public and private.
Federal revenue 2017 = $3.3T, total federal debt = $21T. About 6:1 ratio.
You may be able to raise taxes and thus federal income, but not without decreasing private income and raising the private debt:private revenue ratio in the process. Simple transfers the problem to the other side of the scale.
Stephen,
The metric used is debt to GDP in economics.
https://en.wikipedia.org/wiki/Debt-to-GDP_ratio
Total debt public and private is a better measure.
Duanex,
For an individual 3x income for a nation 3x GDP, for US debt to GDP is 2.5x.
https://oilprice.com/Energy/Crude-Oil/Canadian-Oil-Crisis-Continues-As-Prices-Plunge.html
EIA and IEA tend to overstate alternative shipments other than pipelines. So, it may be that we see little growth from Canada for 2018-2019. I guess that is ok, because today’s oil prices indicate it is not that important of a commodity, anyway.
Needless to say, today’s prices are part of computing the volatility of oil prices when the 2019 budgets are computed for capex in 2019. This oil price vs supply/demand/inventory is going to be one interesting scenario to look at in retrospect.
Canada doesn’t have pipelines lined up to be built soon? They obviously have a ridiculous amount
of tar sands, they would get use…lol.. I’m guessing there’s a lot of politics involved with that delay.
First scheduled at the end of 2019. However, there is a debate now, as to how the proximity of the pipelines will affect the growth of native rice. We should have a debate in Texas, as to how the bumps created by pipelines will affect the flow of tumbleweeds.?
Adam B,
Enbridge’s expansion of its Line 3 is the one that may have an effect on native-rice (it isn’t rice) harvesting. If that’s dealt with there’ll be increased oil leaving Canada via Line 3.
The TransMountain doubling-plus of the TransMountain pipeline from Alberta to Burnaby near Vancouver has been delayed repeatedly by both the BC government and protests on environmental grounds. There’s been work done but when (if?) it will be finished is uncertain.
Keystone XL has been mostly cleared except for landowner objections in Nebraska tying up the work in court.
Each of these three projects would afford greater export capacity for Canadian crude.
Rig count up 13 in USA, 10 oil, 3 gas, 2 in GoM; down 14 in Canada which is counter-seasonal so maybe the pipeline bottlenecks and heavy oil discount are having an effect. Permian was still biggest gain but not in Texas and there’s no sign of increase in Bakken or Eagle Ford yet, the biggest gain was to “others” basins, which I assume are smaller or mature plays getting another look at. I think one GoM rig was new exploration for Murphy, but a lot of the weekly changes there just depends on what permanent platform rigs are drilling rather than idle or on workover.
http://phx.corporate-ir.net/phoenix.zhtml?c=79687&p=irol-reportsother
Six of them were in Louisiana, which I assume is based on their new assault in the Austin Chalk (the widow maker).
I agree with you about the chalk, Guym. widow maker.
Widow maker for the operators and investors. Has been for over 50 years. Even EOG came out with the statement that they could unlock the Austin Chalk anywhere over the Eagle Ford. Duh. They have since walked that statement back, and restated that it would require natural fractures. That has been known since it was first drilled. I am not even an amateur geologist, but have read it is not a source rock. It traps oil in it from other fields (e.g. Eagle Ford), if it has a way for it to be trapped. In the eighties, a lot of money was stolen from investors over its hype. Now it’s BAAACKK!
EOG has had fantastic results in one area. Karnes County, as in over the Karnes Fault. Giddings in western Karnes and Eastern Atascosa Counties was also an active area years ago. As I say, I am no geologist, but there looks to be a similar fault area in one section of far Eastern Louisiana. If they are trying to drill all over, good luck with that.
The 2017 EY US reserve and production report is out: https://www.ey.com/us/en/industries/oil—gas/ey-us-oil-and-gas-reserves-and-production-study-2018
Big increase for reserves from discoveries and extensions, I’d imagine mostly for Permian but couldn’t find if it says so.
It covers only some large companies, and purchases of reserves from other non reported companies made up some of the increase. But, it’s hard to tell when they just lump stuff together.
This shows the history and category of changes. Net acquisitions were quite high, positive revisions also, probably because of the price though so far they’ve only recovered about a third of what was lost in 2015 and 2016, but discoveries were highest. Even if all that discovery is against Permian it would still have only around 15 Gb official reserves, so probably still some way to go.
Thanks for the link. I see they lump NGL with crude and condensate. I assume ngl is increasing faster than stabilized crude and condensate, because the increase is mostly LTO. Does anybody have NGL data?
IEA OMR is out: https://www.iea.org/oilmarketreport/omrpublic/
Global oil supply rose by 300 kb/d in July to 99.4 mb/d, 1.1 mb/d above a year-ago. Compliance with the Vienna Agreement eased to 97% in July as output cuts were relaxed. Non-OPEC production is expected to grow by 2 mb/d in 2018 and by 1.85 mb/d next year.
OPEC crude oil output was steady in July, at 32.18 mb/d. An unexpected decline in Saudi Arabian supply was offset by higher production from the UAE, Kuwait and Nigeria. OPEC compliance was unchanged in July at 121%.
OECD commercial stocks fell seasonally by 7.2 mb in June to 2 823 mb and were 32 mb below the five-year average. Stocks at the end of 2Q18 were up 6.6 mb versus end-1Q18, the first quarterly increase seen since 1Q17. Outside the OECD, inventories were also mostly higher during the quarter.
The recent cooling down of the market, with short term supply tensions easing, currently lower prices, and lower demand growth might not last. When we publish our next report in mid-September, we will be only six weeks away from the US’s deadline for Iran’s customers to cease oil purchases. As oil sanctions against Iran take effect, perhaps in combination with production problems elsewhere, maintaining global supply might be very challenging and would come at the expense of maintaining an adequate spare capacity cushion. Thus, the market outlook could be far less calm at that point than it is today.
IEA is still using the estimate from EIA for non-OPEC production (or US production). There is only going to be about a .6 million increase in C&C from the US in 2018, and less than that in 2019 (more than that from shale, but reduced by GOM). So, liquids other than oil would have to be about 1.4 million in both years to make their projection close. I kinda doubt that. Just my opinion. But what are they calling non-OPEC production? If it includes Russia, there might be 300k more. However, that means OPEC, by itself, could not make up from the drop in Venezuela, and other OPEC producers. And how much is the projected demand influenced by phantom oil from the EIA? Add in a million barrel a day stoppage from Iran, and we are totally screwed.
US production estimates are way too high, we know that now. The EIA was essentially extrapolating the Permian in a straight line, logistical constraints ignored. Doesn’t work in the real world.
The ultimate adjustment in USA numbers is going to be large. Might or might not tilt world production flat in July but I think that misses the point. The USA numbers for rest of 2018 and all 2019 are way too high. Unsurprisingly storage has been dropping. Meanwhile natural decline is going to continue to grind on most conventional producers and political problems will keep Venezuela falling.
Is “rampant lack of maintenance and theft” a political problem?
Really do not see how an Iranian sanctions cut of 1 million+ is supposed to be covered.
OECD inventories, they revised May down by just over -10 million barrels and so June is down -17 from the prior report.
India Comsumption of Petroleum Products (PPAC)
Total (without LPG)
July 2018 is up +7.6% compared to July 2017
The first 7 months of 2018 is up +6.2% from the same in 2017
Chart https://pbs.twimg.com/media/DkVNTHAXoAAJ3I6.jpg
Yep, and they are having a sense of optimism about growth that is taking strong root.
Yes the economy still seems to be growing even with higher fuel prices…
Delhi retail diesel prices from the Indian Oil Corporation Ltd (Rupees per Litre)
May 29, 2018 was the high at 69.31
August 10, 2018 at 68.57
The average for the month of July 2017 was 54.58 (so prices up approx 25% yoy)
https://pbs.twimg.com/media/DkVZ5t6WwAAS0jG.jpg
The headline seasonally adjusted Nikkei India Composite PMI Output Index rose from 53.3 in June to 54.1 in July (PMI by IHS Markit Ltd)
Composite chart https://pbs.twimg.com/media/DkVb7s7XcAAa39x.jpg
WTI Midland – WTI Cushing updated to August 10th
https://pbs.twimg.com/media/DkVl0jfW0AEeeG9.jpg
It looks the demise of the Haynesville gas has been grossly exaggerated.
https://www.eia.gov/naturalgas/weekly/#itn-tabs-0
Haynesville natural gas production reaches five-year high
In June 2018, natural gas production in the Haynesville shale formation, located in northeastern Texas and Louisiana, averaged 6.35 billion cubic feet per day (Bcf/d), accounting for 8.5% of the total U.S. dry natural gas production, Haynesville’s highest production level since November 2012.
Who would have thunck that, with those huge decline rates?
SWEPI and Encana sold out. BHP just sold out. Chesapeake has sold off a good bit of theirs and for all practical purposes, they are insolvent. EXCO is bankrupt. Private Equity has come in and taken over most of the production and is drilling the new wells.
This is what we call a pyrrhic victory
In today’s Wall Street Journal.
Frackers Burn Cash to Sustain U.S. Oil Boom
“Two-thirds of U.S. oil producers failed to live within their means in the second quarter, even as oil rose above $70 a barrel. Collectively, 50 major U.S. oil companies reported in their second-quarter results that they have spent $2 billion more than they took in, according to an analysis of free cash flow by FactSet.”
“In recently reported second-quarter earnings, more than a dozen shale companies either lowered this year’s production targets, said they would have to spend more to extract roughly the same amount of oil and gas or missed analyst expectations for growth. To be sure, many continue to expect their production to increase compared to last year, but they are having to spend more to meet those goals.”
“The days of rapid efficiency improvements appear to be waning industry-wide. Producers during the downturn figured out how to produce more from each well for less money. Since 2016, however, the oil price at which operators can turn a profit drilling a new shale well has flatlined in some parts of the Permian and increased by an average of 17% in others, according to data from Rystad Energy.”
Its OK- “the debt is serviceable”
And if at some point all the debt becomes too much to service (along with all the student loan, pension plans, etc), then we’ll just raise taxes to make everyone whole (OK, half-hole).
Just like last time, except more/worse.
‘who you calling a half-hole?’
Yeah. I am not sure as a country we would pay any amount of money to make sure everyone had clean water. So why would we assume the government would screw the economy just to keep oil flowing?
Raising taxes is used to reduce public debt, also spending could be reduced instead, if people are worried about government debt, they need to elect representatives that will reduce government deficits.
This has no effect on private debt, that is determined by the decisions of private borrowers and lenders. In a free market economy, those decisions are made by private individuals.
Hickory,
If the debt cannot be serviced, the companies go bankrupt. When debt is not paid back, the lender loses, that’s part of the risk of lending and is a part of the reason interest has to be paid to borrow.
When there are enough bankruptcies interest rates may increase and there may be less LTO produced, this will reduce supply and oil prices rise. The higher prices may make the producers that have not gone bankrupt more profitable.
I seems likely that oil prices will rise, if so the Permian basin will become cash flow positive and debts can be paid.
Yes Dennis, I am in agreement about the Permian becoming profitable for some if the oil price rises high enough.
Some (?many) other players may be washed out.
I’m hoping you can tell me which ones will be left standing {insert smiley face emoji here}.
Hickory,
No clue, but if I were investing I would consider those who have lower debt at present and are nearly cash flow neutral, those are likely to be the companies left standing.
Comrades—
Futures are looking a bit dim tonight.
We will see in the morning——
NYT reporting an agreement among all countries with a Caspian Sea shoreline to permit pipelines and oil development. Google for it, has a paywall.
The markets are said to be concerned about emerging economies due to higher rates and trade tariffs. Waiting to see if some new trade agreements can be done???
November 20, 2017 St Louis Fed
The world has become used to cheap credit. And the increase in borrowing by emerging economies could pose a risk as monetary policy normalizes.
.
Market expectations of a rapid increase in the policy rate and the reduction of the Federal Reserve’s balance sheet could lead to higher borrowing costs and an appreciation of the U.S. dollar. This, in turn, would increase the cost of refinancing debt in emerging economies.
https://www.stlouisfed.org/on-the-economy/2017/november/global-debt-rising-emerging-economies
Turkey is making the headlines – 2018-08-10 (FT) Turkish oil prices (priced in Turkish lira) are almost triple the level they were in 2008, when Brent hit $147.50/bbl. Country imports more than 90% of its liquid fuel.
https://pbs.twimg.com/media/DkRuv31U8AAnQy9.jpg
Question for George Kaplan,
In the past I had seen that you posted a production estimate out to 2051. The estimate stated undiscovered 23Gb, undeveloped 145Gb, extra heavy 78Gb, and developed 495Gb. Perhaps you recall this post? Have you refined or reconsidered any elements of that future production estimate?
No – haven’t looked at it since, might have lost the file but I’ll have a look. I’m pretty sure I would only have included conventional oil and XH, not LTO, because I don’t understand how that works at a permanent loss.
George K,
LTO permanent loss? Not at higher prices. Even a slow rise in oil prices from $67/b in Jan 2018 to $114/b in Jan 2027 allows the Permian to reach cumulative net revenue neutrality (all debt paid off) by late 2023, with cumulative net profits of 380 billion by 2031.
https://www.bloomberg.com/view/articles/2018-08-12/trump-s-iran-oil-sanctions-will-hurt-more-than-you-think
With India and Japan set to reduce, its easy to see Iran exports losing one million barrels a day.