An interesting paper was published by S.H. Mohr, J. Wang , G. Ellem , J. Ward , and D. Giurco in Feb 2015 entitled, Projection of world fossil fuels by country. It updates Steve Mohr’s earlier work in 2010 and can be found at the link below.
https://www.researchgate.net/profile/Steve_Mohr
The table below is table 2 from page 124 of the paper which summarizes the URR estimates with comparisons to Mohr’s earlier estimates from 2010.
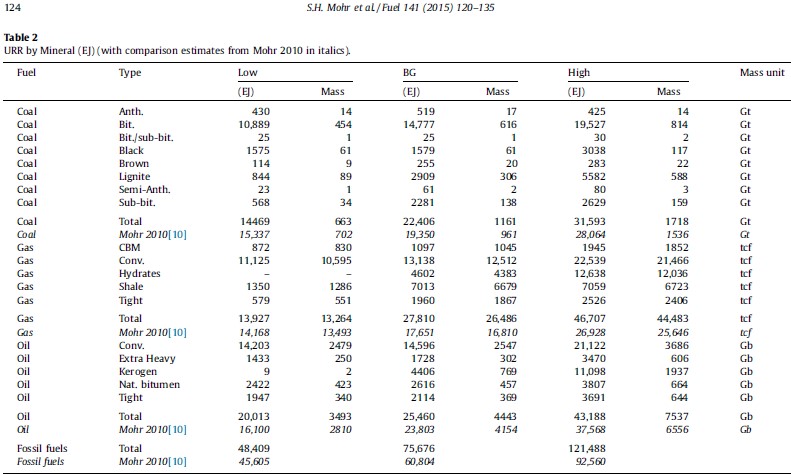
The best guess (BG) and High URR estimates both include considerable quantities of kerogen and gas hydrates.
Both comments below discuss the high case for oil and natural gas.
From page 127 (section 5.2.2):
The projection is heavily dependent on the rapid growth in kerogen oil in the USA. Historically kerogen minerals were exploited for synthetic oil production such as in Australia, and kerogen is currently exploited in Estonia as an energy source for power stations. However, kerogen is only being exploited as a source of liquid fuel in small quantities in countries such as China, Brazil and Estonia [109]. Given the limited current production in kerogen, any projection of future kerogen oil production needs to be taken with considerable caution. Production from kerogen oil could easily fail to materialise due to delays in technological advances needed to reduce the cost of the oil, or due to scarcity in fresh water needed to process the kerogen into a synthetic crude oil.
From p 127 section 5.2.3
After conventional gas peaks, gas hydrates are anticipated have strong growth before peaking in the latter half of the 22nd century. The hydrates projection needs to be treated with considerable caution, as methods of extracting natural gas hydrates are still being researched. It is uncertain when or even if, technological advances will make gas hydrates extraction technically and economically feasible.
The Best case for natural gas has the comment below from p. 128 Section 5.3.3.
As with the High case, projection of hydrates needs to be taken with considerable caution. Hydrates could be delayed if technical advances are slow in developing or unfavourable economically; alternatively the recent shale gas boom in North America highlights that technical advances could happen suddenly if a technical breakthrough occurs.
In my opinion, the recent shale gas boom was due to high natural gas prices leading to the combination of fracking and horizontal wells, which was not a technological breakthrough. So citing this as being the reason that a methane hydrate technological breakthrough might be imminent seems dubious. Also the assumption that high enough natural gas prices can be maintained to allow the profitable large scale exploitation of gas hydrate is doubtful in my view, even over the long term.
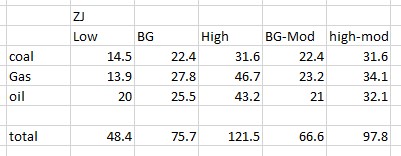
To consider the case that no significant kerogen or gas hydrate resource is extracted in the future, I excluded these resources from both the BG and high cases to create two new cases called BG-mod and High-mod.
In zettajoules (ZJ)= 1000 exajoules(EJ) we have:
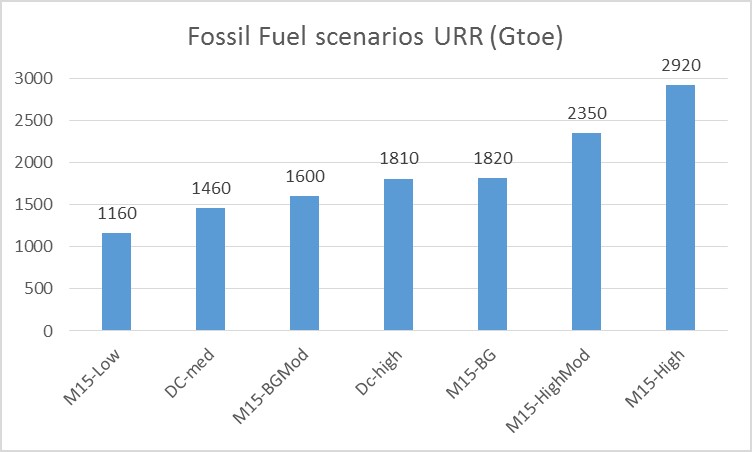
For the more familiar gigatonnes of oil equivalent (Gtoe), where 1 Gtoe=41.72 EJ we have:
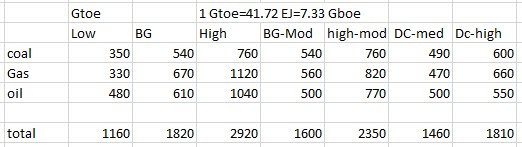
The DC-med and DC-high cases are my medium and high fossil fuel scenarios from earlier posts at Peak Oil Barrel (oil, natural gas, and coal), my high scenario is similar to the Mohr et al 2015 (M15) BG, my medium scenario is slightly lower than the modified BG case (BG-Mod). The M15 high case is 2 times higher than my medium scenario and seems overly optimistic with Gas and oil resources that are almost 2 times higher than my high scenario, mostly due to high estimates of shale gas, tight oil, bitumen, and extra heavy oil as well as kerogen and gas hydrate resources. My low scenario is similar to the M15 low scenario and is not presented. The chart below makes for easy comparison.
Based on this new information a medium case of about 1700 Gtoe +/- 600 Gtoe for World fossil fuel URR seems reasonable.
198 responses to “Projection Of World Fossil Fuel URR”
Hi Dennis,
Of the about 1700 Gtoe +/- 600 Gtoe for World fossil fuel URR, how much is conventional crude plus condensate and how much is unconventional?
About 1250 Gtoe is conventional oil,gas, and coal.
Thanks Dennis, does this piece change any of your previous estimate statements of URR conventional crude?
My old estimate was DC-med about 1460 Gtoe not sure about my shale gas estimate, but unconventional oil was about 100 Gtoe, my guess is the conventional gas estimate was similar to M15-BG. Probably not a big change in conventional estimate but unconventional slightly higher by 250 Gtoe.
Misunderstood your question, conventional crude estimate is unchanged. Mostly the estimates of unconventional Petroleum is higher.
These guys use what i call baloney units. Need to use a volumetric unit and be very clear as to what they think is the crude density. Energy values are no good because it doesn’t spell out clearly how they get to it.
Hi Fernando
I disagree, the barrel of oil equivalent is a pretty standard energy unit. The paper has a table which lays out how many EJ per unit volume (or mass for coal) are used. A Gtoe=41.72 EJ.
Does this entire type of analysis even make sense? I say it doesn’t. Or if it does, you’ve omitted the crucial parameter: the price. What oil price are they assuming in this paper?
Obviously the amount “recoverable” depends entirely on the price, so you need a range of scenarios *for each possible price point*. The lower the price goes, the lower the amount ultimately recoverable is.
After all, at a high enough price, we start doing manufacturing oil using stuff like the Fischer-Tropsch process, which vastly increases the amount “recoverable”.
And at a low enough price, nothing is recoverable.
What would be useful would be a chart which *for each price point* gave a range of possible amounts ultimately recoverable.
Implicit in the analysis is that fossil fuel prices are high enough to make extraction profitable demand for fossil fuels is met by supply at least until peak.
Demand will ALWAYS be met by supply. Before, at, and after the peak.
Yes supply and demand will be equal after prices adjust to establish a match.
The point is that as supply falls prices will rise and the amount purchased will fall, eventually a combination of substitution and greater efficiency may result in demand falling faster than supply and fossil fuel prices will fall.
I doubt this will occur (falling fossil fuel prices long term) until 2050 (possibly 2040 under very optimistic scenarios for EV and renewable ramp up).
Supply equal to demand is tautological.
Asdf, you are correct – but ultimately deprivation and die off may help demand meet supply.
That’s a lot of scenarios. Implicitly the lower URR scenarios correspond with lower prices.
All right. I’ll take the bottom scenario then! But I suspect it may be way too high, depending on what price assumptions it has baked in.
Explanation on the oil price: My projections on price say the oil price might spike for a few years but it crashes in the 2022-2024 timeframe and stays down for a very long time, until lots of companies go bankrupt and shut in their wells and shut down their refineries. Oil is basically only used for transportation now, since it priced itself out of all the other markets back in the 1970s. 2/3 of that is ground transportation, 1/3 aircraft. The disappearance of the ground transportation market will crash the price for a long time, if not forever.
The price of substitutes for ground transportation continues to drop fast. There’s a complex dynamic in the electricity markets, but the bottom line is that the prices keep dropping and oil can’t compete.
Let’s use Australia as an example.
Right now, Australian solar panels are now coming in at an LCOE under AUD$41/Mwh (assuming zero discount rate, which is fair in the current zero-interest-rate environment, though this may change). Again, right now, batteries are coming in under AUD$230/Mwh (which is *sure* to drop *fast*). A typical electric car will get 300 wh/mile (Tesla Model S and X are worse, but they’re huge), so that’s AUD $0.081/mile.
The best “conventional gasoline” (not hybrid) sedans get 32 mpg (not including the smallest econoboxes). Converting to liters, we find that to compete on price, gasoline needs to cost AUD$0.69/liter or less. This will never happen. Petrol excise tax in Australia is AUD$0.395, shipping is minimum $0.01, wholesale and retail margins are minumum $0.10, which is $0.505; GST just on this (not on the pre-shipping gasoline!) brings it up to $0.5555. This leaves about $0.1345 for cost of gasoline, but subtract out the GST and it has to be AUD$0.1222/litre. Given that refining costs amount to more than AUD$0.10/litre, this is plainly impossible.
So, in Australia, solar + batteries powering an electric car has won on fuel cost — permanently. The only restriction is upfront cost of the cars. (If the solar panels and batteries have too high an upfront cost, people will use grid electricity, which will be forced to come down to the price of the panels + batteries in order to compete; the market for utility solar and batteries is fast-moving and competitive.)
The upfront cost of the cars is coming down fast. The premium market is done for already, cooked. The above-mid-price market gets cooked by the release of Model 3. As for the downmarket, a large number of Chinese companies are moving in on it very fast. The limit here is largely the price of batteries again; and they’re coming down very, very fast.
Once the batteries + electric motor cost less to produce than the *very complicated machinery* involved in the internal combustion engine (engine block, automatic transmission, muffler, catalytic converter, oil pumps, etc. etc. etc.) it’s just a matter of replacing the existing fleet on the road.
And that’s going to happen soon. A brand-new automatic transmission is something like US$2500, and a brand-new engine block is around $3000; add at least another $500 for all the other parts. (And no, I’m not including labor, and I believe I’m lowballing costs.) With battery packs at $100/kwh (which I really do believe is happening by 2020) a battery pack with a >200 mile range for a Tesla Model 3 costs about $6000. Yeah, you have to add a bit for the motor, but you get the point.
Now, there is one potential problem with my analysis: hybrids can get better than 32 mpg.
It is possible that non-plugin-hybrids will stay around for a bit longer, but that seems unlikely; if you have a non-plugin-hybrid, why not get one with a plug instead (at very little extra upfront cost — one cheap inverter)? This trend is already clear.
And although plugin hybrids will probably be around for quite a while longer, they’ll cost more than pure battery-electrics (due to having two entire motive power systems), *and* it’s already documented that plugin hybrid owners will preferentially use electricity to fill up instead of gasoline, because it’s cheaper and more convenient.
So I see the fleet being replaced with cars which run primarily on electricity, and really replaced as fast as people can find the capital to do so. This will *devastate* oil demand.
It is true that the transition may go slower in areas which have particularly low gas taxes and particularly cheap gasoline (which includes the US), but the worldwide trend is clear enough. Europe, India, and China all have gas prices which are more comparable to Australia in both level and structure than to the US. So does most of the rest of the world
I’ve run the gas-vs.-electric numbers for the US, and for gas to be competitive, it really has to stay under $1.80/gallon. Maaaybe $2/gallon. This is USD$0.47 – $0.57/liter. There are very few countries in the world where the gas price is anywhere near that; every one is a major oil producing country, and the list doesn’t include all of the major oil producing countries.
Accordingly, global demand will crash as fast as the electric cars can sell, and they’ll sell fast.
About the only way this could slow down would be massive cuts to the gas tax worldwide, and I just don’t see that happening.
Hi Nathaneal,
I agree excluding hybrids is a mistake, you need to use 50 MPG (Prius fuel economy) as a comparison. Also fuel taxes can be reduced and roads can be funded by registration fees as it is unfair to put the entire burden on fuel taxes as more electric vehicles join the fleet. So using US prices for fuel would be a better benchmark.
There is also a convenience factor in places like the US and Australia, where even at a similar cost of operation being able to refuel quickly may be worth paying extra so EVs will need to cost much less to operate to overcome this hurdle for those who drive long distances regularly as in the Aussie outback or the US West. Most of the fuel is probably consumed in more densely populated areas though so probably not a huge factor.
Eventually I agree oil demand will decrease more quickly than supply, I just am not as optimistic that it will happen as quickly as you envision, I think by 2030 or so, you seem to think more like 2025 (maybe earlier). If AVs become operational by 2025 (which I doubt) you might be right. Again, I think realistically these won’t be ready before 2030 for commercial use.
Also fuel taxes can be reduced and roads can be funded by registration fees as it is unfair to put the entire burden on fuel taxes as more electric vehicles join the fleet.
ICE’s don’t pay the costs of pollution or supply insecurity. Exempting EVs from road taxes very is a good idea, but it doesn’t go far enough: road taxes should be higher.
Dennis: So we’re only disagreeing on timeframe? Great. 🙂 There’s certainly a lot of ambiguity in that, and the big wild card for me is China, since I don’t read Chinese, which makes it hard to follow the state of the car market in China.
I think even if the key year is 2030, we don’t really have enough time for more than one big oil price spike. I don’t think there’s room for two (spike, collapse, spike, collapse) before 2030.
Fuel taxes could be reduced, but politically I don’t see it happening in countries like China and India.
Hi Nathaniel,
For accuracy sake, when you compare relative cost of energy sources to individuals (or larger populations), it is the retail price of those sources that affects purchase behavior rather than ‘wellhead’ cost of production.
For example- here in Calif (PG & E territory) regular 87 gasoline is just under $3 for the past 6 months. Electricity weighted average is 24-25 cents/kwh at the customer level, with only a few cents discount for middle of the night use plan that is quickly exceeded beyond tier one pricing (minimal use).
What electric rates do you pay?
I pay 11 cents per kwh, upstate NY.
California, like Australia, has particularly expensive retail electricity. If you look at gasoline-vs-electric car in isolation, this makes electric cars look bad in these locations. Which is the reason why I specifically sat down to calculate the cost of home solar. I don’t think the expensive retail electricity in California (or Australia) is sustainable as it will be driven down by solar, when the solar is cheaper than the grid. This is already happening in Australia. People *are* capital-cost-restricted, which is something I’ve been ignoring, but in a zero-interest-rate environment I tend to think the loans will appear.
Now, *solar prices* are currently elevated in the US by excessive “sales and marketing” costs, which I don’t think is sustainable either, which is why I was using Australian numbers for solar. I expect the US “soft costs” to converge to the Australian norm, which is similar to the German norm, very quickly (next 1 or 2 years).
You’re asking for a pretty basic thing: a “supply curve” showing supply vs price, for each energy source.
An analysis like this absolutely needs supply curves. If you have supply curves for coal and solar power, for instance, you can see compare the supply of each at a particular price. The dynamics of substitution become much clearer.
You also need projections for changes in those supply curves over time, as FF depletes and new energy sources become cheaper.
Hi NickG,
I think the authors are more interested in output which is determined by supply and demand, feel free to produce supply curves, I don’t have enough information to even guess.
As I have said this is the resources likely to be produced under a range of scenarios.
I agree with Nathaneal that the lower estimates are more likely if wind, solar, and hydro ramp up quickly. I also agree with an earlier assessment by you that without proper policy an assumption that alternative energy growth will happen quickly by “letting the market work” is not wise. I also agree with a comment by Gone Fishing that it will not happen “automatically” (basically the same point you have made.)
For that reason I think the medium scenarios may be more likely as we probably will not see “near perfect” policy (especially in the US). I certainly hope that the low scenario will be correct, but hope and reality often do not coincide.
I think the authors are more interested in output which is determined by supply and demand
Exactly! And, the relationship between supply & demand is described by a supply curve.
How can you analyze supply and demand without a supply curve??
I suspect that the authors have intuitive ideas of those supply curves – their analysis would be greatly improved if they made those curves explicit and quantitative. They probably don’t want to admit how hazy their ideas about supply & demand really are…but that’s the whole point of research: you publish your assumptions and results, and then others can improve on them.
Perfect is the enemy of the good.
Thank you Nick 🙂
Oil and gas jobs down dramatically in Pennsylvania.
Jobs in Pennsylvania’s oil and gas industry dropped sharply in the first quarter of 2016, compared to the same time period last year, according to new data from the state Department of Labor and Industry.
“Overall, the industry shed about a third of its workforce, dropping to 20,524 jobs in 2016 compared to 30,313 the previous year. Those figures are not seasonally adjusted and reflect employment in six core areas of oil and gas operations:
•Crude petroleum and natural gas extraction
•Natural gas liquid extraction
•Drilling oil and gas wells
•Support activities for oil and gas operations
•Oil and gas pipeline and related structures
•Pipeline transportation of natural gas”
https://stateimpact.npr.org/pennsylvania/2016/11/22/oil-and-gas-jobs-down-sharply-in-pennsylvania/
This article in The Economist is probably as middle of the road as any you will find, it terms of a discussion of future trends in fossil fuel energy use, with most of the emphasis on India and China.
It’s well worth the time to read it.
http://www.economist.com/news/special-report/21710633-consumption-patterns-asia-will-not-replicate-those-west-where-indias-and-chinas
Oil companies shoulder pain of downturn with lower output
Nov 24, 2016
http://www.reuters.com/article/us-oil-production-idUSKBN13J0I0
The world’s listed oil companies have slashed oil output by 2.4 percent so far this year.
The aggregated production of 109 listed companies that produce more than a third of the world’s oil fell in the third quarter of 2016 by 838,000 barrels per day from a year earlier to 33.88 million bpd, data provided by Morgan Stanley showed.
In the second quarter of 2016, the companies reduced production by nearly 930,000 bpd, according to Morgan Stanley.
The firms include national oil champions of China, Russia and Brazil, international producers such as Exxon Mobil and Royal Dutch Shell, as well as U.S. shale oil producers like EOG Resources and Occidental Petroleum.
The drop in oil companies’ output is particularly compelling given the increase in 2015, when third-quarter production rose by some 1.9 million bpd.
“Clearly, we have seen a large swing in the year-on-year trend in production, from strong growth as recent as a year ago, now to steep decline. This is the outcome of the strong cutbacks in investment,” Morgan Stanley equity analyst Martijn Rats said.
Capital expenditure for the companies combined more than halved from $136 billion in the third quarter of 2014 to $58 billion in the same period this year, according to Rats.
Oil executives and the International Energy Agency have warned that a sharp drop in global investment in oil and gas would result in a supply shortage by the end of the decade.
Large oilfields, such as deepwater developments off the coasts of the United States, Brazil, Africa and Southeast Asia, typically take three to five years and billions in investment to develop.
Cost reductions and increased efficiencies have only partly offset the drop in production as a result of the lower investment. Technological advancements have also helped boost onshore U.S shale production.
“These declines should temporarily soften in 2017 as new fields are coming on-stream in Canada, Brazil, the former Soviet Union and U.S. tight oil probably stabilizes,” Rats said.
“Still, unless investment rebounds relatively soon, this steep downward trend is likely to resume in 2018 and beyond.”
We haven’t even begun to see a “steep downward trend” yet. As to “softening” – there is less new production coming on next year, overall and for the IOCs, than this – highlighting Canada, Brazil etc. doesn’t change that.
When is someone in Reuters or Bloomberg going to figure out that 2017 + 3 (or 5) + 1 (for FEED and FID approval at the beginning and ramp up at the end) = 2021 (or 2023) so there is no way to cover drops “at the end of the decade” now. Also when are they going to actually understand that the companies don’t ever “slash” output, like its a choice – depletion does it for them.
And how about this paragraph “Cost reductions and increased efficiencies have only partly offset the drop in production as a result of the lower investment. Technological advancements have also helped boost onshore U.S shale production.” He/she has suddenly started to talk about company finances rather than production, but without actually telling the reading public. Cost reductions caused the drop for heavens sake. “Increased efficiencies” and “technological advancements” – do you think the author has the faintest idea what that actually means and how it is related to anything else he says.
I don’t know when peak decent reporting happened but it’s well into decline now (another big internet age negative).
“When is someone in Reuters or Bloomberg going to figure out that 2017 + 3 (or 5) + 1 (for FEED and FID approval at the beginning and ramp up at the end) = 2021 (or 2023) so there is no way to cover drops “at the end of the decade” now.”
It should be actually 2015 + 3 (or 5), as pre-FID projects have been posponed since end-2014 – early 2015.
Also, the author quotes a report by Morgan Stanley (that we haven’t seen). Apparently, those “109 listed companies that produce more than a third of the world’s oil” are covered by MS equity research team. And changes in their output may not fully reflect trends in overall global oil production.
But I agree that articles in Reuters, Bloomberg and other MSM sources often misinterpret third party research. A recent example are numerous article about USGS assessment of TRR in the Wolfcamp formation
Heh. Peak decent reporting. I don’t know but it definitely peaked some time before I was born in 1976!
interesting i had you pegged to be about 15 years of age based on your understanding of the world. goes to show even I can be wrong sometimes?
If your assumption that I was around 15 was simply based on my arrogance (an understandable assumption since teenagers have a tendency to be arrogant), the arrogance actually comes substantially from successful investing which I started when I was 10 and successful political predictions starting around 15.
If people in the US purchase 1 million EV’s a year, 1 million hybrids per year and ICE’s are moved up to averaging 35 mpg, we will be saving about 3 million bpd of oil within ten years. Also be saving a huge amount of money, other energy and materials.
Just back of the napkin calculations but should be well within the ballpark.
The battery, PV, wind, car industry, electric grid and home grid industries will all experience growth over that decade and well past it as EV’s mostly replace the ICE. Who knows what other industries will benefit.
If we don’t we could end up with $8 gasoline and burning up 3 billion dollars of fuel a day. Fuel would get well beyond the cost of the vehicle. Of course we can’t afford that so the economy would plunge.
There is no reason for an American to conserve oil.
Why should he? So that a Chinese or Indian can burn more? That’s all that happens. China consumption growth 5%/yr. India 7%.
This whole green this and green that narrative is just silly.
253 million gas burning cars on US roads. That is what — 0.79 cars per person. China is only 172 million and .13 cars per person. They are growing that number 10%/yr, and they are essentially ALL gas burning.
Just stop with the silliness. You want conservation? Go babble in Mandarin.
Hi Watcher,
When prices increase people will want to save money.
Not all 253 million are F150s.
Just stop with the silliness. You want conservation? Go babble in Mandarin.
Good point! While you are at it, you might want to check out EV sales growth rates and numbers in China.
https://www.iea.org/publications/freepublications/publication/Global_EV_Outlook_2016.pdf
BTW, the IEA’s numbers are already superceded.
The report was issued in November 2016 and its projections are already superceded?
Yep. It’s been very hard for the IEA to keep up with the monthly numbers in the very fast-moving businesses of wind, solar, batteries, and EVs. They operate on this slow, lugubrious publication schedule which means that by the time they’ve published the report, its numbers are months out of date — and a few months is *huge* in these industries.
There are other factors aside from conservation which may lead to less gasoline consumption in the US:
1. The cost of vehicles. If we hit another recession, auto loans may go down, leading to fewer auto sales.
2. Fewer places to drive. If workers live closer to their jobs and if aging baby booms stay home more, people will be driving less.
“There is no reason for an American to conserve oil.”
The average price of regular gallon of gas 2006 through 2015 has been $3.23 per gallon. That means about 1.2 billion dollars spent per day in the US on gasoline. That is 0.45 trillion dollars per year, just on gasoline. That is nearly a half trillion reasons to reduce oil usage, and that is only a part of the barrel of oil. Burning money unnecessarily got the US and it’s people into huge debt over the years. Is that your recommendation for the future?
How about all the other energy that goes into gasoline and oil production/refining/transport?
How about air, land and water pollution?
How about global warming?
How about the horrors, death and pain that will occur as oil depletes?
Should we fight wars for oil, oil we never get anyway?
Enough reasons?
Actual numbers for China.
Chinese EV sales up 188% over last year, about 1.5% of all car sales (fromEV360.com):
“Chinese consumers bought 34,000 new electric cars in July, a 188 percent jump over the same period last year, according to CleanTechnica, an energy and technology news organization. The monthly total puts China on track to sell 400,000 electrical vehicles in 2016, accounting for 1.5 percent of the total auto sales market — larger than annual EV sales in Europe, or the U.S., Canada, and Mexico combined. By the end of the year, China is projected to have 700,000 electric cars on its streets; the vast majority of EV sales, 96 percent, are for Chinese-made cars, including from manufacturers BYD Auto, Zhidou, and SAIC Motor. Tesla accounts for just 2 percent of EV sales in the country, and Porsche just 1 percent.”
188% yoy growth is not too shabby.
As was pointed out the vast majority of “EVs” have gasoline engines in them. Those BYD cars in particular. Hell, my Lexus with a V6 has a battery in it so why not add it in to get EV numbers up.
152 million gas burning cars. 5% national oil consumption growth. We are going to kill a big chunk of that population soon.
Oh and before the wackos show up saying those gas engines are never used, fuelly tracks gas mileage of various cars with millions of miles of reports. Toyota Prius about 44ish mpg with its 1.8L engine from various recent year cars (how they accumulated millions of miles of samples.)
Toyota Corolla with its 1.8L engine and no battery? 34 mpg.
Oh and before the wackos show up saying those gas engines are never used, fuelly tracks gas mileage of various cars with millions of miles of reports. Toyota Prius about 44ish mpg with its 1.8L engine
That’s absolutely ridiculous! Most people I know in the real world have commutes that are under 40 miles round trip per day. Any hybrid or EV can easily do that without using any gasoline.
As an example a buddy of mine who drives a 2013 Chevy volt and charges it at home and at his shop almost never uses his gas. He averages well over 135 mpg.
EV Misinformation Abounds!
A Battery is not a Tank!
http://www.aprs.org/EV-misinformation.html
You may not personally like EVs, or change but the oil based economy is going away!
“Most people I know in the real world have commutes that are under 40 miles round trip per day. Any hybrid or EV can easily do that without using any gasoline.”
Fred, I love you, but actually no.
The Volt is the only PHEV that can do that.
http://www.plugincars.com/cars
The Cadillac ELR is close at 37 miles electric range, but no cigar.
No other manufacturer aside from GM has a PHEV with greater than 30 miles of all electric range, and most are under 20.
Ok Bob, tks for the reality check. 🙂
Hi Bob,
If someone can charge at work and has a 40 mile commute, then 25 miles of range (Toyota Prius Prime) will enable mostly electric travel. For now you are correct for cars available in the US.
Also the BYD Qin has a 43 mile Electric range
https://en.wikipedia.org/wiki/BYD_Qin
The BYD Tang has 50 miles of electric range, both of these are plugin hybbrids.
68% of US commutes are less than 15 miles.
http://www.statisticbrain.com/commute-statistics/
If your point is that an impressive 25% better mileage can be wrung from a much larger car simply by incorporating a small electric motor and a very small battery, you picked a fine example.
What happens when you add a plug too?
The plug in Prius (with a pitiful 11 miles of EV range) averages over 53 mpg. (Fuelly)
What happens when you add both a plug and enough all electric range to drive the U.S. daily average of 35 miles?
The Chevy Volt gets over 80 mpg. (Fuelly)
And of course full battery electric vehicles all get over 100 mpge. (EPA)
But, nothing to see here. Chevy Bolt sales are still dismal. Why don’t you quote that figure again while you still can. They start arriving at dealerships tomorrow.
A question for you though Watcher. What is the line in the sand that must be crossed for you to take EV’s seriously? (presuming that you actually don’t)
1 million EV’s a year in sales? 2 million? 10 million?
What rate of YOY sales growth?
What percentage of overall sales?
Just curious. Or are they not to be taken seriously until the last internal combustion engine vehicle sputters to a halt? Or perhaps, not even then.
Hi Bob,
It probably will be when the best selling EV outsells the F150 in the US. I figure for the Tesla Model 3 (or its successor) that will be in 2025, or maybe 2030.
If the definition of EV’s includes PHEV’s, The 2030 F150 will be an EV.
Hi Bob,
You may be right. The F150 with no plug or hybrid system might still be available for the purists. When the bestselling “EV” out sells the F150-ICE version in the US, perhaps Watcher will admit oil no longer reigns supreme. On second thought …. probably not 🙂
Take them seriously when there is no retail subsidy of any kind, no gasoline engine in them, and they sell 1/2 the number of total cars sold per year.
We should see the first part of this when Harold Hamm, US Secy of Energy, gets his recommendations in and either they are terminated or allowed to expire.
So then,
A PHEV is not an EV, and EV’s will affect oil markets long before they meet your condition for taking them seriously.
Got it.
At least it’s not never.
As for the subsidies, fine. EV’s will be at price parity before long anyway. But when will ICE’s give up their subsidy of being able to pollute for free?
Let’s truly level that field.
Hi Watcher,
When the Model 3 hits Tesla will quickly use up its allotment of sales subsidies, the phaseout begins after a manufacturer sells 200,000 vehicles with qualifying batteries. Tesla has sold about 93,000 cars so far.
About half of “plug in” cars have no ice.
BEV (Battery electric vehicle) sales will reach half of total car sales by about 2040, the other half will be plugin hybrids with 50 miles or more range on the battery with an ice for the range anxious or those that routinely drive 300 miles or more in areas without chargers. By 2040, 300 miles of battery range will be commonplace for the price of a Lexus today.
Harold Hamm, US Secy of Energy… Fox guarding chicken coop!
Let’s see him end all subsidies for fossil fuels first.
Dennis, 2040? That’s an awfully conservative prediction. For the price of a Lexus you can get 200 miles of range in 2018. 300 miles for that price is not gonna take until 2040!
Hi Nathaneal,
It depends on which Lexus and on supply and demand. Yes 2040 is a conservative estimate, probably 2030 would be better, it was intended to be a conservative estimate.
Currently it is estimated that 215 miles of range will cost about the same as a low end Lexus in 2017, it may be that limits will be reached on how much more battery costs will fall. Also if demand is high, the price of the cars may not fall even though battery costs do fall, so we may not see the price of a 300 mile range car fall below 35k before 2035, difficult to predict, but I doubt it will be before 2030.
Again I would like to be wrong, but am trying to be realistic.
Currently it is estimated that 215 miles of range will cost about the same as a low end Lexus in 2017
OTOH, there’s a pretty good chance of saving $20k in fuel over the life of a Bolt.
Throw in reduced maintenance costs, and you have a very low cost vehicle.
Dennis, you do have a point about supply restriction. If the factories can’t ramp up fast enough, the production cost for a 300-mile-range EV may be way lower than for a Lexus, and the price may remain significantly higher, simply because demand exceeds supply.
I’ve had some difficulty modelling supply restriction. It depends largely on the rate of factory construction. In the western world, Tesla’s the only one constructing factories in significant numbers and I can model *them*, but the factories in China and South Korea are seriously a black box for me, and have a tendency to be done and operating before I find out about them. I probably do need to learn to read Chinese. 🙁
Apples and oranges. The Prius isn’t a plug-in, so Prius drivers use gasoline all the time.
Plug-in drivers tend to use electricity 90% of the time and gas only occasionally.
Hi Nathaneal,
You should put the name of who you are responding to in your comment. I have no idea which comment you are addressing.
Responding to “Watcher”. Sorry!
IEA expects oil investment to fall for third year in 2017
Thu Nov 24, 2016
http://www.reuters.com/article/us-iea-oil-investment-idUSKBN13J08H
Investment in new oil production is likely to fall for a third year in 2017 as a global supply glut persists, stoking volatility in crude markets, the head of the International Energy Agency (IEA) said on Thursday.
“Our analysis shows we are entering a period of greater oil price volatility (partly) as a result of three years in a row of global oil investments in decline: in 2015, 2016 and most likely 2017,” IEA director general Fatih Birol said, speaking at an energy conference in Tokyo.
“This is the first time in the history of oil that investments are declining three years in a row,” he said, adding that this would cause “difficulties” in global oil markets in a few years.
Oil prices have risen to their highest in nearly a month, as expectations grow among traders and investors that OPEC will agree to cut production, but market watchers reckon a deal may pack less punch than Saudi Arabia and its partners want.
The Organization of the Petroleum Exporting Countries meets next week to try to finalize to output curbs.
“Our analysis shows that when prices go to $60, we’ll make a big chunk of U.S. shale oil economical and within the nine months to 12 months of time, we may see a response coming from the shale oil and other high-cost areas,” Birol told Reuters, speaking in an interview on the sidelines of the conference.
“And this may again put downward pressure on the prices.”
Birol said that level would be enough for many U.S. shale companies to restart stalled production, although it would take around nine months for the new supply to reach the market.
The IEA director general said it is still early to speculate what Donald Trump’s presidency in the United States will have on energy policies.
“Having said that, both U.S. shale oil and U.S. shale gas have a very strong economic momentum behind them,” Birol said.
“Shale gas has significant economic competitiveness today, and we think it will be so in the next years to come.”
If people in the US purchase 1 million EV’s a year, 1 million hybrids per year and ICE’s are moved up to averaging 35 mpg, we will be saving about 3 million bpd of oil within ten years. Also be saving a huge amount of money, other energy and materials.
Just back of the napkin calculations but should be well within the ballpark.
The battery, PV, wind, car industry, electric grid and home grid industries will all experience growth over that decade and well past it as EV’s mostly replace the ICE. Who knows what other industries will benefit.
If we don’t we could end up with $8 gasoline and burning up 3 billion dollars of fuel a day. Fuel would get well beyond the cost of the vehicle. Of course we can’t afford that so the economy would plunge.
Hi Gone fishing,
It will probably require $8/gallon (2015$) gasoline before EVs will really take hold in the US, people are motivated by saving money even when they don’t believe science (or have any knowledge of it).
Think back, a shift started when gasoline hit $4 a gallon a few years ago. So I figure the $3.50 t0 $5.50 range will accelerate the push to EV’s and hybrids since they are improving so rapidly.
Hi Gone fishing,
Higher gasoline prices will help and you are correct $4/gallon may be enough for many to jump on the EV train, we may need $8/gallon for the very skeptical people that like to watch.
Sure, when they are paying $300 dollars or more a month for fuel then they might get the idea.
Dennis: thanks. You’ve got me thinking about geographical variation.
The financial incentives to shift to BEVs are becoming overwhelming in Europe, Australia, China, and India, where the gas price is already a lot higher than it is in the US. I suppose they will shift first. (While Russia, Nigeria, and the Middle Eastern oil states, with even cheaper gasoline, will shift even later.)
The question then becomes, what does the oil market look like as the US becomes a laggard in the transition, after conversion is well underway in other parts of the world? Do Americans rush to try to “catch up” (status seeking)? Or do we wallow, backwards-looking, in the oil which is made available by other countries abandoning oil first?
Hi Dennis,
People are motivated by status more than by saving money.
As you know, the F150 is the top seller. Most function as single passenger vehicles carrying no load and doing no towing for the majority of the time. This makes absolutely no sense from a frugality standpoint.
I’d wager that we will hit a social tipping point on EV’s long before we see $8 gasoline.
Status, performance, and convenience will drive EV adoption, not penny pinching. The list of advantages is long.
Also, throw in energy independence. How much is that worth?
Six 330 watt PV panels will produce on average 30+ miles of EV range per day, and do it for 25+ years. Blows my mind really.
Yes, performance has been appealing to EV drivers. They like how quickly and quietly the vehicles respond.
And then as they become the “cool” cars, other people adopt them. Sure, there are people who want trucks, but the muscle car era ended long ago.
The high-end EVs are today’s equivalent of the European sports car.
The first flashy status-symbol BEV pickup will be a big deal. Tesla’s planning one but has it under wraps (and has other stuff on their plate) so probably won’t get to it before 2020, if then; someone else may get to the market before they do.
Hi Bob,
Yes status is important for many and for some saving money may be more important, others want to save the planet, but don’t want to walk or ride a bike everywhere.
You may be right, especially as EVs get close to 30K in the US. The early adopters will get them and there neighbors will see and hear how great they are and they may sell like hotcakes.
Elon sure hopes so, and so do I.
Оpposite view on 2017 global upstream capex from BMI Research:
Oil Firm Spending Seen Up in 2017 for First Time Since 2014
September 23, 2016
https://www.bloomberg.com/news/articles/2016-09-23/oil-firms-seen-spending-more-next-year-for-first-time-since-2014
• Capital spending seen growing 2.5% in 2017 and 7%-14% in 2018
• U.S. independents, Asian giants seen spurring spending growth
The oil industry may be ready to open its wallet after two years of slashing investments.
Companies will spend 2.5 percent more on capital expenditure next year than they did this year, the first yearly growth in such spending since 2014, BMI Research said in a Sept. 22 report. Spending will increase by another 7 percent to 14 percent in 2018. It will remain well below the $724 billion spent in 2014, before the worst oil crash in a generation caused firms to cut back on drilling and exploration to conserve cash, the researcher said.
North American independent producers, Asian state-run oil companies and Russian firms are prepared to boost investments next year, outweighing continued cuts from global oil majors such as Exxon Mobil Corp. and Total SA, BMI said, based on company guidance and its own estimates. Spending will increase to a total of $455 billion next year from $444 billion this year, BMI said.
“North America is where we’re really expecting things to turn around,” Christopher Haines, BMI’s head of oil and gas research, said by telephone. “We’ve seen a push to really reduce costs, reduce spending and take out any waste and inefficiency. These companies have gotten to the point where they’re all set up to react.”
BMI’s outlook is more optimistic than groups like the International Energy Agency, which said last week that the industry might cut spending in 2017 for a third year in a row as companies continue to grapple with weaker finances. Oil prices still hover around $50 a barrel, less than half the level of the summer of 2014.
Hmm. So oil investment will dry up internationally but money will be thrown into holes in North America. OK, I actually believe that.
We will be seeing sharply declining demand in China, India, Australia, and Europe in about two years; meanwhile, increasing supply in the US. The price scenario looks to me to be one which calls for lots of bankruptcies in the US.
From what I am reading, Permian hz wells will be drilled in greater numbers in 2017, regardless of price.
These wells are generally less prolific than those in the Bakken and EFS. However, the money has been raised and therefore it will spent.
To me, a good question is how much money is being diverted away from longer term projects that will ultimately produce more oil, to drill these Permian wells?
The Permain wells have no staying power. Under 50 bopd after 24 months is the rule, not the exception. Under 200,000 cumulative in 60 months is the rule, not the exception.
We shall see.
“To me, a good question is how much money is being diverted away from longer term projects that will ultimately produce more oil, to drill these Permian wells?”
shallow sand
The companies that are postponing longer term projects are not the same companies that are planning to increase drilling in LTO plays.
“The companies that are postponing longer term projects are not the same companies that are planning to increase drilling in LTO plays.”
I assumed he meant investment money. If investors want to be in gas and oil, are they picking the companies with best chance of long-term success (if there is such a thing anymore)?
“I assumed he meant investment money. ”
Yes, but international oil majors and U.S. shale companies generally have different investor base.
Oil majors are viewed as defensive stocks, slowly growing, but with strong balance sheets, paying high dividends and buying back shares.
On the contrary, shale companies are viewed as high risk – high reward stocks, with aggressive growth strategies, highly leveraged.
I meant both.
ExxonMobil, Chevron, ConnocoPhillips, Hess, Marathon and Oxy all have significant LTO production and all are, or were considered international upstream producers.
I agree the supermajors are defensive stocks. But there were many “growth” stock US companies which explored and produced offshore/internationally or both, prior to the LTO boom.
I may be wrong, we shall see.
Most of large US E&Ps and mid-sized integrateds have divested their overseas assets during the years of shale boom.
I’m not sure that Exxon and Chevron are planning to increase their shale exposure in the near term. For Exxon, US upstream operations were hugely loss-making in 2015-16. And it has recently made two relatively large discoveries outside US.
AlexS. Are those XOM international discoveries primarily oil or gas?
Also, for the international assets you refer to which US companies divested, do you know whether the buyers are aggressively developing them? Just a guess, but I suspect maybe not.
11/30 is a big day, hoping for a cut, hard to say if it occurs whether it will be adhered to, other than by maybe the Gulf States.
shallow sand,
Both are oil discoveries:
1) Liza discovery offshore Guyana, with potential recoverable resource of 800 million to 1.4 billion oil-equivalent barrels
http://news.exxonmobil.com/press-release/exxonmobil-says-second-well-offshore-guyana-confirms-significant-oil-discovery
2) Owowo field offshore Nigeria with a potential recoverable resource of between 500 million and 1 billion barrels.
http://news.exxonmobil.com/press-release/exxonmobil-announces-significant-oil-discovery-offshore-nigeria
AlexS. Thank you for the information.
Interesting to note Nexen is a partner in both ventures, while Hess and Chevron are in one each.
I agree XOM has sustained significant losses in North America, but they continue to spend money on new wells. Had they not spent the money they have in North America (both shale and tar sands) would the money have been spent elsewhere. A tough one to know the answer to.
I recall XOM was going to partner in Russia on projects and those were halted for political reasons? Did those projects go ahead without them?
Again announcements of discoveries with no discussion of production cost.
The oil companies got *lazy*. For so many decades, oil had no competition and production costs were very low, so drilling and pumping was a license to print money. They don’t know how to deal with the new competitive environment, where there are alternatives to oil and production costs are high.
shallow sand,
I’m not saying that Exxon stopped investing in U.S. upstream. My point is that oil supermajors, like Exxon, Chevron, BP, Shell and Total are not diverting investments from deep offshore, LNG and other long-term projects to U.S. shale. They cut upstream capex both in U.S. and in overseas projects.
The chart below shows Exxon’s E&P capex in 2007-2015 (in US$bn). There was a sharp increase in US capex (both in absolute in relative terms) following the XTO deal. In 2015, the company cut spending both in the US and abroad
Hi Shallow Sands,
Looking at Enno Peters’ data it looks like about 125K on average at 60 months and about 20 b/d output at 60 months on average for the average TX Permian well from 2011 to 2016.
Dennis. I agree with the Permian proponents that wells are improving.
But still, try to figure a 60 month payout on these assuming $7 million well cost, 25% royalty. Does not compute.
Hi Shallow Sands,
I agree. Also the 125k is cumulative output to 60 months, not great for 7 million.
As always one wonders why these wells are drilled and completed at $45/b, seems payout would be negative for the average well. I don’t understand the oil business like you and Mike, but you and he don’t seem to understand this behavior either. At some point, either oil prices will rise or these companies will fail, if oil prices remain where they are now, they are toast in my view.
Dennis,
as we had discussed earlier, shale companies’ CEOs are paid for volume growth, not financial performance
I do not understand the financial behavior of shale oil development, no. In the Bakken and the Eagle Ford it was indeed about reserve “growth,” as Alex points out. Growth at the expense of profitability. That model failed (look at the debt, debt to asset ratios and losses for operators in those two shale oil plays) because the price of oil collapsed.
Now, in spite of that, the Permian is using the same business model; growth at the expense of profitability. It is borrowing billions in the bottom of a price down cycle (it thinks) believing prices have no where to go but up. I would say this particular shale play might work, except that from the data I see the UR’s on those wells are going to be pitiful at best, far less than the Bakken. Unless it is by the shear number of wells those operators are not going to have a lot of reserves that will appreciate with rising prices. It will therefore fail too, just like the others, perhaps for different reasons, I don’t know. I think oil prices are a long way away from being high enough to save the shale oil industry.
We may be overthinking all this and Alex is right again; it may be a simple matter of everyone taking advantage of a loosey goosey monetary policy in America. Money gets printed, Central Banks give it away, lenders are in desperate need of miniscule yields and CEO’s and upper management borrow it, make millions personally on bonuses and incentives for growing reserves, then walk away from the whole shebang (Sheffield) before the loans come due. America looks the other way because they get cheap gasoline.
http://fuelfix.com/blog/2016/11/22/pioneer-denied-request-to-reclassify-oil-wells/
Happy Thanksgiving Mike! This article is for you! The RRC just refused to allow Pioneer to reclassify oil wells in the Eagle Ford to….. wait for it…….GAS WELLS.
I believe Pioneer just admitted the you, Shallow, Alex, and the others have been right all along about the GOR going up, up and up.
It seems that Pioneer is trying to take advantage of the “high cost gas tax credit” designed to encourage gas production in HIGH COST low permeable tight gas reservoirs.
Interestingly, this move by Pioneer has initiated a discussion about whether there should be a new category for classifying wells. Hmmm sounds like the industry is about to hit the new Texas Legislative session up for some new tax relief to encourage horizontal drilling in its new favorite geological province the Permian Basin. But it will apply to the Barnett, Haynesville, Eagle Ford, and all those other disasters.
Happy Thanksgiving to you too, John ! I had actually seen this before. Scoundrels they are, one and all; Pioneer too, a Texas Company start to finish. The TRRC will roll over in another year or so, watch.
Why is there a tax credit to subsidize high cost gas extraction?!?!
And yet some people complain about tax credits for solar power…
Hi Mike,
Despite the CEOs not worrying about profits, I would think at some point the people buying the bonds or stock of these companies would realize that the Emperor is naked.
Eventually when enough investors get burned, the money will stop flowing. Maybe not in 2016, and perhaps not in 2017, but if oil prices remain low for the long term as experts in the field seem to suggest is a likely event (though nobody really knows future oil prices), the money will dry up. In that case these companies are done.
Hi Alex,
Eventually the piper must be paid, low oil prices (for another 2 years) will be the LTO focused companies undoing in my opinion.
10-4 on both comments, Dennis. Then what? Shale oil is too expensive, it declines far to rapidly and is woefully unprofitable at prices less than 65 dollars a barrel. It cannot exist without low interest money to borrow from outside sources. So when that money is gone, how then does this last valuable hydrocarbon resource get developed? Because we are sure going to need it.
Hi Mike,
I agree, we will need it. When oil prices rise to $95/b and stay there these LTO wells can be drilled profitably, I think. Though land costs will need to fall a bit perhaps, for the Permian Basin, transport costs are pretty low. I would have to run the numbers to check and have not done so for the Permian. There is some price that will make these wells profitable ($50/b is too low, my guess is that $100/b will work). Eventually we will see $100/b oil again, probably in late 2018 or early 2019 and on average oil price will remain $100/b or higher on an annual basis until 2030.
I believe that you think we don’t know future oil prices, no doubt you are right. I am guessing that demand for oil will increase and that supply will be flat or down so oil prices will rise and eventually reach $100/b or more.
The economy is a vector bell-curve in a graphics program:
At the top of the curve, there is a node. The node is selected and pulled to the right– pulled forward.
What happens is that the bell-curve distorts into a ‘Seneca Cliff’ curve.
Increased money– debt/fractional reserve– into the economy makes the economy run hot. A hot-running engine goes through energy/fuel and resources faster.
‘Growth is national security’: There seems a kind of natural, built-in logic that suggests that if you don’t grow (take energy first), the other ones will. Growth will make money (energy credits); more money/energy/power.
So you have a lot of people and machines working harder/hotter than ever going nowhere in competition and pulling resources out of the ground faster and faster.
You can’t rent flats in a ghost city with less and less money left, though…
But you can feed a hot economic engine that creates them…
With a view toward future economic growth and continued and increasing energy supply.
Thank you.
Sundown
“So when that money is gone, how then does this last valuable hydrocarbon resource get developed? Because we are sure going to need it.”
Well, I don’t think we’re going to need it.
My crystal ball is cloudy. But after the demise of oil for ground transportation and the massive wave of bankruptcies in the oil industry, we’ll be left with a residual demand for oil for airplanes. Once the shakeout is done — and the shakeout will take a long time — there should be a “new stable” at that point. I’m not sure what price that will be at. I suspect Saudi Arabia (or whoever succeeds them as government of that area) will still be the primary producer, since they’re still the cheapest-cost extractor of oil from the ground.
It’s hard for me to work out what the oil supply/demand situation looks like after aircraft kerosene becomes the primary use of oil. It’s tricky because of the way refineries work. I can say that 1/3 of oil goes to aircraft fuel, but that’s really due to the fractionation at the refinery.
When gasoline becomes a worthless byproduct, great effort will be taken to maximize refinery production of kerosene, but it’s not clear to what degree this is *possible* — it probably requires inventing new chemical technologies. Initially, large portions of the gasoline and diesel “cuts” can be redirected to kerosene. After that, what to do with the worthless naphtha and gasoline? It’s hard to lengthen chains.
Right now, I suspect they’ll get shortened, converted into methane, ethylene, butane, and propane — and end up pushing down prices in those markets and pushing down natgas prices. But I could be wrong.
Yeesh. Did I read this right? At $40/bbl,125k barrel cumulative output for 60 months only raises $5 million in revenue. At $50/bbl, that’s only $6.25 million in revenue.
If the well costs $7 million, that’s a loss-maker.
Did I really read this right?
Hi Nathaneal,
The newer wells are producing more for the first 12 months, but it is difficult to predict their output down the road. It is possible that the output over the first 60 months of the newer wells might be 145k, the well cost might only be about 6 million, but even so there are operating costs, royalty payments and taxes so wellhead costs need to be about $75/b or more for these wells to be profitable.
This is what Mike and Shallow sand, and Rune Likvern have been saying for quite some time.
I don’t understand why anyone is willing to invest in these companies at current oil price levels.
All the hype about reduced production costs, is just hype from investor presentations that take the best wells in their fields and call them “typical” well profiles.
Go to Enno Peters website for more info, link below.
http://shaleprofile.com/index.php/2016/11/08/permian-update-through-july-2016/
Dennis: based on my experience with Cheseapeake, I would ask two questions:
(1) Are these companies “flipping” the wells? Announcing great results from them and then trying to sell them to some other company (such as a large integrated oil company) ASAP?
(2) Are the execs collecting large take-home cash bonuses which are based on well production levels, or “reserve growth”, or some other metric which can be gamed by this method?
‘Cause it’s obvious that they’re not making money on the drilling. This means the execs are likely to have a different business model for profiting off of these, and these are the two most obvious.
It’s also possible that they’re just delusional. In the oil business, the idea that oil is vital and everyone will need it forever seems to be an endemic delusion and results in unprofitable decisions.
“longer term projects that will ultimately produce more oil”
Which are those? Offshore? Oil sands?
Both of those as well as conventional international.
But I agree, there are fewer of these.
Reminder, continuing to drill. At least some of that is avoiding lease expiration.
I just released a new kind of presentation, which reveals a more in-depth picture of shale oil production in the Bakken, here.
Enno:
The Ultimate Return function is awesome!!
Cannot wait to see this for the EFS and Permian.
Again, a huge thank you for all of your work, presenting the FACTS!
Great to hear that Shallow!
I’ll try to see if I can also publish this version for the other basins, which will require a few additional tricks.
“Shell considering selling its Iraq oil assets: sources”
http://www.reuters.com/article/us-shell-iraq-idUSKBN13N1UK
At one time Majnoon was to be expanded to 1 mmbpd, but not now, I think it is heavily depleted – maybe over 75%. Shell cut a lot of staff there earlier this year. They may follow Statoil who exited West Qurna 2 a few years back and ExxonMobil who left the (seemingly now defunct) centralised water injection project. I guess they are not getting the production they wanted but also no big reserves to book the way the service contracts work.
Thanks George.
Do you think Iraq is pretty close to its peak at this point? It seems they are unlikely to break 5 Mb/d, but I don’t follow this as closely as you (and I am less knowledgeable about the oil industry).
Dennis – I think they may be able to hold a plateau, but who really knows – I doubt anyone in Iraq government for sure. The paper referenced below by John Keller covers things pretty well. I know Lukoil has announced a 150 kbpd expansion on West Qurna 2 (the project Statoil pulled out of) I think due in 2021, and there were original plans for a phase 3 there on a deeper part of the reservoir to give another 650 kbpd – presumably once phase 2 is operating. As the Oxford paper indicates the lack of water injection and produced water handling is a key limit. Eni and BP were planning to develop localised systems for their fields, I don’t know what process has been made. The centralised system seems to be dead in the (lack of) water. Based on Saudi I’d say keeping these old, but supposedly revitalised, fields going at plateau would be an extensive job – i.e. continuous drilling, artificial lift, continuous monitoring and control of the water interface etc. Saudi do all that and just maintain plateau. Iraq aren’t allowing the IOCs to spend enough to do the same so you’d expect a poorer result. I think also that the contract structures being used are guaranteed to engender big corruption problems – the western IOCs will not like to be near that.
… should have been “maintain a plateau for next year” – production from the Gazprom project in the Badra field should be coming on line in that period. After that I guess it depends on investment decisions in the near term which will depend on the oil price.
Thanks George,
I actually didn’t say it, but when I said peak, I was thinking output would not go higher and guess I was thinking plateau without saying it. In any case, your guess of a plateau sounds reasonable, but I surely know less than you (I learned a lot from you comment that I didn’t know about the specific projects). The investment will be difficult with low oil prices, if oil prices eventually rise in 2018 or 2019, they may be able to invest enough to maintain a plateau, but I doubt we will see more than 5 Mb/d and they might not even reach that level.
I don’t know if cause and effect of rising oil prices is going to be really clear cut and predicable. Food prices are starting to rise, especially rapidly for sugar and dairy, based on supply falls (I think mostly related to drought, at least for sugar). So far cereal seems OK, but if this goes on or even deteriorates and a fuel based spike is added on top then things would be worse than 2011 (i.e. Arab spring #2 – but maybe more extensive problems through Asia, Africa and Latin America as well). That won’t produce an environment that allows easy investment where it is needed I think.
See:
http://www.fao.org/worldfoodsituation/foodpricesindex/en/
Weird. I thought there was a global milk glut in 2016:
http://www.agweb.com/article/world-glut-of-milk-being-felt-in-canada-ireland-new-zealand-naa-jim-dickrell/
http://time.com/4530659/farmers-dump-milk-glut-surplus/
Hi George,
There can be many complex interactions between markets (food and petroleum) so nothing is ever clear cut.
Always implicit in my simplified analyses is a ceteris paribus assumption on everything not made explicit.
In the Real World ceteris paribus is not a good assumption of course, but any analysis where everything is varied is beyond my ability. 🙂
Just read this. I think it is a decent overview of the challenges for Iraq. To me, they desperately need an agreement tomorrow.
https://www.oxfordenergy.org/wpcms/wp-content/uploads/2016/10/Can-Iraqi-oil-production-surprise-again-on-the-upside.pdf
Thanks John,
Great read. Summary, not much growth in Iraqi output likely in 2017, possibly slow decline, depending on investment levels.
Interesting that possibly no cut again due to KSA being upset that Iraq and Iran will not cooperate.
Have either ever cooperated on a cut? I assume all along they surely knew those cutting besides them would be the Gulf States, with Algeria and Angola possibly contributing small amounts. Nigeria, Libya and Venezuela can’t. Ecuador is too small to matter, as are new members Indonesia and Gabon.
As for Russia, they have never cooperated in a cut either? Russia seems satisfied with $40 oil anyway.
Looks like KSA makes more $$ producing 9.5 million v 10.5 million BOPD. Unfortunately for them, it is one or the other.
Nobody will make more $, it’s just a political power game.
Best thing is, the deal fails and everyone of them, including russia, will try to bring all their reserve fields online to get a few $, that they won’t get. Game theory pure, only loosing is possible.
Irak without the IS can be developed to 10 mbd, Iran can get 5-6 and SA 15, when they bring online everything.
Oilprice will crash sub 20, SA, Nigeria, Ven and a few others will get broke sooner or later, deep sea oil+oil sands will collapse, fracking will continue (enough wall street muppets to milk out there) – that’s the mixture for 200 $ oil in a few years then.
I think it’s the dynamic/relationship between KSA and Iran that matters. My impression is that KSA originally thought that Iran would lose more than them if the oil price was low. Now it is the other way around. Iran has a more diversified economy and after lifting the sanctions they are doing alright compared to KSA.
If there is no deal and FED hikes the rate then US shale producers with high levels of debt will find themselves between a rock and a hard place.
SS – You almost were killed by low oil prices with the physical product. I am in a similar situation with respect to oil stock investments. But, I see a much better longer term benefit with no OPEC agreement. I think that demand will outrun supply at these prices [demand will not even have to go up – just constant usage at current levels], so I see a significant price increase in any event.
If OPEC agreed to even just a freeze and then prices go up, the mainstream media narrative will always be that the oil producers are cheating the public because of OPEC manipulation.
Russia already has enough bad press, so they do not need more. So if I were in their shoes, I would just keep production where it is and wait it out. No sense in them looking like the bad guys with respect to oil. They have other issues.
If I am wrong, then I will be sorry for you – and me too.
Demand will actually go down starting in about 2 years, I’d say.
The question is whether supply drops will outrun demand drops. They might. Some of these fields deplete really fast.
Hi Nathaneal,
I doubt that demand for oil will decrease in 2 years time, your expectation for the speed that a transition to EVs will occur is not realistic. Yes a lot of EVs have been sold in China, but the total cars registered have grown from 59 to 172 million in just 7 years, an average growth rate of about 16.5% per year.
Eventually this might level off, but consider that in the US there are about 0.8 cars per capita and assume China gets to 50% of the US level at 0.4 cars per capita, that’s 400 million passenger vehicles. The increased demand from developing nations will offset less demand from a transition to EVs and plugins.
I agree that eventually demand will decrease, but it will be forced initially by a lack of supply and higher prices which will reduce miles travelled, increase the use of public transportation and ride sharing and eventually speed the transition to EVs. I expect demand will decrease due to falling supply in 2020 to 2025 and by 2035-2050 demand might start falling faster than supply due to the scale of EV production cutting into demand for oil and oil prices may start to fall at that point.
Dennis: China is aggressively rationing (!!!) gasoline car registrations, while EV registrations are unlimited. In major cities you have a *lottery* to register a gasoline car, and it can take 3 to 4 years of trying before you get a registration.
This will cause a shift to EVs which is faster than anything we could possibly see in the US. I mean, just think about how people react to THAT incentive.
On top of this, the Chinese government incentive to buy an EV is reported to be equivalent to about $13,000 per car — larger than any incentive in the US.
AND Chinese gasoline prices are equivalent to $2.49/gallon as of October. And the China average electricity price is only 8 cents / kwh, according to the only sources I’ve found. (Obviously there’s regional variation.)
This is a pretty overwhelming set of incentives for consumers, way beyond anything we can imagine in the US. Really I do believe China is the driver of the trends here.
India could be a driver of increased gasoline-car sales; they don’t have the sort of extreme policies China has; but they’ve been making a lot of noise about electrification too, largely for the same reasons (local smog).
clueless.
As you know, oil prices and the stock market are much more about perception than reality.
OPEC announces a cut today, to occur a month from now, no way to know if it will hold, will be complied with, whether non-OPEC countries will fill the void.
Yet I see the following examples:
MRO up 20.80%
CLR up 22.88%
WLL up 30.28%
SM up 24.91%
OAS up 27.73%
DNR up 33.57%
CRC up 44.40%
Buy the rumor, sell the fact.
I just know 2008-2009 crash ended when OPEC cut, same with 1998-1999 crash, same with 1986 crash (although the price then crashed again in 1988 due to widespread cheating and a huge supply/demand imbalance).
Fundamentals? Who needs them? I think we are seeing an example of that playing out in the Permian land boom, where $40-60K per acre is not uncommon.
The stock market is a semi-casino where all of our retirement is invested.
shallow sand, You’re quite right about the stock market and its disconnection from fundamentals in the near term.
ss newfield has a interesting graphic on their 3rd presentation showing the gravity of “oil” across the stack scoop plays. It seems a lot of people were really challenged in reading maps.
TT. You are not the same person as Carl Martin on SA are you?
Hi guys, what do you make of this:
There are a few more responses now. Examples:
Hi Caelan,
Perhaps I should have said if oil prices reach $95/b.
Mike and Shallow sand are very familiar with the oil industry. At one point Mike inplied that the LTO companies are likely to fail with low oil prices long term (say oil prices below $50/b until 2030).
Rune Likvern has done a very good job of showing why the Hill’s Group analysis does not make much sense.
Basic economics suggests low prices will result in the World being short on oil, a basic shortcoming of Hill’s analysis is that the price of oil is not determined by its net energy and the assumption the price of a good and its net energy are related is not a good one.
Another poor assumption by Hill is the assumption that a shortage of oil will not result in an increase in oil prices. We will just have to wait and see what happens when we actually do see a drop in oil supply.
So far the supply of oil has been more resilient than I had guessed.
If you remember, there were many who questioned my thesis of oil supply dropping relatively slowly, it turns out the oil supply has dropped less quickly than I expected.
I have been wrong on price because supply has not dropped as much as I expected.
If supply never drops and demand never increases (both not likely), we might remain at this oil price level long term, I doubt this will be the case.
Pscyhology is the key wild card here. It became uneconomic to drill new wells, but *psychology of oilmen* meant they kept drilling, which kept supply up and prices down. Eventually economics will trump psychology here, but who knows how long that will take.
Since there’s a delay between investment decisions and oil production, when the drilling-crazy guys finally go bankrupt and give up, it’ll be another couple of years before the supply contracts.
Meanwhile, I’m watching the demand side. I think there are good odds of *one more* big oil price runup and peak (up to $80 or $100 or something). It might not happen, but the timing is such that I think there probably will be one more. However, that peak will be the last. It will accelerate the already-very-fast-moving transition to electric vehicles, and destroy demand permanently and very quickly. If investors make the mistake of drilling for more oil at that peak, two years later they’ll find themselves with the oil price back down at $50 and production costs well above that. That’ll pretty much do in the entire industry, with the exception of those sitting on old wells which still have easy-to-pump oil (i.e. the Saudis and nobody else).
This is close to my analysis. Rystad Energy predicts supply will decline slightly out to 2020 http://www.bloomberg.com/news/articles/2016-03-22/drillers-can-t-replace-lost-output-as-100-oil-inheritance-spent. I do not expect prices to rise much for the reasons you mention. After that I expect NOPEC production to decrease faster, on the order of 4% per year. A price spike will cause a recession lowering the price. Investors in oil may be very disappointed.
Hi Schinzy,
At some point supply decreases and oil prices may rise, hard to know to what level as it takes time to bring new supply online and the lags create some volatility, so perhaps we will hit $100 or even $120/b due to lags in output, possibly this will cause a recession though from 2012 to 2014 we had pretty high oil prices without a Worldwide recession.
Eventually Nathaneal’s analysis of decreasing demand might drive oil prices lower, but it will be a race between declining supply and declining demand, I doubt we will see 4% supply decline in the near term, maybe by 2030 to 2050 when EVs have reached larger scale. Hard to know how fast the ramp up will be, but anything more than 20%/year annual sales growth long term (after 2020) is not realistic in my view.
Autonomous vehicles may change demand for cars, so possibly things might move faster than I envision. I don’t expect AVs to be approved before 2025 and become mainstream about 10 years later.
This could reduce the car fleet substantially and may allow the transition to EVs to be very quick once that occurs.
A difficult model, with more than the usual guesses.
Dennis: That race between declining supply and declining demand is very hard to figure out.
The oil companies are sufficiently secretive and dishonest about their decline curves that I’ve ended up with declining-supply estimates ranging from 1% to 16% per year depending on different assumptions — which is a less-than-useful range of estimates, obviously! 🙂
I’m on more solid ground on the demand side, but the declines are largely driven by the rate of electric vehicle adoption in China, which unfortunately also has a lot of ambiguity and lack of information. The rates are huge. But as a result, the difference between a 188% growth rate and a 200% growth rate compounds to be a massive difference over only a few years, and shifts the rate of decline in oil demand substantially.
Some of the folks over at Peak Oil News seem a little bugged by what they consider the ‘techtopians’ over here.
Myself, I’ve previously inquired hereon where we’re all supposed to be going in our new EV’s if the economy has much less energy in it and less growth or at least FF or oil-powered growth, such as to support roadway infrastructures.
We’ll drive them over dirt roads and gravel from farm to farm. 😛 Which we already have where I live.
Hi Dennis,
Back later (There are some new posts at Peak Oil News, BTW.), but one thing occurred to me:
Rune previously mentioned I think something like ~35% global for oil use, but oil is the most ‘mobile’, ‘structural’ or ‘master resource’. So ~35% would seem to be a little misleading when it might support much of the other ~65%.
I mean, take that ~35% away and how might it affect the remaining ~65%?
It’s a ‘disproportionate’ ~35%. The wheels on my bike are only ~35% of my bike, but remove them and what happens?
Hi Caelan,
Why would it be “removed”? It is energy that might be considered the master resource. Oil can be replaced with EVs, electrified railroads, light rail, electric buses. It will be removed when demand diminished because the ice has been largely replaced for personal transportation.
Also note that a great deal of energy is used in the Petroleum Production system for producing, transporting, refining and distributing petroleum and the products made from it. Then in an internal combustion engine (ice) only about 35% of the energy is converted into work moving the vehicle with 65% lost as heat. EVs, wind and solar convert energy to exergy far more efficiently so that less total energy is needed.
In fact it is exergy rather than energy that is the true “master resource”, if you go in for the master slave relationship.
I do not believe there is a “master” resource. Just as you could say the wheel on the bike is most important, or the chain, or the frame, or the air in the tires, the handle bars, you get the idea. It is all important, earth, air, water, and fire.
Hi Dennis,
My point was that the ~35% doesn’t seem like much of a contribution to the current global energy input mix joule-for-joule until where and how the oil is used is considered.
I don’t doubt that attempts that you mention are being made and will be made as depletion relentlessly digs in, but they are fraught with seen and foreseen problems aplenty. And those making those attempts don’t inspire much confidence either
Oil Extraction and Price Dynamics (repost)
Hi Caelan,
Techguy’s guess of $80/b might be right, it depends on supply and demand. The World economy grew for 3 years from 2011 to 2014 with oil prices above $80/b over that period so I doubt that $80/b will be the limit unless there is more easily produced oil than I have estimated. I think the limit will be $120/b due to demand being higher than supply at $80/b after 2020.
On Shinzy’s analysis, I think that the balance of supply and demand will result in higher prices than his model predicts and I question whether his model is correct, of course lower prices reduce supply and higher prices reduce demand, that is axiomatic. What matters is how fast supply falls and the price necessary to make demand fall at the same rate so that supply and demand match.
This is a complex dynamic that is impossible to predict and everything is a guess as to how it may play out.
Many possibilities, high supply would imply lower prices. Also an easy substitution of EVs for ICEV would tend towards lower oil prices. I think both of those are unlikely. On the pessimistic side high prices could lead to a World recession which would reduce oil demand and reduce prices, I think this doesn’t occur until $120/b, I doubt $80/b would cause problems based on the 2011 to 2014 experience. There could be a financial crisis for other reasons, that is beyond my ability to predict, but seems less certain to me than many others believe.
Fair enough, Dennis, and I’m inclined to agree somewhat. Thanks for the insights.
I have been keeping track of the wormhole opened up between POB and PON and will continue to do so until which time as the threads of the fabric of the space-time continuum becoming increasingly unstable and collapse it. In which case, you’re on your own until another one opens up.
* Yes.
You never answered this by the way, not that you had to of course.
I think it may be as simple as diminishing quality and the increasing energy required to get it. Oil is not a normal commodity, however, poorer-quality things are often the cheapest.
Rystad Energy’s recent estimates of U.S. shale breakeven oil prices
From an article in Reuters
http://www.reuters.com/article/us-opec-meeting-usa-shale-idUSKBN13P0C8
“In shale fields from Texas to North Dakota, production costs have roughly halved since 2014, when Saudi Arabia signaled an output free-for-all in an attempt to drive higher-cost shale producers out of the market.
Rather than killing the U.S. shale industry, the ensuing two-year price war made shale a stronger rival, even in the current low-price environment.
In Dunn County, North Dakota, there are around 2,000 square miles where the cost to produce Bakken shale is $15 a barrel and falling, according to Lynn Helms, head of the state’s Department of Mineral Resources.
“The success in Dunn County has been fantastic,” said Ron Ness, president of the North Dakota Petroleum Council.
Dunn County’s cost is about the same as Iran’s, and a little higher than Iraq’s. Dunn County produces about 200,000 barrels of oil a day, about a fifth of daily production in the state.
It is North Dakota’s sweet spot because it boasts the lowest costs in the state, yet improved technology and drilling techniques have boosted efficiency for the whole state and the entire U.S. oil industry.
The breakeven cost per barrel, on average, to produce Bakken shale at the wellhead has fallen to $29.44 in 2016 from $59.03 in 2014, according to consultancy Rystad Energy. It added that in terms of wellhead prices, Bakken is the most competitive of major U.S. shale plays.
Wood Mackenzie said technology advances should further reduce breakeven points.
Landlocked Bakken producers still need a substantially higher international price than their breakeven cost to make a profit, since they pay more to transport crude to market than producers in most other U.S. regions.
International oil prices of $45 a barrel are enough for some Bakken producers to profit, Ness said, and $55 would encourage production growth.”
Wellhead breakeven oil prices: Bakken, Eagle Ford
Source: Rystad Energy, NASWellCube
What is included in the breakeven costs? Does that include royalty payments, taxes, maintenance, interest payments on loans, etc?
Theoretically, breakeven oil prices should include all capital cost + all operating costs + rate of return at 10-15%.
This includes royalty payments, taxes, maintenance, interest payments, etc.
But I am not sure that estimates by Rystad and others really include all those cost items
It depends – there are different sorts of break even: accounting breakeven (I think this is operating costs with accounting allowances like depreciation but not for certain – it’s used sometimes in financial statements), operating cost or full cycle (of which there are various subdivisions as well). The biggest number would be full cycle including finding and development (including decommissioning allowance), cost of capital, HQ and admin., production costs (including taxes and royalties). The lowest would be cash cost with only production costs plus admin (i.e. the minimum needed to keep company running without losses on one particular day). Even in full cycle costs its possible to choose only a subset of wells (currently operating and for future F&D) and come up with different numbers. The Rystad report might have all the details; Reuters not so much but I can’t see those numbers are total full cycle cost.
Having done a bit of investigation I think the most likely break even they quote is “accounting” as this would be the one where they could get the data. That is defined as Production costs (including Taxes) + Transportation costs + Exploration Expense + Depreciation, Depletion & Amortization. So the drilling costs I think get included in the DD&A rather than being directly counted. I am no accountant though.
For 15$ an 6 million dollar well (I think that’s cheap for drilling and fracking) has to produce about 400k barrels of oil. That’s without interesst, office costs, land lease, taxes.
And I haven’t seen many 400k wells in Ennos bakken graphic, so where does these numbers come from, or are they without fracking costs, too?
I strongly suspect inflated out-year production estimates. That was Cheseapeake’s technique for defrauding the integrated oil companies; taking first-year production and letting the integrated oil companies make unduly optimistic extrapolations for the decline curve.
OPEC cuts. Now it will be very interesting to see:
1) new oil price
2) how many more oil rigs will enter in US (eg. per month)
3) if US oil production actually will increase. My jugdement is no, too much downwards momemtum / depletion. Many oil analysts will say the opposite. Interesting times!
It’ll be interesting to see November Saudi production, but what if they knew they were going to decline anyway? Last year from June they had consecutive declines equivalent to about 5.6% y-o-y until they bought on a couple of NGL trains, after which production levelled off, and then Al-Shaybah new production train with nameplate 250 kbpd, although production went up a bit more than this. The last two months they seemed ready to go back to the steady decline. They don’t have anything else on the go until Khurais expansion due in spring 2018 and continued investment in new wellhead platforms to maintain Al Shaheen plateau. Earlier this year they also started up a big gas fired power station, and are continuing tight gas development for local power use, so may have oil freed up to maintain exports anyway, even with an overall production cut.
Interesting that despite the lowest breakeven oil prices, oil production in the Bakken continues to decline, and oil rig count is recovering much more slowly than in the Permian, where breakevens are about $10 higher (in the case of Midland).
Can it be explained by a $10-12 price differential between bakken wellhead oil price and WTI or there are other explanations?
Wellhead breakeven oil prices: Permian
Source: Rystad Energy, NASWellCube
Even in the Dunn county, “where the cost to produce Bakken shale is $15 a barrel and falling, according to Lynn Helms”, oil production declined 21% from September 2015 (peak) to September 2016
Oil production in the Dunn county, North Dakota Bakken (kb/d)
source: NDIC
The number of active oil rigs drilling for oil in the Dunn county has recovered from this year’s lows, but is still only about one third of November 2014 peak levels.
Why they are not drilling more if breakeven price is only $15
Active oil drilling rigs in the Dunn county, ND
AlexS.
I think you know that these numbers that are thrown around in the US are meaningless.
The numbers that matter are in company 10K and 10Q, which are filed with the SEC, and those on joint interest billing statements, if one can get his hands on them.
If you have not, check out Enno Peters’ most recent post on the Bakken, linked above. The Ultimate Return function is most telling IMO.
This is the way I look at these wells to get a sense of where they are going. When I see an LTO well drop below 50 bopd, I realize this well, absent possibly a multi-million dollar re-frac, will never produce over 18K BO in a year again. Now realize, in the Spraberry trend, dropping below 25 bopd, or 9K BO annually is the marker, and in EFS, below 30 bopd or 11K BO is the marker (marker = when the well’s production finally stabilizes and begins to decline slowly).
I think in 5 more years we will see this come full circle in these three LTO plays. Vast majority in Bakken at 50 or below, EFS 30 or below and Permian at 25 or below.
No way these wells can work at $15 per barrel.
250,000 BO in 60 months x .80 =200,000 BO to working interest owners.
200,000 x $15 = $3,000,000.
Then subtract LOE, G & A, severance and extraction taxes (10%).
At $15, a 250K BO well in 60 months loses money on an operating basis. NONE of the cost of drilling, completing, equipping, etc. is returned to the operator.
Thank you, Shallow; you took the words plum out of my mouth. I think “take home pay” in the Bakken is more like $11.00 dollars a barrel and if, and I repeat if well costs have declined to $7M ($5M in the Bakken with 3 strings of pipe and 10K ft. laterals is another deception), most Bakken wells have to produce of 600K BO, not BOE just to payout.
Breakeven prices is a meaningless metric. The point in the exercise should be sufficient return on investment to manage new debt, and retire legacy debt. That “breakeven price” (ug!) is more like $85-95 dollars.
Hi Mike,
Breakeven price includes a 10% ROI. If that’s not high enough you could make the ROI anything you want, maybe a 15% ROI for the well to payout in 36 months.
You seem to assume breakeven means ROI is zero.
Nobody does it that way.
I agree the ND Bakken/TF needs about $85/bo at the refinery gate for the average well to be profitable (10% ROI).
Probably about $90/bo at the refinery gate for 15% ROI and about $78/bo at the wellhead ($12/b to move the oil to the refinery) for the average well to be profitable.
I have assumed the average well costs $8 million to drill and frack and the sunk costs have been ignored (a simplified point forward analysis). When all the stuff I don’t know about is added the well cost might be $9 million and “breakeven” prices rise.
I fully agree, other than maybe making monthly costs early on in the well, the low prices don’t work. The closer t0 $90 bo the more new wells will become profitable in the long run, not just for the month or the day. Prices under $60 bo are chancy in fracking plays.
Dennis, who says the “breakeven price” includes 10% ROI, where do you get that is acceptable accounting standards; from the shale oil industry?
As I said, “breakeven prices” are meaningless to me, as is other shaleisms like IRR and ROI. I use ROI religiously but ROI to me does not commence until all my investment is returned (payout occurs) and that ROI, depending on risk, needs to be at least 250%, better 300% over 20 years. I stay out of the bank that way. I am not sure even what ROI means to the shale oil industry and I don’t care. Whatever it is, it ain’t near enough.
I gave what I believe is a reasonable example of how many barrels of oil is required at current prices, held constant, to pay out a $7M dollar well. I said “if” the example well costs $7M. How many wells in the US, from any shale oil play, do you think will produce 600K BO, not BOE? Try <3%. Therefore 97% of wells being drilled at the moment, at these prices, held constant, in any shale play, will not even reach payout, in my opinion. Hoping for higher oil prices is no plan. So I have no idea what you mean by 36 month payouts.
Nor do I know what you mean by "profitable." Profitable enough for the shale oil industry to be able to work off net cash flow? Profitable enough for the shale oil industry to deleverage legacy debt?
Read Shallow's post again. That's a stripper well operator's view on the subject and if you want to know if an oil well, a couple of oil wells, or a whole covey of oil wells is going to make money or not, ask a stripper well operator. He/she will know down to the penny.
It is a mistake to take for granted anything the shale oil industry says about itself, or what it spoon feeds analysts like Rystad. I would have hoped by now folks would be savvy to that.
Hi Mike,
Profitable means that when the well is shut in you are in the black, this would be from an opportunity cost perspective.
So let’s say one has one million dollars to invest and one chooses to use it as an oil man.
A well is drilled, completed and operated for 20 years then shut in. We will assume an average rate of inflation of 3% per year over those 20 years and that a large stock mutual fund earned 11.25%/year with a real return of 8.25% per year (Vanguard’s Windsor fund has earned 11.25%/year on average since 1958). A simple investment of one million in a mutual fund would earn $3.88 million over those 20 years in constant(real) dollars. This would be a 388% ROI over 20 years. A more realistic stock mutual fund return would be 8%/year which would only be $1.65 million over 20 years.
An investment in an oil well would only be in the black if the net revenue over 20 years was more than $1.65 million, if one made exactly $1.65 million you would have broken even relative to the alternative mutual fund investment at 9% per year average return and 3% average inflation (real annual rate of return of 6%).
Using a discounted cash flow analysis does a better job because it accounts for whether you get the revenue sooner or later.
In the example above the “real” return is $1.65 million (6%/year over 20 years) and if we discount the annual cash flow at a 6%/year real discount rate the present value of that future cash flow is only $928k.
To do an accurate comparison you need to look at the present value of future net revenue streams, your 300% ROI would roughly correspond to a 7.3% real annual rate of return if it is a nominal rate (not adjusted for inflation) or 10.3%/year if your suggested 300% ROI is a “real” rate of return in constant dollars (inflation adjusted dollars).
I agree the wells don’t typically produce 600 kb, I use about 320 kbo for the average Bakken well, about 230 kbo for the average Eagle Ford well and about 155 kbo for the average Permian basin well.
Current oil prices are not high enough for profitable wells (wells that pay out and then provide a reasonable ROI. For the average Permian well the net present value of future cash flow using an 8% annual real discount rate is equal to the well cost of $6.2 million at a wellhead price of $79/barrel. Assuming $10/bo LOE, 20% royalty and 10% taxes. ROI in real dollars is 121% over 12.5 years, the well is shut in at 7 b/d at 150 months. Raising well cost to $7.2 million to include all costs (land, exploration, well shut in, etc) would raise “breakeven price” to $89.70/bo.
Well head price needs to be $105/b for payout in 36 months and $92/b for payout in 60 months assuming well cost of $7.2 million.
I got all that, Dennis; I am starting No. 238 next week, all with my own mullah. Thanks. I agree with you downhole, by the way; lying, bankruptcy, insulting people and running stop signs have now become admirable attributes for all Americans.
Hi Mike,
Congrats.
let’s see if I understand this. I believe it was you who said OPEC would not reach an agreement and warned all to stay away from LTO stocks.
in the plays I am familiar with the 3 biggest players are:
MRO stock has gone from under $7 to 0ver $18
CLR stock has gone from $17.5 to 0ver $58
NFX under $22 to over $46.
maybe 4 generations in the oil patch is to much if it leads to those types of conclusion. you are to this board to what Gomer Pyle was to the Mayberry gas station. ? just for the record I told this board OPEC would agree to a deal and to hold your noses and buy energy stocks. History repeats and the play book is well known to those who know what the hell they are talking about.
Nat gas still looking good. A lot of cold air pooling to enter lower 48. It will be interesting to watch how much nat gas will be burned when we get a visit from the “polar vortex”. We have not seen a nation wide outbreak of cold in over 2 years and a lot of coal plants have gone off line.
it’s good to be the king?
Which one of us are you attempting to insult?
All of us.
I mistakenly said once I was 3rd generation oilman and that has given the King reason to mock my heritage. The rest of you gentlemen are in his good graces, I’m certain.
Gomer
Hi Mike,
Some people should be ignored imo.
shallow sand, Mike
I completely agree with you.
Per barrel costs at corporate levels, as in 10K and 10Q reports, are much higher than breakeven cost estimates we are seing in company presentations or in reports by research and consulting firms like Rystad.
And actual average well performance is much worth.
“Why they are not drilling more if breakeven price is only $15”
Alex,
This $15 breakeven price meme is just part of the fake news analysis. Oil price needs to be $100 for shale development in order to appear that it makes sense in this supposed “free market” economy. Since oil price crashed from over $100 due to political and not economic reasons it is necessary to resort to narrative of “lower cost”, “leaner and meaner shale”, “investors waiting on the sidelines” and other fake analysis that we have heard.
Price will go up when there is some political agreement between 3 countries US, Russia, SA. This deal today in Vienna will not do it. It is just internal deal, although very important, just within the OPEC and only for 6 months. Therefore, by the second half of 2017, the situation could once again spiral out of control. But it is very possible that in 2017 in order to stop oil price volatility, some measure to be adopted at the highest political level between US and Russia, once new administration gets settled in. And that will affect the decisions of other oil producers given their massive influence.
Hi Alex S
What is the vertical scale on those Permian charts?
Same as previous chart? $100/boe for top line with 20,40,60,80 between?
Keep in mind transport costs are much lower for the Permian which is why their well head prices are much higher than for Bakken oil.
Dennis
I could not post the original chart, which comprises 5 shale plays, as it’s two big.
If you can, please do it
(see the link above)
Sometimes jpg is smaller than gif, or it was in this case when I used MS Word to do a screen clip.
After that I used MS-Paint to resize to under 50 kb.
Just in case you don’t already know more than me about posting charts (as you clearly do about the oil industry).
Hi Alex S,
Ok Got it.
From http://www.reuters.com/article/us-opec-meeting-usa-shale-idUSKBN13P0C8
Thanks Dennis,
I am also using MS Paint. In this case gif was even bigger than jpeg.
Resizing to 40% of the original size indeed helps
Hi AlexS,
In this case the gif was 80kB and the jpg was only 53 kB, so I used the jpg and scaled it down using paint. You seem to know at least as much as me about posting the charts, Fred M. knows way more than me about graphics.
It is interesting to compare breakeven oil price estimates from different sources.
See, for example, estimate by BTUAnalytics (for 2016).
Bakken: BTU $50 vs. $35 estimated by Rystad
Eagle Ford: $40 in both BTU and Rystad estimates
Permian Midland: BTU $55 vs. $40 Rystad.
Furthermore, as the article in BTUAnalytics points out, the decline in shale production and capital costs in 2015-16 was largely due to declines in drilling and oil services rates. Current margins in oil services sector are unsustainable and service providers will inevitably increase their rates in line with the rise in oil prices and drilling/completion activity.
BTU Analytics estimates LTO breakeven prices with various scenarios of increased services rates.
source: WILL RISING SERVICE COSTS DESTROY PRODUCER GAINS?
October 25th, 2016 | Jason Slingsby
https://btuanalytics.com/will-rising-service-costs-destroy-producer-gains/
Guys, come on.
You have been pointing out shale oil flow is happening at a monetary loss for months/years. Laying out the numbers doesn’t change anything about that.
And the oil continues to flow.
Intellectually, at some point you will have to face the music and answer the questioin why. Why is oil flowing at a loss? Does money matter for oil flow?
Why can’t I edit that?
I can edit this, and it’s only been a few mins.
It’s easy.
When everywhere is printed, Bakken oil has a break even of 15$, there will be enough private investors buying oil fonds to make a dollar for their pension savings.
And the CEO and CIO and the fond manager can be paid, and the train rolls on. Oil don’t has to make money, it has only to promise to make much money. So the piper is paid, as long enough uninformed people with money are born.
Yes, its private enterprise that is extracting shale oil in America, not a nationalized oil company being funded by the government. If your theory is correct about the enormous costs of shale oil development not being of importance, the American public simply needs the oil, how much longer is the American public going to tolerate the likes of Sandridge, or Magnum Hunter, or Halcon jefe’s walking the check on billions of dollars of debt, pocketing tens of millions of dollars personally, then starting all over again with more “private equity?”
Hi Mike,
Hey maybe those guys want to run for president, bankruptcy is a selling point. 🙂
They “know the system”, so of course they can “fix” it so they can make plenty more money in the future.
Hi Watcher,
The oil will continue to flow, until it doesn’t.
When prices were higher output was increasing in the US L48, this is no longer the case.
I had once argued that decline might be gradual, but it has been more gradual than I guessed.
Higher oil prices will help the LTO companies, but they may overproduce and shoot themselves in the foot. Oil at about $75/b is needed for even the best areas to be profitable.
Oil is flowing at a loss, because debt sucks energy from other areas of the economy, and gives it to tight oil companies. That’s why the glut isn’t dissapiring. But who needs oil that isn’t needed by the economy? It would be better if it stayed in the ground.
First, the part I tried to edit was the phrase oil flowing, as opposed to wells being drilled.
Oil flows from already drilled wells.
The problem is wells are being drilled at a loss. Okay, X number of them are drilled to hold the lease, and we really do need that number X known, but one would think that’s not the substantial explanation.
These things are being drilled with no chance of profit. The lenders are suspending covenants and looking for any possible way not to foreclose — and there is that powerful and ominous ZH article outlining Dallas Fed instructions to avoid foreclosure at all . . . pardon the expression . . . costs.
I would suggest this is part of the post 2008 global facade. Money has lost its meaning and an ongoing effort is underway by the various industries whose lives depend on the pretense . . . to present an array of behaviors ostensibly normal. Everything is normal. If it isn’t, pretend it is. Money is a man created concept and there’s no reason you can’t pretend it is anything you want.
Note, again, Argentina is producing oil at a price they decreed, because why not? That may be a LOT easier than contorting all the lending presentations and cost definitions. They have the superior solution. Just decree the price.
Article in BTU Analytics comparing actual performance of shale wells with what companies show in their presentations:
BUYER BEWARE: E&P INVESTORS SHOULD VERIFY COMPANY CLAIMS
September 21st, 2016 | Kathryn Downey Miller
https://btuanalytics.com/ep-investors-verify-company-claims/
As E&P investors search for their next investment, they should be wary of company presentations touting the company’s latest and normalized results. During the training of new industry analysts, there comes a time when each presents a piece of analysis based on data sourced exclusively from an E&P investor presentation. When asked if the analyst verified the initial production rates or cross checked assumptions against others developing similar assets, the analyst looks dumbfounded. “But this is what the company presentation showed?!”.
New analysts aren’t the only ones prone to this confusion. BTU Analytics consults for a number of financially sophisticated clients looking to make large investments in the energy space, and many initially question how it is possible that our analysis brings different results than what is reported by E&P producers. Early in my career, my first experiences in the job market included positions in both banking and investor relations. Much of my time was spent mining data for the perfect statistic that would help my company or client reinforce their brand and define their position in the market in the most appealing light. (We have the best wells! Footnote: Only includes wells drilled in the eastern part of the county on Thursdays in March.)
Today’s analysis shows how a company can present a message to E&P investors that, while factually true, may choose to leave out information that could muddle an otherwise appealing message.
Please note that although we chose a single company as an example for this blog, almost no company is immune from selectively communicating information that puts their best foot forward. And honestly, investor presentations are mostly marketing materials to sell the company’s stock, so ‘fair and balanced’ shouldn’t be the expectation.
The company chosen as today’s example is far from one of the worst offenders.
The chart below shows production performance for all horizontal operated by Goodrich in the counties the company has identified as being part of the Haynesville region that are marked as being in the Haynesville reservoir.
continued:
Note that the initial production (IP) rate for the investor deck slide looks to start at about 13 MMcf/d. But only one well out of over twenty in the historical data set shows first month production that high. That isn’t necessarily a red flag as the production curve based on the state data very likely shows less than thirty days of production, whereas the Goodrich curve shows 13 MMcf/d as the average for the first thirty days of production. Operators typically report wells in company materials excluding any downtime where as analysts utilizing state data typically have to assume the well was “on” for the number of days in the month due to lack of consistent reporting of days on production. Additionally, looking at the cumulative production curve implied by Goodrich’s type curve, the IP rate isn’t the only issue. Cumulative production is over 30% higher than even their best performing wells by the end of two years and nearly double the average well performance of the 20 operated wells analyzed .
Comments:
1) It is interesting if shale breakeven price calculations are based on actual well performance or the data provided by operators.
2) Analysis by BTUAnalytics helps to explain why money is flowing into the shale sector and why
“MRO stock has gone from under $7 to 0ver $18
CLR stock has gone from $17.5 to 0ver $58
NFX under $22 to over $46.”
Investors simply ignore the real numbers.
Investors never learn.
Good investors read the 10Q and 10K and ignore the hype in investor presentations.
Dennis: More accurately, “There’s a sucker born every minute”. One investor learns (by losing his shirt), but there’s always another sucker behind him to step up with more money.
Eventually you do run out of suckers willing to fall for the same scam, but it takes a really long time…
That’s good stuff.
Time for the SEC to have presentations put under oath. That would be interesting.
A President Trump loosening of regulations would suggest that would not happen, but a President Trump draining the swamp . . . wow, it actually might happen.
Here is the sort of stuff going on. Some stuff profoundly right. Some stuff completely, factually wrong. Final paras from a ZH article:
In sum, OPEC has so far managed to fool the market, and send the price of oil surging off all time lows hit in early 2016 even as OPEC output has reached record highs, and the just concluded deal may end up eliminating just a small fraction of this excess supply.
All true.
There is also risk that demand – most notably out of China – will continue to decline, delaying the so-called market equilibrium even assuming full OPEC and non-OPEC compliance.
mazamascience.com/oilexport and the BP bible says 2015 oil consumption growth in China was +5%. There is no continue to decline. And they have 21 million more cars this year burning oil. How can there be much decline, at all?
And, courtesy of Modi’s ridiculous “demonetization” attempt, India’s economic outlook is suddenly in jeopardy: should Indian oil import demand decline as a result, OPEC will have to double its daily production cuts just to catch up to the drop in global demand.
Just checked EIA. No evidence of any significant fall in US consumption. It will probably rise. Indian consumption was +7% last year. No real evidence of a global drop in consumption. Population grows. So why is this surprising?
Perhaps the best forecast at this point is that the price of oil will remain rangebound between $45 and $55. Below that and more jawboning will emerge; above it and concerns about shale output will dominate.
That’s not best. They are all equally worthless.
Finally, it is safe to say that this is OPEC’s final attempt to prove it is still relevant in a shale-driven world after the “2014 Thanksgiving massacre” when Saudi Arabia essentially unilaterally crushed the organization, and the price of oil. Should OPEC blow this, it will likely be game over for any future attempts to artificially prop up the oil price by the world’s oil exporters.
24 hrs ago there was no deal of any kind and all reports were that there would be no deal.
There still is no deal. Mexico was quoted by Nigeria as willing to cut. Mexico has since refuted. Russia is similarly essentially refusing. It’s jawboning. Nothing will happen, other than provide article writers something from which to extrapolate nirvana, trigger headline reading trading algorithms and continue the facade of normalcy.
They never ever seem to prepare graphs showing what will happen if there are horribly bad presumptions. It’s always sunny presumptions.
ZH can do better than this. They have.
OPEC will cut production…
http://www.vox.com/2016/11/30/13792788/crude-oil-prices-opec-cuts
Coincidentally, on the same day after I posted to Peak Oil News, this shows up at SRSrocco:
THE HILL’S GROUP: Gold Mines vs Oil Depletion