North Dakota has released August production data for the Bakken and also for all North Dakota.
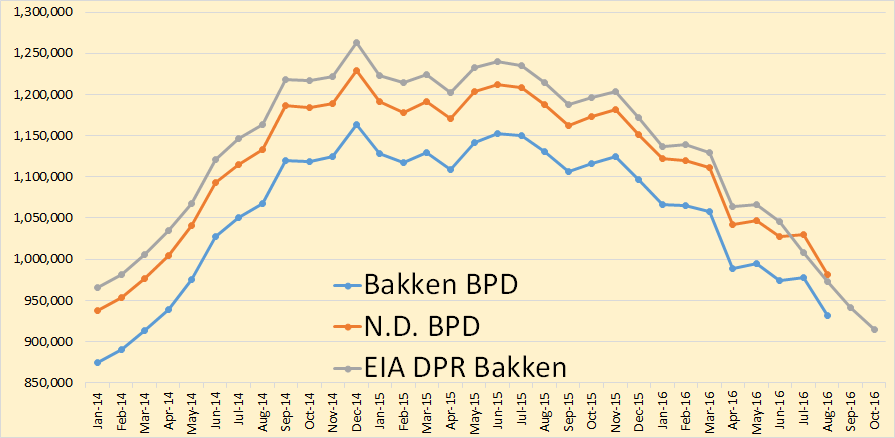
Bakken production was down 46,433 barrels per day to 930,931 bod, All North Dakota was down 48,695 bpd to 981,039 bpd. This is first time North Dakota has been below 1 million barrels per day since March of 2014.
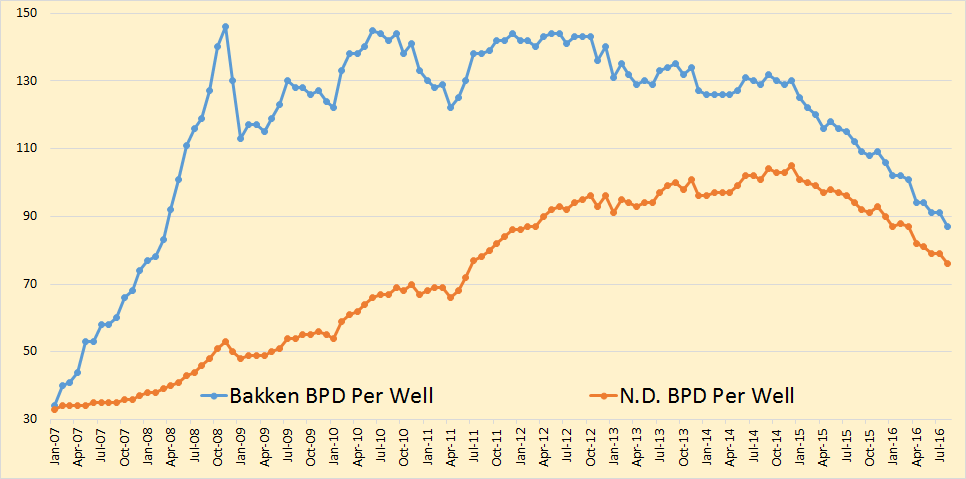
Bakken barrels per day per well dropped by 4 to 97 while all North Dakota bpd per well dropped by 3 to 76.
From the Director’s Cut
Oil Production
July 31,921,757 barrels = 1,029,734 barrels/day
August 30,412,200 barrels = 981,039 barrels/day (preliminary)(all-time high was Dec 2014 at 1,227,483 barrels/day)
Producing Wells
July 13,265
August 13,289 (preliminary)(all-time high)
Permitting
July 86 drilling and 0 seismic
August 99 drilling and 1 seismic September 63 drilling and 1 seismic (all time high was 370 in 10/2012)
ND Sweet Crude Price
July $35.57/barrel
August $33.73/barrel
September $32.98/barrel Today $39.75/barrel (all-time high was $136.29 7/3/2008)
Rig Count
July 31
August 32
September 34 Today’s rig count is 33 (all-time high was 218 on 5/29/2012)
Comments:
The drilling rig count increased one from July to August, then increased two from August to September, and is down one more from September to today. Operators remain committed to running the minimum number of rigs while oil prices remain below $60/barrel WTI. The number of well completions rose from 44(final) in July to 59(preliminary) in August. Oil price weakness is the primary reason for the slow-down and is now anticipated to last into at least the fourth quarter of this year and perhaps into the second quarter of 2017. There were no significant precipitation events, 11 days with wind speeds in excess of 35 mph (too high for completion work), and no days with temperatures below -10F.
The new October OPEC Monthly Oil Market Report is out with crude only production numbers for September 2016. All charts are in thousand barrels per day.
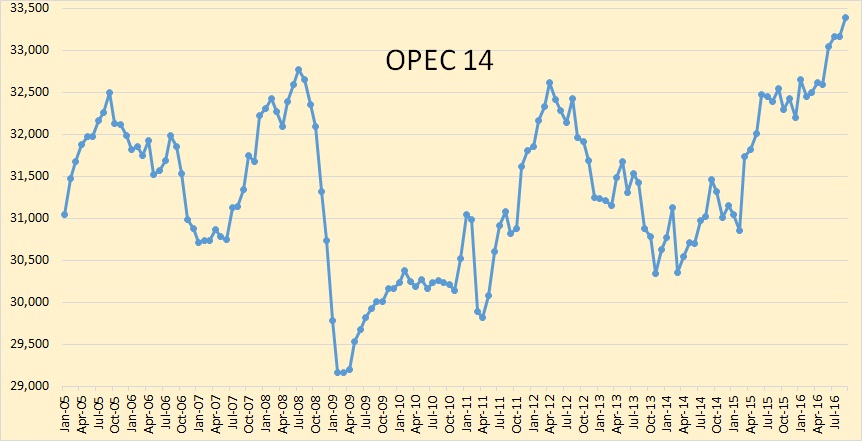
OPEC crude only production reached 33,394,000 barrels per day in September. This includes Gabon. Since May, OPEC production has increased .8 million barrels per day.
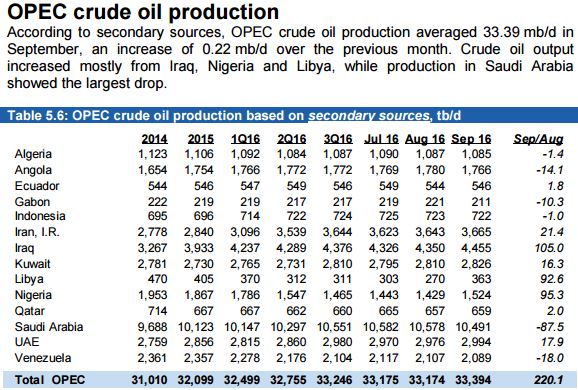
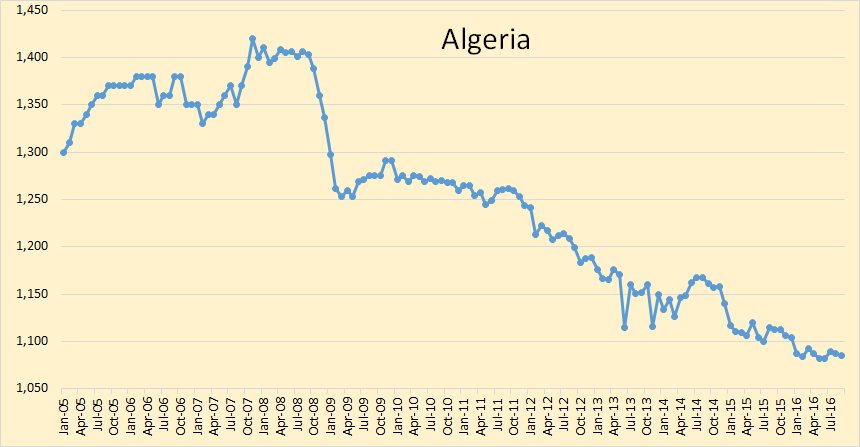
Algeria is in slow decline.
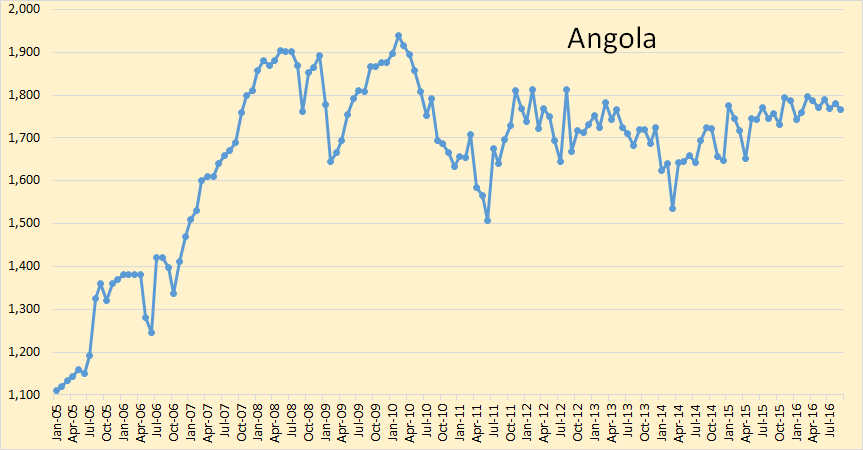
Angola seems to be holding steady.
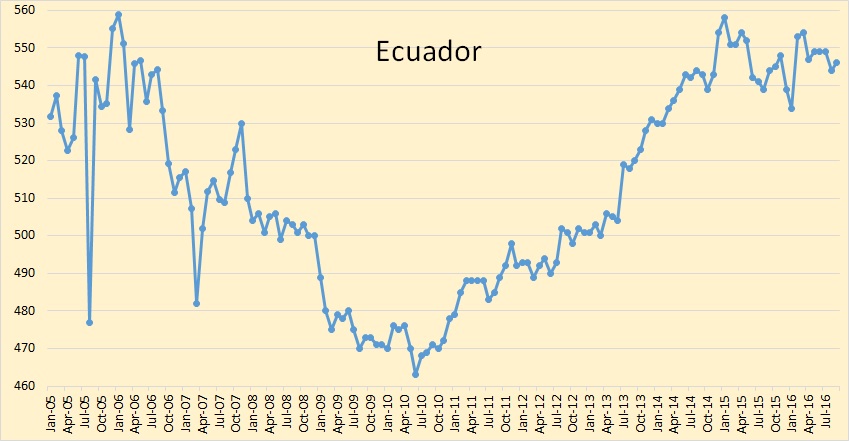
Ecuador was sharply down in August but seems to be holding steady for the last two years.
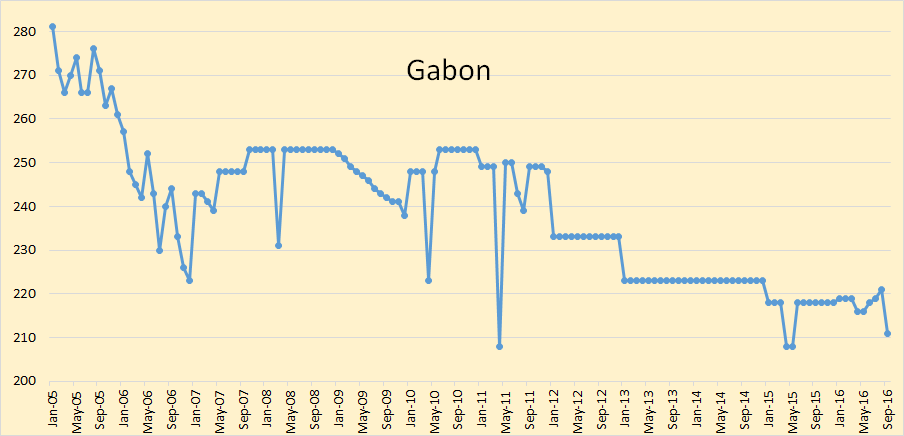
Gabon has been added to OPEC but their production is so low it will have little effect one way or the other.
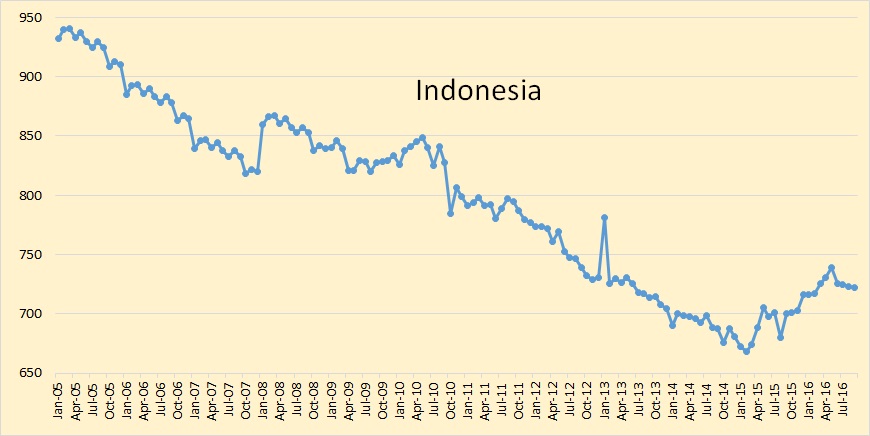
Indonesia will also not affect OPEC production in a big way one way or the other.
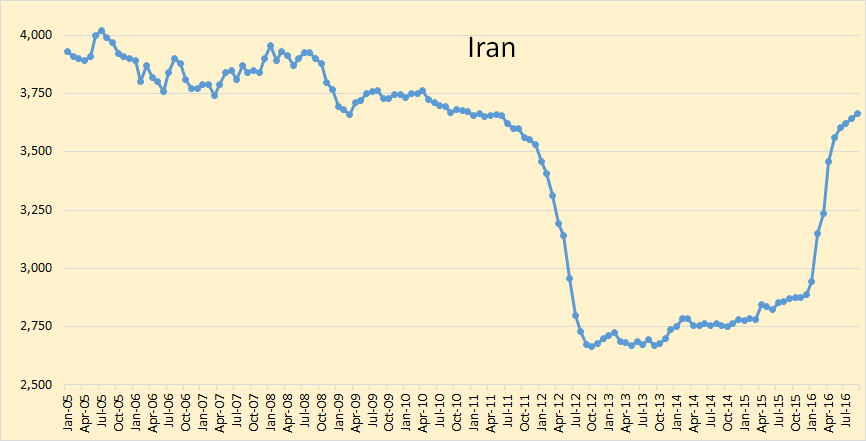
Iran’s increase since sanctions were lifted has slowed to a crawl. There are other problems on the horizon for Iran. They are talking about changing all their oil field contracts to “buy back” contracts. That is they want the option to nationalize all everything. This will likely cause a mass exodus of foreign oil companies from Iran and hit their production considerably.
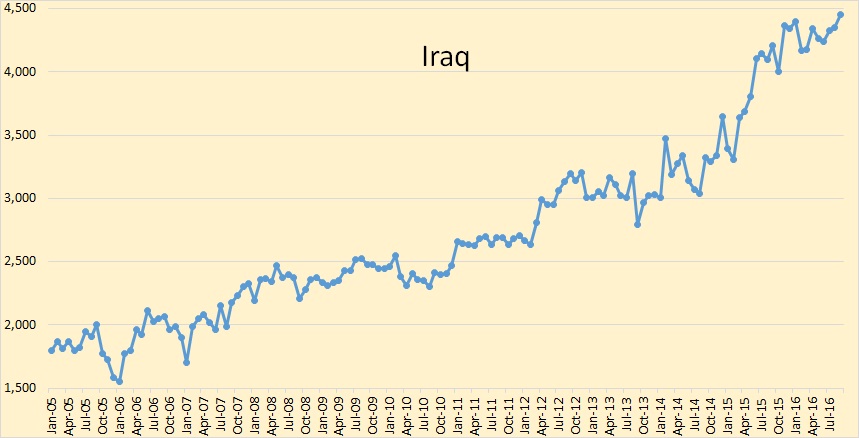
Iraq’s production was up 105,000 bpd in September. Though this was 56,000 bpd above their January high, I don’t think it is anything to get excited about. Iraq, like everyone else in OPEC, is positioning themselves for an OPEC “freeze” in oil production. So they are producing every barrel possible in order to freeze at the very highest level possible.
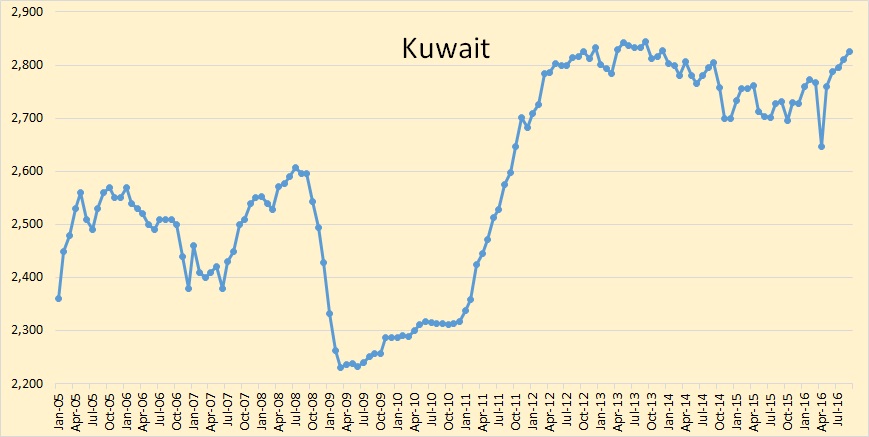
Kuwait has recovered from the problems they had in April. I expect their production to flatten out here with a slight decline over the next few years.
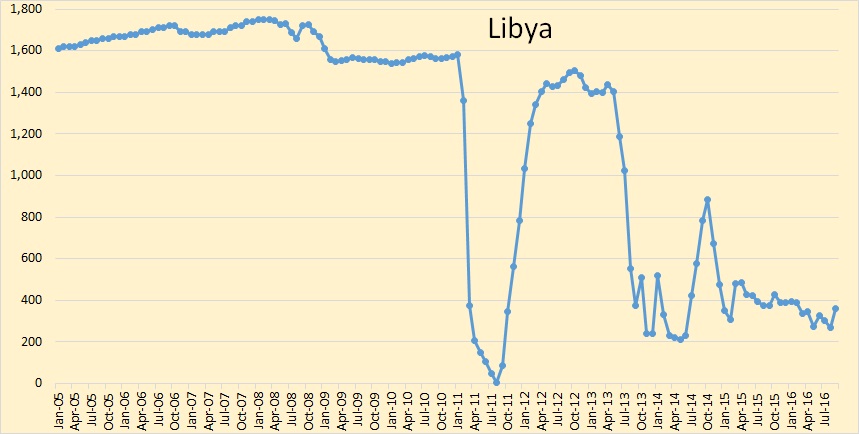
Libya’s problems continue, and will likely continue for a long while yet.
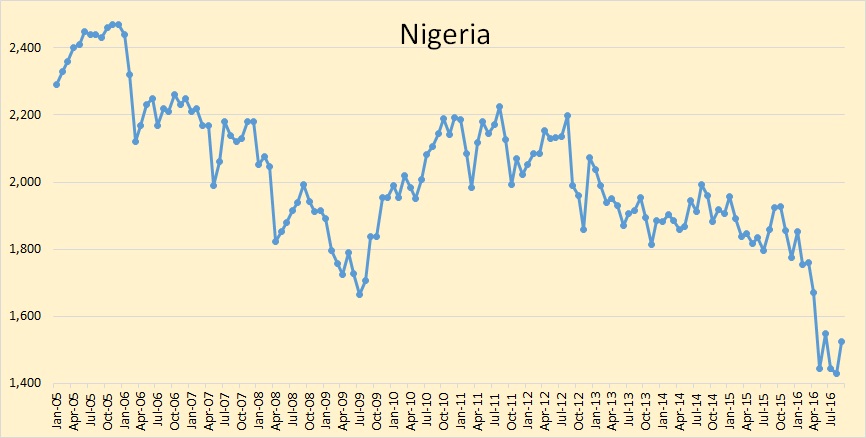
Nigeria’s problems continue and shows little signs of improving.
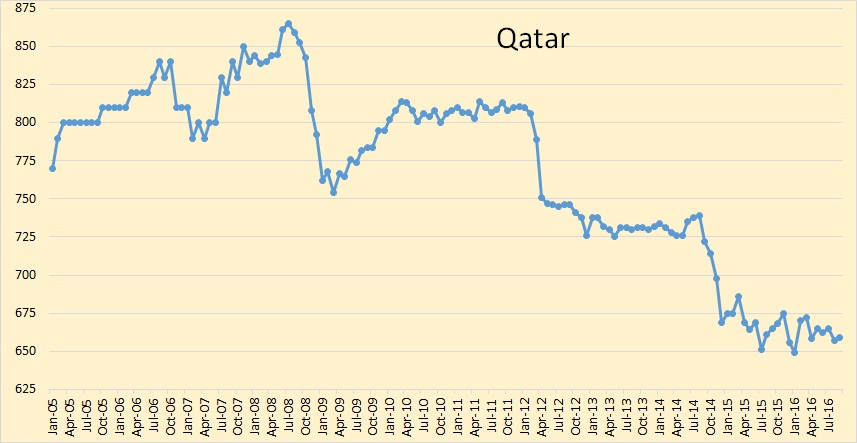
Qatar’s oil production seems to have bottomed out since late 2014.
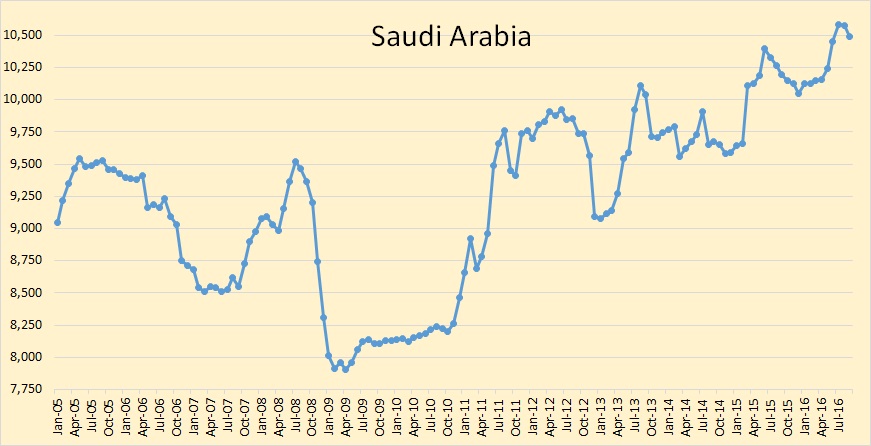
Saudi saw a slight decline in September.
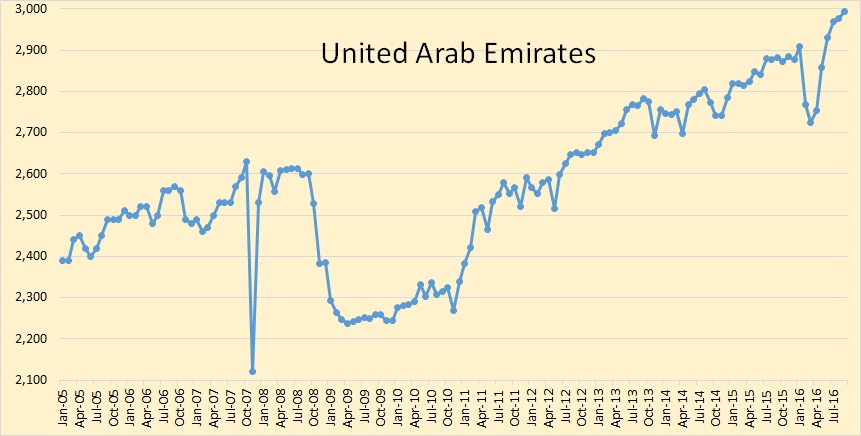
The United Arab Emirates had some problems earlier this year but they seem to have recovered. I think they will hold production steady for a while now. I really don’t think they can increase production much above 3 million barrels per day.
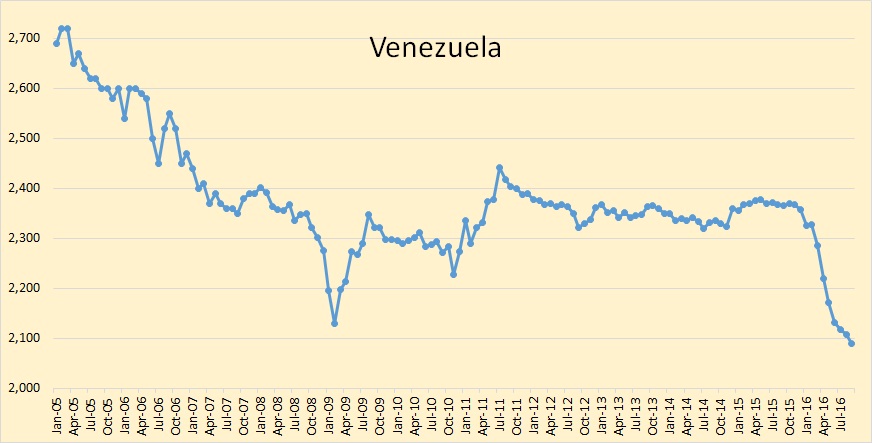
Venezuela’s oil production is still dropping but the decline seems to be slowing. Venezuela has very serious economic problems. They are nearing the “failed state” status.
376 responses to “Bakken Production Down, OPEC Production Up”
Ron,
Excellent article. Let me start off by saying, the downturn in Bakken oil production is likely just a temporary blip. I would imagine when the oil price recovers and heads back to $100, on its way to $200, we should see a new high in Bakken Field oil production. I wouldn’t be surprised to see the Bakken reach 2 million barrels per day.
However, for that to take place, the Federal Reserve will most certainly have to send $10,000 checks to every American family in the country. First, they will likely start buying the Broader Stock market as Chairman Yellen suggested during the FOMC last week. And why not… everyone else is doing it.
Secondly, while OPEC is producing more oil than ever, we see that the Saudi Govt is in big trouble. No doubt, they are producing all out just to keep the doors open there at the Kingdom of Saud.
Lastly, I believe after another year or so of financial and economic insanity, the U.S.S. Titanic will likely hit a big ICEBERG. This will finally wake Americans up from the dead.
steve
Hi Steve,
If the World economy crashes before 2018, as you expect, oil prices might remain low forever.
Oil prices of $85 to $90 per barrel will be enough to make the Bakken/Three Forks of North Dakota profitable based on research by Rune Likvern. It is doubtful that the Bakken will reach 2 Mb/d, but it might return to its previous peak if you are wrong and there is no World economic collapse before 2025.
Yeah, as soon as the unicorn starts shitting lightning skittles, we don’t need affordable oil anymore.
the titanic has already hit the iceberg and is sinking… we are (fortunately) up on the dry end. i doubt we will see $200/bbl oil. the limits to growth cannot afford those prices.
todd cory,
Yes, we are in agreement on that. However, I was just making a “Funny.” I believe the past-time of calculating reserves and making nice charts showing we don’t have nut’n to worry about because we have several trillion barrels of crude, ready for the pick’n, will dry up and blow away (like collecting Beanie Babies) in the next 2-5 years.
Instead, people will be realizing they should have been spending their time learning how to grow food or something more important than counting digital barrels or digital wealth.
GOD HATH A SENSE OF HUMOR….
steve
Hi Steve,
I think there is plenty to worry about as I expect oil output will begin to decline within 5 to 10 years, oil prices will rise and the World economy may have great difficulty adjusting. I also expect the inability to adjust to declining fossil fuel output may lead to a depression in 2030.
Which leads to a strong public policy prescription of an aggressive buildout of EVs, mass transit, ride sharing, etc.
I expect oil output will begin to decline within 5 to 10 years…
Really now? Within 5 to 10 years?
I also expect the inability to adjust to declining fossil fuel output may lead to a depression in 2030.
And the bad news keeps getting worse. A depression in 2030. Not by 2030 mind you, but in 2030. Well hell, my crystal ball is not at all that clear. All I have is an educated guess, and I am not at all sure as to how well my education is. But I expect all hell to break loose way, way, before 2030. Perhaps by or before 2020.
And as to oil output beginning to decline in 5 to 10 years, I think you are a little off base here. I think oil output began to decline in 2016.
Addendum: I am on my third toddy right now. A little background info is in order here. I have a hiatal hernia and and cannot eat or drink late. Because if I do I am up all night with heartburn. So I have my first toddy at 3:30 PM Central Time. And usually two more after that and no more. I must quit then or I am still up all night with heartburn. But goddammit I enjoy those three, each at least two ounces each (Canadian Blended). So when I write around 5 PM Central, please don’t take me too seriously. 😉
But goddammit I enjoy those three, each at least two ounces each (Canadian Blended). So when I write around 5 PM Central, please don’t take me too seriously. ?
Cheers! I raise a glass to toast you!
Hi Ron,
Yes I should have said around 2030. I expect 2030+/-3 years for the start of a World Depression. Yes output has declined a little, but the 12 month centered moving World C+C average output has only declined a little from 80.14 Mb/d in Sept 2015 to 79.92 in Jan 2016 (most recent centered 12 month average based on EIA monthly data). My guess is that we will see an undulating plateau between 79 and 81 Mb/d from 2015 to 2022 and then output will begin to decline.
Chart below has centered moving 12 month average World C+C output from the EIA from Jan 2004 to Jan 2016. Note the undulating plateau between 73 Mb/d and 75 Mb/d from Oct 2004 to Sept 2011, I think we might see a similar plateau from 2015 to 2022 as rising oil prices leads to more drilling.
Generic zantac is $5 for 60 tablets OTC. One before bed.
I don’t drink much at all, so 3 of those would put me to sleep quite nicely at 5pm. ‘u’
But I’d like to brew my own cider shortly and also make a freeze distillation out of it, as well as a ‘mead’ made from its ‘live [yeast] dregs‘, so that could change.
The Peak Oil 101 bible says that basic brewing and distilling knowledge and skills can of course be important to have, post peak oil, like in an apocalyptic scenario, and like, where people are sad and want to drown their sorrows.
Moonshine or ethanol are good for all kinds of things, like electricity-free lighting; running ICE engines in the absence of normal gasoline/petrol (probably not for prolonged periods though); medical emergencies (sterilizing cuts and scrapes); preserving things like fruit; and making crêpe flambés.
I think jet engines can also run on ethanol, so if you have a spare jet lying around in your garage, and your normal fueling stations are empty or have been bombed, like in riots or worse, and/or there are hours-long lineups at them, and people fighting each other because someone butted in, in front of them in line (I hate that), then you should still be good to go.
Caelan,
If you’re looking for a simple refreshment for summer, making hard ‘cider’ with supermarket apple juice is possible (it’s pasteurized, so you don’t have to boil it). The problem is fermentable sugars, which some of us get around by boiling a pound of honey in 1/2 gallon of the juice (for, say, 10 minutes – to pasteurize the honey), and combining it with, say, 4 gallons of the juice (in a **sanitized bucket**), then throwing some champagne yeast in (some other yeasts are ok, too).
This year I’ll try throwing in a little malted barley extract. It needs to stay in the bottle for a while, though, so I do it late October for drinking in summer. Carbonating it is something you can look up online (or are you already a brewer??)
Also, should we not be talking about this on the other thread?
Yes. Better on non-Petroleum thread.
Dennis,
Where would we be without your excellent oil thread moderator skills?
Steve
Thanks for the input, Stu.
Perhaps we can let each other and the forum know how it goes, (since it’s social-decline-relevant) and on the other non-oil thread. I’ll look for you there.
https://www.youtube.com/watch?v=qNi1sevKNd0
“End of the Ship” by Roy Zimmerman
Hey Steve,
I believe under current legislation, the federal reserve can only buy government issued debt instruments with “printed” money.
The fed is beholden to congress under the 1914 federal reserve act.
SatansBestFriend,
While that is true on “paper”, I would imagine the Presidents Working Group On Financial Markets has been buying stocks on behest of the U.S. Treasury and Fed for some time now. If everyone else is doing it, do you really think the Fed & U.S. Treasury would be left out of the party??
I wouldn’t be surprised to see Fed Chairman Yellen getting the ‘GO” on buying stocks “PUBLICLY” as they need it to go FULL RETARD now.
After the Fed realized it was issuing more debt than the market could swallow, it had to start buying Bonds, HAND OVER FIST. Unfortunately, the stock market is now in big trouble as the business model of borrowing money at zero interest rates to buy back shares or issue dividends, is not a long term solution.
So, I would bet my bottom $100 Trillion Zimbabwe Fiat Note that Ol’ Yellen will get the go at some point. However, this will signal the end of the system…. that is, if they don’t use their last bullet by issuing everyone a $10,000 check.
If they do… well then, we could enjoy another 3-6 months driving to WalMart, Starbucks or Walt Disney World.
steve
I would be more concerned with deflation than hyperinflation ( in the USA ).
When the defaults start happening the asset base of the country ( stocks, houses, etc). Will implode.
This will also trigger the derivative monster. No one knows what is being hidden off the balance sheets of big companies, like major banks.
SatansBestFriend,
The MOTHER of all Deflations is the ultimate outcome. This is due to the Thermodynamic Oil Collapse. I didn’t understand it before, but now that I have looked at the report, charts and spoke with the project manager of the model, DEFLATION is most certainly coming.
We are going to see a collapse in the value of most Stocks, Bonds and Real Estate.
The only debate here is the timing. My crystal Ball says its within the next 1-3 years.
steve
Steve. Another 2008?
Shallow,
Unfortunately, 2008 was a shot across the bow. What’s coming is orders of magnitude far worse. Again, this ETP Oil model and Thermodynamic Oil Collapse really changes how I look at energy now.
I will be interviewing Louis Arnoux on my site, the SRSroccoReport.com next week. I plan on putting on the site next Friday. It will be a youtube video interview including seven charts. Some of these charts will really get (some) people looking at energy and economics in a much different way.
Lastly, I just published an article on the disaster taking place in the copper mining industry. Copper is the King base metal. When things start to get rough in that industry, it is an OMINOUS SIGN:
https://srsroccoreport.com/big-trouble-for-copper-the-breakdown-of-the-industry-has-begun/
steve
Thanks for this, Steve. I look forward to the interview with Louis. The copper article is interesting and, as you say, ominous.
Medicare and Medicaid are costing the govt 1.3 trillion per year and compounding at 9%.
Simply look at a pie chart of govt expenses and their growth rates.
Even Javier couldn’t get this wrong.
No this is not 2008, it is an exponential doubling later from 2008.
All the problems in 2008 were papered over with fed money printing.
None of the structural problems were fixed.
On the up side, people are getting a lot more health care.
But what in the world do you mean by compounding in this context?
Growing exponentially. Compounding might not be the appropriate word, but I love the way it sounds.
Yeah we have more health care. For a few more years till it bankrupts the country.
Without the monopolistic pricing practices, that same health care will be ALOT cheaper. But the industry will need to collapse first.
Oil only makes up about 40% of total energy consumption. Even if it completely disappears, it won’t be the end of energy, or even fossil fuel.
Most energy is wasted anyway. Cutting consumption by half is feasible from a thermodynamic point of view. A few applications of oil are hard to replace, but this is not a thermodynamic issue, it’s a technology issue.
It’s a food issue. The shelves get stocked by trucks.
When oil goes away, so do you.
You’re being silly.
Diesel used for food delivery is a small fraction of overall oil consumption. That small fraction won’t go away for many decades, unless we want it to. There are good substitutes (rail, local electric trucks).
Hi Watcher at least half of oil use is personal transportation which can easily be reduced.
For example the UK uses less than half the oil per capita America does.
https://upload.wikimedia.org/wikipedia/commons/9/91/Energy_Use_per_Capita.png
And they aren’t exactly frugal.
Me,
The trouble is, in the US the wife feels she needs a F-350 to do the weekly shopping. While in the UK, the wife realizes a diesel Fiesta does the same job.
Nothing like $5 diesel to change the wife’s mind about what to drive.
Steve wrote;
”This is due to the Thermodynamic Oil Collapse. I didn’t understand it before, but now that I..”
As you understand this Thermodynamic Oil Collapse, pls enlighten us.
I agree with Rune. I have a cursory understanding of thermodynamics, Rune’s knowledge is far better than mine.
What I don’t understand is why the net energy provided by oil really matters. Even if oil becomes an energy carrier like electricity, it will still have value and the price will be determined by supply and demand.
Maybe Steve can explain why the price of electricity hasn’t collapsed. The price of a product has nothing to do with its net energy.
If the net energy of all energy produced by society was zero we would have a problem, the analysis needs to be done with wider boundries for all forms of energy to be convincing.
Steve,
We are still awaiting your explanation to the Thermodynamic Oil Collapse.
After all since you understand it it should be easy for your to explain.
I am not sure why people think this is really complicated. Net energy concept is just an application of the law of conservation of energy. If you cannot understand the following video, well there is nothing else to say
https://www.youtube.com/watch?v=CmttxT1Wl1M
Hi mynamett,
Why is electricity produced? It is not an energy source, but still it’s price is positive.
The Hill Group argues that petroleum must be an energy source or it’s price will fall to zero, or at least below the cost of production.
I believe there is no logical reason that petroleum cannot continue to be used even if it only serves as an energy carrier.
The net energy of all energy produced by society, probably needs to be above 6:1. It does not need to be the case for every energy product, some types of energy will have higher net energy than others.
Of course price matter. The drop in demand was driven by 2 oil price shocks in 1973-74 and 1979-80.
But:
1/ In 1979-81, the cost of oil to global economy was much higher than in 2011-14, as oil intensity of GDP has significantly declined since early 80s.
For a similar effect, today’s prices should be above $160 for 2-3 years.
2/ Oil substitution in power generation and cost-saving measures of early 80s were low-hanging fruits.
Nominal Global Oil Expenditures as percent of Nominal World GDP
Based on Toolpush’s remarks, I’d say the definition of thermodynamic collapse is when your wife doesn’t have a big enough car.
Wealth – any income that is at least one hundred dollars more a year than the income of one’s wife’s sister’s husband.” – H. L. Mencken
Steve,
I’ll take the heat to say I am with you on this. Most of us cannot wrap our heads around the reality that systems run on available energy, not its poorly linked proxy of money or value.
Mother Nature’s systems run on the laws of physics and energy is king, in the form of flows and storages. Natural systems exist because of energy that flows through them and what they can store, mostly in the form of complex molecules. Tiny changes make big differences given some time.
Our global economy/society/whatever is a system subject to the same rules of physics. Changes in energy flows will modify the system. Less net energy from oil will yield less to run the system, and the system will reduce in size accordingly.
How and when? Mostly gradually and constantly, although organized efforts to delay the inevitable changes can cause sudden changes when the delaying tactics run out and the system resets to match the energy actually captured by the system.
The predicament is that the declining net energy from oil is a one way trend, and we don’t seem to have an equivalent alternative. If we did, we would just crap ourselves out of our nest sooner and more severely than we seem hell-bent to do.
Interesting times. Glad I’m much closer to the end of my life than the beginning. Best wishes for everyone else.
Steve, good luck explaining systems ecology in a nutshell to folks who know economics. No matter what you write, the money and value distortions get in the way.
It is all about energy flows, not economics. Economics is noise and market manipulation which distorts our understanding and obscures the subtle changes and effects from less cheap oil in the system. The signs of collapse are subtle, but everywhere, in my observations. I don’t claim to have any idea as to deflation versus inflation, but I do see less energy available in the near future and that will make parts of the systems go away.
Jim
Thanks cracker, excellent. And with 7 billion + people, a very highly leveraged financial system and social tensions already rising there’s a LOT of downsizing to do. Net energy is the key.
Hi Cracker,
I agree net energy is important. It is not important for any single energy source however and that is what the Hill Group is claiming. If for some reason the petroleum industry could only use energy from liquid petroleum and not energy from natural gas, coal, nuclear, or any other energy source, the analysis might be correct. Energy can be used more efficiently and there are plenty of energy sources that have adequate net energy such as wind, solar, nuclear, coal and natural gas (at present). As oil, coal and natural gas deplete the EROEI will decrease and more importantly the cost of each unit of energy will increase, other energy sources such as wind, hydropower, solar, geothermal, and nuclear power that have a lower relative cost will replace fossil fuels over time.
Note that I have two semesters of thermodynamics as a mechanical engineering student on one semester of statistical physics as a physics student with undergraduate degrees in Physics and Economics as well as a Masters in Economics. The proper boundry for the type of net energy analysis attempted by Hill is the entire economy rather than a single industry.
Net energy is of little importance on an industry scale relative to cost of production and price, there is no need for petroleum to remain an energy source, as long as it is profitable to produce economically.
The Hill Group argues that the oil price is determined by its net energy. I think even if the average net energy of oil was zero, it will continue to sell for a price of more than zero until demand for oil falls to zero. This may occur at some point in the far future (after 2080 at least), in the mean time gradually rising prices will lead to a gradual move to hybrids, plugin hybrids, EVs, ridesharing, and greater use of public transportation. AVs may also reduce fuel use as ridesharing may be easier. Eventually demand may fall faster than the fall in oil supply (after 2050 would be my guess). As I have said many times I doubt the transition to other energy sources will be smooth and expect a severe recession/depression to begin between 2027 and 2033 after an undulating plateau in oil output from 2015 to 2023 (79 to 81 Mb/d). In the scenario below based on a URR of 3300 Gb for C+C, the annual decline rate remains under 1% until 2026 and in 2030 the annual decline rate is 1.5%.
When I get to thinking about that World C+C graph Dennis, I see that 2022-2024 timeframe as critical. If it pans out the way you project, I believe that the writing will be so clearly on the wall that some very vulnerable countries will go ballistic- literally. I think we will get a big crude war, with countries trying to reshuffle the deck.
If so, the oil available for export (which peaked in 2005), will plummet even faster than it already will do under your projected scenario. This is the big intermediate timeframe risk as I see it.
Hi Hickory,
That is just one scenario where extraction rates level off over that period, it is possible that a plateau might be maintained a little longer than I have guessed, but that would lead to steeper decline later.
It is hard to know how it will play out. Oil prices will rise and this will help the exporting nations. It is not clear who will go ballistic, the wealthier nations are likely to be able to outbid poorer nations for oil and there may be a move to lower oil consumption in OECD nations as more EVs, plugin hybrids and hybrids will sell, this may take some of the pressure off declining oil supply. Eventually I expect too much stress on the economy from rising oil prices (as supply is likely to fall faster than demand at lower oil prices) will lead to a recession. Maybe it will be 2025, but I still like 2030 as a guess, 2035 does seem quite unlikely if the scenario in the chart above is close to correct.
Yeah, war could happen. The Iraq wars were partly motivated by oil.
But….it would be incredibly stupid. It would be far, far smarter to invest in EVs, mass transit, car sharing, etc.
That kind of investment would stimulate economies, prevent the depression that Dennis worries about, and make everyone better off. War, of course, just makes everyone poorer (or dead).
As of 2013, the % of net energy imports by country includes Singapore 98%, Japan 94%, Korea 83%, and countries in the 70-80% range include- Ireland, Italy, Spain, Belgium, Portugal, Turkey. These are example of countries that will come under extreme duress as the ‘oil available for export/import’ [OAFE/I] declines. Who will protect those tankers coming up through the strait of Malacca toward Asian ports, as they head through the South China Sea?
Any question why Turkey has moved armed columns into northern Iraq?
For comparison- Germany imports 62%, India 33%, and USA and China 14%, of total energy use. These big consumers of energy will be certainly big players in the game as well, as OAFE/I declines.
In the past I have spoken against the country having a big debt load (entitlement). This is because I think we will need every bit of economic resource at our fingertips as this scramble gets underway- whether its to build solar, wind or nuc generating capacity, or help protect friends from becoming failed states, for example.
http://data.worldbank.org/indicator/EG.IMP.CONS.ZS?year_high_desc=true
Hi Hickory,
Here is the problem with reducing government debt. Generally in an economy that is doing poorly, this leads to higher unemployment and idle resources (unused production capacity) and lower national income.
Your thinking seems to be very 1920s. The policy of everyone tightening their belts and balanced government budgets didn’t work very well from November 1929 to February 1933,it will work no better today.
When oil supply starts to decline in approximately 2023,oil prices will rise so that demand is reduced to the level of supply. The last time that World supply contracted (1979-1982), the decline rate was very sharp and the only major wars were between Iran and Iraq and the Soviet invasion of Afghanistan.
I think unless there is aggressive policy action a recession is very likely, and war is not unlikely, but hopefully if their are oil wars they won’t escalate to WW3.
Unfortunately most humans don’t learn from history. Not much reason for optimism.
Aggressive policy action won’t be taken until a crisis occurs, so we will have to wait for Great Depression 2, before governments will implement necessary policies to speed up an energy transition.
There’s ‘education’ and then there’s the real world, Dennis (which seems to be getting worse, despite all those masters and phd’s running rampant). While I wouldn’t lean too heavily on textbooks, your ‘qualifications’ are duly noted, thank you.
Dennis,
You simply do not appreciate the essential nature of oil in leveraging everything else, along with its own dominant share of utilized energy, and unmatched utility.
Everything you point to as mitigating factors are true and part of the equation, but they cannot be enough to match declining net oil energy. H.T. Odum’s systems ecology modelling showed me that in the early 1970s. It didn’t matter how we adjusted the inputs, oil energy drove the global system, and it still does today.
Your arguments are precisely what I mean when I write that economics distorts and obscures the reality that declining net energy from oil will reduce the systems dependent on it, and the people in that system will be less, too. Your knowledge of economics (which I very much admire) affects how you see things. The systems numbers that really matter in physics are energy flows (storage, too, but flows are usually the critical piece). Money and value are not the same and describe different parameters to serve different purposes that do not lend themselves well to honest and critical evaluation of energy flows.
Forget economics, that’s people stuff. Mother Nature manages all systems based on physics. Follow the energy flows. They rule, along with time for their manifestations. Economics is just fluff in the real world.
Jim
Jim,
That misses something:
We have an *enormous* net energy surplus at the moment. Half of all oil consumption is for passenger transportation: the average US vehicle only gets 22MPG, and only carries 1.2 people. Only about 1/3 of US passenger vehicles are in use on a daily basis for commuting.
The US could reduce it’s oil consumption by 25% almost literally overnight by shifting it’s mix of vehicles, and raising vehicle occupancy. Putting most SUVs up on blocks would be easy. There would be some relatively small inconvenience for carpooling and carsharing.
And industrial/commercial consumption has a very large component of low-value consumption: trucks and ships could slow down, fleets could implement other low-cost efficiencies, and could switch fuels.
“The US could reduce it’s oil consumption by 25% almost literally overnight by shifting it’s mix of vehicles, and raising vehicle occupancy. ”
Do you really believe that the U.S. can almost literally overnight change its vehicle fleet?
This goal can be achieved only by introducing very high fuel taxes (like $3-5 per gallon).
Do you think this is acceptable politically?
But even in this case it will take no less than 10 years to drastically change the mix of vehicles.
Do you really believe that the U.S. can almost literally overnight change its vehicle fleet?
Well, remember, I pointed out that only about 1/3 of the US light vehicle fleet is in use at the peak commuter periods. The US could stop using SUVs almost entirely just by choosing to use the sedans that are already on the road. For instance, many families use an SUV for the parents, and the teenage kids use the 3rd vehicle, a sedan. Sedans, you see, are less expensive and less fashionable, so they’re used less.
This goal can be achieved only by introducing very high fuel taxes (like $3-5 per gallon).
That would make sense. Various kinds of rationing would also work.
Do you think this is acceptable politically?
Of course not, or we’d be doing it. But…the US economy is not likely to collapse for lack of fuel. If it gets really scarce, more efficient utilization of existing supplies would be relatively easy.
Hi Cracker,
Oil provides 33% of World primary energy.
If we look at it in exergy terms it is far lower, 20% or possible as low as 10% of the total exergy used by society.
I agree net energy is important, but oil provides a fairly small proportion of the World’s net energy, much less than the 1970s.
Hi AlexS,
I agree Nick tends to be on the optimistic side.
He didn’t really say the fleet would change overnight, there would be a gradual change in the efficiency with which vehicles are used. The more efficient vehicles will be driven more when families own several vehicles with different efficiencies, people will drive less by ride sharing and combining trips.
I agree it will take 10 years at least to significantly change the efficiency of the vehicle fleet, even with high oil prices.
I agree in the US high fuel taxes are not likely, though it is the correct policy. When peak oil becomes apparent, perhaps higher fuel taxes may be enacted.
Hi Dennis,
If we take a look at global primary energy for fossil fuels– not just oil– it’s whopping.
If oil has been and is being replaced, what has it been/is it being replaced with (and when do they decline); what are their energy-densities/EROEI’s, (trans)portablilities, C02/pollution emissions and reservoirs like, and how’s everything working out for the pseudoeconomy? How healthy is it currently?
Also, what amount of oil/FF’s is/are embedded in nuclear, hydro and alternative energy, and general electricity-generation, including proper/rigorous mining/sourcing, building, maintenance and decommissioning? Nuclear waste has yet to be decommissioned. (Would you know of, or would you like to fashion a guess as to what proportion of relatively non-renewable energies might go into that? How about financing for those kinds of things in a debt-based and ostensibly-failing pseudoeconomy?)
How about the impacts of a growing and ‘developing’ global population and national-competition in those regards, as well as the use of fossil fuels in war-time scenarios, such as in their security and in national security?
Lastly, if we agree that the economy is not really economic at all in the classical sense of the word (‘frugal’) then what of our contentions and calculations? Do they all kind of fall apart and/or have much less meaning than what we might have learned?
Incidentally, did you take any anthropology, sociology or psychology majors, minors or electives, and if so, what might they have taught you, such as about such things as true community, anarchism, democracy, freedom, self-ownership and self-empowerment, scale, ethics, equability/equity, (‘sociopolitical’) power or decline/collapse, etc..?
3000-word essay, due by Friday, Oct. 21st.. 10% off final grade, each day it is overdue.
tends to be on the optimistic side.
That assessement depends on the context.
Remember, I’m pointing out the fundamentals: how much energy is available, what could be achieved with different strategies.
These strategies may seem unrealistic in the current environment, but when people suggest that we may be staring at a possible collapse, or even just a depression caused by energy costs…well, in such a context people will be willing to do things that seem unrealistic today.
Carpooling for instance. It’s inconvenient, but in a world where *everyone* has a smartphone, it’s obviously doable. It could literally reduce US oil consumption by 25% overall in weeks: just increase the average number people in cars from 1.2 to 2.4.
Reminds me of the old WWII poster: “If you don’t drive with your carpool, you’re driving with Hitler”.
Hi NickG,
You often state your case as if it will not be difficult to accomplish.
Let’s assume there is no war and no recession in response to declining fossil fuel availability.
In that case do you think the policy actions that are necessary to accomplish an energy transition will happen seamlessly through the magic of “the invisible hand” of the free market.
I most surely do not think that is likely given the assumptions above (which are not realistic in my opinion.)
Hi Caelan,
I studied Mechanical Engineering, then switched to physics and economics.
Mathematics, Chemistry, Physics, zoology, economics, history, English, music, and philosophy are some of the areas outside of mechanical engineering that I can remember, it was long ago.
often state your case as if it will not be difficult to accomplish.
Well, this all depends on context. Countries like the US and Switzerland reduced their domestic oil consumption in WWII by very large fractions – I think the Swiss managed about 90%. Was it easy? No. But, it was done while increasing GDP dramatically.
Perhaps I should clarify that when I talk about possibilities I’m typically talking about what’s possible from a technical, engineering and economic point of view. NOT the political.
do you think the policy actions that are necessary to accomplish an energy transition will happen seamlessly through the magic of “the invisible hand” of the free market?
Absolutely not. If things were up to an unregulated free market US MPG would have been about 12 up until 10-15 years ago, when we would have hit an earlier and more vicious peak in oil production. Wind and solar power would be primitive. EVs as we know them wouldn’t exist. Tesla wouldn’t exist – Elon Musk is NOT out for commercial profit. The Paris Climate agreement wouldn’t exist. China and the US would be burning 20% more coal.
No, we need a *regulated* free market, with the proper incentives and pricing mechanisms, as well as strategically chosen energy regulations, such as CAFE.
So, where are we now? Well, we have *part* of what we need, public policy-wise. I do think that if we get 10 years of very high oil prices you will be very surprised by how much things change. OTOH, to deal with Climate Change we need much more, and there’s no guarantee that we’ll get it. It requires conscious human choices, personally and politically.
Finally, remember where this discussion started? It was with “Cracker” saying Your arguments are precisely what I mean when I write that economics distorts and obscures the reality that declining net energy from oil will reduce the systems dependent on it, and the people in that system will be less, too.
He was saying that the *fundamentals* of energy would dictate economic decline and collapse. I’m arguing that the fundamentals are very different!
Fair enough, Dennis, and thanks for sharing.
Hi Nick G,
I gave the context.
The point is that without a crisis (and most people would include WW2 as a crisis) the kinds of changes needed are unlikely to occur.
Also how do you define “regulated” free market, do you mean what exists currently in the US and Canada for example?
Especially in the US the existing regulations are unlikely to result in fast enough change in energy use.
Leaving out what is politically possible, takes us from reality, what is technically possible is nice, but helps little without the political will to implement needed changes.
So generally I use the context of the real world as my starting point, a world where politics matters a great deal.
Only a crisis is likely to lead to the changes that are needed, hopefully it will only be a severe recession similar to the GFC, but I expect it might be close to the level of the Great Depression with World unemployment approaching 20% maybe more. Hopefully economists will re-read their Keynes and military leaders and politicians will re-read history and potentially avoid the mistakes made from 1936 to 1945, perhaps WW3 will be avoided.
Windmills, solar panels, EVs, and batteries would be a better use of resources than weapons in my opinion.
Dennis, slow changes in oil production would produce exactly the types of changes needed since the economics would drive them and given time there are more than enough options. Quick changes in oil production could result in exactly the wrong types of reactions since politics would drive the choices. It is the quick change scenario which is problematic.
It is the quick change scenario which is problematic.
Exactly. If the world economy has 10 years to adapt to high oil prices, it can do amazing things. Heck, the world economy handled high prices in the 2011-14 period quite well, and we saw the beginnnings of dramatic change.
It’s the very fast changes, like a disruption in oil supplies due to war or embargo, that are really problematic. Then you have a situation where industries can’t respond quickly, and you have “capex lag”. For instance, car buyers suddenly stop buying SUVs, but there isn’t a big enough supply of hybrids and EVs, so car sales crash. Crashing car sales causes financial problems for the car industry, which requires very good management to deal with properly (e.g., Obama rescuing GM vs Romney wanting a disastrous bankruptcy), and recession is hard to avoid because it takes time to ramp up the proper alternative capital investments into EV/battery production. Which in turn makes it hard for car buyers to make their capital investments in new EVs.
It’s interesting to watch the growth in EV and PV sales. They seem to be doubling about every 2 years. If that continues for 12 years, that gets you to a level that’s 64x higher than today: that would be a major change!!
Hi Stan and Nick,
I am less optimistic about the World economy’s ability to adjust to a long tern decline in oil supply. It is uncharted territory.
I suppose one could argue that oil supply declined sharply from 1979 to 1982 and did not rise above 1979 levels (C+C output) for 15 years. At that point in time the World was using oil very inefficiently so there was more room for less oil use, but also oil was a bigger part of the economy. The decline rate will gradually increase to about 2% and oil prices will rise. When the money spent on oil gets to 5% of World GDP we are likely to see a recession. It is possible the World might make a seamless transition to other types of energy besides fossil fuel, I don’t believe it is likely.
I would put the odds at less than 1 in 10.
Yeah, this is certainly uncharted territory. We have to look at analogous situations and try to inform our intuition.
One thing to keep in mind: most of our experience with high oil prices has been with very fast, short term changes. Then we’ve seen recessions. But, our one experience with slow, fairly seamlessly rising oil prices, from 2004 to 2014, was a fairly “successful” one.
That’s not to say that I would suggest complacency!!!
First of all, you’re absolutely right: deliberately planning for high oil prices is a risky strategy. 2nd, there are many, many costs to our oil addiction, including climate change, loss of foreign exchange, supply insecurity, and world conflict.
Dennis,
“oil supply declined sharply from 1979 to 1982 and did not rise above 1979 levels (C+C output) for 15 years. ”
The decline in supply was a result of the decline in demand largely driven by a shift of the power generation sector from oil to natural gas, coal and nuclear, but also to energy saving measures.
In order to stabilize prices, OPEC countries significantly cut production, but this policy failed and oil prices continued to decline.
By 1985 OPEC spare capacity reached 12 mb/d and the Saudis and others started to gradually increase production with the aim to gradually regain market share. This led to a further drop in oil prices.
Oil prices remained generally low (except a temporary spike during the 1st Gulf war) until the beginning of the 2000s when global surplus capacity was eliminated by rising demand.
The decline in supply was a result of the decline in demand largely driven by a shift of the power generation sector from oil…
And, of course, that shift by the power generation sector was driven entirely by high oil prices! The US reduced oil consumption by 18% from 1978-1982, while growing GDP slightly, a reduction entirely due to oil prices.
Prices matter…
Of course price matter. The drop in demand was driven by 2 oil price shocks in 1973-74 and 1979-80.
But:
1/ In 1979-81, the cost of oil to global economy was much higher than in 2011-14, as oil intensity of GDP has significantly declined since early 80s.
For a similar effect on global economy, today’s prices should be above $160 for 2-3 years.
2/ Oil substitution in power generation and cost-saving measures of early 80s were low-hanging fruits.
Nominal Global Oil Expenditures as percent of Nominal World GDP
See my comment at the very bottom. Things are getting narrow here…
I am sorry but I believe it is all about economics. Our problem is government and a dishonest money system.peak oil could be used as a ready excuse for the collapse of the present system by the government and bankers .the best way to deal with the consequences of peak oil is with economic freedom. Our current system now is going to be a nightmare.
What is economic freedom? I’ve never seen it identified in the wild.
I am a firm believer that when economic collapse is staring the government in the face, and the choice is between immediate collapse and printing that ten thousand buck check for everybody, and putting collapse off by a few days, weeks, months, or possibly even longer,
THE CHECKS WILL BE PRINTED. And they will be cashed, and the cash will be good. Anybody who has money owed to them, and tries to refuse that cash, will be in violation of some very heavy duty federal law.
This is in part why I believe in holding onto actual physical goods rather than cash to the extent it is practical to do so. I am not much afraid that I will be UNABLE to buy fertilizer or diesel fuel, or nails, but rather that the prices of them will go thru the roof at some point.
Think about this, we are mostly all realists in this forum, with differing opinions of course. IF it is possible for Uncle Sam to use a sledgehammer to create inflation, will he allow the economy to collapse rather than use the sledge hammer?
The sledge hammer will not FIX the economy, but it will probably keep the economy more or less functional for some period of time, in the same way that powerful poisonous drugs keep a cancer victim alive for some period of time.
If this hypothetical deliberate inflation is well managed, it might prevent an actual collapse from happening for some significant period of time, maybe even a year or two or longer.
I apologize for putting this in the wrong thread, but it goes part and parcel with a major shortfall in the supply of any critical resource- any resource that is important enough to upset the economic apple cart.
If this sort of inflation comes about, it is my intention to be ready, and sell some land for cash, before the public figures it out, enough to pay off all my debts.
When people run from the stock and bond markets, they run to gold, real estate, and collectibles. This is well worth remembering.
Hi Old Farmer Mac,
In the Great Depression inflation was not a problem, it was deflation that caused much bigger problems. Perhaps this time will be different. Though note that deflation was also a problem in 2009.
Traditionally, most folks think of inflation as what happens during the “boom-cycle” – i.e. when high capacity utilization, low unemployment and rising wages puts an upward pressure on prices.
Asset inflation and deflation are two sides of the same coin. Central banks fear deflation (and unemployement) and therefore they will do whatever they can to combat it (last resort is to print money/hand out helicopter money as mentioned above). This causes inflation but not for the same reason as “normal inflation” and different assets will be impacted differently.
(Hyper)Inflation can also arise as result of debt that is issued in another currency combined with deteriorating ability to repay it.
Hi Jeff,
There has been very little inflation since 2009 in the US, but very loose monetary policy.
US issue debt in its own currency. Money currently flows into the US, not because it´s good but because it is the least bad of the major currencies.
The loose monetary policy has resulted in asset inflation, see e.g. the stock market. These assets are not included when calculating inflation.
Hi Jeff,
Stocks are a little overvalued at present when considering the PE of the S&P 500, but not anywhere near the level of Sept 2008 to Aug 2009. See chart at link below.
http://www.macrotrends.net/2577/sp-500-pe-ratio-price-to-earnings-chart
Most of the excess money is just sitting in bank accounts and the velocity of money has fallen to compensate for the large money supply.
In an earlier comment you mentioned helicopter money. Only the legislature can do that, not the central bank. It’s called fiscal policy, either a reduction of taxes or government spending. Government spending tends to be a better stimulus as reduced taxes could simply be parked in a bank account, especially tax reductions for the wealthy, reduced taxes for the middle class (income of 50k to 150k) could be pretty stimulative. Or the government could repair roads, bridges, and water systems, which might be useful.
Hi Dennis,
In the Great Depression era, we were looking at at what was nothing more than a major economic slowdown, rather than an actual collapse brought about by a shortage of critical resources. Resources of every physical sort were plentiful.
The things that were short were confidence and credit mostly.
When I speak of major inflation as the result of dire economic conditions, I mean this within the context of the economy already being in a state close to actual collapse – and within this context, deflation WILL be very real, and already have happened, as likely as not.
But consider things being in this dire state, and the options available to the government at that time. With most of the people broke, and the ones who still have some money either afraid to spend it, or holding out for even lower prices before buying anything except groceries…………
Well, at that time the government will still have the option of printing that ten grand helicopter check, and those who are broke WILL spend it.
I have never contended that this would FIX the economy, but rather that it is a very likely last resort that will postpone the end -Assuming we do get into such dire economic troubles that we are belly to belly and nose to nose with collapse.
Now while I do not contend that such a deliberate grand scale inflation WILL fix the economy, and never have, there IS a possibility that it MIGHT allow the government to buy enough time to figure out and implement policies that prevent outright economic collapse.
And for what it is worth—In the last analysis, central banks, and the banking industry itself, are outgrowths of our political culture as much as our economic system.
We can never be sure what politicians will do at some future date, depending on the circumstances prevailing at that time.
It is possible that we will see money printed and handed out, directly to the public, even though there might be no actual real need for this to be done. If such a trend becomes established, Sky Daddy alone knows where it might end.
We are already in essence giving money away by the billions in the form of welfare for businesses and individuals, although it is not considered pc to talk this way, lol.
OFM- “We are already in essence giving money away by the billions in the form of welfare for businesses and individuals, although it is not considered pc to talk this way, lol.”
Well, you are right about that for sure. According to the St Louis Fed- the government transfer payments (social benefits) to individuals in 2016 Q2 = 2,024 B (or 2T$).
https://fred.stlouisfed.org/series/B087RC1Q027SBEA
This does not include any subsidies to companies. The entire budget is soon to be entitlements and interest on debt. I don’t see the government having too much available for infrastructure, energy innovation or other discretionary projects before too long.
Mr. Verwimp. Is ND still fitting the “curve”?
Hi shallow sand,
My curve changes depending upon the number of wells completed. The scenario below is fairly conservative with the number of new wells completed gradually increasing to 70 per month (56 per month until Feb 2017, then rising by 1 per month until April 2018, then remaining at 70 wells completed per month until 2041 when 32,000 Bakken/Three Forks wells have been completed in North Dakota (21,000 wells completed from Sept 2016 to August 2041). ERR is 7.6 Gb. No new peak just slow decline in this scenario. This would coincide with oil prices (WTI) remaining relatively low (under $90/b until 2020 at least).
This would coincide with oil prices (WTI) remaining relatively low (under $90/b until 2020 at least).
The NDIC Director gives a threshold of $60 for changes in drilling and completions. I would guess that your model above is more consistent with $70 than $90.
Hi Nick,
The model goes to 2040, oil prices will need to rise above $70/b as the new well EUR will decrease over time and wells will not be profitable to drill even at $80/b (in 2016$) after 2018. In the model the new well EUR falls from 326 kb in June 2017 to 236 Kb in June 2028. In 2015 it takes at least $80/b for the average new well to be profitable, lets assume all costs are unchanged in real terms from 2015 to 2028 for simplicity. The 38% lower output of the 2028 well will require higher oil prices in order to earn a reasonable rate of return (assumed to be a real rate of return of 7% for the $80/b 2015 estimate).
In fact the $90/b (in 2016$) estimate for the oil price needed in 2030 is likely to be too low rather than too high. The NDIC estimate is a short term estimate (for 2016 and 2017), my estimate is a long term estimate, very different (and much more speculative).
Thanks Dennis.
I wonder if your new well EUR decrease assumed is steep enough?
It is very difficult to model that, no doubt.
Do you have a breakdown of where the remaining wells will be located, maybe by county?
I am just guessing, so feel free to be critical of my guesswork. Maybe shale will be different from the steeper drops seen in most conventional fields.
Hi Shallow Sand,
The EUR decrease will depend on the rate that wells are drilled. The 1P reserves in the ND Bakken/Three Forks at the end of 2014 were about 5.5 Gb, typically 2P reserves are at least 50% higher, so 2P reserves would be 8.25 Gb. Also David Hughes analysis has about 7 to 8 Gb of oil from the Bakken and the USGS has a mean estimate for TRR of about 10 Gb for the ND Bakken Three Forks and their F95 estimate is about 8 Gb. So the model is based on these three independent estimates of URR. The number of wells in my model is similar to Hughes, most other models have estimated between 40,000(Mason) and 60,000(NDIC) total wells drilled in the ND Bakken/Three Forks.
I do not have county by county analysis, if prices remain under $60/b (WTI) long term (until 2025), this scenario will not be correct.
Proved Reserves for North Dakota at link below, 0.5 Gb in 2007 and 6.1 Gb in 2014, I have assumed most reserves added since 2007 have been Bakken/Three Forks reserves.
http://www.eia.gov/dnav/pet/hist/LeafHandler.ashx?n=PET&s=RCRR01SND_1&f=A
The EUR decrease is very easy to model I just put it in the spreadsheet. Do you have a suggested rate of decrease, just let me know and I can do it and post it in 5 minutes?
What kind of new well EUR decrease do you see in conventional fields as sweet spots become fully drilled? Note that if I doubled the drilling rate to 140 new wells per month, I would also double the rate that the new well EUR would decrease to 6% per year.
Dennis.
I am probably missing the boat here, but I will take another crack at it.
What I am referring to is individual well quality, which would then impact field wide production rates.
You assume completions of 70 wells per month from 4/18 through 2041.
How much less productive do you believe wells will be in 2030 than those of 2018, for example? Are you assuming a gradual decline of 3%
(For example, wells completed in 2017 EUR 300K BO, wells in 2018 EUR 291?). Note, these are my “made up numbers”.
My observation is that at some point, well quality will decrease dramatically. Absent a price spike, this, in turn, leads to greatly decreased drilling and completion activity.
How long this takes varies field to field and is dependent on many factors. The first drilling boom in our field lasted about 5 years from field discovery. Suddenly, IP’s dropped greatly, and drilling all but ceased. Production fell off a cliff. Only the advent of waterflooding and then price spikes reversed this, with waterflooding being a much greater factor.
I do not know enough to suggest an EUR decline rate, but I suspect once the best areas are drilled up, absent an EOR breakthrough, the large public companies with access to large amounts of capital will move on, leaving it to smaller firms to eke out the remaining barrels.
Over half of our field’s cumulative production occurred in the first six years, ours being 111 years from the discovery well.
Again, ours is but one small field. My guess, however, is that decline of the shale fields will not occur in a straight line, but will look more Hubbert curve like, as suggested by Bruno Verwimp.
My understanding is that “conventional” oil migrated from it’s source, and a small percentage was trapped in various domes and prevented from migrating to the surface and being dissipated. Those domes created pools of oil that could be sucked dry pretty efficiently, and when the metaphorical straw hit the bottom of the milkshake there was a very distinct regime change.
My understanding of most other mineral resources is that they’re much more widely distributed, and the boundaries between the resource and it’s surrounding are much blurrier, much more extended. Conventional oil goes from something to nothing: most resources go from some to 90%, then 80%, then 70%. And, the quantity of resource tends to expand dramatically when you step down slightly in terms of resource quality.
My understanding is also that LTO is source rock, unlike these secondary pools, and is more like most other resources than it is like conventional oil. Therefore,declines in resource quality are also likely to be different, and traditional oil industry paradigms and models, like Hubbert linearization, don’t apply.
Does that make sense?
Yes. I agree that makes sense.
I also made an error, more than half of the oil in the field I am most familiar with was produced in the first 6 years PRIOR to widespread water flooding. Actually, the first six years represent 28% of cumulative. Waterflooding greatly increased cumulative production.
I still guess that there will be a steep drop in EUR per well as time goes by, but I can see the difference between shale and conventional.
Hi shallow sands
I doubt most fields would be drilled at the rate in my scenario.
I also don’t think prices will remain low. It is pretty rare for an individual field to follow a Hubbert curve.
The analysis applies to large regions.
Hi shallow sand
I also did not consider economics in that scenario.
At some point before 2041 the economics won’t work without high oil prices.
I will revisit the problem when I have a chance.
Just curious if there is no economic crash and demand grows as it has for the past 5 years but supply is flat for the next 5 years. What seems like a good guess for oil prices in 2020?
I think over $100/b in 2016$.
Hi Shallow sands,
For the scenario to work, oil prices would need to rise to $72/b by Jan 2017 and then continue to rise to $130/b by Oct 2020 (all in 2016$), then oil prices would remain flat until 2041. This assumes real costs are unchanged.
Most think such a scenario is absurd. I think oil is very valuable and demand may drive oil prices to $130/b by 2020. I agree that it is unlikely that oil prices will remain high once the economy collapses which I expect between 2025 and 2035, with my best guess as 2030 for the start of Great Depression 2.
I wonder at what price oil would be costly enough that economic growth would grind to halt, but not so high that the cost alone would cause economic contraction?
Certainly this is a simplistic question, since there are so many other variables- like the supply of Nat Gas, Coal, Solar, etc, and the ability of the culture to adapt.
Nonetheless, we may be in a very choppy phase of ‘seeking equilibrium’, after about 150 yrs of rapid growth, largely built on back of cheap energy.
If so, I believe this will just a temporary phase prior to downsizing toward carrying capacity.
Hi Hickory,
Usually the economy either grows or contracts, rarely does it remain steady state.
I think $150/b in 2016$ is the most the World economy might tolerate without a severe contraction.
Hi shallow sand
On EUR decrease yes.
If EUR was 100 in 2019 it would be 97 in 2020, and every year after 97% of previous year if 840 new wells are completed each year.
Hi shallow sand
The rate of decrease in new well EUR was chosen so ERR was about 8 Gb for the assumed 70 new wells per month.
Clearly I don’t know how new well EUR will decrease. It may not decrease at all for many years and then drop suddenly. I have just assumed gradual decrease. Probably I am incorrect.
This datapoint is not what I expected. There was supposed to come decline, but only in a couple of months.
I’m on a beer drinking weekend with friends now. I will comment on this datapoint sunday evening mote profoundly.
Cheers!
Hi Verwimp,
The last datapoint seems to be off by 12 months (maybe Aug 2017 rather than August 2016?)
Cheers!
Hi Dennis,
A little confusing, but I think that might be the graph legend rather than a data point.
Hi econ
I believe you are correct. Thx.
Indeed: It’s the graph legend. Indeed: It’s confusing.
Anyway: ND Bakken data have had some noise earlier. This datapoint (Aug ’16) might be the beginning of a new trend; it might just as wel be some noise. The HL linearisation suggests this datapoint is well within the noise range we have experienced earlier. Time will tell.
The model suggests a severe drop in production at some point during the coming winter, before stabilising again at around 800,000 barrels per day next summer.
So far so good: total production in ND Bakken since the model was built 33 months ago ( 1.055 billion barrels) is only 0.7% higher than predicted with the model (1.048 billion barrels).
The drilling rig list shows no MIRU and the list only shows a few rigs with a start date last week. The oil price is on its highest level in a year and the number of active rigs seems to be declining (from 33 to 31 last week).
LOL
That’s complexity in a nutshell.
I did a joint post with Art Berman
8/10/2016
U.S. Storage Filling Up with Unaccounted-For Oil
http://crudeoilpeak.info/u-s-storage-filling-up-with-unaccounted-for-oil
From Matt and Art’s article above:
Matt, what does this mean and what are the implications beyond that and with regard to the price?
How is net imports estimated? If stocks being reported are high, then something is sneaking into those tanks. That something isn’t NGL because they evaporate. So it has to be imported oil.
On the other hand maybe NGL production includes a huge amount of molecules which can be put in a tank. Do NGL pay different royalties? ?
Misinformation by the media in Australia
27/9/2016
ABC TV a true believer in US shale oil supremacy
http://crudeoilpeak.info/australian-public-broadcaster-a-true-believer-in-us-shale-oil-supremacy
ABC not the only ones. Why must Bankers need their clients to loose more on pet tight rocks.
http://seekingalpha.com/news/3213944-oil-rally-may-thwarted-u-s-shale-rebound-credit-suisse-says?source=desktop_notifications
A short question. As US-production and OPEC-production seem to balance each other – where does the world stand as a whole? I’m sure the actual peak is still November 2015 (and I’m quite convinced it will be the definite historic production maximum). But what’s the trend for now and the next months? Upwards? Level? Downwards? Thank you all in advance for your kind response.
According to EIA STEO we are almost balanced for last quarter, but then supply exceeds demand again until late next year. Supply increases overall by about 1 mmbpd, mostly from OPEC. EIA don’t always get things right.
World Oil Production In Balance, U.S. Natural Gas Production Way Down
http://www.artberman.com/world-oil-production-in-balance-u-s-natural-gas-production-way-down/
The E&Ps in Bakken may be running out of good places to drill. September they opened 63 new permits but cancelled 28. So far this month they have opened 22 and cancelled 16. The number of permits opened is quite variable month to month (i.e. March and May were at 56 and 42 and then recovered) but I think the net number of open permits stayed almost level in September and may now start to decrease as drilled wells and cancellations exceed new applications. The number of DUCs also is now declining on a definite trend. There was a boost to drilling in Dunn County earlier this year, I think from a new pipeline or better infrastructure, but that impetus may be running out of steam, though with 12 it still has the most rigs of any county now, when for a long time it had one or two only.
Including all the producing wells, DUCs, permits and current drilling locations in the core area (a 50 km radius circle) gives a well density of about one per 120 acres now, which I think is near the limit some companies have given. There are still permits and wells completed outside this, but relatively few at the moment.
It looks like Verwimp’s model predicted the seasonal impact on production close to spot on again.
As you will recall, about 18 months ago I explained how the economic environment induced companies to drill but not complete wells, delay fracturing, completion and hook up for a while. I believe this “while” is now over, because the service industry has been shaken down and prices are probably as low as they will be, and OPEC is now starting to break. This means wells can be put on production expecting $50 to $65 per barrel WTI, with lower CAPEX, which allows a better return than completing a well in 2015 or 2016.
Thus, if the companies holding these Driilled Uncompelted wells think the wells will produce an average amount of oil, the DUC count should start dropping. Do remember some of these DUCs will have been identified as dogs usng the log suites, cuttings, and offset well information. These dogs will be held back.
So now we get to see whether the operators behave prudently, focus more towards the Permian basin Wolfberry and other low cost targets, or if they manage to get more financing from the usual mullets and get into a fight with OPEC.
What is clear is that service company charges and tangibles are at the bottom, so anybody who wants to be in the business in the USA does have to drill and complete to hold acreage.
Things aren’t nearly as clear in countries like Canada and Brazil. Operators in these high cost areas will have long term outlooks and may seek project financing from banks likely to be a bit scared. What we do know is their reaction time will be much slower than the “shale” drillers’ in the USA.
Regarding Venezuela, companies would have to very desperate, or managed by idiots, to risk anything at this time.
To give you a symbolic glimpse of how bad it is, a couple of days ago Brazil’s soccer team went to Venezuela to play a World Cup preliminary round, around minute 75 the power went out, and the crowd began chanting “it will fall, it will fall, this government will fall”. International media also reported the stadium didn’t have running water, and there was no toilet paper in the stalls. Brazil won 2-0.
Another development that’s bound to make things even worse is Maduro’s move to have the Supreme Court anoint him a defacto dictator. They ruled the National Assembly isn’t allowed to approve the 2017 state budget. Maduro went in public, led a crowd chanting coarse insults against the National Assembly president, and said he would approve the budget after he discussed it today with a “Pupular Assembly”. This is a turning point because Maduro is now crossing a threshold which hasn’t been crossed by previous dictators (at least in the prior 100 years). Things may not go smoothly for the communists. The National Assembly is now preparing a warning to all outside financing sources that any funds provided to Maduro will not be repaid because they haven’t been approved by a budget law, as provided for by the Venezuelan constitution.
Thing is, most oil investments require foreign financing of some sort, and this means companies and banks which do provide financing will either have to commit to backing a full blown dictatorship which is clearly run by a criminal Mafia, or hope their cooperation with the Maduro regime will be forgiven (something I don’t think will happen, because Venezuela doesn’t have much money, and repaying outlaw lenders won’t be a priority).
Where? Anybody can claim they said anything they want.
I do recall Fernando making exactly that argument with a little sketch of the math of decision points
Lower down I do not recall the hills group being secretly negative on oil for two years and then releasing it. I recall them being dramatic both ways, wrong when bullish and probably soon wrong when bearish
Perhaps I am too much of an old time right wing redneck myself, but I read a hell of a lot of history, including twentieth century history, and I take most of what Fernando says seriously, although I do not necessarily agree with him on all points.
He may not be ENTIRELY justified in calling the Maduro gang commies, but there are certainly plenty of commie genes in the family political tree, so to speak. Does anybody think he is not right in saying only fools would invest money in Venezuela, with the Maduro regime, right now?
He most definitely has commented about actual oil field operators planning their work so as to take advantage of recent tough times at the expense of service contractors who do the actual work. He said the oil field operators would hire drillers, etc, at rock bottom, because doing the work and delaying the completion of the wells drilled was good business strategy. In a very low interest rate scenario, this is a sure fire winner for oil field operators, assuming the price of oil DOES go up before the operator goes bankrupt.
There is nothing new about this strategy , it is often employed by business people in a position to utilize it. I hire big ( in relation to my economic shoe size ) jobs done when business is slow, and can generally negotiate a serious discount for this reason. I saved twenty percent on some bulldozer work over the last few months this way.
The dozer owner operator wanted the eighty percent, which still allows him a decent profit immediately.
I have reason to believe he really needed the money,
Just like most or all of the service contractors. Bringing in enough to keep good men on the payroll is important, and maintaining market share is important, even if you just barely break even or lose a little.
They say they are Marxists. They call themselves communists. They worship Castro. They are now saying elections aren’t a priority, they like to torture prisoners, etc.
The problem I see is simply that you don’t listen to the savagery they spout. They are savages. And they are communists.
By the way, there are reports of cannibalism in Maduro’s jails because prisoners are barely being fed. Also lots of reports of children dying due to poor Medicare care, and increasing numbers of babies being born with a missing piece of brain, caused by zika, which the dictatorship neither responds to nor cares to reveal is spreading. In a sense, Maduro is genocidal. But the USA left and Obama aren’t about to even discuss these matters. It’s an inconvenient truth at a time when Obama is in bed with Raúl Castro.
Ignoring elections and torturing prisoners is something the USA has also shown no aversion to. It seems to me that you’re rather selective in who you find intolerable for such behaviours. We’re you as hot and bothered to see Chile rid of Pinochet and Argentina rid Galtieri or is this a passion you posses for only left wing tortuters and tyrants? You perhaps seem like a bit of a fanatic to me.
https://en.m.wikipedia.org/wiki/List_of_authoritarian_regimes_supported_by_the_United_States
This is an oil discussion site, and I bring up the Venezuela case because I’m observing Venezuela being torn apart by the communists. What is taking place is getting close to genocide. And this is impacting Venezuela’s production, which will likely be even lower as Maduro tries to entrench a dictatorship which copies the Raúl Castro system.
Regarding whether this bunch is communist, here’s an overview of what has been going on:
https://panampost.com/enrique-standish/2013/11/29/venezuela-communist-finally/
For those who wish to read about this very real humanitarian crisis caused by this thuggish communist regime, please read this article in The Guardian
https://www.theguardian.com/world/2016/oct/19/venezuela-crisis-hospitals-shortages-barcelona-caracas?CMP=Share_iOSApp_Other
Finally, I’d like to point out to the readers that a regime like this is incredibly difficult to overthrow, especially when President Obama encourages it by being friendly with its mentor and boss, the Castro family dictatorship. Obama has simply had a really good knack for timing his moves very poorly, getting into dead end alleys, and causing wars and suffering he doesn’t know how to stop (Syria is an excellent example).
So where do we go from here? I wouldn’t expect the Venezuelan people to go quietly into Raúl Castro’s gulag. I’m seeing too many calls for resistance, people who were afraid of writing are now stating openly they will oppose the. Maduro dictatorship. And quite a few of the people I know are still working in the Venezuelan oilfields. This tells me we may see a surge in “accidents”, including explosions and oil spills.
And for those of you who worry mostly about the oil prices, this should have some of an impact. Forget the humanitarian issue, to most people the Venezuelans might as well be cardboard cutouts. But to me they aren’t.
Fernando,
I share your opinion about the Castro regime. Thanks for the links. God help Venezuela …… especially if the USA gets involved
At least you are trying to help those people.
It doesn’t look like anyone else is doing much.
South America has not been particularly stable for quite some time. Will this be contained to Venezuela?
Apology in advance to Ron/Dennis for getting off topic.
Put a lid on it Fernando.
Or else take this topic over to a non-petroleum thread. If you want to discuss which countries are in worse shape, I have Haiti for you to consider.
John S: thanks for the comment. Last night the regime made a move to stop the vote to kick off Maduro’s recall referendum.
I saw a message from one of the opposition parties which informed people should be ready to hit the streets.
And a response on Twitter suggesting they organize a resistance to stop traffic flow between the Orinoco fields and Maturin (the logistics center for oil field goods in Eastern Venezuela). It also suggested people be prepared to hit the streets and block roads on the eastern side of lake Maracaibo. That would paralyze the offshore fields as well as the old fields located near the lake.
If this type of street action takes place I expect a harsh regime response, but Venezuela could lose 100-200 kBOPD in November.
If this was specifically addressed to me then, no I don’t recall that, but I think I followed other sites like Rigzone and Upstream more then anyway. I don’t follow how it relates to my comment either way. If not addressed to me then please ignore.
As with the 70kbpd drop earlier in the year, next month may well see a ‘dead cat bounce’ in production i.e. a slight increase. Aside from simple reversion to the mean, one reason is that completion number being higher – many of those wells were completed right at the end of August, so most of their production will come in Sept.
There were a unusally high number of new wells put on production in August. Around 65 compared to around 45 in April-July. The initial production from those wells were quite poor, 210 barrels per day for the month. Historically it´s usually around 300 and during May and June it was 450 and 510. The average production days in August was 16,2 which is expected as the average well is put on production in the middle of the month. So the reason for the low number is not as you said because of the wells were put on production late in the month.
The number of rigs have not increased that much so it must mean that those extra wells comes from the drilled uncompleted backlog. But poor quality of the DUC wells cannot alone explain such a low number. It may be a combination of poor DUC well quality and that they are drilling more wells outside the core areas. What I can see is that around a third of the non confidential wells that came online in August were from counties outside of the top 4 counties, which is very high historically. The first month of data is usually a bit unreliable though. So we may see some improvements from those wells next month.
Of the 68 new wells in the data released last week, 3 were completed in September while 11 were confidential (i.e. with no completion date known, other than it is likely to be in August). 20 of the remaining 54 were completed on the 15th or before, while 34 were completed on the 16th or after. Check the graph here: http://imgur.com/a/1E1Ka – average well completed per day is 1.333 first half of the month and 2.125 second half of the month.
More wells in August is not unusual, it’s in line with seasonal variation.
Yes you are right that it has happend before that there has been more wells put on production in late summer. But I would say that a 50% increase is unusual.
I can only say that we have looked at different types of data then and drawn different conclusions out of them. Im not sure why they should differ.
I was just wondering if there is any reality to the claims in this article. If there were, shale drilling and fracking would become profitable at much lower oil prices.
Zipper Fracking:
“This new technique improved the economics of shale wells.
But in 2012, professors at Texas Tech University developed a twist on fracking, called “zipper fracking.” This is when operators drill two wells side by side. Once both wells are completed, they’re fracked at the same time.
As you can see in the diagram below, the fractures form a zipper pattern that cracks the rocks more deeply and efficiently than in a single well. The process allows both wells to produce more oil and gas. In the Barnett Shale in Texas, the zipper-fracked wells doubled the volume of a typical well.”
Stacked Laterals
“I based this diagram on oil producer and S&A Resource Report holding Laredo Petroleum’s actual work in the Permian Basin. According to the company, its 64 wells in four shale layers will recover 44 million barrels of oil. If it only targeted the top layer, it would recover just 12 million barrels of oil.
The stacked laterals increase its production by nearly fourfold.
With so many layers to drill, the company has over 3,500 well locations… and roughly 1.6 billion barrels of oil equivalent. That’s 35 years’ worth of drilling to do.”
http://dailyreckoning.com/2-new-drilling-techniques-that-will-shatter-us-oil-expectations/
Hi Gonefishing,
The article makes an obvious mistake. It assumes the 64 wells output will be matched by the 3500 locations left to drill. Typically the best locations are drilled first and then gradually EUR decreases as later wells are drilled. Hype no doubt.
the guy shows a table of big increases of production per drilling rig.
Rigs/drilling got way ahead of completions. They were standing down even before the price fall. Completions generated oil flow and / drilling rig denominator shrank, giving a big increase in production/rig.
It’s bogus. It only happened because of fracklog.
While we who takes an interest wait for an explanation to the Thermodynamic Oil collapse, let us have a look at how this measures up against recent work done by agencies that for decades has done and made public available studies of energy flows through countries/economies.
—
The author of the article (which Steve refers to) makes a lot of bold claims, but fails to support those with documentation or any real world examples.
http://cassandralegacy.blogspot.no/2016/07/some-reflections-on-twilight-of-oil-age_15.html
From the linked article;
”Since 2012, we have entered the last stage of this sad saga – when the OI began to use more energy (one should talk in fact of exergy) within its own productions chains than what it delivers to the GIW.”
Exergy; useful energy, available work.
https://en.wikipedia.org/wiki/Exergy
Stated a different way, the author claims EROEI went below 2 in 2012.
OI; Oil Industry
GIW; Globalised Industrial World
SANKEY DIAGRAMS
Sankey diagrams are ingenious invention to describe energy flows also within a society. It starts out with the gross flows and then splits it up into sub flows and losses and ends up with how much energy becomes available for categories of end consumers.
IEA has an interactive web page for Sankey diagrams (for 2014) where it is possible to view the energy flows by countries, economic entities, countries.
http://www.iea.org/Sankey/index.html
UK Department for Business, Energy & Industrial Strategy (UK DECC) produces some excellent Sankey diagrams for UK, and the link below leads to a web page that allows downloading (pdf format) and studying how these flows have developed through some of the most recent years.
https://www.gov.uk/government/collections/energy-flow-charts
The Flow chart from DECC for UK for 2015 shows indigenous oil supplies at 49.5 MTOE while energy industry use and distribution losses are 4.4 MTOE (this figure also includes losses from imports and exports), but assuming all the 4.4 MTOE is all from indigenous oil supplies results in a EROEI above 11.
Whatever oil field, producing country I have looked at describing energy flows (and those who produces Sankey charts are highly experienced in thermodynamics) I cannot find support for the claims that EROEI for oil (using oil companies as boundaries) dropped below 2 in 2012.
Rune,
According to that article, they show the EROI at 10/1 in 2012, not the 2/1 you stated in your comment.
Furthermore, there are gobs of data to back up their “bold” claims. The detailed work was done by The Hills Group. As I mentioned in a previous comment, a group of engineers led by Bedford Hill, spent over 10,000 hours on their Thermodynamic Oil Collapse & ETP model.
You can check their work at the hills group dot org.
Steve
No, you can’t check their work at the address you mentioned. There is reference to thermodynamic models and mathematical equations but no report, no references, no bibliography, no equations. I see 9 charts. Looks like weak tea to me I’m afraid. Perhaps Mr Hill would like to play the game of science and publish his 57 page report for peer review. As my math teacher used to say, ‘show me the work’.
”Since 2012, we have entered the last stage of this sad saga – when the OI began to use more energy (one should talk in fact of exergy) within its own productions chains than what it delivers to the GIW.”
That statement above in quotes is synonymous with saying EROEI does not exceed 2/1. If EROEI is 10/1 then that statement is not true.
Let’s assume global oil production is 80 million barrels a day. For that statement in quotes to be true then the OI is consuming in excess of 40 million barrels a day. That’s laughable.
Perhaps Mr Hill would like to defend his thesis.
Survivalist, exactly the article quoted from (link below) is saying that for each barrel of oil equivalent the oil companies use in their value chain they deliver a surplus of about 1 barrel of oil to society.
http://cassandralegacy.blogspot.no/2016/07/some-reflections-on-twilight-of-oil-age_15.html
There is another catch there. Oil companies normally use refined products in their value chain and refined products comes with a higher (per barrel) cost than crude oil.
So the economics of it becomes like this, the oil companies produces about 2 barrels of gross oil, sells both for $50/bo (now) and then turns around and buys 1 bo of refined product at say $100/b for their operations.
In other words, the economics of it does not add up either. Oil companies are in business to explore and produce oil to make a financial profit.
In other words the article linked to above is written by someone who has poor understandings of thermodynamics and NO understanding of petroleum economics.
Hi Rune and Survivalist,
I believe the EROEI is 10:1, but then when the exergy is considered (work performed by the oil in personal transport) only 2 units of exergy are available for every unit of energy invested (about a 20% efficiency is determined from the analysis).
So lets say society produced 29.2 Gb of oil in 2015 and the oil industry used 2.92 Gb of energy to produce, distribute and refine the oil (assuming EROEI of 10:1). The total work performed by the remaining 26.3 Gb of energy not used by the petroleum production system (PPS) would be about 5.8 Gb of work or 33.6 quadrillion BTU (assuming 5.8 million BTU per barrel.)
If we look at World Real GDP (2010 $) and World C+C consumption from 1981-2015 the GDP produced per barrel consumed increased at an annual rate of 1.75% per year (EIA and World Bank data). Oil is being used more efficiently.
The oil industry is not able to use energy at 100% efficiency.
Start out with looking at gross energy produced and consumed in the value chain.
Then apply (average) thermodynamic efficiencies along the chain to look at, call in net, EROEI, from what I have seen the EROEI changes little from using gross to net. This is for petroleum.
Hi Rune,
I agree with your analysis and it roughly coincides with the Hill estimate of an EROEI of 10:1.
My point was that the 2:1 estimate may be the work that ICE could perform if 20% efficiency is assumed from tank to wheel relative to the energy used in extracting, refining and distributing the gasoline or diesel to the car’s fuel tank.
This is based on a quick read of the Hill paper.
Steve,
”According to that article, they show the EROI at 10/1 in 2012, not the 2/1 you stated in your comment.”
In the article it says;
”Being well aware that EROIs for oil and gas combined had already passed below the minimum threshold of 10:1, I…”
Where in the article(s) does they show that EROI at 10/1 in 2012?
”Furthermore, there are gobs of data to back up their “bold” claims.”
Steve, provide links, references to these “gobs of data”! So far you have not provided anything to support your claims, while there are scores of data from institutions that documents otherwise.
Steve, there is no way to make an independent check of their work, ref also the comments by Survivalist.
Rune,
I purchased their 67 report with 30 charts and all the calculations at the end of the report. The Hills Group spent a lot of time working on the ETP model, so I gather they offer more detail in that report.
Furthermore, Louis Arnoux, Bedford Hill and an engineer from Ireland are working on a white paper on this thermodynamic oil collapse to the U.K. Royal Society.
Listen, I am not here trying to defend their work, but from what I have seen in their 67 page report gives me enough evidence of the situation. Sure, they could be off a bit on the timing, but not by decades… maybe a few years.
Rune… one more thing. After the Hills Group ran the software on their model, they sat on if for a few years before publishing, because they were quite shocked by the results. This is what Bedford explained to me during our 90 minute conversation.
Furthermore, Bedford sent the report to dozens of professors (most Thermodynamic PhD professors) and some private scientists, and none of them disagreed with the work and ramifications, even though some had questions regarding the inputs and etc. When Bedford asked them to stand behind the report, none would do so because it would be career suicide. Where have we heard this before????
steve
Steve,
All major oil companies have scores of people with MSc’s and PhDs that do extensive mass and heat/energy balances in their process departments.
Then add governmental bodies who do the same and often use Sankey diagrams to show the energy flows in a society.
Why has none of these come to the conclusions similar to the Thermodynamic Oil Collapse?
”When Bedford asked them to stand behind the report, none would do so because it would be career suicide.”
Yes, it surely would be, but for different reasons than you think.
”Listen, I am not here trying to defend their work, but from what I have seen in their 67 page report gives me enough evidence of the situation.”
You keep referring to this report, have bought and read it, and despite this is not able to explain in your own words (in a simple general way) the Thermodynamic Oil Collapse. What is the dynamics?
Globally, there must be millions of flowing oil and gas wells and thousands of discoveries/fields and some wells /fields have been shut down. There should be lots of examples to document that some/all of these were shut down due to the effects you keep referring to.
The evidence/arguments so far presented here from the real world does not support the report about the Thermodynamic Oil Collapse.
Hi Rune,
Unsure if you noticed it, or if it’s the same one being referred to, but Survivalist mentioned a Hill’s Group 65-page report available online.
I have downloaded it and am about to attempt a scan of it myself. (Thanks to The Hill’s Group.)
In the interim, and with regard to your questions to Steve/SRSrocco about it and this ‘thermodynamic oil collapse’, my formative/tentative sense about it in a nutshell, goes something like this:
– I have a master analogue tape reel of music that you want a copy of…
– I make an analogue copy and give it to you…
– Someone wants a copy of it but you can’t locate me for the master tape, so you make an analogue copy of your copy and give it to them…
– Someone else wants a copy of it, but they can’t locate either you or me, so the third one who has a copy makes an analogue copy for them…
After producing successive copies in this fashion down the line, eventually, there is going to be white noise for a copy, and at that point, what will it be worth to anyone if they want the original music?
Each copy of the tape reduces its value. Occam’s Razor.
As for supportive evidence in the real world, how about debt, itself? Or financial instrument pathology? ZIRP/NIRP? Syria? ISIL? Refugee floods? Venezuela? Obama appearing in Cuba?
Ghosts of Ladbroke Grove
http://peakoiltas.org/wp-content/uploads/2011/08/EROEI-oil-3.jpg
Tasmania!
probably the more significant item about oil now vs oil then, aka days of yore, would be the famous Jeffrey chart of how diesel and kerosene content (middle distillates) fall sharply at API 40 and up.
Andddd how what oil production we have has been at relentlessly increasing API.
Baker Hughes Rig count is out – US gas up 11, US oil up 4 – but Eagle Ford down 4 and Permian down 2. ND and offshore unchanged.
George,
Interesting how the gas rig numbers are starting to rise. No doubt in anticipation of large draws on the current stock pile. $3+ mcf must also be a pivot point. Not sure how the economics compare to the shale oil lot, but at least in the gas market, which is basically confined to the US, the price can/will rise to the point to keep the gas producers in business.
Also note Eagle Ford is nearly down to the Bakken rig count. 31/30
Cana Woodford, is actually higher than this time last year. I think this is mainly a gas play. Please correct me if I am wrong.
I think Cana Woodford is confusing as it covers STACK and SCOOP as well, which are new and growing, while the actual Cana Woodford play is probably declining. According to the Excel break down by basin these all count as oil rigs. I think there may be some question about that though (e.g. oil versus condensate) which has been discussed here before.
Note in EF oil rigs are now 28, below Bakken, with 3 gas. The drop was all on the oil side. The lowest oil was 26 oil in May and July.
George,
Thanks for pointing out about the EF and dropping oil rigs, with a pick up in gas drilling. Make EF oil prospects look even worse.
The reason I thought Cana Woodford was gas. I remember a Florida gas company had bought into Cana Woodford wells as a hedge for their gas supply contracts. But I suppose it must be a 50-50 call on whether it is call an oil or gas well.
Related to SCOOP/ STACK and another nail in the Bakken coffin:
“OKLAHOMA CITY (Bloomberg) — Don’t expect a major ramp-up of oil production in Oklahoma’s hot new shale plays any time soon, even as companies invest billions of dollars in the region, said Newfield Exploration Co.’s CEO.
“Producers need more exploration time and a higher oil price before they can begin accelerating drilling in the SCOOP and STACK oil formations, Lee Boothby said in an interview in Oklahoma City Thursday. Newfield may eventually sell its Bakken shale assets in North Dakota as one way of financing development, he said.
“Crude prices hovering around $50 aren’t high enough for explorers to start taking on the kind of debt they’d need to significantly speed up, Boothby said. It may be a year or two before companies learn enough about the SCOOP and STACK’s underground geology to gear up production.”
http://www.worldoil.com/news/2016/10/14/newfield-ceo-sees-cautious-approach-on-huge-oklahoma-oil-find
Toolpush,
There is this spectre haunting me: Whenever I see something about US NG production what pops up in my mind is “The US is exporting LNG. The US is exporting LNG. The US…”
How is it going to play out that US NG production isn’t growing much if at all, and the global picture is that “Australia and the US are going to take over the world LNG market”? There certainly is a market out there but when is US NG production going to mobilize for going after it?
Time for more port except that I’ve already had it. What’s left–food?
Syn,
I know what you are saying. The massive amount of planned LNG exports, certainly has a few problems ahead of it.
1/The numbers being thrown around are 10 bcf/day in the next couple of years. The problem is those plants need pipelines to connect to the gas fields. At the rate FERC is approving these pipelines, the new plants are going to be short on gas.
2/The NE are refusing any pipelines, and will end up importing LNG from 3rd countries, balancing any exports from the La and Tx.
3/If the US gas fields require too high a price to increase production, then eventually the LNG will price itself out of the world market.
If the Marcellus and Utica can’t get enough pipelines going south connected in time, Marcellus gas will remain cheap, while Haynesville et al, will be required supply LNG and Mexico. That may take a higher price than people were counting on when planning their LNG plants.
As for US gas production currently falling. I feel it has more to do with a couple of cold years where stocks in storage were drawn down to very low levels, and the US nat gas industry did an excellent job of refilling the depleted supplies. This was followed by a very warm winter, very high stock levels, and resultant low prices. This is the reason for the current falling production.
The test will be how quickly and at what price they can ramp up again. If they succeed, then the discussion is back to pipelines again. I feel we should have a good idea of how things are going by mid summer next year, on condition that this winter is “normal” and stocks get pulled down fairly hard.
Enjoy your port. I hope it is a well aged Tawny.
Toolpush,
Thanks for the reply. Those are the things that have me wondering, all right, but I don’t come across much attention being paid to them.
The Northeast, especially, puzzles me. They know what winter is yet they object to the pipelines they need. I understand the objection in principle but there’s the immediate requirement to keep warm. Somewhere back there was importing coal from Colombia last winter, and not for the first time.
I’m quite broad-minded about port: Tawny and LBV-character only. I prefer ten-year tawny to older; 20-year reminds me of sherry and I leave sherry to those who like it.
Synapsid/Push
Just came across something I’ve been searching for awhile … precise, detailed data on just what fuels are being used to generate New England’s juice.
Fascinating reading … chilling, ya might say.
Site is ‘ISO Express’, ‘Daily Generation By Fuel Type’ (found down on the right aways), and clicking on desired time frame (2014/15/16, etc) gives every single days’ total demand in megawat hours and how much each of the eight sources provided that day.
Current up to last week.
The sources include coal, gas, oil, refuse, hydro, nuclear, wind, solar.
The folks on this site who do charts and graphs would have a field day with the data, but my quick scanning of the winter/summer numbers indicate those folks better pray for Miami type temperatures until they get their act together.
(Push, my mobile device prevents me from linking, but that ISO Express site provides a TON of interesting info).
Coffee,
Thanks for the info, but I can’t seem to open the page. Maybe geo locked, but I feel a lot of Marcellus gas will end up be transported out of the region, by wire rather than pipeline, unless there is an upset in the election next month of course.
Perhaps
https://www.iso-ne.com/isoexpress/web/charts
Perhaps https://www.iso-ne.com/isoexpress/web/charts
Kinda reminds one of Ross Perot’s favorite line … something like “a giant sucking sound”
https://www.iso-ne.com/isoexpress/web/charts
Remember Ross Perot’s ” giant sucking sound” ?
Some help>
http://isonewswire.com/updates/2016/6/30/survey-says-add-more-data-to-default-iso-express-dashboard.html
https://www.misoenergy.org/MarketsOperations/Prices/Pages/Prices.aspx
Long timber
Thanks for the link.
On your first link, by tapping on/clicking ISO Express at top of screen brings up the page where, scrolling down a bit, the Daily Generation by Fuel choice appears.
It is by choosing that, that single page Excel spreadsheets show specific fuel use for each if the 365 days in the calendar year.
While the charts you posted show today’s high natgas useage (pipelines, anyone?), on cold days in January/February, the coal has equaled, the oil has doubled the amount put forth by gas as the natgas was diverted for heating.
No wonder those folks are paying a fortune for electric.
This next spring, the large Brayton Point coal plant is shutting down making a bad situation even worse for the following winter.
Note that there is Zero Coal being offered up for Bid. Is coal just priced out of the Market at this period in time and the Baseload not traded??
Long timber
I am not sure how all this works and am still trying to find my way. However, my understanding is that natgas plants, especially the new Combined Cycle Gas Turbine plants, which can be ramped up to 100% nameplate capacity in ten minutes (see the blue line up above in your graph. That denotes enormous change in output in a very short timeframe) simply makes coal-fired uneconomical as there is a several day ramp up period before producing all out.
I don’t know, but everything I read points unequivocally to CCGT plants being the way to go.
Even the New England folks seem to agree as they keep building more of ’em.
Just gotta get the fuel to them.
Wonder if anyone remembers this, but when Gore was gunning for the White House, during that time he was doing photo-ops on Maryland rivers during a drought, he also petitioned for a release of oil from the national reserves for the poor New Englanders looking forward to a harsh winter.
It so happened that the oil was released, loaded onto the tankers, only to end up at the highest bidder’s ports in various parts of Europe. Not one drop actually made it to New England!
That’s exactly the scenario we can expect if the XL pipeline gets built – all that oil from Canada will go … somewhere else!
The XL pipeline oil should displace Venezuelan crude being marketed by PDVSA and its multinational allies like Chevron. The profits will end up being used to help the Maduro dictatorship survive.
The market dynamics are well known to Obama. But Obama’s focus seems to be getting involved in Middle East quagmires and helping Latin American communist dictators.
I have a new post on North Dakota as well, here.
thankyou again !
Hi,
Here are some updates from me. 2008 has reversed the trend of decreasing GOR and saw a big increase in August. 2007 also increased alot. 2013 was the only year with decreasing GOR, the rest continued to increase. So in general, they don´t seem to hold back any production.
Here is the production graph. I zoomed out a little so that 2015 would be visible. It’s very hard to see now though as it´s only one data point up to the left, right now on top of the 2014 curve. 2014 saw a big drop in August and is now together with 2012, 2009 and 2013 noticeably bellow 2010, 2011 and 2008. 2013 dropped a bit faster than 2012 and is very slighty bellow the 2012 curve. 2008 was able to hold production steady and production for 2009 and 2010 decreased slightly.
Soooooo odd only one year was refracked.
Do you have water cut history as well?
George yes here it is. As you can see, water cut is increasing very slowly over time. I don´t think shale oil fields have water drive the same way as conventional fields. So not sure how to interpret the graph in that case. Why the curves appears to be grouped into 2007-2009 and 2010- is a bit of a mystery. Three fork wells generally produce a bit more water that Middle bakken wells. But the Middle bakken/Three fork ratio stayed roughly constant from 2009-2011. So higher Three forks well ratio is not the reason. I think it has to do with completion technique. Longer cracks would reach deeper into the lower parts of Three forks where the water content should be higher. The cap between Middle bakken and Three forks is not very thick compared to how far the cracks reach. So Middle bakken wells drain at least some oil from Three forks and the other way around.
The gas to oil ratio is getting fairly high. This means the cash flow from gas should be included in individual well económics.
The gas capture rate from the Bakken is now about 90% and includes a fair amount of NGLs.
I believe the bulk of it is being sent to the Gulf, some by way of Colorado which is pulling in the Niobrara’s output also.
I would expect North Dakota gas to end up in Wisconsin, Ilinois, etc. But I don’t know the pipeline layouts.
I’m still wondering why they aren’t capturing 95 to 98 % of the gas? They should have equipment to use produced gas to fuel their facilities. And given the reservoir they produce, keeping wellhead and casing head pressure at 100+ psi shouldn’t impact production an appreciable amount.
Fernando
Along with the early, big dropoff in oil output per well, the gas production would also decline rapidly after a few months.
Lack of processing plants and gathering lines made gas capture pretty uneconomical.
That has obviously changed, but I imagine the more outlying wells are still flaring off.
Fernando, if you are interested/receptive, I’d like to post some brief snippets from a well report that Statoil drilled and get your – from afar – appraisal.
The mud weight was dramatically increased, and the pumps altered to boost pressure in apparent efforts at well control.
Still, the lateral was halted 1,000′ short of original plans due, seemingly, to extraordinary induced formation pressure from a nearby frac’d well.
Interested in reading it?
Sure. Go ahead and place it here or somewhere else.
By the way, in most jurisdictions gas isn’t flared simply because the operator didn’t install enough gathering capacity. I’ve seen developments where the well is flowed multiphase to a satellite, the gas is separated and compressed and sent to a gas plant.
And if the gas gathering system capacity is choked we simply backoff from drilling wells for a few months to allow the gas rate to drop. Or we drill and complete and put them on choke for a few months. It just seems to me that ND isn’t too keen on the enviromental issues.
Fernando
Condensed summary …
Statoil completed a well, permit #26158, and immediately shut it in for several months after getting a 24 hr IP of 3,700 BO.
A second well, permit #29564, was drilled 4 months later and purposefully drilled close to the first well. (This is clearly seen on the Gis map T152 99 Section 1)
The well of interest, the second one, was having no problems, with ROP of 350’/450′ per hour till April 4, at 20,411′ MD.
Over the next ten calendar days, only 400′ were made and the well was declared done, a full 1,200′ short of original plan.
From the file report …
April 4 Mud weight increased to 12ppg
SCIP still increased
Mud weight increased to 14.2 ppg
April 8 ROP 35’/hr
Pump pressure near 5,000 psi. Using half pump strokes.
At 20,487′ MD, pump liners changed from 5.5″ to 5″ to increase pressure additional 1,500 psi.
Mud weight now 14.5 ppg.
April 11, drilling resumed, ROP 50’/hr.
April 14, At 20,823′ MD, drilling halted and Called done, 1,225′ short of planned TMD.
At 18,200′ MD, ceramic proppant from the other well’s frac appeared in the returns, and continued to show throughout.
Potentially huge implications from all the above is that fracs induce elevated formation pressure in adjacent areas for extended periods of time.
Thoughts?
You wrote the second well was drilled close to the first well, rán into a high pressure environment, weighted up. The well had intercepted a fracture plane at 18,200 md. So they drilled into an environment already fractured by well 1. Well 1 barely produced, so…
They simply intercepted fractures from the other well. The fact that pressures were high means the frac fluids didn’t bleed off. This tells you the formation being drilled was very tight, and that’s expected.
So thus far we didn’t figure out much other than well 2 was drilled too close to well 1.
I suppose you do realize that if well 1 had been blown down to recover frac fluids the pressure would be bled off and well 2 may have had lost returns if the fractures were good enough to convey well 1’s flowing bottom hole pressure? This may have been followed by a kick if they didn’t keep their annulus full.
I don’t think this really helps you, but it’s hard to figure out more without more info.
Fernando
Your reply actually did help, and your analysis is correct based on the info provided.
I do not wish to make a hodgepodge of this, nor go on to great lengths, but …
The lateral distance between wells was about 700′ and Statoil deliberately chose this.
The first, earlier well WAS bled off with the near 4,000 bo IP and an additional 6,000 bbl that calendar month’s production.
Then, deliberately shut in.
Along comes well #2, not only 700′ away, but in a different formation – the Middle Bakken. (The first well was Three Forks, bout 100′ deeper).
This second well has flowed over 1,000 bbld for 110 days, and counting, along with a quarter Bcf gas.
The main issue of interest to me, and possibly others, is to gain a better understanding of what is going on 2 miles down, most specifically the influence of elevated formation pressures brought about by these massive fracs when a good deal of the water does not immediately resurface during the week or so of flow back (immediately post frac).
This area of interest directly ties in with the current practice of drilling/completing two or three wells at a time per pad, moving on, and repeating the process.
Some way or another, there seems to be reasons these more recent wells are producing so much more prolifically than earlier wells, notwithstanding the recent advances and high grading of development.
It would appear that the interaction between these two Statoil wells showed clear evidence of elevated, induced formation pressure via earlier frac’ing and the high output from the second well will be repeatable if these dynamics are understood and controlled.
This is a good answer, Fernando, and there is really nothing more to figure out. “Induced” energy from a frac is artificial energy and it dissipates; over time, by moving to lower pressure sinks in nearby wells, by going up, out, sideways and down (100 feet of vertical separation in a brittle, naturally fractured mudstone is nothing). Frac energy can move like a pressure wave, similar to a water flood front, and temporarily increase production from wells ahead of the pressure “wave.” Induced frac energy does not create new “formation” energy in shale, it does not magically increase natural bottom hole pressure. In areas where too many shale oil laterals are drilled too close together (just about all sweet spots are like that) communication exists between laterals. This ‘halo’ phenomena is short lived and merely speeds up the “rate” of drainage in nearby wells. It does not increase ultimate UR.
Folks in the oil business familiar with frac radiuses, the effect of well communciation (often very negative) and who understand, for instance, how water flooding works, don’t think too much of this shale oil halo hubbub. In the 1990’s it was common for horizontal Austin Chalk wells drilled using water, under a mud cap, with no returns, to see other wells 3000 feet away making 1000 BOPD go to 100% water overnight. I have yet to see an SPE paper about “halo” effects in shale, though admittedly I have not looked very hard. Its much to do about nada.
I guess a fracture from a well in the Three Forks cut into the Middle Bakken? You would need to have an idea of the geology right at the spot where well 2 started seeing proppant. But because these are horizontal wells you wouldn’t know for sure.
Did they drill any other wells offset to these two wells?
Just prior to drilling well #2 (#29564), at least two wells several hundred feet to the west – and running parralel – were fractured, briefly produced, then also shut in.
These other two wells – permits #’s 25856 and 25859 have produced about a thousand barrels/day in a few months online with almost as much produced water.
Seems like a lot of communication is happening amongst these wells.
How it affects hydrocarbon output remains to be seen, I guess.
FreddyW,
Thanks for sharing your work and charts.
I am a big fan!
Thank you Rune, that was very kind of you. You do a very good job yourself with you webpage. Keep up the good work!
Weather about to arrive in NoDak.
http://www.bloomberg.com/news/articles/2016-10-14/petrobras-lowers-fuel-prices-and-unveils-new-pricing-policy
Quite a lot of convoluted thinking in this.
Eagle Ford Oil production is falling as fast as it rose
Eagle Ford’s oil production has risen up quickly since 2010 all the way through to 2015 with the production peaking at 1.7 million BBL/D. In March of 2015, oil production in Eagle Ford started to drop but it wasn’t until this year that the oil production dropped rapidly in an 8 month period from 1.4 million BBL/D to 1 million BBL/D.
This is a reflection of the significant decrease in oil rig activity. There has been an 82% decrease in the number of active rigs from 183 rigs to 33 rigs in the last year, marking a drastic change in the trend of oil rig activity in Eagle Ford.
Deals in the Eagle Ford have been fetching more modest valuations, especially when compared to its regional counterpart, the Permian Basin. The average (US$) value per BOE/D for deals with at least 1,000 boe/d in production is in the $40,000 range compared to the $160,000 range of Permian Basin’s average (US$) value per BOE/D. In two years’ time, deals from Permian Basin have captured $17.4 billion over the Eagle Ford area. Source: BOE Report M&A Database
Hi Ron
Enno Peters estimates july 2016 EF output at 1.2 Mb/d when data is complete. I agree with his estimate. Completions in the EF have continued at July levels through September so output will fall more slowly if the completion rate does not fall further.
If you have a rail break, snap, the rail line is closed. Can’t run a train, a broken rail will derail the train, so you have to call in a crew to open the line. A maintenance crew will arrive in a truck, have a rail saw, cut the rail in two places, add a new length of rail to fill the distance between the two cuts, the thermite handlers will show up and weld the piece of rail with some heat, friend the rail smooth, voilà, rail traffic can resume.
The barley in the railcars built for grain are on the way to the malting plant in Milwaukee.
The energy expended to fix the broken rail is tiny, the energy required to make it all go is useless if the system is broke down and can’t move, and it is on the move all of the time.
If no one is there who can fix it, it will remain broken. Everything comes to a screeching halt.
A rail saw is a heavy duty machine powered by an engine that needs gas for fuel so it can cut the rail with ease, with some cutting oil, the job gets done.
With no oil, everything changes.
No problem to power the rail saw with bio Oil, it takes only a few liters. A few square foot of oil seed will do the job. It’s done now and here in Germany for woodcutting by law, to prevent pollution from mineral oil in the wood. After all, it are only a few gallons per work day.
And carry it with an electric car, or as in pioneer times a horse car or a rail car via the left rail line to the broken part.
No problem at all – but there has to be a working company to pay the repair crews to stay on hold.
There even will be mineral oil for special purpose in 100 or 200 years, just milk all the old wells once a week.
As there still exist many optimistic views about Bakken production, I want to show my more pessimistic view documented by below chart. The number of spuds did beautifully predict the rise in production at a time lag of around six months. However, it predicts now a more accelerating fall of production towards 0.4 mbbl/d by mid next year – if spuds stay low.
Spuds came down again to the thirties, although permits did rise in August. If the oil price does not rise significantly, there is litte chance that the production slump will be stopped.
I like that graph, shows how fast things can change. That’s the problem, a change in investment in either direction can bring the future oil production up or down. It looks down now, that is for sure. But as we have seen that a few years of intensive investment can cause a large surge in production.
The possible range of production over the next ten years is very wide. It will depend more on societal demand rather than nature at this point. Nature will determine the farther future.
Hope for the best, prepare for the worst. Probably get something in between. Sometimes we get things we have not foreseen at all. Then, who knows?
GoneFishing,
Thanks for your reply.
At the end we have to survive in a changing environment. It is in my view very important to grasp the real parameters – and to be honest to ourselves – in order to make the right decisions.
Hi Heinrich,
The number of spuds can change very quickly and re likely to do so if oil prices rise. Also there are a lot of DUCs which can be completed.
Dennis,
If spuds – and it is a big if – go up, then for sure production will increase. However, spuds at around thirty per month mean only 0.4 mill bbl per day can be sustained over the long term.
I am not so sure about a short term oil price recovery. Russia brings some production online this month (Filanovsky near the Caspian Sea and also in the Far East). Then the Kashagan project should start at October 23d with 0.35 mill b/d and peak in 2018 at 1.2 mill b/d. In addition Kasachtan will start up new production capacity of 0.8 mill b/d at the Tengiz field in 2018. Iran and Iraq have already announced the intention to produce 5 mill b/d in the near future.
Last not least Libya has announced that it will restart 0.9 mill b/d within the next four weeks??
This alone adds up to nearly 5 mill b/d of new capacity within the next two years. As this production incease will not materialize for any project, it is simply too attractive for Mideast and Russian producers to sell oil at USD 50 per barrel.
And if EV will come very soon, it is probably better to cash in the oil revenue now, rather than to wait until the assets are worthless. This has been also a big change on the assessment of oil reserves due to the consistent media storm against fossil fuels.
In its drilling report the EIA http://www.eia.gov/petroleum/drilling/#tabs-summary-3 presents for the first time also an excellent summary about DUC wells. From this report, I can see the Marcellus/Utica DUC wells stand at around 700 , which is already a significant reduction from the peak.
Those new supplies will roughly offset falling output from depletion. If demand also remains flat, then oil prices may not rise.
Eventually EVs might cut demand, but not significantly at low oil prices.
Newfield CEO sees cautious approach on ‘huge’ Oklahoma oil find
holy smokes there is oil in okla who would have guessed that? oh that’s right it was me?
http://www.worldoil.com/news/2016/10/14/newfield-ceo-sees-cautious-approach-on-huge-oklahoma-oil-find
actually a good article and speaks to how the future may shape up. yes much higher prices are required. Once a well is drilled and if you can not borrow new money, you must wait to get that money back to drill a new well. That speaks to higher prices in the future or much slower development.
This is quite interesting (and was supposed to go against the Toolpush comment below):
Why Are Oil Co’s Q3 Earnings Expectations So Bad? (XLE, XOM):
http://www.investopedia.com/news/why-are-oil-cos-q3-earnings-expectations-so-bad-xle-xom/
“Third quarter earnings season has begun, and analysts remain concerned that results could prove lackluster. Just this week HSBC, an investment bank, said in a note to clients that it was issuing a “red alert” for U.S. stocks with a “very high” chance of severe fall. With oil prices up 7% year-to-date (YTD) from the third quarter 2015 (3Q15), why are analysts’ earning expectations so poor?”
“Expectations of continuing financial difficulties are surprising given the recovery in oil prices combined with aggressive cost cutting and reduced capital investment spending. Taking a closer look at analysts’ expectations reveals some diverging outlooks for integrated versus purely upstream companies. Analysts expect integrated companies to perform marginally better in terms of revenue growth and operating income. This means the earnings per share (EPS) reductions likely come from items lower down the income statement like higher expected non-operating expenses as well as higher taxes and elevated interest expenses.”
I think in September and April US companies have to reassess their oil reserves asset value based on average prices for the past six months which will be interesting to see.
Before I retired we did it once a year. I didn’t know that requirement was increased to TWICE a year. Which by the way impacts non USA companies if they sell ADRs in the USA. The bureaucratic demands are mind boggling.
I found a link to the eTP report at PO.com
http://tinyurl.com/jmsgweo
I hope all those interested in it have a chance to enjoy it.
Was this what you and others were looking for? Anyway, thanks for sharing. Feel free to lend your thoughts after you’ve read it.
Yes Sir, it is indeed a link to what has become a big topic, with so many inches of type, in the comments section of this fine blog. It’s not hard to pull the wool over my eyes with math so I’m hoping that others who are smarter than me give it a treatment.
Buyllshit alert!!
Hill says oil will be unaffordable by 2030. Alert! Alert! Today, a family of 4 is spending $200 – $400 per month on smart phones [including the phone cost + taxes] – (Note: the foregoing EXCLUDES the huge increase in auto insurance due to texting accidents). When push comes to shove, which is more important – gas to get to work or a cell phone to check news, friends, etc. [and, I know – work related]?? If you cannot drive to work to do your work [construction, sales, etc], you are still going to NEED your cell phones [so your kids can exchange the wisdom of the world – porn ( cancel that, they are sharing homework)].
And I’d like to ad I see no shortage of people sitting down to enjoy an 8 dollar muffin and latte. When these discretionary dollars are spent on higher priced fuel and not on over priced and non essential consumer products and services it’ll result in the unemployment of people who manufacture and retail non essential consumer products and services, which will result in them demanding less fuel themselves since they’ll have less money with which to buy it, which may result in a decreased demand for high priced oil and then perhaps soon after a lower price. I’m not entirely sure what the future will hold specifically but I am rather certain that whatever it is it’ll be characterized by volatility.
I don’t think the people with money will allow oil prices to eat into their toys and extravagances. There will be a big push to convert to EV’s. Also the tech companies will not want to be shut out by consumers not wanting to buy their electronic wonders. They will probably start to produce cars themselves that don’t run on oil products.
Wait, that is already happening. Talk about planning ahead.
Right! I forgot about Apple. Oops – they just announced that they will not be in the car business.
No such thing as unaffordable. If it is required, and it is, price will not be permitted to stop it.
This is why God gave us subsidies.
Yeah, it’s not a question of affordability, it’s a question of competitiveness.
Oil above $80 can’t compete with EVs.
From a quick look the key to their calculation is equation 7 (below). This really gives how much energy is needed to maintain the temperature in the reservoir when oil and water has been extracted. They seem to assume this has to come from the topsides oil industry (here I might have missed something, but they assume a large amount does). In fact almost all such energy comes from the earth. In a water flood there is pumping energy, but all the heat to warm the water comes from the surrounding rocks. In aquifer flood almost all the energy is free. In primary pressure drive the oil can continually evolve gas as it is kept hot from the surroundings. So it comes down to the control volumes they have used, which are not closed as they are assuming.
In addition their EROI numbers aren’t referenced that I could find, but I think they are making a common mistake which is that EROI for a given year applies to all oil produced that year, rather than just the incremental new production coming on stream.
There are some other ig assumptions as well – no associated gas considered, ignore 1980 to 1985 as ‘anomolous’?
I also lost a bit of confidence reading Darsie rather than Darcy, which is a pretty well known name for reservoir engineers I’d have thought.
Hi George,
Thanks. It does seem that the entire petroleum industry needs to be considered (this would include oil and natural gas) at minimum.
There is also no particular reason that oil has to remain and energy source, as long as other energy sources (natural gas, coal, hydro, nuclear, wind, and solar) are available to provide any needed energy inputs for lower EROEI oil from oil sands or LTO and are available at low cost relative to price of oil, there is not a problem.
EROEI is only an issue when all energy produced and consumed by society is considered, drawing boundries around a single industry might be interesting in theory, but will not influence the price of oil, it is the financial cost to produce the oil that will determine the price of oil in the long run.
Hi Dennis,
You run into other problems– including depletion– when oil has to be substituted for such primary, and less mobile, sources as coal and gas. Is oil more concentrated an energy form than either?
If my body is the global economic engine and I run out of fruit to eat, then I have to switch to something else. Fruit’s pretty high in calories so what do I switch to? Vegetables? If so, what happens to my energy level?
Downthread, Rune speaks of Varg being shut down at an EROEI of 17-18, which is still pretty high. Should that be telling us something?
What’s the EROEI for roadway infrastructure, incidentally, since many here like to talk about EV’s?
”Downthread, Rune speaks of Varg being shut down at an EROEI of 17-18, which is still pretty high. Should that be telling us something?”
That energy sources with high operating EROEI are shut down for financial reasons is something I believed would be worth exploring.
I agree and like the idea of exploring things holistically and systemically.
Incidentally, Steve St. Angelo (SRSrocco) briefly mentions you in James Howard Kunstler’s most recent podcast.
I agree on the systemic and holistic approach.
Let us try to view these things through a different lens.
Money (marker capital) is a claim on energy (real capital).
Whatever activity/service we buy, some amount of energy is spent.
Money serves accounting purposes, energy (real capital) are what we spend.
You have a link to subject JHK podcast.
Yes, it is possible that The Oil Drum had an article or more that spoke about money-as-energy-credits. Perhaps you authored or co-authored it?
I guess ballooning debt could be considered as the manifestation of economic momentum just at, or immediately after, the cliff of peak oil/energy, where energy, relatively-suddenly, falls away and, as a result, claims on it suddenly get pulled harder forward in time (because there’s less energy to service the debts).
On the podcast, you’re mentioned briefly in passing. I’m unsure where exactly in the recording it is, but here it is.
Hi Rune,
A firm in a capitalist economy is concerned with financial profit and not EROEI. It would be wise for the high EROEI fields that are not currently profitable to be temporarily abandoned with minimal maintenance to allow the platform to be brought online later (if this is in fact possible at relatively low cost).
Oil prices will rise by 2019 to levels that are likely to make such fields profitable.
You would probably have better ideas because you are much more knowledgable about Norway’s production than me.
Maybe there is no solution. I agree that the question is worth exploring.
Ref also my reply to Caelan.
It is difficult to find a perfect system and energy is embedded in the financial matrix.
When a field is shut down it becomes plugged and abandoned and the production installation is removed. It becomes very hard (as in expensive) to resume production at a later stage, though there are examples of companies trying to do so.
To stick to the Volve case and the numbers presented are crude and simplistic, but it illustrates to me several interesting things.
If the oil price was $80/ it could have operated with an EROEI for society above 5.
If the oil price was $160/b it could have operated with an EROEI for society above 3.
If the oil price was $320/b it could have operated with an EROEI for society close to 2.
Thanks Rune,
Very interesting. Based on research by Hall et al, this suggests oil prices above $160/b might not be sustainable unless there is surplus energy from other energy sources such as coal, nuclear, natural gas, wind, solar, hydro, and geothermal that could subsidize the oil sector.
If energy is scarce this might not make sense, but until we electrify the transportation system (or switch most of it to non-petroleum energy sources), we may continue to use petroleum as efficiently as possible until such a transition is complete (possibly by 2060).
It is possible (in theory) to produce all the surplus energy for a society based on (operational) EROEI sources at say 3 (oil price at $160/b).
In special cases even lower as oil is strategic in nature.
The thing is at $160/b consumers (private and public) would significantly reduce their consumption with the consequences that entails.
Hi Rune,
Yes $160/b would likely be very disruptive to the economy, but in real terms as the economy grows, it could be handled from an financial perspective. There would be less oil purchased so the entire bill might be less than 5% of total World GDP by 2020.
There would be a move to more efficient vehicles ( in the case of oil) and as we move to wind and solar there will be fewer thermal losses and in general as energy becomes scarce it will be used more efficiently.
This is not meant to imply such a transition will be easy to accomplish. The difficulties that will be encountered are the reason I expect an economic crisis by 2030, possibly as early as 2025.
“If the oil price was $80/[b] it could have operated with an EROEI for society above 5.
If the oil price was $160/b it could have operated with an EROEI for society above 3.
If the oil price was $320/b it could have operated with an EROEI for society close to 2.” ~ Rune Likvern
Perhaps it’s a good thing you didn’t type that out in bold, otherwise it might have drawn too much attention to those questioning what BW Hill/The Hills Group may have been, at least in part, suggesting (oil EROEI ‘peg’ to price?).
And do you really want that kind of headache. ‘u^
Hi Caelan,
The Hill Group argues that the price of oil will go down rather than up as EROEI decreases, Rune is arguing that if prices do not increase the low EROEI oil will not be produced and his analysis makes sense.
The idea that the consumer cares about the EROEI of the oil they consume and will only care to consume oil that has an EROEI greater than 3:1 is the Hill Groups idea.
I think as long as a gallon of gasoline will work in a consumers car they will pay the price at the pump. If the price is very high they will drive less or perhaps sell their car and ride a bike. No doubt ride sharing, public transportation, hybrids, plugin hybrids and EVs will be utilized more and this will reduce oil use.
If there is an economic crash, oil prices might fall as the Hill Group assumes, I don’t think that will happen in the near term and think oil prices will rise to $75/b by the middle of 2018 and are likely to continue to rise as supply will remain level or decline over the next 5 to 10 years. Until there is a recession (which is difficult to predict in advance) at current price levels supply will be less than demand by the end of 2017 and this will lead to higher oil prices.
But is that along the lines of the low-hanging fruit idea?
If Rune is suggesting that higher prices will net lower EROEI, then will the ‘economy’ go for the higher EROEI at the lower price investment first?
When you’re at a food market, do you buy the poorer-quality fruit at the higher price first?
If the ‘low-hanging fruit’ (highest EROEI for the lowest price) is always attempted first, this would seem to function to perpetually, efficiently and increasingly-rapidly knock out future oil production (until there’s none at any price).
While I have yet to read it, I think Gail Tverberg just wrote something about this on her most recent blog entry.
In any case, if this is what happens, while increased efficiencies will likely enter the fold as you suggest (using bikes, etc.) as I’ve written above, other primary energies will likely be substituted and depleted, possibly more rapidly than we think and in the same kind of dynamic.
This might serve to throttle investment in alternative energies and in capacities to manufacture them with their own energies, rather than with FF’s.
As a curious note, I was involved in the full shut down and abandonment of a field, which was later redeveloped using a brand new platform and a new set of wells. But abandonment was caused by a ship collision against the platform. It sort of bent the jacket and conductors.
Going back to a previously shut in field is possible if it gets mothballed properly. We did that in the past, in OPEC countries. But if the field is old, it doesn’t seem worthwhile unless the operator has a new play in mind, wants to try EOR, etc.
“…This really gives how much energy is needed to maintain the temperature in the reservoir when oil and water has been extracted. They seem to assume this has to come from the topsides oil industry (here I might have missed something, but they assume a large amount does)…”
That would be a strange assumption given the typical geothermal gradient is about 25°C per km and global geothermal flow rates are more than twice the rate of human energy consumption from all primary sources.
That is the reason why oil and gas produced in the North Sea (and many other places) is cooled down downstream the wellheads.
Reducing the inlet temperature of natural gas upstream the compressors reduces energy use for compression.
Rune – I think you are looking for sensible explanations where there may not be any, because their assumptions are fundamentally flawed. For one thing there is no consideration anywhere concerning gas – they assume only oil and water comes out and I think only water flood reservoirs are produced.
I guess it’s an interesting mental exercise. I have seen everything when it comes to temperatures. For example, if a water injection well takes 25,000 BWPD it will cool down so much the formation fractures with the water column weight. This means the well can go on vacuum. This in turn may allow using only the water flood feed pumps (the ones that feed water to the main pumps) to put water in the well.
On the other hand, some wells start running incredibly hot when they are making high water cut (water has higher heat capacity). The wellhead warms up too much, the tubulars stretch in an ungodly fashion, and the well starts to leak and gets high annulus pressure, which in turn leads to the field manager throwing a fit and the chief completions engineer getting demoted to geologist.
On closer review the whole thing is questionable. The issue with the second law of thermodynamics is just a red herring. They use a the relationship between entropy and reversible heat flow between homogenous systems at different temperature and then apply it to the oil production system which is highly irreversible but more than that the energy and entropy changes are dominated by phase change (off-gassing from pressure release during production and distillation separation in the refinery), composition changes (again refining but also replacing oil with water or gas in the reservoir) and chemical changes (burning oil or gas to give the energy needed to do the processing and distribution).
But all that is irrelevant really because after some equation manipulation (I think a bit dodgy at times( they end up with equation 7, which is just a heat balance, and to be blunt is bollocks. The energy needed to produce, refine and distribute the oil with the narrow API range they use is a very weak function of reservoir temperature and water cut. It is mostly a constant proportion, irrespective of much except the design of the refinery.
They should forget entropy and just use an energy balance on the whole thing. That is kind of what they ended up with but they’ve left out a load of terms – e.g. heat flow from reservoir rocks to reservoir, latent heat from release of gas, combustion heat for power generation.
They also seem to have completely changed their tune on prices – this paper indicates ever rising prices but now they seem to be in the “civilization can’t afford it” camp. Either might be right as far as I know, but it’s a questionable theory that allows you to switch whenever you feel like it.
I’d suggest not wasting any more time on it.
George,
“I’d suggest not wasting any more time on it.”
I came to the same conclusion some time ago.
Intuitively [or not], I just did not understand talking about reservoir temperature. Probably the US largest gold mine [now shut down] in Lead SD – Homestake mine – was down about 2 miles and had to be airconditioned for the miners to work.
In the Brazil sub-salt, I read a number of years ago that they were going to have to design drilling tools with new metals since the temperature would melt steel.
So, as a dumbass accountant, I just do not believe it when some “new” mathematical theory is talking about reservoir temperature.
How and when?
If The Hills Group/BW Hill is suggesting that oil ‘might as well be’ $0 in ~10 years or so, it seems to make sense.
Hi Caelan,
That paper looks at the EROEI of all energy used by society not only oil.
As long as other energy sources such as coal, natural gas, nuclear, wind, solar, hydro, and geothermal energy have enough of a surplus to subsidize the use of oil then oil can continue to be used. The price of oil is likely to decrease rather than decrease as it becomes scarce.
What price do you pay for electricity?
What is its EROEI?
Come again?
I realize that that’s what that paper looks at.
Do subsidies make the prices of things go up or down? If or as oil gets subsidized, where do you think the price of it is going to go, and how do you think this will affect our proper understanding of the increasingly obscured fundamentals or developments in other areas, such as alternative energies?
Hi Caelan,
As oil becomes scarce its price will increase rather than decrease.
As the price of oil and other fossil fuels increases, wind, solar, hydro, geothermal, biofuels, and nuclear energy all become more competitive and their use will increase. There is likely to be gradual transition from fossil fuels to alternatives as well as improved efficiency of energy use. There are a lot of losses in the fossil fuel industry as less fossil fuel is used, efficiency is improved because those losses are eliminated.
Hi Survivalist,
Thanks.
A crucial assumption of the analysis is that petroleum must be an energy source with an EROEI of more than 1. There is not a logical reason why this must to be the case. Just as electricity is valuable as an energy carrier, the same could eventually be true of petroleum because of its characteristics of being energy dense and easily dispensed into a fuel tank to power transport.
Oil provided about 33% of the World’s primary energy in 2015 based on BP data. If we consider total exergy use by converting total primary energy to exergy by assuming average thermal efficiency of 38%, but assuming oil is converted to work at about 25% efficiency, then oil falls to 20% of total society exergy.
The second poor assumption is that the price of oil is related to the EROEI of the oil produced. I believe that energy industry experts would tell us that there is little correlation between EROEI and the price of oil. In the long run, the price of oil is determined by the cost to produce the marginal barrel of oil (those that are most costly to produce). Why?
In the long run, if the highest cost barrels cannot be produced profitably (price>opportunity cost), they will no longer be produced. It really is that simple.
The fall in oil prices in 2014 had very little to do with the EROEI of oil and everything to do with a glut of oil. When supply and demand become balanced (probably in 2017), oil prices will rise to at least $75/b, and likely to $90/b or more by 2020, in my opinion (prices in 2016$).
Yep. In most fields we use natural gas to generate power and for utility services. If we run low we buy it. Or we just buy electricity.
If we can’t buy it we scrounge around to see if we can build a dam, a nuclear power plant, wind turbines, solar panels, and donkeys (that’s not in order). Some fields do burn oil, but we try to avoid it. I’ve seen a study to estimate the cost of a nuclear powered steam generation system in Venezuela, done about 35 years ago. But Venezuela has so much heavy oil the steam facilities for a mega project use as much as 1 million Bwpd of feed water.
I have just browsed the report linked to.
I am also in the process of illustrating that high EROEI sources are shut down (and P&Aed) while their operational (flowing) EROEI is very high.
As boe is poor unit for energy I have used Joules (Tera Joules, exp 12). The unit used is TJ/d (Tera Joules per calendar day).
Actual Production data from Norwegian Petroleum Directorate (NPD). Data on diesel and natural gas burned on Varg from the Norwegian Environment Agency (NEA). Norway has a CO2 tax in place.
For helicopter transport (primarily personal), supply and standby vessels a gross energy consumption of 0.22 TJ/d was used. (This is the equivalent of 0.7 MW 24/7 at a thermal efficiency of 30%.)
The chart below shows estimates of gross energy produced (stacked areas and by category) and gross energy spent (black columns) on operations on Varg (shut down in 2016).
NPD data shows a flow of 8,642 boe/d for Varg for Jan-May-2016.
The chart shows the development in operational EROEI for Varg (EROEI ex Varg) from 2005 and until it was shut down this year.
Varg had an EROEI of 17-18 when it was shut down. NO Thermodynamic Oil Collapse caused it to shut down. A higher oil price would have kept Varg in production while EROEI continued to decline.
It was lack of financial operating profits that caused Varg to be shut down, it had been running at a financial loss since the summer of 2015.
Assuming 5% losses in the (net) production that leaves Varg and until it is available for distribution to consumers would bring down the EROEI (at the consumer level) to about 9.
Rune,
Just think about what you said:
“It was lack of financial operating profits that caused Varg to be shut down, it had been running at a financial loss since the summer of 2015.”
So, the low oil price shut down Varg. If the company can’t make a profit, then the EROI is understated.
I would also kindly like to remind you that our modern society needs something closer to 20/1 EROI of oil to be sustainable.
The are countless examples in the alternative and MSM showing how the Falling EROI is gutting the entire system. I would imagine many will continue to Bicker about the insignificant counterpoints as the Titanic sinks.
At some point, it is time to WAKE THE HELL UP and look around.
Funny, how no one seems to be concerned about the massive amount of debt in the system.
GOD HATH A SENSE OF HUMOR
steve
Steve,
Let me clear on something;
1) I have shown that EROEI is declining with time using actual data. (This also goes for full life cycle EROEI).
2) At some point in time globally depletion induced decline will be apparent for all to see and reduce useful energy available to societies. This IMVHO will be the most dominant force.
3) Let me try to illustrate this another way. Presently globally about 80 Mb/d (C+C) is extracted. For the purpose of illustration, let us say that EROEI (from producer to consumer level) now is 15, that means societies are supplied net 74.7 Mb/d.
Fast forward a decade or so global C+C could be down to 65 Mb/d and EROEI have declined to 14. Now societies will be supplied net 60.6 Mb/d.
That will have huge ramifications!
4) I have published several articles focusing on total amounts of debt in the system (at a macro level) as well as done work focusing on the effects also for oil companies. Most is unaware of how this will restrain oil companies abilities to invest for costlier replacement oil.
Yes, I am very much aware of these developments, but it certainly does not help if someone try to spread fear based on, at best, flawed science.
”So, the low oil price shut down Varg. If the company can’t make a profit, then the EROI is understated.”
What do you mean?
It is very simple
High oil price => allows for low EROEI sources to become financially profitable (ref tight oil and oil sands)
Low oil price requires a higher EROEI source.
”I would also kindly like to remind you that our modern society needs something closer to 20/1 EROI of oil to be sustainable.”
Any references to this? (Trust me will not work!)
As long as societies get all the “cheap” oil it demands, EROEI does not matter.
”The are countless examples in the alternative and MSM showing how the Falling EROI is gutting the entire system. I would imagine many will continue to Bicker about the insignificant counterpoints as the Titanic sinks.”
There is a complex set of reasons for this, and presently I hold the financial dynamics to be in the driver’s seat.
The societies will not collapse if we use 20%? less energy. That is not an existential threat. It is a warning that our overconsumptive lifestyles are not sustainable.
I suppose the first thing that comes to my mind when someone says ‘sustainable’ is, ‘what is it you wish to sustain?’. If it’s soccer moms driving around Vegas in mini vans looking at show homes, well that’s one thing, if it’s an agrarian syndicate, well that’s another. Anyway, I found this link on EROI minimums from Charlie Hall.
http://dieoff.com/_Energy/WhatIsTheMinumEROI_energies-02-00025.pdf
Thanks to all for sharing your point of view on eTP.
PS personally I don’t like the word collapse. It’s kind of vague and value based. I like the word contraction. Perhaps a collapse is a rapid contraction, or a deep contraction. For what it’s worth I do feel there will be a rapid contraction.
Cheers
Thanks Survivalist.
An excellent paper.
One small issue I have is the paper suggesting shadowstats CPI might be a better measure to use rather than CPI or the GDP deflator. See
http://www.mit.edu/~afc/papers/BPP_JEP.pdf
The Billion Prices Project shows that CPI does a pretty good job of measuring inflation.
Also if we convert the average imported crude price into real prices in 2012$ using the CPI and the shadowstats index we get the chart below. Shadowstats data suggests real oil prices were roughly 3 times higher than 2008 in 1980.
I don’t find the shadowstats data credible at all and by mentioning it in the paper (page 39) taints what is otherwise very good work.
Hi Dennis,
You may have a point there in your ‘niggle’, but we can miss the forest for the trees in general anyway.
And as you like to sometimes suggest, you can be wrong. ‘u^
And there seem to be a lot of indicators and potential indicators, if we simply look around.
Apparently, birds and other animals seem to know before humans, when some dangerous things are about to materialize, like maybe an earthquake or a storm.
Hi Caelan,
Absolutely correct, 99% of economists could be wrong about the inflation data.
At a societal level for all energy types EROEI is important, but for a single industry it is not.
Do you pay for electricity? Why? It is not an energy source (for the average electron in the system), by the Hill Groups analysis the price of electricity should be zero because it is an energy sink rather than a source.
Hi Dennis,
My comment here addresses this.
To add; insofar as electricity is a secondary energy source or carrier or conduit, then maybe we pay for the primary energy sources, but call it ‘paying for electricity’. (So maybe Hill has a point if that is what they say.)
Hi Caelan,
There is no logical reason that oil must be a primary energy source.
This is a fundamental assumption that Hill makes, but is unproven.
Their entire analysis hinges on this assumption. One could easily pay for gasoline or diesel fuel even though the source of the energy might be coal, natural gas, or solar power.
Your comment that addresses the question, simply asks questions, it addresses nothing.
The paper you cite actually answers most of those questions, just read it.
The argument that solar and wind currently contain fossil fuel energy is correct, as more and more energy used by society is provided by wind, solar and hydro power less and less fossil fuel energy will be embedded in those energy sources.
There was a time when most fossil fuels were produced by equipment made with biofuels and human and animal labor (wood, peat, and muscle mostly). Gradually fossil fuels replaced most of those energy sources and gradually fossil fuel energy will be replaced as well.
Dennis,
Now I understand why you don’t get it. Your failure to understand the concept of oil as a primary energy source is a huge blind spot, an inconvenient truth, of sorts.
Technically, oil is stored solar energy. Solar energy and gravity (hydro-power uses gravity) are pretty much it for energy sources, in many forms.
Solar energy stored in oil is a big chunk of what we use, so arguing that it isn’t proven to be a primary source of energy is just foolish. Take away solar energy (real time and stored) and gravity, and tell me what will keep you from freezing in the dark.
Jim
Why would we take away solar energy?
BTW, hydro is also from solar: rain powers hydro, and solar powers rain.
Hi Jim,
According to BP’s Statistical review of World energy oil provides 33% of primary energy. If we consider exergy, oil is used very inefficiently, from well to wheel the work provided is only one fifth of the energy in the Barrel, natural gas does much better (at least 50%) and even coal probably gets 30% of the energy as work or useful heat (for buildings or water). Oil is far less important today than in the 1970s. If it is as important as you believe we will produce it even if there is no energy surplus using the surplus from coal, natural gas, hydro, wind, solar, geothermal, and nuclear power.
Oil is currently an energy source, as it depletes it may become a sink. My point is that the total energy surplus of society from all energy sources is what is important because energy can flow from one product to another.
I assume you pay for your electricity. Is it a source or a sink? If it is a sink why do you pay for it? Couldn’t the same be true for oil in the future? If not why not?
I have been through the same exercise for Volve (started in 2008), a field that shares many of the same characteristics as Varg; Stand alone development, no interference with other installations (self sustained) and present plans now call for Volve to be shut down in 2017.
In 2015 well interventions led to higher production.
Development in operational EROEI for both fields in the chart below.
Note that the fields reached/approached their end of their economic life with an operational EROEI at the field in the area 15-20, and a consumer EROEI (operational) of about 9. This with an average oil price of about $40/b.
In my humble opinion, EROEI is a concept that Einstein could not figure out.
Just stop trying to “solve” the impossible equation, and try to figure out “money spent” versus “money expected (with a discount for probability of success).”
If you can produce 10 barrels of oil for $1 billion, and someone will pay you $2 billion, it does not matter how much energy it takes – the 10 barrels will be produced. I wonder what the math is on the pyramids in Egypt. They took a lot of energy, produced none, but the workers were fed and paid.
Clueless,
Upon mentioning the pyramids of Egypt, there was one very important criterion that had to be met to build them….access to surplus energy (food for the slaves building the pyramids).
Surplus energy is to me the important thing to follow.
Of course it is possible to use energy arbitrage whereby a lower priced/less costlier energy source is used to produce a much costlier and the desired one.
Consider this hypothetical situation to warring nations, one that can get hold of oil to fuel their warplanes, warships and tanks by using 2 energy units of nat gas to get one of oil (GTL for instance).
The other one with no/little possibilities for access to liquid petroleum.
The outcome from this is not hard to predict.
Rune,
You are on the mark in noting that surplus energy is the important thing to follow. The surplus energy is what is available to fuel the energy flows to operate the system.
That is what is declining, cheap surplus, as that is where most exports, and revenue generation, and profits come from. Many of us commenting are talking past each other.
Your evaluations of EROEI for specific facilities is just part of a larger picture that, as Steve notes, is understating the real numbers, or it would continue as a profitable venture. EROEI is too complex and difficult to accurately quantify for my purposes, and I’ve given up on it, although I know it is critical for the global system as a whole.
Surplus energy to fuel system energy flows is the key. Spot on!
That surplus and its profits provide the excess above subsistence to support much of our society, like medical care, the arts, scientific research, retirement plans, militaries, and human population above 7 billion. As the surplus declines, those things will, too. I see it already happening in many ways, subtle, but relentless.
Can’t say I like it very much, but I see it.
Jim
Speaking of pyramids- eqypt is the #1 wheat importer of the world. Wheat importation is a form of water and oil importation. The population grew from about 10 to 80 million people in 100 yrs, during the age of cheap oil. They no longer have any oil to export, and the oil subsidies for wheat purchase is no longer available.
People do overthrow governments when food gets too expensive. Sometimes governments pre-empt overthrow by going to war, in effect a diversion.
“try to figure out “money spent” versus “money expected”
I agree. It is price vs. costs that matter in real life.
Energy is only one of the inputs in energy production.
Well said.
When we were losing our behinds on a monthly basis at $20 oil this winter we were shutting in wells and making plans to shut in more.
Now we have pretty much everything back up and running at prices in the mid $40s.
It comes down to being able to pay the bills.
I just realized it is October. How are the banks treating the shale players this time around? It has been very quiet on that front.
930,931 barrels per day times 40 dollars equals 37,237,240 usd.
At 100 usd per barrel there is 93,093,100 usd, an income shortfall of 56,000,000 dollars not there however, needs to be there for profitability reasons but ain’t, you have to operate at a loss. That’s every day. It can be fixed.
A credit, the expense side is greater than the company revenue. Not a problem, accounting can enter a credit, an oil production tax credit, the oil explorers can operate at a profit when the taxpayer pays for the energy like they should, the taxpayer is the consumer, so the taxpayer should pay for energy for what it is worth, not what it sells for, you can’t expect Whiting or Continental to do it without some help from the consumers.
You can’t expect decreases in production to suffer losses, therefore, an oil production tax credit can be an answer, a tax paid by consumers, 21 dollars per barrel will reduce the income deficit by fifty percent. The taxpayer pays through the nose at all times, another new tax shouldn’t require too much sacrifice.
What are you going to do? Go without? Not a chance.
(Behind a paywall in The Times)
http://www.thetimes.co.uk/edition/business/saudis-keep-lid-on-reserves-j9fksr6lj
Saudis keep lid on reserves:
“Saudi Arabia is crafting a plan to avoid revealing its oil reserves as part of the $2 trillion (£1.6 trillion) stock market float of state oil giant Saudi Aramco.”
“It is considering creating a holding company that would be handed a production contract to pump the crude but would not own the reserves. A third party, understood to be British oil consultancy Gaffney Cline & Associates, would give an assessment to assure investors that there is enough oil to last for several decades, but stop short of revealing the overall figure. Aramco declined to comment.”
They may not have to reveal total reserves if they create a separate company with a 30 year contract to produce a single field using a production sharing agreement. The stock value is estimated using the PSA terms, and reserves only have to be stated for the 30 year term. Because discount factors make a field production beyond 30 years fairly inconsequential, the stock will sell at a premium because the PSA terms can be written to stabilize cash flow and dividends. This takes a lot of risk out of the purchase, and leaves the political risk, which is pretty high.
KUWAIT EMIR DISSOLVES PARLIAMENT OVER FUEL PRICE ROW
“…speaker Marzouq al-Ghanem called for early elections, saying the country faces “economic security and regional challenges” and “the only way” to deal with them was to “form a new government line-up”.
http://www.bbc.com/news/world-middle-east-37671913
Doug,
Interesting article about the deteriorating situation in Kuwait. I would imagine these developments are most certainly generated by the ETP Oil model and Thermodynamic Oil Collapse.
Watch for serious trouble to increase in Saudi Arabia as the dominoes continue to fall in the Middle East.
Steve
Kuwait, data from BP Statistical Review 2016.
Oil production in 2015: 3.096 Mb/d
Oil consumption in 2015: 0.531 Mb/d
Hi Rune,
In addition, Kuwait’s oil is probably some of the highest EROEI oil in the World.
I am not arguing that EROEI is relevant, but if Steve is going to argue that low EROEI is leading to collapse, he would need to focus on the collapse in Canada (oil sands) and the US (LTO) where the EROEI of oil might be relatively low.
Did you see the link to the Hills Group report?
http://www.thehillsgroup.org/petrohgv2.pdf
Dennis,
I also believe ME oil in general has high EROEI.
My point by referring to Sankey diagrams that shows the energy flows through a society, the data on Kuwait was that just by looking at public data showed that we are far from a global operational EROEI of about 2.
EROEI is an important concept, but it needs to be understood as part of what I frequently refer to as the “financial matrix” as both energy production and consumption is embedded in this matrix.
IIRC I saw someone had estimated the EROEI for Bakken LTO to be about 8.
Bakken may be a good laboratory to understand relations between EROEI, costs and prices.
Let me illustrate this the following way;
If the average Bakken well has a full life cycle EROEI of 8 and EUR of 320 kbo, this means about 40 kbo is society’s energy costs. Most estimates would likely now show this well as profitable at $70/bo.
If we now looked at a well with EROEI of 4 (EUR of 160 kbo), 2 (EUR of 80 kbo) and 1 and estimated what prices these needed to yield a decent financial profit, then we also have some points to make a curve that shows how costs develops with EROEI.
We have good well data on Bakken.
A simplistic exercise like this would illustrate how costs develops with EROEI.
On the other side we could guess? what price society could afford at different EROEIs.
Hi Rune,
I agree EROEI might be a useful concept, but to me it seems better to apply it to society as a whole, this may not be necessary as long as we track all of the energy flows into and out of any individual industry.
We indeed have good output data for the North Dakota Bakken, but I do not have a good handle on all of the energy flows in the North Dakota LTO petroleum system.
Where did you see the EROEI analysis for the Bakken? I have found a couple of mentions of 6:1, these estimates are from 2012, it is possible the oil may be produced more efficiently at this point. I have not seen any good EROEI analyses of the Bakken.
Kuwait has possibly the highest per capita oil consumption of all countries?
If Energy Input for the EREOI calculation is not oil based, like perhaps drills powered by nat gas (drill rigs are 2000-3000 horsepower), then this theoretical mechanism for a Great Collapse would not be valid (if there is natgas to spare). (a cursory look found a 2100 horsepower natgas engine). I suspect the huge LNG tank will need refilling for each well drilled.
Notice I’m saying natgas and not electricity because transport of power to each new well site would require huge cables for 2.2 megawatt motors that would have to be routed and then removed in what, about a day or two?
So, there is a way to dodge EROEI. There is no way to dodge outright scarcity.
Some are working on it
http://hhpinsight.com/epoperations/2014/09/ferus-ge-last-mile-for-statoil-bakken/
There is one quote by some VP of development suggesting using it for drilling. Seems unlikely.
Natgas energy density is 1/1000th that of oil. Compress it to increase, or liquify it to increase, but at 1/1000th I don’t see running a 2500 horsepower engine on it without exhausting the tank in a few seconds.
A quick look says the frac pumps are also north of 2000 horsepower.
Watcher,
There is no problem powering large engines with Nat gas. Check out the hhpinsight.com page. Drilling rigs can either use a local well for its gas, small scale LNG from local production or CNG from local production. CNG is transported by the semi trailer load at 3600psi.
The size of the engine is not a problem. For an example Drilling rigs, tend to use2 x Cat 3516 engines, whereas a frac truck will use a 3512 per truck. The only real difference in the 3516 and 3512, is the number if cylinders, 16 or 12.
All the big engine manufacturers are producing a range of nat gas engines, both duel fuel and pure nat gas. It is all available, just needs the investment and the financials to work. GE is even powering frac spreads with 25mw gas turbines. One turbine and just run power cables to the trucks.
You will see on the HHPinsight page that shipping in leading the way on large nat gas engines. These include the room size low speed 2 stroke engines that power large ships, as well as the medium speed engines that power the rest of shipping. These all run on LNG. Infrastructure for bunkering for these ships is currently being built around the world. Pollution controls on shipping has been on of the big drivers for these changes.
Watcher/Push
This is exactly where the Adsorbed Natural Gas developments kick in.
No longer will one need to chill methane to -260 degrees Fahrenheit.
No longer will heavy, bulky cylinders be required to store natgas at 3,600 psi when lightweight cylinders rated st 500 psi will hold the same amount of fuel.
The ‘hardware’, ie., the engines, are already on the marketplace.
When the fuel is available at room temperature and 500 psi, or less, natgas will displace both gasoline and diesel as primary transportation fuel.
It is already happening with fleets throughout the country and the Chinese are apt to promote this in a big way.
I used to work in a field with 25 natural gas engines, mostly Cats. Looked at replacing them with turbines, but the Cats were very reliable and our maintenance Dpt had the facilities to do the overhauls, so we kept the cats.
Saudi Arabia, where even milk depends on oil, struggles to remake its economy
Low oil prices and an increasingly costly war in Yemen have torn a yawning hole in the Saudi budget.
Saudi Arabia has cut public spending and reduced take-home pay for government employees.
Huge subsidies for fuel, water and electricity are being curtailed.
“The government is moving very fast at reforming things in Saudi Arabia while the people are finding themselves left behind,” said Lama Alsulaiman, a businesswoman and board member of the Jidda Chamber of Commerce and Industry. “Life as usual and business as usual can no longer continue.”
[…] Bakken Production Down, OPEC Production Up […]
Interesting graphics from Visual Capitalist that shows the size of the global oil market relative to other raw metals markets.
http://www.visualcapitalist.com/size-oil-market/
The FED production numbers, which are the most timely for oil and gas production, were out today. Oil production is now down over -10% for September and natgas (number is from July2016) continues its relentless downward spiral. In below chart, natgas production is down -3% (blue line) although prices (green line) recovered hugely by +38 % year over year.
As drilling (red line) follows very reluctantly – still down -46% year over year – production is very likely to fall over the next six months. In below chart it is clearly visible that the current cycle is much longer than the cycles in 2008/9 and 2012/14. However the cycle will be in my view also much deeper than before. As prices will not go to USD 20 per mcf this time, they have a good chance to go to USD 10 per mcf during this cycle.
The reason is in my view a deep structural change in the US natgas market. First, the frantic drilling in the Northeast did not only increase natgas production, but mainly natural gas liquids NGL supply soared to unprecedent numbers. So Marcellus/Utica is mostly a condensate play, with serious consequences on the worldwide market for NGL or condensate.
As the NGL market is considered the little brother of the crude oil market, NGL prices, which went into tandem with crude oil prices for a long time, decoupled from the crude oil price in 2012 due to soaring US supply. The total market for wordlwide NGL stands around 6-7 mill barrels per day and and exports are between 2-3 mill barrels per day. So, the market for NGL is over ten times smaller than the crude oil market. In this market, the US suppliers poured over 0.5 mill barrels per day – or over 25% of the market size – within one year in 2015. No wonder prices plummeted and US suppliers do not get more than USD 5 per barrel of oil equivalent in many cases. In some cases producers have to pay to get rid of condensate.
At the begining of the shale gas boom high NGL prices supported very much the production of natgas, yet now it becomes more and more a nightmare for US producers. As Asian consumers welcome the low prices, importing vast amounts of NGL (China imports in 2016 over 120% more year over year), the market may eventually balance, yet it will take some years.
Secondly, most of the shale gas production is concentrated in the Northeast, which brings increased distribution headaches to the market. Transportation of natgas is expensive and accelerates exponentially by the length of the pipeline. In addition, there are also storage issues just like now when storage in the Northeast is full and natgas produced has nowhere to go. Currently producers in the Notheast receive as little as 10c per mcf.
This leaves two thirds of US hydrocarbon production (3.6 mill boe/d NGL and 10 mill boe/d of natgas) to cope with revenues of just USD 5 to 20 per barrel of oil equivalent. No wonder the industry is on its knees http://oilpro.com/post/27056/energy-bankruptcies-weve-only-seen-third-them and banks are increasingly nervous to fund new production.
Currently many gas companies have more losses than revenue. How long can an industry sustain this torrid pace? In my view we are in for at least a pause of frantic growth.
Heinrich,
Thank you for this comment! I am always eager to read your posts. Although, my mental forecast is still very cloudy on the future of natural gas. Perhaps this afternoonI shall other POB members to drink either Port and/or a Canadian or Tennessee blended beverage to clear my mind.
JohnS,
Thanks for your comment. I hope you are successful.
Thanks from me too ,Heinrich
I hope I there are more than just a couple of farmers reading this blog.
When the price of gas shoots up again, so will the price of nitrate fertilizers, which are a major expense in my industry.
Expensive fertilizer has a hell of a lot to do with food shortages and even outright starvation in some parts of the world, and with the consequent troubles ranging from forced migrations to ethnic wars.
Even though I am more or less retired, I still use some nitrates, and plan on buying up a substantial supply while gas is still cheap. The price of them will double if gas hits ten bucks. The bank is paying less than two percent, lol.
Mr. Leopold
A few observations on your post …
I don’t know if it’s precisely correct to consider the Marcellus/Utica condensate-weighted formations as there is substantial variation depending upon location.
Ohio reported 22 million barrels of oil for all of 2015, less than one month’s Bakken output.
Pennsylvania was far less.
Regarding NGLs, however, these formations are, as you pointed out, extremely productive, particularly in West Virginia, western Pennsylvania, and most of Ohio’s Utica. (Belmont and Monroe counties, however, have extraordinarily productive wells that are 98%+ methane. So too northeast Pennsylvania).
By this time next year, the Mariner East 2 pipeline should be in operation carrying 275,000 bbld NGLs to Marcus Hook.
This pipeline will be expandable to 450,000 bbld.
That is a heck of a lot of product.
Presently, the 70,000 bbld Mariner East is providing ethane for export by way of Ineos’ specially designed and built fleet of ships.
Shell just announced that groundbreaking will start on their cracker plant in Beaver county which will consume another 100,000 bbld.
Three more crackers are proposed to be built in this area.
I do not feel $20 HH may be forthcoming in the near future, bu the Jan/Feb 2017 Algonquin Citygate price is currently almost $8/mmbtu … likely to go much higher as the cold winds start to blow up Boston way.
Yes, Mr. Leopold, this frantic pace of drilling/producing cannot – will not – continue. The financial havoc wrought by the uncovering of one of the largest gas finds of all time has been extensive and crushing for many.
The future developments will unfold over many decades time.
coffeeguyzz,
Thank you for your comment. For the first time I feel we have a common understanding of the situation in the Northeast.
Yes, the Marcellus/Utica is prolific so far. However, as companies swamp the market, they destroy the price of their product. If they could sell NGL at the same price as crude oil – which main market is transportation fuel – this would be the right strategy. Yet the market for NGL is mostly for petrochemicals (e.g. propan dehydrogenation to polypropylen) or cooking fuel for households and in some cases also as transportation fuel, which requires some adjustments.
The main point I want to make is the mismatch between supply and demand. NGL cannot go immediately into the transportation market. Therefore the market for NGL collapsed, which forces shale companes to produce at a big loss. This happens much in favour of India, Indonesia, China… who can import energy for heating at much lower prices than for crude. This is a subsidy for Asian consumers.
On the other side, US producers suffer huge losses. Cabot oil and gas COG – one of the stalwarts in the Northeast – just collapsed last week due to horrenduous losses. In that sense US shareholders are paying for cheap cooking fuel in Asia. This makes it also difficult to ramp up natural gas production. Range Resources had in the last quarter -5% lower natgas production, yet 34% higher NGL production. This means, the harder US companies try, the deeper they dig themselves in a deep hole. As it is probably an advantage for the US economy to produce cheap natural gas at a loss, it is just absurd to export massive quantities of NGL at extreme low prices much below production costs.
Mr. Leopold
A further followup …
I don’t think we have ever been in much disagreement in regards the economic questionability of much if the unconventional operators actions, both in the Appalachian Basin and, in fact, all throughout the areas this ‘Shale Revolution’ is taking place.
My explanations for the happenings seem to frequently be misinterpreted as some kind of advocacy, cheer leading, if you will, for dubious decisions made by CEOs.
Case(s) in point – Cabot and Range.
Cabot, producing exclusively from Susquehanna county in NEPA, produced 100% natgas from their 500 wells, no NGLs.
In just a few years time, these 500 wells have cumulatively produced over 2 1/2 Trillion cubic feet of gas, an average of over 4 Bcf. Truly an astounding figure.
Problem? Virtually no takeaway as they need to transgress either NYS or heavily populated SEPA.
The 18/24 new power plants coming to that area will all be fueled by natgas, which Cabot is assiduously, creatively attempting to supply.
Just as Iceland us a prominent supplier of aluminum despite importing 100% of the raw material, bauxite, so too can this area become a manufacturing powerhouse.
P&G has one of the world’s largest paper processing mills here and it is both heated and powered by gas wells located on the property.
Range has about a million leased acres located primarily in western PA with far more NGL potential.
The minimal pipeline build out that has occurred has benefitted them as their product can move both south and west.
For size comparisons, the Bakken covers about 12,000 sq. miles.
The entire state of ND is 70,000 sq. miles.
The Marcellus is said to be over 72,000 sq. miles.
The Utica is larger yet.
Many of these decisions to produce/develop were motivated by lease protectingprotecting rationale.
http://www.zerohedge.com/news/2016-10-15/september-global-auto-sales-hit-record-high-thanks-chinas-new-car-bubble
Concerning technological marvels and the falling cost per well.
Anyone know the average age of a DUC?
Obvious way to declare a quarterly cost reduction if the well was drilled (and cost declared for the drill rig) last year. Now, that cost would not be redeclared, so the quarterly declaration would be lower and the wackos would leap to praise and marvel at technological progress.
That didn’t make sense.
If you drill a well last year, the cost of that drilling might be declared. Then.
If this year you come along and frack that well and get it flowing, you can then declare that newly flowing wells cost much less than old ones because of technical advance yadda. Reality is they were DUCs.
Doesn’t even have to be a conspiracy. Executives would be delighted to present accurate numbers like this.
Indeed, CLR were doing just that in a recent presentation by comparing ROR of DUCs to ‘greenfield’ wells, in which DUCs had their drilling costs excluded from the calc, giving 70% rate of return (!)
Page 8 of this one:
http://phx.corporate-ir.net/External.File?item=UGFyZW50SUQ9NjQ0NzA3fENoaWxkSUQ9MzU0MTI3fFR5cGU9MQ==&t=1
Bakken wellhead prices remain significantly lower than WTI.
September average was below $33, a $12 discount to WTI.
This may be one of key reasons for weak drilling/completion activity and continued decline in oil production
Bakken sweet crude vs. WTI price
AlexS, thanks.
I have for some time been of the understanding that in general Bakken companies now will be funded constrained (limited by cash flows from operations).
Then in the near future they also need to pay attention to what I refer to as the bond “hedges” (retirement of debts).
I would also follow interest developments closely as rolling over debt into a higher interest rate is not a very attractive deal.
Thanks, Rune
Big companies in the Bakken and other shale plays have actually improved their cash flows. This was achieved thanks to a sharp reduction in capex that offset the effects of lower oil prices. Below is a chart for Continental:
CLR quarterly operating cash flow, capex and free cash flow ($ million)
Net cash from operating activities is the one to watch as new wells and debt management is primarily funded from this.
(I take it the units is $Million).
Rune,
yes, this is in $Million
My point is that CLR and others were able to adjust (cut) their spending in line with much lower operating cash flow. That helped to achieve almost neutral free cash flow, but resulted in declining production
As cash burn was sharply reduced, and companies are also selling assets, net debt stopped to increase and stabilized in the past few quarters.
Some companies are even reducing their debt. Thus, Continental recently announced redemption of its outstanding Senior Notes due 2020 and 2021.
From the company’s release:
“We expect to fund the redemptions from proceeds of our 2016 completed and pending asset divestitures. Once these bonds are redeemed, we expect total outstanding debt to be approximately $6.6 billion, down from approximately $7.2 billion at June 30, 2016. We will continue to consider options to further reduce debt while increasing cash flow from operations.”
http://investors.clr.com/phoenix.zhtml?c=197380&p=irol-newsArticle&ID=2208978
CLR net debt and net debt / equity ratio
AlexS, thanks for sharing.
Interesting development in net debt/equity.
How should that be interpreted?
CLR is focused on debt management (and so are other companies).
Most likely scenario is the debt redeemed had covenants that were unavoidable.
Also, the SEC modified valuation of lease holdings enable a higher asset value for divesting to fund the paper redemption.
Yet, more conservative financial policies resulted in declining production volumes.
Thus, in the case of CLR, crude oil output in 2Q16 was down 11.2% vs. 2Q15. This was partly offset by a 12.6% increase in natural gas production, but total oil and gas volumes were still down 3.2%.
Almost all of the decline was in the Bakken region, where CLR has sharply reduced drilling activity. Growth in Cana Woodford and SCOOP was largely “gassy”.
CLR quarterly oil and gas production
Assuming gradually increasing oil prices, big shale players may return to growth somewhere in 2017. But as they will likely try to maintain neutral or slightly positive free cash flows, their volume growth should be much slower than in 2011-14.
But even in the case of relatively conservative financial policies, most shale companies will not be able to pay down their existing debt from operating cash flows. If they continue selling assets and underinvesting, that will result in lower output volumes and lower cashflows. The only alternative is new share issuances (if private equity and other potential investors are willing to buy them).
In any case, shale companies will have to roll over debt; and I agree with you that will be not a very attractive deal in a higher interest rate environment.
Why not assume gradually decreasing oil prices? Or flat oil prices?
What happens then?
Gas does not add much.
One interesting development would be net cash from operations (ex CAPEX).
“Gas does not add much”
Exactly. In CLR’s case, nat gas accounted for 40% of of 2Q16 hydrocarbon production (in boe), but less than 12% of revenues.
Average nat gas sales price was $7.86/boe ($1.31/ kcf) vs. $38.38 oil sales price.
Continental Resources quarterly oil and gas sales ($ million) and averages sales prices ($/boe)
AlexS, thanks.
The numbers you refer to I presume are gross revenues.
How would those number look specific net ([$/boe] post OPEX, taxes, royalties etc)?
Rune,
Yes, these are gross revenues.
Oil companies only show opex, taxes and royalties per boe, and do not separate between oil and gas.
So it is impossible to calculate the netbacks for gas separately from oil.
But I think opex in gas production is lower.
E&P companies which produce mainly nat gas generally have lower costs per unit of output than oil producers.
Hence my guess is that the share of gas in operating or pre-tax profit should be higher than in revenues.
AlexS, thanks.
I am following some companies in Bakken very close.
One of the companies according to their SEC10-Q filing for Q2 2016 listed these numbers.
Average sales price nat gas: $1.42 Mcf(kcf), this amount to about $8.52 boe (6 Mcf per boe).
Total (cash cost) for operating activities $24.98/boe (includes interest costs).
Estimated net back (based on boe) for nat gas: (minus) – $2.74/Mcf.
Same numbers (per boe) found for NGLs as some companies report these separately.
Presently nat gas and NGL’s (in Bakken) incurs operational losses for several of the companies.
Thanks Rune,
I didn’t know that some companies report operating expenses separately for crude, NGL and nat gas.
I wrote:
“Total (cash cost) for operating activities $24.98/boe (includes interest costs).”
Some companies reports revenues for NGL’s sales.
All operating costs lumped together and also presented as per boe unit.
“All operating costs lumped together and also presented as per boe unit.”
Exactly. But we don’t know what are the costs for each product, and they are certainly different. So it is difficult/impossible to calculate netbacks for crude, NGL and gas extraction operations.
Indeed, all operating costs are combined, reported on per BOE basis and that is, for lack of a better term, part of the slight of hand in shale oil advertising. That is precisely how Scott Sheffield recently went on record as saying PDX had incremental lift costs as low as 2.50 per BOE in the Permian, where initial GOR is very high and gas often represents 40% or more of the production stream.
Yes, the LOE for oil, nat gas and NGLs are different. From earlier work I found LOE for nat gas to be about half of that for oil
The point is that if the costs were specified by category, LOE for oil would come up slightly.
Sometimes one just have to work with the data that are available even if these are not perfect it should result in an estimate that is very close.
How much difference would it make if losses are $2.50/Mcf versus $2.00/Mcf?
At the other end one would get somewhat lower net backs for oil.
As natural gas production costs are lower than for crude, and the share of natural gas in total output of many LTO producers is increasing, that is one of the factors explaining the decline in overall OPEX per unit of output.
But average revenues per BOE are also declining, even if oil prices remain constant.
It is my understanding that the new OK shale plays (STACK in particular) have very little produced water. This would be one reason why CLR would show lower per BOE LOE than more oil weighted companies.
With regard to PXD, I think the same may also apply, very little produced water with regard to many of their more recent wells.
That is correct, Alex, and all cleverly disguised by using gas to oil equivalents in economic advertising. Of particular “interest” to me, for instance in the first 5 years of the Bakken play, was BOE advertising when ALL that gas was getting flared. Which, by the way, a lot of gas is getting flared in the Delaware Basin also; I am told for months and months before gathering systems are in place and processing available. A lot of wet Bone Springs gas has 10-12% CO2 content.
So regardless of BOE and gas in the production stream, gas as a portion of the revenue stream is highly suspect, IMO. But we know that, and have; Wall Street, however, clearly did not receive that memo.
Ok, so if they triple gas prices the gas earns ~ 30% of the total. If GOR increases 20 % then gas earns ~33% of the total gross?
So these operators may be able to increase well life if the figure out how to lift a well making 15 BOPD, 30 kcfd and 20 BWPD.
AlexS,
What is interesting about Continental Resources increase in oil and gas production, is that it has paralleled its Long Term Debt. Here is CLR increase in Long Term Debt Since 2006:
Continental Resources Long Term Debt
2006 = $140 million
2015 = $7.1 billion
This seems to be the case for many of the U.S. Shale oil and gas producers. The more their production has increased, the more their debt.
Looks like a WIN-WIN to me.
steve
Sounds like subsidization to me.
One would have thought that the US ‘government’ would have been more prudent with its national security fuel than that, but maybe it can (continue to?) strong-arm/confuse/destabilize Venezuela, in part through sweet-talkings with Cuba, while they get Gigafactory up-and-running and corral their sheeples into self-crashing electric vehicles.
I just caught you on Kunstlercast today by the way. Thanks for speaking in plain English.
Be sure to second-check audio levels with Louis Arnoux et al. if it’s not already done. Sometimes we can get really nice interviews only to be spoiled by bad levels and background noise and whatnot.
Caelan,
Glad you enjoyed the interview with James. I will be interviewing Louis via Satellite Internet service. Its is the only service I can get. So, there will be a bit of a Latency issue. However, Louis and I have chatted four different times, including this morning… and I believe the interview will turn out quite well.
steve
Sounds good and best with it, have fun.
Steve,
We all know that the U.S. shale gas and then LTO production boom was in large part funded by debt .
It is no surprising that growth in shale companies’ debt was matching growth in output volumes
Alexs,
Correct. So, let’s say we could not issue debt. If the debt markets had collapsed, and collapse they will (just a matter of time), how much of this shale oil or gas do you think could have been extracted without debt?
steve
In theory you don’t need much debt for shale oil, if it’s really profitable. The most production comes in the first 3 years, after this the debt should be paid and later drillings can be paid from cash flow.
It’s really ideal for this, in opposite to deep sea drilling where investing goes for years before the first barrel flows – and then you have a slow start.
Or shale was never really profitable… only with accounting tricks.
Hi Steve,
Your argument gets a little circular.
You assume debt markets will collapse because the energy companies will not be able to get any financing and there won’t be enough energy.
Let’s assume debt markets don’t collapse (because we don’t want to assume the thing we are trying to prove.)
Energy supply decreases, oil prices rise and profits increase. What causes the debt markets to collapse?
World Non-Financial Debt to GDP has been 200% to 230% from 2004 to 2016 according to the Bank for International Settlements (BIS). Chart below uses BIS data.
https://www.bis.org/statistics/totcredit.htm?m=6%7C326
Dead on, Dennis
The lending industry has lost big time already and will likely lose as much or more again, on unconventional oil and gas.
But there will be PLENTY of people with money to jump back into the shale biz once prices are high enough to make it worthwhile.
I think some companies are already going around like vultures cherry picking the best distressed properties while they can get them at fire sale prices.
If the price of oil goes up anytime soon, the new owners will make some money. It looks like a safe bet to me.
I don’t think it is at all likely that electric cars, etc, will displace conventional cars plus all the other legacy oil burning machinery fast enough to offset depletion for a pretty good while, assuming the economy remains on its feet.
OFM,
According to BIS data, world non-financial sector debt amounts to $103 trillion, of which $45.9 trillion is the U.S. debt
U.S. shale sector’s debt is about $300 billion, representing only 0.3% of the global non-financial sector debt and 0.7% of the U.S. debt.
Accumulated debt is obviously a big issue for shale companies themselves and for the banks with significant exposure to this sector, but not a big issue for the global financial system.
(P.S.: Dennis, thanks for the link)
Hi AlexS,
Your welcome. Thank you for your excellent comments. I often don’t respond because there is not anything to add and I usually agree with your points. I imagine there are many like me who say to themselves, wow great comment!
Hopefully you realize that there are many of us who appreciate your contributions.
Thank you Dennis,
I also do not comment on many excellent posts (including yours) as I have nothing to add.
Special thanks for keeping this website alive!
Of Interest: Visual: The Oil Market is Bigger Than All Metal Markets Combined
http://www.theburningplatform.com/2016/10/17/the-oil-market-is-bigger-than-all-metal-markets-combined/
Furthermore,
Let’s not forget the U.S. Energy Sector Interest on its debt as a percentage of operating income. In 2015, the U.S. Energy Sector paid 48% of its operating income to pay the interest on its debt. This shot up to 86% in Q1 2016.
How sustainable is this??
Even though the oil price has recovered a bit since the first quarter, I would imagine the U.S. Energy Sector debt service will be 60%+ of their operating income for 2016.
steve
steve
The real danger for the US oil and gas industry comes from rock bottom NGL (around USD 5 per barrel of oil equivalent) and natgas prices (around USD 20 per barrel of oil equivalent).
NGL and natgas represent two thirds of the US hydrocarbon production. Even if oil prices go up a bit, this would not do very much.
Heinrich,
Yes, I totally agree. I read your posts above. I believe there is a lot of “Wishful Thinking” going on about the sustainability of the U.S. Shale Oil and Gas Industry.
Heinrich, you are one of the few here that I enjoy reading. You make a lot of “common sense.” This seems to be missing from the majority of the analysts and commenters.
The debt issue in the United States and world is becoming unsustainable. Which is why more sovereign bonds rates are heading to zero or negative.
If we look at the increase in U.S. debt since Q1 1980, we can spot an interesting parallel with the major U.S. stock indexes. As the U.S. public debt increased 22 times since 1980, the Dow Jones Index has increased 21 times and the S & P 500, nearly 20 times.
There is no COINCEDENCE that U.S. debt and the major U.S. stock indexes increased about the same amount 20-22 times.
Again, another example of PONZI FINANCE 101 based on the massive increase in debt.
steve
“The debt issue in the United States and world is becoming unsustainable. Which is why more sovereign bonds rates are heading to zero or negative.”
May you please explain why bond rates for countries (other than the US) that have unsustainable debt should head lower? If it is unsustainable the rate should go up just like junk bonds.
Jeff,
In a FREE, FAIR & UNMANIPULATED market, you are correct. Interest rates should be heading higher. However, Central Banks (mainly western) are printing money and buying bonds. Thus, they are acting as “Artificial demand.”
Furthermore, the European Union is printing so much money to buy their bonds, investors are moving into the protection of the Swiss. This has forced the Swiss Govt to push its rates to negative yields to try and keep too much money flows heading into their bonds.
Anyhow, the insanity of printing money and buying bonds is now moving into buying stocks. The Japanese Govt is propping up its markets by buying its own stock market, in a BIG WAY. The Swiss govt is buying U.S. Stocks. We also know the Chinese Govt is also buying its stock market.
While the Federal Reserve cannot buy U.S. stocks, it is probably already doing it via the Presidents Working Group on Financial Markets. However, last week Fed Chairman Yellen was suggesting to Congress to consider passing a bill so the Fed could buy stocks.
Once the Fed buys stocks PUBLICLY… bend over and grab your ass, because the collapse won’t be too far away
steve
What is unsustainable debt? How can there be any such thing when a central bank can retire it?
ya ya oh no, that will lessen the value of the dollar! Maybe. Maybe not. Regardless, it’s a separate issue. The CB can retire debt with created money.
Period.
ya need to inflation adjust that guy — which at first glance would look uniform, but ain’t cuz constituent companies of the indexes changed over that period.
Why fudge factor the data? We all know that the factors aren’t realistic.
Why worry about debt, it’s backed by resource, real estate and infrastructure values, as well as productivity that are way beyond the debt. Add up the total value of the US and then compare it to the debt.
legit questions, but it’s not backed by those things — because those things are mostly privately owned. Now you can make the debt backed by those things via confiscation and elimination of capitalism thereby — but not really proper until you DO those confiscation events, publicly and overtly, to wave a hand at one entity’s debt (govt) as being adequately collateralized by a different entity (private owners).
Some of whom are Chinese, in Calif, btw.
I thought we were talking about total US debt, public and private. My mistake.
Mind boggling, but true. 19T is US national debt.
https://en.wikipedia.org/wiki/National_debt_of_the_United_States
“The National debt of the United States is the amount owed by the federal government of the United States. ”
http://www.usdebtclock.org/
Hi Steve,
The nominal GDP in the US has gone up by a factor of 6 since 1980 and the stock market was at very low valuations in 1980 (so you have cherry-picked your starting point). The price earnings (PE) ratio of the S&P 500 was at about 7 in Q1 1980, a typical value is about 15 for the PE of the S&P500. So the reality is the increase from average values has been about 10, and stocks are probably overvalued by roughly a factor of 1.6 at present (PE is about 24 for the S&P 500 on Oct 14, 2016).
http://www.wsj.com/mdc/public/page/2_3021-peyield.html
http://www.macrotrends.net/2577/sp-500-pe-ratio-price-to-earnings-chart
Using BIS data from link below we can look at US Government debt since 1980 by considering Debt to GDP (the proper measure of debt load). From Q1 1980 to Q1 2016 the US Govt debt to GDP has increased by a factor of 2.7.
Note that from Q1 1980 to Q1993 (end of 12 years of Reagan-Bush) the US Govt debt to GDP had increased from 36.4% to 63.6% (a factor of 1.75).
Chart below uses data from the Bank of international settlements (BIS)
https://www.bis.org/statistics/totcredit.htm?m=6%7C326
Hi Steve if we see the stock market price earnings ratios climb to the levels we saw in 2008 to 2009, that would suggest an impending crisis.
For US market as represented by the S&P 500, that is not the case.
Chart below is from link below
http://www.macrotrends.net/2577/sp-500-pe-ratio-price-to-earnings-chart
S&P 500 PE Ratio – 90 Year Historical Chart
“Hi Steve if we see the stock market price earnings ratios climb to the levels we saw in 2008 to 2009, that would suggest an impending crisis.”
No, this means the crisis had already happened, not that it is impending. The 2008 crash was impending in 2006-07 and pointed out by many at that time (e.g. Dean Baker).
The sequence was a buildup of debt, an increase in interest rates, and then crisis. Seems like we are repeating the pattern…
Hi Some Guy,
Steve points out the stock market, in 2008 the PE was roughly 100 for the S&P500, today it is about 24, a pretty common level throughout the past 90 years.
Government debt has increased since the crash, but has been level from 2012 to 2016. It is about 61% higher than before the GFC, if we think it is important for it to be lower, taxes on the wealthy can be raised or military spending can be reduced.
Steve,
I have been thinking about debt a lot. Is debt inflationary or deflationary? Central bankers for sure (except Weidmann from the Bundesbank) think debt does not matter, you can have as much as you want – otherwise they would not pursue the current path.
Much of the debt is sterilized by Central Banks. China, South Korea, Japan…… buy US Treasuries and never sell them anymore. As interests are anyway below inflation it is even an advantage to have debt as the debtor makes money on issuing debt.
However, there is a catch on this strategy. If the current account deficit of the US gets too high ( e.g. through high oil prices and imports) or if we get something which becomes very scarce (e.g. natural gas) inflation will arise and Central banks and other institutions have to sell their reserves.
This is why Wall Street is doing whatever it takes to keep US oil and gas production high – no matter how high the losses. It is all about keeping the US dollar and US reserves stable.
However, this strategy will lead the US economy into a deep depression and we will see negative rates in the US quite soon.
too far from oil, but you have slightly mis-used sterilized.
Sterilized CB actions have to do with equivalent opposite actions at different maturities of the yield curve.
QE long term instruments, and borrow the money back via distribution of short term instruments. Related to twisting but not exactly the same.
Certainly not buying T paper and letting them mature. Wrong word.
It’s all gobbledygook. It’s imaginary substance created from nothingness and enshrouded in its own lexicon and faux complexity.
Watcher,
Long time ago we have had this discussion already.
Again it is you who is mistaken. The mutual manipulation on the yield curve has been called ‘operation twist’ and has nothing to do with sterilization of bonds.
You should be rather carefully think about hitting out at other people with contempt as this just reveals your own shocking incompetence, making the same mistakes again and again.
If this was a proper gift economy– ostensibly, the only real one that’s tied to terra firma– then we wouldn’t be having some kinds of stupid time and energy-wasting conversations that are essentially about nonsense, would we?
I’d say ‘I’m hungry’ and you’d simply throw me a chicken leg, and after I’ve eaten, maybe I’d fix your boots or something. No governpimp, intermediary or money involved.
Don’t remember the conversation.
Not important.
“There have been a flurry of rumors recently about the Federal Reserve investigating “sterilized” quantitative easing. Although the financial media has been harping on the concept, it has provided very little explanation of the actual process itself.
When the Federal Reserve purchases a bond, mortgage-backed security, or other asset as part of typical quantitative easing, it essentially injects cash into the economy, and theoretically the value of the dollar would decrease because of the greater supply.
“Sterilization” at its essence just means that the Fed is not expanding its balance sheet (or creating money) when it purchases these assets because it’s absorbing money from elsewhere in the system.”
Saudi inventories are down to 281 MM BBl in August, which is a 45 MM BBL decrease since August last year and brings us back to levels seen in 2014.
Their inventory is well over 100 billion barrels.
Unfortunately, all of our minds wander from time to time – which I personally notice more and more as I age.
Watcher says: “Their inventory is well over 100 billion barrels.” Well, the US inventory announced today is 469 “million” barrels as of 10/14/16. So, the SA inventory is 213 times larger – enough to supply 100% of world demand out of inventory for more than 3 years. At $50 per barrel, they have $5 trillion in inventory. What budget deficit??
It’s kind of true. It’s called oil production, but nothing is produced. It’s oil extraction. From storage/inventory.
Rent
You could make a case for rent delineating storage/inventory vs something else, but . . . not really. If the oil owner also owns the tank, they pay no rent.
“Rent is that portion of the produce of the earth, which is paid to the landlord for the use of the original and indestructible powers of the soil. It is often, however, confounded with the interest and profit of capital, and, in popular language, the term is applied to whatever is annually paid by a farmer to his landlord.” (Ricardo)
So is oil rent?
If the farmer and landlord are the same guy, no.
Do you get the impression that storage draw down is starting to cover up for supply shortages? Floating storage is down 60 mmbbls or so and effectively done with, even for Iran condensate by the look of things, combined crude/gasoline/diesel in USA is dropping pretty much every week now (big fall tonight), KSA down 40 mmbbls over the year. IEA indicated last OMR report that all OECD levels were down (wont see details until access is available next week). What is most telling is that the analysts expectations seem to turn out to be the opposite of reality every week, that is a sure sign that the trend is turning.
I think they are selling the oil at a higher price than they paid.
A new EIA drilling report came out this week:
http://www.eia.gov/petroleum/drilling/#tabs-summary-2
They have Bakken and Eagle Ford still falling quickly for November (m-o-m predicted decline give 23 and 35% yearly decline rates respectively), with Eagle Ford almost below Bakken for the first time (presumably there may be some corrections over time). I don’t see much seen of either of these starting to pick up with the oil price. Rig numbers are declining if anything, permitting is slowing and land sales seem to be increasing.
Permian is above 2 mmbpd for first time. Niobrara looks like it might be starting a fat tail with reduced decline (I think it is a mix of old vertical wells and newer horizontal which might explain some of this).
1.21 million bpd to 987,000, all formations, a drop in production of some 220,000 bpd.
Because of the low price? Because buyers buy less Bakken oil?
Refiners move to other sources of oil.
Production = oil sold, demand. Demand slows and stops, lower production.
Has to be some storage out there, you see tanks that look like oil could be stored in them, could be empty, more than likely full. I have seen oil wells along the road side, tanks at the pad, must be oil, the pumps are pumping.
Must be some sandbagging going on.
BNSF was down 30 percent on petroleum cars, 9,142 one year ago to 6,354 in week 40, 2016.
Lower demand is the reason for lower production.
http://www.bnsf.com/about-bnsf/financial-information/weekly-carload-reports/
“At today’s prices even if I had a (rail) facility, I would not be buying Bakken,” Yap said.
http://bigstory.ap.org/article/2b71e9e35c194e3182f6a241952b8e9f/shell-halts-proposed-oil-rail-project-its-refinery
tanks at the pad hold water too
During downturns all those unused railcars get stored. The rail lines providing the storage space get paid for the storage period, just another income source for railroads that have spare sidings and spurs. They also get a fee for moving them.
Today it’s in the 80’s about 25F too high. In fact snow and ice are often seen here in a couple of weeks. The leaves are falling off but he grass is still growing. I have my radiation reflectors on the windows today so the house does not overheat.
China production slightly increased last month after several months of declines (decline rate fell to 8.5% y-o-y from 10% last month).
http://www.bloomberg.com/news/articles/2016-10-19/china-crude-oil-production-in-september-rises-from-six-year-low
“September oil output rose 0.3% from August to 3.9 million b/d
Country’s production likely won’t rebound this year: ICIS”
Production in the world’s largest energy consumer added 0.3 percent last month to about 3.9 million barrels a day, rebounding from the lowest since December 2009, according to Bloomberg calculations based on data from the National Bureau of Statistics released Wednesday.
http://data.stats.gov.cn/english/easyquery.htm?cn=B01
That’s China’s National Bureau of Statistics.
Don’t see oil in it. Maybe it’s there and more digging needed.
China oil production (mb/d)
Source: China’s National Bureau of Statistics
Watcher,
the latest numbers in the table are for August. Preliminary data for September is reported in a press-release, probably in Chinese.
China oil production, 2002 – September 2016 (mb/d)
can’t find it. link?
For a similar effect, today’s prices should be above $160 for 2-3 years
Power producers didn’t care about the overall impact of oil on GDP. They only cared that they had cheaper substitutes available. So, the driver of the speed of substitution is the price differentials between the BAU item, and the new competitor.
Sure, power generation was the low hanging fruit 40 years ago. But now, with the development of electric vehicles (hybrid, EREV, EV, etc) passenger transportation is the low hanging fruit.
Even now EVs are growing. If oil rises above $80 that will accelerate sharply. If it rises above $120 it will explode.
Ding ding, we have a winner.
The ceiling on the price of oil is set by the price of *alternatives* to oil.
The floor on the price of oil is set by the production cost.
When the floor for production of the next marginal barrel crosses above the ceiling, all new drilling stops, except for idiots (of whom there are a lot).
Maduro regime short circuits recall referendum.
http://www.bbc.com/news/world/latin_america
This has the potential to throw the country into something approaching civil war, and may well result in a major reduction in oil exports within the near future.
Discussion of the details should probably go in the open topic thread.
Venezuelan bonds coming due in the next few days are as likely as not to go into default.
http://www.cnbc.com/2016/10/21/venezuelas-state-oil-company-is-struggling-under-bond-obligations.html
This will throw a real monkey wrench in the gears of the national oil industry.
Not a lot different than the troika’s imposition on Greece.
CoreLabs released their 3Q2016 results yesterday, which weren’t particularly good and their share price is down today. However they are quite knowledgeable on the state of the world’s reservoirs and gave their expectations for 2017 for the oil industry (they are also one of the few companies that almost always manage not to mix up oil with gas and NGLs). They expect a V-shape recovery in projects like 2008 to 2012 (presumably this implies a similar sort of price rise as well and might be somewhat influenced by their fiscal position, and I think ignores the differences in the economy now versus then). They expect USA production to fall 11% y-o-y with other drops in the usual suspects (Mexico, Colombia etc.) but also Iraq and Nigeria. They give natural decline rates at 3.3% globally, which is quite a lot less than Rystad’s numbers at 5 to 6% (and maybe a result of handling brownfield development and in field drilling differently). I think the 3.3% might be closer the truth, at least for last year: the rate is probably increasing at the moment as maintenance and operating budgets have been cut, and possibly from short term, older initiatives to boost production when prices were high that are now running out of steam.
http://www.oilandgas360.com/clb-core-laboratories-believes-recovery-already-underway/
… financial, not fiscal.
George,
I think Rystad’s 5-6% annual decline rate estimate is the average for the fields that are in declining stage of their life (similar to earlier estimates by the IEA).
3.3% probably refers to all currently producing fields
Alex I think that is probably true except there was a report concerning recent increase in decline rate and in that it was stated that an increase that looked to be about 0.9% from the chart shown was equated to a drop of 700 kbpd, which implied that the decline is on about 85 mmbpd (i.e. full global production). It may be that the reporter misinterpreted things as well. At 3.3%, and assuming 1 mmbpd growth to maintain BAU, requires about 4 mmbpd new production in projects each year, and there is nowhere near that going forward – about 2.5 next year, a bit less in 2018 and then no more than 0.8 at the moment for 2019 and 2020 (maybe Iran and Russia can fill the gap) and then dropping to zero in 2023. Things just get worse with higher decline rates.
Baker Hughes rig count out – USA up, especially in the Permian, but a big drop in Canada almost all on oil (maybe to do with Thanksgiving there ?).