STEO
The EIA’s Short Term Energy Outlook (STEO) was published in early January. The chart below estimates World C+C by using the STEO forecast combined with past data from the EIA on World Output.
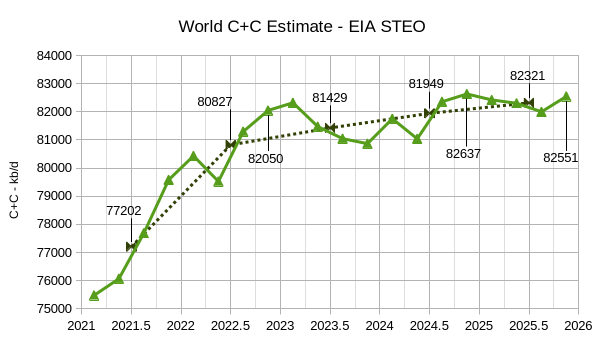
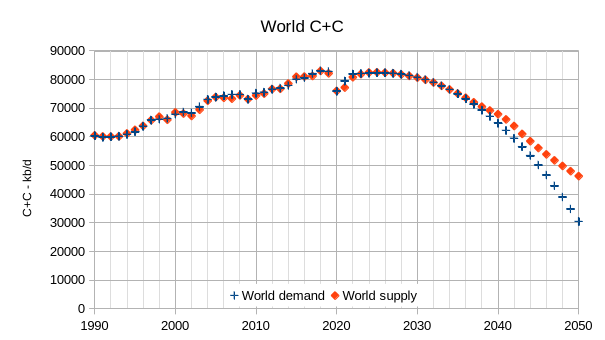
The EIA’s Short Term Energy Outlook (STEO) was revised lower for both 2023 and 2024 C+C output compared to last month by 522 and 396 kb/d respectively. World C+C output is expected to decrease in the 4th quarter of 2023 and increase 2024Q1 followed by a decrease in 2024Q2 then an increase and then flat output through the end of 2025. Annual average World C+C output increases by about 502 kb/d in 2023 to 81429 kb/d, then to 81949 kb/d in 2024, and rising to 82321 in 2025 about 679 kb/d below the annual average in the peak year of 2018. The average rate of increase in World C+C output from 2023 to 2025 is about 285 kb/d per year using the OLS trend, but note the small increase from 2022Q4 to 2025Q4 of only 501 kb/d over 3 years an average annual increase of only 167 kb/d. (See 82050 and 82551 kb/d shown on chart.) Also from 2024Q4 (82637 kb/d) to 2025Q4 (82551 kb/d) the EIA projects a fall in quarterly output of 86 kb/d.
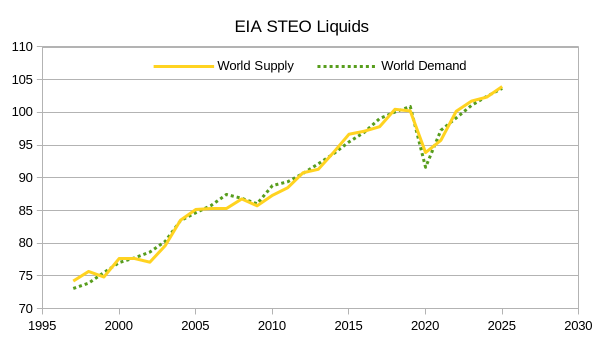
The chart above looks at quarterly World Liquids Supply and Demand from US EIA international Statistics from 1997 to 2023Q3 and then uses the STEO forecast for World Supply and Demand from 2023Q4 to 2025Q4. It is apparent there are significant periods of low supply from 2000 to 2013.
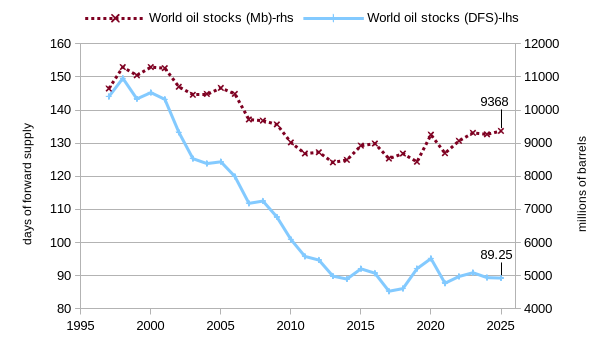
The chart above assumes the the STEO Supply and Demand estimates are correct and also assumes about 140 days of forward supply is held in World stocks at the beginning of 1997. This level was chosen so that in 2022 and 2023 the stock levels would be about 90 days of forward supply. A big drop from almost 150 days of forward supply in 1998 to about 89 days of forward supply in 2025, if the STEO forecast is correct.
Tight Oil
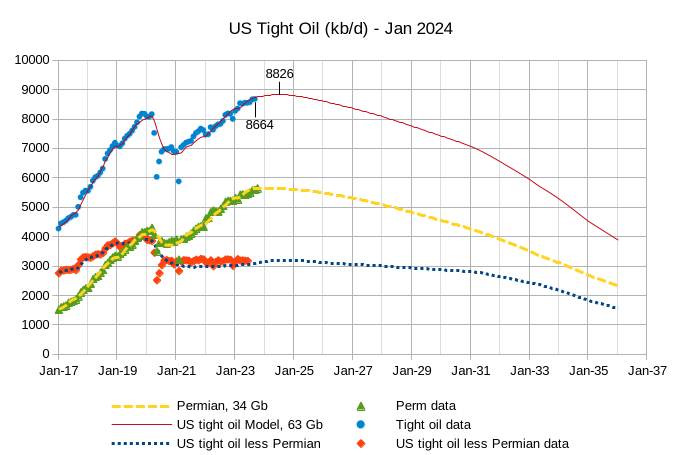
The tight oil scenario above updates all scenarios for a better match to the latest data. The non-Permian tight oil basins decline more gradually starting in 2031 to reflect an update to my demand expectations with demand falling below supply in 2035, this is discussed later in the post. The updated tight oil scenario peaks in July 2024 at 8826 kb/d, about 162 kb/d higher than the October tight oil estimate of 8864 kb/d.
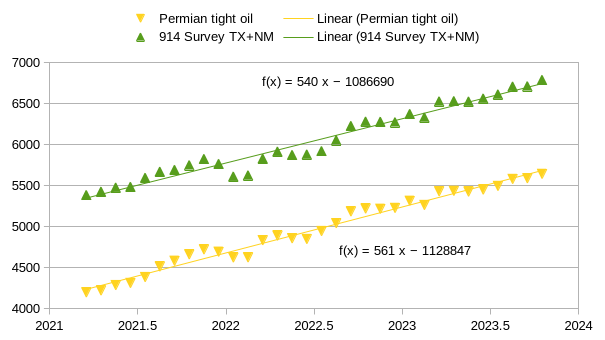
The chart above compares my Permian basin tight oil estimate with the EIA’s 914 survey of large oil producers (about 90% of total) in Texas and New Mexico, the difference between the estimates is about 1000 kb/d which is roughly the output of the Eagle Ford play over this period. The trends are very similar at annual rates of increase of 561 kb/d for the Permian basin vs 540 kb/d for the 914 survey data for Texas and New Mexico.
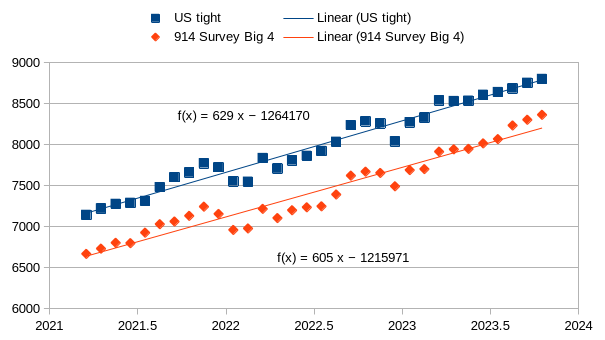
In the chart above the “Big 4” refers to the largest 4 oil producing states in the US, Texas, New Mexico, North Dakota, and Colorado. The 914 survey data from large oil producers in these 4 states is compared with my estimate for US tight oil output (which uses data from Texas, New Mexico, and North Dakota’s state oil agencies, data from Novi labs, and data from the EIA’s Petroleum Supply Monthly and the EIA’s tight oil estimate.) As for the Permian basin, the trends are similar at 629 kb/d for the annual rate of increase for US tight oil vs 605 kb/d for the annual rate of increase for the Big 4 914 survey. The roughly 600 kb/d difference in the level of output may be due to several tight oil plays that are in other states besides the Big 4 such as the Powder River Basin in Wyoming, the Anadarko Basin in Oklahoma, and the Uinta Basin in Utah. There are also small amounts of tight oil produced in the shale gas basins in Pennsylvannia, Ohio, and West Virginia.
Oil Shock Model
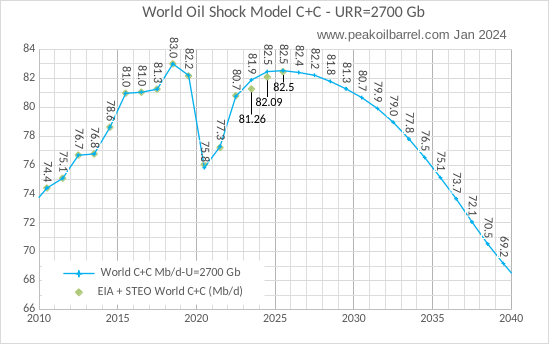
The World Oil shock model has been revised in line with the tight oil model presented above, the EIA STEO estimates for 2023 to 2025 are presented and labelled on the chart (81.26, 82.09, and 82.5 Mb/d) these estimates are actually lower than my model for 2023 and 2024. Beyond 2035 demand may be below this supply estimate and oil prices may fall to adjust supply lower to match demand. Clearly it is not possible to predict the future with any accuracy, this is a guess that will evolve as the future unfolds. The assumption is that oil prices remain in the $70 to $85 per barrel range over the period from 2024 to 2034, higher oil prices might lead to higher output and lower oil prices to lower output.
World Oil Demand
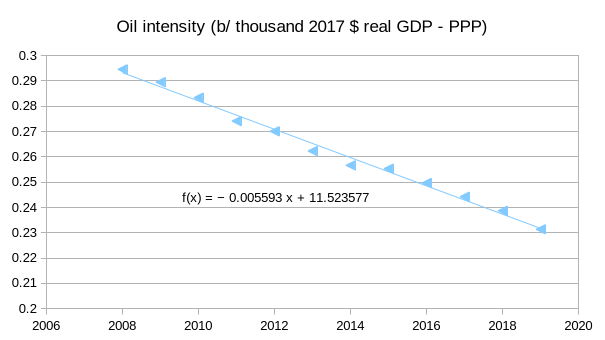
The chart above uses World real GDP in 2017 international dollars (PPP) data from the World Bank (link here) and refinery throughput data from the Statistical Review of World Energy 2023 to measure World demand for crude plus condensate. Longer term the oil intensity falls a bit faster at -0.007 per year based on the trend from 2000 to 2022. In the model below for World oil demand I assume the trend shown in the chart above continues from 2023 to 2026 and then the rate of decrease gradually increases by 0.0001 each year until reaching -0.0066 in 2036 and then holds steady at that rate until 2051. A transition to electric transport would be the reason for the gradually increasing rate that oil intensity decreases. I will remind everyone that is is a guess and that higher or lower estimates could be used, my guess is certain to be incorrect. The supply model is from the Oil shock model presented earlier. Spreadsheet with data for demand model at this link.
207 responses to “Short Term Energy Outlook and Tight Oil Update, Jan 2024”
Dennis Coyne,
Well I looked at you 2012 links. Anything a little more recent?
Try this even though i am not a fan of Oilprice.com but it is widely reported.
https://oilprice.com/Latest-Energy-News/World-News/Hertzs-Big-Move-Into-EVs-Turns-Out-To-Be-A-Dud.html
and
https://www.euractiv.com/section/road-transport/news/eu-targets-to-suffer-as-consumers-shun-used-electric-vehicles/
and
https://www.acea.auto/pc-registrations/new-car-registrations-6-7-in-november-battery-electric-16-3-market-share/
look at the share of EV’s `Jan -Nov –
and
https://www.thisismoney.co.uk/money/cars/article-12597325/EV-sales-falling-short-targets-forced-manufacturers-2024-buyers-steer-clear.html?mrn_rm=rta
Have a read. I do not have cognitive bias or groupthink. I see it as it is, and this is all very recent.
I am one of those that looked at an EV and walked away. Some year back I had a taxi ride in Amsterdam in a Tesla. the taxi driver was no a fan. Too many electronics and too many gimmicks. Why do you need retractable door handles? Why? Why does Tesla have a $4000 iPad controlling the beast? ( A $1000 iPad would do just as well)
I am not against Ev’s in principle. But most are tun on a mix of unreliables and fossil fuels and they will stress any power grid, OPM will pay to subsidise EV’s.
Carnot,
From 2023
https://climate.mit.edu/posts/how-much-are-electric-vehicles-driven-depends-ev
From 2020
https://climate.mit.edu/posts/how-much-are-electric-vehicles-driven-depends-ev
From 2021
https://its.ucdavis.edu/blog-post/no-electric-vehicles-arent-driven-less-than-gas-cars/
I didn’t post anything from 2012.
The subject is how much EVs are driven vs ICEVs, not interested in gish gallop.
Here is worldwide plugin sales growth from 2012 to 2022 average rate of growth is about 42% per year. If we look at 2019 to 2022 the average rate of growth is 52% per year.
Usually people count BEVs and plugin hybrids together which would have about a 21% share YTD. The fast growth is occurring in China, when BYD starts exporting to Europe, they will take a lot of market share. The transition won’t happen overnight, some will wait and will save money as prices will fall. You might consider a Prius Prime, if you like the Prius.
I prefer to skip the petrol station, just plugin in my garage. Most charging occurs overnight when rates are lower and grid demand is low.
Plugin hybrid vehicle and battery electric vehicle share of global light duty vehicle sales was about 13% in 2022. Roughly 1.8% of global light duty fleet were plugin vehicles (plugin hybrid and EV) at the end of 2022.
https://mobilitynotes.com/2022-light-duty-vehicle-sales-by-powertrain-and-regional-split/
Dennis,
My apologies. I am a terrible typist. I meant 2021 of course. Using 2021 data in a fast growing market is a little disengenuous. What really matters, and what is really goung to affect the gasoline consmption is the % of BEV in the car parc. PHEV’s are not relevant as they are not eidespread and most of the driven iles are from gasoline. In the EU PHEV sales are actually declining. I do no do Gish Gallop. I use the best data availabe and have an open mind.
If you bother to look at the ACEA link the BEV sales in the EU actually declined as a % of sales in 11 months of 2023. December sales are not yet availabe. The actual volumes of BEV’s will probably be about the same as 2022. BEV’s look like being about 15% of the total. It remains to be seen how 2024 shapes up but it looks as if BEV sales have reached a plateau which is worrying goverments across the EU. To date the Eu has about 3.5 million BEV’s in a car parc of 300+ million vehicles. IT is going to take a long time before the gasoline demand falls. At present gasoline demand is growing as buyers switch from diesel to gasoline.
Had there not been subsidies BEV sales would likely be even less because the buyers are in the main companies. Private buyers are few and far between and they are wary of used BEV’s. No-one wants a used battery
Read the press release about Hertz. No real surprise and it mentions all the issues of resale values, repair costs and high running costs (tyres, brakes, electrical issues)
15 yeara go I spent many years working between the EU and the US. I was in the US every month flying and driving around the country. A BEV rental car would have been an absolute nightmare. How would I charge it up?.A real problem for a road warrior. Many of my y colleagues have succumbed to BEV’s due to tax breaks- subsidies. Many now regret their choice.
We are probably at an inflexion point in terms of growth of BEV. Two things need to happen. They need to be affordable and the charging infrastructure needs to improve as mus the cost of ownership ( repairs, insurance, reliability) I do not see this happening soon and for this reason private buyers will be scarce. I have been looking at the price for 3 year old Teslas. <50 % of the new cost, and that is with price falls.
I will send you an update of my model fuel consumption for gasoline and diesel next week.This is for light vehicles only
Carnot,
I use the data I can find, specifically I was looking for average miles driven for ICEV vs EV, We don’t have full year data for 2023 yet, from 2019 to 2022 the average rate of growth in plugin sales was 52% per year, there will be ups and downs as governments change incentive poilcies. The TCO for a new EV purchased today is very favorable, charging infrastructure for a Tesla in the US is fine and many brands will have access to the Tesla Supercharging network soon.
When prices fall for a product, depreciation will be steep. The Model Y did not have any incentives available a few years ago, in some places in the US there are combined state ad federal incentives of 11k, bringing Model Y to under 40k, about 20k less than the MSRP a few years ago. I don’t think you will find a Model Y for 20k or even 25k in the US unless it is very high mileage or has been in a serious accident.
The Model S and X depreciate faster, the comparable car would be a Mercedes E class or BMW 5 for depreciation. The relevant car to look at is the Model 3 and Model Y, and compare with Mercedes C or BMW 3 class (or equivalent cless of SUV in thos brands (X3 for BMW) for depreciation for an apples to apples comparison.
Carnot,
YTD sales of plugins (Jan -Nov about 22%) which is pretty good, much better than US, not as good as China,
Sales of older technology is always a problem, prices should fall to levels that make these vehicles a bargain for those not able to afford a longer range EV, good for short trips around town (which accounts for a lot of VMT.) Mandated sales levels are never a good idea, grant incentives through tax breaks and let the consumer decide is a better approach. Eventually prices of EVs fall to a level that incentives are no longer needed, probably by 2029, perhaps sooner.
On the Hertz story, depreciation should have been anticipated and they misjudged demand for EVs, they are reducing their EV fleet size to match demand.
Not all EVs have retractable door handles. You’re complaining about Tesla, not EVs.
Think he’s only complaining about model S. The 3, Y (newer models) don’t have retractable handles…
Thanks, Dennis, great post. It’s really looking peakish, isn’t it? I just love your “Oil Shock Model” post. It’s something I could almost agree with.
Thanks for the great work.
Thanks Ron,
Yes if prices remain where they are 2018 may remain the peak. I am unsure if my demand scenario will be correct, odds are 50/50 that prices will be either above or below my forecast for an average oil price of $75/bo in 2023$.
The updated Oil Shock Chart URR 2700
when superimposed with The Plateau chart I had previously shared
shows the peak plateau being the period from 2014 to 2032…18 years.
Peak plateau being defined as world C C centered on 82 Mbpd /- 3Mbpd (4%).
The plateau is now past the 1/2 way point.
And soon down for good.
Hickory,
If you download the spreadsheet with the oil demand model, it also gas the oil shock model as the supply scenario. So you could create a chart with the new model, if you wanted.
I have very poor skills at database interaction, and too busy with work to take the time to learn properly.
But I did give it a shot doing the cartoon version on ‘paint’.
Without getting too deep into it, it looks like a tighter description of The Plateau is 81 Mbpd plus/minus 2 Mbpd (less than 3%).
This extends for 17 years from 2014 to 2031.
About 8 years left.
Realizing that this is based on a bunch of assumptions on how things play out. I doubt your model projection will end up being off by much.
Thank you for the continuing update process. I think it helps everyone to wrap their mind around whats coming up, despite everyone’s attempt at denial.
Thanks Hickory,
I think the box could be extended to 2032 when the model has average annual output at 79 Mb/d, so 2014 to 2032 or 19 years with a midpoint of 2023. According to this plateau hypothesis, June/July 2023 is the midpoint of the plateau and we are just 7 months past midway.
Many of us may already have enough electricity to run our EVs. For those of us who have an electric water heater, simply replacing it with a heat pump water heater can save enough energy to run a typical family’s electric transport needs.
https://cleantechnica.com/2023/10/06/a-heat-pump-water-heater-will-save-all-the-electricity-youll-need-to-power-your-electric-vehicle/
https://oilprice.com/Latest-Energy-News/World-News/Citi-Cuts-Brent-Oil-Price-Forecast-to-74-in-2024-on-Ample-Supply.html
Brent Crude oil prices are expected to average $74 per barrel this year, Citi said in a note, revising down its previous forecast by $1 a barrel, due to expectations of excess supply.
The researchers at the bank also slashed their Brent forecast for 2025 by $10 per barrel, and now see the international benchmark averaging $60 a barrel next year.
Dennis
As we all know Europe and US, Canada oil demand has peaked, each US individaul uses about 20 barrels of oil per per year. The Average European around 10.
Unfortunately the world has 6 billion people who use much less than we do in Europe and they are all increasing their consumption.
India which has 1.4 billion people, individuals only use 1.5 barrels per year.
Everything that is going on in India tells us that they are following China in their oil consumption. An article written by a journalist looking at India’s development said, everywhere you go, you see roads being built, airports, and power stations being built.
https://www.news18.com/news/india/the-single-statistic-that-shows-why-indian-roads-are-getting-more-congested-each-passing-month-2031835.html
and they are building 8 to 10 thousand miles of roads each year to accomodate all those diesel and petrol cars (99% of sales)
https://timesofoman.com/article/133135-building-of-roads-contributes-to-indias-growth-story
India’s oil consumption is going up, only thing to guess is will it peak at half European average or go higher.
At 5 barrels per person India will be consuming not 5 million barrels per day but 15 million. and still be using a quarter what each US person uses.
India will never consume 15 million barrels per day period.
Would you like to elaborate based on current growth?
At current oil consumption levels New Delhi is the most polluted city on earth. Traffic is already insane. More cars aren’t the answer but the ones that are selling there are quickly converting to electric. EVs don’t waste energy idling. In urban traffic electric vehicles are ten or more times efficient than gas vehicles. Almost zero electric vehicles were sold in New Delhi in 2020, it’s already 20%. Sales of gas cars will likely be banned in India by 2030.
“ A record 19.5% of vehicles sold in the city in December were electric, the highest reported in any state till date, according to Delhi’s transport department.”
https://www.msn.com/en-in/autos/news/evs-account-for-195-of-total-vehicle-sales-in-delhi-last-month/ar-AA1mTkHl
The answer of course is buses and fortunately they are working hard in that regard also
https://www.reuters.com/world/india/india-approves-7-bln-plan-electric-buses-nearly-170-cities-2023-08-16/
If you’ve ever ridden on an electric bus the ride is amazing compared to a diesel bus. Gas buses switch through numerous gears at low speeds and this creates a constantly jerky ride. On an electric bus the acceleration is very smooth and it is easy to read. It’s more like riding on a light rail line.
Stephen
Sales of electric cars have increased in India, it will be interesting to see the sales figures after April when the Indian government will stop subsidies it can no longer afford.
I have said many times, only integrated public transport with very regular trams, trolley buses and trains will ever fix road congestion.
India’s electric bus scheme will not scratch the surface.
This looks like chasing after the USA and China to me
https://www.airport-technology.com/features/10-biggest-airport-projects-india/?cf-view
Agreed- expanding air travel is short-sighted. Better spent improving their rail network. I did see that on Wikipedia that about two thirds of their rail cars are electric with the remainder diesel
Charles,
I expect India’s oil use will increase while other areas will see a decrease, impossible to forecast this correctly, It may be that you are correct, oil prices will give us a hint. I have thought since 2015 we would soon see oil prices rise to over $100/bo, except in 2022 due to disruptions due to sanctions on Russia this has mostly not occurred. This alternative hypothesis is to explain the low oil prices we see. Perhaps that will change.
Charles,
China has lead the way on a rapid EV transition, India can import cheap EVs from China and they do not have a large legacy light duty vehicle fleet, the transition to electric transport could be particularly rapid there. It is not difficult to install EV chargers, very simple really, it will be much cheaper than petrol. The recent price for a US gallon of petrol in India is about $4.75($1.25/l), in China it is $4.33($1.14/l). Prices from
https://www.globalpetrolprices.com/gasoline_prices/
Also see
https://morth.nic.in/sites/default/files/RTYB_Publication_2019_20%20(1).pdf
Only about 2.7 million passenger vehicles were sold in India in 2020-2021, about 82% of motor vehicles sold in India are 2 or 3 wheel vehicles (2 wheel motor vehicles at 81% of the total) commercial vehicles are only 3% of the total.
In 2020 India had 326 million registered motor vehicles, of these 75% were two wheel vehicles and about 44 million of the vehicles were cars, jeeps or taxis.
About 5% of the two wheel market is EVs, so a lot of room for growth here as prices of EVs falls. Charging infrastructure needs to be expanded. The Indian Government can facilitate this transition, there is also an opportunity for private businesses to establish charging networks or a consotium of private EV producers in India with potential government incentives.
It is an interesting space, TCO is pretty good for EVs and they may take market share rapidly.
Dennis
I prefer my explanation, that the dark fleet which has doubled in size in the last 3 years is actually transporting crude oil and not teddy bears.
Also the numerous articles I have read give a scale of false accounting and theft and lack of pipeline meters has enabled large scale oil hidden production.
Anyway as I said this is at it’s peak now. So what happens next will be more important.
China declared oil consumption despite all those electric vehicles was 17 million barrels per day in October 2023.
Americans and Europeans have for so long been used to consuming what they want and assuming others will make do with a fraction of what they use.
They are simply constantly surprised how Chinese or Indians are starting to use more and more and catching up with our consumption habits.
https://www.airport-technology.com/features/10-biggest-airport-projects-india/?cf-view&cf-closed
I think it will be a case of the world using the maximum of everything.
https://ourworldindata.org/grapher/coal-consumption-by-country-terawatt-hours-twh?tab=chart&time=1987..latest&country=IND~CHN~OWID_WRL
and 2023 is even higher
Charles,
The dark fleet may be transporting oil that was transported before by the normal tankers. Still no source for your claim of 5% more oil being consumed than is reported by major agencies.
I go with the data reported by major agencies, they match up pretty well, seems silly to make up other numbers from my perspective.
Dennis
What is silly is you believe that after 30 years of the world using more oil to produce more GDP you make yourself believe that global GDP could increase by $10 trillion with oil consumption falling by 2mb/d.
You probably think all the timber that goes onto the world market is all legal and all counted. I will not bother to attach studies conducted by journalists risking their lives to find out how criminal gangs get hundreds of trucks in and out of forests with the help of corrupt officials who are paid not to count of the trees cut down.
Going forward, you now clearly state oil consumption will peak this year and oil prices will not go over $100.
I am sure oil consumption will continue to grown until global oil production can no longer increase.
This will be around 2028 plus or minus one year.
Once US production starts to decline, OPEC spare capacity will be used up.
OIl prices will increase from 2025. The global oil price will be over $100 most of the time after 2026 while there is growth. Obviously global recessions will cause price to fall.
Agree – Conflating production and transportation of oil is a fools errand…
Charles,
Your scenario is exactly the same as my previous scenario, it might be correct, the alternative hypothesis is the explain the fact that refinery throughput decreased from 2019 to 2022 while Global GDP increased. What happens to future oil demand depends on future oil intensity and real GDP growth. I have presented one scenario based on a single set of assumptions, if the assumptions are correct, the scenario might be correct.
Download the spreadsheet, make your own assumptions, or create your own model and present it in the comments with a link to a spreadsheet if you want to share your model as I have done.
I only believe GDP can increase with less oil use because that is what has occurred from 2019 to 2022, now I could create an alternative reality with different refinery throughput numbers, but I choose a fact based analysis.
Charles,
Still waiting on the source for your estimate that oil consumption is 5% higher than EIA or Statistical Review of World Energy estimates. I might believe it if I saw the source for this and it is reliable.
On Chinese Oil demand, the link below suggests gasoline inventories are swelling
https://www.energyconnects.com/news/oil/2023/november/china-s-oil-demand-outlook-is-worsening-as-winter-approaches/
Its funny how they call less oil demand a ‘worsening’ condition.
I think of less demand as a ‘better’ condition,
considering the current status and trajectory of population, energy supply, climate destabilization, and the overall human crush upon the natural world.
hickory,
I agree. I think the article is from an oil industry perspective, for an oil producer less demand may mean lower oil prices and fewer profits, these are a bad thing for those companies. It may be good news for the planet though.
Citi tends to be bearish. Thus, their analysts have been more on point regarding prices since 2015.
It seems like the other large banks have called for $90+ on and off during the past decade, but 2022 was the only year they were correct.
I hope someone owning an EV that lives anywhere in the Midwest will post his or her experiences using the car in this extended subzero weather.
Ervin,
I live in Maine and have had an EV since 2018, it is not a problem. Snow tires help, but I have used those during winter since I moved to Maine in 96.
It’s funny how persistent folks criticize EVs for not being exactly like ICEs as though the environment that made ICEs proliferate will remain constant. My $.02 we’d have been be better off pricing gasoline $3 more starting two decades ago and eliminating various incentives that made light trucks economical commuter vehicles than trying to encourage the sales of more expensive EVs. But here we are. My 26 yr old F150 is done. Maybe I’ll replace it with a 15 yr old F150. Not commuting here and it’s useful for the twice monthly dump run.
LEEG,
In Maine nearly everyone drives either a Ford or GM pickup truck, they are useful, but a hatchback with an old blanket thrown in the back often gets the job done for me. If I was a tradesman, I would use a Van. When I need a pickup truck occasionally I rent or borrow one.
I tow a utility trailer with my Fiat 500e. Cuts the range in half, but that’s no issue on my building supply, yard waste, and dump runs. Vehicle weight, torque, and regen braking all add up to making EV’s great for towing within their range.
“It’s funny how persistent folks criticize EVs for not being exactly like ICEs”
Indeed!
News Flash- the world is changing whether or not we want it to, or are ready for it.
Changing in very big ways. Try to see the trends, try to adapt.
The exceptional moment in history where a working man could drive down the road in a pickup with a tank full of petrol just to go the ball game, the church or a bar
is near the end of the chapter.
Rig and Frac Report for week ending January 12
– US Hz oil rigs decreased by 3 to 454, the lowest count over the past six weeks and down 118 since November 25, 2022. Allowing for an average six month time lag from Spud to production, when will we see US production starting to plateau and then drop?
– Permian rigs were down 2 to 296. Texas Permian was unchanged at 208 while NM was down 2 to 88. In New Mexico, Lea county was unchanged at 44 while Eddy dropped 2 to 44.
– Eagle Ford dropped 1 to 47.
– NG Hz rigs were unchanged at 106 (not shown)
Frac Spread for Week ending January 12
The count was down by 2 to 234, the same as the previous low of 234 on December 29, 2021.
Fewer rigs, Fewer Frac crews.
Hey Dennis, great post, probably your most sobering, the ending is quite dramatic. Could see that graph as a movie poster for “The Ovi & Coyne Greatest Shit Show on Earth”…production should start soon 🙂
https://en.wikipedia.org/wiki/Five_stages_of_grief. Stage 5 is the place to be, and to maybe help get there, a Soutpark retrospective on the remarkable achievements of homo-sapien-colossus…lol. https://www.youtube.com/shorts/gzZmFwWmLBw
“Nuclear is the perfect antidote to the energy challenges facing Britain – it’s green, cheaper in the long term and will ensure the UK’s energy security for the long-term”, Prime Minister Rishi Sunak said in Thursday’s announcement.
“This is the right long-term decision and is the next step in our commitment to nuclear power, which puts us on course to achieve net zero by 2050 in a measured and sustainable way”.
https://www.rigzone.com/news/uk_plans_to_build_third_new_32_gw_nuclear_plant-12-jan-2024-175360-article/
As I mention long ago, nat gas will bridge the industrial economies to nuclear. YOU have to have your head up your backside not to have seen that coming. And while we are on the subject of nat gas, as I also mention months ago the long term forecast was favorable. if the forecast continues to pan out, US storage for nat gas will return to if not dip below the 5 year average in the next few weeks supporting prices above $3.00mmbtu. I am long pipelines for the long term as even canada is now approving them.
https://docs2.cer-rec.gc.ca/ll-eng/llisapi.dll/fetch/2000/130635/4429798/C28001%2D1_Commission_–_Letter_to_Trans_Mountain_–_TMEP_–_Mountain_3_Horizontal_Directional_Drill_Variance_Application_–_Decision_of_the_Commission_%2D_A8V7I8.pdf?nodeid=4429882&vernum=-2
The era of “green” energy hype is now over in favor of energy security that actually works. Now we pray the long forecasted (mine) potential cold weather catastrophe is averted, but it may very well push parts of the county to the brink before this winter is over. Joe Bastardi has the winter of 2014 as his more recent pattern comparison, IE endless winter.
https://twitter.com/BigJoeBastardi/status/1745829512825258085
For the next decade or two it looks like nuclear is going to run as hard as it can just to stay in place.
Beyond that…we will see how things play out.
China which has the most aggressive nuclear industry in the world, and the best ability to get big projects done, is making very slow progress with nuclear capacity additions as the chart below shows. The WWS redline is
wind/water/solar, although it is noted that no big hydro plants came on line during that timeframe.
You might find the 2023 World Nuclear Industry Status Report interesting to browse. It is chock full with info. (the chart I show below is not from this report)
https://www.worldnuclearreport.org/IMG/pdf/wnisr2023-v4-hr.pdf
Status report on Chinese nuclear power plant installations
https://www.world-nuclear-news.org/Articles/China-approves-construction-of-four-new-reactors
Texastea,
Nuclear is fine for your backyard, I would prefer wind and solar in mine. Natural gas is fine, you just need state government subsidies to make it reliable. Didn’t work great in February 2021 as I recall.
Texastea,
A different perspective from yours
https://oilprice.com/Energy/Energy-General/Is-the-Texas-Grid-Ready-for-This-Years-Polar-Vortex.html
This is how it looks currently in the US, with the 2yr STEO [short term energy outlook] tagged on.
Although the current administration has approved 2 new nuclear reactor designs, bringing the grand total since 1950 up to seven, the industry is not finding traction (even with big subsidies). In fact at this rate its going to be hard just to run in place and keep generation at current levels since the fleet is getting older.
Maybe in the next decade, or in the 2040’s, there will be some renewed growth in the industry. Maybe being a key word.
Nuclear has never been a huge economic success with most plants needing subsidies or special additions to consumers bills to keep going. That’s because the EROEI is terrible, barely returning the energy to build, operate and maintain them, all before the cost of dealing with spent fuel..
At some point it will register with people that the dollar cost is very much related to the energy cost. Nuclear costs a huge amount relative to the electrical energy it puts into the grid, many multiples of a simple coal plant of the same size. Also the operating costs of nuclear are horrendously high as per the World Nuclear Association, with USA plants averaging $US29.13/Mwh in 2022, a year when the average price of oil was $60/Mwh.
Why would any commercial enterprise decide to invest in nuclear with such poor economic metrics?? All the talk of nuclear having an EROEI of 100 are just hot air. If that was close to true, they would be huge profit generators and companies would be chaffing at the bit to build as many as they could..
https://www.artberman.com/blog/evs-will-have-no-effect-on-oil-demand/
JB,
A lot of gasoline is produced by cracking longer chain molecules in heavy oil, if gasoline use decreases less cracking will be done so that a higher proportion of product will be middle distillates.
Since 2010 Norways oil consumption in metric tonnes (which reflects energy used better than volume) has decreased on average at about 1.4% per year. Art Berman’s post is not very convincing, more EVs sold (the rate of sales growth fro pugin vehicles from 2012 to 2022 was about 42% per year) will lead to less oil consumption, but it will take time. The growth rate in sales of new plugin vehicles was about 52% per year from 2019 to 2022. In July of 2023 plugin vehicle sales in China reached a 38% share, with EVs at 26%. China has a big lead in EV manufacture and the west is falling behind, with the possible exception of Tesla. China may dominate future EV sales Worldwide once demand flattens in China and they begin to export EVs more aggressively.
Yes but the data clearly shows oil consumption per car is flat in Norway. So, any oil use transition away from EVs will take a lot of time. A lot.
Their decrease in oil consumption elsewhere is from other sources, not EVs. Which the decreased oil consumption could be tied to flatlining GDP growth:
https://www.macrotrends.net/countries/NOR/norway/gdp-gross-domestic-product
I think the point I would try to make is that oil will either 1) flatline at best if oil prices are favorable or 2) will have demand destruction if prices skyrocket. The demand lowering forecasts presented are way too optimistic unless significant price destruction.
JB,
Perhaps correct, I agree it will take quite a bit of time for plugin vehicles to make an impact on demand. Total oil demand is the important number in my view and that has decreased even though demand for other uses of oil (water transport, air transport, rail transport, and heavy duty truck transport has likely increased in Norway.
See
https://www.theglobaleconomy.com/Norway/gasoline_consumption/
Chart below from web page linked above it is Norway’s gasoline consumption in thousands of barrels per day, the average annual decrease from 2015 to 2022 is about 2.57% per year.
JB,
Real GDP Norway
https://fred.stlouisfed.org/series/CLVMNACSCAB1GQNO
Berman cites US consumption per vehicle, we don’t have that data for Norway. For the US EV penetration is far lower than Norway, about 10 times less, perhaps 2 to 3% of the light duty vehicle fleet at best for 2023. This is not enough to see an impact. In Norway, Berman used “fossil fuel consumption” instead of oil consumption, and even the oil consumption metric is not as good as gasoline consumption, but that data is harder to find (behind paywalls).
Let’s assume for a moment the World follows Norway with 2.57% decreases in gasoline demand and then eventually diesel demand starts to fall by 2.57% per year. This may be faster than the supply of oil falls and would lead to low oil prices to match supply with falling demand.
We will see, China is moving very fast, India might adopt the Chinese model and expand its light duty fleet with EVs rather than ICEV, much of the motor vehicle fleet in India (80%) is two wheel vehicles, which may be able to be replaced with EVs more quickly due to smaller batteries that are more easily manufactured and charged. TCO would be very attractive.
For sure, absolutely. And that’s why the market is where it’s at!
Norway’s motor gasoline consumption went down by almost 40% between 2012-2022. LPG also down. But diesel consumption went up and so did “other liquids”. Note the Covid19 drop! Amazing how long it took after the 2nd oil crisis to reduce use of fuel oil
https://pbs.twimg.com/media/GDSHEEaaEAA88iv?format=jpg&name=small
Matt,
Great chart thanks. Better at Matt’s link, but for those that don’t like to click links.
Could one call this chart a graphic representation of the principle “There Is No Free Lunch”?
What accounts for the big increase in diesel over the past 20-30 years?
Diesel engine technology has improved a lot.
Hickory,
Perhaps just normal growth of the Norwegian economy and perhaps also a shift to diesel cars before the transition to EVs started in Norway. Also there was a reduction in residual fuel (perhaps used in water transport) and maybe this was replaced by distillate fuel use. It may be a bit of both effects.
In a similar vein:
https://medium.com/@stevebull-4168/todays-contemplation-collapse-cometh-clxxiv-b6f7f8c4c597
Using Data from the Statistical Review of World Energy for Norway’s Oil consumption
Dennis – That’s great, can we see similar for US (or maybe the key states where EV adoption has had the greatest impact)? Maybe California, Florida, and Texas? Those 3 states consume almost 30% of fuel/nat gas in US…
Kengeo,
Much lower EV penetration in US vs Norway, even in California. For US no we do not see a decrease, in California that data is not very good. Roughly 1800 million fewer gallons of gasoline were consumed in California in 2022 compared to 2017 (about 12.5% less consumed in 2022 vs 2017).
https://www.cdtfa.ca.gov/DataPortal/charts.htm?url=FuelGasJetStats
California has about a 4% share of ZEV (zero emissions vehicles) compared to Norway’s 23%.
https://www.energy.ca.gov/data-reports/energy-almanac/zero-emission-vehicle-and-infrastructure-statistics/light-duty-vehicle
For Texas and Florida the numbers are probably much lower than California.
It will be interesting to watch China where in Nov 2023 42% of new car sales were plugin vehicles, a lot of these are plugin hybrids in China, 15% and 27% EVs. The YTD market share for plugins in China for 2023 is 37% with a 35% increase YOY in plugin sales. For BEVs the YTD market share is 25%. Total plugins sold YTD is about 7.11 million with about 872k sold in November.
https://insideevs.com/news/703633/china-plugin-car-sales-november2023/
Thanks Dennis – Not too surprising. I think most/many early EV buyers didn’t necessarily drive high mileage for several reasons (with some exceptions):
1 – lack of sufficient charging infrastructure between ~2013 and 2018
2 – generally low mileage drivers due to high cost of vehicles.
Pandemic effects likely impacted 2020-2023 overall drop in EV miles driven (as well as all vehicles).
Looking at US oil consumption, 1983 thru 2004 had a steady increase of ~1.5% annually from 15 mb/d to 20.8 peak in 2005. Since then it’s made progressively lower (slightly) peaks. 20.5 mb/d in 2019 and 20.2 mb/d in 2023.
Imports have been steadily falling since 2005 peak at ~12.5 mb/d to present net imports <0.
EVs will need to get into the light-medium duty segments in order to have a meaningful impact (replace diesel vehicles)…
On the topic of EV.
https://energyskeptic.com/2024/tesla-semi-trucks-hauling-corn-chips/
Also in Norway, Oslo is transitioning to all electric busses. But a lot of diesel busses had to be put into service this December because of the cold.
A different evaluation of the Tesla Semi
https://topelectricsuv.com/news/tesla/tesla-semi-all-we-know-feb-2022/
also
https://www.nextbigfuture.com/2023/09/comparing-tesla-semi-versus-diesel-semis-with-real-world-data.html
California passed a law stating that all new semi trucks had to be electric. From my understanding of the situation. Because of the time involved in charging. One individual truck can only do about 2 hauls per day compared to 6 hauls a day for diesel trucks.
A lot of these drivers can’t make it work as they are only able to deliver 1/3 of the cargo per day due to charging times.
So if this is correct we’d need 3 times the trucks and three times the drivers to move the same amount of cargo over the same amount of time.
HHH,
The law applies mostly to short haul drayage trucks at shipyards and state and federal government fleet trucks in California.
https://ww2.arb.ca.gov/new-california-requirements-heavy-duty-vehicles-and-trus
Yes, But the owner operators are saying financial they can’t make it work. Mainly due to the recharging times. These truckers are saying they can’t make a living due to recharging times.
If what they are saying is in fact true. It would apply to all trucking. Say the law expands to all trucking. The price to haul cargo is going to go through the roof.
Drivers will have to be paid the same for 1/3 of the amount to cargo moved as they would using a diesel rig. And you’d need 3 times the amount of drivers and trucks to move same amount of cargo.
Prices of goods delivered would have to increase by as much 300% in order to accommodate the recharging time.
Now how many people’s wages will be going up 300% ???
Heck who wages will be going up 25%
Until the technology gets better if it ever gets better. Electric semi trucks don’t economically work. And we will need every drop of diesel possible.
For drayage operations, lots of stop and go, perfect for EVs which don’t require energy to stand still, no idling engine and low speeds are where the EV shines, the law is not intended for private truck owners, it is for fleets mostly government owned. The technology can be perfected before requiring private companies to use EVs. Perhaps that won’t be needed as the technology improves.
It’s the drivers at the port that are complaining about the the down time having to recharge.
Apparently electric semi’s aren’t good for every application at the ports. Apparently it takes a hour and a half to charge 70% needed to do their second run of the day. And they can only do 2 runs instead of the usual 6 they do with diesel trucks. In order to do 6 runs they’d need to charge twice a day for 2 hours each or 4 hours total between runs. These drivers can’t make it happen in a 10-12 hour day.
These are their words not mine.
All I’m saying is with current technology we still need the same amount of diesel and adding electric is going to raise the cost of shipping big time.
There for the cost of everyday goods goes up big time while wages don’t.
Sound inflationary but ultimately prices would crash because they are directly related to disposable income available to spend. With everything at record debt the debt servicing cost is going to crowd out available dollars to spend.
If not a financial crisis at very least a balance sheet recession where debts are paid down. Which means a strong contraction of the money supply.
With Americans and Europeans having to tighten their belts. China will remain in deflation because China absolutely depends on US and Europe consumption to keep everyone employed in China.
Heck China absolutely depends on BAU continuing in the US and Europe to keep their people employed.
I could state how the above leads to lower energy prices and consumption but it’s obvious.
Heck China needs Russian energy flowing to Europe to keep demand for Chinese made goods flowing into Europe.
If shale oil and gas production were to fall due to lack of DUC inventory and there for export of LNG fall. Europe has a big problem. And so does China as the number 2 destination of Chinese made goods runs out of gas.
If the US wants to move all of it’s manufacturing base back home or near home we going to need all of our natural gas.
Have you ever shipped anything overseas? The shipping cost are becoming ridiculous. I ship stuff all over the world. Getting stuff into Israel is costly. 4 pallets of medical supplies from the US is over $50,000 shipping charge. This was before the Houthi’s started attacking ships in the Red Sea.
While that is a drastic example. The cost of shipping products all around the world isn’t cheap. Shipping American LNG to Asia will now cost a lot more. Might even be cost prohibitive.
HHH,
With proper charging infrastructure the heavy duty trucks can charge in 30 minutes.
Oslo had a pretty good tram system when I lived there, but last I read it had lost passengers partly because the government incentives to use EVs had been made so strong.
Sure, there have been some problems regarding electric buses in Oslo in the not normal cold weather minus 10-20 celcius in some periods this winter. It is mainly due to shorter range and more frequent recharging than planned. And the electric fleet of buses have been expanding rapidly in recent years. There is a major inconvenience when the buses are not going according to schedule in extreme winter weather; but we a rather spoiled are we not? Experience with electric cars are that you have to plan for 30-40% less range (to be on the safe side) in extreme cold, and have a model that pre warm up your battery. Then you are actually ok.
The infrastructure build out in a city like Oslo is going at a rapid speed at the moment. I am not involved in any of the decisions taking place, but they all seem sensible. I would guess the city would get to “as good as it gets” when it comes to being prepared for a low carbon consumption and relying mainly on electricity in the future on this northern lattitude. Thanks to oil legacy wealth to make upfront investments. The tram system is for example expanded and the trams are being replaced with newer models. A little bit too expensive to use I would argue. Still, we are along with for example Great Britain very reliant on global trade being a maritime nation historically. So we do not have an easy way to insulate ourself from what happens globally.
https://www.coxautoinc.com/market-insights/q4-2023-ev-sales/
Expect major revisions in the next month, October, EIA international report. They have Saudi Arabia’s September oil production is up by half a million barrels per day. The OPEC MOMR has had them up only one-fifth of that amount, up 100 Kbpd per day. Somebody got it horribly wrong. And I expect it was the EIA.
Ron
I think the problem is August. It appears to be too low.
Global oil demand
This is just one airport that India is building there are dozens built or being built over the last decade
https://en.wikipedia.org/wiki/Noida_International_Airport
and China is still building many more
https://english.news.cn/20230511/f55197baef2e45289608babef4b0d351/c.html
Very interesting video. Dennis and the blog get a mention.
https://youtu.be/aw8LOS2y8qs?si=-2-Tod9HtIou1M6i
Edit: most of the data comes from this blog.
Thanks, Lightsout. I missed Dennis’ post of the link, but here it is again:
Peak Cheap Oil Debate – Doomberg / Peak Prosperity Podcast show Review
I watched the entire video and also the follow-up reply to the first video:
Putting a Ceiling on the Equilibrium Price of Oil – Doomberg vs Peak Prosperity Podcast
Both videos are fantastic! However, they both deliver very horrible news. Peak oil is here right now, and nothing will replace it. Gas to liquids is a horrible idea. The largest gas-to-liquid plant in the world, actually the only one In Qatar, will replace 0.1% of the daily oil we use today. He failed to mention it, but there is only one other gas field in the world as large as the one in Qatar. That is in Iran. So there could only be one other such gas-to-liquids plant ever built as large as the one in Qatar.
Both Dennis’ and Ovi’s charts are used extensively in the first video. Congratulations to both of you guys. Great work. But everyone should watch these videos. I think they both paint a true picture of our situation in the world today. And it is not a pretty picture.
Edit: The largest gas field in the world is located mostly in Qatar territory. It is called “North Dome” and the part in Iranian territory is called “South Pars”. This gas field is by far and away the largest in the world. No other gas field comes even close to the size of this one.
Qatar-Iran ties: Sharing the world’s largest gas field
Thanks Ron for elaborating much better than I could.
As a resident of Europe the coming decline in US shale production is of particular concern as the cargoes of LNG are literally keeping the lights on.
Heh. Art Berman has a lovely takedown of Dickberg here:
https://www.artberman.com/blog/doomberg-embarrasses-himself/
“Doomberg has built his thesis of energy abundance on a house of cards.”
I worked with people from Shell when Pearl was being built and it just sucked capital and resources away from all other projects.
According to wikipedia, first commercial shipments from Pearl were in 2013 (but of what?). It was named Shell’s Asset of the Year in 2021.
Did Pearl make any significant technological improvements to GTL?
I think this is one of Doomberg’s points, initial development is difficult, but with time becomes economic. I thought LNG would always be a niche industry, today it’s mainstream. I thought fracking couldn’t survive without supercheap debt, but now it looks like above a reasonable oil price its profitable. Is it reasonable to consider that GTL follows the same path?
In a tight energy market, natural gas goes to the oil price in energy equivalent terms. For decades in the US natural gas traded at the No 2 fuel oil price. The coal to methane plant in North Dakota made gas instead of liquid fuel because it was thought that the US had a natural gas shortage which was due in fact to that tax on interstate sale of natural gas. In 2008 there was a cargo of LNG into Thailand that sold above the oil price. So at Pearl Shell is throwing away 40% of the contained energy of the natural gas to sell a liquid at the same price as the feedstock. Laherrere is predicting that US shale gas production will be falling at the rate of 1 million barrels per day energy equivalent from 2025. It is going to get interesting.
Just on Pearl and GTL in general.. If the ‘world’ decided that was a good use for gas, then using all the remaining gas in the 20 largest fields, including North Dome/South Pars, if we replaced ‘all liquids’ (about 100mbbls/d) with GTL, it would buy 4.5-5 years at most. We would have to build 714 plants like ‘Pearl’ to ‘make’ the 100M bbls/d, and after the 4.5 years, then what??
It’s just another dead end, short term waste of resources, let alone the 50% of energy used in the process and the associated CO2 into the atmosphere.
Qatar/ Iran could have gas use for the next thousand plus years, if they didn’t think short term to use as much as possible in as short a term as possible. Pearl by itself, is just short term thinking, it never should have been built..
I think the gas gathering system used quite lightweight platforms that used a novel design. The FT plant was fairly standard just much bigger than previously tried. There was some problem at start up with filters getting blocked, I don’t know much more than that. I think the low grade waste heat (of which there is a lot) is used for desalination, it would.make sense but I’m not sure. The main problem is that there is just so much pipework and equipment. I’ve seen a autocad model and the plant just goes on and on, all packed solid with metal stuff. I seem to remember some report at the time that this single plant took some significant proportion of all of some type of steel and/or pipes being made in the world (can’t remember the details).
Am I right that it only produces around 150kbpd diesel plus about half again of light fractions? So figure out what proportion of oil industry capital let alone the human resources available in the development divisions would be needed to give 6 mmbpd. Where are the undeveloped fields big enough to support one of these plants, keeping in mind the local area would lose access to the gas. In Qatar a lot of the unskilled wort would have been indentured labour so $20 billion might seem cheap and the the cost would rocket if you tried building these concurrently.
They may have waited 8 years for the award so everybody had forgotteb what a total pain it was at the time.
Ovi’s charts also get used extensively in the podcast. The podcast fails to mention that my scenarios depend on the assumption of low future demand and do not fit in with the podcasts assumption of very high future oil prices.
Note that my scenarios used in the first podcast are based on the assumption that oil prices remain low due to lack of demand. If oil prices rise to $140/bo in 2023$ (Average real oil price for Brent oil from 2011 to 2013), then oil supply will be higher than the scenarios I have been presenting recently. Peak in that case would be in 2028 at around 84 to 85 Mb/d and decline in output would be slower if there is enough demand to keep oil prices high.
In the podcast a number of $25/gallon for gasoline is thrown out as one potential future scenario. Lets say this implies crude oil prices at about 8 times higher than at present (where gasoline prices are about $3/gallon in the US), so crude at say $75 times 8 or $600/bo for Brent in 2024$. There would be many oil projects that get the go ahead (FID) at such a high oil price and there might not be adequate demand for all of the oil that could be supplied at that oil price, in my opinion.
Below is a scenario consistent with oil prices at over $100/b in 2023$ for Brent crude. Note the URR increases to 48 Gb for Permian basin, close to the USGS F95 TRR of 45 Gb, the mean USGS TRR estimate is about 75 Gb for the Permian basin.
Martenson does not even understand what doomberg said.
https://www.youtube.com/watch?v=c8hZryPAc20
Doomberg never said the US would produce the amount of tight oil that Martenson showed in his fake graph.
Doomberg clearly says various countries around the world could increase oil production significantly.
Venezuela for instance if it were not a political cesspit could get the best IOCs to ramp up the production of heavy oil. Venezuela oil production was heading to 4mb/d and could have got to 8 according to experts. It does have 250 billion barrels of oil reserves.
https://www.forbes.com/sites/rrapier/2023/02/21/inside-venezuelas-contradictory-oil-industry/
Iraq with 100 billion of oil reserves could easily produce another 2mb/d, geology is not the restraining factor but incompetence and corruption at every level.
https://www.brookings.edu/articles/corruption-is-the-forgotten-legacy-of-the-iraq-invasion/
Iran dictatorship spends most of it’s money on building nuclear weapons, brutal internal security and funding terrorists.
What could Nigeria produce without corruption, what could Sudan, look at how the west left Libya after bombing it for weeks.
https://www.hrw.org/world-report/2023/country-chapters/libya
What could Canada produce if there were no legislations in place
Will every corrupt oil producer remain corrupt, probably.
Is that final supply curve much different from the one I developed based on bottom up analysis of Laherrere’s data in 2018?
I don’t believe oil demand will ever be suppressed by other technology, it is just too good, i.e. the best fuel and chemical rfeedstock we are ever going to find by a long way and every bit of it that is available will be sought after and used. However things are looking likely to start falling apart because of extreme weather, economic contraction, social disruption, political moves towards autarkies, oil export unavailability, exponential increase in migration, pandemics, famines etc. – take your pick, so the down slope is going to be much more bumpy and possibly steeper overall.
George,
The supply curve data can be downloaded at the end of the post, you can compare with your analysis from 2018. The URR is about 2650 Gb. Perhaps demand will never be subdued, demand for crude has been gowing pretty slowly from 2018 to 2022, and perhaps even in 2023. Beyond that we can only guess, your guess is probably better than mine.
We are below zero F with -30 F wind chills here. We did drain and shut in a few of our low volume leases.
I see it is currently —26 F with -50 wind chills in Williston, ND. Don’t know if this weather will knock January production there a little, but wouldn’t surprise me if it does.
It’s currently 14 F in Odessa, TX, but sunny with a high of 37 F. Assume no freeze issues in the Permian?
Oil production in very low temps is not fun. I’m always amazed at how they get stuff done in the Bakken, Canada and other parts of the world that are very cold in winter. Lots of tough folks for sure.
Speaking of which, is there a tougher oilfield to work in than the Alaskan North Slope? Below zero and dark for months. Anyone here ever work there or somewhere else with tough conditions?
Of course, I’m just mentioning onshore. Some offshore stuff I’ve seen is really rough.
The lengths we go to for oil!
Shallow,
Hope you are staying warm.
There are several online videos showing large waves hitting oil rigs in the North Sea with the Dunbar rig and moonpool footage particularly dramatic.
i still vividly remember looking down from the deck of the Piper Alpha and seeing relatively ‘calm’ swells that measured -20 foot/+20 foot on the adjacent rig’s pontoon markers.
40 foot peak to trough.
Amazing engineering, construction and operational expertise required to produce oil in those conditions.
Shallow Sand
Lea County is going to be coolish for the next few day. Up here in southern Ontario it is -22 F today. The house is being heated with reliable NG.
Your chart is in degrees C, not F. I am about 150 miles due west of Lea County, and it is about 15 degrees C warmer here than in Lea County. I am in Dona Ana County, New Mexico. Strange that it should be so much colder there.
The “n” Dona has a squiggly line above it and is pronounced “enya”. So, Dona is pronounced “Donya”
Ron
I just assumed US temperature would come up in Degs F.
Ovi, you can click on the C or the F just to the right of the temperature and get whichever you want. You can see that the C is in bold, and the F is not, meaning you have C.
Got it
My first job in the oil patch was 50 years ago. As a juggie on a seismic crew in far western Queensland. Leaving the breakfast tent we were given a choice of cans on table for lunch. You didn’t know what you were getting because the labels had worn off on the 1,200 km trip from Brisbane. No can openers on the line so we bashed the tins open on the corner of a Landcruiser trayback and ate with our fingers. Sometimes the contents were disappointing.
Oiiprice.com reporting Bakken production reduced by 280k BOPD due to cold.
-26 F in Williston now with -45F windchill.
Will warm up, but not above freezing anytime soon.
With us, once we shut in, we can’t resume on those leases till we have a few days above freezing. Why we try not to shut in.
Not sure if the same applies in the Bakken.
Dennis
A lot of interesting charts. Based on your World Shock model and LTO projection, the world is close to possibly a Peak Demand scenario in 2025. I say Peak Demand because I think OPEC has enough reserve production capacity to meet required demand in 2025.
Attached is an expanded view of the EIA STEO Liquids chart, your second chart. It shows how supply exceeded demand through most of 2022 and 2023 which resulted in OPEC plus initiating their production cuts. For 2024, seven months are in surplus but overall, the year will be short by 1.5 Mb/d, which is a staggering shortage if correct. February is particularly short, 2.39 Mb/d. At this point, WTI price action does not indicate a world shortage.
Dennis
Attached is the latest data for US production from the 914 report and the STEO. For 2024, the STEO is showing essentially no growth for 2024 in the L48. From October 2023 to December 2024, production growth is 25 kb/d. This is consistent with the DPR model which has been showing flat production for the last few months. Not clear on the source of the 300 kb/d production increase for 2025.
Ovi,
Thanks.
Yes the STEO seems to be quite conservative in their predictions for 2024, I think we will see a small increase for Onshore L48 production in 2024 through July (an increase of only 64 kb/d), followed by decline through Dec 2025 (202 kb/d from July 2024 to Dec 2025). The tight oil scenario is quite conservative and assumes oil prices of about $80/bo for Brent crude ($75/bo for WTI) in 2024 and 2025. I assume new well productivity in the Permian falls by about 4% per year starting in Jan 2022 and the completion rate gradually declines starting in November 2023. As always any scenario beyond October 2023 is certain to be incorrect including the one presented below, many assumptions have been made, all of them will be wrong. A big assumption is lack of demand leading to falling oil prices after 2035, the scenario would be very different if we assumed high oil prices in the future due to increasing demand for oil.
” A big assumption is lack of demand leading to falling oil prices after 2035, the scenario would be very different if we assumed high oil prices in the future due to increasing demand for oil.”
What might it look like in the latter scenario?
JB,
The tight oil model below assumes high oil prices and high completion rates, I did this scenario in October 2022, it is likely too optimistic based on my current thinking, but if oil prices were over $140/bo in 2023 US$ from 2025 to 2040, it might be possible.
Gotcha, thanks! Runs with common sense: higher oil prices = more areas economical = more output.
Dennis – For the world oil shock model, can you pinpoint what causes the model to decline by only 2 mb/d between now and 2032? From 2032 – 2040 it declines from ~80 to 70.
My best guess is that it will have an average annual decline rate of 1.5 mb/d between 2025 and 2050.
This brings URR to ~2,300 Gb by ~2070. I believe your model reaches ~2,500 Gb by 2070.
I suppose your model is factoring in the Unconventional oil decline plus the impact from EVs….
I’m not convinced a gradual production decline over the next decade or so is in the cards.
It would be great to see this model based on the top 10 producing countries data (maybe as a QC of sorts).
Kengeo,
The model assumes that demand falls below supply around 2035 and results in falling oil prices, I assume tight oil completion rates start to fall more rapidly as a result, see my tight oil model which has output decrease from 7.26 Mb/d in 2030 to 1.25 in 2040 ( a decrease of 6.01Mb/d). In addition the extraction rate for conventional oi is assumed to increase from 2023 to 2034 and after that it is flat until 2040. Also note that producing reserves for conventional oil start to decrease after 2022 at a gradually increasing rate. In addition I assume extra heavy oil production starts to decrease after 2033 due to falling oil prices assumed in my scenario. Conventional oil output falls by 6.6 Mb/d from 2030 to 2040 for the model.
Thanks Dennis – I took a stab at a bottoms up approach, here’s what I got:
US will be the largest annual declining country by far, around 0.8 mb/d annually.
Russia + Saudi Arabia will be next both around 0.35 mb/d annually (total of 0.7 mb/d annually).
Then Mexico + Brazil for a total of 0.25 mb/d annual decline.
This works out to annual decline from these countries of 1.75 mb/d.
Right around 2% annual decline rate.
For some reason this ends around 2030 and decline rate drops to ~1% (not sure exactly why).
There is large opportunity for a couple countries to increase production (Canada, Iran, Iraq, Kuwait, and Venezuela).
From present level to 2035, I get a drop of 10-15 mb/d.
I suspect this is optimistic, it assumes BAU, which seems like a bad assumption since we are going into uncharted waters…
Numbers below for 2024 and 2035:
Kangeo
What is the source for C + C of 77.65 for 2024?
My own estimate (likely off a bit)
According to this article OPEC has 5 mm bbl spare capacity. Is that realistic ?
https://oilprice.com/Energy/Energy-General/Fundamentals-Point-To-Flat-Oil-Prices-in-2024.html
Daniel
You are right to question the so called spare capacity which is OPEC+ and not just OPEC. I would beand remain sceptical about such claims as no-one has access to what “spare” capacity actually exists, especially in the OPEC+ states. We have to take the KSA capacity at face value- it has never been audited.
Spare capacity is a misnomer. It means that the capacity must be available within 30 days and sustainable for 90 days.
In these budget stressed times no-one can afford to have spare capacity standing around costing money, and because of depletion capacity to produce is constantly being lost- look a the Permian Basin. But is also occurs in conventional fields so very roughly about 5% of the productive capacity is lost each and every year. That means that every month about 400 kbd is lost- gone. It is a moving target.
You are reading Oil Price.com BS, with data form the EIA ( sometimes referred to as the Energy Inaccuracy Agency) and the World Bank. My impression of these two entities is not great. Just look as the DPR nonsense. Both are full of political appointees.
Daniel,
No it is not realistic. OPEC spare capacity only exists in Saudi Arabia, UAE, Iraq, and Kuwait, all other producers are producing all that they can, the spare capacity which I define as output that can be brought online within 60 days and sustained for 12 months is about 2100 kb/d for OPEC, this level was last attained for these 4 nations (the Big 4 of OPEC) in October 2022 for the centered 12 month average (at a level of 20849 kb/d), in November 2023 the big 4 of OPEC produced 18756 kb/d.
I don’t understand how the world is projected to be on a plateau when US growth is the reason why the World is currently on a plateau and not on a decline curve
https://peakoilbarrel.com/wp-content/uploads/2023/12/US-Tot-4.png
OPEC+ cuts are the reason why the World is currently on a plateau. But for OPEC+ cuts, we will see increasing production.
Peakoiltracker,
If OPEC was not cutting output, oil prices would be lower and many tight oil producers would complete fewer wells so that tight oil output would fall, so not clear you are correct. The market is demand constrained at present, this might change in the future, we’ll see.
Svaya,
The model assumes that as US output declines other nations will increase output (Saudi Arabia, UAE, Iraq, Kuwait, Canada, Brazil, and Guyana) enough to keep output roughly on a plateau (within about 79 to 83 Mb/d). The peak for the updated model is 2018 with a secondary (lower) peak in 2025 about 500 kb/d below the 2018 peak.
Keep in mind the model is based on assumptions and those assumptions are certain to be wrong, the future is not known.
Occidental
CEO of the company sees supply not meeting increasing demand by 2025.
https://oilprice.com/Energy/Crude-Oil/Occidentals-CEO-Sees-Oil-Supply-Crunch-from-2025.html
If this is the case we will start to see prices gradually but consistently rising after 2025.
Thanks, Charles. This article is excellent. Here are two critical paragraphs from the article.
The ratio of discovered resources versus demand has dropped in recent decades and is now at around 25%.
……..
The additional oil and gas demand over the coming decade needs new upstream investments to offset the 5-7% annual decline rates, Nasser noted.
Nasser is the CEO of ARAMCO and knows what the hell he is talking about. ARAMCO has been warning us for over a year that we face a serious production problem. It is time we took notice. Of course, no one will pay him a damn bit of attention. People know what they know or think they know. And they know that renewable energy production will rise faster than fossil energy will decline. And that is total absolute bullshit if bullshit ever existed.
Nuff from this old fart for today.
He says- “2025 and beyond is when the world is going to be short of oil.”
I wonder- when the ‘world’ is short of oil where does that show up, and just who is short?
It does show up as higher price around the world.
But if high prices doesn’t weed out enough consumption,
where does physical supply get restricted?
At some point, geopolitics is going to come into play on the question.
The fallout on energy supply disruption from the Russian invasion of Ukraine
being a sneak preview of this kind of action.
Hickory,
There are more than 4 billion barrels of crude stocks worldwide. The world can be in a small ~1MMbpd deficit for quite an extended time.
KDIMITROV
In a ideal world you are correct, but we are in a world in which, “he who has the gold, makes the rules”.
That means at the first sign of shortage the tanks will be padlocked PDQ. It will be a free for all and all ideas of sanctions working are wishful thinking. The oil, exporters, and there are not that many will dictate pricing.
Look at who the main consumers are and you will see the problem. Very roughly, CEU (all), China, US, India, Japan, South Korea in that order.
The US might think that they are sitting tight when LTO rolls over but you would be wrong.
LTO has limited application in the US with the current refinery configuration, which is why it is sold and heavy crude oil is imported.
The US has a very high gasoline demand – about 45% of the barrel, compared with the EU which is under 20%. EV’s will have no measurable impact on crude demand any time soon. Much of the gasoline in most parts of the world is made up primarily of FCC gasoline, because it ts octane number and vapour pressure is close the spec. FCC’s consume heavy distillate which is in limited supply in LTO grades.To run an FCC or hydrocracker you need crude oil of about 28-34 API. Russian Urals is such a crude and was extensively used in the EU prior to the Ukraine invasion. Now it goes to China and India at a discount, only to be refined and sold to the West.
The main exporters are the ME countries ( KSA, UAE, Iraq, Kuwait and Oman). Rouggh export quantities are in mb/d (2022 data):
ME 21.9
CIS 9.3
Africa 2.8
M/SA 0.5
KSA produces circa 10 million b/d buy has numerous local demand and JV partners
Local Demand 3.3 mb/d
JV partners 3 m/bd
Asia exports 1.75 m/d
Some ad hoc quantities were also sold to India and other locations.
So go figure. KSA makes up half the ME volumes, but very little product actually is sold on the open market. Most Saudi oil is sold on contract referenced against a benchmark, so the idea that the US, EU and Asian countries can draw on ME crude is wishful thinking. The UAE, Kuwait, Oman have growing internal demand. Iran and Iraq are a mess, but China is building relationships with both.
It is being made worse by ESG investors (now in decline thank goodnes) and decarbonisation demands, especially in the EU. Refining assets in the US and EU are under pressure and investments are being very carefully scrutinised. Not so in China. They are in the process of building out no less than 9 major refining-petchem projects that will consume in excess of 2.8 mb/d by 2027 which will raise Chinese demand to about 19 mb/d. They are about to crush western petchem producers.
So using very simple language we are likely to be in deep doo-doo when the LTO dream comes to an end. This will cause another financial crisis but this time the dollar will not be in such a strong place as de-dollarisation of world trade increases.. I do not predict oil prices as it is a fools game. A price flip up will stoke inflation and stress budgets. Affordability will loom big-time, and it will affect everything.
Carnot,
Yes, if the prevailing narrative is what you say, of incoming shortages, then hoarding becomes a big thing. That was actually a thing in 2008-2014.
However, that’s not the narrative now. We have all kinds of opposite narratives: “oil glut from USA, Brazil, Iran, Guayana, Venezuela”, “global recession is just around the corner”, “China is cooked”, “energy transition/EV –> oil is out”… In this type of environment and with interest rates well above what they used to be a couple of years ago, many players would gladly destock a little bit. “dollars in the bank” is a more profitable proposition than “barrels in the tank” nowadays…
Who is going to hoard oil?
Hoarded oil is of no value.
Saudi Arabia needs to sell its oil to finance free schools free health care and very cheap electricity petrol and water.
Electric vehicles are starting to reduce the increase in demand.
The question is will production fall faster than demand?
I think production will start to fall in 2028 once opec spare capacity is used up and Brazil, Guyana etc are close to peak.
More electric vehicles will mean demand from the US and Europe will start to fall
But demand from India, China will ensure higher prices.
Kdimitrov,
Often it is said the World aims for about 90 days of forward supply, if we look at crude plus condensate only at roughly 82.5 Mb/d consumption in 2024 (a guess at crude input to refineries) this would suggest about 7.4 Gb of crude stocks if the 90 day goal is being met. So yes well over 4 Gb of stocks, if we were 1 Mb/d short on supply vs demand, perhaps enough for 10 years, if we assume half of the stocks (3.7 Gb) is the system minimum (barrels in pipelines, tank minimums, etc. just a guess of 50% of total stocks.
I see oil prices (US) consistently increasing by around 1% per month for the foreseeable future.
As always, there will be shifts up and down but the base price will go up considerably between now and 2030.
In step, I see inflation running 10-15% each year primarily on account of increase in oil/fuel costs…
By 2030 a gallon of fuel will be at least $10.
Kengeo,
If you are right about oil prices, then oil supply won’t decrease as fast as you believe it will. So by 2030 you expect the price of a barrel of Brent crude will be about $230/bo in 2023$ (this is about 3 times current price to reflect gasoline prices increasing by a factor of 3) ? Using your 1% per month increase in price we get about $167/bo in July 2030, so perhaps that is a better guess. If you are right on price, I would expect a glut of oil as supply would increase by more than demand. I doubt we see those prices.
For those that think inflation will be high with high oil prices, from Jan 2011 to Dec 2013 real oil prices averaged about $145/bo in 2023 $ and the US rate of inflation was about 1.6% over that period. The longer term rate of inflation from Jan 1995 to December 2019 was about 1.84%. I used the data from the link below, which is the preferred inflation measure of the US Fed.
https://fred.stlouisfed.org/series/PCEPI
So inflation might not be as much of a problem as some believe with higher oil prices, if they go to $300/bo in 2023$, perhaps we will have a problem, but this would tend to speed the transition to electric transport, which would reduce demand while supply would increase and oil prices would fall.
Dennis – I think we are reaching the limits of oil supply, therefore because oil is the king of inelastic supply-demand economics, very large price movements are needed in order to have any effect on the supply-demand balancing dynamics (as seen during COVID and the negative oil prices).
The middle east is waiting to see US supply start to decline and then will take some very aggressive cuts to production to get the price where they want it (>$100). This would give them $30-40B annually in revenue.
At $100/barrel, gas of ~$7 per gallon, this still seems extremely cheap. A prius for example can travel for $0.15 per mile. By comparison, a Tesla charging at $0.56 per Kwh travels at about the same price. The prius costs ~$30,000 and the tesla around $40,000.
kengeo,
This is quite plausible, however, I guarantee you that we’ll not see a steady 1%/mo price ramp.
Oil market is for all intends and purposes a financial derivatives market. Price fluctuations are prevalent because of changing narratives, macro winds, news cycle, even regular seasonality… The fundamental pressures are visible only on very large (super-cycle) time scales. Monthly prices do not respond to your type of reasoning.
KenGeo, I agree that
“At $100/barrel, gas of ~$7 per gallon, this still seems extremely cheap.”,
considering what you get.
However when it comes to light transport anything over $5/g starts making EV’s look like a bargain. For example, my wife has a mid-size AWD EV that to charge up costs the equivalent of $1.50/gal of gasoline. She charges at home close to 100% with a flat electricity rate, so its easy for us to calculate.
The equation would be different if you lived where electricity rate were higher, or if you generally charged at commercial ports where they take their cut.
I suspect that the next episode of high oil will spur a big jump in EV adoption. All of the ingredients are now in better alignment for a big boost.
I’m paying 40 Euro-cents / Kwh here in Germany – and 1.68 € / Liter Diesel.
So it’s not much difference whether I take my current Diesel (I’m at 5.5 Liter / 100 km) or an electric car that goes on 20 Kwh on realistic driving.
Eulenspiegel,
Over 121k km, I have used about 0.153 kWh/km in my Model 3. So about 15.3 kWh/ 100 km times 0.4/kWh=6.12 Euros per 100 km vs 1.68 times 5.5 or 9.24 Euros per 100 km.
Eulenspiegel —
I’m paying 40 Euro-cents / Kwh here in Germany
You’re paying too much. I pay 26 cents. Change your provider. Also at that price rooftop solar is a no brainer. You can set up your own mini Balkonkraftwerk with a couple hours work if you can’t find an someone to set up a bigger system — the solar companies are massively overworked right now.
Kengeo,
I live in a state with high electricity rates over 22 cents per kWh, there are not many places in the US where electricity costs 56 cents per kWhr, perhaps a few in Europe. In China electricity is about 7.6 cents per kWhr. Even at my high electricity rate this is equivalent to $2.75 per gallon in a Prius getting 50 MPG.
Our rates are 13 cents/kWhr, and I see now that there is a higher use tier of 15 cents .
And if you charge at night the rate goes down to 8 cents/kWhr.
Almost 1/2 of the electricity supplied by the utility are non-fossil.
Pretty sure he means supercharger price, or on the road price.
Hideaway,
Most charging is done at home rather than at Superchargers. Where I live the Supercharger rate is usually about $0.45/kWh. In this case the Prius is indeed cheaper at $3/gallon assuming 50 MPG (that was my average when I owned my 2004, 2009 and 2015 Prii).
As Dennis pointed out most EV charging in the US is done at home…according to the Dept of Energy roughly 90%.
And this comment about pricing reinforces what has been said-
“It’ll [Prices] vary wildly based on location. Here superchargers are .33-.45/kwh while my home rate is .06/kwh so supercharging is 5-8x more expensive …
Kengeo
Do you know what the price of Brent Crude was in 2011 and 2012?
Do you know what that equates to today?
Do you know the inflation rate in the US in 2011 and 2012.
you are just repeating all the stuff we heard on The Oil Drum 16 years ago.
Efficiency counteracts increasing costs. Today with electric vehicles being sold in the millions each month will ensure the price of oil does not hit the sort of highs people were concerned about in 2008 when electric cars did not exist. Today about 500 million families can afford an electric car, this will be enough to moderate the oil price to some degree.
Not sure what 10 year old data would have to do we forward looking estimates. Back then world cumulative consumption of oil was only around 40%.
In 2023, 55% of all crude oil has been consumed and world uses around 1/45th of the remaining supply each year, I believe a price ceiling exists somewhere around $200-225 per barrel, which equates to ~$15-16 per gallon gasoline ($2023).
I would argue that high oil/gas prices are in fact needed to make EV adoption possible. In a low price environment, few will move to EVs for a number of reasons…
EVs are not sold in low oil price environment…that seems really straightforward (unless legislation requires it)…
Kengeo,
This is about inflation that is expected when oil prices were high, from 2011 to 2013 when oil prices were very high, inflation was under 2%, just a set of facts to consider.
The inflation of the 1980s was less about high oil prices and more about a wage price spiral that had started 15 years earlier and led to high inflation expectations. These are often self fulfilling, if everyone believes prices will rise at 5% per year or more, they will.
Kengeo
You said high oil prices will cause high inflation. I pointed out that €120 oil for 2 years did not cause high inflation. Childish to dismiss what does not fit into your narrative.
Also 12 million electric cars will be sold this year, releasing over 2 billion litres of petrol and diesel to be used by other people and sectors.
OPEC who have been correct about oil production for years estimate oil production will continue to rise for some years as it has done for the last 3 years.
But maybe you know more then hundreds of research experts.
Charles,
OPECs forecasts are different from the EIA and IEA, so it depends upon which experts you want to believe, perhaps the average of several forecasts is the best approach, though I can only get the IEA report 2 months after it is published because I am not a subscriber to the OMR. Also we do not get forecasts for World C+C output from OPEC, but I could do a similar estimate to what I do for the EIA STEO using OPEC forecasts for liquids to estimate C plus C demand and supply.
OPEC has now dropped Angola and is now the OPEC 12. OPEC 12, 12-month average crude-only production was down 727,000 barrels per day in 2023.
The data in the chart below is in thousand barrels per day, and is through December 2023.
2022 …….. 27,734
2023 …….. 27,007
Difference -727
OPEC oil monthly report
https://www.opec.org/opec_web/en/publications/338.htm
If they are correct and they have not been significantly wrong in the last 12 years.
Then 2018 global total liquids production was beaten in 2023.
Global C and C production will be well and truely trumped by the end of 2024.
Charles,
OPEC has World liquids demand at 102.11 Mb/d in 2023 and World output at 101.48 Mb/d which suggests a shortage of supply for the year of 0.63 Mb/d for the year. Oil prices do not reflect this suggesting that either the demand estimate is too high or the output estimate is too low. OPEC does not always have the best initial estimates they get revised all the time.
World liquids output in December 2023 was 100.9 million barrels per day, down 400,000 barrels per day from November. That means world C+C will take a huge hit in December. World 12-month average C+C production has turned down and will likely continue to decline.
From the January OPEC MOMR:
World oil supply
Preliminary data indicates that global liquids production in December decreased by 0.4 mb/d to average 100.9 mb/d compared with the previous month.
That would make sense since the underlying Crude oil has been losing ~1 mb/d annually since 2018/2019…while it’s a long-shot, if price moves up considerably (>$120) might see a secondary peak near the magnitude of the one 5 years ago, prob. take a year or two to manifest…
Kengeo
No it has not, go look at the data
Ron
I am looking at annual data
World C+C production has turned negative. That is oil, not bottled gas. It is going lower. The OPEC CEO is warning everyone that the world will soon be in deep shit because of the lack of investment in oil discovery and production. What he fails to realize is you cannot get blood from a turnip, and you cannot get oil from a dry oil patch.
Dennis
still higher than 2018
Charles,
Yes for all liquids it is higher than 2018, due to increased NGL output. If you compare the crude refinery throughput in 2023 with 2018 you will see crude demand is still lower than 2018. The important products of petrol, gasoil/diesel. and jet fuel/kerosene are produced from crude oil not NGL. World liquids is not a very useful number to focus on.
Dennis
That is exactly what I said regarding total liquids. Late this year early next year will see new highs in crude and condensate.
OPEC cut production due to increasing production in non OPEC countries.
Also increase in illegal oil from Venezuela, Russia and Iran.
Oil is at $80 because there is lots of it being produced.
Charles, the US lifted sanctions on oil from Venezuela on October 18th last year, so there wouldn’t be any ‘illegal oil’ from there currently…
https://ofac.treasury.gov/media/932241/download?inline
Charles,
Oil is $80/b because the amount produced is greater than the amount consumed and stocks are building as a result. It is a lack of demand not excess supply.
Dennis,
Why do you say that? The output/demand balance has no correlation to oil prices. In fact in the last few years it has been anti-correlated: high prices and builds in 2022, low prices and draws in 2020 and 2021…
The price is not an indication of whether OPEC is is right or wrong.
My bigger issue is that in their Stocks section you don’t see these draws. They only follow OECD and December data is missing for most… but still. If their balances are correct it will have to be mostly non-OECD draws and some December OECD…. 230 MMbbl draw for the year is something that has to be more pronounced in the Stocks data, IMO.
Kdimitrov,
Prices were high in 2022 due to disruption of oil markets by Russia’s invasion of Ukraine and in 2023 price were low despite OPEC cutting supply to try to balance markets, in 2020 there was a huge build in stocks, the draw in stocks in 2021 was to bring stocks back to normal levels. Prices are affected by stock balances, though visibility is often poor for both stocks and demand, also prices are affected by expectations of future supply and demand and there is very poor visibility in that case. In fact when you look at OPEC, EIA and IEA for forecasts you get three different answers, add the many consultants and there are a multitude of forecasts.
You are correct that the correlation between days of forward supply and oil price is not strong, though some of the problem may be related to using World liquids estimates which do not reflect crude oil prices.
Perhaps price does not necessarily tell us anything. Oil Prices were very high for most of the period from 2006 to 2014, the average annual real Brent Oil price in 2023 US$ was $123.27/b. As I remember it this was mostly a period of perceived shortage (except during 2009 due to the GFC) on the oil market which was the reason that oil prices were relatively high. From 2015 to 2023 oil prices wer mostly lower than that previous period with average annual Brent oil prices at $74.43/b on average as I experienced it this was mostly a period of perceived oversupply on oil markets (except 2022 due to fear of oil market disruption from Russian invasion of Ukraine.) I think 2023 liquids demand may have been overestimated by OPEC, their actions cutting output seems to indicate they did not believe that demand was robust in 2023, regardless of the oil price (though I believe their cuts in output had everything to do with the price of oil.)
In Chicago’s deep freeze yesterday, Tesla’s would not start and had to be pushed/towed to chargers. I presume these Tesla’s must have been low on charge and the cold weather dropped the voltage to below some critical level. Anyone with experience with this issue.
“Fox Chicago’s Dane Placko reported that, “desperate Tesla owners in and around Chicago were seen trying to charge their vehicles with no luck amid frigid temperatures that have gripped the Midwest. “Nothing. No juice. Still on zero percent,” Tyler Beard, who had been trying to recharge his Tesla at an Oak Brook, Illinois Tesla supercharging station since Sunday afternoon, told the news outlet. “And this is like three hours being out here after being out here three hours yesterday.” “This is crazy. It’s a disaster. Seriously,” said Tesla owner Chalis Mizelle. Mizelle said she abandoned her car and got a ride from a friend after hers would not charge. “We got a bunch of dead robots out here,” one man said.”
https://blog.pricegroup.com/2024/01/17/peak-out-the-energy-report-01-17-2024/
My cell phone did that one time when I was skiing, had 70-80% then all of a sudden was dead…
Guessing it’s a similar process for an EV, they use energy to keep the batteries warm until they can’t, then go into hibernation mode. Many people have had no problems driving their EVs in cold weather (Dennis for one), just takes some planning (pre-conditioning the battery to ~60-70 degrees before heading out) and keeping your battery above 30%…Normally aim to keep battery above 20%, in cold weather prob. aim for 50%…
Kangeo
I have updated the comment with some new info. I had a somewhat similar situation with an iPhone. I had a new one and left the old one on without recharging for about a week. I plugged it in to recharge and it would not charge. I left it plugged overnight but no luck. I decided the battery voltage must have fallen below some critical level. I put it in the oven at around 100F for 1/2 an hr. Plugged it in and it immediately started to charge. I assume that is what has happened to those Tesla’s.
Ovi,
In very cold weather, it is a bad idea to let the battery drop to under 20%, these may have been new Tesla owners that do not have a way to charge at home, I plan for this, but it can be a challenge at ski areas as there are many EVs and not enough chargers, especially as EVs have become more widespread. I have rarely had a problem at Superchargers with not being able to charge, maybe I have just been lucky the past 5.2 years.
Dennis
I think this was a very unique situation, like you say new owners, that had let the battery charge drop to 25% and then the cold dropped the internal voltage to below the critical shut down voltage. I don’t think this was a charger problem, this was a battery issue shutting itself down to prevent damage.
The LiOn batteries charge should not fall below 20% or go above 80%. I think the battery range is based on those numbers. When the car reads 100% charge, that means it is at the battery’s real 80% charge level.
In all of the years that we have had extreme cold weather, this is the first time I have heard this issue.
The attached article details what Tesla recommends for cold weather driving. Number 1 is: To cope with extreme cold, Tesla recommends keeping the vehicle plugged in, and maintaining a charge of at least 20%.
https://www.npr.org/2024/01/16/1224913698/teslas-chicago-charging-extreme-cold
Ovi,
How cold was it? I have been in -15 F weather with my Tesla at Ski Areas and have never had this problem. Though I was careful not to let my battery get too low. Looks like around minus 9 Fahrenheit for a low, not anything I haven’t experienced where I live since I have owned my Tesla.
Dennis
Another article says: “Chicago’s climate site spent about 35-36 hours below 0°F.”
Ovi.
I have family living in the NW Chicago burbs. Not far from the Wisconsin border. It seems to be colder there in the winter than in the City. Although, it seems like a lot of weather is measured at O’Hare, which is in the burbs.
I see a lot of Tesla’s now in the Chicago burbs. I assume this story is just one of poor planning by the drivers. EV’s require some planning. Not a lot, but more than ICE at present.
But it’s changed a lot since my neighbor first bought a Tesla in 2012. We even have a charger now in my small town, and probably have 10 or so Tesla here now. Probably many more plug in hybrids. A coworker has a plug in hybrid mini van. She has about a 20 mile drive to work and says she rarely, if ever, goes to gasoline on that drive.
It has seemed to me that it would make sense if Tesla had a ICE back up, that could get someone 40 miles or so. I guess there are reasons why they don’t go that route?
Shallow sand,
The ice backup would add weight and complexity to the car. It is not necessary. Often gasoline and diesel vehicles also have trouble in the extreme cold, it is not only a problem for EVs.
See article in comment just below.
Shallow Sand/Dennis
The biggest problem for Tesla to add an ICE is the lack of technology There are two issues, meeting very strict emission standard and manufacturing. The technology for meeting the emissions standards is closely held within each company and so is the manufacturing process. Engine manufacturing apparently is fully automatic.
As for weight, the engine weight would be offset by a smaller battery.
In the article that you mention, I was totally stunned by this comment; “Setrom noted that 13% of starting difficulties are linked to electric cars”. This to me is totally surprising/shocking. I thought that the Chicago incident was a once off event. Also were those percentages normalized.
Like everything else, there is a learning curve.
Ovi,
No the percentages were not normalized, about 23% of light duty vehicles are EVs in Norway and 13% of incidents were EVs, the 77% of vehicles that were ICEVs were responsible for 87% of the incidents, so the ICEVs did slightly worse as I understand what was written.
The main issue is more complexity and more chance of repair issues with a plugin hybrid compared to a BEV.
“The main issue is more complexity and more chance of repair issues with a plugin hybrid compared to a BEV.”
True, but consider that the Chrysler Pacifica plugin hybrid has been performing excellent with the integration for over 6 years, as an example.
An interesting issue arises for those with such a vehicle. The ICE is only used for longer trips, and for many people the electric only mileage can be 70-90% of the annual total. I have witnessed exactly this, and in such a case you have the ICE only being used for 3000 or less miles/yr…barely used. A good problem to have.
A fleet of such vehicles can result in stringing out the remaining petrol for a long time, while minimizing the EV issues with public charging away from home.
The Ramcharger 1500 2025 PHEV looks like a winner in this segment. “How’s 663hp, a 14,000-pound tow rating, and a 145-mile range sound? Ram estimates a fully electric driving range of 145 miles, but with a full tank of fuel powering the V6, total range is expected to be 690 miles, 60mph in 4.4 seconds!”
They should make an SUV version.
Hickory,
Perhaps this is a good route, has the Pacifica been reliable? I imagine RAV4 or Prius Prime plugin would be reliable, not so sure about former American Big 3 Auto Companies, I have had bad luck in the past with Ford and GM vehicles, haven’t owned one since 1984.
I am on Chevy Silverado 5, the first one being a 1997.
The most recent one before the current is the only one I have had a problem with. The transmission went out at 167k miles. I was going to trade it later in 2023, but had to trade in July of 2023.
The best vehicle we have had was a Lexus, over 300k miles on that 2007 model that we bought new. Better half drove it for 12 years.
Article on cold weather performance of EVs in Norway
https://www.teslarati.com/electric-car-cold-weather-fears/
It is true that most EVs are doing fine in cold weather. There could be be issues with new models especially with new battery chemistries and the planned charger infrastructure set up. It is part of the growth pain adoption when we have a rapid pace of new electric vehicles added. What have been more of an issue in Norway with the snow storms in the recent month is that the technology telling if buses are coming or not have been failing more often than not (relying on sensors that can not cope with the weather conditions).
I’m not following this logic, in November 2018 production of crude oil was ~85 mb/d.
Current level is ~80 mb/d…what am I missing?
Supply is dropping by ~1.2% annually, starting right when cumulative oil production hit 50% (2018/2019 timeframe).
Don’t be fooled by the smoke and mirrors of total liquids…
Kengeo,
OPEC, IEA, and EIA report World liquids in their monthly reports (MOMR, OMR, and STEO). Ovi and I try to estimate World crude roughly by using the past 6 or 12 months of C plus C to total liquids ratio for World minus US to estimate the crude plus condensate for World less US, the ratio of the past 6 months (in Ovi’s case) or 12 month (for my estimate) is multiplied by the STEO Liquids forecast to get C plus C, then the US C plus C forecast by the EIA in the STEO is added to get World C plus C, it is a rough estimate, but the best we can do (Ovi came up with this approach, which I have adopted.) Possibly Ovi has adjusted his method, it was at some point the method I have outlined.
I focus on the 12 month average peak which was roughly 83 Mb/d in 2018 for World C plus C, and yes 2023 will be roughly 81.4 Mb/d. Charles claims there is another 5% of oil that is not accounted for (roughly 4 Mb/d of C plus C), but he has not revealed the source of this estimate or where this 4 Mb/d is produced. I think he is wrong and he believes I am wrong. A difference is I cite my sources (EIA, OPEC, Statistical Review of World Energy). He has yet to reveal the source of his 5% estimate for “missing oil”.
Oh and 81.4/83=98%, so over 5 years this is about a 0.4% drop in output, using annual average output data. Monthly data is very seasonal and also very noisy, not much is learned by choosing two months and drawing a straight line between them (though I guess I did that for 2018 and 2023 to save time, it is not the best method).
Charles conflates the transportation of oil with production thereof, also sounds like his shadow fleet carrying 5 mb/d of oil spawned itself out of thin air…curious indeed…
Kengeo,
The theory on the dark fleet is older tankers that could not comply with the rgeulations for lower emissions have been put to use in the dark fleet. I am sure this fleet exists and might transport a significant amount of oil, but the oil has been counted before it gets loaded on these vessels or gets transferred from ship to ship to hide sanctioned oil from Venezuela, Iran, and Russia. Some of the oil on these ships may be oil that has been stolen through illegal taps into pipelines, though that oil may remain in the nations where it is stolen, I doubt there is enough such oil to fill a tanker, crude may be refined in teapot refineries and some of the theft is of products rather than crude. There is not any decent data on this that is freely available, there might be some information behind paywalls. My guess is that major agencies get access to such data to improve their estimates. The fact that most of the data from major agencies matches up pretty well suggests that the numbers may be fine.
Perhaps I am wrong, I adjust my thinking when presented with evidence from a reliable source.
5 mb/d transport could be Russia alone at the time – they don’t sell to the numbers given by the USA.
That’s a reason why the USA now has plan B – dumping down the oil price via Wall street to hit Russian profit.
You see often these 2-3% oil price dumps the moment the US market opens, over the last months. Even when there are bearish events like target shooting on ships, Libya shuts down production, Bakken freezes over.
Yes, consumption was a bit low in the December – most tea pots in China have run out of import quotas.
This may be a conspiration theory. But it’s visible, logical (Hit Russia and curb inflation the same time) and you don’t need lot’s of people involved.
Kengeo
You obviously have read nothing on the subject.
Do you know how fraud happens in the industry?
Kindly answer question above.
This is just one article about the chaos in counties like Nigeria.
https://www.vanguardngr.com/2017/05/nigeria-lost-n2-trillion-poor-metering-oil-wells-two-years/
The same can be found in Angola, Libya, Sudan, Iraq
It is not all about Russian dark fleet. Which you know nothing about.
Charles,
These factors may be included in the estimates, if it is reported on, it is known. Still no source for your 5% estimate? I will assume this is an unsubstantiated estimate, claims remain just that, I could claim it is 1%, but have nothing to back such a claim, it is simply an illustration. I use data rather than vague claims. In Nigeria the article claims as high as 400 kb/d, though some say this estimate includes oil spills so the actual number is likely lower. Also the article is 5 years old, things may be better or worse, oil prices are lower so less incentive to steal the oil.
also see
https://www.vanguardngr.com/2023/09/oil-theft-nigeria-lost-n16-25trn-in-11-years-reps-speaker/
where we get about 141 kb/d when we take the 619 million barrels over 12 years from 2009 to 2020 (365 times 12 days).
This leaves us a long way from 5% of 100 Mb/d or roughly 5000 kb/d, we just need to account for another 4859 kb/d to make it all add up.
For your theory, you need ~5 tankers departing and arriving every single day to reach 5mb/d. Transit time is 3.5 weeks. So you need over 100 of these ships moving ~150 mbs of oil at any given time…it all seems like a pretty big stretch to me…to add, all of this oil must be unreported/unaccounted for in the countries it’s originating from…I might be inclined to believe that there is 0.5mb/d of ghost ship oil on the move, this would be one illegal tanker every couple of days, 5mb/d seems way too high…
Kengeo
I again gave an example of internal fraud, where the oil does not leave the country. And then said this happens in… and gave list of other countries.
Have posted many research articles on the various ways data is changed by officials and the oil sold illegally.
Sorry you can’t keep up
Charles,
Mainly anecdotal evidence for individual years, when one drills down on these articles the amounts are very small. Still no source on your 5 Mb/d or 5% of oil production or demand not being reported. Did you just make that up?
Here’s a look at possible decline curve for 1P, 7-8% decline rate thru 2030, then up to 20-25% after that…
10 years from now production would be 50% of current level…
Peak 1P year was 2004….
This is kinda funny:
https://www.reuters.com/legal/litigation/drivers-sue-us-shale-oil-producers-over-alleged-price-fixing-scheme-2024-01-16/
https://mishtalk.com/economics/pakistan-confirms-missile-strikes-inside-iran-as-mideast-tensions-flare/
Iran hits Pakistan.
Pakistan hits Iran.
Did Andre say that Pakistan could nuke the Strait of Hormuz? OHHHHHH……YEEEEEAH!
IEA World Demand and Supply to Grow in 2024
Global oil demand growth slowed to 1.7 mb/d y-o-y in 4Q23 – well below the 3.2 mb/d rate registered during 2Q23-3Q23, mirroring the unwinding of China’s post-pandemic release of travel demand. Growth is projected to ease from 2.3 mb/d in 2023 to 1.2 mb/d in 2024, as macroeconomic headwinds, tighter efficiency standards and an expanding EV fleet compound the baseline effect.
World oil supply is forecast to rise by 1.5 mb/d to a new high of 103.5 mb/d, fuelled by record-setting output from the US, Brazil, Guyana and Canada. Non-OPEC production will dominate growth this year, accounting for close to 1.5 mb/d. By contrast, OPEC supply is expected to hold broadly steady on last year, assuming extra voluntary cuts that started this month are phased out gradually in 2Q24.
https://www.iea.org/reports/oil-market-report-january-2024
That’s the big joker – in the mainstream, the most of oil production growth comes from the USA this year.
According to some data mining here, this growth can be less than anticipated or even roll over due to lower well quality.
Non OPEC oil supply
In 2018 non OPEC production was 60.1 mb/d
https://www.opec.org/opec_web/static_files_project/media/downloads/publications/MOMR June 2019.pdf
In 2023 non OPEC production has hit 66.5 mb/d, January revision hardly changed from month before
https://momr.opec.org/pdf-download/res/pdf_delivery_momr.php?secToken2=accept
30% of that increase is crude oil, so non OPEC production is at a new high by a long way.
This is good news as electric vehicle sales are not yet strong enough to counter global peak oil.
World and Non-OPEC update tonight.
Supply projection out to 2025 and an unexpected surprise.
Looking forward to it and the big unexpected surprise.
The Great Convergence: North American Natural Gas and the Looming Shift in Global Energy Economics
The United States would have faced an acute gas shortage without the shales as conventional natural gas production had declined steeply. Instead, surging shale gas production produced a prolonged (and huge) disconnect to world prices. However, our models tell us that the shales are likely plateauing and the discount to world prices will narrow quickly and most likely disappear.
It is not healthy to have too low natural gas prices over a prolonged period of time. So it remains to be seen what happens to supply if prices go up again. I suspect supply can go up again, and to argue that gas supplies do not have potential in North America is a bit like saying shale oil did not have potential 10 years ago. I suspect the resources can be squeezed for a long period, and that more plays are interesting with higher prices. It is also easier to get more out of shale gas fracking than shale oil.
Relying on “cheap” LNG might be costly in the long run, just my opinion.
Higher prices might lead to a plateau for 5 years and perhaps a fatter tail, it might not lead to a much higher peak.
ND Director’s Cut is out. NOV up 2% (rebound from drop in OCT). I listened to the webinar live (video won’t post for a few days.
Helms said DEC looked very strong also. But that JAN might be down 0.5MM bopd (!) because of extreme cold causing producing wells to shut in. Not just normal seasonal difficulties with completions, but actually impact on already producing well pads–the issue is a lack of gas liquids handling in very cold weather, combined with the anti-flaring restrictions. May be spring before the wells get put back on line, once taken off.
Not a big rebound. North Dakota production was up by 24,000 barrels per day.
Agreed, no big deal. The rebound was less than the dip from month before.
Just trying to get out ahead of the massive JAN2024 drop that is coming. 😉
That sort of thing always excites the peak oilers. Every winter drop in the Bakken is a signal of the play being over. Remember Art Berman:
“The decline in Bakken oil production that started in January 2015 is probably not reversible. ”
https://www.forbes.com/sites/arthurberman/2017/03/01/the-beginning-of-the-end-for-the-bakken-shale-play/?sh=6950fe6f1487
[Bakken ended up increasing more than a half million bopd after the Berman column, and setting new records.]
It’s sort of like Groundhog Day with winter weather in the Bakken. Similar with the people misinterpreting RRC reporting lag as Texas peaking. We’ve seen that from you and Roger Blanchard. And we still get new random peak oil commenters that think they have discovered something.
I was following Enno’s Novi Bakken report and noticed that operators have been drilling in the real high TOC shale (lower and upper Bakken), and results have been good and this might help Bakken reverse the decline.
A new thread updating World oil Production has been posted.
https://peakoilbarrel.com/september-world-oil-production-rebounds/
A new Open Thread Non-Petroleum has been posted.
https://peakoilbarrel.com/open-thread-non-petroleum-january-19-2024/