By Ovi
Below are a number of Crude plus Condensate (C + C) production charts, usually shortened to “oil”, for oil producing countries. The charts are created from data provided by the EIA’s International Energy Statistics and are updated to September 2023. This is the latest and most detailed/complete World Oil production information available. Information from other sources such as OPEC, the STEO and country specific sites such as Russia, Brazil, Norway and China is used to provide a short term outlook for future output and direction for a few of these countries and the World.
World Oil Production and Projection
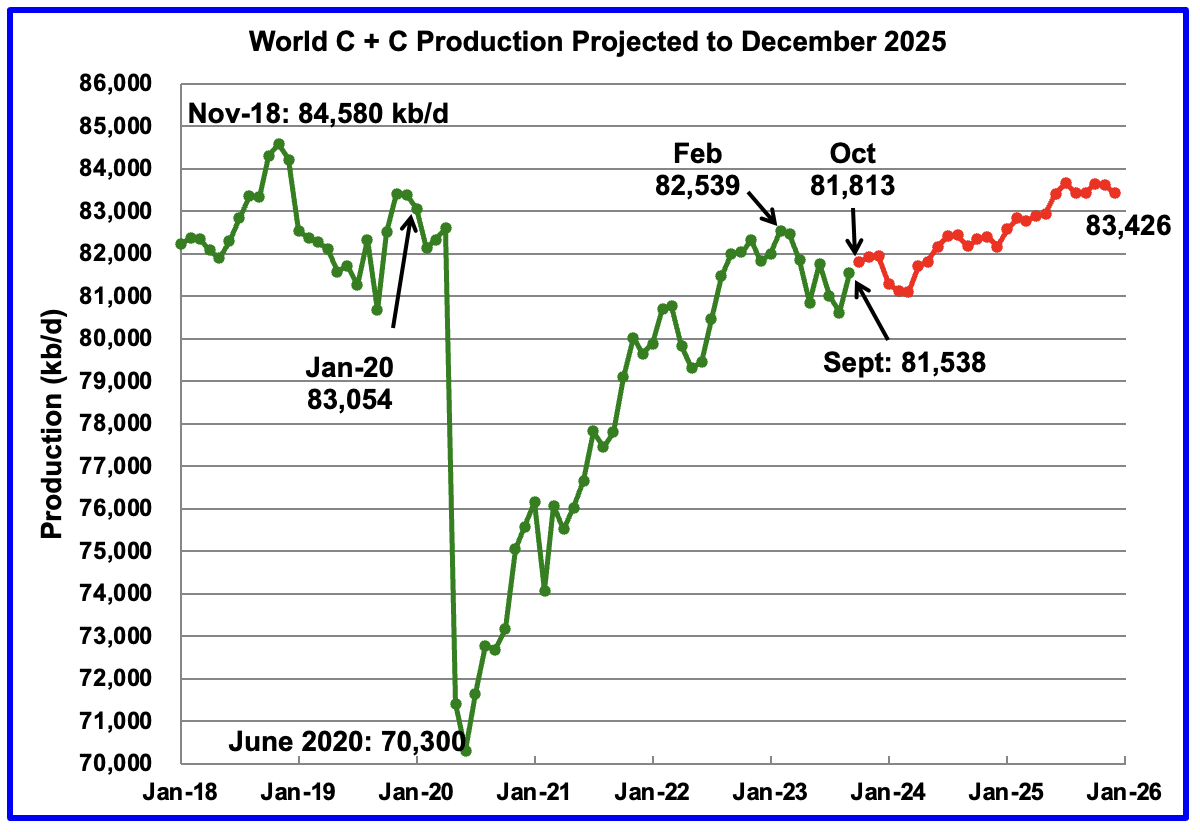
World oil production increased by 927 kb/d in September, green graph. The largest increase came from Saudi Arabia 500 kb/d while the US added 224 kb/d and Brazil 210 kb/d.
This chart also projects World C + C production out to December 2025. It uses the January 2024 STEO report along with the International Energy Statistics to make the projection. (Red markers).
The red graph forecasts that World crude production in December 2025 will be 83,426 kb/d and is 1,154 kb/d lower than the November 2018 peak. Note the large production decrease starting in January 2024. It could be the reflecting the latest OPEC + cut announced in November 2023.
From October 2023 to December 2025, production is estimated to increase by 1,613 kb/d or an average of 62 kb/d/mth.
Keep in mind that OPEC + has close to 3,000 kb/d of cuts in reserve if required.
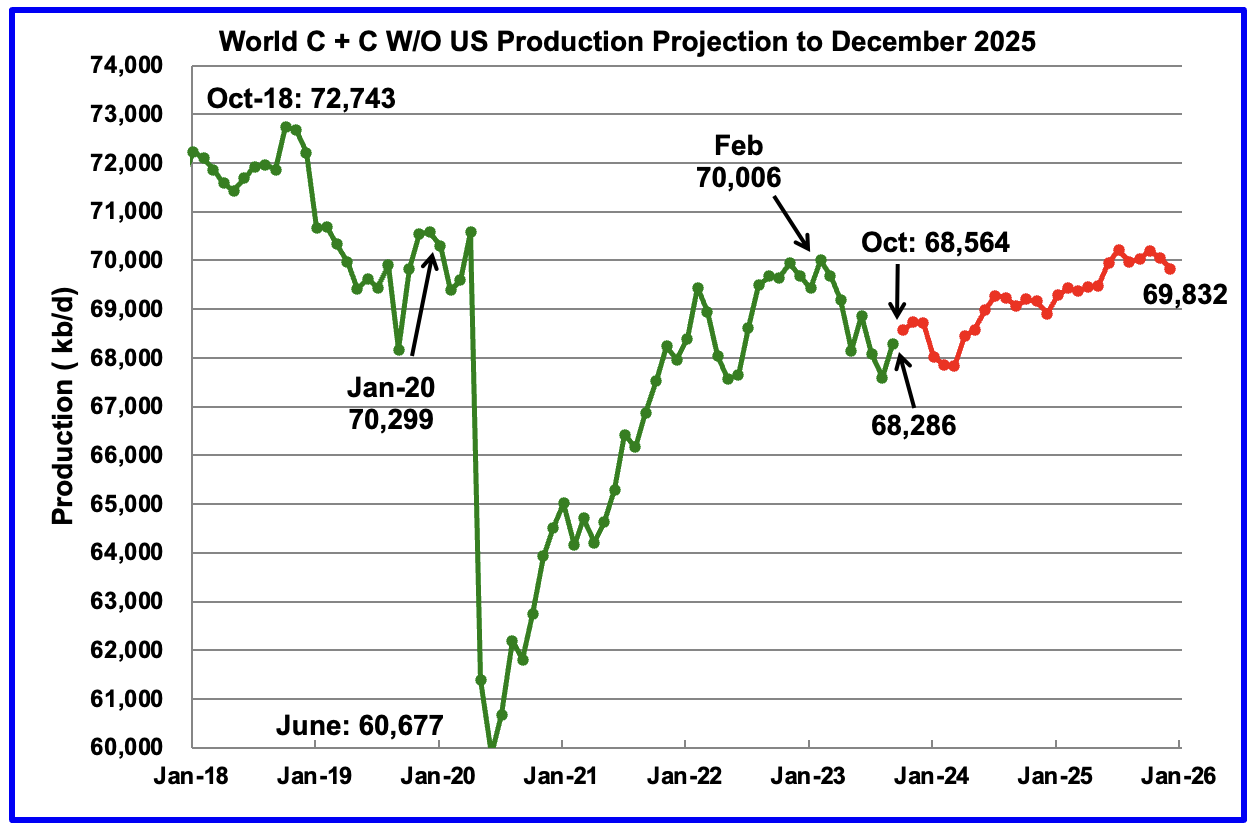
World without the US oil output in September increased by 688 kb/d to 68,286 kb/d. October is expected to add 378 kb/d.
Note that December 2025 output of 69,832 kb/d is lower than February 2023.
World oil production W/O the U.S. from October 2023 to December 2025 is forecast to increase by a total of 1,268 kb/d.
A Different Perspective on World Oil Production
Instead of dividing the World oil producing countries into OPEC and Non-OPEC, this section divides the countries into two groups on the basis of their production capacity. The division will be The Big Three, US, Saudi Arabia and Russia, and the Rest, i.e. the World oil producers W/O the Big 3. The top producer in the Rest, currently Canada, produces less than half of the lowest producer in the Big Three.
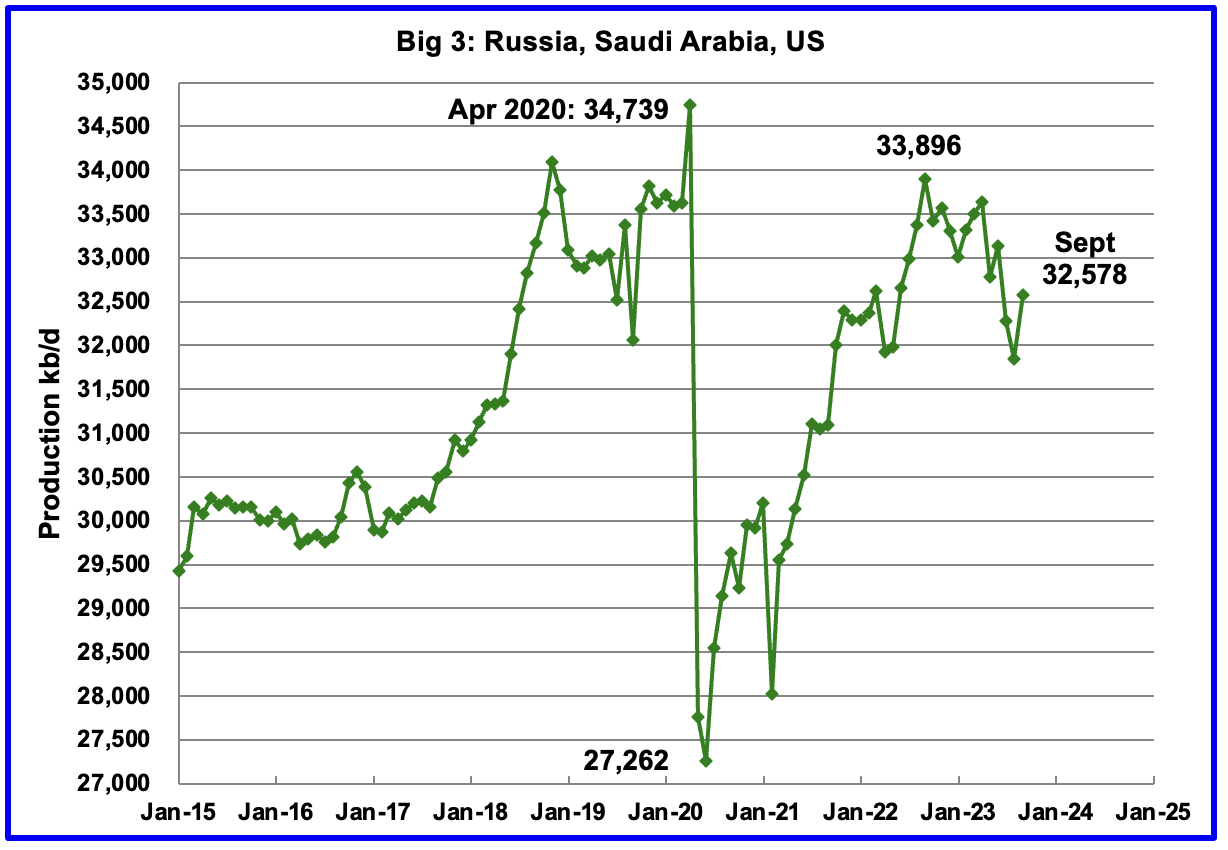
Peak production in the Big 3 occurred in April 2020 with a rate of 34,739 kb/d. The peak was associated with a large production increase from Saudi Arabia. Post covid, production peaked at 33,896 kb/d in September 2022. The production drop since then is due to cutbacks within the OPEC + countries.
September production from the Big 3 increased by 730 kb/d to 32,578 kb/d.
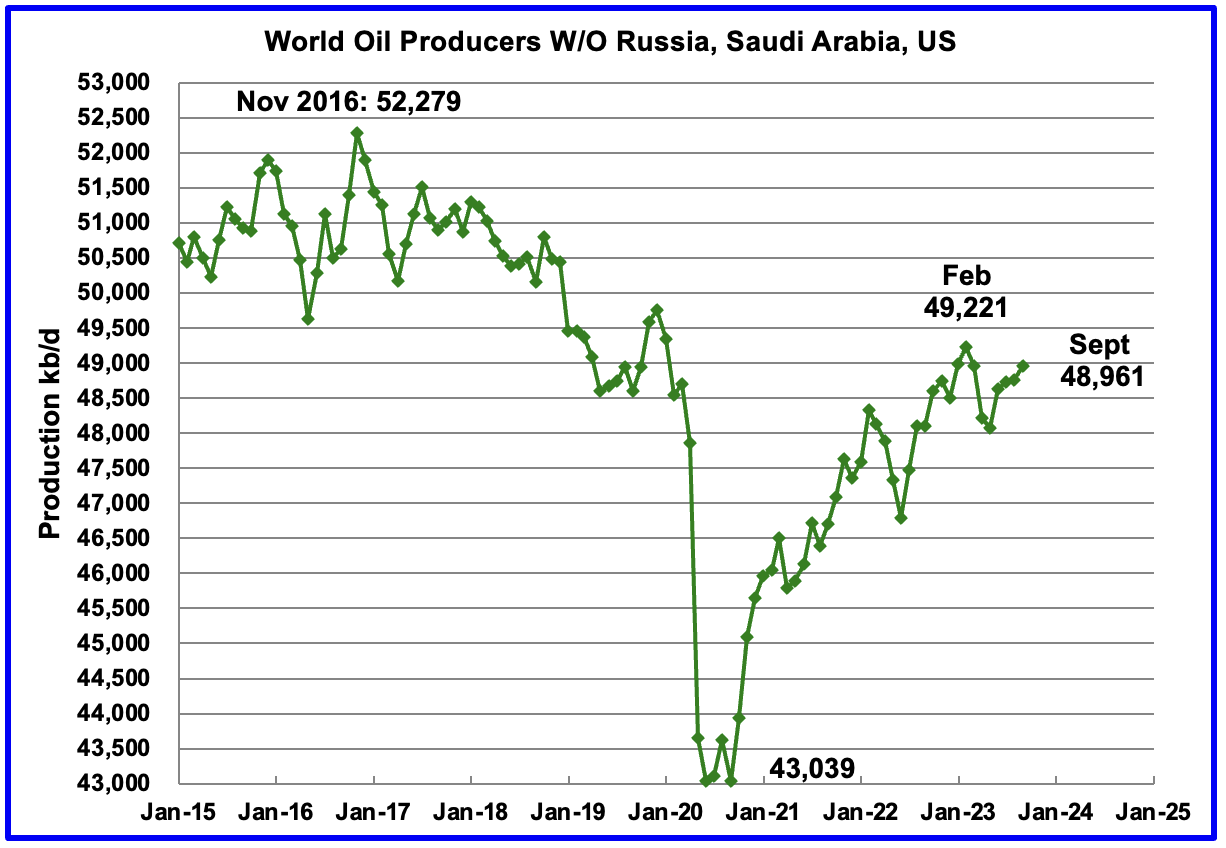
Production in the Rest has been slowly increasing since the low of September 2020, 43,039 kb/d. In February 2023 production rose to a post covid high 49,221 kb/d. Output in September was 48,961 kb/d, an increase of 235 kb/d over August.
Production is down 3,318 kb/d from November 2016.
World Oil Production Ranked by Country
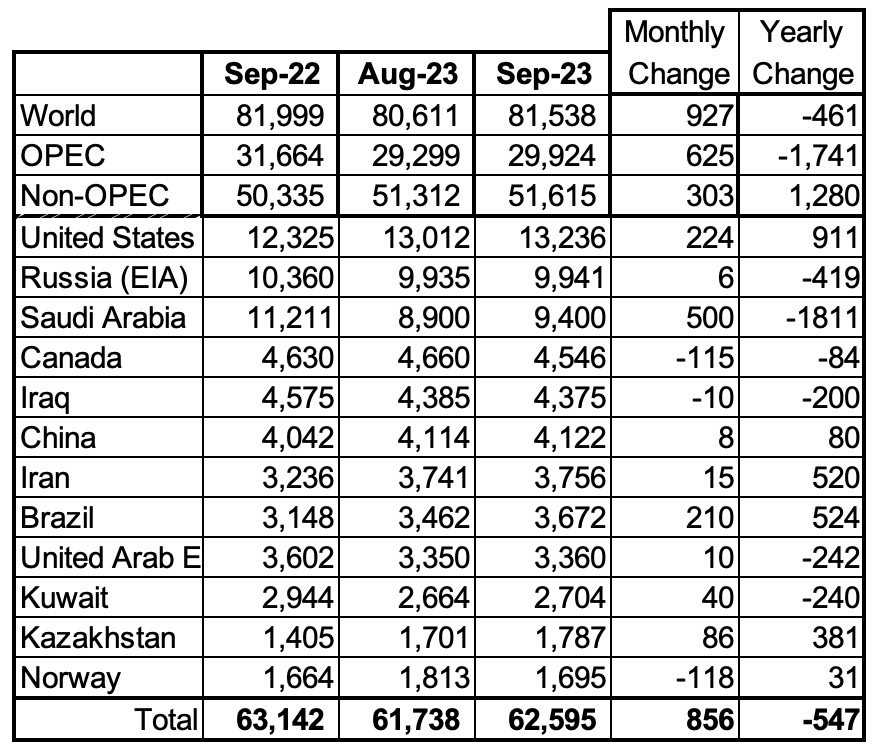
Above are listed the World’s 12th largest oil producers. In September 2023, these 12 countries produced 76.8% of the world’s oil. On a MoM basis, these 12 countries increased production by 856 kb/d while on a YOY basis, production dropped by 547 kb/d. On a YoY basis, the size of the Saudi Arabia drop is double the US increase.
Non-OPEC Oil Production Charts
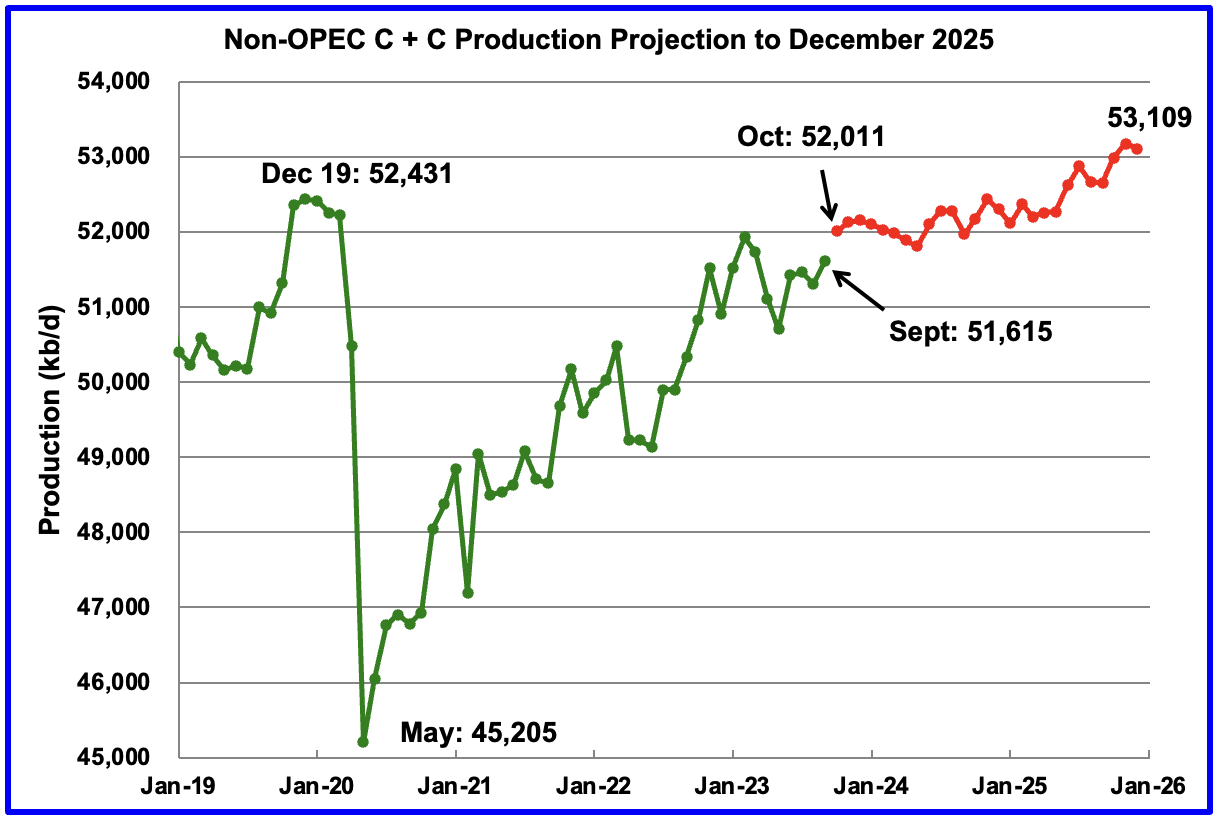
September Non-OPEC oil production rose by 303 kb/d to 51,615 kb/d. The largest increase came from the US.
Using data from the December 2023 STEO, a projection for Non-OPEC oil output was made for the period October 2023 to December 2025. (Red graph). Output is expected to reach 53,109 kb/d in December 2025, which is 678 kb/d higher than the December 2019 peak of 52,431 kb/d.
From October 2023 to December 2025, oil production in Non-OPEC countries is expected to increase by 1,098 kb/d. According to the STEO, the major contributors to the increase are expected to be the US and Canada.
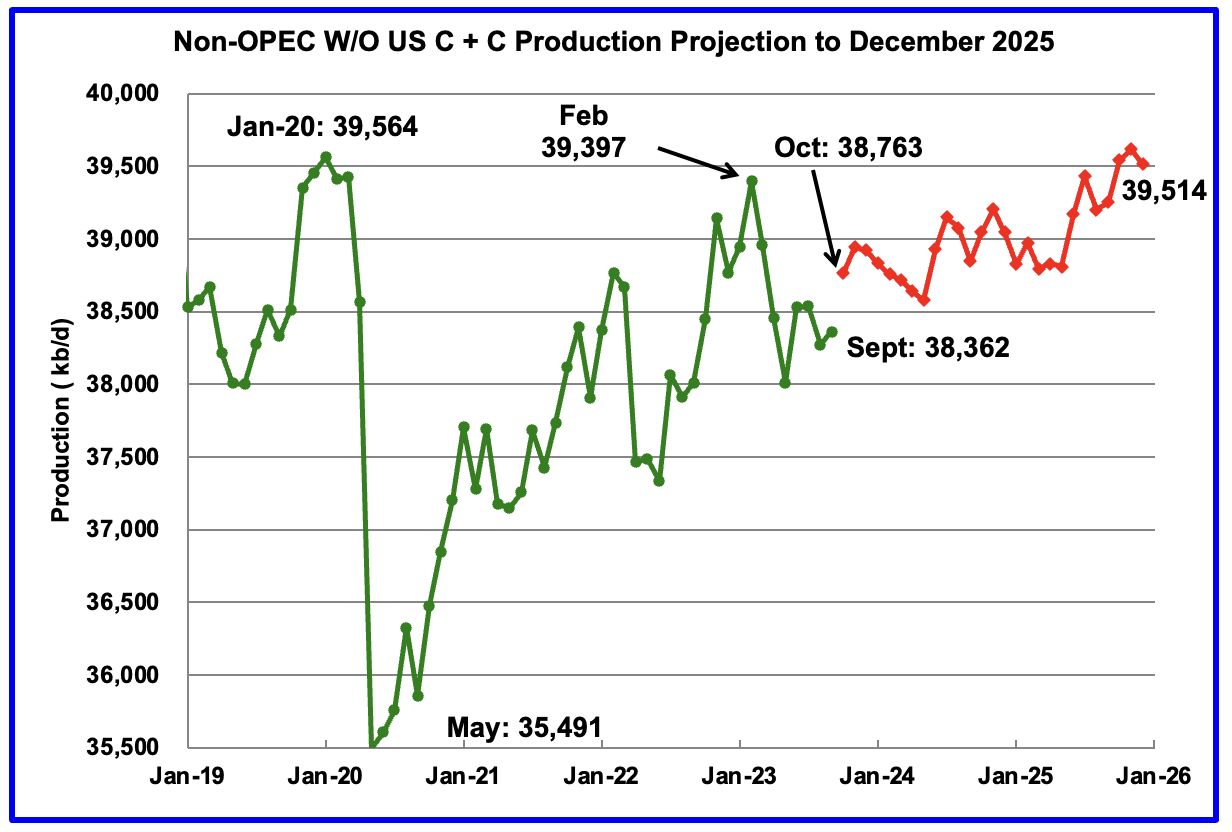
September Non-OPEC W/O US production increased by 91 kb/d to 38,362 kb/d. October production is projected to increase by 401 kb/d.
From October 2023 to December 2025, production in Non-OPEC countries W/O the US is expected to increase by 751 kb/d.
Note that December 2025 output is lower than the January 2020 high of 39,564 kb/d by 50 kb/d.
Non-OPEC Oil Production Ranked by Country
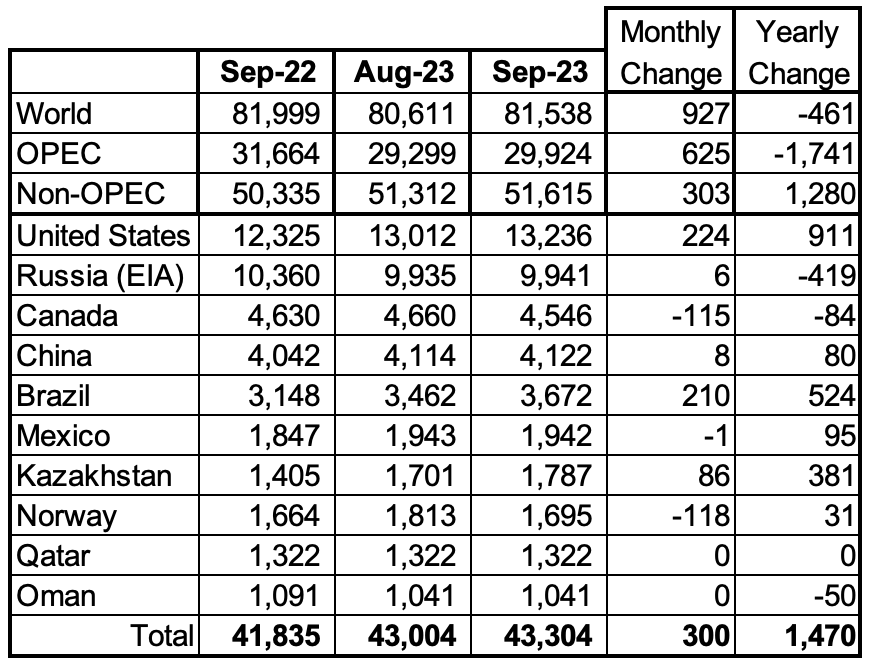
Listed above are the World’s 10 largest Non-OPEC producers. The criteria for inclusion in the table is that all of the countries produce more than 1,000 kb/d.
September’s production increase for these ten Non-OPEC countries was 300 kb/d while as a whole these Non-OPEC countries saw a production increase of 303 kb/d.
In September 2023, these 10 countries produced 83.9% of all Non-OPEC oil production.
OPEC’s C + C production increased by 625 kb/d MoM while YoY it decreased by 1,741 kb/d. World MoM production increased by 927 kb/d while YoY output decreased by 461 kb/d.
Non-OPEC Oil Production Charts
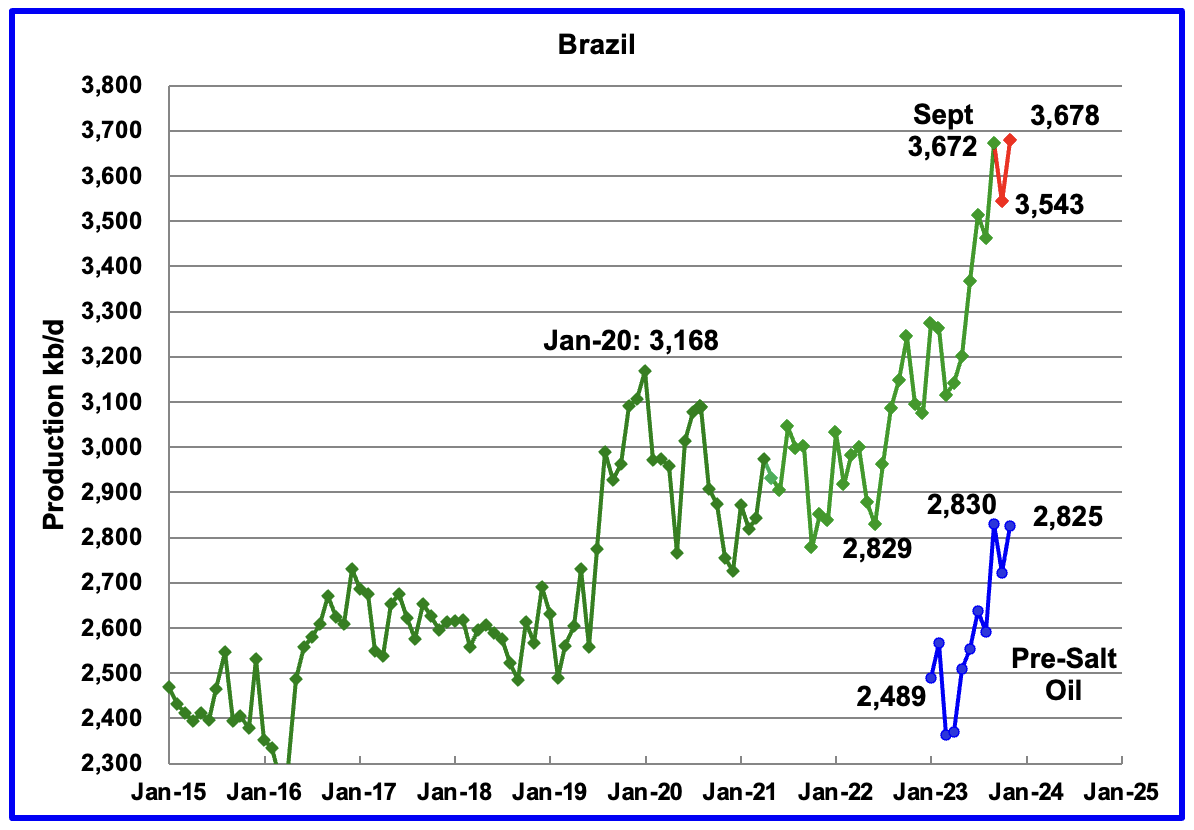
The EIA reported that Brazil’s production increased by 210 kb/d in September to 3,672 kb/d.
Brazil’s National Petroleum Association (BNPA) reported that output in October decreased by 129 kb/d to 3,543 kb/d followed by a 135 kb/d rebound in November to 3,678 kb/d.
From March 2023 to November 2023, production increased by 563 kb/d. A similar rise in production is not expected in 2024. For 2024 the MOMR is expecting a smaller increase, closer to 100 kb/d.
For 2024, the January MOMR states: “Crude oil output is expected to increase through production ramp-ups in the Buzios (Franco), Mero (Libra NW), Tupi (Lula), Peregrino and Itapu (Florim) fields. Oil project start-ups are expected at the Atlanta, Pampo-Enchova Cluster and Vida sites. However, increasing costs in the offshore market and inflation might also continue to delay projects and could temper growth in the short term.” However for 2025, an increase of close to 200 kb/d is expected.
Production from the off-shore “pre-salt” region has been added to the Brazil chart, blue markers. November oil production increased by 103 kb/d to 2,825 kb/d, which accounts for most of the 135 kb/d overall increase in Brazil’s November output. Much of Brazil’s 2023 production growth came from the highly productive pre-salt fields. From March 2023 to November 2023, production from the pre-salt fields increased by 462 kb/d.
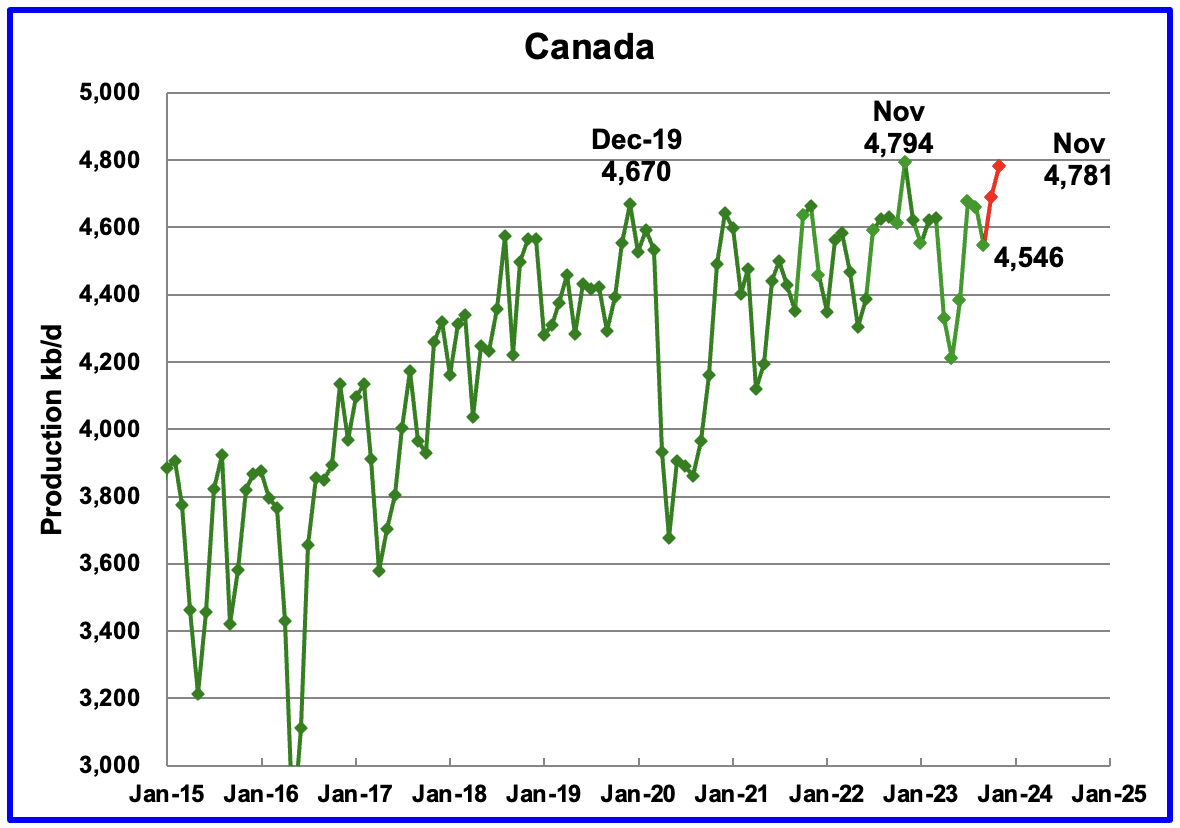
According to the EIA, Canada’s production decreased by 115 kb/d in September to 4,546 kb/d. The September drop was due to fires in Alberta during the 2023 summer.
The STEO is forecasting that Canadian production will rise by 142 kb/d in October along with an additional 93k/d increase in November, red markers.
According to this source, Alberta’s oil production rose to record in November that tops China’s production.
“Production is surging as oil-sands companies prepare for an expansion of the Trans Mountain pipeline — which runs from the province to Canada’s Pacific Coast — to start up this year, giving them 590,000 barrels of new export capacity.
Alberta’s oil-sands deposits represent the world’s third-largest crude reserve, and November’s production is more than all but four countries, edging out China’s average output in 2022 while trailing Iraq’s, according to data from BP Plc. Including output from Canada’s other provinces makes the country the world’s fourth-largest producer.”
In January 2024, the Canada Energy Regulator approved another variance request by the Trans Mountain Pipeline (TMX). Line fill of the TMX pipeline could start in March/April.
“Trans Mountain Corp is racing against the clock to complete the expansion project, which will boost the capacity of Canada’s only oil pipeline to the West Coast to 890,000 barrels per day from 300,000 bpd currently.”
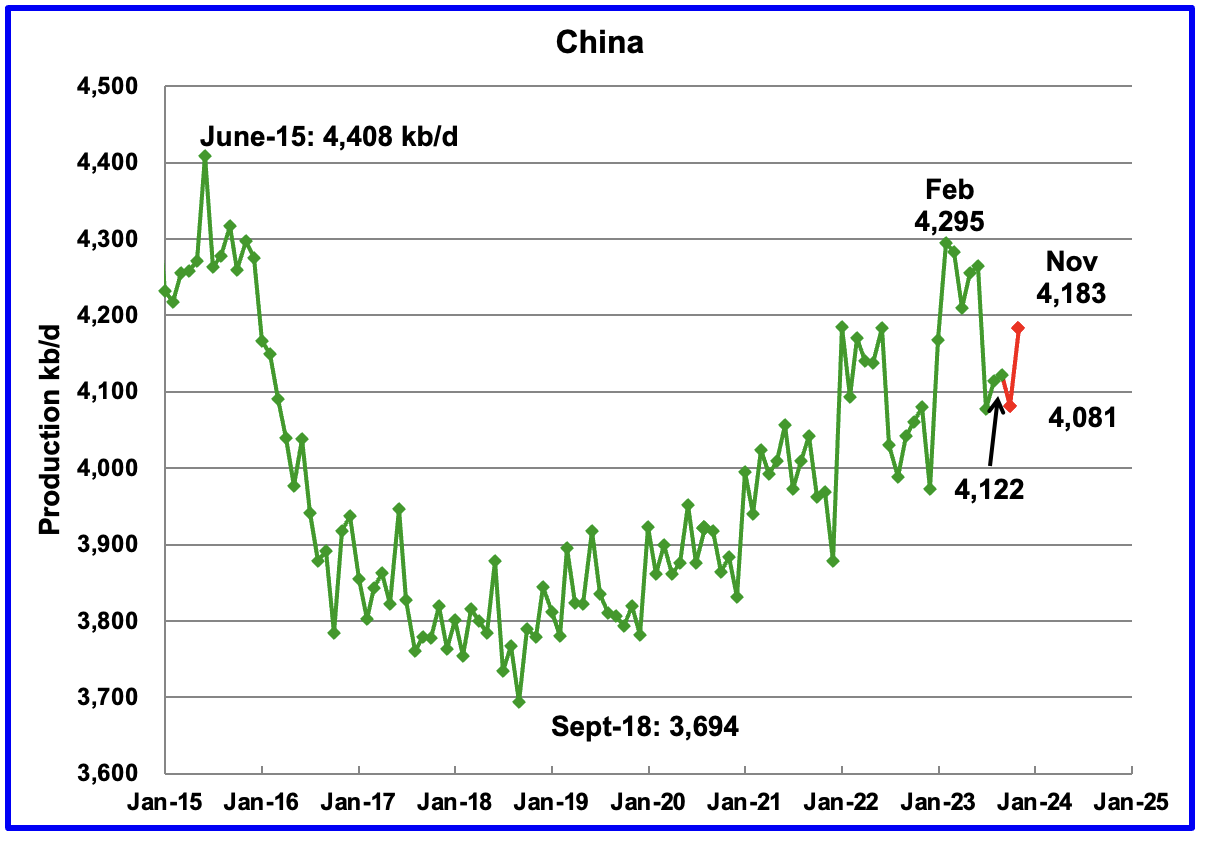
The EIA reported China’s oil output in September rose by 8 kb/d to 4,122 kb/d.
The China National Bureau of Statistics reported that output dropped in October to 4,081 kb/d and then rebounded in November by 102 kb/d to 4,183 kb/d.
Every January for the last four years, China’s production has taken a massive increase. In 2022 production jumped by 322 kb/d from December 2021 to February 2022. However according to the January MOMR: For 2024, Chinese liquids production is expected to remain steady at the 2023 level of 4.6 m/d.
While China’s production growth has risen steadily since 2018, it may be approaching its post pandemic high as inferred by the January MOMR.
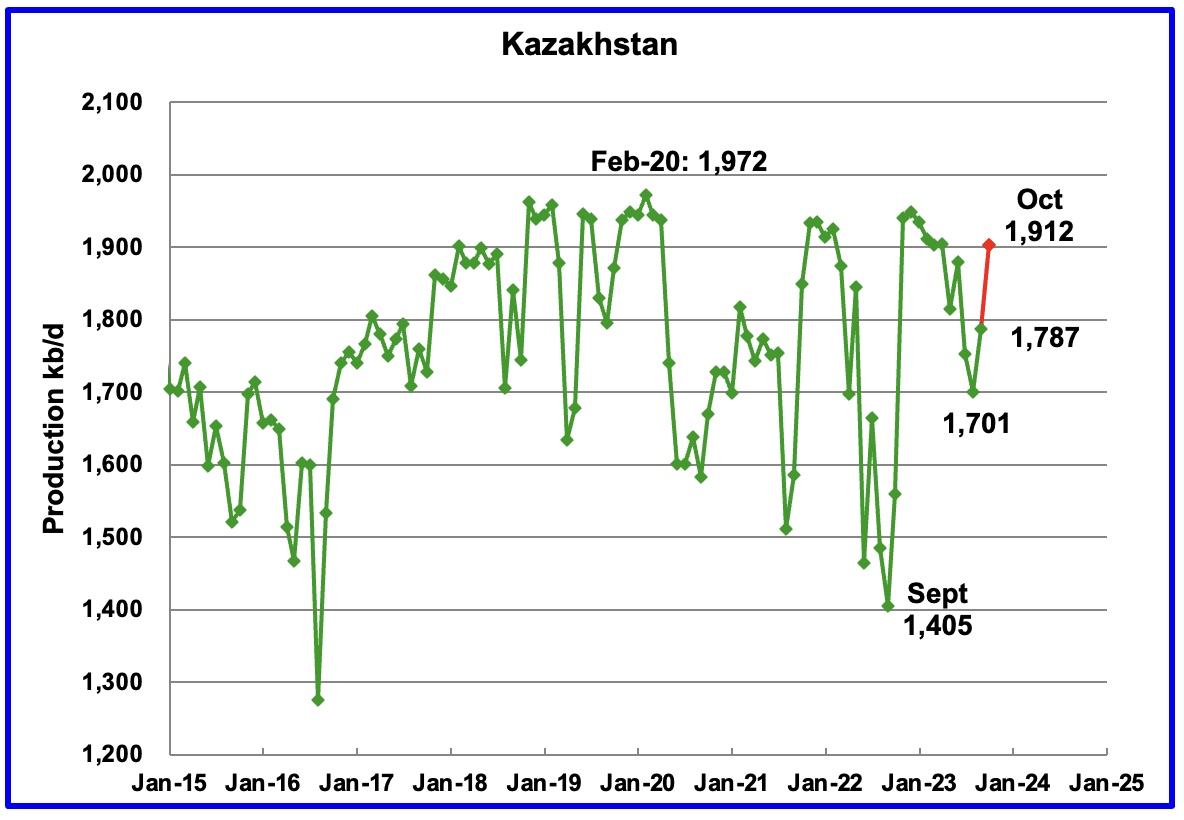
According to the EIA, Kazakhstan’s output increased by 86 kb/d in September to 1,787 kb/d.
The STEO is forecasting that production will continue to rise in October to 1,912 kb/d, red marker.
The January MOMR is reporting that “November Crude production dropped by 44 tb/d, m-o-m, to average 1.6 mb/d. NGL and condensate output rose by 17 tb/d, m-o-m, to average 0.4 mb/d.”
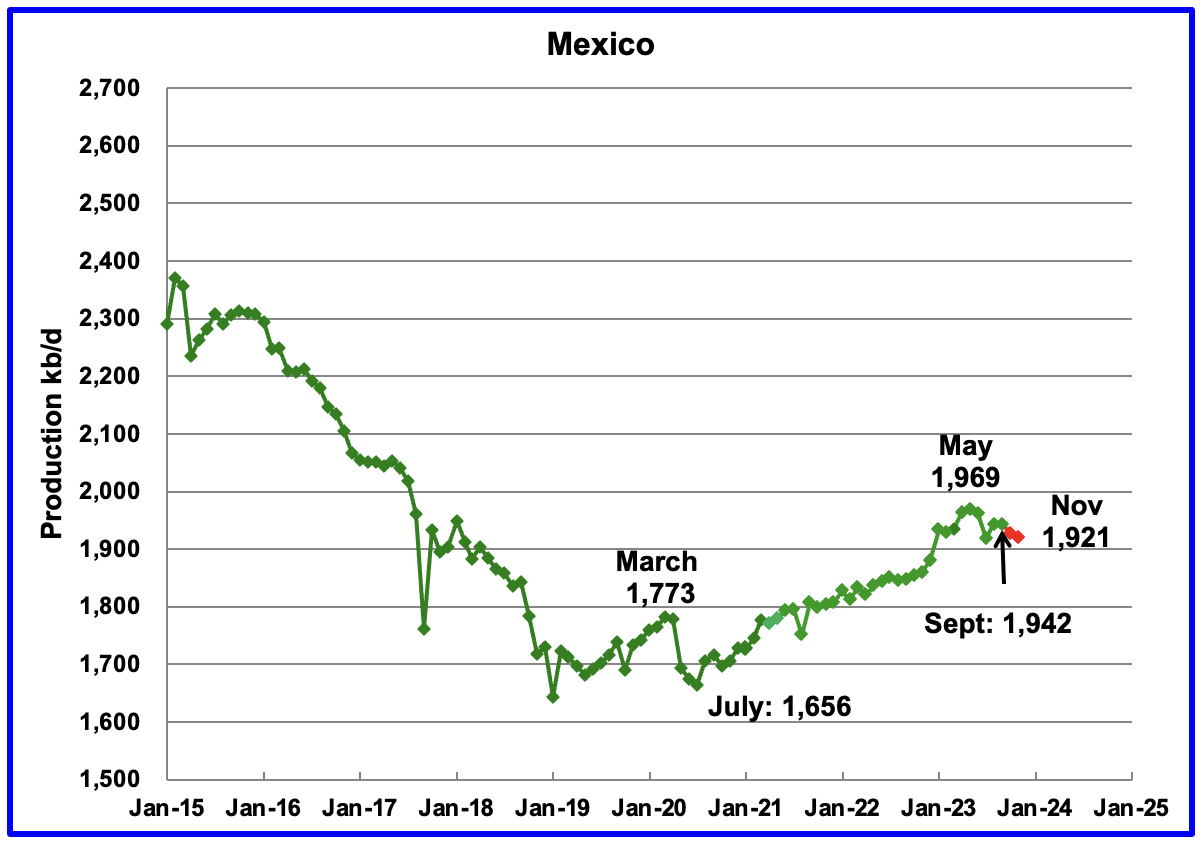
Mexico’s production in August and September was 1,943 kb/d an increase of 24 kb/d from July’s 1,919 kb/d.
According to Pemex, Mexico’s oil production dropped in October and November to 1,921 kb/d.
Mexico has recently revised its definition of condensate. This has resulted in the EIA adding an extra 63 kb/d, on average, to the Pemex report. The red markers include the additional 63 kb/d.
According to the January MOMR for 2024: “Pemex’s total crude production decline in mature areas like Ku-Maloob-Zaap and Integral Yaxche-Xanab is forecast to outweigh production ramp-ups in Area-1 and El Golpe-Puerto Ceiba, and from a few start-ups, namely TM-01, Paki and AE-0150-Uchukil.
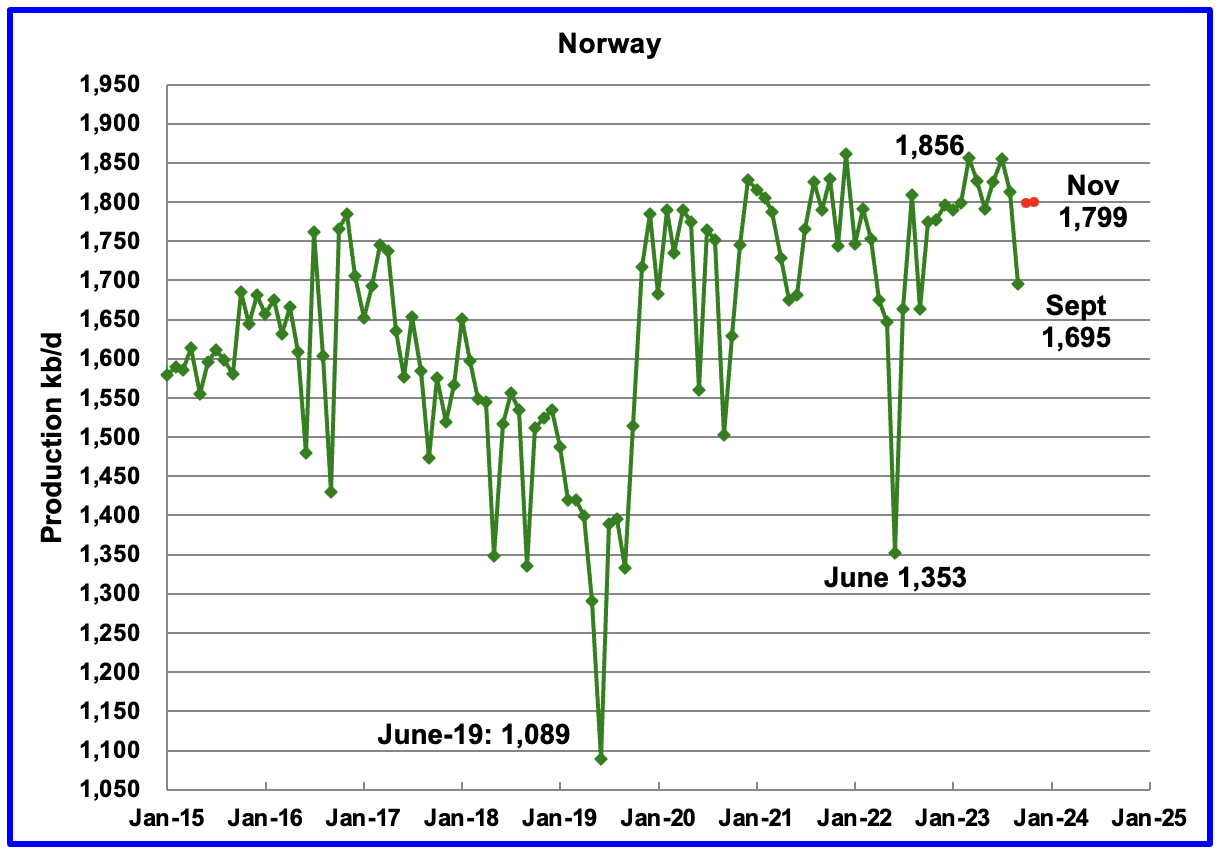
The EIA reported Norway’s September’s production dropped to 1,695 kb/d.
Separately, the Norway Petroleum Directorate (NPD) reported that October’s production increased to 1,798 kb/d and then added 1 kb/d in November 1,799 kb/d, red markers. The October rebound was due to repairs to the equipment failures experienced on a number of platforms in September.
According to the NPD : “Oil production in November was 3.1 percent lower than the NPD’s forecast and 0.9 percent lower than the forecast so far this year.”
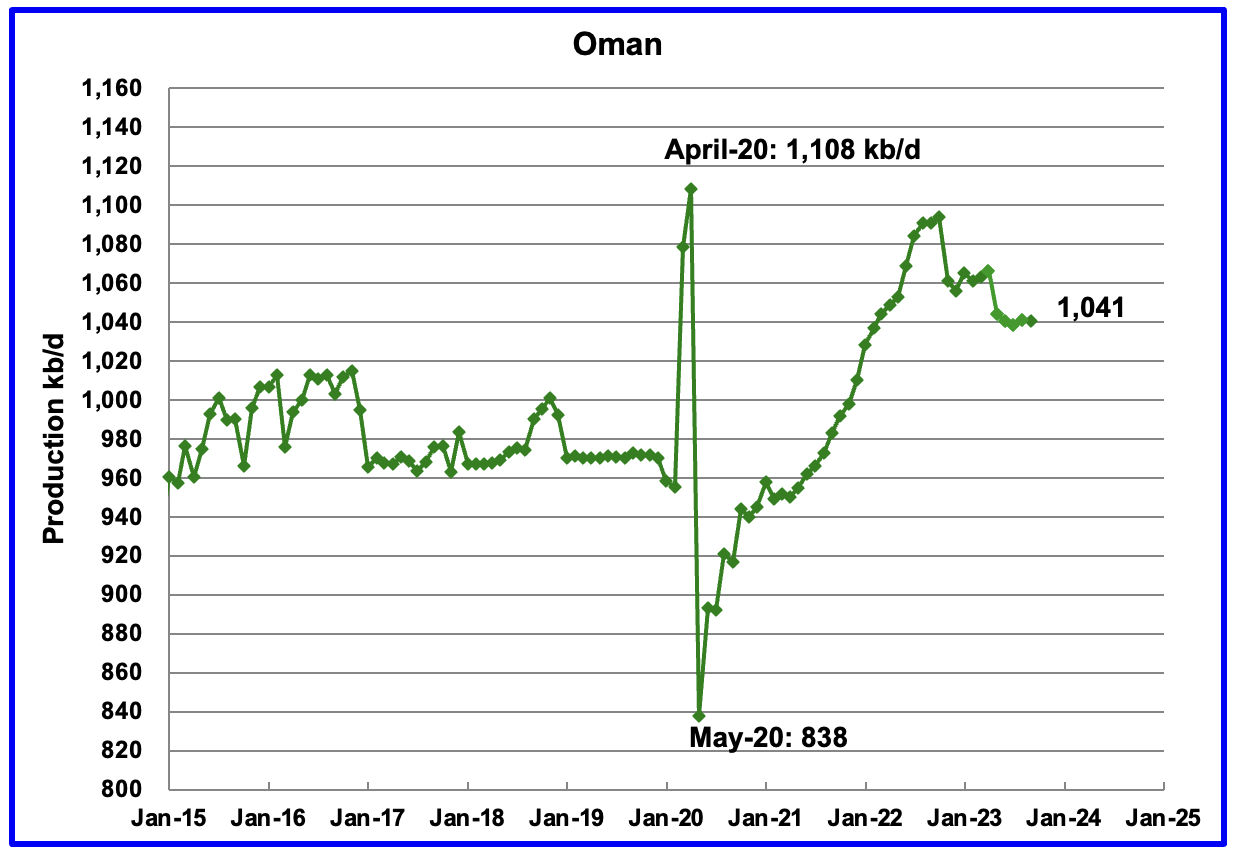
Oman’s production rose very consistently since the low of May 2020. However production began to drop in November 2022. According to the EIA, September’s output was unchanged at 1,041 kb/d.
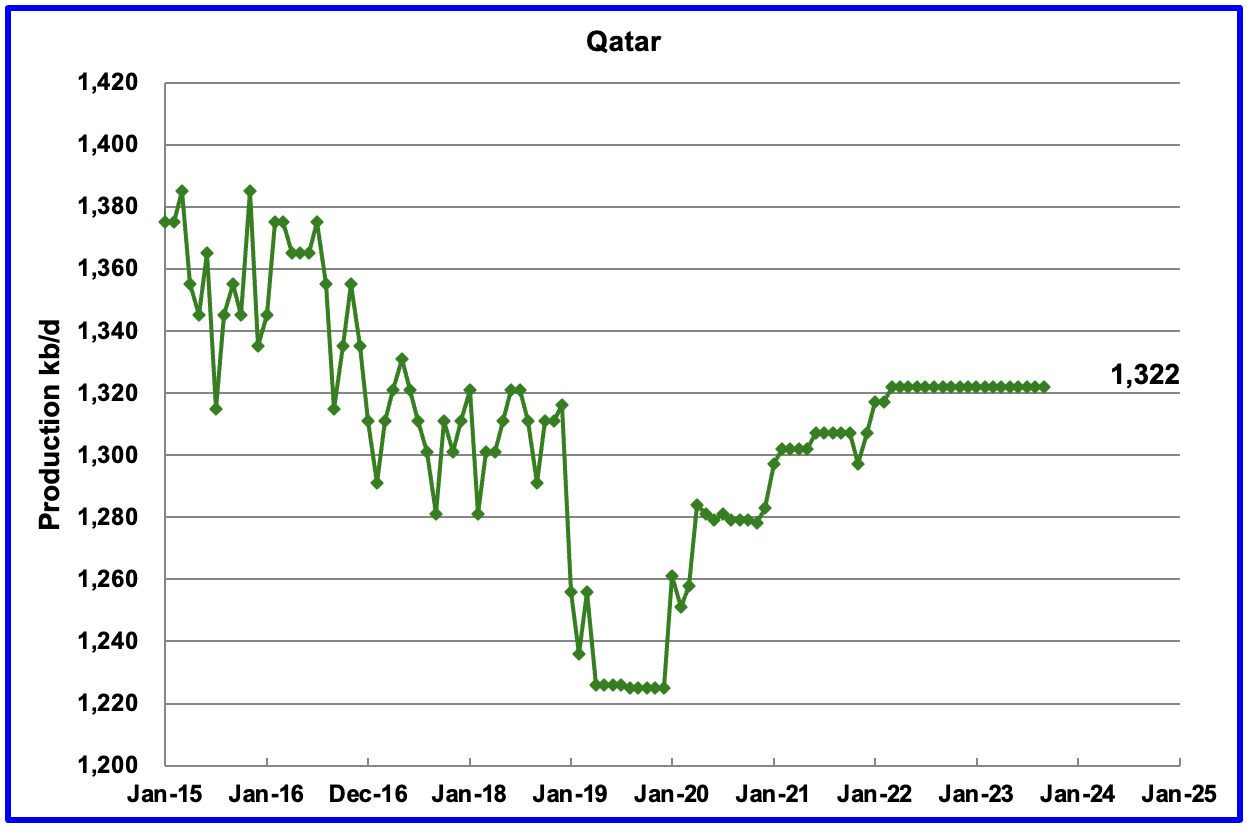
Qatar’s September’s output was unchanged at 1,322 kb/d, possibly due to lack of updated information.
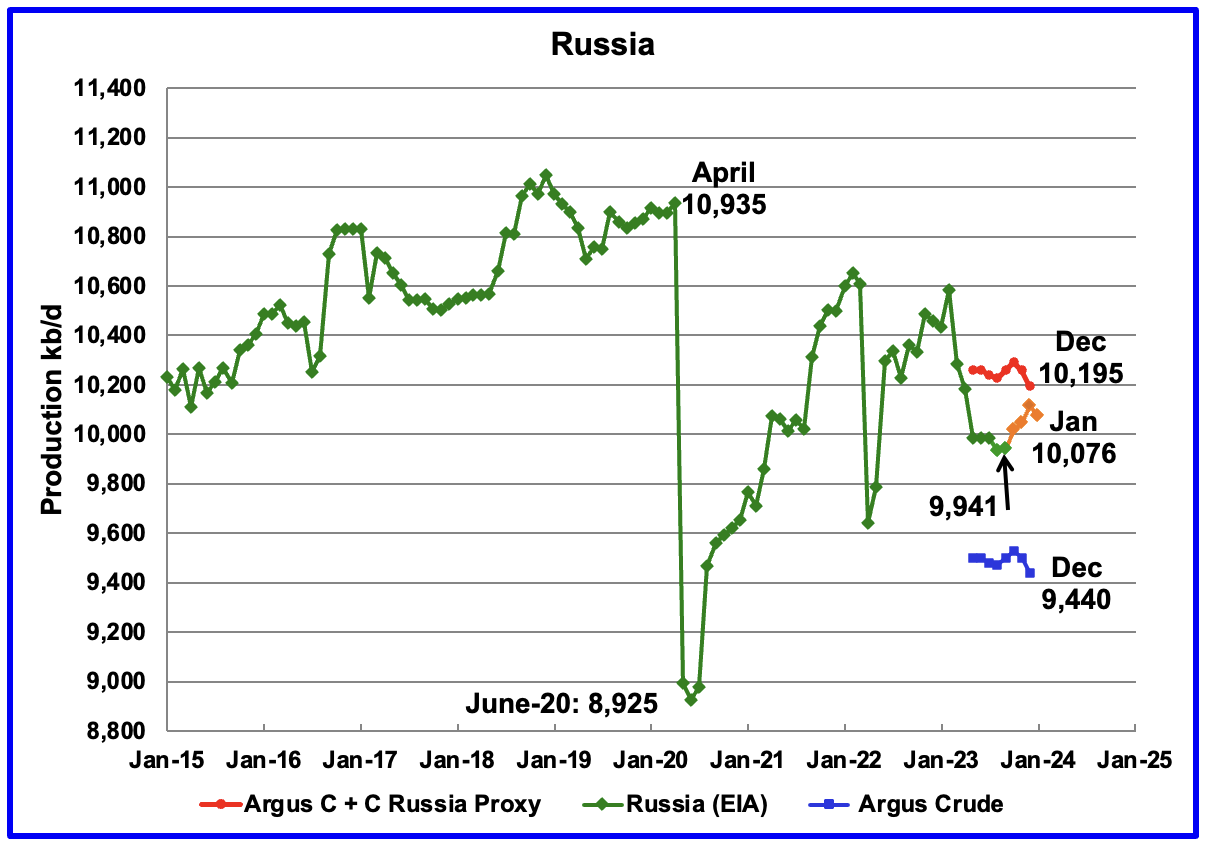
The EIA reported Russia’s September C + C production rose by 6 kb/d to 9,941 kb/d. Using data from the January STEO report, Russian output is expected to increase to 10,076 kb/d by January 2024, orange markers. If the projection is correct, this indicates that there is no sign that Western sanctions are affecting Russian oil production at this time.
According to this source, Russian Crude Flows Exceed OPEC+ Target. (A very long article)
“(Bloomberg) — Russia’s seaborne crude shipments shrugged off attacks on shipping in the southern Red Sea to register gains in the latest week, as Moscow failed to match export cuts that it pledged to its OPEC+ allies.
About 3.43 million barrels a day of crude were shipped from Russian ports in the four weeks to Jan. 14, tanker-tracking data monitored by Bloomberg show. That was up by 94,000 barrels a day from the period to Jan. 7.
The more volatile weekly average rose by 166,000 barrels a day to 3.45 million. While that was 134,000 barrels below the average export level seen by Bloomberg during the benchmark months of May and June, it was still less than half the cut Moscow pledged to its OPEC+ partners for the first quarter of 2024.”
Using data from Argus Media reports, Russian crude production is shown from May 2023 to December 2023. For December, Argus reported that Russian crude production was 9,440 kb/d, a decrease of 60 kb/d from November, blue markers. Adding 8% to Argus’ November crude production provides a C + C production estimate of 10,195 kb/d, which is a proxy for the Pre-War Russian Ministry estimate, red markers.
Comparing the Argus crude data with the latest STEO projection indicates that the EIA estimate for Russian C + C is between the Argus estimates for Crude and C + C. Prior to the war, the Russian Ministry estimate was alway 404 kb/d higher than the EIA estimate for C + C. The current December Russia Proxy output is 119 kb/d higher that the EIA’s estimate.
The January IEA OMR reports that Russian crude production in December was 9,480 kb/d, very close to the Argus report. Note the trend difference between the EIA and Argus after October. Is this an indication EIA’s estimate for Russian C + C is too high?
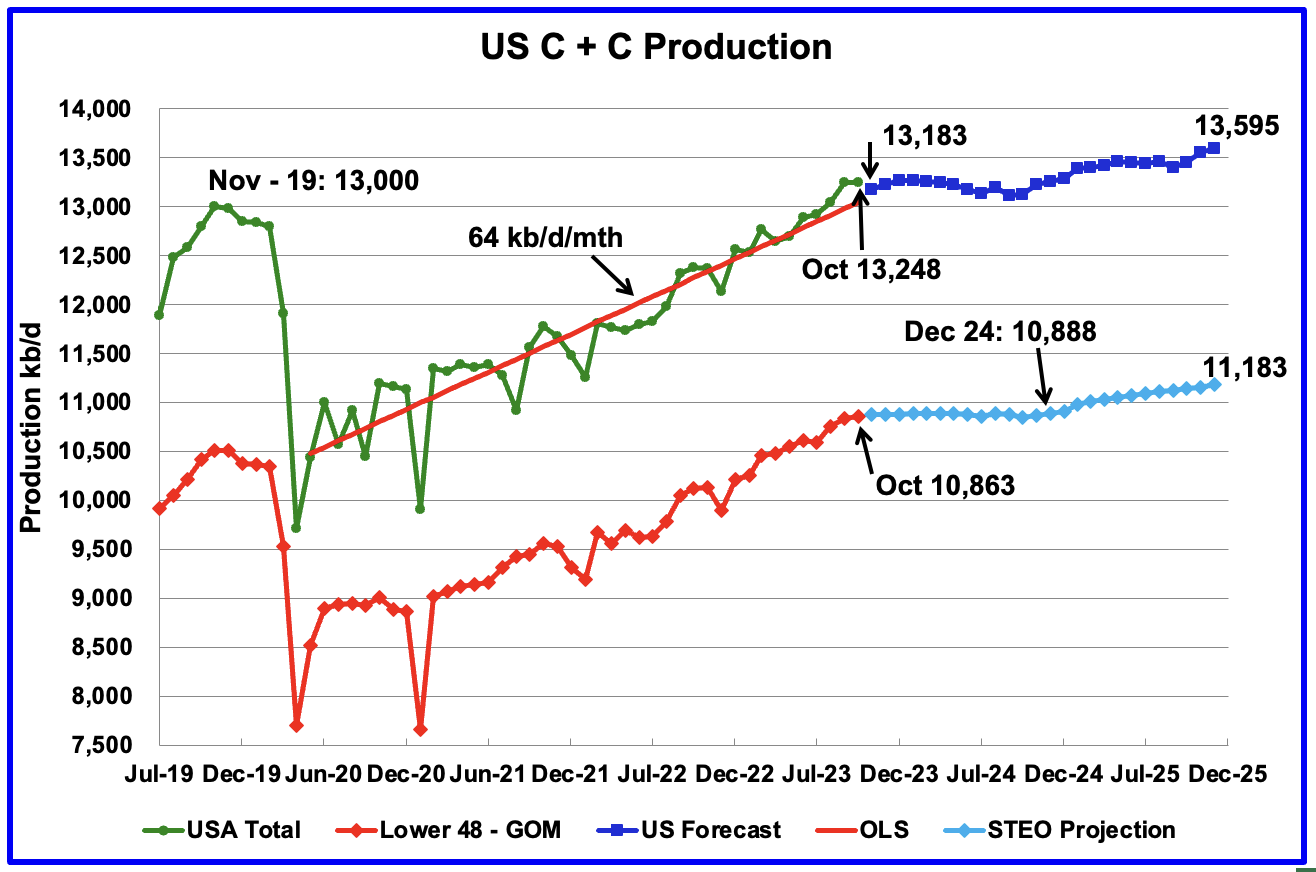
U.S. October oil production decreased by 4 kb/d to 13,248 kb/d. The decrease was primarily due to decreases in the GOM and North Dakota being partially offset by increases in Texas and New Mexico.
The dark blue graph, taken from the January 2023 STEO, is the forecast for U.S. oil production from November 2023 to December 2024. Output for December 2025 is expected to reach 13,595 kb/d.
The light blue graph is the STEO’s projection for output to December 2025 for the Onshore L48. For 2024, the STEO is showing essentially no growth in the L48 states. From October 2023 to December 2024, production growth is 25 kb/d. This is consistent with the DPR model which has been showing a slow growth production trend for the last few months. Not clear on the source of the 300 kb/d production increase for 2025.
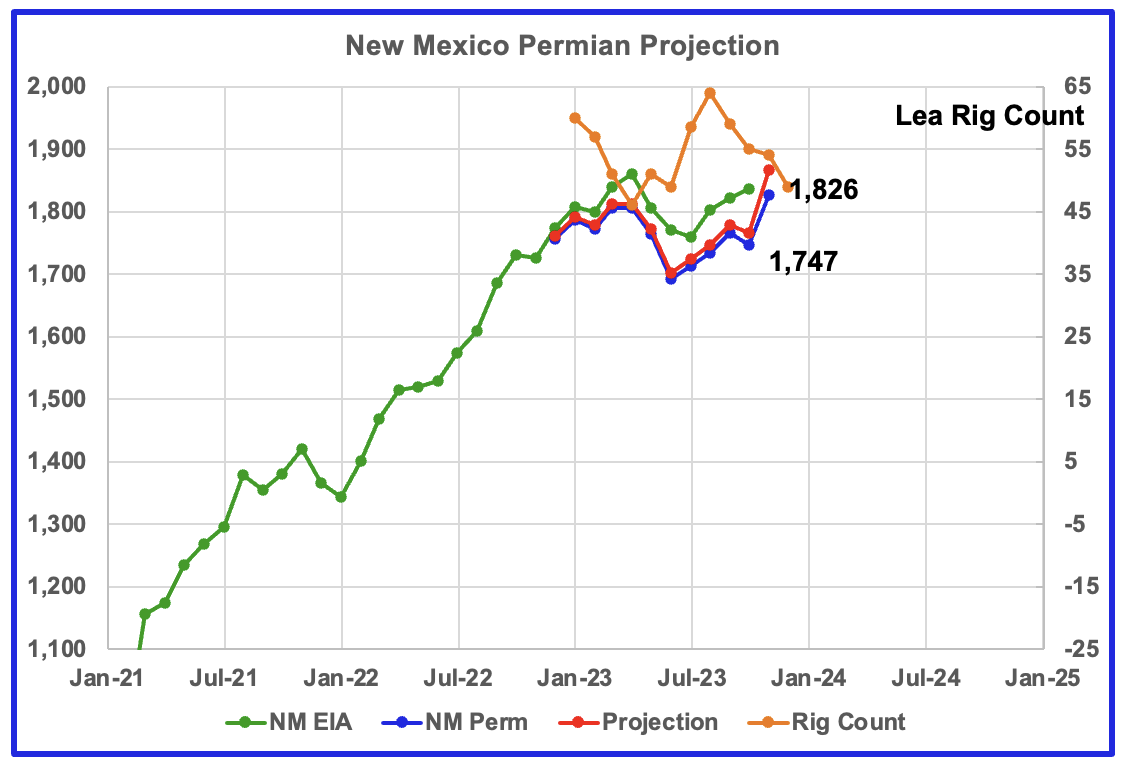
This chart reports on October oil production for New Mexico according to the EIA and November production from the New Mexico Oil Conservation Division (OCD). The blue graph is monthly data as published by the OCD and is the total oil production for the Lea and Eddy counties. The red graph is a projection for what the OCD could be reporting about a year from now for November 2023 production.
The raw data from the OCD is indicating an increase of 79 kb/d (Lea 59 kb/d, Eddy 20 kb/d) from October to November which translates to 101 kb/d in the projection.
Such a large increase in production was an unexpected surprise. The Lea county rig count has been added to the chart and it provides a possible clue to the surprise increase. Note that the rig count began to rise in June 2023. Allowing for an average delay time of four to six months to bring wells online, the November increase may be the first batch of those wells starting production. If correct, production increases in New Mexico could continue for a few more months.

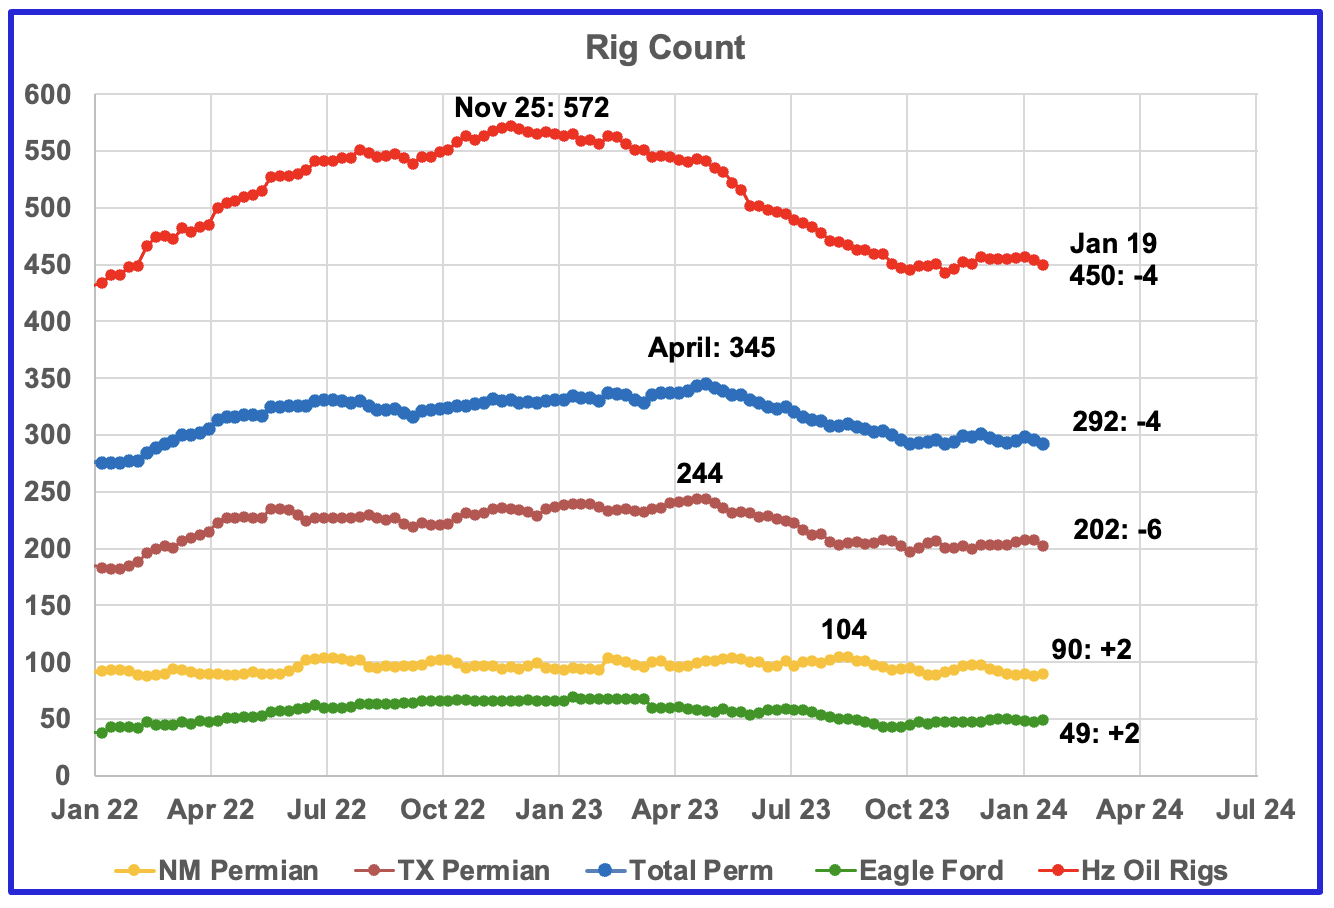
This rig count chart has been added to show the rig count for the New Mexico Permian. While the rig count for Lea county started to increase in June, the opposite occurred with Eddy. However even though the rig count began to drop in Eddy county in June, production rose by 20 kb/d in November.
For the week ending January 19, Eddy added 2 rigs to 46 while Lea was unchanged at 44. Lea’s rig count is down 19 rigs from the 65 operating in the week ending August 18.
Rig report for week ending January 19
– US Hz oil rigs decreased by 4 to 450, the lowest count over the past ten weeks and down 118 since November 25, 2022. The rig count has been close to 450 since the beginning of October.
– Permian rigs were down 4 to 292. Texas Permian was down 6 at 202 while NM was up 2 to 90. In New Mexico, Lea county was unchanged at 44 while Eddy added 2 to 46.
– Eagle Ford added 2 to 49.
– NG Hz rigs added 3 to 109 (not shown)
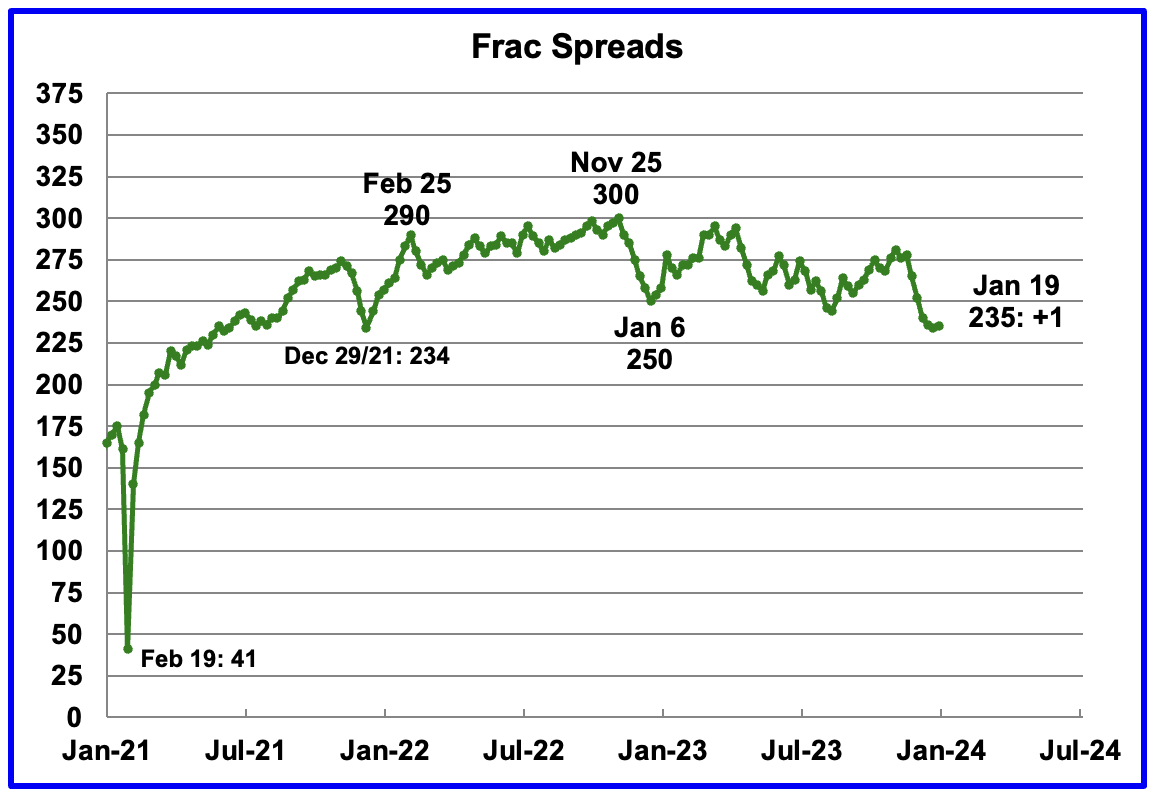
Frac Spread Count for Week ending January 19
The frac spread count was up 1 to 235 and up 1 from the previous low of 234 on December 29, 2021.
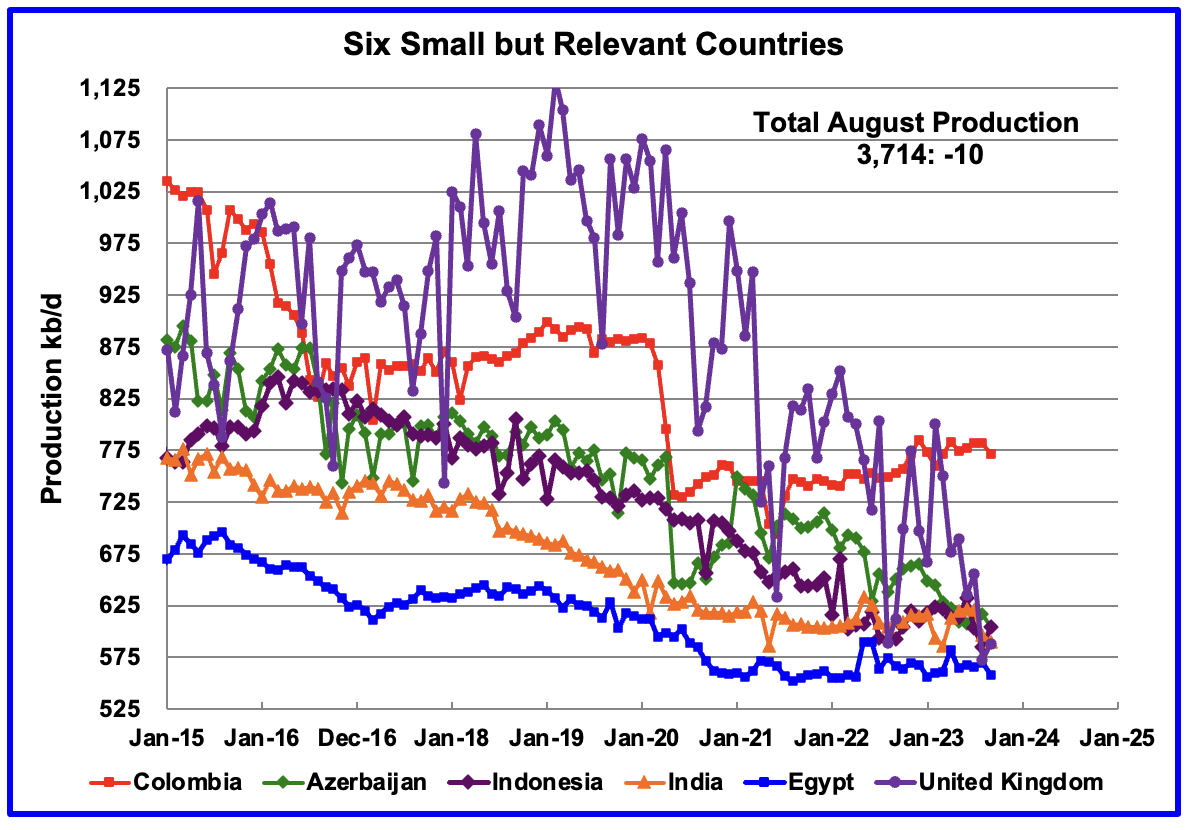
These six countries complete the list of Non-OPEC countries with annual production between 500 kb/d and 1,000 kb/d. Note that the UK has been added to this list since its production has been below 1,000 kb/d since 2020 and fell to a new low of 573 kb/d in August. September added 15 kb/d.
Their combined September production was 3,714 kb/d, down 10 kb/d from August.
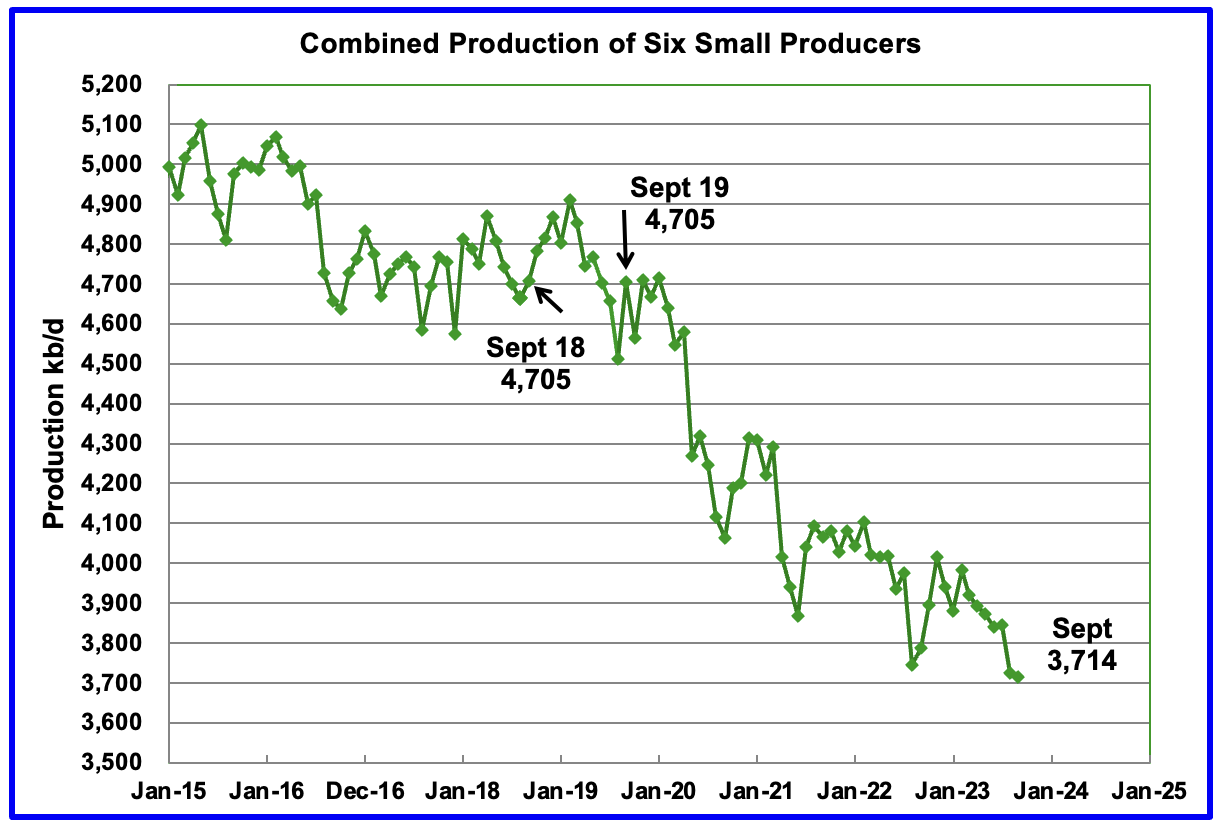
The overall output from the above six countries has been in a slow steady decline since 2014 and appears to have accelerated after 2019.
The decline from September 2018 or September 2019 to September 2023 is essentially 1,000 kb/d. This means that the combined average decline rate for these six countries is somewhere between 200 kb/yr and 250 kb/yr
170 responses to “September World Oil Production Rebounds”
As always, Great job Ovi!
Andra the Giant
Thanks. Much appreciated.
Ovi , stellar and efficient as usual . Kudos .
Hole In Head,
Great to see you back! Thought you might have some bad health or something…hope u r well.
What do you think of those US Navy Aegis Destroyers that are sinking drones, missiles, ships and anything else advesarial….with ease!!!!
They are detecting missiles about to be fired and destroying them before they can.
https://www.youtube.com/watch?v=58FB3orQz8E
only 62 of these!
The CEO of ARAMCO has been warning for over a year that we are about to see a world oil supply crunch. Now the CEO of Occidental is saying the same thing. Peak oil is upon us and the big guys are screaming the bad news. Is anyone paying any attention?
Occidental’s CEO Sees Oil Supply Crunch from 2025
Occidental’s CEO Sees Oil Supply Crunch from 2025
By Charles Kennedy – Jan 16, 2024, 11:00 AM CST
• The ratio of discovered resources versus demand has dropped in recent decades and is now at around 25%.
• Oxy CEO Hollub: “2025 and beyond is when the world is going to be short of oil.”.
• Oil industry executives have been warning that new resources, new investments, and new supply will be needed just to maintain the current supply levels as older fields mature.
The world would find itself short of oil from 2025 onwards as exploration for longer-producing crude reserves is set to lag demand growth, Vicki Hollub, chief executive of Occidental Petroleum, said at the Davos forum on Tuesday.
For most of the second half of the 20th century, oil companies were finding more crude than global consumption, around five times the demand volumes, Hollub said, as carried by Reuters.
The ratio of discovered resources versus demand has dropped in recent decades and is now at around 25%.
“In the near term, the markets are not balanced; supply, demand is not balanced,” Oxy’s CEO said.
China Issues Huge Batch Of Crude Oil Import Quotas
“2025 and beyond is when the world is going to be short of oil.”
According to the executive, the oil market will find itself moving from an oversupply in the near term to a long period of supply shortages.
Oil industry executives have been warning that new resources, new investments, and new supply will be needed just to maintain the current supply levels as older fields mature.
One of the most persistent warnings has come for years from Saudi Arabia, the world’s largest crude oil exporter, and its state oil giant Aramco.
The Kingdom and Aramco have repeatedly said that the focus of the energy sector and the debates on the energy transition should be on how to cut emissions, not on reducing oil and gas production.
Speaking at the Energy Intelligence Forum in October, Aramco’s chief executive Amin Nasser said that the Saudi oil giant is working on renewables, e-fuels, hydrogen, and carbon capture and storage (CCS). But the world will need oil and gas for decades and renewables won’t meet this need for decades, he added.
The additional oil and gas demand over the coming decade needs new upstream investments to offset the 5-7% annual decline rates, Nasser noted.
Ron
I think the CEO of Oxy is optimistic. Attached is a chart by Rystad of oil discoveries from 2015 to 2021. Using the posted GOR, below are a sample of recent years oil discoveries.
2018: 5.4 Gb
2019: 6.2 Gb
2020: 7.0 Gb
2021: 3.1 Gb
Considering the world uses 30 Gb each year, the only year when discoveries were close to 25% is 2020. 2021 is close to 10%.
I think the first chart in the post is more a reflection of demand than supply. Keeping in mind that OPEC plus has close to 3 Mb/d in reserve and demand will expand at 1 Mb/d/yr, I cannot see where 2025 will be the year when oil gets short. I still think that shortage, if it develops, will be closer to 2028 to 2030.
I think both CEOs are trying to talk up the future price of oil, exactly as you would expect, being producers. However the financial markets aren’t buying it. They see prices dropping into the 60s next year, and below 65 by 2027.
https://www.cmegroup.com/markets/energy/crude-oil/west-texas-intermediate-wti-crude-oil-calendar-swap-futures.html#venue=globex
Of course it’s impossible to predict future gyrations/ For one thing the timing of geopolitical shocks or recessions is unclear. But markets don’t see some sort of Hotelling style high price scenario with a dwindling fossil fuel resource leading to production price increasing with a discount rate equal to the cost of capital. More the opposite. Markets think prices are being propped up by Middle East war jitters, which are near term.
As for the lower discoveries, this is an incredibly old complaint, which paradoxically hasn’t held up. Where is the $200+ oil that Matt Savinar predicted? And why is the R/P ratio not declining.
“Discoveries” tends to be the wrong metric because reserve growth in existing oil fields is not considered a discovery and is actually backdated and given to the historical finding of the field.
The CME manages crude oil “futures” predictions based on current price fluctulations; those strip outs change every day and have nothing to do with how financial markets “view” the future of supply and demand. “Markets’ change every millisecond; go to, for instance, oilprice.com and watch WTI open on the NYMEX at $3 and close at -$3 later in the afternoon. The CME strip changes accordingly.
Of course the lack of major worldwide discoveries matter. They matter a lot, for a host of reasons.
Reserve additions in newly found structures, or traps, are generally added from new minor, tertiary pays found on the same trap, or IOR estimates, both rarely work out as predicted…EXACTLY like volumetrically estimating OOIP in the original new discovery and picking some stupid RR factor like 60%, never works. Whose guilty of all this horse shit? Resevoir engineers wishing to self-perpetuate their existence, or CEO’s selling the wares and ordering resevoir engineers to lie. Like 1,000 BO EUR’s from the Wolfcamp in 2018. How embarassing should THAT be?!
In the world we live in today, oil reserves are dung heap. By the time you book shale oil reserves, for instance, and the EIA recognizes them, they are totally depleted.
Worldwide R/P ratios have remained remarkably consistent over the years, in spite of falling new discoveries, because of all the stinking lying.
“Peak oilers,” an asinine term, get constant grief from people who refuse to accept reality, want to be different, and relevant on social media, and will resort to all kinds of dog dookey to prove themselves right, others wrong. It’s not happened yet, mostly because of other people’s money, and inspite of unprofitability, so therefore it will never happen, they think.
Don’t buy it. We’re getting closer every day.
In 2023, US production substantially outperformed predictions. In DEC2022, the EIA STEO predicted we would average 12.3 MM bopd in 2023 and exit at 12.5. Instead, we exited at 13.2+ MM bopd and averaged 12.9 MM popd. We had double the growth predicted. And at lower average oil prices than EIA had predicted. Just check the DEC2022 STEO.
Or look at PXD CEO statements at CERA Week in MAR2023. He said it would be another 2-2.5 years before we broke the old 2019 production record. In fact, we broke it in AUG2023, 5 month later, less than half a year!
That doesn’t mean it will go on forever. But those who want to talk down production now ought to consider how they failed to predict 2023 growth, of almost a million bopd per year, exit to exit.
Great post, Ovi. Please keep up the good work. This blog could not survive without you.
I’m just curious, but what is your personal opinion of the world energy situation for the next ten years or so? Do you think oil production will keep on rising? Or do you think the decline will set in and cause serious repercussions? Or do you think oil production will plunge, but renewables will replace falling oil production, and all will just be fine and dandy?
I am extremely pessimistic. But I could be wrong. We know that Dennis thinks renewables will save the day. I do not. What do you think?
Hey, just curious. It’s not that important, but I was just wondering. Oh, and anyone else with an opinion, please chime in.
Ron
Ron
Thanks
I am slowly drifting into the Peak Demand camp. I think that Peak Oil is history, 2018.
The problem is slowing demand rate growth. I think that demand will continue to grow till about 2028 to 2030. The question I can’t answer is whether it will get back to 84,580 kb/d. Assuming there are 3,000 kb/d in reserve by OPEC Plus today and add that to September 2023 production in the first chart, supply could be 81,538 kb/d plus 3,000 kb/d = 84,538 kb/d in 2028. Damn close to 2018.
Going forward I will be interested to see what the Post pandemic peak oil will be. My guess is slightly below November 2018. Then demand will start to slowly fall off. I don’t see a Seneca hill. For a while I thought that Ghawar was going to be a Seneca hill. I now think it will also be a slow decline.
So bottom line, I see a post pandemic peak close to 84,000 kb/d around 2028 to 2030 and then a slow decline in demand for oil.
Ovi, I don’t see a gradual decline in world supply. I believe we will hit 5% decline within 5 years, perhaps within three years. The article below is from 2015, 8.5 years ago:
Saudi Aramco Testing C02 to Get More Oil From Giant Ghawar Field
Saudi Arabian Oil Co. started injecting carbon dioxide to try and boost extraction rates from the world’s biggest oil field as the company steps up plans to recover more crude from its deposits.
Saudi Aramco, as the company is known, already started injection and will put 40 million standard cubic feet per day of CO2 into the Uthmaniyah area south of the Ghawar field, it said Thursday in an Arabic statement on its website. About 40 percent of what’s injected will be stored in the field.
“The project aims to enhance oil recovery beyond the more common method of water flooding, and is the largest of its kind in the Middle East,” it said. The project is part of the company’s efforts to reducing domestic carbon emissions and meeting environmental goals, it said.
Oil-rich nations across the Persian Gulf are seeking ways to continue output from fields that are at least half a century old. While the industry average is for producers to recover about 35 percent of fields’ total deposits, Saudi Aramco is developing technology that could double that rate, Ahmad al-Khowaiter, chief technology officer, said in March.
Injecting CO2 into Uthmaniyah will boost oil-recovery rates by 10 to 15 percentage points, Khowaiter said in March. The CO2 for the project will be captured at Hawiyah gas recovery plant and then piped 85-kilometers to the site. The project will be tested for three to five years before Aramco applies the technology to other fields, it said in Thursday’s statement.
“Saudi Aramco is carrying out extensive research to enable us to lower our carbon footprint while continuing to supply the energy the world needs,” said Amin H. Nasser, acting president and chief executive officer.
bloomberg
I think Saudi is starting to panic. I doubt that Saudi has more than one million bpd in reserves. And the rest of ARAMCO Plus has less than half that.
Ron
My gradual decline remark relates to slowing declining demand. Producers will produce enough to meet lower demand post 2030 without any problem. Could result in a fight for market share between countries.
With regard to Ghawar, I will go with SA’s claim that production is declining at 2% in spite of all of their efforts.
Hi everyone! A long time lurker who dares to post for the first time. To begin with, great work Ovi, Dennis and Ron!
On the peak oil demand debate, the assumption is that renewables will eventually decrease oil demand. However this isn’t happenning jus yet and to get there, industrial production (mainly using fosil fuels) would need to ramp up. Wouldn’t this show as a pronounced acceleration of oil demand before it gets subdued? If we asume the transition continues at the current speed, wouldn’t peak oil demand rather plateau and only decrease slowly?
“to get there, industrial production (mainly using fosil fuels) would need to ramp up. Wouldn’t this show as a pronounced acceleration of oil demand”
I don’t think anyone knows just how much energy will be consumed in the attempt. I doubt it would add to a ‘pronounced acceleration’ considering how lackadaisical the world is about the challenge, and just how very much energy is used in all kinds of other pursuits including air travel, marine transport, metal industry, computer industry, medical and military industrial complexes, agriculture, fossil fuel production, etc.
OIV —
A lot depends on China. Much of the increased demand for oil (and all for coal) since 2000 has come from China. But the government doesn’t like being dependent on imports, so they are trying to reduce demand from the transportation sector, though not from petrochemicals. They have succeeded yet, but if they do it will be hard to see what new demand could offset efficiency improvements and demographic change in rich countries.
Maybe India? Well maybe, but if the Chinese succeed inbuilding a big EV industry, they will start massive exports of cheap electric cars. They are already doing this with two wheelers, which are the vehicle of choice in densely packed Asian cities.
Here is my opinion, which is worth nothing.
https://www.oilystuff.com/forumstuff
Mike Shellman has identified the wholer world of oil growth is being supported from 4 counties in the USA and the wells there are getting gassier.
( I don’t remember which ones, read his work….I hope I haven’t misinterpreted )
That does not sound good at all. It seems really simple to me.
Andre The Giant
I have added a special section in the last US report on POB to track what is happening in those four counties.
In the current post, under the US report, there is a sudden spike in NM production above its previous high. The was an unexpected surprise and difficult to explain, except through a sudden increase in new wells coming online due to increased drilling. This increase may continue for a few more months and then the decline might begin in parallel with the decline in drilling that started in August 2023.
Attached is the oil and gas production chart for Lea county. This is raw data from the NM OCD. The first batch of Lea data was downloaded on Thursday and I thought there was a mistake. I checked again on Friday and production was higher again.
In November 2022, oil production was 1000 kb/d. In October 2023, production was 1,051 kb/d, up 51 kb over 11 months. Then all of a sudden November 2023 adds 59 kb/d. What happened?
Mike has his ear to the ground and has been watching the Lea rig count drop since August 2023. The drillers/friends he is talking to are probably telling him that things have changed for the worst in Lea county. Because of the delay from spudding to production, it may take a few more months before a sharp decline in production starts to show up in Lea county data.
Mr. Shellman is 100% correct. 4 Permian Basin Counties are the only shale counties growing non opec growth and that will come to an end very soon and perhaps this year.
I own stock in a couple of smaller Canadian oil companies (that I almost sold in late October) and they have been crushed over the past few months. I believe that the Permian is going to roll over this year so I think that companies with more conventional wells and oil sands will do better when the depletion really sets in.
I have no joy in watching this resource being sent overseas as fast as we can pull it out of the ground. I think we’ll wish that we kept it in the ground to ease our own transition to whatever comes afterwards.
Same situation here too. I have been watching the TMX debacle since 2013 and have come to the conclusion that Canadians are dumber than Americans on a per capita basis. The TMX project is now entering its eleventh year. The Alaskan pipeline, which is longer and in an isolated and harsh environment, was built in three years. Much of the TMX push back came from British Columbia in an attempt to lean green. But BC is anything but green. Their forestry management is atrocious, wood being their second biggest export. Clear cutting on 45 degree slopes is apparently a bad idea. Not to worry. Anther ice age will fix the soil erosion.
Victoria, the capital and a jewel of a city, dumped all their sewage straight into the ocean until 2020. That would put them about 100 years behind the rest of the west. Better yet, BC’s number uno export is… coal:)
Anyhow I greatly appreciate this site and all the effort that goes into it. Thanks muchly to everyone and respect to Mr Patterson.
If Art Berman is right, there might be a drop in demand for gasoline, not a drop in demand for oil, which is still going to be needed increasingly for diesel, jet kerosene, marine fuel, etc. If demand for EVs grows, won’t gasoline just keep getting cheaper, and all those used ICEs become hot items? Idaknow.
But then I’m a lay person who in spite of keeping track of oil issues since 2005 still feels like he knows nothing about the subject. It’s fucking complicated. My geology professor back in 2007 predicted peak in 2011-2013 and has since drifted off into retirement obscurity. It looks like he might have been off only by 5-7 years.
Two of my great-great grandfathers pumped the oil fields near Toledo, Ohio back in the period of 1895-1920.
“What oil fields around Toledo, Ohio?” you say.
Exactly. As goes Ohio . . .
Ron
I agree with you completely that, renewables, won’t some how save humanity.
A successful human endeavor must, in the end, produce enough revenue (wealth) to pay for itself. Governments giving subsidies, preferential treatment and legislative coercion isn’t a long term solution.
I would say that, in the moment, any power project should be the least expensive most reliable and minimally environmentally disruptive as possible. If those that feel that peak oil production is past, in the present or sometime in the near future then worrying about carbon dioxide is silly. Without abundant inexpensive steel, fertilizer, plastic and cement the world will not be a nice place live. Another thing that’s becoming common to have power companies telling its customers to start sweating in the summer and start shivering in the winter and in both cases DON’T charge your car. Just a side note….the US Government is scheduled to borrow $340 Billion this coming week. There are only 47 countries in the world with an annual GDP greater. Let the fact sink in, that it’s just this week.
” If those that feel that peak oil production is past, in the present or sometime in the near future then worrying about carbon dioxide is silly. Without abundant inexpensive steel, fertilizer, plastic and cement the world will not be a nice place live. ”
What if both propositions are true? Both peak production AND climate change mean the “world will not be a nice place to live [in]”. There is no way out.
And lets just keep pretending poor planning of transport isn’t the main reason for oil consumption.
When Ovi said “The problem is slowing demand rate growth”, I found myself thinking in an opposite way…
slowing demand growth is desirable and may help blunt the severe effects of the world economy running rapidly short on oil supply. As I see it- the greater the demand destruction we can achieve without experiencing outright depression…the better/luckier we will be.
Ron, I think the energy situation is going to be even more and more a mosaic of regional outcomes than it has been in the fossil energy growth phase. Some places will drop off the list of regions which have been able to purchase or could afford to purchase oil products and NG. And others will be off the import list for geopolitical reasons…including perhaps the US and/or places we are economically and politically partnered with since WW2.
I also agree with your notion that alternatives to fossil energy will come up short on replacing all of the fossil energy. Once again a mosaic of outcomes.- Some places, like those with great hydro or those who are building other forms of energy capture/generation quickly, and have the capital/credit to ramp up fast with their purchase of Chinese equipment, will have a better chance of partially blunting the loss of fossil energy.
I think that overall the big risk is that globally energy demand destruction is going to be much slower than supply declines. And by demand destruction I am not talking the kind that is voluntary or proactive, rather the kind that comes via loss of purchasing capability…the hard way.
Before Johan Sverdrup, Troll was the largest oil producer in Norway. Troll III switched from producing the oil rim with long reach horizontal wells and reinjecting the gas to producing the gas a few years ago. Since then oil production (multiply by 6 to give kbpd) has been falling fast and may reach zero in the next few years or so.
Ovi,
Great job.
Note that on the delay from spud to first flow, Mr. Shellman has said 6 months minimum, my guess is that he is right, he obviously knows more than me. There also could be a few DUCs that are nor wolls in process, though the numbers are likely small, about 100 to 200 perhaps. So rig counts give some indication, but DUC inventory also plays a role. My guess is the New Mexico estimate form the PSM probably tracks New Mexico Permian output pretty closely. Note how close the numbers are from Feb 2021 to Dec 2022. I think you will find the match is quite close, in fact a chart of the difference would be interesting perhaps (that is New Mexico 914 initial estimate minus the sum of output from the 4 New Mexico Permian counties from the NM OCD).
Dennis
Thanks
Something seismic happened in Lea county in November. Let’s see what the EIA reports at the end of January. Will they confirm this November production spike.
Attached is the chart you requested using Lea, Eddy and Chaves county. The difference wanders between ± 30 kb/d up to February 2023. After that the OCD lags due to delayed updates.
The chart in the attached article agrees that Spud to Sale time (STST) of 6 months is a good rule of thumb.
While the STST average is 6 months, to me that expands the STST range to 4 months on the low end for a number of wells. That is why I think additional new wells were coming online in November to account for the increase.
https://btuanalytics.com/crude-oil-pricing/are-permian-rig-counts-high-enough-to-drive-growth/#:~:text=The chart below shows average,5.5 months and 6.7 months.
Thanks Ovi,
Your chart seems to confirm that the PSM pertty accurate. I think if we looked at Jan 2015 to Dec 2022 we would find it matches quite closely.
I think Mr Shellman said 6 months minimum, he knows aot more than me, my guess is thar he is correct. I am not an expert on the realities of how oil is produced.
Ovi,
Aren’t you over-interpreting this single preliminary data point?
I noticed that the OCT data point from the NM office is in the opposite trend from the PSM report… So if you average the two, things don’t look that extraordinary…
Another thing to keep in mind is that weather in November got colder and with colder weather more C5 condenses on the lease, rather than in the NG plant. That fluffs a bit the lease volumes (“oil”) and leans the NGL volumes.
BTW, this is probably the reason EIA reports lower volumes for Russia than the Russian Ministry of Energy. EIA probably only estimates lease condensate, while the Ministry reports both lease and plant condensate. Also, the condy volumes for Russia have been going up the last couple of years. The last two months before the embargo (Jan/Feb of 2023) they reported 1.1 MMbd, which is more than your estimate of 8%…
Kdimitrov,
If you have access to Russian Ministry of energy data can you put it in a spreadsheet at Google Docs (or wherever) and post a link to the spreadsheet?
We no longer have access to this data from North America (Ovi and I cannot access the data if it is available where you live).
This would be much appreciated.
Dennis,
They embargoed production data for a year, starting March 2023.
For the data for Jan/Feb of 2023 (last available), I used this Oxford IES paper. It has other interesting tidbits there.
https://www.oxfordenergy.org/wpcms/wp-content/uploads/2023/07/Insight-132-Russian-oil-output-increases-in-2022-amid-unprecedented-Western-sanctions.pdf
Thank you Kdimitrov.
On demand and supply…right now the UK National Grid is supplied by
34% nat gas, 6% nuclear, 49% wind, 1-2% each hydro, biomass and coal.
They have tapped into less than 1% of their offshore wind resource thus far.
And they have announced plans to ramp up nuclear deployment over the next 25 years-
https://www.theguardian.com/environment/2024/jan/11/uk-government-sets-out-plans-for-biggest-nuclear-power-expansion-in-70-years
We’ll see what they can pull off. The race is on.
Hickory
Are you implying that if the UK is able to get to 10% or 20% or 50% of its wind potential then the UK will be a prosperous and therefore a wonderful place to run a business and raise a family? Then the UK could once again be a manufacturer like it was 150 years ago? Abundant cheap power, the stuff that prosperity is built.
Ervin,
I assert that a place like the UK will survive the loss of fossil fuels (depletion and geopolitical disruption) better if they take extraordinary measures to come up with replacement production such as wind, nuclear, deep geothermal, and energy storage capacity (I leave out PV for the UK since its a marginal endeavor in the cloudy clime).
Similar thinking applies to all countries that don’t have enough fossil fuel to last them indefinitely.
Relying on imported fossil fuel is a dangerous limb to be hanging on.
Hickory … “Relying on imported fossil fuel is a dangerous limb to be hanging on.”
Yet relying on imported, solar panels, wind turbines, inverters, nuclear fuel, geothermal pipes, other electronics, batteries, cables and ships to repair off shore turbines is somehow going to be more reliable than importing fossil fuels.
IMHO when they can’t import fossil fuels, they wont be able to import any of the things made from fossil fuels either. All the solar, wind, nuclear, geothermal suffers from entropy, it needs to be replaced over time. What happens to imports of food once they have racked up huge debt in new BRICS yuan, or whatever currency, and they can’t pay back? Will the Pound be worth anything?
The whole energy story is one of an entire system where different feedback loops affect everything. All the renewables and nuclear comes at huge cost, a real cost of energy to build it, that the UK will never be able to pay back, especially in a world where they can’t import fossil fuels, which is coming whether they plan for it or not.
You know commercial banks create all the money via lending. Even before the FED existed. Back when we had a gold standard or gold backed currency. The money supply wasn’t at all connected to the amount of gold banks had on hand. Money supply grew back then just as fast as it does today with a debt based monetary system. Banks make loans when they see an opportunity to make a profit on the loan.
When the energy supply is shrinking so will the money supply. Because commercial banks will see less opportunity to be repaid on loans that they create. There for they will make less loans.
This is in fact why we currently have a dollar shortage globally. Banks don’t want to make the loans. It’s not that they can’t it’s that they see reality and choose not too.
Even in China where the CCP tells the banks they have to lend it’s just not happening as desired. Banks don’t want to lend when they know they won’t get the money back.
Here is the US since 2008 if you were too big to fail. Banks have had no problems loaning money to we will just call it wall street because they believe at the end of the day they will get bailed out. So the loan is perceived as safe.
The FED put is 100% psychology. As long as the commercial banks are willing to create the money that the FED can’t actually create the illusion of FED liquidity will remain.
There aren’t any bank reserves invested in the US stock market. That leverage is created at commercial banks using collateral to make actual loans.
Collateralized loans is what drives the financial markets but it also drives the real economy.
When the energy supply shrinks the debt is going to be defaulted on. We will see the private debts go down first. But eventually government debts will also be defaulted on because it’s the money that commercial banks create that ultimately turn into taxpayer dollars to be collected by the government.
Without enough commercial bank loans property values fall and there for tax receipts.
I don’t see an inflationary way out. Just a deflationary way out. And it isn’t really a way out it just an outcome.
I think we will see some spikes up in oil prices that are followed by collapse in oil prices as scarcity sets in and banks decide not to make loans needed to sustain current economic activity.
HHH. The outcome you describe will result in governments being unable to sustain support payments for healthcare, pensions (social securities) and other support to the poor and old.
This seems like a more and more likely outcome as the can of fiscal balance has been kicked so far down road in many countries.
The result (increased energy and health care poverty) could be one of the mechanisms that forces population downsizing, and destabilization within countries.
Yes , But deficit spending will be blown out to levels beyond comprehension in an attempt to keep the status quo going.
Interest rates will be pinned in at zero. Central banks will do but won’t have to do yield curve control. Markets will set interest rates at zero for them. Because without the credit impulse from the commercial banks growth will be lower than expected. Which will create high demand for government bonds extending government’s ability to spend money into economy.
Government spending, if it takes what is basically savings and turns it into deposits into checking accounts can increase the velocity of money. For a period of time. Like in the aftermath of Covid. But that has a shelf life. And the only real end result is debt levels both private and government went up by a lot since 2020.
Right now everyone both governments, private citizens and businesses needs interest rates to go lower much lower so the enormous amount of debt can be rolled over. Not paid down. Just rolled over.
Stuff like UBI (universal basic income) will be tried. To keep the economy up. But ultimately the debts are unsustainable. And as seen, if you hand out money especially during a time when we are in a supply shock or scarcity . Prices can go up. They can go up to uncomfortable levels. They just can’t stay at those levels.
So I think we will be swinging back and forth between high priced oil and low priced oil. Which is no good if you’re an oil producer.
Look at the FED’s so called tightening. Higher interest rates and QT which is lower balance sheet and yet stocks are at all time highs because commercial banks currently have no problem lending to wall street.
Further proof that the amount of bank reserves or the size of the FED’s balance sheet doesn’t matter because banks don’t actually use bank reserves. They don’t need or use bank reserves to create loans and there for liquidity.
Heck between 1940 and 2007 the amount of bank reserves at the FED ranged between about $20-$40 billion. Yet the money supply grew for the most part exponentially over that time. Bank reserves don’t matter.
What matters is the risk level involved with commercial banks creating loans.
We get into and energy contraction. The money supply will contract regardless of what the FED does or doesn’t do because they don’t control the money supply. The FED put is 100% psychological.
The idea that there is an entity out there that’s all powerful when it comes to the economy and money supply is absurd. And will get exposed as being absurd when energy scarcity sets in.
My bet though is as bond yields roll over and head down it means financial conditions are tightening and money becomes harder to get. Stocks and oil both head lower as bond yields fall back to zero.
Look over in China. Bond yields are head down almost at all time lows. It’s because credit is becoming harder to get as they continue slipping into deflation.
I’m going to give you a little hint on how I believe things will play out in Asia in particular.
But also in Europe.
The collateral that underpins a lot of the Eurodollars in Asia is actually JGB’s or Japanese government bonds. Well it’s actually the shorter dated bills that are important to the Eurodollar market.
JGB’s are used as collateral to create dollars that allow global trade and finance to happen in that neck of the woods. US bills are also used but not exclusively.
The equivalent in Europe would be Italian government bills that underpin the majority of dollar denominated loans in Europe.
I think we will see a run on the collateral that backs a large part of the dollar denominated debts and it’s going to be an enormous deflationary problem. Outside the US.
A lack of energy will most definitely cause a dollar liquidity squeeze outside the US. And the biggest bulk of collateral being used that isn’t US bills comes from two countries that have a lot of debt but not many natural resources. That’s a problem for global dollar liquidity.
And there for it will be a problem for oil prices.
Central banks would make the collateral shortage worse by buying the short end of the curve trying to stop a run on collateral btw.
So I think the above is all inevitable regardless of what the central banks do.
HHH, what is your guess for the timing?
Timing is very hard to nail down. But I keep an eye on what the JGB’s bills are doing. When there is strain in the market the yields on the bills tend to spike down as there becomes huge demand for them as collateral. During a collateral shortage.
But what if that collateral was to get repriced though. Meaning what if it lost value say due insufficient energy. Or what if Eurodollar banks decide they no longer wanted to use that collateral and only US T-bills will do. Which in itself would reprice the value of JGB’s or Italian bills much lower and cause a collateral shortage.
Counterparty risk between banks will play a huge role. When deciding whether to except collateral or not. If the only collateral you have is deemed no longer sufficient. Then your ability to borrow money into existence for global finance and trade is greatly diminished.
Some US banks ran into this very problem back in March of 2023. The collateral that they held was insufficient to borrow their way to liquidity. So they became illiquid due to insufficient collateral.
Also keep in mind that in the Eurodollar market the same collateral is being used for anywhere between 15-25 different loans at the same time. What could possibly go wrong?
I also keep an eye on REPO failures. Meaning one of the parties involved in the REPO transaction decides to keep the collateral. Instead of returning it as was agreed upon.
REPO fails tend to spike during collateral shortages as collateral is at a premium and cash isn’t. Which again could make banks think twice about what collateral is sufficient or not sufficient.
Hideaway- “somehow going to be more reliable than importing fossil fuels”
Certainly- Compare a scenario 7 years from now where an importing country who relies almost entirely on imported fossil fuels loses half of the supply (or can’t afford it), versus the same country who had deployed large capacity alternative sources. The second would indeed have ‘more reliable’ availability of energy at its disposal.
As an importing country just sitting on your hands is not a strategy.
Regarding affordability of energy consider that the world has grown big on very cheap energy. The whole system, no what the particular components and sources, is going to get more and more expensive over time. Perhaps that wouldn’t be the case if fossil fuels were self-replenishing by magic forces deep in the earth. I think it is highly likely that populations of most countries will decline to come in line with the domestic/regional food and energy resources that they can muster. It won’t be voluntary downsizing. Mostly a process of forcing in the form of poverty, failed migrations, and in some cases armed conflict (within and/or without).
Hickory, it’s not ‘some country’, we are talking about the UK. Where you wrote ‘deploy’, it should be ‘buy from overseas and import’.
The cost of importing all the renewables and batteries would be multiples of importing just the oil, coal and gas over the same period.
IMHO ‘any’ country is much more likely to be able to import ‘some’ raw products for a long time after finished goods become too expensive or just not available.
“The cost of importing all the renewables and batteries would be multiples of importing just the oil, coal and gas over the same period. ”
I disagree. The cost of importing depleting fossil fuel energy is and will be much higher than spending money on replacement and efficiency mechanisms.
And importation of energy as a strategy in this increasingly destabilized world is a very insecure path to walk.
True for the UK, or Korea, Australia and most other countries.
Hideaway I’ll give you an example.
Iowa has very good wind resource, with about 60% of state electricity generated by wind on an annual basis currently.
As of 2022 they had installed wind capacity of 12 GW,
and the US government estimates they have a total wind resource of
as much as 570 GW! (which yes, may be triple what is practical to deploy).
And the retail price of residential electricity is 14 cents/kWhr
Compare this to Indiana which has 47% coal and only 6 % wind as electricity source, and yet has slightly higher retail electricity rate than Iowa.
Hickory, I don’t think one path is better than the other, I think both are disastrous.
Taking the UK as the example, the latest plan seems to be building one nuclear power plant about every year. Assuming something like Hinkley point C in the next decade. Assuming the current cost of around $40B for 3260Mw of capacity, the cost for 10 of these being ~$US400B, making the very big assumption the British pound does not fall dramatically as they try to borrow this much.
Assuming the cost of operation is similar to the US fleet of around $US32/Mwh in 2019 dollars (from WNA, last sensible year for numbers pre covid), giving a 60 year ‘life’ for the power plants, equals a spend of ~$US920B to generate ~17B Mwh of electricity over the next 70-80 years from 2034..
Assuming they spent the same dollars in coal at the current price (probably easier/much cheaper to buy the mines in USA, Australia, Indonesia, Canada etc). At current $US118/t of thermal coal of roughly 7Mwh/t, equals an energy equivalent, after allowing for only 40% efficiency, of around 21.8B Mwh of electricity generated. It could be run through existing plants from today, and new ones built from cashflow over the years at a fraction of NPP price.
The NPP has the distinct disadvantage of having a huge cost of money associated with it all paid up front over a decade or more before any return to pay for the interest…
For the UK, the real problem is Wind is making both Nuclear and Coal unprofitable to run. For 40% of the time Wind provides vast amounts of energy, but the coal or Nuclear still need to exist for the other 60% of the time. They can’t be turned off and on as quickly as needed, so excess power is available at that time and the wholesale price goes negative, destroying the economics of all 3. The UK system planned to be around 80Gw constant by 2050, a total of around 700Twh of supply, up from 320Twh at present because of EVs, heat pumps everywhere, etc.
If the plan is batteries to support wind, then covering just 5 days outage would need $US1.5T for this alone, assuming the cost gets to $300k/Mwh for full installation cost (cheaper than present and excluding any operating costs, maintenance costs and replacement costs after only 12-15 years).
BTW last time I looked Iowa wasn’t a country so not comparable to countries without natural resources of fossil fuels…
I agree about two points you make here
1-nuclear power is expensive to build. No company or cluster of companies in the world can fund the buildout of these stations on their own, without a large degree of government support in the form direct subsidies, tax breaks and loan guarantees, below market financing, insurance coverage, fuel chain support, waste handling.
2-‘both scenarios are disastrous’. Sure, since the human experiment is so very far overextended. There are no good options.
However, I assert that to just rely on depleting and imported fossil fuels is a worse disaster in very important ways compared to the alternative approach which involves making fierce efforts to deploy energy efficiency measures, other energy generation sources, along with proactive downsizing.
On that last matter, one way or another the consumption will come into line with the long term sustainable supply in the world and in a country. Better to make a few choices about how to get there rather than just have it happen to you with hands in your pockets and head in the sand.
The UK is certainly a fascinating place to look at. They may be farther along in their transition from fossil fuels than anywhere else, given their previous history of coal and oil production. They have all but eliminated coal use and their oil production is falling off a cliff. Still a fair amount of oil imports but less than a decade ago.
https://www.msn.com/en-us/news/world/venezuela-military-drills-start-as-uk-warship-sent/ar-AA1masXR
UK sent a warship to Guyana ( hottest oil prospect in South America ).
Didn’t realise the UK had interest in Guyana.
The UK is definitely an interesting case, their electricity consumption is one of the lowest in the developed world (per capita), lower than China.
In part, this is no doubt because of the ever increasing rate at which people are disconnecting their electricity (and gas) supply because they can no longer afford to pay it…
People sometimes speak of ‘peak demand’ like it is a sunshine and roses scenario where we just didn’t feel like using oil (going on trips, eating meat, buying big cars, etc.) any more, but the reality is more like the above, any peak or decline in demand we are seeing is not because we have switched to better substitutes so we can have everything we want without needing oil, but rather because people can no longer afford to pay for it. Oil is down from its recent highs, but still well over double (inflation adjusted) what it was in the good old days of the 50s and 60s.
The only way you could say that demand is peaking because we have better alternatives available, and not because we are just to poor to pay for it any more, would be if the price of oil went down to low levels (back to where it was in the 50s and 60s) and stayed there for a long time.
Some Guy. True. The hard truth is that most countries including the UK will find themselves unable to afford all the energy that they had become accustomed to over the past century. Even more so if they only rely on depleting and/or imported fossils fuels. Its going to be costly one way or another.
Stephen
When we burnt coal poor people could afford electricity.
Today we have one of the highest electric prices, million stay in cold houses and tens of thousands become so ill they end up in hospital.
We now import lots of oil and over 60% of our gas consumption.
When there is no wind at night 100% of the electricity comes from gas and some nuclear.
Silly me. Of course coal never made anyone sick.
https://en.wikipedia.org/wiki/Great_Smog_of_London
Stephen
An ignorant response from a rich person.
At that time coal was burnt in almost every home in very inefficient fire places. Once coal in homes was stopped there was no more smog
Charles, if you had read the link you would have seen that much of the coal burned was from power plants. Burning coal causes massive health problems regardless if it’s for power or heat. But I’m flattered that you think I’m rich!
We now import lots of oil and over 60% of our gas consumption.
What country do you live in? It’s sure as hell not the USA.
Ron
I was Replying to Stephen regarding his praise of how wonderful the U.K. renewable utopia is.
I notice California has a high electricity price.
Charles- Can’t go back in time.
“The United Kingdom holds 77 million tons (MMst) of proven coal reserves as of 2016, ranking 61st in the world and accounting for about 0% of the world’s total coal reserves of 1,139,471 million tons (MMst).
The United Kingdom has proven reserves equivalent to 1.9 times its annual consumption. This means it has about 2 years of Coal left (at current consumption levels and excluding unproven reserves).”
Maybe can dig under the sea-
““We think there are between three trillion and 23 trillion tonnes of coal buried under the North Sea,” explained Dermot Roddy, former professor of energy at Newcastle University. If we could extract just a few per cent of that coal it would be enough to power the UK for decades or centuries.”
Charles —
When we burnt coal poor people could afford electricity.
On the other hand anyone can buy an electric heated vest with a USB plug online for 20 pounds. staying warm was never cheaper
For the UK I would suggest, again, that you insulate your houses with something different than bricks, and use 2 or even 3 layers of glass in your windows.
And if indeed, which I would like to see numbers on, the UK per capita electricity use is comparatively low, I would suggest to prepare for less NG in the exact same way.
Laplander
To fit double glazing is easy if you have £10,000 plus. To properly insulate solid walls is difficult and expensive. Most people can’t afford to do that.
But I guess when you get Hinkley point C running, all will be well and electricity cheap. /S
Sorry, could not resist, it´s not the common man/womans fault but the bed is made anyway, so some preparations at least would be valuable.
To retrofit masonry buildings you might find this interesting if you live in the UK
https://www.academia.edu/10322361/POTENTIAL_FOR_RESEARCH_ON_HEMP_INSULATION_IN_THE_UK_CONSTRUCTION_SECTOR
Interesting, according to Stephens link there´s 5 million dwellings in the UK with mostly solid brick insulation (p 144)
I knew it was bad but that was even worse than expected. On the other hand, if you solve the moisture/condensation problem with an impearmeable wall, your business oportunity is golden.
U.S. Oil Production Flatlines
– US unconventional crude supply is expected to remain flat in February for the third straight month, declining by a mere 2,000 b/d to 9.68 million b/d as the country’s rig count is still yet to see a rebound.
– The EIA expected bigger month-on-month declines in 2024, but productivity gains in the Permian, Appalachia, and Haynesville have surprised to the upside.
– The Permian Basin remains the only major play to see its production increase, improving marginally to 5.974 million b/d next month, though oil producers are still yet to assess the damage wreaked by the cold snap on US upstream sites.
– North Dakota oil production dropped by as much as 700,000 b/d this week, whilst the US Gulf Coast’s refining capacity took a 15% drop with some 1.5 million b/d going offlin
Frugal
The first and third paragraph come the January DPR report.
Ovi,
Great as always, thanks!!!
May I suggest that you use a fixed color-scheme in the graphs? It will be easier to orient.
The green for the EIA is perfect; then fix one color for all STEO projections and another color for the preliminary data from local authorities, across all the country graphs.
Thanks, again!
Kdimitrov
Thanks
With regard to your request on the colour scheme, I am sorry but I won’t be able to accommodate it.
I create charts with two objectives
– Keep them simple so that the results and trends are obvious. I am trying to make sure that new visitors and lurkers can also understand the charts.
– Use high contrast colours to separate different data/graphs. Green, red and blue are the preferred basic colours.
I will tweak some charts by adding a legend. For instance, the Brazil charts will be updated to show the source of the data. Red for the Brazil Petroleum Association beyond the EIA’s data. Blue for Pre-salt.
North Dakota Oil Output To Be Lower For Another Month: State Regulator
It might be another month before crude oil production in North Dakota returns to normal, the state regulator said on Friday.
Extreme weather has eaten into crude oil production in North Dakota to the tune of hundreds of thousands of barrels so far—with the cold weather creating power outages and shutting down oil refineries. It has essentially cut crude oil production in North Dakota by half, cutting out 650,000 bpd from its typical 1.24 million bpd of oil production.
The North Dakota Pipeline Authority said on Friday that production was now down between 350,000 bpd to 400,000 bpd for oil, and 0.95 BCFD and 1.10 BCFD for gas—leaving about 30% still offline due to the extreme cold weather and operational challenges.
On top of production outages, oil spills and other incidents have been reported in Bakken oilfields, where windchills have fallen in recent days to -70F. But subzero temperatures are not over for oil country just yet, with the cold snap expected for another few days.
The cold temperatures didn’t just knock out oil and production in North Dakota. Frozen gas wells resulted in the lowest level of production in 11 months over this last weekend, Reuters estimates predicted. And while the cold weather is tightening oil and gas supplies, it is also creating an increase in demand as consumers try to stay warm.
The cold snap in the United States has collided with other supply-tightening factors, such as tensions in the Red Sea that have caused oil tankers to take the long way around.
The tightening supply and temporary oil and gas production curtailments will come as welcome relief for OPEC, which looks to be struggling to live up to its oil production cut promises for January.
By Julianne Geiger for Oilprice.com/i
Oil resources
Some people do not know the difference between reserves and resource.
What would Canadian oil reserves be at a consistent $120 barrel, which is cheap.
https://natural-resources.canada.ca/our-natural-resources/energy-sources-distribution/fossil-fuels/crude-oil/oil-resources/18085
Venezuela could easily produce 8 million barrels per day if the country did not have a totally corrupt government. Venezuela oil reserves are vast and its resources even greater.
https://pubs.usgs.gov/publication/fs20093028
Peak Oil in its proper sense is about unrestricted oil production in a region with a certain amount of resources. Such as the United States. The United States is a rare exception in the world. Most countries have undergone years of wars and sanctions where oil production has been stopped.
OPEC is another case where production and drilling has been curtailed for political and price reasons.
Today Peak Oil and s a guess as to what may happen to oil prices which no one knows. It’s a guess as to what may happen in every oil producing country. Peak oil could be 2018, (annual production) but this is looking unlikely. US, Canadian, Venezuela, Guyana and OPEC spare capacity will push world to new highs.
Charles,
If demand for crude grows, you may be correct, but for the past 4 years demand for crude oil has been relatively flat, if it grows as it did from 1983 to 2019 then oil prices may rise and supply may grow to levels that are higher than 2018, I expect by 2025 or 2026 we will see this effect if oil prices rise, otherwise we may see a plateau of roughly 82 Mb/d, if oil prices remain below $80/bo for Brent crude. I agree future oil prices, demand and supply are difficult to predict, we just do not know.
“Peak oil could be 2018, (annual production) but this is looking unlikely”
So far it’s still 2018, 1P reserves are only about 250 Gb, world currently consumes almost 30 Gb annually.
1P reserves run out in ~8 years, we will need to see 1P reserves increase by 15% each year just to keep them around 200 Gb…so far there’s nothing suggesting that is going to happen.
A future peak exceeding that of 2018 seems very unlikely, so I completely disagree with your willy nilly assessment…
More likely, we will see very large production cuts from a number of key producers (Russia, Saudi Arabia, US, etc).
Dennis Coyne,
Firstly EU car sales and gasoline
You are conflating periods in which there were major changes in the vehicle fleet composition and then trying to derive a decline curve and trend
There are lies, damned lies and statistics- Disraeli.
There are two distinct periods in the EU- and I mean all of the European OECD countries. In the period 2002 and 2016 the high-speed diesel for light vehicle improved in leaps and bounds and substantially affected gasoline car sales.
In 2012 diesel cars outsold gasoline cars by 54 to 42% of EU car sales. Emission limits on NOx and PM2.5 started to reverse this trend such that diesel cars sales declined to 13.6% of new car sales and gasoline (CV and HEV) climbed to 61.1%. In that period EU BEV.’s sales climbed to 14.6% of new car sales in 2023 (1.533 million units). Total BEV’ are still <5 million in 300 million on the road vehicles .The uptick in gasoline demand from 2015 is because gasoline car sales are growing and light vehicle diesel sales are declining. When we see the gasoline sales for 24 they are likely to show a small increase. I do not buy into you argument that gasoline demand has peaked and is falling.
Thus your EU gasoline graph needs qualification because without it is meaningless.
Second point
I have worked in the oil business for a long time. One thing I learned was the errors in gauging. You believe in the figures presented by the EIA, IEA, and consultants. I don't. There is no way that you can trust a lot of the data from countries that do not have the same standards as the west. Even some of west's statistics need a little care as you have found out with LTO. The data might not be in sync, and there might be deliberate misinformation. Don't believe everything you read. Be sceptical.No-one knows the ture extent of the Dark Tanker fleet.
I have said and will repeat my view on so -called spare capacity. No-one really knows and 5 mb/d would be about 6% of the global production (C+C). I very much doubt that figure. It might be the surge capacity which might be possible for a short-term fix.
As for new oil finds just remember that company X might have found a "new reserve but it will take time to develop. 5 years or more. LTO took time and there was an already established gathering system. The price pinch in 2009 was only solved when the Saudi's finally commissioned the AFK field gas plant. They we not prepared to produce the field until the gas plant was operational.
As Charles has noted some readers conflate reserves with resources. The US has a mighty large LTO resource. The reserves are much , much less and due to the nature of the methods of exploitation the recovery factors are much less than 10% of the OOIP. The Saudis do much better because their resources are better. They have championed pressure maintenance with water injection, and are now going to use carbon dioxide. Whether this will work is open to question and Aramco will wisely proceed with caution and evaluate both effectiveness and the economics of this process over a lengthy time period. It might work, it might not be economic. Only time will tell.
Carnot,
That is the reason I initially included both petrol and gasoil consumption in my initial chart.
Carnot, please, that quote is not by Disraeli. You look like a fool when you repeatedly misattribute it to him.
https://en.m.wikipedia.org/wiki/Lies,_damned_lies,_and_statistics
The phrase was popularized in the United States by Mark Twain (among others), who attributed it to the British prime minister Benjamin Disraeli. However, the phrase is not found in any of Disraeli’s works and the earliest known appearances were years after his death. Several other people have been listed as originators of the quote, and it is often attributed to Twain himself.
Who cares who actually wrote it.
It is the message that matters and accurate data is hard to find. Read the message
Why should I believe any of your other facts if you refuse to fact check? I understand why you are wrong so often now.
17 minute Joe Bloggs YouTube video. Lots of good information on the current state of Russia’s oil industry.
RUSSIA Shuts Down Oil & Gas Terminal & Port After Drone Attack as Ukraine Targets Russian Oil & Gas
Refining Crude Oil
Some people have been expressing opinions on what will happen with falling gasoline demand and the fuel mix balance.
Firstly, in the west the prospect of a significant contraction in gasoline demand is most unlikely in the next 5 years. In the EU the BEV fleet is still less than 5 million out of 300+ million light vehicles. WU BEV sales in 2023 showed growth but gasoline vehicle sales were over 4x that of BEs, and with all the recent negative publicity regarding BEV’s there are a lot of hurdles.
Crude oil comes in many different variants but can be classified as light, medium or heavy and sweet or sour dependent on the sulphur content. Different crudes yield different yields of the primary derivatives ; light distillate- naphtha, middle distillate – jet, diesel and gas oil, heavy distillate – atmospheric residue.
Contrary to what you might read on the internet there is very little direct blending of naphtha into gasoline.
Crude oil generally contains about 2-3% LPG which is recovered with the naphtha. Very roughly the naphtha fraction is about 15-25% and the middle distillates about between 30 and 40%. The atmospheric residue fraction cover material boiling above 365 deg C. The rough boiling point for the fration are as follows:
1. naphtha 35- 180 deg C
2. jet kerosine 180 – 240 deg C
3. diesel/ gas oil 240-365 deg C
4 atmospheric residue 365+ deg C
The atmospheric residue is typically distilled under vacuum tp yield
5. Vacuum gas oil 365-560 deg C
6. Vacuum residue 565+ deg C
Refineries have 4 main process steps:
A. Separation – distillation of streams
B. Upgrading to improve properties- reforming, isomerisation, alkylation
C. Conversion – cracking technologies to convert heavier molecules to more valuable smaller molecules
D. Treating- stabilising and sulphur reduction of finished products
Refineries cannot pick and choose what products they produce. The crude oil stream dictates the yield structure and the product mix. Gasoline is the most energy intensive fuel in the refinery and it is NEVER a single product. It can contain from 4-10 components depending on the refinery configuration and complexity. Most gasoline will contain a mix of streams such as :
1. FCC gasoline RON 91 35-45 %
2 .Reformate RON 96 25-30%
3. Isomerate RON 81 10-20%
4. Alkylate RON 94 10-15%
5. isopentane RON 93 <5%
Streams 3,4 and 5 might not always be available. RON is the Research Octane Number.
Sometimes gasoline might contain light naphtha but this has a very poor octane number of around RON 66 so must have additional high octane components. This could be ethanol or fuel ethers ( not US).
There are 3 main parameters for gasoline.
1. Octane
2. Density
3. Vapour pressure
The name of the game is to get the lowest cost of product with the lowest density – max volume.
The are few more points to mention about gasoline.
The naphtha fraction is typically split into light and heavy naphtha, but can be split into 3 streams. Light naphtha is used as steam cracker feed (petchems) whereas the heavy naphtha is routed to the reformer and/ or isomeriser to make reformate and isomerate for gasoline and aromatic precursors for petchems.
FCC gasoline is made from Vacuum Gas Oil in a fluid catalytic cracker, and FCC gasoline makes up the major component in the gasoline pool. The FCC also makes the precursors to alkylate, so in all about 50% of the gasoline is produced form vacuum gas oil distilled form the atmospheric reside.
If LTO is considered it is typically around 50 API gravity and will contain mainly light and middle distillates with very little atmospheric residue.This means there is little or no feed for the FCC( or hydrocracker).
When a refinery is designed there will be a typical crude specification that is used. Generally a 32-35 API crude is used and by blending lighter crude with heavy crude a suitable crude blend can be produced (not always that simple), such as blending Arab Heavy with Brent. In the case of LTO this is really challenging. The US Gulf coast has refineries that were optimised around heavy crude processing where the atmospheric residue can reach 50-60% of the barrel. In such refineries it is very difficult to produce a blended crude that could be processed. For this reason most of the US LTO is exported, and heavier crude is imported. Where significant LTO be processed in the US refineries there would be a reduction is crude processing capacity, resulting in a reduction in just about every fuel component, because the main crude distillation unit would be naphtha flooded.
We are some years away from refinery armageddon. Gasoline production will remain at a high level for at least another 10 years, assuming there is crude available ‘ and in my opinion we will with all likelihood be in the Peak Oil Production scenario by then. I do not see Peak Demand anytime soon and there will be a continuing requirement for fuels of all types, but especially middle distillates and heavy distillate fuels for marine applications.
We produced a fuel model for light vehicles in the EU which took the existing vehicle fleet and depleted the vehicle parc over 20 years, which is not atypical. By year 20 much of the 20 year vehicles are gone but there are a surprising number that survive The average age of vehicles in the EU is about 12 years and increasing. The vehicle fleet declines in an S shaped curve, not a linear reduction. New cars tend to be driven more, especially diesels, but diesels are now being replaced by hybrids.
My own personal view is tha BEV’s will continue to grow but their limitations will slow down the rate of growth.. At present gasoline cars in the EU are outselling BEV’s by 4:1.
Thanks for that post – it must have taken quite a bit of work to put that together and it is much appreciated. It helps to to understand the conversion paths between input and outputs.
Thanks again,
WP
Excellent comment!
As a side note: I have seen various sources comment about the “surplus” gasoline production that could happen as a result of BEVs reducing the demand for gasoline, while diesel must still be produced to supply the heavy transportation industry. But if that process does begin to happen, gasoline prices will fall. If natural gas prices in the US rise, as they are expected to due to increased exports, combined cycle power plants that now burn natural gas could easily switch over to more inexpensive gasoline with just a nozzle change. So I don’t expect to see a glut of gasoline happen anywhere. If cars don’t use it, electricity producing powerplants will.
The ongoing demand of 8 billion people for energy is going to be enormous. I suspect that the world economy will burn anything that can be burned, including oil, gas coal and wood, and use as much renewable and nuclear power as can possibly be built. Demand for every energy source will always exceed supply, but since much of our current supply is nearing its end of life, a major energy crunch is coming.
Joe Clarkson,
Powering CCGT with naphta (gasoline) would be super funny.
We would have switched from gasoline-powered cars to EVs, powered by electricity from… gasoline!
The way humanity is getting stupider and stupider, I wouldn’t put it beyond us, though!
I have already seen some people using diesel generators to charge their Teslas…
I think humanity as always been stupid, well, perhaps not stupid but very shortsighted. The end of the fossil fuel era has been forecast since at least the time of Edison and certainly since Limits to Growth from 1972. Very little has been done to keep population low and to husband the magic of fossil fuels for dire emergencies only, concentrating on keeping our energy supply from depending on a finite resource.
And yes, it would be ironic to burn naphtha or gasoline to generate electricity for electric cars, but I think the energy efficiency would be a little better. Not much, but a little.
As a casual follower of this blog and the peak oil story broadly, it seems like the same people saying peak oil doom is here and inevitable are the same people who fought tooth-and-nail against any type of energy transition or even energy effiiciency improvements 20 to 60 years ago, basically as long as “hey maybe we should start moving away from fossil fuels a bit” has been an idea. Why should anyone trust those who now say renewables are worthless? Many of you are the same people who insisted we stick with finite, depleting fossil fuels that whole time.
Layman, it has been a long time since I have heard such a line of bullshit at this. Just who has said that renewables are worthless? Who has fought tooth and nail against any type of energy transition? And no one, no one has fought against energy efficiency. Just where in hell did you come up with that one? No one is saying renewables are worthless. You just made that shit up.
We are all rooting for renewables. We are all for energy efficiency. All we are saying is that we doubt the ability of these measures to save the world from a disastrous decline in world oil supply. And we should be allowed to express that opinion without stupid people accusing us of hating renewables and fighting tooth and nail against energy efficiency.
Just what the hell are you trying to prove with such stupid accusations?
Ron..”Who has fought tooth and nail against any type of energy transition? And no one, no one has fought against energy efficiency. Just where in hell did you come up with that one?”
I’ll tell you who- the republican party policy in the US has been a roadblock to all attempts to increase vehicle efficiency progress, and to fund research efforts on all sorts of energy efficiency research and deployment. Its been a huge partisan divide since the the late 70’s. Very unfortunate partisanship, and the destructive effect of vested interest on policy making.
I’m sure you know a lot of this story.
Trump- ‘the noise from windmills causes cancer’
You could write a three volume book documenting all of this in short form.
For example- “Fossil fuel money in politics tilts overwhelmingly toward Republicans. Oil and gas companies give 87% of their donations to Republicans, coal companies 95% of their campaign funds to GOP politicians.” In 2017-2018 for example on lobbying “Fossil fuel interests outspend renewable energy by more than 13 to 1”.
As if spending lobbying money could stop fossil fuel depletion and turn atmospheric science into a fairy tale.
One thing that lobbying money in collaberation with Fox News and AM radio did do was to purchase a political party and the minds of about 1/2 of the voters. Job accomplished. An American tragedy.
I have noticed that some do change their tune when they see some money to be made.
Hickory, I agree with you about the Republican Party. I was thinking about posters on this blog. And perhaps I could be wrong about that. That is, if there are any Republicans on this blog. 😫
republicans… 1920s..pump all can…. taxes…cars… British pound sterling global reserve currency
1970s..ran out of drill more pump more with vertical well technology….go arabia
2020s… arabia pumped empty….no invasion europe…
2020s… china pumped empty, just a vulnerable storage reserve. no navy..
idea? was 2020s..russia pumped empty…no invasion europe
USA..more tech…more oil
Layman
What is the value of a solar installation at 4:00am and a 1000 2MW wind turbines when the wind is blowing at 4 miles hour?
Ervin,
What is the value of an ICEV when oil supply falls and gasoline sells for $15/gallon? What is the value of a Combined cycle natural gas power plant when natural gas output starts to fall and natural gas goes to $30/MCF and electricity produced by those power plants goes to $1/kWh.
Widely dispersed (many different locations) and highly interconnected wind and solar power will require perhaps 10% of average power load backup and maybe much less than that. There is not a lot of power demand at 4 am, and often the wind continues to blow at might, there is also battery backup, hydro, pumped hydro, nuclear, biofuel, waste burning, and synthetic fuel all that could provide backup power.
Dennis, when gasoline goes to$15/gallon, do you really think there will be the ability or money around to import or buy EVs or solar panels or wind turbines or batteries?
They all need replacing and constant new bits for when electronics fail. I’d expect complete failure of grids within a few years of oil supplies dropping drastically. Our world has such interrelated complexity that when one important supply drops it will take the rest of the system with it, as things drop out with the appropriate lag time.
Hideaway,
The smart nations will accomplish the transition before gasoline reaches $15/gallon. The nations that think along the lines of Ervin will go down in flames.
Dennis
Obviously another subject you know little about.
Study of wind and solar in Europe, an area including UK as far as Poland and Norway down to Spain. They found that during the year there were many occasions that wind and solar required 90% backup for up to three days.
Wind and solar produced less than 2% of demand at least once a week for 2 to 3 hours.
https://www.energy-charts.info/charts/power/chart.htm?l=en&c=DE&week=04&year=2023
You have to study wind data, weather systems cover thousands of square miles and often the whole continent has either little wind or too much.
Fact is wind and solar are a good partial solution. Vast amounts of money are needed to build pumped storage, tidal power, nuclear power, wind, solar and batteries.
Most countries are only a tiny way along this path.
Charles,
Yes there is a lot of build out that is needed to replace fossil fuel power. Wind and solar power output have been growing rapidly. The World consumption of Wind and solar power has been growing at about 16% per year on average from 2011 to 2022 and for China the average growth rate is close to 21% per year on average over that period.
See
https://www1.udel.edu/udaily/2013/dec/renewable-energy-121012.html
or for something more recent
https://www.theguardian.com/environment/climate-consensus-97-per-cent/2018/mar/26/study-wind-and-solar-can-power-most-of-the-united-states
and even more recent
https://www.energy.gov/eere/articles/nrel-study-identifies-opportunities-and-challenges-achieving-us-transformational-goal
It’s following a classic S curve Dennis. 16% growth in a 5% saturation is not that hard. It’s a problem when saturation is hire. Growth will abate as more storage is needed which will be an absolute requirement to avoid blackouts. Ironically the most cost effective time to build that storage is now. However on a cost basis Nat Gas CC will win out every time. There is no economic incentive to build storage. The math gets worse as fossil fuels decline in every step of the supply chain. This is already evident in wind and solar projects being canceled because of cost. Wind and Solar are the filet minion of the energy world. Nat Gas is the beans and rice. When people can’t afford beans and rice I’m sure the political class will cry “let them eat steak” or is it cake?
Just doesn’t pencil out and never will.
For the renewable energy mantra you even need 2 reserve systems:
A 24 hour storage, for fluctations and mainly solar night / day cycle.
A lasting backup when both fail – in Germany for example there are up to 2 weeks long periods of cold, calm and often foggy weather. Looks like this then:
https://energy-charts.info/charts/power/chart.htm?l=en&c=DE&week=02&year=2024
This winter was a better one – I have seen ones with 2 weeks of such weather, then a week wind and then 2 weeks calm again.
So you need backup power plants, paid for capacity standby and not production. And energy to power them.
A new player besides nuclear is deep geothermal here. It starts at the moment with building first installations, but the technology is here.
Dennis,
You have been on the Hopium again.
Like many on this blog you do not appear to have any comprehension about the cost of under-utilised assets, and that includes all your wonderful unreliable renewables. No company or government can afford to have idle assets, because idle assets burn money money faster than you can make it. Oil companies do not sit on idle assets because they loose money. That is why there is little spare oil production capacity. Investment is only made to meet demand.
A highly integrated grid is nothing but a dream by stupid politicians and academics who could not run a bath let alone a country. Do you realise the cost of the highly integrated grid, with all the necessary balancing ,required for your plan. Do you know how many HV DC cable producers there are? Better still what is the lead time for HVDC cable? Not only that you seem to forget Ohm’s Law. Entropy always wins. Every time. Putting electricity in and out of a battery is a loss. Same for charging an EV. Less power out than was put in. Where are all these pumped hydro locations waiting to be exploited. Same for hydro. Waste burning- what sort of waste? Biomass?. Municipal waste? Good luck with those. Then you bring up biofuels, – already failed – do you want to starve people because that is the only option so far that has actually sort of worked -at a huge cost to consumers. Then the synthetic fuels myth which so far are nothing but political fairytales
Please show me a viable process because to date the production has been little more than a thimble full. If basic base chemicals cannot be produced using unreliables then what hope is there for synthetic fuels. Just show me one process? One will do.
Where is all this cheap electricity? I will believe it when my power bills are realistic and the unreliable mobsters operate without subsidies. It is never, ever going to happen.
Climate change is not the problem Resource depletion and population growth is- and this will kill us first.
Carnot,
We can use HVAC, in most of the developed World it is already in place. HVDC could be used in places where new lines were needed or to replace older lines, it does not need to be done overnight. No I am well aware of I squared R loses, that is the reason for HV lines, you seem to think you are the only one who has studied physics, not the case.
Municipal waste is often burned and there are biofuels that can be burned as backup, hydro, and nuclear already exist an can be used when backup is needed.
I imagine you realize there are already many idle assets that exist in the energy system, a system with a large share of wind and solar will have some assets that are idle when the wind does not blow and the sun does not shine, just as fossil fuel power plants must be shut down for routine maintenance and cannot operate 100% of the time.
A highly integrated grid already exists in most of the US (except in Texas) and there are ties between parts of Canada and the US. So not a dream, reality.
If more HVDC is needed, this is a business opportunity for someone which is likely to be exploited.
Looking at US data for coal, natural gas and nuclear power capacity for power plants from 2012 to 2022, the capacity utilized was between 46 and 48%.
See
https://www.eia.gov/electricity/data.php
Dennis
Why do you need to pretend you know everything about everything?
For a subject like electrical generation I read what grid electrical engineers say.
They point out that Germany has a peak consumption of 80Gw and have installed 82Gw of solar, 69Gw of wind and 8Gw of biomass. In total over 180% of peak consumption. Power transfer over borders is already widespread. Yet often Germany has to rely on coal and gas for over 90% of it’s electricity.
The United States has over a thousand Gw of capacity, 330Gw is nenewable.
https://www.eia.gov/energyexplained/electricity/electricity-in-the-us-generation-capacity-and-sales.php
Unless the US has some magical qualities you will find the same problems in your country as in Europe. Such as at night there is no sun therefore no solar power. Also large weather systems can dominate the entire continent with periods of little wind. Hand waving about having installed backup when it’s needed does not make an expensive power plant economically viable.
If the United States had 5 times the installed renewables it has there would still be times every week that 80% of its demand would still be met with coal and gas and nuclear. How do you run a plant that is only producing a quarter of the electricity it needs to to make a profit.
Look at what it costs
https://www.statista.com/statistics/263492/electricity-prices-in-selected-countries/
As the UK shut down cheap coal our large manufacturers could not compete with high electricity costs. Every coal plant shut down here saw 20 built in China and 5 in India.
Your point about HVDC is irrelevant it’s about the entire costs of production.
Affordable electricity is vital to jobs, and China and India know this you don’t
Carnot
I think what Dennis is trying to say is we can build out the needed HV DC system using step up brass magnet generators. All we need is a sufficient quantity of brass magnets and the political will to do it. In any event I’m sure it will all work out the geriatrics running for office know what they’re doing. Or is it what no doing or do what knowing. Better refer to the teleprompter at least it knows what’s going on. 🤦♂️
Charles,
I have never claimed to know everything, just offering another point of view. You need to look at all of Europe, do you think the NREL does not have electrical engineers working on their research? These are experts and there are experts that ave different opinions. I cite data on cola, natural gas and nuclear capacity in the US and the output from those sources of electric power capacity the utilization is about 48% of capacity, that is about 52% is idle on average. That is just a fact. The idle capacity is higher when wind, solar and hydro are included as would be expected as solar would likely be about 30% utilization and wind perhaps 40%, the costs are still low with wind and solar in areas with high wind for wind power and high insolation for solar.
As prices for fossil fuel increase, the relative cost of wind and solar compared to fossil fuel power will fall, fossil fuel can be used for backup, the capacity already exists, eventually synthetic fuel, nuclear, and pumped hydro, with perhaps a bit of biofuel and municipal waste burning can replace fossil fuel backup.
Export ban on NG under consideration;
https://www.wsj.com/articles/biden-toys-with-an-lng-export-permitting-ban-752a62f4?st=6no3t6vpqigrqju&reflink=desktopwebshare_permalink
Rgds
WP
Weekend peak,
That is not an export ban, it is a decrease in the speed that we export a depleting resource and would be very wise policy in my view.
Dennis – Obviously you’re correct – i was in between 2 zoom calls when I posted it…. my bad.
rgds
WP
2024 will be new high
https://www.reuters.com/business/energy/iea-raises-2024-oil-demand-growth-forecast-again-2024-01-18/#:~:text=At%20the%20same%20time%2C%20the,%2C%20Brazil%2C%20Guyana%20and%20Canada.
What was the average crude production for 2018? 82.3mb/d
2024 will probably be higher if IEA is correct and certainly if OPEC is correct
Charles,
The annual average C plus C output in 2018 based on EIA data was 83 Mb/d, Stat Rev of World Energy 2023 has it a bit higher at 83.5 Mb/d or so (I don’t remember the exact figure). The IEA does not give crude oil estimates just total liquids. Much od the increase in total liquids since 2018 has been from increased NGL output which tends to follow the trend of natural gas output.
Charles is still confusing gas with oil. When will he ever figure out the difference?
Ron
Natural gas plant liquids is not methane
Charles,
NGL is mostly butane, propane and ethane with a bit of C5 (condensate), about 90% of it is a gas at standard temperature and pressure (25 C, 1 Atm). Also if we include NGL the measure should be mass rather than volume because the energy content matches more closely with mass than volume.
Charles/ Dennis,
You are both correct in a way. The well liquids are stabilised (pressure reduced) above ground in a GOSP ( gas oil separation plant), where by the oil, water and gases are split. The wet gas is sent to a gas plant whereby the sales gas (mainly methane) is separated from the NGL’s (ethane, propane, butanes and C5+). Gas condensate is normally recovered in the gas plant. The NGL’s fraction is generally referred to a Y grade mix and is routed to a NGL fractionation plant which will recover the individual NGL’s
Quite often the condensate is back blended with the produced crude which avoids the need for separate logistics and also gets a crude value.
I do not like the term boe because the density of NGL’s is much less than crude.
Accepted conversions are as follow for mass measures.(Platts)
Crude oil 7.3 b/mt ( equivalent to 33 API)
ethane 17.66 b/mt
propane 12.4 b/mt
isobutane 11.1 b/mt
n-butane 10.8 b/mt
natural gasoline 9.45 b/mt
US condensate 7.86 b/mt (45 API)
naphtha 8.65 b/mt
gasoline 8.45 b/mt
jet 7.86 b/mt
diesel 7.46 b/mt
VGO 6.84 b/mt
Fuel Oil 6.5 b/mt
It is possible to figure out the US C+C from the EIA report
https://www.eia.gov/dnav/pet/pet_crd_api_adc_mbblpd_m.htm
Anything above 50 API can be treated as condensate ( condensate is generally 45+)
Likewise the NGL’s are in this report
https://www.eia.gov/dnav/pet/pet_pnp_gp_dc_nus_mbblpd_m.htm
As you will see the NGL,s are about 6.6 mb/d
That means the US is producing about 18 million barrels per day but 1/3 is NGL’s and 1/3 LTO (which is close to condensate. The important <35 API crude is about 1/3 of the mix. That is why the US is a big crude importer.
Personally I think the use of volume units is most misleading, especially for NGL's, but this is how the oil industry in the west, especially the US functions.
The attached picture illustrates above ground gas and crude processing. The units GPM are the gallons of liquids per 1000 SCUF of gas.
(You will not find this image on the internet or any book as I created it and claim the copyright)
In the gas plant residual moisture is reduced ( glycol drying) and acid gases( amine treating) are removed. This is to avoid corrosion in the pipelines and downstream infrastructure.
This comes from one of my training modules. Unfortunately I can only load one image at a time.
Carnot
I completely agree. No units should be volume based everything should be converted to tons. BOE is an intentional misleading indicator. Hydrocarbons are approximately 21,000btus per pound doesn’t matter their flavor. If you use that measurement we haven’t exceeded 1971 production and if we have it’s not by much.
JT,
I agree mass would be a much better measure or energy units such as Joules.
Dennis, I would be wary of pushing joules or mass as the metric.
For one thing consider “BOE accounting”. I completely agree with those who criticize calling a barrel of natural gas the same thing as a barrel of oil. You can see they are radically different, just based on prices. It’s strange to hear the same people who rightly criticize “BOE” pushing energy normalization, which is exactly what BOE is!
Similarly (but not to the same extent), a barrel of extra heavy (and usually full of sulfur) oil has a lower price than premium oil (e.g. Brent or DSW). Just look at the Mars to LLS price differential. Or WCS-Houston versus WTI-Houston. (Make sure you compare in same geography so that you are only looking at quality differentials, not geographic ones.) This despite the heavy oil barrel being both slightly denser and slightly higher energy content than the light sweet.
Anonymous,
Good points, yes mass or energy or BOE does not solve all problems, just better than using volume as a measure in my view. Obviously there are many different grades of crude, along with many other types of energy products, possibly using exergy or EROEI would be useful, but that is another can of worms. There are no perfect measures in this regard, the world is complex and we try to simplify and thereby introduce errors into the analysis.
Natural gas plant liquids is not methane.
They are still gas. They only can be liquified under enormous pressure. Any gas can be made a liquid if you pressurize them enough, or get them cold enough, including methane.
Ron,
Not exactly correct for natural gas (methane). A cryogenic process is required to drop the temperature to produce LNG otherwise the pressure will be enormous.Most natural gas will also contain ethane- usually about 4-14% by volumes in order to meet the calorific value spec. Excess ethane is recovered for pet chem use.
You were too quick Carnot. It took me about two minutes to correct my mistake and include “or get them cold enough,” But those two minutes were long enough for you to get your point in.
But my original statement was still technically correct.
otherwise the pressure will be enormous.
Enermous pressure is still pressure.
Natural gas can be liquefied at a pressure of 45.8 atm at or below its critical point temperature of −82.1 ºC to form liquefied natural gas (LNG)3 for commercial transport.
Not very important but I´m pretty sure LNG needs -160C, compared it with LH2 that needs -253C for liquid storage in a project I worked on a couple of years ago. Also, the energy loss to cool it takes energy, in Norways Snövit/Melköja LNG plant they use 5 NG fueled jet engines to run the plant, or at least used to.
For Germany and Europe, perhaps a pipeline with cheap NG would be better, but unfortunately someone blew it up, luckily the US can sell more LNG to cover it.
Strictly speaking if the pressure is above the cricondenbar no amount of cooling will produce a liquid (it’s called “dense phase” instead) and if the temperature is above the cricondentherm no pressure, however “enormous”, will cause condensation.
Charles –
World w/o Top 3 is declining by 1.2% annually since 2017. Current level is ~48.7 mb/d (2023 average)
The Top 3 (Russia, Saudi Arabia, and US) is declining by 0.8%. Current level is ~32.9 mb/d (2023 average)
In total, current decline rate is 1%/year since ~2020-2021.
Current world production level is similar to that of 2015-2016 (~81 mb/d).
This would suggest there was a peak around 2019….reviewing Ovi’s graphs it shows a November 2018 peak of 84.58 mb/d. Top 3 had a 2020 peak of nearly 35 mb/d, current level is more than 2 mb/d lower. World without the Top 3 had it’s peak slightly above 52 mb/d in November 2016 (the only time it exceeded 52 mb/d).
Had both these peaks occurred around the same time (call it July 2018), World total production would have been ~87 mb/d. Since they did not, the max production was ~85 mb/d in November 2018.
If what you are saying had the slightest of chance to occur, it would take at least 3-4 years to return to the 2018/2019 levels…but somehow you believe that it could happen this year?
With all of this in mind, a most likely scenario will see world production averaging 80.5 mb/d in 2024.
Then continue dropping by ~1.1 mb/d each year…
Still nothing from Rystad on 2023 discoveries but I came across this from an October report which shows how fast things are falling and that 2023 is very likely to be all time low. I am most surprised at the level of conventional gas finds, I think there were plenty of exploration wells aiming for gas and the demand is still high judging by the LNG plants that have been built.
There isn’t a big backlog of decent projects from old discoveries now, most of the known marginal fields were developed in the 2012/2014 bonkers years, so pretty soon FIDs are going to dwindle away like the discoveries and oil and gas company development teams are going to be cut back and specialised engineering and construction companies are going to be out of work.
Does anyone have statistics or know of a good place to see how older horizontal wells are holding up in the three major shale basins?
I noticed in November, 2023, EOG’s Parshall wells averaged 19.59 BOPD each. This includes TA and SI wells.
Shallow sand,
See https://novilabs.com/shale-oil-and-gas-insights-blog/
Thanks Dennis.
I used to look things up on a subscription site, but since we have quit looking for leases to buy, I haven’t used it for awhile.
I used to look at Enno’s work a lot. Had forgotten they still provide some free updates.
SS: You might look at buying access to the ND state data. I believe the price is very reasonable, although the user interface takes some getting used to. Check out the state’s website for more info. You might also correspond with Bruce Oskol (a blogger, but has experience using the interface).
P.s. It is interesting seeing you still intrigued with buying stripper wells in the Bakken. I would think that would be a really big move, given your current size and geographical experience. Maybe somehow doing something in the Bakken to gain experience might be good first. E.g. investing in one of the Bakken players that has specialized in buying older wells. Or even just buying some WI. Don’t need to put a huge amount of money down (and I would advise against it). The whole point is to just put a little, to start learning…before you make a bigger committment.
The EIA is reporting US L48 production for the week ending January 19 dropped by 1000 kb/d from 12,900 to 11,900.
The number may not be right but the direction is.
Wouldn’t this drop of production be a consequence of extreme cold conditions last week?
If I recall correctly more than half of Baken’s production wasn’t operational last week.
Currie
Yes. Mostly North Dakota and possibly a bit from Texas.
Ron,
Point accepted on LNG. But can you imagine the weight of a large LNG vessel that was carrying pressurised NG at $5 bar. It would sink under the weight and cost a fortune. I am not even sure that one could build a pressurised bulk NG carrier.It would be an interesting challenge to design one but out of my scope.
Of interest is the shipment of NGL’s Small vessels ( <15 kt) are pressurised and large vessels (75 kt) are refrigerated.
Carnot, I had no intention of describing what is practical. I was only describing what is technically possible. And it is technically possible for ethane to be liquified. And ethane can be liquified at a pressure of 45.8 atm. Of course, you could do that in a laboratory, but you sure as hell could put a shipload of that on a ship and take it over the sea.
Any gas can be made a liquid if you pressurize it enough at high enough pressure. That is a true statement. It says nothing about any practical application of such a process.
Ron,
Sorry to be a pedant, but ‘Any gas can be made a liquid if you pressurize it enough at high enough pressure. That is a true statement.’ is not strictly correct.
There are gases, mainly those that approach thermodynamically ‘ideal’ intrinsic properties, that must be cooled before pressure will liquefy them. They have to be at a temperature at or below the liquid-vapour critical point on their phase diagram, above which liquid and vapour cannot co-exist. I.e., they cannot be liquefied by pressure alone.
A few examples: Nitrogen. Critical temp 126K. Oxygen: 154K. Methane: 190K.
Petroleum gases, with carbon chains of 2 or more, have a critical temp above ambient at 293K. So ethane can be liquefied by pressure, with a critical temp of 305K, below 32 degrees C, at 48 bars.
Jonathan
Oil production in Azerbaijan will decrease by 8.8% by 2028
January 23 / 13:07
Baku. The Azerbaijani government forecasts oil production in the country in 2027 at 26 million 899.2 thousand tons. This is 8.8% below the forecast for 2024.
According to government forecasts, in 2024 oil production in Azerbaijan will amount to 29 million 492.3 thousand tons, in 2025 – 28 million 298.3 thousand tons, in 2026 – 27 million 477.4 thousand tons, in 2027 – 26 million 899.2 thousand tons.
As Interfax-Azerbaijan reports, oil and gas condensate production in 2023 in the country amounted to 30 million 189.6 thousand tons, a decline of 7.5% from the 2022 figure.
Above I responded to Charles’ notion that 2024 is going to exceed the previous 2018 peak of ~85 mb/d.
Below is the same chart just added Dennis’ Shock Model data to the graphic.
While I see a continued annual decline of ~1.1 mb/d, the shock models has the same decline just occuring 5-6 years later. Time will tell…
Also, important to note, current 1P reserves of ~250 Gb would run out in 2032/2033 (coincidently, this is about the same time when US 1P reserves would run out ~2031 or so).
It appears humans are just too good at removing oil from the earth…I suspect there will be a long skinny tail, but likely only 1/10th of current production level…and only the countries that can keep it together…
Kengeo,
As I have pointed out before, 1P reserves are not very useful, it is 2P reserves that matter, the 2P reserves are the petroleum engineers best guess with about a 50/50 chance that actual output will be either higher or lower than this estimate. The 1P reserves are an estimate that ha roughly a 90% probability of being below actual future output, in short estimates based on this number have roughly a 90% chance of underestimating future output, you should keep this in mind.
https://en.wikipedia.org/wiki/Proven_reserves
Also note that my most recent shock model assumes peak demand, if that assumption is incorrect (at least a 75% probability that will be the case) then the model will be lower than actual output because oil prices would be higher in a high demand scenario and oil supply will be higher because more of the technically recoverable resource will be profitable to produce.
We disagree on the meaning of the word conservative.
There is still a 10% chance that 1P reserves are above the actual amount available.
While the 2P reserves is a coin flip, equal probability of possibly higher/lower.
Regardless, 1P reserves must grow (not shrink) over time, currently it appears that they are not even growing by 5%. Even with 5% annual growth they run out by 2035. Are we adding 12.5 Gb every year?
Even with 10% annual growth they run out by 2043. Are we adding 25 Gb every year?
With 11% annual growth they run out by 2052. Are we adding 27.5 Gb every year?
For past 10 years, it’s been minimal additions to 1P reserves, prob. no more than 1-2 Gb per year…
Changing gears, these was prob. shared previously, but looks like it’s pretty clear that US unconventional oil is getting ready for a big, long decline:
Kengeo,
The World produces roughly 30 Gb per year, each year proved reserves get replaced as probable reserves move into the proved category, also there tends to be reserve growth over time. The 2P reserve number is the one that Jean Laherrere focuses on with good reason. Always best to use the best guess engineering estimate in my view.
Let’s say we were guessing the price of oil next year and you were betting on it, would you give your best guess (let’s say that was $100/b) or would you give the guess that you believed has a 9 in 10 chance of being too low and a 1 in 10 chance of being too high? Personally I would make my best guess, that’s what the 2P reserve number is.
The tight oil output depends in part on well productivity and in part on the completion rate, what is more important than output per foot is profits per foot. Costs per foot decrease as lateral length increases and output per foot also decreases, if the costs decrease more than the output decreases, then at any given price the profits would rise and completion rate might increase under those circumstances. An increasing price of oil under an assumption of increasing demand for oil might lead to increased tight oil output.
This is a projection for Texas November oil production. It is a bit of a shocker.
The orange and blue graphs are the original finalized Texas RRC raw data for October and November respectively. The brown and green graphs are the production projections for October and November using the last two months of raw data.
As can be seen, the projection for the October raw data, brown graph, is reasonably close to the Texas data posted by the EIA 914 report. The green graph which uses the same methodology shows a drop of 184 kb/d from the production reported last month by the EIA. November is down more than 400 kb/d from October.
I have checked the analysis and don’t see any errors. That leads me to conclude that either there is a data input error by the RRC or they are missing more reports than usual.
For instance the typical drop for the last month in the raw data is roughly 500 kb/d, orange graph. However for November, the last month drop is closer to 800 kb/d. I have also checked Midland and Martin County and they show the same behaviour of an extra large last month drop.
The answer could simply be a data reporting delay. Let’s see how the EIA handles this.
Ovi, respectfully, I don’t understand any of this. Maybe data hounds that follow you all the time do, I apologize. Sorta.
EIA 914 “mandatory” filings by operators are necessary (though as a Texas operator I wouldn’t do it if you held a gun to my head) on estimated production a month a head of time. Its a stupid way of doing things. In N. Dakota who, for instance, would have predicted that it was going to get freezing-ass cold and 600K BOPD would have to be shut in? That made those EIA filings worthless and predictions based on them, meanningless.
If all you guys that rely so heavily on the Energy Inaccuracy Agency, instead of the TRRC (where every BO = a dollar for royalty disbursement), insist on relying on this EIA data for Texas production, and know it ultimately gets sorted out over time, when you know its wrong, why make a big deal of it? Wait.
The EIA, by the way, isn’t going to “deal” with anything that has to do with Texas…it has nothing whatsoever to do with Texas production. Oil extaction per BO is an accounting system in Texas. It is how people get paid and taxes get paid. Texas has the final say, thru the TRRC and the Texas Comptroller, period. The EIA are the FED’s and they are sorta nada. The FED’s can’t tell us, for instance, to cut razor wire on the river. Don’t mess with Texas. We know what we’re doing. If production reporting takes longer than you guys like, go fishing ! Or shovel some snow.
You’ve heard my rants, Permian production is going down. How hard it goes down I don’t know yet, but it ain’t gonna be pretty. You KNOW why its going down. Productivity is going down, rig counts are down, DUC’s are gone, longer laterals are gone, WOR is going up, GOR is going up, econmics suck at less than $4 gas…the 120,000 remaining drillable locations is total dog dookey.
Maybe what you are seeing is actually Texas HZ tight oil production going down.
Gasp.
The funny thing is that financial press and traders (those who make the oil price while tanks are half way full or empty) calculate with a strong Permian production growth this year, fueled by increased efficiency and better individual well performance (they don’t need many rigs, fracking spreads any more).
And their induced lower oil prices don’t help to improve production in Permian…
“EIA 914 “mandatory” filings by operators are necessary (though as a Texas operator I wouldn’t do it if you held a gun to my head) on estimated production a month a head of time.”
Mike, the 914 reporting is supposed to be actual past production. What exact field on the form are you seeing where they ask for next month’s predicted production? See form linked below.
If an operator doesn’t have the accounting done on the past production, he is asked to estimate it. (and update with a revision when he gets the actual info.) But there’s never a 914 question on future production.
https://www.eia.gov/survey/form/eia_914/instructions.pdf
P.s. Perhaps you are thinking of the EIA DPR (which is not based on 914, but on rig/frack patterns). And is a future prediction. But one made at a basin level and by EIA, nothing with operators making future estimates.
You are correct, I am wrong, it is EIA DPR, not 914’s. There are too many different entities with stoopid abreviations all trying to make guesses about the future, then adjustments, and re-adjustments on top of those, about production that, in Texas, ultimately the TRRC and State Comptroller only need to know. It all sorts itself out over time. What happens in the interim is a hobby for many I don’t relish in, and should not pass judegment on, so I won’t. I stand corrected.
Mike,
The current 914 survey covers production for November 2023, it is not an estimate of future production. As an operator wouldn’t you know how much oil you had produced in November by the following January?
In October 2023 the producers that filed a 914 survey produced about 90% of Texas C plus C output ( as estimated by the EIA, 5042 kb/d of 5607 kb/d were produced by companies that file a 914 survey.)
Yes the RRC gets it right after about 12 to 18 months, but the 914 estimate is pretty damn good.
When Ovi says lets see how EIA handles this, he is just wondeing if this output decrease will show up in the EIA data, that all depends on what is reported by the companies that are required to fill out the 914 survey, we will find out on Jan 31.
Mike S
I am just an analyst manipulating old and new RRC data to see how the RRC data for November 2023 will look like a year from now and willing to put it out there for comment.
The EIA and RRC data are reasonably close after one year. I think the EIA uses the RRC data and then apply a procedure to project what the production data should really be. I am just trying to find a way of doing the same thing.
I just use the difference between the November and October data to project the production data.
Further up I did the same thing and it showed that Lea production was increasing.
I will keep doing this for about 6 months to see if the methodology has any merit.
You are closer to the action and get more up to date info than I get. Maybe it is as basic as you say “Maybe what you are seeing is actually Texas HZ tight oil production going down.”
https://peakoilbarrel.com/september-world-oil-production-rebounds/#comment-768887
Your fine, Ovi; I made a mistake as to abbreviations and what is what. Its very confusing and forgive me, seems much to do about nothing. I stand corrected.
As a former Texas operator we would estimate production into stock tanks at the end of the month, closing at midnight the last day of the month. Our reporting to the TRRC did not occur, however, to the end of the following month because we are waiting on run statements from the crude oil purchaser, ususally arriving by the 23rd of April, for March sales, for instance. Sales were estimated by the purchaser at lease pick-up but then adjusted for temperature, heat and BS&W on the final run statements and were different than field estimates. We reported stock tank production to the TRRC, and EXACT sales volumes, adjusted, and oil left on hand in stock tanks had to be accounted for to the TRRC, sort of like balancing a check book. Ulimtately production and sales must jive to the barrel. You can’t make oil just disappear in that check book.
Sometimes operators with large lease storage capacity will hold oil playing the price game, sell in a given month, and THAT can be an explanation for a big surge in “production” in a month. Somebody like EOG in Lea County might have 25,000 BO or more hand they’ll dump when the price is high. Or PXD, for instance, before a sale to Exxon.
So I don’t know what the EIA thing is about, nor do I care. The only insight I have to offer is that unless there is some sort of penalty due the EIA for non-balancing issues, operators, I assure you, are going to take the path of least resistance and lie about it.
TRRC adjustments have more to do with sales balancing and corrected reporting than late reporting. It does not take 12-18 months anymore to sort that out, by the way. That is wrong.
I am likely premature about a big decline in Texas production by a few months, but it’s coming.
Keep up the good work.
Thank you Mike.
More great information that is obvious to you and Shallow sand and others in the business, but most of us have no knowledge of. This seems to line up with EIA making estimates for November production in the 914 report (aka PSM) at the end of January. If I understood your comment correctly.
Ovi,
Yes something seems OFF. For starters, your October model run (brown) is suspect. It takes 10 months for TX RRC to complete its data, but your October model deviates from October reported (orange) quite a bit deep in the past, 2022…
The November model fares much better with past data, but as you say it deviates from EIA PSM quite a bit…
If I eye-ball your October model and translate it down to match the orange line in prior years, then it looks like it gets much closer to the Nov model… But that would not explain the big deviation from EIA…
Strange, indeed…
Kdimitrov,
Historically the EIA PSM has tended to be within 1% of the final number reported by the Texas RRC at least since Jan 2015 to December 2022 (when we use the initial 914 estimate for comparison.) So in my view it makes sense to focus on that number.
Dennis,
Sure, yes. However, there are several things to consider here in the past 6-12 months.
1. According to EIA themselves, the biggest source of error in their 914 report is Mergers and Acquisitions. Well, the past 12 months have seen record level of M&A activity in the Permian. EIA only surveys 385 large operators out of 15,000 as a sample. It is very, very plausible that they have missed some mergers and as a result got higher production on their surveys from acquirers that were due to acquired wells.
Since the small operators are estimated based on the survey results from the large operators, the problem is compounded: small operators are estimated higher, while in reality they should have been completely deleted from the estimates.
2. I have discussed here the reversal in the Adjustment factor in the PSM from positive to negative in recent months. An overestimation of TX production would certainly explain that. Adjustment factor should fluctuate around zero, any consistent bias, discontinuity or inflection would suggest something more than random noise.
3. Historical PSM is adjusted continuously. When you say it is within 1% of RRC do you mean first release of PSM to final RRC? Because by the time RRC becomes complete, PSM would have adjusted some, too.
Right now the 400 kbpd in Ovi’s model is a bit over 7% from the initial PSM release. That is a large delta, I agree. It may go down, but I wouldn’t be surprised at all if it is significantly higher than 1% when all is said and done…
EDIT: I saw now that you meant initial PSM vs complete RRC, I had missed that. So point 3. is moot, but Point 1 and Point 2 stand.
EDIT 2: Sorry, I had also misread Ovi’s numbers. The delta for October is only 184kbpd, which is ~3.3%. That’s plausible IMO. I would bet $5 that Ovi’s Nov model would come closer to final RRC for October than EIA.
Kdmitrov,
The EIA estimate is never perfect, but I imagine there have been periods where the merger and aquisition activity in Texas has been as high as the recent period from Jan 2015 to Dec 2022.
Kdimitrov
Attached is a chart which shows the difference between the EIA’s production estimate for Texas and the October projection. Basically the October projection appears to have an error band of ± 120 kb/d or about 2.2% based on the current production of close to 5,500 kb/d. The November model error gets quite large after July 2023.
While it would be nice to get the numbers right, it is more important to get the trend right. Both the October and November models are showing a plateauing trend after March 2023. The EIA Texas data is hinting at the beginnings of a plateau over the last few months.
Ovi, thanks.
I am perplexed. Maybe I am missing something. Can you share a bit more about your model?
When you input the October-vintage data, I wouldn’t expect there to be wobble so far back in the past in the output projection.
I think there’s data (historical and monthly) that would be interesting to have articles on (or incorporate in the Ovi’s 914 mega reports).
1. API gravity. Standard part of the 914 report. It has changed much less than people think, but has shown some evolution over time. There are also interesting features like the state by state gravities (e.g. Appalachia very light).
2. Natural gas: Probably look at total withdrawals and exclude AK (since 90% is reinjected AND it gyrates a lot month to month). But can also look at gross versus marketed dry, etc. State by state (and even DPR) trends are interesting also. There is both a long story, that has not been well covered here (almost doubling in production since gas crisis of the mid 2000s) along with great and interesting monthly data. There’s even tight gas shale specific info (monthly, but buried inside the weekly reports).
3. NGL evolution over time (almost tripled since the mid 2000s) and monthly variations. I don’t think there is state specific data, but there is PADD info. Also interesting patterns (long term and near term) in which products are produced (propane, ethane, etc.)
Anonymous,
Contact me at [email protected], if you are interested in producing such a report to be published here.
Dennis
“As prices for fossil fuel increase, the relative cost of wind and solar compared to fossil fuel power will fall, fossil fuel can be used for backup, the capacity already exists, eventually synthetic fuel, nuclear, and pumped hydro, with perhaps a bit of biofuel and municipal waste burning can replace fossil fuel backup.”
I don’t agree with your above assumption which is truly an assumption. Solar and Wind are derived from fossil fuels and there is no evidence that without cheap fossil fuel inputs that they can be economically viable.
For example the steel needed for wind towers can not be derived from recycled steel solely. Because it would be too brittle. High strength steel requires carbon which comes from coke, which comes from coal and oil.
Wind also needs high strength lightweight blades that are carbon composites. They can’t be recycled. Where does the carbon come from synthetic fuel? No cheap oil and gas.
Silicon Metal that is required to make solar cells uses coal and charcoal in its manufacturing. There is no evidence that it can be produced in the purity or quantity needed without coal and charcoal. Solar also cannot be recycled.
Another problem with wind is the blades have become so heavy that they must be kept rotating so the main shaft doesn’t warp. So when there is no wind they need grid power to continue turning and without grid power they need diesel generators. So low wind days aren’t just nonproductive they steal power from the grid.
There are other aspects that make renewables impractical like curtailment. We already facing capacity problems because on good sun or wind days they produce too much. Without good storage options the power is wasted which affects their economy. Why is this such a problem? Because it’s a stranded asset. 60% of the time it’s sitting there doing nothing then when it does work you need to throttle its output. Combined with the first inline sales mandate and now you have coal nuclear and gas generators under utilized making them more expensive. Not because of efficiency but because they can’t operate at 90% instead they’re being throttled to 40-50% . Both models right now aren’t economically viable. Either you pay for curtailing generators which should apply to coal nuclear and gas the same as wind and solar in all fairness and maybe to coal nuclear and gas more because they’re not the problem wind and solar are. Or they will all need to be subsidized to remain in business which means tax payers paying the bill. No matter how you slice it energy costs are going up which will represent greater percentages of the economy meaning less for discretionary spending. That’s a shrinking economy which will feedback in less customers higher prices and so on. Just like LTG predicted more capital allocation to the energy sector and less for everything else.
It’s already happening in the UK and other countries and it will happen here to.
JT,
I guess we will continue to disagree, steel can be made without fossil fuel energy input, there are lots of sources of carbon. There are different viewpoints on this. Perhaps you are correct, but I think not.
“How much oil Russia produced in 2023”
In 2023, Russia reduced oil and gas condensate production by within 1%, to about 530 million tons. This happened due to the restrictions of the OPEC+ deal. Coordination of the efforts of oil-producing countries within the framework of the deal contributed to the stabilization of the supply and demand ratio and the formation of a fair price for oil on the world market. In general, the past year has shown a high degree of stress resistance of the Russian energy complex.
According to operational data, in 2023 there was a slight decrease – less than 1% – in oil and gas condensate production (about 530 million tons), which is due to our country’s participation in the OPEC+ agreement. The domestic fuel and energy complex adequately coped with the challenges and continued to reliably ensure the country’s energy security and obligations to foreign partners. In 2023, a total of 43 hydrocarbon fields were discovered. The Volga Federal District became the leader – 34 oil and one gas condensate fields. Also, new resources were discovered in the Republic of Sakha (Yakutia), Khanty-Mansi Autonomous Okrug, Irkutsk and Tomsk regions and in the Caspian Sea. The total reserves for them amounted to 43.56 million tons of oil, 145.5 billion cubic meters. m of gas, 24.5 million tons of condensate. Three wells at the Sauzbashevskoye field in Bashkortostan have been put into commercial operation. For the first time in 30 years, new hydrocarbon deposits have been discovered on the territory of the Chechen Republic.
In turn, Russia increased oil refining by 1.1% in 2023. Gasoline production increased by almost 2.8% compared to 2022 (to 43.8 million tons), diesel fuel – by 3.4% (to 88 million tons).
To stimulate the oil refining sector in the country, the modernization of refineries continues. By 2028, through the mechanism of investment agreements, 50 technological installations for fuel production will be launched. As a result of the implementation of the agreements, the production of motor gasoline and diesel fuel of environmental class 5 will increase by almost 4 million tons per year and 30 million tons per year, respectively. Since 2022, five investment agreements have been concluded with producers of petrochemical products on the creation of new and modernization of existing facilities. The commissioning of new facilities under these agreements from 2022 to 2027 will make it possible to additionally invest about 800 billion rubles in the petrochemical industry. The production of large-scale polymers by 2025 will increase to 9.9 million tons from 7 million tons in 2023. In addition, the share of hydrocarbons as feedstock for petrochemicals should increase from 26.2% in 2023 to 35.2% by 2025 .
Alex
Irrelevant for many Russians who not not see a penny of their country’s wealth.
https://www.businessinsider.com/russia-economy-real-situation-economist-ukraine-war-sanctions-growth-inflation-2023-11?r=US&IR=T
Thank you Charles. Of course, like any normal person, I do not approve of the unfair distribution of income. But I believe that the information about the situation in the Russian Federation from the media does not correspond to reality. The standard of living, comfort and quality in Russia are constantly improving, despite the fact that the inflation figures published most likely correspond to reality. Along with inflation, pensions and wages are growing, and most likely wage growth is far ahead of inflation. The quality of life and level of consumption in the Russian Federation has never in history reached the current level. Medical care in Russia is free, with the exception of dental prosthetics and private medical clinics. There are no queues at medical institutions, in a city of a million (I live in Volgograd) there are more than a hundred clinics and hospitals, all of them are well equipped, including tomographs. The city has developed public transport. My pension and social benefits are about 150 dollars for an apartment (72 square meters almost in the center city, I live alone in an apartment), Internet, mobile communications and electricity, I pay 70 dollars with the rest of the money, I can eat well by buying fresh farm meat at the market and food in the store. The support of V. Putin’s government is high and, in my opinion, justified for the following reasons:
1. With his coming to power, the redistribution of property and related crimes ceased. With the advent of capitalism, the redistribution and related murders of entrepreneurs and officials began. I believe that all oil business leaders in those days had blood on their hands up to their elbows. In general, the crime rate was There are very few of us today.
2. Since the beginning of 2000, Putin has forced business owners to pay real, fair taxes, they have grown exponentially.
3. In the Russian Federation, until 2010, there was such a democratic practice: a candidate for governor spent from 5 to 50 million dollars on elections, then after winning, he returned the money spent from the budget in a criminal way. Putin stopped this practice, on his recommendation, candidates began to win (in a fair way) who did not They spent money on elections and did not steal. As a result, the money went to roads, infrastructure and the landscape began to improve significantly.
The employment situation has improved significantly, the number of jobs offered has increased. Many migrants from the south work in Russia. Usually, it’s not a problem to find vacancies with a salary from 250 to 1000 dollars. The salary in the war in Ukraine is 2000 dollars. Rent an apartment from 60 to 1000 dollars, depending on the quality.
“How much gas was produced in Russia in 2023”
Russia in 2023 reduced gas production by 5.5%, to 636.7 billion cubic meters. m. By the way, for example, the Novatek company in 2023 increased natural gas production by 0.3%, to 82.39 billion cubic meters. m compared to the figure for 2022. At the same time, Russian pipeline gas exports reached 91.4 billion cubic meters. m, and LNG exports amounted to about 43.6 billion cubic meters. m.
So, the level of gas production at the end of the year amounted to 636.7 billion cubic meters. m, this is 5.5% lower than last year, while gas production at offshore fields at the end of 2023 increased by 10.9% (to 34.5 billion cubic meters). Pipeline gas exports at the end of 2023 amounted to 91.4 billion cubic meters. m, and liquefied exports are about 43.6 billion cubic meters. m.
Last year, the commissioning of new gas fields and infrastructure facilities continued. Thus, the first billion cubic meters of gas were produced from the Jurassic deposits of the South Tambey gas condensate field on the Yamal Peninsula, which is the base for the Yamal LNG plant. As part of the development of the Sakhalin gas production center, comprehensive testing of the two final production wells of the Kirinskoye field was successfully completed in 2023.
.
Previously, from the forecast of socio-economic development of Russia for 2024 and for the planning period of 2025 and 2026 by the Ministry of Economic Development, it followed that gas production in Russia in 2023 will decrease by 5%, to 642 billion cubic meters. m. At the same time, according to the baseline forecast, gas production in 2024 will increase to 666.7 billion cubic meters. m, in 2025 – up to 695.4 billion cubic meters. m, in 2026 – up to 707.5 billion cubic meters. m.
Ok – so peak oil is officially in the rear view mirror. This site can be shut down and we can all go watch cat videos instead.
https://www.esa.int/Science_Exploration/Space_Science/Cassini-Huygens/Titan_s_surface_organics_surpass_oil_reserves_on_Earth
Rgds
WP
New posts are up
https://peakoilbarrel.com/opec-update-january-2024/
and
https://peakoilbarrel.com/open-thread-non-petroleum-jan-25-2024/