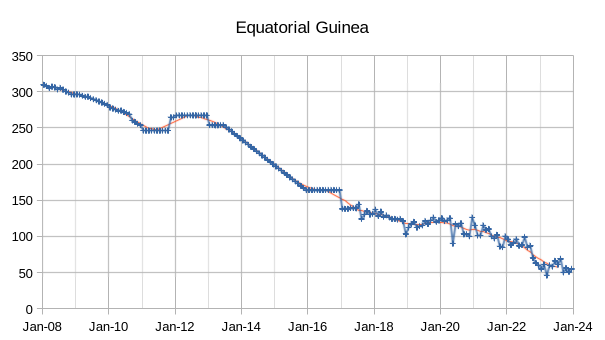
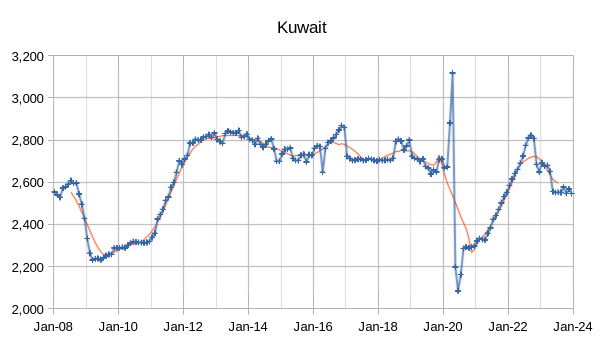
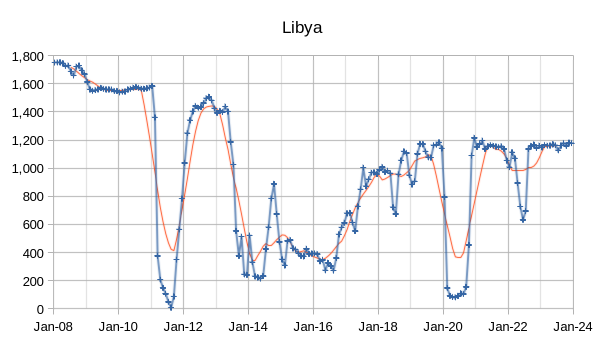
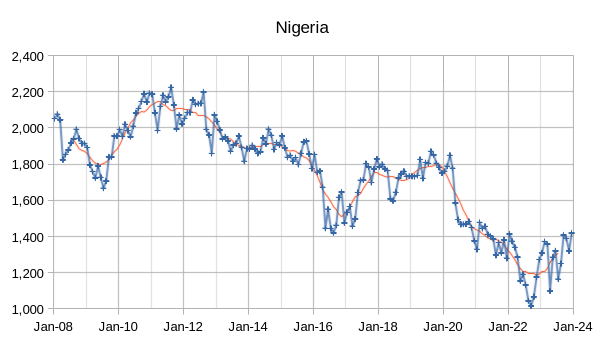
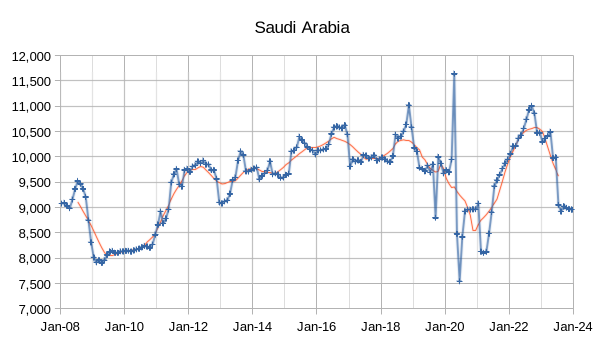
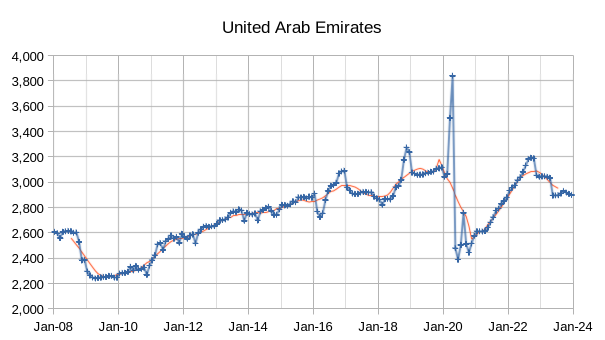
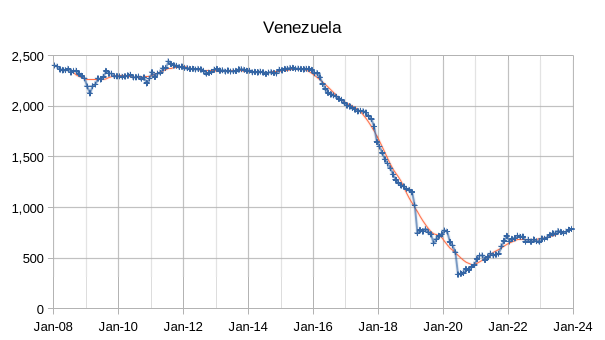
The OPEC Monthly Oil Market Report (MOMR) for January 2024 was published recently. The last month reported in most of the OPEC charts that follow is December 2023 and output reported for OPEC nations is crude oil output in thousands of barrels per day (kb/d). In many of the OPEC charts that follow the blue line with markers is monthly output and the thin red line is the centered twelve month average (CTMA) output. For the first chart I compare OPEC- 13 with OPEC -12 due to Angola deciding to leave OPEC and reducing the number of OPEC nations by one.
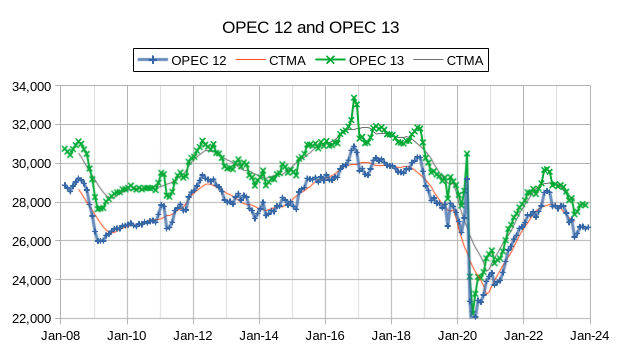
When the World was at its CTMA peak for C+C output in 2018, OPEC-12 crude output was about 29830 kb/d and by December 2023 OPEC-12 crude output had fallen to 3130 kb/d below OPEC-12 output at the World C+C CTMA peak in 2018.
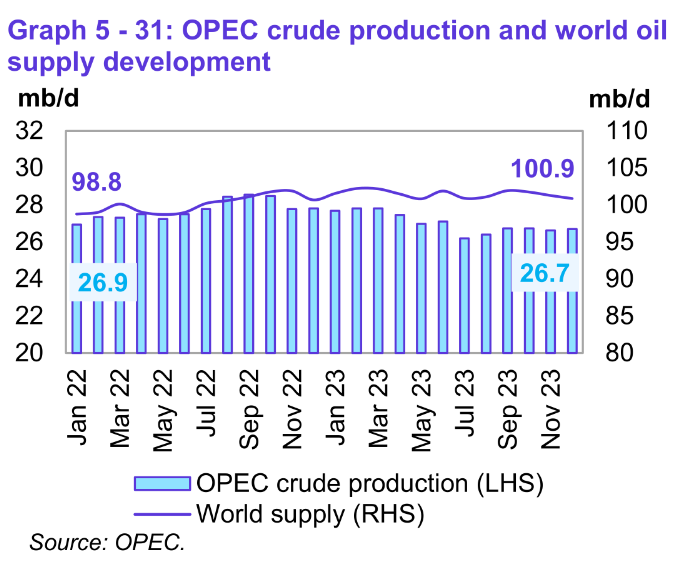
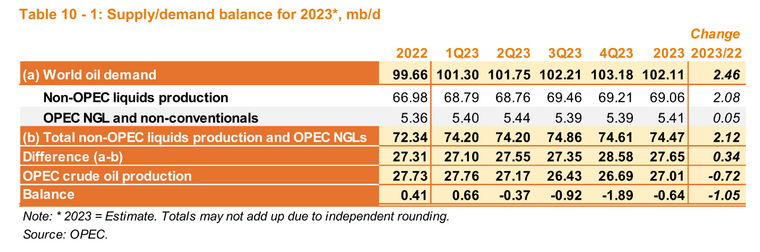
Preliminary data indicates that global liquids production in December 2023 decreased by 0.4 Mb/d to compared with the previous month to average 100.9 Mb/d. October 2023 output was revised 0.6 Mb/d higher than the estimate published in the December 2023 MOMR. Liquids supply was 2.1 Mb/d higher than 23 months earlier and OPEC crude output was 0.2 Mb/d less than 23 months earlier.
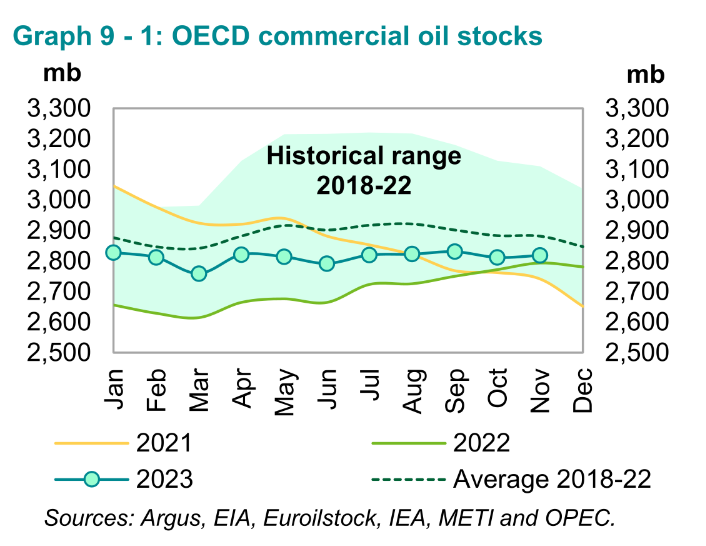
OECD Commercial Oil stocks were 7.3 Mb higher in December than last month. At 2,819 Mb, they were 25 Mb higher than the same time one year ago, but 62 Mb lower than the latest five-year average and 122 Mb below the 2015–2019 average.
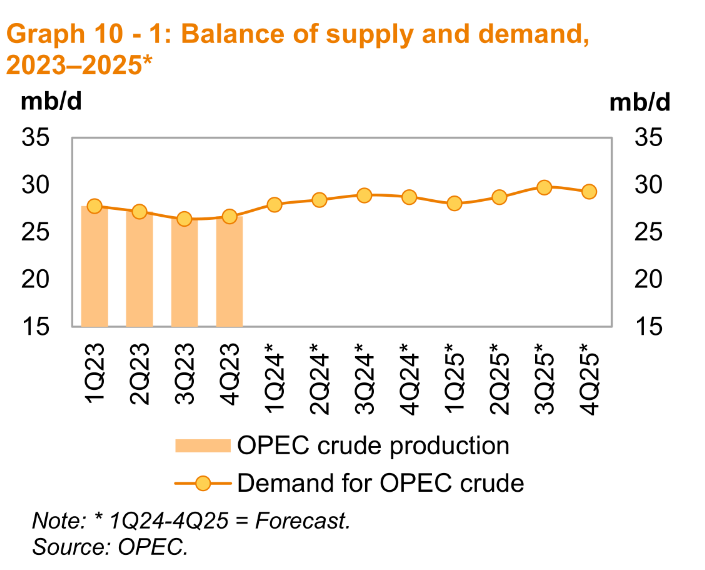
The chart above looks at demand for OPEC-12 Crude which is close to 30 Mb/d for 2025Q3 based on OPEC forecasts of non-OPEC liquids supply and World Liquids demand. The peak centered 12 month average output for OPEC-12 was in April 2017 at 30.06 Mb/d. Note however that the smaller OPEC-8 producers have seen reduced output since 2017.
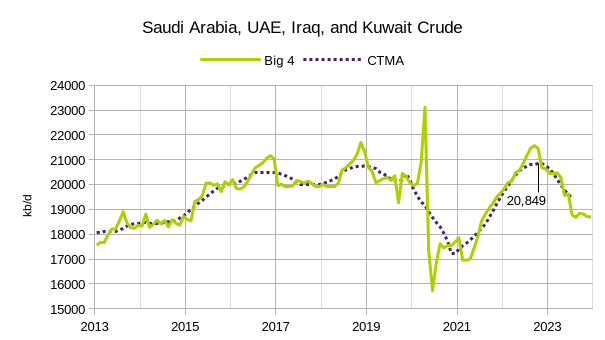
The recent peak for the “Big 4” OPEC producers is 20849 kb/d and the rest of OPEC which is likely producing at maximum output is producing 7563 kb/d for their most recent CTMA output. Adding these together gives an output of 28,411 kb/d for OPEC-12 which may be their maximum sustainable output.
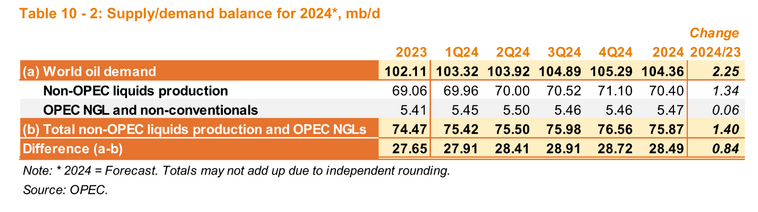
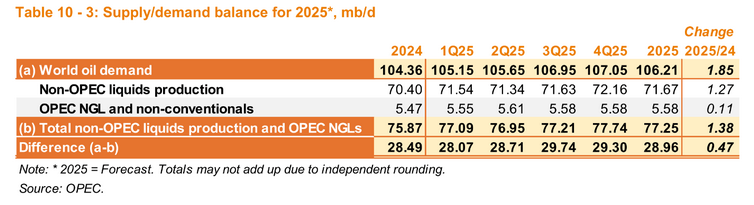
We can see that by 2024 OPEC may not be able to meet the average annual demand for OPEC crude at 28.49 Mb/d. If the OPEC demand forecasts for World liquids are accurate and their Supply forecasts are also accurate, we would expect to see oil prices rise in 2024.
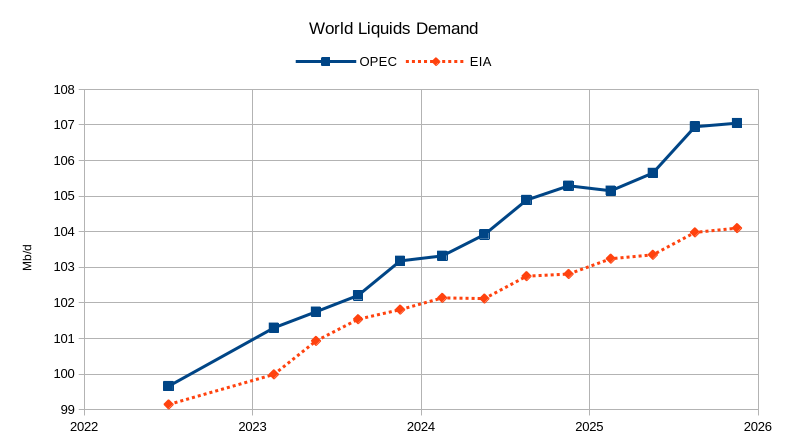
The chart above compares the World liquids demand forecasts from the OPEC MOMR with the EIA’s STEO, there is a widening difference which reaches nearly 3 Mb/d by 2025Q4. My guess is that the EIA forecast will be closer to reality than the OPEC forecast.
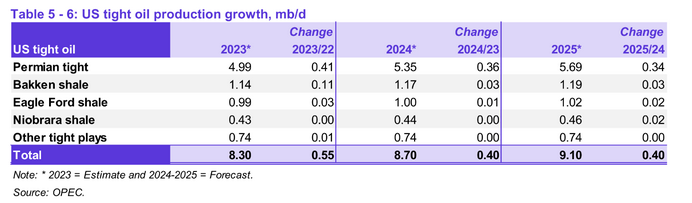
The OPEC forecast for US tight oil output has been revised lower since last month though it may still be optimistic at current oil and natural gas price levels, if prices increase by 10 to 15% this forecast might be reasonable.
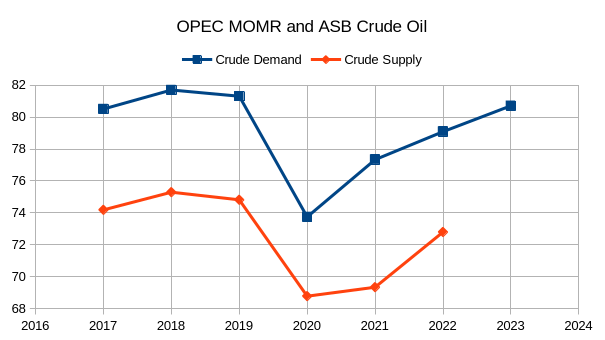
The chart above uses OPEC’s Annual Statistical Bulletin (ASB) for Crude oil supply and the OPEC MOMR Refinery Operations section for refinery crude throughput which is the best measure of crude oil demand. There may be a difference in the way these two reports define crude oil, perhaps the refinery throughput includes some condensate, though the number is lower than the estimate for C+C refinery throughput in the Statistical Review of World Energy 2023. Note that through 2023 crude oil demand remains below the peak in 2018 (80.72 Mb/d vs. 81.7 Mb/d).
245 responses to “OPEC Update, January 2024”
An interesting recent EIA analysis of API gravity trends.
https://www.eia.gov/todayinenergy/detail.php?id=61283
While we hear a lot of people complaining about lighter fluid and cat piss and wanting to talk down US production, it’s actually grown more, recently from oil in the 30s than from oil in the 40s. And oil in the 50s has actually declined! How many people realized that?
Yes, and a closely related questions is: “How many people realize that a big fraction of 2023 US oil production growth came from GOM and conventional, not from shale?”
The TX data is surprising to me. Is that WTS revival from the Central Basin? Pricing is the great resuscitator of “dead” oil fields.
Production growth outside of the shale basins has also been boosted by the following emerging and expanding plays that are not as widely discussed:
-Meramec/Woodford: Marathon and Continental are making nice 500-1,000 BOPD completions in Ward and Winkler Counties from the eastern flank of the Delaware moving east up onto the CBP. Same general age as Oklahoma Woodford, just a thicker zone.
-Barnett Shale: Continental, Pioneer and others are making nice completions in the Barnett, approaching 1,000 BOPD now. This play is running north/south on the CBP through Ector, Crane and Andrews Counties mostly. Some success in the Mississippian Lime here too.
-Eastern Shelf Plays: Various private operators making 500-1,000 BOPD horizontal completions in traditionally conventional zones like the Strawn and Canyon sands.
-Way up in NE Borden County, Browning Oil tested 1,378 BOPD in an apparent Wolfcamp completion that has made 325,000 BO since 10/22 and still making ~500 BOPD as of 11/23… plus lots of water! Offsets ongoing, but limited area currently.
Point of the above is, that shale completion technology has been and continues to bleed into conventional areas outside the traditional Midland and Delaware Basins with some outstanding results. Time will tell how widespread these plays develop.
A similar pattern is developing across the Anadarko Basin in Oklahoma…. watch for OK to possibly reverse its statewide decline soon with continued success in the Cherokee, Red Fork, Tonkawa, etc…
GUNGAGALONGA,
Interesting. Thanks!
there are also many laterals drilled and completed with fracing similar to the shale zones in the conventional oil belt, tapping so called Residual Oil Zone (ROZ), in the San Andres and YESO formations, i.e. the northern Permian, Eddy & LEA and Andrews and Gaines counties, north of the Guadalupe mountain belt.
But majority of the conventional oil in Permian is the WTI grade, which should be more or less 40degrees. It is possible that most the 30-40 degree API oil in the past years in TX are actually close to 40 degrees.
The OK wells are notoriously gassy (and presumably light) and so are the Permian Barnett. I don’t know much about the other areas you mention, but perhaps county level data (from paid providers or RRC) might help explain if this is some Central Basin thing. It’s also strange the ND trend. Wonder if it is something with well age? Or with recovery methods (as SS mentioned).
Gungagalonga,
Don’t overlook the Buckeye State’s 25 per cent yoy increase in oil production … soon to surpass 100,000 bpd.
Encino, Ascent, and EOG have started to develop the Northern Utica in Ohio and have brought in spectacular wells on just a few pads.
These results in low pressure, relatively shallow rock hold promise that smaller operators in nationwide fringe shale areas might join the party and produce economically viable results from their smaller – albeit highly motivated – operations.
Ohio takes you in the direction of higher API gravity, not lower.
It is over 95% 50+ API oil. 85 M bopd at 50+, 1 M bopd in the 40s, 2 M bopd in the 30s, and 0 under 30. And only the 50+ has been growing.
https://www.eia.gov/petroleum/production/pdf/table5.pdf
Uinta, on the other hand in Utah is very heavy and it has been growing, too…
Uinta is the lacustrine, different from rest mainstream US marine deposit.
Not sure if it is the same hypersaline lacustrine as Vaca Muerta though.
Kdim, Utah is mostly growing in the 40s, not the 30s.
Month LT30 30s 40s MT50 Total
Oct21 3 65 39 2 109
Oct22 4 70 62 4 140
Oct23 3 75 91 3 172
last 12 -1 5 29 -1 32
last 24 0 10 52 1 63
GOM is not included in Texas or Lower 48 production?
Federal GOM IS included in lower 48. It’s up some. It’s not part of Texas. There is some close to shore (non Federal) TX offshore production but it is very minor.
Really, I was surprised to see the analysis. Didn’t know what had happened. But it just goes to show that the “crude quality matters” complainers hadn’t been looking either.
Not sure what is going on in TX. I do think probably a lot of it is just that Midland Permian is heavier than the cat piss complainers think. It’s always had a reasonable fraction below 40 (and not just WTI Sour, but even sweet barrels).
ANONYMOUS
Yes, Midland is not as light as other TX shales, like Eagle Ford. That’s a factor for sure, as Midland volumes grow relative to others….
No, oil from the GOM is not reported as Texas production. Much of the GOM is off Louisana and there are a few wells in the GOM off Louisana, Mississippi, and even Alabama. The GOM oil is not reported as part of the lower 48.
In fact, the huge majority of GOM wells are off the Louisana coast, not Texas. Just look at the map in the link below and see what I mean.
Oil and Gas Structures in the Gulf of Mexico
Sheng Wu,
The chart in that EIA analysis ids labelled other L48 States. The Federal GOM is not part of any state, it is beyond the state limits for their shoreline and is US waters controlled by the Federal Government. Usually if someone just says the L48, it includes GOM output, unless the analysis specifically excludes GOM, in this case by saying L48 States, the exclusion of the GOM is implied (or that’s the way I read it).
I have been reading about the carbon capture technology of the majors and large independent companies in the Permian Basin. OXY has been the largest for years. XOM bought Denbury, which was pure play CO2 company. CVX also has been big into this.
I also recall a lot of discussion about horizontal drilling in the older zones to recover stranded or residual oil.
Is there a way to know how much oil is being produced in the Permian Basin broken down by water flood, CO2 flood or other secondary/tertiary methods?
I noticed this too early this week and posted in another early post.
I gave an ominous explanation:
the overdrilling caused severe PVT phase separation of heavier oil and wetter gas, and cause the original Permian shale/tight oil which majority at the border of 41~43 degrees to separate into 38~40 degrees and more NGL.
Sheng:
Could be. I was sort of wondering along the same directions. E.g. why is the Bakken getting heavier also? I probably wouldn’t have stated it as negatively as you did…but I do wonder if it’s basically an effect of wells getting older. Do strippers put out heavier oil than they did earlier? Does the rod pump (which is positive displacement) pull up heavier barrels than come based on pressure drive? Do flaring restrictions affect API of oil delivered (back pressure)?
I read about petroluem production Engineering from McCain’s old classic papers.
according to the figure attached, for black oil the API will go down as it ages.
For lots of volatile oil, API>45, this probably the reverse way.
I noticed only half a year ago that there is a huge difference between US shale oil or even conventional oil and other shale oil or conventional oil in Argentina and China.
The above 5-fluids are mainly from US fields compiled by McCain.
But, the Black oil is probably US Black shale oil, actually closer to 40+ degrees API, with GOR already at least over 500scf/bbl. This make it really easy to have steep rise in GOR as production lower the reservoir pressure.
For other Black shale oils, such as the Argentina’s Vaca Muerta, the API could be well below 35deg, and even well below 30deg and GOR well under 500scf/bbl or even 200scf/bbl. This makes the GOR really hard to go up as production lower the reservoir pressure and might explain such low GOR black shale oil could outproduce US light tight oil.
you could watch the video here:
https://youtu.be/2wwoUOT4rGE
This difference in GOR and API actually bears birthmark in oil generation and go all the way to the petroluem engineers. In China, few petro engineers ever mention the word “GOR”, and reservoir engineers took reservoir barrel, i.e. Bo, as close to 1.2 for granted; while in the US Bo is more than 1.5 to over 2.
Sheng Wu,
Interesting hypothesis. I noticed there is strong cyclicity in the TX data the past few years. The Unuder40 volume goes up in summer and down in winter. In the warm weather you do have more NGL flashing out than in the cold weather. C5 have same cyclicity.
So it is plausible that the C5 flash-out into the the gas stream brings the just-over-40 oil down to just-under-40…
KDIMITROV,
your observation is really fancinating too!
One big difference between the shale/tight oil closer to source rock and coventional migrated oil far from source rock is that shale/tight oil has wetness much higher than conventional oil all the way from the reservoir conditions.
So, this seasonal cycles are not evident before but really strong now in the past shale peak decade. This seaonal cycles are particularly obvious in the 30-40deg API Texas oil production in the past 2 years in the above EIA link,
https://www.eia.gov/todayinenergy/detail.php?id=61283
If this is true, then it is really an ominous bubble point death for US shale oil.
May be more than just seasonality, especially in 2023.
Chart below perhaps clearer on changes in % of Texas C plus C that is 30.1 to 40 degrees API, there is definitely some seasonality, but there may be more to the story. I do not have a good explanation (or any explanation in fact).
Also if we look at Texas C plus C from Aug 2020 to Aug 2023 (seasonal peak to peak) the increase was 939 kb/d, for Texas C plus C with API gravity between 30.1 and 40 degrees the increase from Aug 2020 to Aug 2023 was 972 kb/d (more than 100% of the increase in C plus C output was this weight oil).
Mike is running 2 big blogs about this, Dennis,
https://www.oilystuff.com/forumstuff/forum-stuff/its-not-near-as-big-as-you-think
https://www.oilystuff.com/forumstuff/forum-stuff/observations-on-the-eia-s-resent-statement-regarding-changing-texas-oil-density
your percentage normalized plot certainly reveals more about seasonal, and it matches the same NGL plot Kdimitrov gave above. The past seasonal cycle match prove it is phase separation driven, but just annual Temperature cycle dominated; but in 2022-2023, the sharp increase is Pressure driven.
Mike argued that there is no new field or formation contributing for the production, and so there should be no change in API or GOR. There might be heavier part left later in the formation as Mike said, but to promote my isotope service, monitoring isotopes of methane, ethane and propane, could help identify such changes.
Thanks Sheng Wu,
Interesting stuff.
The articles from Mike are interesting, but he is also struggling for an explanation. Doesn’t have a lock and key insight. I think his water/metals concerns are silly (oil has very low specs for this, I have seen it purchased…the amounts would not swing the API). Depletion is a reasonable concern and to give him credit, he labels it most likely.
As I think, I still wonder if it is some subtle aspect of blending or deblending, going on. Even though I don’t see a strong “tell” in the numbers. But it just feels like the sort of thing that could make this much of a rapid shift. More than any other factor. Even depletion would not be that rapid a shift. And we are in a growing production frame (so more young oil than old as a percent of total).
For example if you had a blended barrel at low 41, composed of half (or more sub 40) and half over 40 and just “stopped blending”, you’d lose a half barrel of 40s (-1 0.5) and gain a half barrel of 30s. Of course you can’t just separate the oil if it really comes up at 41. But if it were being blended and you just stopped doing that blending, you could get that. Of course the economics would need to support that. Traditionally 40-45 have been the most desirable barrels, so you actually wanted to blend to that. But if the market prices shifted enough, perhaps your incentives would reverse.
By the way, Anne “who knows her midstream” on that EIA comment thread has some silly comments. Sorry…NGLs are NOT part of C&C. C&C is defined as what comes out the liquid hydrocarbon tap of the 3 phase separator. NGLs, whether gas plant condensate (pentanes plus) or C4s, C3, C2 are all NOT part of C&C…are “products” and are part of the wet gas at the 914 level. Drip gas is also not part of C&C. That’s only the barrels from the 3 phase separator. I have seen this same suspicion of NGLs getting counted as oil from peak oilers in the past, when oil made large growths that they did not expect. And for all that…NGLs would be taking average API lower, not higher (duh).
We have here three explanations from various contributors, that are all plausible. Most likely, it is a combination of the three.
1. Proposed by Sheng Wu: Slight decrease in API from “just over 40” to “just under 40”, that is typical for fields with increasing GOR, flashing out light NGLs and leaving heavier oil behind. The seasonal signature supports that.
2. Proposed by ANONYMOUS: increasing share of slightly heavier Midland oil at the expense of lighter Eagle Ford oil.
3. Proposed by GUNGAGALONGA: Uptick in conventional projects in the State. Maybe some WTS?
I want to throw-in another consideration: commercial factors? Most TX operators will blend back lease condensate into the oil up to specification. Neat condi pricing in TX markets is ~$10/bbl lower than WTI, so even if the oil from the wellhead is heavier they would prefer to dilute to WTI spec to get the better pricing.
The question is: are there factors that work in the opposite direction, where blending and lightening is not desirable? Maybe they are seasonal factors and that explains (part of) the seasonality?
Would anyone know and care to share?
Kdimitrov,
I agree that it might be possible in “commercial factor”, i.e. “blending” to get better pricing.
The flood of Midland WTI close to 40 probably made it more appealing to strip more condensate and NGL from Midland close to 40 crude to get it below 40deg and better pricing?
The seasonal change probably is like commerical gasoline refinery seasonal change.
But, do we see corresponding increase in condensate like we already see in NGL (your US NGL is not exact TX NGL, but close)?
The other new formations scenarios is also possible.
The overlooked formation could be the lower and upper spraberry in Midland where the oil is slightly less mature than the deeper lower Wolfcamp and maybe higher density or lower than 40API oil. From Novi Permian report, you could find that these 2 Spraberris have increase of 400K BOPD from 2021 to now. But this is still lower than the >900K BOPD 30.1-40deg increase as shown in EIA and Dennis pointed out above.
The GOR and maturity in Permian is actually quite complex and not following increasing burial Depth-GOR/Maturity (DGM) model. The whole basin Wolfcamp has inversed DGM, i.e. shallower edge has higher GOR and maturity/API, while deeper center has lower GOR and maturiy/API. This is especially pronounced in Delaware than in Midland.
To make things more complicated and interesting is that in certain parts of Permian, i.e. core in LEA/Loving border, the DGM is reversed in vertical direction, i.e. shallower Bones have higher GOR and API than deeper Wolfcamp, while it is normal in the edge of Delaware. I used isotope instrument and logged this and they are very consistent with production. Isotope log also shows that in deeper Barnett, maturity could be even lower than Wolfcamp in certain part of Permian.
Not quite sure this DGM is reversed vertically in Midland core part or not though, if so then the above assumption that shallower Spraberries have lower API oil does not hold true.
KDIM: I thought about blending as an explanation. It’s well known that both suppliers and pipeline operators will blend in extra sulfur or API (high or low) to keep a pipelined cargo from the Permian in the desirable range. In the past, they’ve actually wanted to blend everything to 40-45 sweet (most desirable). But perhaps the economics have shifted and some cessation of blending is occurring.
Anonymous, you need to get a real name and prove some sort of credibility. You are failing miserably using a fake name. Like so many others on social media you seem…hesitant to stand by something you say with your real name, for some reason. Why is that? If you are some one famous, and actually know what the fuck you are talking about, be proud. Otherwise, you lack conviction.
“Silly,” is an (4th grade) objective claim when you have no credibility; if you followed the links I provided, including the SPE link, water and contaminants are both good reasons for oil gravity changing as it comes out of the ground. Read them before mouthin’ off.
I’ve known Anne for a long time; she spoke last week at the Petroleum Club in Midland. She is well thought of in MY industry. All the brilliant observations you’ve made, she already made; you are just parrotting her. She is on record, clearly, that NGL’s were not included in the EIA defintion of C C. I assumed they might be because I am, still, not sure where the EIA crap about oil density is sourced from, the well head or downstream at the refinery gate.
Quit being an asshole about peak oilers; we’re trying to find some answers here. Lead or get out of way.
As to operators blending different kinds of oil for a better price, you cannot do that in Texas. Once oil leaves a lease it is done, booked, a dollar in the bank. We need to move on from that. Its possible to commingle different crude qualities on the same lease, unit or PSA, not from another leases, or units, to improve the price, but I know of NO one who has that privilege by way of wells producing different gravity oil. That you could not improve the price of oil to the detiment of another mineral owner should be pretty obvious, I guess not. Blending is a gatherer/purchaser, midstream priority. The issue with the EIA seems to be at the well head oil densitiy changes? Or does anybody know for sure?
The high volatile flash off of volatiles in the summer, I get, and explains the apparent seasonal cycles in gravity. Its irrelevant. What we are trying to find an answer to is three years of gravity uptrend, particualarly in 2023. What happened in 2023?
It appears to me to have nothing to do with more production from lower gravity benches in the Permian, but lighter oil getting lighter. Likely from depletion.
The mean Upper Sprayberry/Dean API mean average is 41-42 (USGS). Also, I drilled the damn unprofitable sumbitches. What else?
Sheng is smart, and has creditbility, I respect him. I, on the other hand, am just a dumb ass roughneck. His observations about depositional GOR across both sub-basins are well known, and predictable. What’s the point? All Midland Basin HZ wells are completed in the Spraberry Consolidated Field, which has a vertical correlative interval of nearly 3000 feet. If you want to plot PP’s from each completed well in the Permian Spraberry Consolidated Field, to know exactly where wells are completed, knock yourself out.
Lower gravity oil coming out of Texas means its coming out of the Permian Basin. That is a good range for oil, 30-40 API; why aren’t oil exports from the Permian being reduced by this 700,000 BO (2023) volume of better oil? I am standing by on THAT answer.
A little bit of hypothetical “good news” for the tight oil industy, like lower density oil in Texas, which is exactly what the US needs, is often like feeding goldfish on social media. All of a sudden the cheerleaders are everywhere.
I am not sure this EIA oil density information is so good, actually.
Mike:
1. I just re-read the Anne comment. I was unfair (ie. I was wrong) with the comment about NGLs. She is rightfully saying they are not part of 914 C&C. We are on the same side here! [Also, she is not “silly”.] I’m glad that she responded to disagree with your suspicions. And yes, this is and has been something that peak oilers want to go to when oil production surprises to the upside…I really have seen it before. But the EIA is clear about what their definitions are.
2. However, Anne is wrong about plant condensate (last three sentences of third para). It is an atmospheric liquid (AFTER SEPARATION IN THE GAS PLANT) and sold as a liquid (mostly as naphtha or as diluent). However, that still does NOT mean it is part of the 914 C&C. It is not. It is just an NGL that “actually is a liquid”. I get that you like her. But she’s just wrong about plant condensate (pentanes plus). It is not part of the 914 C&C. It is part of the 914 wet gas stream (it is in the wet gas as it heads to the plant, as are the rest of the NGLs).
3. I looked for your SPE links but can’t find them. Maybe it’s like when I’m at the grocery store and can’t find something that’s on the shelf, but I looked several times.
4. Typical limit on crude BS&W (bottom sediments and water) is 0.5%. You can do the math and see that this would only shift the API by 0.2 degrees at the most, if we went from 0% to 0.5%. In reality, it’s unlikely to have shifted much since the three phase separators are fixed equipment and do a good job of separating fluids. Even if a well starts making more water that doesn’t mean you get more water in the oil stream, it means you get more out of the water tap.
5. Iron content is not going to drive any measurable difference in gravity. Even crude streams much more iron-rich than Permian oil (e.g. tar sands oil), will still be under 500ppm iron (at the high extreme). That’s less than 0.05%. It won’t affect density! The issue with higher iron (the RBN articles) is that some refiners may have a harder time processing it, given how it interacts with their processing catalysts.
6. I appreciate the comment on blending. Yes, this is something that happens in the distribution system. I still might want to check the 914 instructions to see if producers can be doing some of that, just in how they report (on the 914). Remember these are not royalty reports, they are doing, but a 914 form (really a website portal) that they are filling out. And they already amalgamate all the barrels at a state level, not report them at the lease level. Really, I’d sort of expect them to report them unblended, so you might very well be right. Still the thing is a real puzzle, so I’d still leave this as an open possibility.
7. I’m not sure that this is good news. I wasn’t pushing it per se as good news. More as a strange puzzle. Also as something the peak oil amateur analysts hadn’t seen. At a minimum, it’s going the opposite direction of the “too light” complaints. But then, I’ve always seen those complaints as overblown anyways. Look at the pricing on Mars and LLS…the market prefers light sweet to medium sour, anyhow. So, reversing this trend doesn’t seem that critical to me. I just thought it was an interesting puzzle and strange that the “lighter fluid” complainers hadn’t tracked it. I would think for sure if the trend had gone the other way, we’d have heard of it. I have a hard time believing the crude streams have radically changed in TX. Still wonder if this has something to do with blending or accounting or something like that (not a fundamental shift). But, like I said, it’s a puzzle. We’ll have to find out what drove it to understand if it is good or bad. And FWIW, there’s nothing wrong with low 40s light sweet oil!
8. I don’t post on your blog any more because you asked me not to. FWIW, I do enjoy the Red Adair posts and the history, photos, etc. Good stuff. But just because you’re on old salt doesn’t mean you can control what other people post on the rest of the Internet or what name they post under. You’re not the moderator here.
Perhaps as someone suggested this is just a slight shift in the average API from 40.1 to 39.9, which would shift the crude from one bucket to another simply because of the way the lines have been drawn, if that is the case the whole thing is a nothing burger.
Here is a chart for all of L48 onshore % of C plus C with API 35.1-40 and API 40.1-45.
Dennis, it would still be an interesting trend. What made it happen? And so progressively, not a sudden jump. Also, why haven’t we seen it before? I’m not saying it’s some big burger. But it’s definitely some bit of meat.
Oh…and if the opposite were occurring, what would the light complainers be saying? Would they say no big deal if the shoe were on the other foot?
There should be more meat in this trend, i.e. not just slight 1~2deg lower API but synchronized with the natural gasoline.
There is this well-known correlation, i.e. the lower the maturity of shale oil and gas only, the higher the wetness in NGL, and the best way to see this is to use gas isotope and plot the template. Conventional oil and gas does not have this effect, and often the wetness is much lower than what the template gives.
So, if the TX oil composition has been already dominated by Permian in 2020, which has a dominated maturity of Ro~1.0, and there is no more change of maturity, then the wetness should be fixed, unless depletion caused the extra rise of wet NGL. If we measure the plant gas isotope and NGL composition versus oil API, we should be able to model the change with higher confidence.
Last year, during the derailed car in Ohio, I studied the link between NGL in Appalachian and the geochem there, particularly in respect to isotope. In the NEPA-WV, the Marcellus is so prolific at such shallow depth that in many of the places PVT should already happen before depletion kick in, and this could alter the NGL production there significantly, so it is similar to the TX Permian case, which at that time, I already did some calculation of the Permian plant NGL. I wrote an article in Linkedin and link is below with the template etc, probably does not work due to Linkedin isolated community.
https://www.linkedin.com/pulse/east-ohio-pvc-monomer-derailment-wet-shale-gas-production-sheng-wu/?trackingId=N%2BsQQzMaTai1Hfv9u0m9Gw%3D%3D
EROI OF OIL
If this study is correct then oil prices will really start in increase from 2025.
https://jpt.spe.org/plummeting-energy-return-on-investment-of-oil-and-the-impact-on-global-energy-landscape#:~:text=Solar%20and%20biomass%20energy%20have,ranging%20from%2020%20to%2040.
Falling EROI was not that important while total extraction increased, as some of the additional production went to pay the cost of diminishing EROI. It will be a totally different matter when production starts to fall year after year. More drilling rigs, more trucks, more maintenance offshore to service less and less production.
There is no evidence from any of the inventory trackers of 1.89 MMbblpd destocking in 4Q2023. This is a bit out there as a number, and calls into question OPEC’s methodology.
In fact, their own report is inconsistent. The Call on OPEC in Graph 10-1 is different from the one in Table 10-1
Kdmitrov,
Yes there appears to be an error in the graph, or the table, I agree the OPEC demand estimate for 2023Q4 seems high, the EIA STEO forecast for 2023Q4 look more reasonable. Note that we don’t have good visibility for non-OECD stocks, or none that I have found.
Kdimitrov,
I should have said either the demand estimate is high or the supply estimate is low (or some combination) for World liquids in the OPEC MOMR, I agree there does not seem to be evidence that there was a 172 Mb World liquids stock draw in 2023Q4.
Biden-Harris Administration Announces Temporary Pause on Pending Approvals of Liquefied Natural Gas Exports
https://www.whitehouse.gov/briefing-room/statements-releases/2024/01/26/fact-sheet-biden-harris-administration-announces-temporary-pause-on-pending-approvals-of-liquefied-natural-gas-exports/
But what about poor Germany, what will they use for electricity generation then?
LAPLANDER
Probably renewables
https://energy-charts.info/charts/energy_pie/chart.htm
Alim
The annual graph is meaningless, it includes excess production sold at a loss.
An electrical engineer explained that the grid needs to be balanced on a second by second basis. In winter when there is 16 hours of darkness and wind output falls to almost nothing coal and gas are the only thing that stop the grid from collapsing.
https://www.energy-charts.info/charts/power/chart.htm?l=en&c=DE&year=2023
Cheap electricity is the basis of all manufacturing and that is why China is flooding the world with cheap goods.
We are already hitting global temperatures of 1.5c higher than a century ago. China and India are burning 6 billion tonnes of coal between them and this will push climatic change even higher.
Pity we did not all do what France did and produced nearly all it’s power from nuclear.
Charles,
You do realize that prices for electicity change by the minute, I assume. All electricity producers have periods where there is excess supply of electricity which must be sold at a loss, this is not unique to wind and solar, coal, nuclear, and natural gas combined cycle power plants all have long ramp up and ramp down times and periods where the electricity produced is sold at a loss. It is the nature of the business.
Electricity produced by nuclear is expensive that is part of the problem. I agree however that using non-fossil fuel energy as much as and as quickly as is feasible is an excellent idea.
Nuclear alone is probably not the most cost effective approach.
Dennis
As I said you try and make out you know everything about everything.
The price of electricity is per year, it is what we pay over a year either homes or industry.
In France they had amongst the cheapest electricity in the world and it worked for 50 years just fine. It was the green peace nutters who prevented any more builds or research.
I have challenged pro renewable advocates on the other post to construct a wind solar and battery grid for the US.
Haw much wind, how much solar how much battery and costs.
They like you have not got a clue what it would take
Charles,
Perhaps you have no clue either? Present what you think will be needed.
One study that has looked at this is at link below
https://www.sciencedirect.com/science/article/abs/pii/S0960148121016499
also see
https://www.nrel.gov/analysis/100-percent-clean-electricity-by-2035-study.html
A good overview at link below
https://www.usatoday.com/story/news/factcheck/2023/11/07/renewable-energy-power-reliability-explained/70748158007/
Charles. This is a ‘game’ of reality.
In reality, the utilities of the world are working to create and maintain electric grids that are fed by a variety of generation sources depending on whats optimal for their region served, and what can be afforded.
Sure national policies do affect the specific decision making,
but in places like the EU, China, and USA the grids are a mixed system.
Not all or none for any particular source.
Its plain to see that you have a very high level of frustration, and since the UK doesn’t have any simple replacement for the fortunes of the fossil fuel era I understand that.
Got to make due with what you’ve got, and for security of supply purposes I suggest that priority should placed on local resources. But that’s up to the choices of the UK, not mine.
Charles —
The chart is not meaningless. It means the Germans are not burning gas much to generate electricity. They never have and probably never will.
Neither whining about China nor fantasizing about nukes does anything to change that.
Alim
Take a look at the charts
https://www.energy-charts.info/charts/power/chart.htm?l=en&c=DE&week=03&year=2023
Germany burns huge amounts of coal and gas, as I said much of the wind and solar is not needed and is used because it is sold for nothing.
I will continue to point out that China burns 4.5 billion tonnes of coal currently because it is true and because it is having a devastating effect on the climate which will destroy us all. Worth mentioning I think.
Really,
The company I work for had a coal fired power power plant in Germany. they converted it to gas. They made a mistake. 3000 tonnes of coal per day converted to gas.
I see that ND production rebounded much faster than anticipated.
I also see Lynn Helms is retiring.
My opinion is ND has done a good job with its oil and gas statistics. It has the advantage of having much fewer wells and operators than other states, so this has surely helped.
According to Novi North Dakota report, operators have been drilling in the high TOC real shale formations, i.e. lower and upper shale now, and results in the past 2 years are good, this might help Bakken bounce back from decline.
I also see that Grayson Mill has its Bakken assets for sale for $5 billion.
It bought Equinor’s assets in the Bakken for $900 million.
It bought Ovintiv’s assets in the Bakken for $825 million.
I think it might have made some smaller buys also.
Would be a heck of a flip, more than doubling money in less than 3 years.
Who is rumored to be buying? Chevron maybe?
Grayson Mill says it’s been able to keep 120k BOEPD flat by running just 3 rigs. That doesn’t sound bad at all to me.
I’m NOT representing anyone (really). But just out of intellectual curiosity, how much cash could you put into a deal in the Bakken?
And again, I’m not trying to talk you into that…if anything I worry about you losing family/your money. But just so we can understand the scale, how much could you put down?
Interesting
What on earth was Equinor thinking when in a hurry to sell their assets?
I guess it has to do with the expansionist area of the company being revised at the time. Too top heavy decisions most likely (state owned as a majority). It is easier to be on top of your game with top geologists at home. And that in the US state with the most Norwegian descendants (about 30% maybe), and where the name of the field “Bakken” actually is a straightforward Norwegian word.
Dennis, you posted this in the text of the OPEC post:
Preliminary data indicates that global liquids production in December 2023 increased by 0.2 Mb/d to average 101.9 Mb/d compared with the previous month. Liquids supply was 2.1 Mb/d higher than 23 months earlier and OPEC crude output was 0.2 Mb/d less than 23 months earlier.
Dennis, that ain’t what the MOMR said. The below is copied and pasted directly from the OPEC January MOMR. Your chart does have the correct figure of 100.9 mb/d but your copier and paster is really screwed up. You need to get that thing fixed. 🤣
Preliminary data indicates that global liquids production in December decreased by 0.4 mb/d to average 100.9 mb/d compared with the previous month. Non-OPEC liquids production (including OPEC NGLs) is estimated to have decreased by 0.5 mb/d,
m-o-m, in December to average 74.2 mb/d. This is higher by 1.3 mb/d, y-o-y. Preliminary estimated production decreases in December were mainly seen in Russia and the US, which were partially offset by rises in Other Eurasia and Canada. The share of OPEC crude oil in total global production in December, increased by 0.2 pp to stand at 26.5% compared with the previous month. Estimates are based on preliminary data for non-OPEC supply, OPEC NGLs and nonconventional oil, while assessments for OPEC crude production are based on secondary sources.
Thanks Ron,
I was looking at my previous post where the November 2023 World Liquids was estimated at 101.7 Mb/d, OPEC revised the November 2023 estimate to 102.3 Mb/d, I have corrected this in the post and noted the 0.6 Mb/d revision to the November 2023 World liquids estimate from the December 2023 MOMR to the Jan 2024 MOMR.
Your corrected text now reads:
Preliminary data indicates that global liquids production in December 2023 decreased by 0.4 Mb/d to compared with the previous month to average 101.9 Mb/d.
Close, but no cigar. You are still off by 1 million barrels per day. It should read:
Preliminary data indicates that global liquids production in December decreased by 0.4 mb/d to average 100.9 mb/d compared with the previous month.
Ron,
Corrected, I think.
Previous post had Nov 2023 World liquids at 100.7 Mb/d, not 101.7 Mb/d. This has been revised to 101.3 Mb/d (an increase of 0.6 Mb/d for the November 2023 estimate compared with last month’s MOMR estimate) and in December fell by 0.4 Mb/d to 100.9 Mb/d.
https://www.youtube.com/watch?v=LoyqXVvX4n8
Some of you Texas oil men may find this interesting.
This guy says we will find out if there is a civil war in the USA in the next 2 weeks ( seems unlikely to me )
Gov Abbot said he is prepared if Biden mobilises the national
guard against Texas
.That would be great for the Permian Basin!!!!
https://www.oilystuff.com/forumstuff/forum-stuff/enough-is-enough/dl-focus
Mr Shellman’s comment is worth reading for some perspective.
It’s going to prove almost impossible to stop cross border migration. If you are coming from a place which is unliveable because of conflict, climate change or environmental degradation (i.e. you perceive that you have a 100% chance of dying soon) then, if you think there is a 2% chance of surviving if you reach another country, you will take it. There are no examples in history of people voluntarily sitting and waiting to die when they have the slightest chance to move. All richer countries will move to the right in the face of mass migration (and some other current trends). Trump and co. seem likely to attempt an incompetent, quasi-theocratic, fascist regime. A break up of the US (maybe into the nine nations of North America proposed forty years ago) seems not such a distant possibility. A break up of the EU is even more likely, maybe starting with this years’ elections as populist anti-immigration, and hence anti-EU, parties are likely to get a lot of MEPs elected. Anti-immigration is mostly driven by the insula area of your brain (basically a disgust reaction as an evolved protection against disease that might be carried by “them”) and has a lot in common with anti-vax sentiment.
Rig and Frac report for week ending January 26
Rigs continue at the 450 level and Frac start their late January rebound.
– US Hz oil rigs increased by 1 to 451. The rig count has been close to 450 since the beginning of October.
– Permian rigs were up 2 to 294. Texas Permian was up 1 to 203 while NM was up 1 to 91. In New Mexico, Lea county was down 1 to 43 while Eddy added 2 to 48.
– Eagle Ford dropped 1 to 48.
– NG Hz rigs dropped 2 to 107 (not shown)
Frac Spread Count for Week ending January 26
The frac spread count was up 7 to 242 and up 8 from the previous low of 234 on December 29, 2021.
Hey Dennis, a question about the future of 3 oil producers: 2 of them posterchildren of oil depletion until the early 2010s, Norway and Mexico, and finally China.
-Norway: they managed to stop their decline, how long until it resumes or under what conditions will they prolong the flattening out/small increase?
-Mexico: will the recent increase we’re seeing be short-lived? I know Pemex was allowed to go into partnerships with private entities but what explains the small boost fundamentally? I found 2013 articles claiming they were hoping to reach 3.5Mb/d by 2025, which seems highly optimistic – as of mid-2023, production stands at 1.9Mb/d
-China: I see production creeping back up again to its 2015 peak. I read somewhere some Chinese companies were pulling from Africa and investing domestically. How sustainable is that trend according to you?
Skeboo,
I don’t know the answers to any of these questions, there are perhaps others, maybe George Kaplan on Norway and Sheng Wu on China. I imagine we will see all three of these nations decline in the future, perhaps flat for a couple of years but eventual decline, a period of high oil prices might lead to a plateau or at least slower decline rates.
I would say shale oil has a 2nd lifeline in Argentina and China, due to the Low GOR high density Black Shale oil, or LGBSO, from fields like Vaca Muerta and Shengli.
The latest news from Shengli field shale development in China has been quite positive, and along with a much smaller shale field, Subei, all produce similar proficiently as Vaca Muerta in Argentina. Shengli alone has plan to drill and complete 700 laterals before 2025, and realize almost 100kilo BOPD. China already had 80K BOPD of shale oil in 2023.
Thanks Sheng Wu, i’ll definitely keep an eye on Chinese shale business.
Sheng Wu,
Any idea of maximum output potential? 100 kb/d is not a lot of oil.
Skebdo
Attached is what the EIA thinks of these countries production out to December 2025. EIA provided the “All Liquids” production data. EIA C + C production was used to scale the “All liquids” to C + C.
If someone is interested. This is an analysis (by country) of world oil production for the coming years. It is in Spanish, but the graphics are very clear.
https://futurocienciaficcionymatrix.blogspot.com/2024/01/analisis-produccion-mundial-de-petroleo.html
QUARK,
This extracted table in Spanish is quite amazing!
I saw that China Oil:NGL ratio is the highest, i.e. more than 1 orders magnitude higher than average and 2 orders magnitude higher than US.
This huge difference could be a source of statistics, but also a result of origin of hydrocarbons in China, i.e. the NGL is really low that statistics noise is high.
This Oil:NGL ratio is like Gas to Oil Ratio(GOR), related to maturity and hydrocarbon origin.
More often than not, main stream geologists believe the maturity in thicker oil with less gas and NGL like that from China is a result of lower maturity, but in fact it is more a result of hydrocarbon origin. This conclusion is exacerbated by wrong maturity reading in China, which uses misleading Tmax and not isotope, and make mainstream used to believe China can not develop its shale oil due to lower maturity, thicker oil and less gas.
In Argentina geologists used vRo to read maturity and found Tmax underestimated maturity in similar way as in China, but mainstream then used US marine template and believe Vaca Muerta should have GOR at 3:1, but in fact it should use hypersaline lacustrine template, and then GOR is actually 1:2~3.
This is true in Argentina Vaca Muerta and sister basin, as well as Presalt in Brazil (where maturity is way high so there are quite some NGL, but still can not make it as high as US).
you could watch the video here:
https://youtu.be/2wwoUOT4rGE
Thanks Ovi,
Better than I expected.
I think someone asked about Mexico, but the Brazil case may be more interesting.
Norway’s increase has been due to Johan Sverdrup, which is probably unique in being one of the largest fields in a basin but discovered only after the basin was mature and well into decline. The original (much earlier) exploration well missed the oil by only a few metres, presumably because it was on the wrong side of a fault. Other recent developments are much smaller with short plateaus, if any, and rapid decline. Even Johan Sverdrup is designed with higher nameplate capacity than I’d expect for the reserve size so may have a relatively short plateau (see grey line below). New fields in the Arctic are not proving as prospective as hoped for, with more gas than oil and expensive upfront costs (low EROI). For example Whisting is fairly large but is on long term hold, however Johan Carstberg is due soon with, I think, up to 200 kbpd (again this is higher than typical for the reservoir size, maybe Equinor is worried about stranded assets and want to produce everything as quickly as possible). So there may be a small increase still to come but then inevitable, and maybe quite rapid, decline will take over.
Mexico added a lot of small and medium sized offshore fields, partly because it opened up to outside companies (i.e. non Pemex as owners and operators). There are still a couple of decent sized developments (e.g. from Talos) to come but production is well below the stated plans and discoveries haven’t been all that promising. KMZ is entering late life and exponential decline now so, overall, it is likely there won’t be much more of an increase but maybe a short plateau.
China doesn’t provide much info. but most of the increase, I think but not based on much data, is from onshore, with offshore developments mostly gas. However it is keen on the South Chine Sea so maybe there is more oil there (BP looked about 30 years ago and came up with all water).
The high price years in 2011/2014 induced a lot of development activity, which is probably now starting to come off plateau. It hoovered up most of the backlog of prospective reserves and, with the discovery rate falling so quickly in the last ten years, these haven’t been replaced. Overall I don’t see all that many new projects around. People argue that higher oil prices will allow more resources to become reserves but it doesn’t work that simply. With low EROIs the costs go up just as quickly as the prices as energy gets more expensive. The time cost of money is always a huge factor and risk premiums are important. Human resources may also become limiting as development departments and engineering contractors shrink. Shareholders care about next quarter’s dividends not providing for the world’s energy needs.
Thanks George,
Great information.
This paper is much too mathematically complex to be of much practical use but has a familiar perspective:
“Bottom-up Aggregation of Field-Level Oil Production Profiles via a Successive Sampling Discovery Model and a Birth Process: An Application to the Gulf of Mexico and Norway” https://www.researchsquare.com/article/rs-3389048/v1
This part especially:
The paper appears to originally be an Econ thesis and is going through a revision process for acceptance as a research journal article.
Part of the problem is the backdating of field size estimates. The discovery curves that peak oilers use, have the date of the field fixed (fine), when it actually happened. But they don’t list the estimated size of the field, when actually found, but when the curve is made (many decades later). This means estimated size of fields could have grown. E.g. the Bakken was discovered in the early 50s, but it definitely has a larger size now than it did in a c. 2000 peak oil graph. Not only does this distort history (since it wasn’t just the discovery that was important but the innovation in recovery), but it also means that current fields in the graph may not be sized correctly (may grow). In aggregate, reserves grow, so probably current fields also will “grow” and be bigger than the meager appearance on a (conservative, bottoms up) model.
Gulf of Mexico, in particular, is interesting because it definitely did better than was predicted in articles and comments on this web site. Not only did George Kaplan have a more negative view (saying it would head down to 1.5, not up to 2.0), but he even laughed at EIA saying what the heck are they thinking. Well…EIA was right. And Kaplan despite all his impressive knowledge of field names (and detailed charts) was overly pessimistic. It’s not just neener, neener he was wrong…but why doesn’t he figure out WHY he was wrong. Why doesn’t he seriously examine his methods, which probably are biased (in the statistical sense) to being too conservative.
Anonymous, Consider two types of intense sports fans — (1) the ones that bet $$$ on outcomes, and (2) the ones that enjoy tracking statistics thereby putting sports achievements in perspective (see for example baseball). Where do you think we fit in as depletion analysts?
Thanks for you detailed comments, very interersting…
Have to say that Michael Lynch is scared out of his mind over the quality of the work being done here. Otherwise he wouldn’t be writing crap like this piece for Forbes:
https://www.forbes.com/sites/michaellynch/2024/01/26/the-shockingly-bad-methods-used-by-some-peak-oil-advocates/amp/
1. Not one of Lynch’s better articles, but I don’t think he’s “scared” of peak oilers. After all TOD died, ASPO died. Who are the replacements for Campbell and Deffeyes? It’s not like peak oil hype is rising, more the opposite.
Probably what annoys him more is how few peakers grapple with new information. To his credit, Dennis tries to. I still think he’s too much a peaker (not too much an optimist), but he does look new data in the face and adjusts his methods/views as a result. It’s OK to be an amateur analyst (I’m definitely an amateur also, just commenting). But you ought to learn something over the years!
2. Most of Lynch’s article is criticizing HL. And the record for HL is miserable. It’s trivially easy to show how it has failed previously and how you can just apply different dates and see how it changes over time.
3. I think Lynch is also dissing the discovery peak meme. The big problem about how peak oilers look at discoveries is that they ignore reserve growth. Growth in existing fields is allocated BACK to the date of the field discovery. So the recent massive growth in expected recovery from the Permian and Marcellus is not reported as a recent discovery, but shifted back in time. For that matter, even new fields, found recently, may grow in sized in expected recovery in future decades. So that bad results of recent discoveries are not considering the reserve growth that will happen in those new fields.
For that matter just look at the how poorly discovery peak meme has performed recently in the US. How come the discovery peakers failed to predict the massive recent growth in US oil and gas production?
Anonymous,
That is relatively easy to explain. Even the EIA undeestimated output from tight oil. Look back at AEO from 2011, chart below has expected crude output from Southwest Region which includes the Permian Basin. The increase in tight oil output was expected by very few in 2011.
Forecasts of the future are often wrong and Lynch has also often been wrong.
Note that actual output from the southwest region in 2022 was 5.3 Mb/d, about 5 times higher than forecast in AEO 2011.
Dennis,
The issue is the methodologies failing to predict various new technologies or regions of oil exploration, not a specific prediction. I still remember debates in the early 2000s. Peakers are like Twilight in the Everywhere. And I’m all like, no we will find more oil. And they are like, we have the Stuart Staniford MegaProject list. Where exactly are you going to find new oil? And I’m like…I donno…new technologies or regions that I can’t exactly describe. And they’re like…your pathetic. Then…we HAD the growth. And totally spanked the Campbell, Deffeyes, Ace, Staniford worriers. And I said…hey…look you were wrong. And they are like…but that was new technology and regions we didn’t know about. Sigh!
While I think the Hubbert approach (of estimating total resource) is not great, it’s at least intellectually thoughtful. The HL and discovery curve stuff is silly. And Lynch didn’t even go after some of the silliest graphs (remember the “triangle of doom”)?
FWIW, your approach (I think “shock” is too fancy a name for what is essentially a total resource estimate) is very similar to Hubbert’s. To give him credit, he made the point that what mattered was the area under the curve (the total resource estimate), not the exact curve that would be traced as it got produced. However, he (and Laherre and others like them) was wrong and underpredicted total resource. And there is a massive history of this underprediction and too soon peak prediction. A man believes what he wants to…
https://www.youtube.com/watch?v=l3LFML_pxlY
But if you really want to be thoughtful, you should consider a large resource. And include a lot of fields to be discovered and the like in your estimate. The history of oil (and mining) is one of improving detection and recovery methods. So…for instance, I would take the PGC US natural gas estimate very seriously!
https://www.aga.org/research-policy/resource-library/energy-insights-future-natural-gas-supplies-in-the-united-states-are-at-their-highest-reported-level-on-record/
But yes, even the much derided optimists were too pessimistic. Something you are well acquainted with. If we include your failure to account for the Permian, the US and those eeful frackers have outdone your crazy April 1st mensch prediction. 😉
P.s. Don’t let the crowd here bully you into “alternate scenarios”. Your predictions lose all meaning if you just draw random curves. You need to try to have a Bayesian assessment (informal Bayesian, not mathematical) of what will happen. That TRR is actually much more the interesting number. And don’t shade it too low…there’s a long history of being wrong. Danger, Will Robinson. But even if it is negative, it should be your take. Don’t let either side (cornies or peakers) push you to “alternate scenarios” to appease their complaints.
Anonymous,
Impossible to predict future technology and there is no way to define the probability space. Every scenario of the future is just a random guess based on a set of random assumptions.
I simply make my best guess based on available information.
It is impossible to predict the exact form and extent of future technology. It is incredibly REASONABLE to predict some amount of future technology. The entire history of the oil industry, and really most industries, has seen technological progress over time. So, while you can’t predict the exact amount of progress, predicting zero is a very BAD guess.
Anonymous,
One can predict some technological progress while at the same time expecting greater challenges extracting a depleting resource, the two effects may offset leading to little overall change in resource availability. In addition technological progress has physical limits which we may be approaching. There are limits despite the musings of people like Lynch.
I’m not defending a view of forever more oil. Not even sure if Lynch would. Obviously it is a fossil fuel. But if you only look at a fixed tank of oil and don’t consider that technology changes, you’re naive. For one thing you can look at other mining industries (coal, gold, iron ore) and they’ve continued to make significant technical advances (affecting economics of marginal deposits) throughout our lifetime. And they were not unsophisticated when we were born.
With oil, you also have large amounts that are off limits because of public policy or cartel actions. Those shouldn’t be seen as inflexible limiters in the long term, the way a lack of resource would.
Of course different factors fight each other. Oil is not at $20 after all. But it’s also not at $150+. You’ve significantly underestimated production response over the years and have been too bullish on price, as a result.
Hilarious to me and to many here I’m sure that Anonymous is telling Dennis to get a backbone about his predictions when he’s too chickenshit to use his real name. Grow a pair dude.
Anonymous,
There is no doubt that my forecasts have not been perfect. In most cases they have been too low and I say this repeatedly. Here is an old model from May 2019, as you can see in this case the estimate was too high.
A said:
So the future tech will be something not at all related to FF. See how that works? LOL
Peak Oilers definitely got conventional crude right to within a decade. Considering that human civilization has been going on for thousands of years, not too bad an estimate.
Anonymous,
Where you think of it as a tank of oil, I do not. The URR is based on what I believe is a realistic assessment of future technology, discoveries and reserve growth. As I get more information over time I adjust my expectations, which seems reasonable at least to me.
I agree I have been too bullish on price in the past. If prices of oil and natural gas remain where they are in real terms (say 2024 US$), it is likely that URR for World C plus C will be under 2800 Gb. If we see oil and natural gas price rise in real terms (to say $120/b and $4/MCF in the US), we might see a higher World URR for C plus C of perhaps 3200 Gb.
Probably 3000 Gb or so would be my best guess, with perhaps a 75% probability (in my estimation) that URR will fall between 2800 and 3200 Gb and 12.5% probability it will be higher than 3200 and a 12.5% probability it will be below 2800 Gb.
If you look at past estimates of URR by Hubbert, Campbell, Laherre (oil and especially natural gas), they’ve been low. Yes, even when they thought they had a healthy slice of unidentified fields and reserve growth. They still were low. I just would counsel you not to let the people here calling you a crazy optimist to make you think you’re batting it down the middle. You may still be being too negative, especially if you’re listening to people here.
A lot can happen over several decades. Heck maybe we DO figure out the synfuels by then. And no, I’m not pushing that cornucopian Green River pipe dream. I’m just saying it’s another thing to rule it out entirely, over the course of rest of the century. I mean we DID figure out the tar sands and the Eastern Gas Shales.
That’s why I take the PGC gas estimates pretty seriously. The molecules are there. Over the course of decades, a lot can happen to improve the economics and the means of extraction.
Anonymous,
I had a range of guesses in July 2012, the highest model overestimated output for World C plus C. See
https://oilpeakclimate.blogspot.com/2012/07/an-early-scenario-for-world-crude-oil.html
Several scenarios from 2012 with EIA World C plus C output data updated through 2022. My best guess was the medium scenario, and the World C plus C URR was a bit too low (2800 Gb where 3200 Gb may be more reasonable), but note that my high scenario overestimated output at least through 2023.
A recent estimate by Laherrere in 2022 has World C plus C URR at about 3500 Gb, I do not think that estimate is likely to be low, my expectation is that the probability that World C plus C URR is higher than that value is under 10%.
The title of Lynch’s article is: “The Shockingly Bad Methods Used By Some Peak Oil Advocates.” A peak oil advocate is someone who believes the supply of oil is finite and will one day peak. Michael Lynch always said, “No peak in sight.” The peak may, or may not, be in the past. But the peak is now, for damn sure, in sight.
Lynch raves on and on about the Hubbert Linerization used by peak oilers. Hardly anyone ever mentions that anymore. The big question is, “How much economically recoverable oil is now left in the ground?” That is a hard question to answer, but I would bet my bottom dollar that far more than half of it has already been produced.
RP said
“Lynch raves on and on about the Hubbert Linerization used by peak oilers.”
We addressed that in Mathematical Geoenergy, chap.8
Indeed, Lynch has been essentially singing the same song for 20 years now, while most of us have moved on.
Yes….undoubtedly terrified of the people and methods that claimed peak oils 16 years ago now…and then wrote that the reason they were wrong is because they didn’t know the future when they made the call.
Quaking in his boots…no doubt. Good one Paul. Now I really do have to go get your book out of the library and see how you handled the most basic economic elements of oil and gas development.
Michael Lynch has had the same grift going for over 20 years now. I quoted this passage by John Attarian in 2005, written in 2003:
I can’t remember but the above insight may have provoked the idea of doing a convolution-based depletion formulation, which describes non-symmetric production profiles.
The best most convenient way to trace citations, Google Scholar gives our work as the 2nd citation for the search terms : (depletion convolution Hubbert oil)
https://scholar.google.com/scholar?q=depletion+convolution+Hubbert+oil
The 1st Google Scholar search match is to peak water in the Oglala aquifer written in 2016.
We moved from bell to shark fin and we are probably right on the pointy bit.
Yep, optimistically speaking, we’ve consumed 75% of the “good stuff” (2P remains 500 Gb), or pessimistically speaking, we’ve consumed almost 85% of the “really good stuff” (1P is 250 Gb). It will surprise some here when they imagine there’s 1,000 Gb still left but nowhere to be found…
Doesn’t matter though, peak was 2008 plus or minus a couple years…
The only hope now is for production to drop rapidly to some sort of semi-sustainable level (maybe half what it currently is)
Important to make Reseervegrowthrulz cry over the fact that petroleum engineers are not being cited by Scholar ChatGPT on some rather basic concepts.
Prompting Scholar GPT with the words (depletion convolution Hubbert oil logistic discovery) and it cites our work first.
https://chat.openai.com/share/67814c20-7c42-40ec-a2e0-06ff1bf8b732
I think he will whine and say that all this was well known but kept proprietary as oil company IP.
Certainly an interesting read, Mr Lynch, clearly an expert!
“ Michael Lynch
Senior Contributor | ENERGY
I am a Distinguished Fellow at the Energy Policy Research Foundation and President of Strategic Energy and Economic Research. I spent nearly 30 years at MIT with my head shoved up my ass”
Lynch’s approach is to marginalize the logical analysis technique of tracking oil from discoveries through to production as is done on this blog. He thinks that by conjuring it as voodoo with his word salad writing style that people reading Forbes will dismiss it out of hand. Lynch has essentially been recycling his argument for years.
But he knew peakers were full of crap before they did. Gotta count for something.
Au contraire, we are full of bottomless insight. Unlike the finite & non-renewable property of fossil fuel resources, the human mind is limitless in finding new ways to understand nature.
Mr. Alexander Khurshudov posted an interesting text on the topic. Let me remind you that in March 2022, Alexander spoke here with Mr. Patterson. Here:
Alexander Khurshudov: The forecast for further growth in oil production in the United States seems too optimistic to me
January 29/ 08:50
Moscow. In September last year, oil production in the United States reached an absolute maximum (13.25 million barrels per day), exceeding the 2019 value by 2%. US authorities believe that growth will continue and the average value in 2024 will be 13.4 million barrels per day. An expert from the Oil and Gas Information Agency briefly reviews the reasons for this event and the prospects for further growth.
Production dynamics
Current production figures for the largest provinces are shown in Table 1. It can be seen that in three regions: Bakken, Eagle Ford and Niobrara, the maximums are in the past, production is generally falling.
Table 1
In the Gulf of Mexico fields, production fluctuates in the range of 1.8-2 million barrels per day, new deposits are being brought into production here (sometimes in deeper areas), and the absence of strong hurricanes had a positive effect last year.
The only area with growing production is the Permian, located in Texas and New Mexico; let’s look at it in more detail (Fig. 1):
Fig.1.
The graph clearly shows the reduction in production during the covid crisis (by 23%); the other two (February) minimums are associated with cold snaps. Over the past 4 years, production growth in Texas fields was only 2.85%; the decline in the Eagle Ford (-0.25 million bbl/d) was offset by the Permian formation (+0.4 million bbl/d).
The picture is different in New Mexico. This is the newest area of shale, mass drilling began there only in 2017, but since then production has increased by 1.4 million barrels per day – 4 times (!!!). There were 97 rigs operating there in December, nearly a third of Permian’s rigs or 19.4% of U.S. oil drilling. The Bone Spring productive formation of the Delaware formation predominates here, represented by dense limestones with interlayers of sandstones and shale with a total thickness of up to 1000 m. Such a powerful formation requires powerful hydraulic fracturing, so an average of 9 thousand tons of proppant proppant is pumped into a horizontal shaft up to 3 km long.
However, there has been some decline here too. Maximum production (1.86 million barrels per day) was reached in April last year, subsequent fluctuations were at a lower level.
Oil in New Mexico is super-light, its density varies between 778-820 kg/m3, in essence it is no longer oil, but gas condensate with an admixture of oil. For every ton, 1085 m3 of associated gas is produced, and the total gas production here has reached a huge value – 91 billion m3/year, fueling the American gas industry.
The richest areas in the Delaware formations appear to have already been drilled. Wells commissioned in 2022 produced 13% less oil than those commissioned a year earlier. It seems strange, but the decline in production during the Covid crisis contributed to the subsequent rise; Some wells were stopped, reservoir pressure increased in them, and they were started up with a higher flow rate. However, after a couple of months this effect exhausted itself.
Proven reserves of oil and condensate in the US were last published in 2021 at 44.4 billion barrels. It is worth noting that since 2019 they have decreased by 5.7%. It is clear why the estimate for 2022 was delayed: oil prices made steeplechase races in 2022, and it is scary to take any average value. I note that at the current level of production, these reserves should be enough for the next 8 years.
The EIA estimates previously commissioned shale wells monthly. cut production by 0.64 million barrels per day, with almost two-thirds of the losses occurring in the Permian territory. To compensate for this decrease, 1,192 new wells with an average flow rate of 70 tons per day must be commissioned monthly (!!!). Therefore, let’s turn to drilling statistics.
Putting wells into operation
The peculiarity of American shale formations is that sinking a shaft, even with a horizontal part of up to 3 km (actually, drilling), is 2-4 times cheaper than subsequent hydraulic fracturing (hydraulic fracturing) and induction operations (completion or development of wells). It is not surprising if you remember what huge quantities of proppant, water and chemicals are injected into the formation during multi-stage hydraulic fracturing. With low oil prices, companies postponed development until better times and mothballed wells. By mid-2020, the number of such wells reached 8,883.
The intensity of drilling critically depends on oil prices. In Fig. 2 the number of active drilling rigs is compared with spot exchange prices for American WTI oil.
Fig.2.
Of course, when prices fell, drilling always decreased. But if in 2015 drilling rigs began to leave the areas at a price of $48/bbl, then last year at the Bakken and Eagle Ford fields this process began at a price of $80, and at the Permian – at $70. Then the reduction in the number of new wells began to be compensated by putting into operation previously mothballed ones. The change in the number of mothballed wells is shown in Fig. 3.
Fig.3.
Both oil and gas wells are taken into account here, but the number of the latter is approximately 20% and this has almost no effect on the nature of the trends. The 2020 production crisis again played a decisive role. At that time, the oldest Bakken field had 920 wells in conservation; and now two thirds of them are already in operation. At Eagle Ford, out of 1,581 undeveloped wells, 372 remained, at Permian, out of 3,522. – 821. The number of mothballed wells in the United States as a whole decreased by 4,468, and 4,415 wells remained mothballed. In Fig. 4, the number of wells drilled is compared with the total number put into operation.
Rice. 4.
It seems that both curves are close, but in 2021, 200-300 more wells were developed monthly than were drilled, and last year this difference was 100-150. Only in 2022, with WTI prices above $100, almost all drilled wells were immediately put into production.
There are no data for December yet, but in November 937 wells were put into operation. To compensate for the decline in the rest, they must have an average flow rate of 89 tons/day. And although the EIA forecasts a slight increase in production for January, given current oil prices and the rate of decline in drilling, it seems to me too optimistic.
Oil refining
Oil refining volumes in the USA are shown in Fig. 5.
Fig.5.
There is also a noticeable decrease here due to the Covid crisis (March-April 2020). Otherwise, oil refining volumes have changed little: over 10 years they decreased by only 0.26%. A more significant decrease in the share of imports in oil supplies turned out to be more significant (from 47% to 41%). Still, the US imported an average of 6.5 million barrels per day of oil last year, half its own production.
Reserves
The change in oil reserves over the past 10 years is shown in Fig. 6. Let me remind you that 2/3 of commercial stocks are used in various technological processes, and only about a third can be used in case of shortage.
Fig.6.
The Covid crisis manifested itself here too: by July 2020, commercial reserves increased by 107 million barrels. During the same period, the United States began to rapidly reduce its strategic reserves, and now they have almost halved, from 695 to 355 million barrels.
This is a logical decision. With high domestic production, there is no point in storing extracted oil in salt formations. This requires some (small) costs, in addition, no one yet knows how much injected oil can be extracted back, there must be losses. Still, I think that further sales of strategic oil reserves will stop at these figures. At least to wait for higher prices.
Export-import operations
The average daily export of oil and petroleum products is shown in Fig. 7. In total, it now amounts to 10.4 million barrels per day, which is much more than Russia exports (7.5 million barrels per day).
Rice. 7.
Here you go! And these people forbid us to pick our noses and consider Russia a gas station country? However, let’s not rush, let’s delve into the details.
In addition to exports, the United States widely imports oil (see Figure 5). Celebrating the growth of their exports at every corner, they have remained a net importer of oil in recent years. Last year, imports amounted to 6.5 million barrels per day, which is 38% more than exports. The difference between imports and exports (this is net imports) amounted to 2.4 million barrels per day.
Imports of petroleum products are also present; last year they imported 2.06 million barrels per day. Then the net export of petroleum products is 4.3 million barrels per day. But it turns out that gasoline, kerosene and diesel are a little more than half of exports, another 2 million barrels per day are oils, lubricants, bitumen and raw materials for petrochemicals, and 1.7 million barrels per day are liquefied gases (!!!) . Are you surprised? I’ve been wondering about this for a long time too. This is the so-called NGL, a natural gas liquid, its main components are propane, propylene and butanes. It is obtained not at refineries, but at gas processing plants; it is a good raw material for gas chemistry, but how it relates to petroleum products is not clear.
It turns out that the United States imports 2.4 million barrels of oil per day and exports 2.7 million oil products. Of course, he provides for himself, makes money from oil refining and, possibly, from the difference in prices.
Canada has been the main importer of oil to the United States for many years. Last year it supplied 3.64 million barrels per day or 56.3% of all oil imports. Mexico is in second place with 0.61 million (9.4%), followed by Saudi Arabia (5.4%), Colombia, Brazil, Iraq and other countries have a share of American imports of less than 3%.
The distribution of exports of oil and petroleum products is shown in Table 2. American companies have traditionally supplied petroleum products to Mexico and Canada; last year, 1.1 and 0.8 million barrels per day went there, respectively. The rest was distributed throughout the world.
table 2
And the most oil was sold to Southeast Asia, with China leading the purchases, followed by Japan and South Korea; purchases are growing in India and Singapore. In Europe, the largest importer is the Netherlands, with its Rotterdam terminal and associated refineries. In general, American oil has dozens of buyers around the world.
Summary
The US oil industry is at its peak. This was facilitated by the commissioning of 4.5 thousand previously drilled wells and the development of new deposits of the Permian formation in New Mexico.
However, its further development critically depends on the dynamics of oil prices. In older shale plays, drilling is curtailed when WTI prices are below $80, and in the Permian formations it is below $70. As the areas are further drilled, these numbers will increase.
Due to the emerging slowdown in the global economy, I do not expect a strong increase in oil prices in the next two years. Even if hostilities in the Middle East expand, the military premium will add 10-15% to the price, and its effect will not last long. Therefore, I am skeptical about American forecasts for increasing oil production this year.
A new renaissance can only happen if prices are stable in the region of $100-120 or higher. But he needs to hurry, because now the decline in production in old wells is not compensated by drilling new ones.
At the same time, I still believe that a sharp collapse in production in the United States should not be expected. It is possible to work with a huge well stock that has already been drilled, to optimize the operation, this is probably already being done, which will ensure a smooth movement from the peak down.
Next time we’ll look at how things are going in the American gas industry.
P.S. If anyone is interested, here is the link to the site, there are pictures there.
https://www.angi.ru/news/2913567-%D0%90%D0%BB%D0%B5%D0%BA%D1%81%D0%B0%D0%BD%D0%B4%D1%80%20%D0%A5%D1%83%D1%80%D1%88%D1%83%D0%B4%D0%BE%D0%B2%3A%20%D0%9F%D1%80%D0%BE%D0%B3%D0%BD%D0%BE%D0%B7%20%D0%B4%D0%B0%D0%BB%D1%8C%D0%BD%D0%B5%D0%B9%D1%88%D0%B5%D0%B3%D0%BE%20%D1%80%D0%BE%D1%81%D1%82%D0%B0%20%D0%BD%D0%B5%D1%84%D1%82%D0%B5%D0%B4%D0%BE%D0%B1%D1%8B%D1%87%D0%B8%20%D0%B2%20%D0%A1%D0%A8%D0%90%20%D0%BF%D1%80%D0%B5%D0%B4%D1%81%D1%82%D0%B0%D0%B2%D0%BB%D1%8F%D0%B5%D1%82%D1%81%D1%8F%20%D0%BC%D0%BD%D0%B5%20%D1%81%D0%BB%D0%B8%D1%88%D0%BA%D0%BE%D0%BC%20%D0%BE%D0%BF%D1%82%D0%B8%D0%BC%D0%B8%D1%81%D1%82%D0%B8%D1%87%D0%BD%D1%8B%D0%BC/
It’s an interesting article. I agree with his comments about net imports of C&C. Also of how propane is not really a refined product, comparable to transport fuels.
I think his comment about US production not falling or rising dramatically is reasonable. Although I think he will e off when he says no rise at all this year. There’s enough momentum in the system, enough rigs still drilling (even with some reductions) that we’ll still grow a bit. Note also that we grew way faster last year than EIA predicted. (And they were derided for being too cornucopian, by the peakers.)
I don’t agree with his concerns about NM oil gravity. If it weren’t economic, they wouldn’t drill it. And it sells just fine, with at most, very small differentials (and still better than grades like Urals, Mars, WCS, etc.) For that matter, only 5% of NM production is over 50+ API (real hard core condensate). The average API is probably 44-45. Very nice, really.
As for Bakken, Nio and EF: yes they are past peak. But “falling” is not a fair description of last few years. They’re flat, really. Bakken even slightly recovering/rising (up in 23).
I don’t buy the conspiracy worry about date of EIA reserves reporting. It’s usually about a year late. that’s just how that works. They are a month late. And they’ve got a lot of work going on to redesign processes, have delayed other reports and even skipped some.
The EIA Monthly Energy Review is just out. Looks like production has hit a plateau. So far, anyway.
NOV and DEC are really forecasts, not data. We’ll have the actuals (914 data) for NOV in two days. And DEC a month from now. Wouldn’t be surprised if it’s sort of flattish…there is some seasonality in the winter.
I think there will be a big drop in JAN (cold snap). But we won’t have that data until end of MAR, two months from now.
NOV actual ended up being a new record. 13.308 MM bopd. Not a plateau. (Not yet at least. JAN will be brutal with the cold snap.)
It’s not even about the actual value though. I just think looking at the PSM, as if last two months were data is a mistake. They are sort of STEO-ish. Not 914-ish.
This is for Dennis, what is “more conservative”, 1P or 2P?
Also, what should happen to 1P, if reserves (2P) are truly 5-6 times 1P?
Shouldn’t 1P grow by a fairly steady amount (maybe 5% – 10% annually)?
1P is the conservative value of potential oil reserves, not 2P…
You may certainly say that 2P is the most probable value, but not the most conservative…
(source: https://jancovici.com/en/energy-transition/oil/what-is-an-oil-reserve/)
At the bottom of the graph it says “on a fictive case”,
which I suppose means rough estimate ( /- 30% ?).
And of course the 1P is a rough estimate,
the 2P is a rougher estimate,
and the 3P is a yet rougher estimate.
And since we are talking about reserves which in part a function of price paid for product, we introduce a wild ass guess into the equation, compounding the great uncertainty.
Kengeo,
Yes the 1P is the most conservative estimate and the 2P estimate is the most accurate and the most useful.
Dennis –
I think the point is that 1P is a real/true value.
As you move from 1P to 2P, you introduce all these “what-if” scenarios.
If I’m driving down the road and I have a 1P fuel gauge and a 2P fuel gauge, I’m sure as hell going to pay close attention to the 1P gauge (2P is a good tailwind, going downhill, drafting behind a semi…)…still a 50% chance that 2P is an overestimate, I avoid calling anything overestimated as a conservative value…
We also know of the tendency for some/all countries to overestimate reserves, that’s another reason why 1P is a better number to focus on, it cuts a lot of the BS from the equation.
Kengeo,
Does your fuel gauge only tell you your tank is 1 tenth full when it is half full? I call that a broken fuel gauge. No the 1P estimate is not a true/real value, it is an underestimate, it is like looking at a 5 pound bag of potatoes and suggesting there might be a half a pound of potatoes in the bag. It is a conservative estimate, so conservative it is of little use.
The 2P reserve estimates by IHS and Rystad are based on technical reserves and are likely pretty close to the truth, though they may underestimate 2P reserves due to reserve growth and future discoveries.
Not clear what your chart is supposed to show.
You can look at history, Kengeo and see that we have overproduced US proved reserves for many many decades. The proof is in the pudding. And the evidence is that proved reserves is too conservative.
World reserves (especially in OPEC) are much more of a black box, I agree. But even in that case, where they are making up numbers, the evidence seems to be that the ME has no problem pumping. It’s been 20 years since Twilight in the Desert. Those “secret Saudi tank farms” must be massive if they stored 20 years of oil! Maybe they are underground. Think about it… Oh and FWIW, Feridun Fesharaki who has actually helped some Arab governments make up the numbers (literally) says that his guess is the numbers are too low!
What many of us IN the actual oil business do is assume, always incorrectly, is that economics and common sense will prevail and we have reached the limits of affordable oil. For instance, tight oil, which is a perfect example of reaching the end of affordable oil. After 17 years its just now eeking over into the black…but only because of higher oil prices. Before 2022 it was a disaster.
So peak oilers make predictions based on there being no more money for poor investments, then go to hell if dickhead financial engineers that lie, profusely, to bankers, lenders, shareholders, etc, don’t raise more money, drill more sorry wells and low and behold… peak affordable oil never happens.
Then guys like you, and Lynch, and Blackmon, etc, puff up like chickens and say, see…I told you.
I think people are smarter than you give them credit for. They see thru your horse shit. We can keep dredging oil out of the ground forever as long as guys like you keep lying about how much there is, and how much money it might make if you are stupid enough to invest in it.
There is an infinite amount of recyclable oil in asphalt parking lots all over the world; hold my beer, give me enough money and I’ll make sure peak oil never happens. Thats pretty much how stupid the abundance theory is.
Again, get a name, man. Be convicted. It will help your cause. You want to make a difference, you want to lead and not follow, you want to convince people everything is peachy…get some credentials. Until then you are just another lone voice of bias on social media.
Not something to hang your hard hat on, is it?
As a consumer, I appreciate it when someone dumps product on the market and runs down the price. Thank you investors! I can see how producers feel the opposite. They want less competition and higher prices.
Remember what Rockefeller said when he got his harshest rivals in a room together, “Gentlemen, let us not forget our true enemy…the consumer!”
But I’m on the side of your enemy. If OPEC dumps a bunch of product on the market (or shale boys do the same, or both) and price crashes…that’s what I want. I don’t wish you anything bad…and actually hope you survive. But if you don’t, so be it. I want those low prices more. That’s capitalism. That’s competition.
You sound a lot like a poster who was here and on Seeking Alpha years ago.
I’m not sure why you’d think I could buy a multi billion dollar oil company either, so I assume that was sarcasm.
I was just commenting that these large independents have really made some mistakes in the Bakken. Of course, some that now look smart are primarily smart because they discharged a ton of debt in BK during 2016-2020.
Chord brags about its low debt levels. How much debt did Whiting and Oasis BK on? Looks like $5 billion to me. The market cap of the company is $6.42 billion now, after its share price has tripled.
Some of us don’t like BK. But it’s apparently the American way now.
FYI I doubt I will ever buy even a 1 well oil lease in the future.
I didn’t expect you to buy $Bs. I was just curious if you were contemplating making even a small move. No sarcasm intended. Good luck in Kansas.
There are always non-operated Bakken working interests for sale. I’ve looked them over.
The wells are expensive to operate and one failure can wipe out many months of income.
Rather than taking royalty, many mineral owners in the Bakken opted for non-operated working interests. This usually was a mistake.
Always take the mailbox money.
If I ever do buy any oil and gas interests in the future, it will be conventional onshore US royalty. We have bought a lot of royalty and ORRI in our operated leases and a few others. Bought a significant amount in the 1990’s and those have been among the best investments we have made.
Mike,
This is a great comment. There is a huge abundance of hydrocarbon on the planet, however, the miracle of poking a hole in the ground and getting a gusher of black gold is practically over. I think Hubbert’s model held very well for that era. Applying this simple math to the new era of trying to squeeze juice from a turnip is pointless, IMO.
I am yet to see compelling theoretical framework for the new era, and that’s not a dig at anybody, it is just something that is not easy to model. It is so multivariate: oil futures prices, financial conditions, regulatory, political, technological, infrastructure, environmental etc…
There are many shale resources over the world, people here mentioned Vaca Muerta, there is a large resource in Russia, etc… Can the unique conditions present in the USA – promiscuous financialization, stable society, advanced infrastructure, business-friendly culture, sophisticated oil services ecosystem – can all of this be replicated elsewhere to carry-out what is a complex extraction process? I have my doubts…
As I mentioned above, US shale as it is today benefitted from $billions of debt wiped away by BK 2016-2020.
Does the same possibility exist in the other world regions where shale is a possibility?
yes,
the US shale oil and China solar battery panels both benefitted $billions debt/negative return investment and helped lower the global energy price and carbon footprint?
So do I.
Rational clear thought is rare. There is much Hopium in the world at large.
Thank you. It is an always overlooked part of the peak oiler defamation league, like Lynch, Blackmon, the API and an array of different annoymous people all over the world afraid they will make a mistake that will come back to haunt them…they know nothing of geology and even less about what it takes to make money getting the stuff out of the ground. I suppose you can say they are all pretty much… economists.
The entire US shale oil and shale gas phenomena would have never gotten off the tarmac had it not been for other people’s money. Here we are, in 2024, yaking about limitless reserve potential, new technology, hope for this and hope for that…if only product prices were higher…if only companies would “invest” more. In the US the tight oil sector is just now making money, after 16 years, and stupid people are filing lawsuits against it because it hasn’t re-invested enough !
The worldwide oil and gas industry knocked it out of the park, for 140 years, at prices below $3.00 oil and 15 cent natural gas. Its funny to me how that goes plum over peoples heads. 140% ROI’s on $12MM tight oil wells is hardly affordable oil; not even close.
If the technology of the 1970s is 1P…and technology of 2010s is 2P….both apply depending upon technology
Then, we should see world production continue to increase without peaking…but the data doesn’t support that, rather supports a peak production in 2018 and declining since. Additionally, the peak suggests a URR of ~2,700 Gb. With an annual decline of at least 1.5 mb/d…
If we use 2P reserves then we have a URR of only 2,000 Gb. This means a much steeper decline is on the horizon… ~3-4 mb/d….
If 1P reserves are measured than an annual decline of ~6 mb/d.
Recap. – If you are like Dennis and prefer to use a very non-conservative estimate, then we are still looking at an annual decline of almost 2 mb/d. If you are a middle of the road type, then you might see an annual decline 3.5 mb/d being most likely. If you’re a pessimist/like to use conservative estimates, then almost 6 mb/d annual decline it is.
What you absolutely do not see is a plateau or increase in global production…
I would even go so far as to say there’s a moderate chance that only 2/3 of 1P reserves are produced. This would result in annual decline of 7-8 mb/d, this would effectively have the entire world production approaching 0 by 2035…
Kengeo:
OPEC and Covid have had significant short term effects. There is no good reason to think 2018 is the ultimate world peak. After all, Ron said 2015 would be the world peak before. There’s a long, long, longitty long-long history of previous “peaks” that were temporary. Heck, look at the US. Not only did we break the 1971 peak, but we actually rebounded post covid and broke the 2019 peak. And lots of peakers claimed that wouldn’t happen. I can go to many other examples (Berman in the Bakken, etc.) where peak calls were made too soon and ended up being wrong.
Keep an open mind.
It’s all in the details, conventional oil peaked long ago (or do you somehow deny that as well?)…call it 2005 plus/minus 5 years, conventional+unconventional peaked in 2018/2019, hasn’t come close to challenging that peak yet, and for some reason once we hit the 5 year mark (will know in next month or two) it seems more people will take notice of decline/depletion rates. In order to grow oil production it’s critical to make new discoveries, you may notice that there have been very few discoveries since 2010…
Over a 7-8 year period, 1P reserves fell from 380 Gb in 2016 to 250 Gb presently. At that rate 1P reserves approach 0 in 10-15 years…
Take UAE, Iran, Kuwait, and Saudi Arabia as an example. 1P in 2016 of ~150 Gb, but <70 Gb in 2023…that's a very steep drop. Each year that group burns through 7 Gb, so together 1P reserves have less than 10 years remaining…
Kengeo, lots of people said the US would never get back to 13MM and had peak in the rear view mirror. Even as recently as spring 2023. And yet, here we are! Given that, I’m pretty skeptical of something as recent as 2018 being the world peak.
There’s too much OPEC crude that might get dumped in a price war. Or danger of peace breaking out in the Gaza and Russia/Ukraine. And the Permian still has some running room. And tar sands. And heck for that matter lot of barrels in Vz, Iran, and Libya that have a danger of returning to the market.
Anomy- “I’m pretty skeptical of something as recent as 2018 being the world peak.”
Yes, it looks possible that if most of the stars were aligned geopolitically and economically that higher peak might be achieved.
The chances of that happening are very low in my estimation.
A long fat tail of declining production is the more likely outcome, in my estimate.
The planet I live on OPEC peaked about 8 years ago and currently stands about 10% below the 2016 peak…since late 90s they have burned through more than 300 Gb of crude, but sure hopefully they don’t flood the market with all that extra oil they have saved up…
OPEC continues decline of almost 4% annually since 2017, right around -1mb/d each year…currently producing ~26.5 mb/d vs ~33 mb/d in 2016, down around 6 mb/d (25%).
Following this decline curve, 1P OPEC reserves disappear in 2038.
They will likely be one of few areas producing oil in measurable amounts in 2035, few other areas will still be at it…
Kengeo,
Where are you getting your estimates? If we go from peak in 2016 to most recent EIA data point (Oct 2023) the decline is about 2% per year, not 4%. If we use the past 5 years of data OPEC output is pretty flat ( a very slight increasing trend).
Directly from OPEC reports…
Kengeo,
If you look at OPEC reports, you need to adjust for the changing membership of OPEC over time.
Try this
https://www.opec.org/opec_web/en/publications/202.htm
Kengeo,
If we define conventional C plus C as that whicjh excludes tight oil and extra heavy oil, the peak for conventional oil output was 2016, not 2005. There are many different definitions of “conventional oil”. Jean Laherrere believes 2P reserves are the number to focus on, I agree with him on this and many petroleum engineers would also likely agree with Laherrere on that point.
Dennis
I have seen the comment many times that the IEA said peak conventional oil occurred in 2006.
” According to some observers, we have already passed the peak or will be passing it soon. Others claim that peak demand will outpace peak production. Fact is that the IEA thinks that conventional crude oil production has already peaked in 2006 at 70 million barrels per day (International Energy Agency [IEA], 2010).”
Sounds like they made that statement sometime in 2010.
https://www.sciencedirect.com/science/article/abs/pii/S0301421512004090
Ovi,
Sometimes estimates are revised and as I mentioned it depends strongly on how one defines conventional oil.
Dennis
Just recalled, the IEA may have also left out heavy oil, bitumen, from Canada and Venezuela.
Oh dear.
Aramco announces that it has received a directive from the Ministry of Energy to maintain its Maximum Sustainable Capacity (MSC) at 12 million barrels per day (MMBD), and not to continue increasing MSC to 13 MMBD.
https://www.aramco.com/en/news-media/news/2024/aramco-receives-directive-to-maintain-msc
And the oil price is down… Lack of investment will bite us at one point. Wonder, if this is an acknowledgement of the improbability of being able to achieve this rather than demand concerns
Okay, so it won’t be the Saudis who are going to increase oil supply. The Russians are out. And the Permian looks set to roll over and may be at bubble death point (I already called this for my band name btw).
That’s such a GOR-y band name!
(ba-da-bum)
High-Impact Drilling to see Rebound in Africa and Latin-America this Year
https://oilprice.com/Energy/Energy-General/High-Impact-Drilling-to-see-Rebound-in-Africa-and-Latin-America-this-Year.html
This is written as if this year is going to be a huge resurgence for exploration drilling but the actual numbers given indicate another nail in its coffin, and a pretty big one. For example:
“Eight planned high-impact wells target prospective offshore resources of more than 430 million boe and considerable prospective onshore resources of more than 230 million boe. The remaining 11 wells are strategically relevant for their respective operators, meaning exploration success would help them gain traction in the region or inform future operational decisions.”
It used to be high impact wells needed to target at least 100 mmboe, but Rystad seems to change the definition to “anything that looks a bit out of the ordinary”. The eight wells identified average about 80 mmboe (that is not “large”). Last years’ success rate was 30% and has been falling so of those eight actual discoveries might be around 250 mmboe, barely enough for one decent greenfield FPSO.
Most years the actual wells drilled are only about three quarters of those planned, so saying “If all planned wells proceed as scheduled, 2024 would see the highest number of high-impact wells drilled in at least 10 years, since we started tracking these wells in 2015” is irrelevant and/or misleading.
Three of the wells are in new basins, typically an initial anchor development in such regions where there is no existing logistics infrastructure requires about 500 mmbbl oil or 3tcf gas to be viable, there doesn’t seem much prospect of that.
There seem to be only 2 such wells planned for the North Sea (neither by major or independent E&Ps) and 2 in North America (presumably GoM, north or south); so I think those areas can now be assumed to be well into maturity and likely to be looking at exponential decline in a few years.
Dennis – As always it is slightly more complicated, conventional peak was a period of 15 years between 2005 and 2020, centered is ~2012-2013.
If 2P is the number to focus on, then do you believe there are currently only ~500 Gb of 2P reserves? If so it’s about 2 times the number of 1P, so we should see 1P growing by some amount each year, right? 1P is not growing though, was 380 Gb in 2016 (near world peak) and dropping by around 14 Gb each year…
Just as there are limits to the geology that constrain the amount of recoverable oil, there are limits to the games that economists can play with numbers, the 1P/2P reserves BS is approaching a limit of sorts…
Kengeo,
If oil prices are low, World C plus C URR might be 2700 Gb, if supply is short and oil prices rise (to over $110/bo in 2024 $) the World URR for C plus C might be as high as 3300 Gb, my guess is that it will be between these two guesses, perhaps around 3000 Gb. Note that it is highly unlikely the the path of output will follow a simple Hubbert curve as the World is a complex place.
Economists don’t make the call on 2P reserves, that is a technical decision based on well understood petroleum engineering principles.
Dennis – Nothing very complex about fluid-flow and hydrodynamics. Just two considerations, time (x) and flow (barrels per day). In the case of the world, it’s a consortium of small, medium, and large oil fields that contribute to the overall shape. Just saying that output will not follow a Hubbert-type curve doesn’t make it so. Current production of ~80 mb/d can be split up into several groups. OPEC which is declining at 4% annually makes up 1/3rd. Russia, North America, and some other areas make up ~1/3rd as well, then misc. for the rest. We can assume that baseline decline will be at least 4% for the overall group. That’s a decline of ~3 mb/d annually.
For the overall world 1P, it is gone by 2035 or so. 2P reserves might last another 15 years after that, say early 2050’s…
Kengeo,
The hydrodynamics of a single well is perhaps not all that complex, predicting the future performance of all wells drilled in the future as well as the future output of existing wells is reletively complex when economic and political considerations are added to the mix.
The fact of the matter is that past production has not followed a Hubbert curve at the World level, to expect it to do so in the future seems absurd in my view, OPEC is not declining at 4% per year, if we do an OLS on OPEC 12 from Jan 2016 to December 2023 for crude oil output the annual decline rate is 0.1% per year. If we use Jan 2019 to Dec 2023, OPEC 12 output is up slightly over that period (using OLS on the crude oil outpt data), but basically flat ( 0.0015% per year). If one looks at the data it is hard to come up with 4% per year decline, can you provide the basis for this estimate based on historical data?
Gentlemen,
Maybe the fluid dynamics of a a vertical well is “simple”, but I would bet that a long lateral deviating left and right and up and down is far from simple. The will be multiple phases and traps all along the lateral. I think it would be challenging at best.
Carnot,
You are likely to know fluid mechanics better than me, it has been a long time since I studied that (roughly 40 to 45 years), my guess is that it is likely more complicated than a simple vertical well, and even that is likely not as straightforward in practice as text books suggest.
https://www.dailymail.co.uk/news/article-13023551/Biden-facing-growing-calls-hit-Iran-directly-response-drone-strike-killed-three-troops-Republicans-slams-Joes-appeasement-Tehran-Democrats-urge-not-drag-U-S-Middle-East-war.html
Biden blames Iran for 3 dead US soldiers. Here we go!
https://www.youtube.com/watch?v=4XO7iQ5gcPQ
Peter Zeihan always with a well thought out perspective.
And there are oil implications discussed.
(My only beef with Zeihan is he thinks USA shale makes USA immune to oil disruptions in the Middle East)
another huge hidden cheap oil reserve should actually be Venezuela,
Venezuela if not because of US shale and sanction, will probably be still producing over 3 million BOPD if not 4 or 5?
Even in 2022, EIA statistics gave only ~650K BOPD, but China’s tea pot refineries alone probably refined over 400K BOPD from Venezuela. At least 400K to 500K BOPD unaccounted for?
In terms of carbon footprint, some heavy oil from Venezuela is acutally very small.
Venezuela also have lots of API>10deg crude good for diesel.
It should be…but IT ISN’T…r u serious!?
Sheng Wu
>10 API crude is good for diesel. Are you sure about that statement? You might like to explain the process and economics of making diesel from heavy bitumen.
“ Venezuela if not because of US shale and sanction, will probably be still producing over 3 million BOPD if not 4 or 5?”
Venezuelan production tanked because Hugo Chávez used PDVSA as his piggy bank. Their oil sands would require huge amounts of outside capital to develop. This will not happen in our lifetime as recurrent nationalization of oil resources and political instability mean no one will ever loan to them again. Russia and China might consider it but because Venezuela is in US backyard, we would never allow it.
Venezuela, Brazilian Pre Salt(?), Guyana Offshore, Argentina Vaca Muerta.
If you think the USA and its 900 billion dollar a year military is going to sit back and tolerate gas rationing while these resources sit idle in South America.
If you get Venezuela oil sands going it will keep going for a very LONG time.
Venezuela is easily the most obvious target.
“ Venezuela is easily the most obvious target.”
Agreed, but it would take a full scale invasion to make it happen with a full puppet government. It’s possible depending on how things play out
Trump said he was gong to invade Venezuala.
Venezuela’s reserves have not gone unnoticed.
A much easier way to get the oil resources of Venezuela would be to offer the country to become a state of the United States. Offer Maduro the initial Govenorship or whatever. Guarantee the vote to become a state within a couple of years instead of the many decades it took to make Alaska a state.
Which US oil billionaire wouldn’t want access to Venezuela’s resources via open competition via US laws?? Wouldn’t Venezuelans vote to become a state of the US as it would bring back their prosperity and ability to trade with the whole world?
The only people against something like this would be Russians and Chinese as it would easily make the US the most prosperous nation with the most resources once again.
Not everything has to be an invasion and war if people just thought outside the square a little.
“The only people against something like this would be Russians and Chinese”
I like the idea and I have previously suggested the same with Australia, unless Australians fancy Chinese Labor camps.
Another group that would be against it would be Replicans as the Venezuelans would vote Democrat.
Saudi Arabia’s surprise oil capacity U-turn was months in the making, source say
State oil giant Aramco was ordered by the Saudi energy ministry on Tuesday to halt plans to boost its maximum sustainable capacity to 13 million barrels per day (bpd), returning to the previous 12 million bpd target.
According to HSBC’s estimates, Aramco had little space to produce much above 10 million bpd in the next two to three years. “This decision might be a recognition of these trends,” it said in a research note.
This is big news. The Saudis to my knowledge have never explicitly stated a limit to how much they could eventually produce.
Stephen,
I have never believed the 12 Mb/d capacity for KSA, I focus on 12 month average output and for crude it has never been much above 10.5 Mb/d. When I see 12 Mb/d average C plus C output from KSA, only then will I believe they actually have that capacity. I don’t see this as big news, maybe just an admission that they cannot increase capacity any further which I have long suspected.
I think too much is made of this near term production capacity. It’s trader talk. Sure, maybe they can only do 11 or 12 or 13 MM bopd, in terms of existing infrastructure. But from the peak oil perspective, what matters is the geological limits on their production several years from now. Are they running on empty (Twilight in the Desert) or is it an incredibly rich petroleum province, where 10,000 bopd wells are ubiquitous and the country has not even been fully explored yet. I lean towards the latter. But in any case, even if you lean to the former, that’s what matters. Not this near term infrastructure talk.
I think it’s also important to look at what OPEC is. What it’s purpose is. It is a cartel. Designed to raise price by restricting production. The Saudis especially within that. It doesn’t exist to confound peak oilers with hidden tank farms so that Simmons looks silly. It exists to raise price. By constraining supply. Therefore, you can’t take production trends as indicative of running out of resource.
Canada’s Trans Mountain pipeline is about to open – perhaps not so good for US motorists…
https://www.wsj.com/business/energy-oil/the-u-s-is-spoiled-by-cheap-canadian-oil-thats-about-to-change-bafe831a?st=oesw8ji93gor6kv&reflink=desktopwebshare_permalink
rgds
WP
Weekendpeak.
TMX has hit another snag. Sounds like they can’t pull the smaller diameter pipe through a tunnel they drilled through a mountain.
Technical issues encountered during pipeline pullback activity between 25-27 January in British Columbia “will result in additional time to determine the safest and most prudent actions for minimizing further delay,” Trans Mountain said in a statement.
The setback comes two weeks after Trans Mountain was given regulatory approval to use a 30-inch diameter pipe instead of 36-inches for this small section of the project about 100 kilometres (62 miles) east of Vancouver, British Columbia. The 1,225 meter stretch has given construction crews repeated trouble, but a tunnel wide enough to hold the smaller pipe had been excavated, which was expected to keep the C$30.9bn ($23bn) project on track and avoid a lengthy delay.
https://www.argusmedia.com/pages/NewsBody.aspx?frame=yes&id=2532780&menu=yes
Thanks for that. Do you have alerts set up for news like that?
rgds
WP
Weekendpeak
TMX delays are big news in Canada. Saw the news on a ticker on a news channel. I then did a search.
“TMX delays are big news in Canada. Saw the news on a ticker on a news channel. I then did a search.”
The TMX construction has been a major CF. If this had progressed like the Alaskan pipeline, it might have been completed in 2017 by Kinder Morgan. KM wised up and sold in 2018. Anyhow, if that had occurred, the TMX pipeline would have had about 6 or 7 years of revenue coming in and the pipeline cost might have been around $8 billion, rather than $31 billion (both in Canadian loonies), With the crazy cost overruns, the shipping fees have nearly doubled.
Recently there was a construction halt due to it putting some frogs at risk. Anyhow, the spread between Canadian Western Select and WTI will have to narrow considerable to offset the fee increase.
Equally crazy is that eastern Canadian has little access to Albertan oil and has to buy the stuff at global prices with weak Canadian dollars.
Another US All Time High
Another large negative Adjustment Factor.
negative adjustment factor puts the production under 13MM b/d. Am I missing something?
1. The adjustment factor has to do with the weekly estimates. It is has nothing to do with the EIA 914, which is its own direct survey (and much more robust than the weekly estimates).
2. Even with weekly data, you can’t decide to subtract the adjustment from production. The whole point of the adjustment is they have several different estimates, which are independent, and as such, don’t “fit” perfectly together. But you can’t tell if the adjustment is from production or inventory or whatever. And it can even vary from month to month.
—
EIA has explained this several times, yet many people still don’t grok it. HFIR (at Seeking Alpha) has made a long habit of not comprehending these concepts
ANONYMOUS
You are partially correct and partially wrong.
1. The PSM, which is based on 914 DOES have an Adjustment factor. This is what it looks like on the MONTHLY, below. (weekly is a separate thing)
2. Adjustment is supposed to be the random error in the data and as such should average out to zero over time. For awhile, however, it had a strong positive bias (both monthly and weekly). EIA addressed that and made some changes in its methodology. Now, however, in the past 6 months the Adjustment has shifted to a negative bias.
3. You are right that we don’t know, by definition, where the adjustment/error comes from, but we can make some guesses. It is pretty safe to assume that it is NOT coming from inventories. Inventory and Refinery Input are the most reliable metrics and inventory flows are very small for such large errors. For November, Stock Flow was 557 kbpd and Adjustment was -315 kbpd. There is no way that such large 60% error will pop-up. Also, with a persistent bias over six months, you would accumulate a humongous deviation in Stock, this is simply not the case.
4. For awhile I thought the error is mostly coming from Exports. That’s the weakest link in the data collection, as it comes from Customs, and they don’t have the same definitions as EIA. That’s still a high probability, IMO.
5. Lately, however, I have been warming-up to the idea that a large fraction of the error may be coming from the production estimates (914).
In any case, we are missing barrels on a consistent basis over the past 6 months, whether EIA underestimates Exports or overestimates Production, or both.
Good note, KDIM. (Was sort of wondering about 1…thanks for educating me.)
Point 3 remains though. I have the same concern about assigning adjustment to weekly or to monthly production. There’s an independent estimate of production (and in the 914 case, a pretty strong one). I think you have to look at the production estimate as the production estimate. If EIA finds reasons to believe that 914 is not capturing everything, they can adjust it (there is no the non surveyed portion of the estimate). Yet, they have not changed the model yet.
I find it a lot more likely that there are errors in exports, imports, or refinery runs. After all, there is a lot of blending going on. There’s drip gas. There’s diluent in tar sands WCS. There’s refineries selling distillate cuts (extra light or extra heavy) and running it through their downstream processes (or even occasionally going into their coker/visbreaker, or even tower). There’s a lot of complexity and hydrocarbons slopping around in the Gulf Coast megaplex. I actually think that’s a more complex system/problem than just what comes out of the 3 phase separators on well pads.
ANON,
Thanks.
The 914 Estimate is indeed a pretty good one, but there is a bit of wobble . The “estimated” portion is for the small producers and there has been a massive wave of consolidation in the past 6-12 months. As small producers get acquired, big producers report higher production, and EIA has to be on top of that and delete the small producers from their database in a timely manner. It is a source of error, and according to EIA is the main source of error to the 914.
EIA was created at a time when USA was a major importer of oil, mostly to track Imports and what happens to them (Refinery runs and Stock changes). Their methodology in that regard is well worked out, they have long-standing relationships with the overlapping set of Refiners, Importers, Storage operators, and that data is very trustworthy.
The Production boom is more recent, and there is a huge and constantly changing number of producers that they need to track. The Export boom is even newer. So if I have to look at which categories are most wobbly I’d say 1. Exports and 2. Production. and Production gets trickier to track when there is a lot of M&A activity.
Kdimitrov,
Since 2015 has there been a big change in merger and aquisition activity in the US? Has there been a significant difference from November 2022 to November 2023? If there was your explanation would make sense based on the data, but I am not sure there is much evidence this is the case. Interesting hypothesis though. I agree the exports may be a weak point in the EIA reporting.
Note also that there is a distinction between the PSM and the 914. The 914 is the source for production data for the PSM, but the 914 is only a production report, it does not consider imports or exports to my knowledge.
Dennis,
Absolutely, yes. 2023 is a record M&A year.
EIA is well-aware of it and is trying its best. You can see the evidence in the file that you linked here. If you go to Texas, for example, you will see that the “estimated” portion shrank while the “reported” portion increased. So they are reflecting it, the question is whether it’s done to a full degree…
This discussion here concerns small volumes, however, a small error could make a huge difference in narrative. If only half of the missing barrels in the Adjustment come from Production, that’s 150 kbpd, or ~1% of total production. However, this 1% is the difference between “U.S. shale oil continues breaking all records” to “U.S. shale oil is done and in decline” headlines. It’s a silly world, but that’s what it is.
PS. Yes, 914 is the form used for reporting production, on which production in PSM is based. Some, including myself sometimes, call the PSM “914”, which is wrong, but is just to distinguish it from the Weeklies, which are not based on 914 reporting.
Kdmitrov,
It is a record year in terms of dollars for the transactions, but I wonder if it is really all that big in terms of barrels of production as that is the number that matters for production reports. In any case, we will know in 12 months or so if you are correct. My guess is the error will remain around 1% or less for the 914 estimate vs final state estimates.
Here is ratio of 914 survey to 914 estimate for Texas from comp-stat-oil file. Sometimes the survey data gets revised and the estimates for the most recent few months will change as a result.
Kdimitrov,
Also note that the large value of oil and gas M and A activity was due to large transactions by oil majors where they bought very large independent producers (as in the merger of XOM and Pioneer), I doubt the EIA has messed up those companies as they are a large part of the 914 survey and the number would be way off. As to aquisitions of small independents, the rate that this has occurred recently may be no different from the Jan 2015 to November 2022 period where the cumulative total of 914 estimate output and State data for Texas and New Mexico is well under 0.1% error.
So we continue to disagree on 914 estimates suddenly becoming inaccurate compared to the past 7 years, time will tell.
JB
The negative adjustment factor is used to balance the in and out oil flows wth inventory changes and does not change the production number. It is an artificial construct to make things balance.
To save folks’ time, I’ll just reeiterate from KD’s post instead of saying the same conclusion twice:
“In any case, we are missing barrels on a consistent basis over the past 6 months, whether EIA underestimates Exports or overestimates Production, or both.”
The 914 report is out.
https://www.eia.gov/petroleum/production/
NOV2023 C&C was up 84,000 bopd. (OCT was revised down 24,000 bopd though.) Anyways, it’s a new record. So much for those who thought we wouldn’t get back to 2019 levels.
I didn’t look which states were revised, but versus the revised OCT, FGOM was down about 75M. With TX and NM up very significantly, and small gains in ND, CO, WY, OH. And random states down small amounts).
On the gas front, we were up 2 BCF/d. Excluding AK (which makes sense), we were up 1.7 BCF/d. The App (PA/WV/OH) drove most of the increase.
Comparison of TX plus NM C plus C from 914 estimate vs State data. The EIA has done pretty well from Jan 2015 to November 2022, my guess is that the 914 estimates from the past 12 months will also prove relatively accurate.
Dennis,
My understanding is that for some portion of 2014 and 2015 TX production was mis-estimated by EIA and was only corrected with the August 2016 PSM. Some quants picked it up from the prelim RRC data in “real time” and were proven correct.
I think we are in a similar situation now.
KDimitrov,
My understanding is that the initial 914 estimate is only revised if there are changes to the 914 survey data in subsequent months, but perhaps I am mistaken. When I look at the oldest comp-stat-oil file on my computer (from Dec 2018) the 914 estimates are the same as the current file up to Sept 2018 (last date covered on Dec 2018 file).
In short I disagree, but time will tell. Do you think the EIA 914 is underestimating or overestimating actual output in Texas and New Mexico? Over the Jan 2015 to Nov 2022 period the ratio of EIA 914 to state data (cumulative) is 100.04%, so a pretty small error rate.
The new methodology for 914 estimates has been in place since 2015, see
https://www.eia.gov/petroleum/production/pdf/eia914methodology.pdf
The methodology says they do eventually overwrite, using state data. But your check would seem to argue to the contrary:
“Replacement of estimates with state data
Given the revision schedule of the natural gas and oil production estimates (i.e., each month data are
released for the current month and revised for the two previous months), once a year the estimates for
the two previous years for natural gas data and ten previous years for oil data are replaced with final
state data. The timing of the revisions/replacement of estimates with state data is done in conjunction
with the publication of the Natural Gas Annual (NGA) for natural gas production estimates and the
publication of the Petroleum Supply Annual (PSA) for oil production estimates. The NGA is normally
published each September while the PSA is normally published each August.”
Anonymous,
The “EIA final estimate replaces the 914 estimate with the state estimates that are more than 12 to 18 months old (this varies as lag times for complete data is different in different states).
In my chart I used the 914 estimate rather than the EIA final estimate, see the comp-stat-oil file at the 914 page at EIA.
Dennis
What is the source of the state data?
Ovi,
I used the 914 comp-stat-oil file.
https://www.eia.gov/petroleum/production/xls/comp-stat-oil.xlsx
Better to use data directly from state agencies, but have not updated for a while. Also note this is the initial 914 estimate column, not the “EIA Final” column, after 12 or 24 months (depending on month of year) the EIA Final data is updated with the state data, this happens once per year in August (for most recent comp-stat-oil file the Texas data has been updated in the EIA Final column through May 2022.
Dennis
Thanks. Wasn’t clear on the nature of 914 data.
EIA also acknowledges increased GOR and gas production
https://www.eia.gov/todayinenergy/detail.php?id=61043
Two strange things about the sudden increase of 30.1-40 API oil in the past 3 years, i.e. Jan. 2021-Oct. 2023 in Texas only
1. There is no obvious decrease of averaged API in Texas oil, actually, 12 month average API increased about 0.1
2. If you plot out all the APIs crude categories together, they don’t seem to confirm the above 0.1 average API increase, i.e. the average API should decrease.
3. To make up for this discrepancy between above 1 & 2, I wonder if EIA is counting in the Natural Gasoline increase in the C&C. Or there is an obvious increase of API in the volatile oil and condensate with initial API above 45. This is described by McCain in this 5 fluids API&GOR behavior figure I posted above in this big thread.
I can not upload the plot so I put the plot and the file of McCain paper in Mike Blog.
https://www.oilystuff.com/forumstuff/forum-stuff/the-last-word-on-the-eia-s-contention-that-texas-oil-is-becoming-denser
GOR went up 50%, while ass gas went up 200%. To me, that says most of the driver is growth in oil, versus getting gassier. At a 3:1 ratio (150%:50%).
Yes, we have gotten gassier. But that’s not strange, especially given the field is getting more mature. “As more oil and natural gas are released within a well, the GOR tends to progressively increase, increasing the volume of associated natural gas produced per every barrel of oil. ” It’s a normal life cycle development.
Wow! So, to be clear, ANON, or whatever your name is, rising GOR is up OVER 50% actually, but is not unexepected because of reservoir maturity. An advanced state of maturity, I might speculate, but ” normal in the life cycle of development.” At what point DO you become concerned about maturity and GOR? Never mind, I don’t care.
I am, however, enlightened and very excited. I had 18 people in my graduating high school class and I was in the top 10% of that class. I now feel certain I too can become a petroleum engineer, if only you will share where YOU went to school. Man, this is great !!
To be clear, I don’t need a referral, just the name of the school. Clearly anybody can get in and, after all, I was in the top 10% of my class.
And to be VERY clear, I don’t want to know where you learned your manners. You have none. Goats have better manners…and they don’t typically have names either.
So just the school, even if it is just in Arizona and I can enroll on the internet. Thanks for everything.
I am excited ! When I get to be a PE can I use the term, ass-gas, just like you?!!
you and Mike are in a bitter exchange, and I kinda want to give some ammunition for Mike — about the water effect on GOR and API.
The water effect on GOR is most severe for oil and gas in reservoir, remember the days with MissLime in northern OK, where there is some oil and gas in the beginning but with more water coming out, the GOR just shoot way way up and oil disappeared, and the oil just got a lot more denser and viscous — I believe that is what Mike referred to, not the small water impurities in pipeline. I got my first PE education in OK MissLime in 2014-2015 and learnt the above.
No, of course I was not referring to BS&W in the pipeline. Thanks. His was a stupid allegation designed to make me lack credibility. He insulted a smart friend of mine, someone who knows what she is talking about.
I personally was referring to the role increasing WOR has in an SVR and what that does to oil density over time, the ability to transistion from one fluid phase to another in a high GOR, natural depletion process of gas depletion, oil expansion shale. I am trying to learn too, starting from scratch; it does not make me “silly.” I have since decided, with the help of others, that heavy metal contaniments in Permian HZ oil IS a marketing problem, but not likely contributing to a change in oil density.
This fella is only capable of making a point if he is insulting and dismissing of others, like he was to Mr. Kaplan. I am sorry my comments to this person make people uncomfortable; that is not my intent.
There is one person, under various names, who gets a kick out of poking fun at the “peakers.” Usually shows up when US production is rising.
Best not to take too seriously. Fun to spar with, but you aren’t getting anywhere.
Mike.
An experienced oilman talking about oil has never made me feel uncomfortable.
Mike,
You are fine, happy to have you teach us.
Chart below uses State data most recently reported by the RRC of TX and OCD of NM and compares with the most recent 914 estimate for TX and NM C plus C. Note that the data from the States is incomplete after Dec 2022 and as the incomplete data fills in these estimates will be revised higher over the next 11 months. It is likely that the 914 will prove quite accurate in comparison to the final state estimates as has been the case from Jan 2015 to Dec 2022. Note also that in 2022 the EIA 914 estimate was mostly lower than the state estimates, which is the opposite of what most people assume.
WeekendPeak posted this link on the Non-Petroleum section. However, it is all about peak petroleum and peak energy and should have been posted her. So I am doing just that.
2025: A Civilizational Tipping Point
To the point of diminishing returns, resulting in a relentless economic contraction, making any transition to any other energy source impossible. The Journal of Petroleum Technology, the Society of Petroleum Engineers’ flagship magazine has published an article in 2023 saying just that: “When the energy required for the extraction and production of these liquids is taken into account, the net-energy peak is expected to occur in 2025″ at a level of 400 PJ/d [1]. In the foreseeable future, the energy needed to produce oil liquids could approach unsustainable levels, a phenomenon called “energy cannibalism.”
Peak oil happened in 2018-2019. Net peak energy is expected to happen in 2025. We are fucked, royally fucking fucked. Learn to live with that fact.
Thanks
Rgds
WP
I wonder when net energy peak for global coal was/will be?
I have no idea. Does anyone track world coal production? It would have happened a few years ago were it not for China building new coal plants. Is China’s increase greater than the rest of the world’s decrease?
Ron,
World Coal output is tracked annually by Statistical Review of Wold Energy.
Is there any more bitter irony than the US exceeding its record production level during the post-peak era?
Mike B, Nice comment deserving a bit of thought, thanks Phil
“Is there any more bitter irony than the US exceeding its record production level during the post-peak era?”
And still no one comprehends that the USA only extracts 12-13 million barrels per day while consuming 20, believing the propaganda that we are a net exporter.
Paul,
The crude input to refineries is roughly what the US consumes, that is about 16 Mbpd, so our net imports of crude are roughly 3 Mbpd.
Yup, the charade is pretty transparent. Consumption = 20, while extraction only 12-13.
Tried to get ChatGPT to follow the logic
https://chat.openai.com/share/82e9f846-edbb-42e4-8db7-5c22af88ad15
It created a Sankey diagram showing the deficit
ChatGPT doesn’t make the best Sankey diagrams as the widths of the arrows are awkward but it tries. More detailed below
“To create a more detailed Sankey diagram that differentiates between inputs from domestic crude oil extraction and those from “other” non-crude oil sources (such as natural gas liquids (NGLs), biofuels, and imports of refined petroleum products), we need to incorporate these additional categories into our flows.
Let’s assume some illustrative figures for these categories to enhance the diagram:
Domestic crude oil production: 12 million barrels per day (mbd)
Other domestic sources (NGLs, biofuels, etc.): 2 mbd
Imports of crude oil: 6 mbd
Imports of refined products: 1 mbd
Exports of refined products: 3 mbd
Domestic consumption: 17 mbd (adjusted to include consumption from all sources)
With these figures, we’ll create a detailed Sankey diagram that includes these various sources and their contributions to the total oil and petroleum product flows in the U.S.
Output image
The detailed Sankey diagram now includes the differentiation between inputs from domestic crude oil extraction and those from “other” non-crude oil sources, such as natural gas liquids (NGLs), biofuels, and imports of refined petroleum products. Here’s how the flows are represented:
Domestic Crude Oil: 12 million barrels per day, representing the primary source of oil.
Other Domestic Sources: 2 million barrels per day, illustrating contributions from NGLs, biofuels, and other non-crude sources within the U.S.
Imports of Crude Oil: 6 million barrels per day, showing the significant portion of crude oil that is imported to meet demand.
Imports of Refined Products: 1 million barrels per day, indicating additional imports in the form of refined petroleum products.
Exports of Refined Products: 3 million barrels per day, representing the export of U.S.-refined petroleum products.
Domestic Consumption: 17 million barrels per day, adjusted to include consumption from all sources, highlighting the total demand for oil and petroleum products within the U.S.
This visualization provides a more comprehensive view of the U.S. oil market, highlighting the diverse sources of oil and petroleum products that contribute to meeting domestic and international demand.”
Here is a version of a Sankey diagram created with an online tool http://www.eco-data.fr/tools/sankey/sankey.php
The left is domestic extraction
The right is domestic production
The top is imports
The bottom is exports
This is a start and the flows can be made more details with intermediate refining connections. As it stands, it’s not quite right, but eventually all flows are partitioned and tracked so that cumulative flow is conserved.
Paul,
Note that if we exclude petroleum gas and biofuel, consumption of C plus C is not 20 Mb/d, it is about 16 Mb/d (the crude input to refineries).
Dennis, People are accustomed to seeing the 20 million barrels per day number as that is on the USA consumption chart that EIA regularly updates
US also export refined fuel, i.e. gasoline, diesel
US is a net negative importer of crude and fuel combined,
https://www.eia.gov/dnav/pet/pet_move_wkly_dc_NUS-Z00_mbblpd_w.htm
“US also export refined fuel,”
Exactly, they do that on IMPORTED UNREFINED crude oil which they relabel as DOMESTIC production after REFINING and thus can spout propaganda via creative bookkeeping on how the USA is self-sufficient.
Sheng Wu,
Net exports of refined fuel is not very large, but it makes things simpler to just focus on crude. Also we could focus on finished Petroleum product consumption in the US which was about 14.5 Mb/d in 2022 for the main products (gasoline, distillate and jet fuel).
I still remember 9 months ago, when people said the US was post peak. What makes you so certain the world is post peak?
Been reading this site and Oil Drum for years.
First time I have seen this terminology “energy cannibalism.”
From our book, discussing EROEI:
Energy cannibalism is a good turn of phrase, but grisly. Just watched Society of the Snow a few days ago.
According to Dennis global oil demand has peaked and Ron almost agrees with the Oil Shock graph Dennis posted in his last post.
If this is the case and electric vehicles have made peak oil practically irrelevant perhaps this site should expand to what Richard Heinberg termed peak everything.
Today nobody who had petrol 10 years ago is having to do without. People are wallowing in excess.
https://www.delish.com/food-news/a46570808/icon-of-the-seas-cruise-ship/
But there are far more urgent peaks happening already.
https://www.unesco.org/en/articles/imminent-risk-global-water-crisis-warns-un-world-water-development-report-2023?TSPD_101_R0=080713870fab2000f7b9fbe75f974078e937f2dfaab8dfef9c405ec19183b9f2ab1929365e84e55708709793fb143000115091367e3e43c4d764029fbf9846af3fd429f60c9a0f9e562f57d071b428086b6092d17fca7677547bb277df840e86
China is taking water from rivers that should flow to other countries.
https://weather.com/en-IN/india/news/news/2019-07-10-india-rivers-drying-up-what-can-we-do
The situation is becoming critical in many other countries.
Of the peak essential commodities we need. Oil is no longer the most immediately critical. Water comes first then soil then oil.
Yes no one is ‘doing without’ petrol. But I can assure you that people of the world at large can afford way less than they did 10 years ago. People will still go on ridiculous cruises in ten years, while even more will be poorer. In 50 years though…
Seideman
Some people can afford way less because food inflation has ripped a whole in their budget. Food inflation has been so high because of droughts in various countries has led to failure to produce the food that the growing population needs.
Oil is cheaper today than it was in 2012.
Water in most countries is more expensive and in some countries much more expensive over the same period.
Globally there is a water crises not an oil crises
Charles,
Under a specific set of assumptions, demand may have peaked, but note that assumptions about the future are incorrect roughly 100% of the time. In short, I have not predicted anything, I created a scenario with very specific assumptions which are highly unlikely (virtually certain) to be incorrect.
Most people probably understand this and I did not think it required explanation.
Dennis
You have changed your view on global oil production peak 3 times.
You have changed your mind on demand peak 3 times, you have now said that oil demand will peak this year.
Nothing has changed in the last few years to justify these changes, it simply reflects the fact that you don’t know which ducks to put in the right order.
It is utterly pointless making predictions and then saying it is wrong. You end up not being taken seriously.
“You end up not being taken seriously.”
Charles, I’m afraid it’s you that aren’t being taken seriously.
Your ranting and apparent hostility towards people who don’t agree with you isn’t going to persuade many people that you have it all figured out, and Dennis and others “don’t know which ducks to put in the right order”
Peak oil will be exacerbating all of the rest and magnifying their effects and its already happening, in all of the countries not major oil producers.
All except the two smallest of the recent leases added for GoM had lower production in November, with Mad Dog having several days of turnaround. I’m not sure if Mad Dog has the potential to increase above its previous maximum and Vito should hold a plateau for a couple of years, but all the others look to be now in decline. Water cut in Taggart is rising very quickly and it is also impacting Spruance and Khaleesi. Of the new leases expected Rydberg is some months late, no news on Whale (also now late wrt original Shell announcement at time of FID) or Shenzi North yet. The Main Pass pipeline seems to be still out, so about 70 kbpd offline.
I still would like a retrospective on how we hit 2.0 MM bopd instead of going down to 1.5 (from the 1.7ish in 2017). Still remember your comments at the time.
It’s not just that you were wrong. I can give you a pass. But still. What did we learn? I’m curious. What happened? What did you miss? And given that you did miss something, how have you adjusted your methods? Have you?
I’m concerned that the bottoms up method biases low. If you haven’t done anything to change your methods, will you repeat the past errors?
Anonymous,
It is not possible to anticipate future discoveries or future plans by oil companies, or if output will be higher or lower than projected by the oil companies themselves. The future is difficult to predict accurately.
We do the best we can with information available at the time the estimate is made. Personally I think Mr Kaplan’s information has been very enlightening and I thank him for sharing his knowledge here.
Go elsewhere if you can find better information at no cost.
I think he’s got massive information, but at the end it becomes a splat of area charts and field names…doesn’t translate to bringing people (cornies or peakers) up to speed.
Also, it’s not just that he was wrong…but that he massively scoffed at EIA, saying he had no idea what they were doing. And whatever they were doing, it ended up being right.
In any case, we still don’t know WHY his prediction was off and EIA was right. Maybe it was new fields or discoveries. But I find that hard to believe in the GOM with long lead times. More likely that his method is too pessimistic about tiebacks or the like. In any case, interesting to find out. (And interesting to see if he’s modified his method…haven’t heard that/how he did.)
Anonymous,
The EIA also gets stuff wrong, forecasts of the future are often incorrect, anyone who is surprised at this has not looked at historical forecasts.
Here is an example of the US tight oil reference scenario in the EIA’s AEO 2012 compared with the recent EIA official estimate of US tight oil output. One might surmise that the EIA didn’t know what they are doing.
Yeah, noted. You said that before. But that still doesn’t explain the lack of a retrospective on HIS OWN predictions.
Thanks for this reply Dennis, and George, I think a lot of us let Dennis reply on our behalf
Further up in comments, there was a discussion of the EIA’s Adjustment factor. Attached is a calculation that shows how the numbers from the Weekly Petroleum Report, Jan 26, are used to get the inventory Ins and Outs to match the weekly change in crude inventory.
The basic assumption the EIA makes is that there are errors in all of the numbers it collects. The adjustment factor corrects the errors in the numbers to make everything nicely balance.
Hi Ovi, Transfer to Crude Supply was put in place recently if I’m not mistaken as well?
JB
Correct. The intend was to reduce the size of the adjustment. On occasion, like this week, it is smaller than previous adjustments in the 1.5 Mb/d to 2.0 Mb/d range.
https://cleantechnica.com/2024/02/02/the-us-added-1-2-million-evs-to-the-grid-last-year-electricity-use-went-down/
Next time you only pay $3 for a gallon of gas, thank an EV driver.
We should be very clear that if it were not for OPM, federal stimulus, QE, low to no interest rates, several trlliion dollars of debt associated with the last administration, and the current one… without the growth before profit business model, and the pure fact that there was NO risk whatsoever associated with drilling HZ laterals in a vast area where you could not fail, people like Anonomous etal., ReservergrowthRulz, David Blackmon, Michael Lynch and countless other members of the peak oil defamation league would be silent, at home, sitting in the recliner, watching Oprah reruns. Peak affordable oil would be very real but for the facade of US tight oil and we would never hear from them again.
A new Open thread reporting on US November Oil Production has been posted.
https://peakoilbarrel.com/another-new-high-for-us-november-oil-production/
A new Open Thread Non-Petroleum has been posted
https://peakoilbarrel.com/open-thread-non-petroleum-february-2/