The Short Term Energy Outlook (STEO) was published by the US Energy Information Administration (EIA) on February 7, 2023. For most nations except the US and total OPEC crude oil output the forecast for future production is for total liquids only. In this month’s post I will try to estimate the crude plus condensate (C+C) output indicated by the STEO total liquids estimate for the top 10 non-OPEC producers and the World minus the top 10 non-OPEC producers. I will focus on quarterly output so that we can compare with recent OPEC estimates for World supply and demand in 2023. The estimate for C+C uses historical output of both C+C and total liquids and uses the average of the ratio of C+C to total liquids for the past 12 quarters (2019Q4 to 2022Q3) for the top 10 non-OPEC producers (except the US where a C+C forecast is provided) and for the World minus the top 10 non-OPEC producers. In most of the charts that follow the units on the vertical axis are kb/d of C+C output.
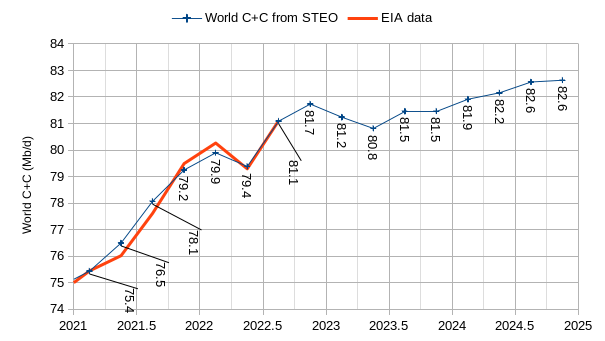
The chart above is an exception with output in millions of barrels per day (Mb/d), the red line is historical quarterly output from the EIA and the blue shows the estimated output using the ratios based on the past 12 quarters applied to the total liquids output from 2021Q1 to 2022Q3. The estimate is fairly good, especially for the most recent two quarters of 2022 (Q2 and Q3).
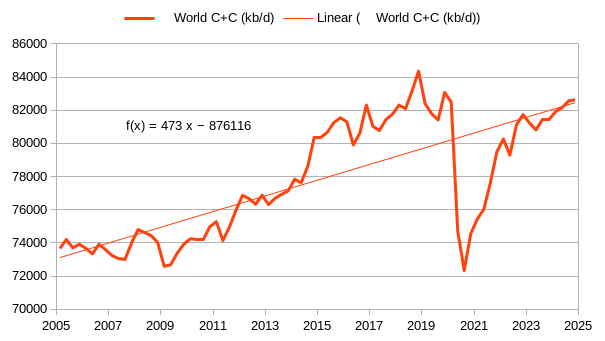
The chart above shows longer term historical data with the STEO projection starting with 2022Q4. The average annual increase in World C+C output over the 2005Q1 to 2024Q4 period (20 years) is about 473 kb/d. The linear trend line on this chart and several charts below uses ordinary least squares (OLS) regression on the data from 2005Q1 to 2024Q4 to estimate the trend. Note that over the 1984 to 2019 period that average annual rate of increase in World C+C output was about 800 kb/d, thus the pandemic and the slow recovery for the past 3 years, plus the two years of projected output in 2023 and 2024 has substantially reduced the average annual rate of increase. In addition, if we consider the 20 years from 2000Q1 to 2019Q4 the average annual rate of increase in World C+C output was about 900 kb/d.
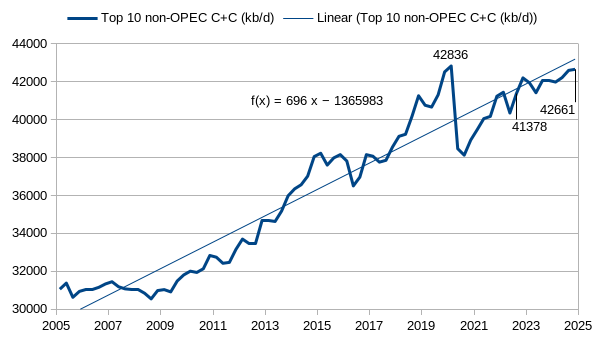
The top 10 non-OPEC oil producers as of 2022Q3 are US, Russia, Canada, China, Brazil, Norway, Mexico, Kazakhstan, Qatar, and Oman. Since 2005Q1 these 10 nations will increase their collective C+C output at an average annual rate of 696 kb/d through 2024Q4, if the EIA STEO forecast proves correct. The estimate has output increasing by around 1300 kb/d from 2022Q3 to 2024Q4, output will remain just under 200 Kb/d less than the 2019 quarterly peak in the last quarter of 2024.
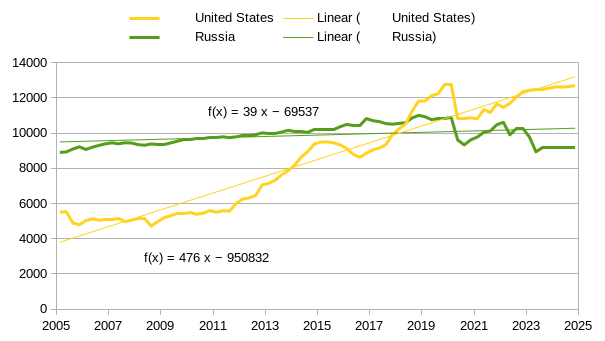
Over the period from 2005Q1 to 2024Q4, US C+C output increases at an average annual rate of 476 kb/d per year, very similar to the World C+C rate of increase (473 kb/d per year, see figure 2), Russian C+C output is relatively flat over the period at 39 kb/d per year (when using the least squares trend over the entire 20 year period.)
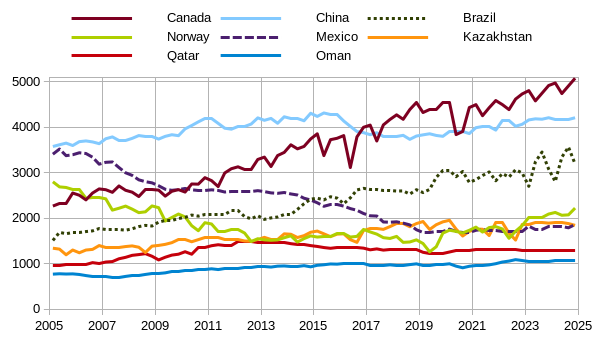
In the chart above notice that since 2019 the top 4 producers in the chart (Canada, China, Brazil, and Norway) in 2022Q3 have increasing output while the rest of the producers have relatively flat output from 2019 to 2024. (Also note that output in figures 2 through 6 are all in kb/d and the output is C+C in all 5 charts).
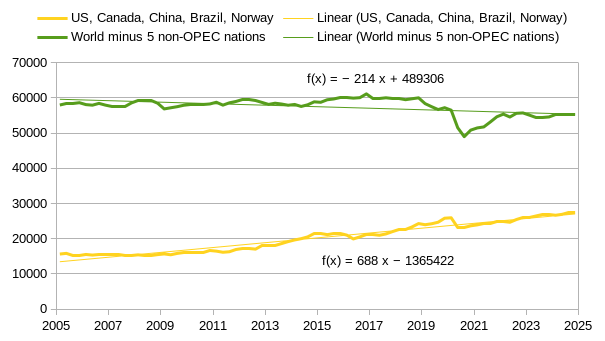
The chart above shows the combined C+C output of 5 non-OPEC producers (US, Canada, China, Brazil, and Norway) that have an increasing trend in output over the 2005 to 2024 period, their average annual increase in output is about 688 kb/d per year, just slightly less than the Top 10 non-OPEC producers (with an average annual increase of 696 kb/d over the same period). The rest of the World excluding these 5 nations will see an average annual decrease in output of 214 kb/d over the 2005 to 2024 period, if the STEO forecast is correct. If we deduct the average annual increase from the US from the 5 nation group, we find the Canada, China, Brazil, and Norway combined average annual increase in C+C output is about 212 kb/d, nearly balancing the decrease from the rest of the World.
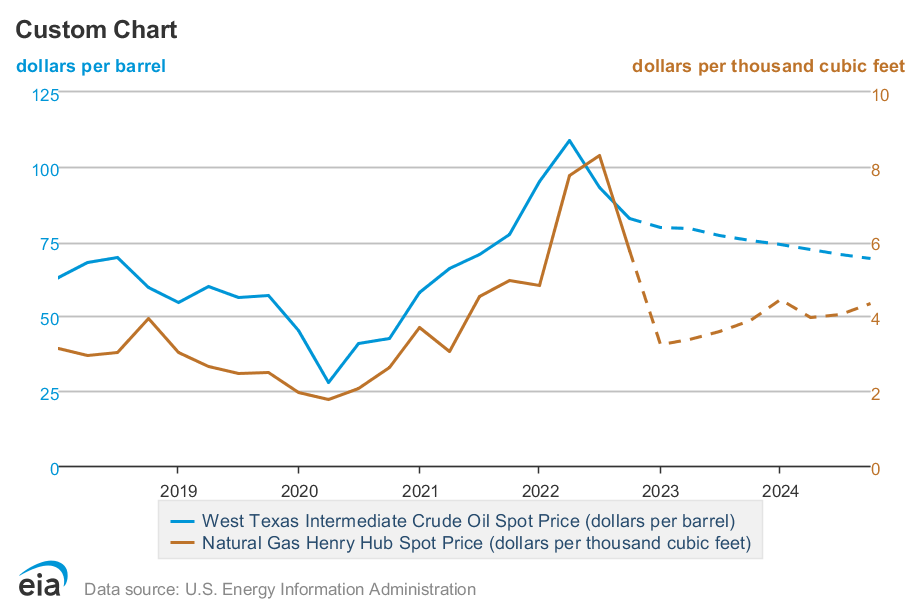
The chart above considers the WTI oil price and the Henry Hub Natrural Gas price forecast from the STEO (see this link for more detail.) In 2023 and 2024 the WTI price falls while natural gas prices are expected to rise after reaching a low in 2023Q1. These forecasts are revised monthly.
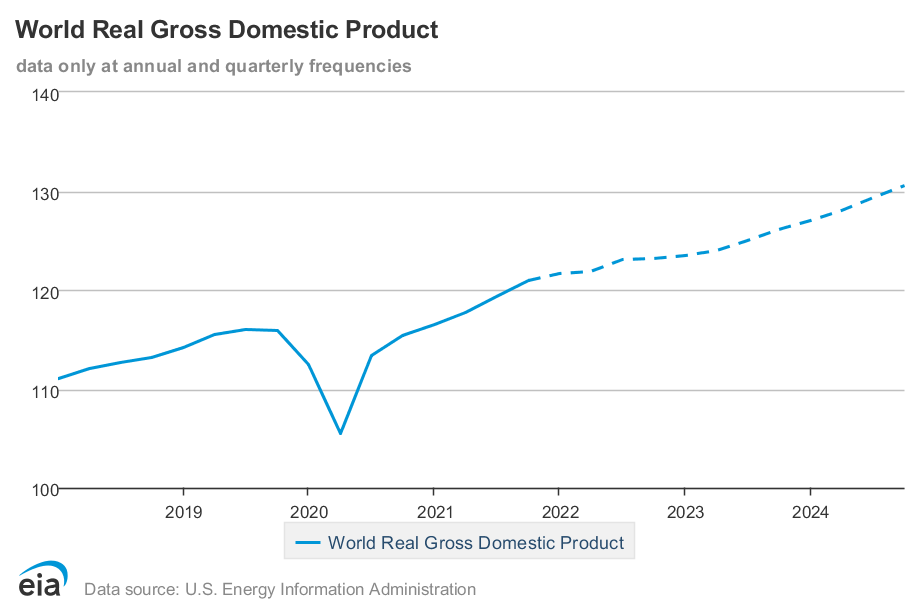
World Real Gross Domestic Product (which is adjusted for expected inflation) rises slowly in 2023 and grows more quickly in 2024. For greater detail see this link.
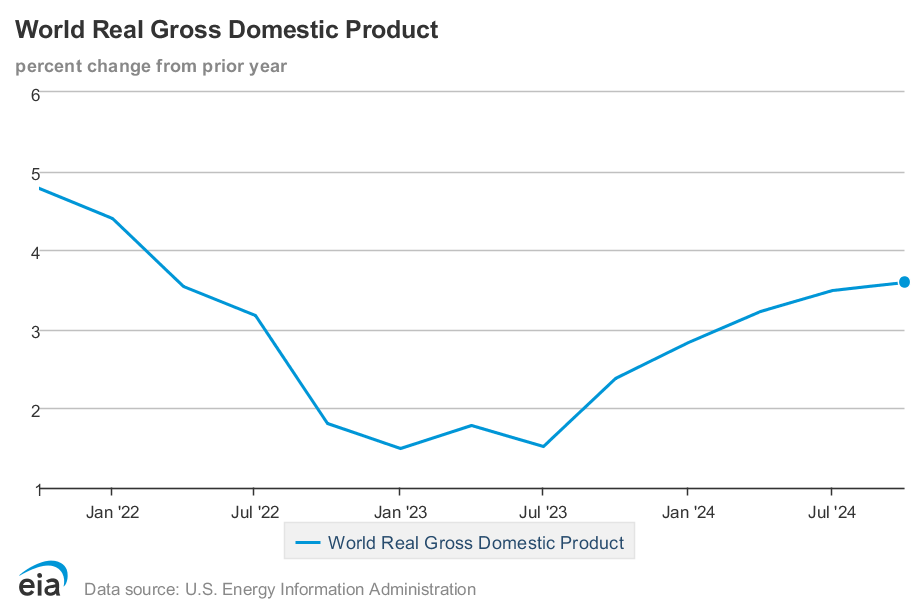
The chart above shows the growth rate for World Real GDP by quarter from 4 quarters earlier (to give an annual growth rate). More detail at this link. From 2022Q4 to 2023Q3 the annual growth rate of World Real GDP is under 2%/year and rises to over 3% per year by 2024Q2.
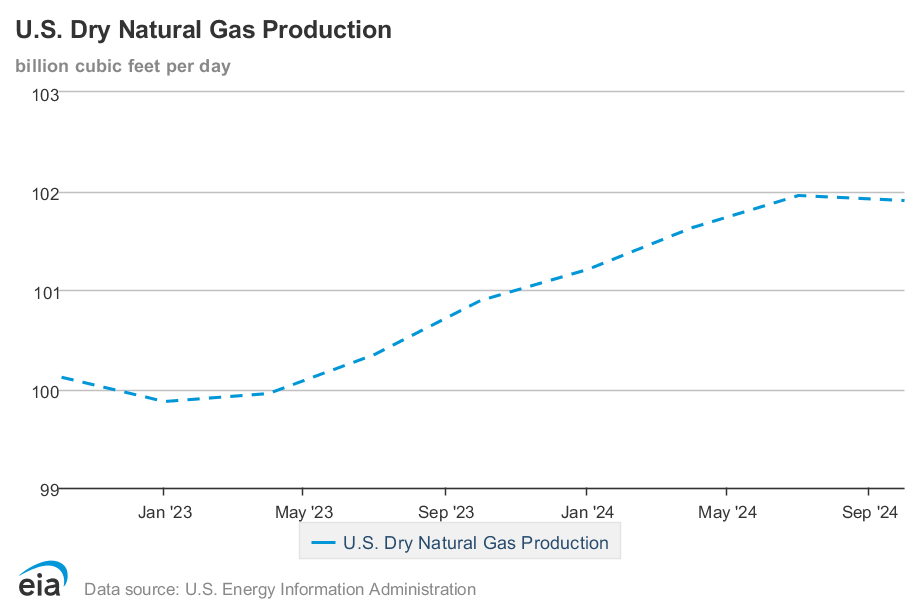
The EIA expects US natural gas production to rise by about 2 BCF/d from 2022Q4 to 2024Q4, details at this link. The EIA does not forecast World natural gas production in the STEO.
A quick comparison of OPEC MOMR expected output (from February MOMR) and the February STEO from the EIA can be done for total petroleum liquids only as OPEC does not estimate C plus C output for non-OPEC producers and provides crude only data for OPEC members (leaving out a specific condensate estimate).
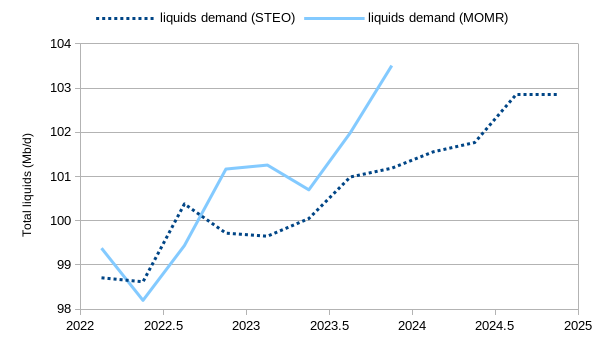
OPEC has a higher estimate of World Demand for Petroleum liquids especially 2022Q4, 2023Q1 and 2023Q4, the OPEC forecast ends at 2023Q4 while the STEO forecasts to 2024Q4.
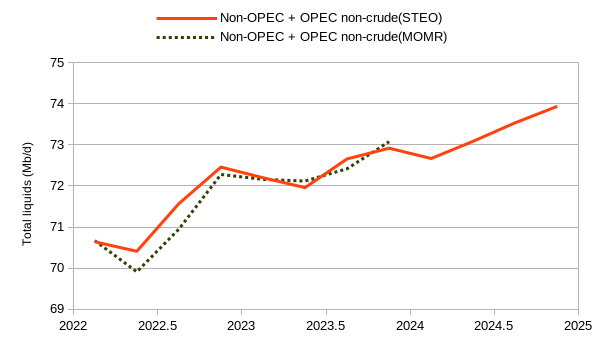
The EIA and OPEC have similar supply estimates for non-OPEC liquids plus OPEC non-crude liquids for 2023.
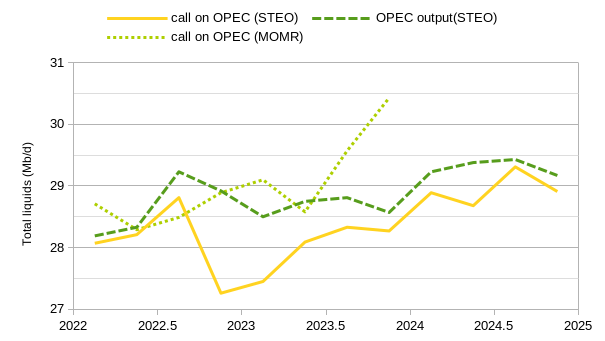
The difference in the “call on OPEC” which is the difference between World liquids demand and the supply of non-OPEC liquids plus OPEC non-crude liquids is mostly due to the different demand estimates. The EIA also forecasts that OPEC will produce more than is needed to balance supply and demand in 2023 and 2024. If the STEO forecast is correct, it suggests a build in World oil stocks over the next 2 years.
251 responses to “Short Term Energy Outlook, February 2023”
Dennis
I think that both Fig 2 and 3 are distorted by the rise in US production. If I were home I would look to see the influence on the US to get a more realistic view of world and Non-OPEC production going forward from 2022.
Now that we are back to normal production, the yearly increases for world, Non-OPEC world without the US, start to slow. The 473 kb/d/yr and 696 kb/d/yr are too high.
Ovi,
Yes if we exclude the US, World output would not have grown at all, I tried to indicate this in the post, but I was not clear. The trend without the US output would be -2.7 kb/d per year.
The short term trend from 2022Q3 to 2024Q4 is an annual rate of increase of 438 kb/d for World less US, based on STEO estimates.
Top 10 less US 2022Q3 to 2024Q4.
Dennis
Thanks. We will have to wait for a while to see how world without US does.
Ovi,
I think the US will gradually increase production over the next 6 years. Over the next 3 years I expect US tight oil output will increase to 9500 kb/d in Dec 2025 from about 8200 kb/d in Dec 2022, roughly 1300 kb/d increase over 3 years or an average of 433 kb/d per year. The scenario below is my most recent tight oil scenario and my best guess.
Dennis, I have no idea how accurate your prediction for the Permian really is. Perhaps it is quite accurate, I have no idea. However, your prediction for the rest of the tight oil world defies common sense. To expect the production for “tight oil less Permian” to remain almost absolutely flat for over a decade is just not realistic. It could increase a little but it is far more likely to decrease. But to expect it to remain flat for that long, to put it mildly, is just not realistic.
To Dennis:
I tend to agree with Ron about your non-Permian tight oil Dennis. While flat for a decade is possible, I’d give you 8/10 odds of a decline beginning to develop rather than flat.
No professional opinion on the Permian yet, but one is in the making.
Ron and Reservegrowthrulz,
US tight oil less Permian basin, scenario unchanged, just a different scale for the chart. Decline begins in October 2024 with near term peak at 3360 kb/d for first 10 months of 2024. Vertical scale on chart below is US tight oil output minus Permian basin tight oil output in kb/d.
Dennis
What does the model assume regarding frac spreads. I get the sense from looking at the rig count that completions are not growing fast in the Permian.
Ovi,
The Permian scenario assumes the comlpletion rate scenario below. I expect oil prices will eventually rise and the completion rate will increase starting in August 2023. It is nearly certain this guess will be incorrect. The model makes no specific assumption about frac spreads and we don’t have this information for specific basins only completion rate from EIA DPR DUC spreadsheet. The most recent month of data (Jan 2023) has Permian completions at 433, I assume a Permian completion rate of 429 from August 2022 to July 2023 in my scenario.
Vertical scale on chart below is Permian new tight oil well completions per month.
Dennis
Thanks. Permian completions have been steady since July. I’ll buy your assumptions out to August and that WTI will rise. I am not convinced that management will ramp up drilling and completions. I think the new completions strategy is steady as she goes.
Ovi,
Perhaps you are correct, if oil prices remain where they are that seems reasonable, many large independents are claiming that their aim is roughly 5% growth in output. My scenario has Permian output growing by about 6.3% per year from Jan 2023 to Dec 2027.
I assume oil prices are relatively low in my scenario (around $80/bo).
I was noticing the completion rate increase of 70 (from 430 to 500) over 18 months (July 2023 to Dec 2025) in my scenario, this is about a monthly rate of increase about 4 new wells per month (430, 434, 438, …, 496, 500).
If we consider the Permian completion rate from July 2016 to July 2018, the annual rate of increase in completions was about 156 per year or about 13 new wells per month.
Ovi,
The scenario below assumes a constant completion rate from Jan 2022 to Dec 2030 for US tight oil wells.
But does it also assume constant production per well completed? Is there no decline as drillers are forced into more marginal production areas? Looking at your chart, you believe there will be a decline in production per well, but not until 2030. So can we assume production per new well remains steady until 2030? Then suddenly all the sweet spots disappear.
Resource cost curves answer your question quite well.
Ron,
I started predicting a decrease in new well EUR in 2012 and every year since then have been revising the decrease forward by one year as for the most part there has been very little decrease in new well EUR. See chart below from Novilabs. At some point we may see a decrease in well productivity over the life of the well, but if the completion rate holds steady overall for the US, with completions from areas that see EUR falling start to fall and other more productive areas replace those we could see something like the scenario I show. Note that the resource estimate of 65 Gb inn this scenario is much lower than the EIA assumes with tight oil in last year’s AEO at 120 Gb from 2000 to 2050.
Thanks, Dennis. Interesting chart.
I think there is a caveat here. The term “new wells” changes over time. Are new wells in 2013 the same as those in 2016 or 2021? Or, were there improvements made over time? Were the fracking technique improved by different fracking pressure, improved proppant, and especially lateral length?
When you ignore these very obvious changes in new wells over time, I do believe you are comparing apples with oranges.
Ron,
The chart above is normalized for lateral length, it is output per 1000 feet of lateral. Other changes are not accounted for such as proppant used per foot of lateral etc. Obviously technique improves over time and knowledge of the play as well.
Dennis,
Your projection out to 2030 is plausible under present conditions, but – as always – price/cost and technologies are ever present and can exert outsized impact.
(Not even gonna get into the socio/political aspects).
As the small, overlooked Uinta Basin should show, increases in output are always possible if techno/price circumstances enable it.
The Powder River Basin is slowly, methodically being positioned to become a significant producing region as infrastructure continues its buildout coincident with the ongoing learning curve proceeding apace.
The biggest non recognized influence will be the enhanced recovery rate – presently pegged at 8%/10%.
As anyone who has been noting my postings on this topic, there continues to be advances in this field and the wider public acknowledgement of success will upend current paradigms.
Have you examined the profile of Zavanna wells in ND? Not just the individual one you previously mentioned, but all of them collectively? It is quite different from what I would consider a “normal” company aggregate production curve.
RGR,
As I no longer follow the Bakken as closely as I once did, I do not have access to the NDIC data.
Bruce Oksol provides daily updates that regularly include items of particular note (which is why that Zavanna well profile popped up).
I have no doubt that …
A. Significant progress has been made in EOR.
B. Many companies – perhaps counter-intuitively to observers – will postpone making any public acknowledgement.
Why so?
One need only look back at EQT’s 2014 announcement of the stupendous 24 Hr IP of the Scotts Run well … an early Deep Utica, ~3,200 foot lateral, 72 million cf IP.
The very next day, EQT’s stock DROPPED 7%.
Reasons for the drop are anyone’s guess, but sensible appraisal would indicate that when vast, vast additional amounts of natgas were recognized to be available below the Mighty Marcellus, its value would drop.
(Try selling buckets of sand down at the beach).
That said, if you have the time, maybe you could describe just what you are seeing in the Zavanna well profiles.
Tnx.
To Coffee:
One well does not a successful EOR project make. Usually. And after checking Zavanna I am trying to determine if they have done anything of value. While daily updates are nice, has anyone announced the economic increase of the production profiles they are displaying? Shutting a well in for a year or 2, lost revenue, pressurize, cost, produce, rapid dropping of oil to the same place the well started within about 18 months (albeit it slightly higher in those 18 months than the otherwise normal decline), and in the process turned the thing into a gas well rather than an oil well. So the question is, other than 18 months of lost production, what is the cost of the procedure they are doing, and how much of turning an oil well into a gas well is just producing the gas injected? As per what appears to be the single example you discussed previously. It certainly didn’t look like a net volume gain, except for the gas involved, and it suspiciously was not declining. So…continued injection to maintain pressure even after oil production fell to legacy levels, or just returning of the injected gas, or…? Dunno, but any economic estimate would be useful to figure out if anything of value happened.
I agree with Ron and I also don’t know how the growth you project will occur with current product prices and current costs. Do you know what the IRRs are for drilling these wells Dennis in this environment? Do you understand why the rig count is dropping now? I just really would like to understand what kind of economics you anticipate to create this curve or is it your reliance on the USGS projected oil reserves? It may climb to the level you expect in 2030 but not with these prices or costs. Just sayin………..
LTO Survivor,
The scenario was based on $3.50/MCF for gas and WTI rising from $75 to $85/b. For the average 2020 Permian basin well at $75/bo at wellhead, NGL sold at 35% of crude price and natural gas at $3/MCF the well pays out at 31 months. Cumulative output at 31 months for the average 2020 Permian well is 267 kbo, 67 kb of NGL and 811 MMCF of natural gas.
Just checked futures price for WTI and NG at oil price dot com.
WTI=$76.87, HH=$2.696/MCF, at those prices the average 2020 Permian well pays out in 32 months, if we assume $13.5 million well cost.
Many Permian producers are planning on 5% annual growth. In December 2022 Perman output was about 4762 kb/d, if we assume 5% growth from 2023 to 2028 we would be at 6381 kb/d in the Permian in Dec 2028. My scenario reaches 6580 kb/d in 2028, but I assume oil prices and natural gas prices will rise from today’s level. The constant completion rate scenario only rises to 5991 kb/d by Dec 2028 for Permian basin tight oil output.
The “World oil demand” is of course definition without real standing, as
“real demand” lacks necessary funding.
And one can never tell when the opportunity for further expenditure may
arise.
Be that as it may, there is problem to meet as the exportable part of
the world oil production diminish.
In case of top 11. exporters it have been at least since 2012.
It going to be real pain in Finland where we refined mostly Russian
sour oil from Ural area.
No more.
https://peakoilbarrel.com/wp-content/uploads/2022/10/747808-1.gif
U.S. drillers cut the most oil and gas rigs in a month since June 2020 – Baker Hughes
Feb 24 (Reuters) – U.S. energy firms in February cut the most oil and natural gas rigs in a month since June 2020, with the gas rig count falling to the lowest since April, energy services firm Baker Hughes Co (BKR.O) said in its closely followed report on Friday.
The oil and gas rig count, an early indicator of future output, fell seven to 753 in the week to Feb. 24. , ,
Despite this week’s rig decline, Baker Hughes said the total count was still up 103 rigs, or 15.8%, over this time last year.
U.S. oil rigs fell seven to 600 this week, while gas rigs were unchanged at 151.
For the month, the total oil and gas rig count was down 18, falling for a third month in a row for the first time since July 2020.
The oil rig count was down nine in February, while the gas rig count also fell nine in its biggest monthly drop since April 2020.
U.S. oil futures were down about 5.3% so far this year after gaining about 7% in 2022. U.S. gas futures , meanwhile, have plunged about 45% so far this year after rising about 20% last year.
What’s happening?
Reverting to logical production levels with an average of WTI around $75-80, after the oil price spike caused by Russia’s invasion of the Ukraine. This level is not a high enough price to substantially increase tight oil out of the Permian with the large increases in material costs and limited experienced labor availability. Why push super hard if the extra profits are not there? Better to keep it steady and work with what you got.
The big production drops in Russia did not happen. Other oil producers are maintaining. We are on the bumpy plateau predicted long ago by Campbell et al
Just a decade or two late. Electrification continues apace and will cap oil prices with no immediate crises present. No one under the age of 50 wants to work in the oil industry as it heads into obsolescence.
“The 8.78mn barrels a day of petrol consumed in the US last year was 6 per cent lower than record volumes sold before the coronavirus pandemic. Consumption will continue to decline in 2023 and 2024, the US Energy Information Administration forecast on Tuesday.”
https://www.ft.com/content/aa1a291e-4293-4b8d-8e33-2b6da4664d35
And sorry folks Europe is not going back to coal ever:
https://energyandcleanair.org/russia-ukraine-war-has-not-led-to-increased-fossil-fuel-consumption-in-the-eu/
Stephen , either they will burn coal or this . Take a pick .
https://www.reuters.com/business/media-telecom/ericsson-lay-off-8500-employees-memo-2023-02-24/
1400 in Sweden .
“Europe shows slight economic growth in final quarter of 2022“
This with 20% reduction in gasoline use.
Damn pesky facts.
https://www.pbs.org/newshour/amp/world/europe-shows-slight-economic-growth-in-final-quarter-of-2022
Stephen , as goes Germany , so goes Europe .
https://www.reuters.com/markets/europe/german-gdp-contracted-by-04-fourth-quarter-2023-02-24/
The data in EU is skewed . Ireland GDP grew by 13.5 % . Can you believe this ? Ireland is only a re invoicing economy since corporate tax is 13% , Apple buys from Foxconn , China , Foxconn ships to New York but invoices Apple , Dublin and then Apple Dublin re invoice Apple USA , Ireland counts this as GDP . Same for many multinationals based in Ireland . Smell the coffee .
https://eurofinancialreview.com/2022/03/04/irelands-gdp-rises-13-5-to-e428bn/
The transition to EVs is happening in earnest in the EU and the results are spectacular. Something similar is likely to happen in China but the data is still too noisy from Covid disruptions.
“The EU’s gasoline consumption fell by 19.3% between August 2022 and
January 2023 in comparison with the common consumption for a similar
months between 2017 and 2022”
https://www.businesslend.com/news/gas-consumption-in-the-eu-drops-by-almost-20-overshooting-15-target/
Consumption is down because EU is in a recession and not because of EV ‘s . Not a healthy sign .
Correlation does not equal causation.
https://www.statology.org/correlation-does-not-imply-causation-examples/
Ice Cream and Shark attacks might correlate but it would take an extreme confirmation bias to tie the two together in causation. The only level of confirmation bias that high is the green new deal camp.
Gosh JT I see your point! How could households abandoning gas cars possibly have anything to do with falling gas use?
JT and Stephen , I work in a logistics company . I can see how much cargo is coming in and going out . How the businesses are faring in real time . The 2600 fired from BASF and the 1400 fired from Ericsson are sure not going to use gasoline . Now multiply that to include the small and medium enterprises that are closing down but you will never hear about them since they employ only 5-10 employees . How about the zombie companies , where the employees stay home but get paid ? Real life examples Alsthom and Bombardier in France ( they are clients ,so I know ) and many all over Europe .
Don’t forget WFH (Work From Home).
Covid was a live fire test of whether companies could function if their employees (non-customer facing) worked from home.
It was a success.
For certain roles ( IT, Accounting, etc) there is no reason people should waste 2-3 hours back and forth to commute to work.
They are happier and more productive working from home.
This is undoubtedly impacting gas/petrol consumption.
Almost everyone I know WFHs 2-3 times a week, some all but 1 day a month.
Thanks Grape Ape , slipped my mind . Next to where I work is a hub in Kortrijk called Benelux Park . Here are all the big IT legal and accountancy firms , EY , Deloitte etc . The office space for ” Te Huur ” and ” Te Koop ” ( For rent and for sale ) after covid is astounding . Not only floors but complete office buildings . They are offering first 3 months free rent to get clients . I will post photos the next time .
Yeah, the results are spectacular all right – those EVs require about 500,000 lb of mined ore just for fabrication of the vehicle and the battery. The amount of energy consumed in both the mining, fabrication, and final assembly of the vehicle and its subsequent use on the road shows no true overall efficiency improvement over ICE vehicles. There was one study done wherein a Tesla model S with the largest offered battery only started to show overall efficiency benefits compared to an ICE after 4 years on the road.
Oh and by the way, just one final thought – who is going to be responsible for cleaning up that mining waste left behind for EV battery production? Any ideas of what that might cost?
In the meanwhile demand for transportation fuel went up by 0.3% in Norway the largest market for EV’s .
https://twitter.com/anasalhajji/status/1630418271760424962
That wouldn’t save the oil industry, even if it were true.
The truth is that EVs are rapidly replacing combustion engines, The car industry is switching technology. That is simply a fact.
People react in odd ways to this technical reality. You get the same reactions to the shift from coal and gas to wind and solar for electricity generation. It’s happening, and quickly. The reasons are basically economic. Saying nasty things about Greta Thunberg, or doubtful hand wringing about environmental consequences among other random emotional outbursts aren’t going to change anything.
Technology changes. We don’t use typewriters or cassette recorders any more. Machine tools went digital decades ago. It isn’t some grand conspiracy, it’s just technical progress.
Stephen “We are on the bumpy plateau predicted long ago by Campbell et al
Just a decade or two late. Electrification continues apace and will cap oil prices with no immediate crises present.”
It is looking more and more feasible for that scenario to pan out, as Dennis has been saying for years.
Every year that goes by without an oil production crash, that isn’t due to demand destruction (pandemic for example), brings us closer to a non-catastrophic transition capability… in the land transport sector anyway.
As HinH, among others, have been pointing out- commercial application diesel may the tough bottleneck to handle.
They’re all wrong about EV. The problem is that the true externalized costs of battery production have not been factored into the actual overall cost of the vehicle, nor factored into the overall efficiency that the vehicle reportedly provides during it’s over-the-road service life. Not only that, but EV owners aren’t paying for their use of the road via taxes at the gas pump, such as the ICE owners are compelled to do.
The only thing that actually happened was, that electrification of vehicles moved emissions to the power plant and the mining site. The mine site is almost always ignored in the true emissions and environmental costs of these vehicles.
With taxes I count on our government.
The moment 60%+ of all cars are electric, and you can see gas is harder and harder to get, there will be new taxes. The moment you can’t escape the taxman will catch you.
Eulen , the new tax is in the pipeline . It is the tyre tax .
https://notalotofpeopleknowthat.wordpress.com/2023/02/27/drivers-could-be-hit-with-new-tyre-tax-in-crackdown-on-emissions/
“They’re all wrong about EV”
Mike you might be correct in a world where oil was infinite, and where there was no problem with fossil fuel climate change.
But we have this thing called oil depletion and we are entering the twilight timezone for personal ICE vehicles. Its just a matter of time.
And perhaps many more humans will have to learn to live without personal equipment that can travel hundreds of miles in a day. Believe it or not, there are humans who do live healthy, happy and longs lives without their own personal 5000 lb metal motion box.
I know….its hard to imagine.
Strongly agree with everything you said, Hickory – it is spot on – and especially in your last sentence regarding life without a 5000lb metal motion box.
The 5000lb metal motion certainly demarks an exceptional era of human existence, which might be prolonged somewhat by EVs but who knows for much longer. I think the standard nuclear (fission) ship sailed decades ago and fusion is still a big question mark.
Gas taxes to pay for roads are a dumb idea anyway. It’s pretty much restricted to the Untied States, and has been a fiction for decades, as just about every DOT is bankrupt. Anyway, the real problem with American infrastructure is overbuilding uneconomic junk thanks to poor planning.
The idea that mines produce as much emissions as cars needs a citation.
But as as I said elsewhere in this thread, all these random multi-pronged emotional arguments won’t change the fact that internal combustion engines are on their way out. Just look at the investments car companies are making. Even engine specialists like Mazda and BMW have seen the writing on the wall.
You may not see the effects on the road in your neighborhood today, but it takes years to bring a new car model to market, so it is easy to see what car companies will be offering in 4-5 years based on their current investments. They are locked into EVs and hybrids.
What’s happening ?
How about no ECONOMICAL place left to drill . Occam’s Razor .
Only one place has published any graphs undersatanding they even recognize this issue. I agree with you, it isn’t just about resource volumes, it is about the cost to get them and the price at any point in time. Lot of good shale oil does you if the cost to get it is $200/bbl and price won’t clear $100/bbl. However, it is more supply/demand/price relationship than Occam’s Razor.
Some people are going to be freaked out by the info presented in this post.
It fly’s in the face of their belief about impending oil cliff starting a couple back.
Thank you for the clear presentation of all this Dennis.
That export graph linked by ForestFinn is a good and important one.
Hickory, you are beinb overly dramatic. I am very familiar with Dennis’s predictions and have never been freaked out by any of them. Also, Hickory, they are Dennis’interpertation of the EIA’s predictions. And, I must add, the EIA has a horrible record of making predictions. They are no more shocking nor valid than my predictions. Anyone’s wild ass guess cannot possibly freak me out because I know they are just a guess.
Also, I have prediced a coming decline in oil production and have never predicted an impending cliff. But if that decline does not materalize in the timeframe that I expect, then I will just say: “Damn, I was wrong.” I will definitely not be shoked that I was wrong anymore than I will be shocked if Dennis’s predictions are wrong.
Oh Ron, you’ve been predicting a decline for awhile. Not sure you’ve ever predicted anything else really. Like this example: “2015 for sure” being my favorite part of course.
“Bottom line, it is obvious that we are on the cusp of peak oil and only the seemingly ever-increasing barrels from US shale oil production is keeping it at bay. But it now looks like that party is about to be over. I think it is very likely that peak oil has already arrived, if not this year then 2015 for sure.”
Dec 1, 2014. https://oilprice.com/Energy/Crude-Oil/Did-Peak-Oil-Arrive-in-2014.html
Damn! I said in 2015 that we were on the cusp of peak oil? I don’t remember that quote, but I will accept it. In 2015 we were damn sure on the cusp of peak oil; it was only three years away.
Yes, I also said it was very likely it had already arrived. But then you obviously don’t understand what a tentative statement is. But what the hell? We all have our problems with language.🤣
I’m with you Ron when QE collapsed in 2014 and tanked oil prices it seemed that 2016 should have peaked the shale patch. Deeper and longer kept it going. But there is a limit that was never in question. It does seem November 2018 might be it. Unless we can turn lead to gold as some think we can depletion will prevail.
The amount of oil produced at a loss surprised me a great deal. There were about 260 bankruptcies in the oil and gas industry between 2015 and 2020. I had not realized that every bankruptcy would bring in more cash. Stock holders lost 90%, but after the bankruptcy all sorts of investors lined up hoping the corner had turned, not only willing to risk more money in oil production, but willing to give financial incentives to the management which had just driven the company to bankruptcy.
I wonder where the current peak would be if all the oil produced at a loss was subtracted?
Schinzy , I have long maintained that shale was nothing but a trade off ” burn useless greenbacks to get useful resources ” . No , I am not complaining as a matter of fact I support this . Brought us another 12 years ( 2010 when shale took off ) of BAU . Problem is that instead of using this period to prepare we spent it on ” driving circles on race circuits and going to stadiums to see some one hit a white ball out of the stadium . ” Ervin .
In 2015 we were already past the first 4 claimed or occurred peak oils of just this century. I start the modern peak oil era with Colin Campbell calling global peak in 1990. At about 60 mmbbl/d no less. Nowadays it just seems to…quaint. You did say very likely in 2014. And you obviously missed your own words following the 2014 “very likely” because you immedaitely followed it with…..”has already arrived…..if not this year then 2015 FOR SURE”. What kind of qualifier would you say “FOR SURE” in 2015 might be? 🙂
For sure, you plan to thrash this straw forever. So I missed my forecast, I was off by three years. But for sure, there can never be a forecast as bad as this one made by you:
“Not only is there enough crude and natural gas to melt the poles, depending on price, there is enough to make sure that peak oil isn’t assured in this half of the 21st century.”
You are off by over thirty years, over 10 times my error.
*CLAP CLAP CLAP*
To Ron:
“You are off by over thirty years, over 10 times my error.”
You apprarently missed my caveat to that statement in your rush to pretend I had made a prediction. I didn’t….I made a specific statement, including the appropriate caveats. Tsk tsk. I wrote what I meant, and you didn’t quote what I said. I was specific.
To MikeB
That is what I said. And it is accurate. I didn’t write it to be misunderstood, and why it is correct is right there in the quote.
Well the all liquids peak in production so far has been shown to be November 2018, so I don’t know where you’re coming from in pointing any fingers at Ron. Your own posts have not exactly been lucid in terms of any reliable forecast in oil production – peak or otherwise – , so it behooves you to reconsider your ongoing blather about other people’s predictions.
I don’t blather. And yes, the 6th claimed or occurred peak oil this century was 2018. Haven’t seen anyone describe what makes it special enough to be the final one, including the work Dennis is doing. As far as “lucid”, A) peak oilers rarely get to tell anyone else that and B) the internet doesn’t have the standards that science rags do, so I don’t have to be held to them there. Why not mention someone I am known for? I knew peak oil early in the century was just a Happy McDoomster fairy tale. Puts me mostly head and shoulders above the average internet prognosticator.
“Haven’t seen anyone describe what makes it special enough to be the final one, including the work Dennis is doing”…..
Well, despite that claim there is one; peak conventional crude production was in November 2005. 18 years long in the rear view mirror – does this qualify as a final peak?
2005 is early in the century, BTW, and it turned out that peak conventional was real and not a Happy McDoomster fairy tale. So perhaps you should review your previous post for “lucidity”, as it appears to be wanting for same.
Mr Sutherland , correct, 2005 the peak for conventional and 2008 -2010 was the GFC . Not enough energy to support the promises made by the politicians . Then began the shale oil trade off . Energy is the economy .
To Mike S:
Here is a list of all the global benchmark crudes.
https://oilprice.com/oil-price-charts/
Mayhap you can point out which are conventional that I can go add them up to determine if they did indeed peak in 2005?
If we are going to make up cool sub-divisions to declare peaks whenever we want (said peak not being a peak of anything but the subset) then I want peak cable tool rigs! Peak onshore. Peak offshore. Peak sandstones, as they matter, and not those pesky limestones. Peak discrete reservoirs, but only light sweet since that once mattered far from than heavy sour. Peak pre-hydraulic fracturing? Sure! Peak sweet versus sour? Why not?
There is a reason why Hubbert didn’t use the word “conventional” when he predicted US and world peaks in 1956, and why McPeaksters made up this particular distinction after their ignorance of the “obvious to a geologist” continuum of hydrocarbon resources, particularly those of the continuous type, was revealed by…you guessed it…..YET MORE OIL. Some were suckered by this and now are making excuses.
And some knew better in real time.
I wasn’t thinking of you Ron when I said some people would be freaked out by absence of an oil cliff starting a couple years back. I know that you have refrained on predicting action beyond peak.
But some others like the fancy salesman-post Steve guy or HinH have been broadcasting a rockfall in oil production.
The drama on that narrative suits them I suppose.
To ReserveGrowthRulz;
I would think the distinction and importance of peak conventional crude would be self-evident to even a casual observer, which really doesn’t leave any leeway as to interpretation.
But apparently the distinction must be spelled out, and here it is: conventionally drilled formations are those that (formerly) flow(ed) freely upon completion, using standard rotary drilling technology and nothing else. Unconventional wells, on the other hand, require high pressure fracking involving millions of gallons of water and proppant, and other specialized well construction and maintenance techniques to induce production and maintain it insofar as is possible. So there is a fantastically large distinction regarding construction effort between the two, and certainly not one that you foresaw. You are only pointing to unconventional (shale) as an argument against the ‘McPeaksters” through the benefit of hindsight (which is self-serving), and not through any prescient insight of your own. If it (shale) hadn’t happened, then conventional peak in 2005 would have been the final peak in world production and your hindsight argument would never have seen the light of day.
Another way to spell it out to you is as follows; conventional wells could be drilled with an EROEI easily exceeding 100:1. Current unconventional (i.e. shale well) EROEI is what, 10:1? 5:1 or less? Does that spell it out more clearly for you?
Finally, I am going to stress the importance of this situation to you in Art Berman terms – “shale is the retirement party for the oil industry”…
And the value of Art’s quote? A history major turned geologist who in 2011 apparently didn’t even realize that Dick Findley was awarded AAPG Explorer of the Year for finding…wait for it….the Bakken? While Art was declaring in 2011 that there was no signficant oil there. Art sure provided timely and quality quotes! Just don’t match them to reality.
No one ever drilled a well based on the EROEI metric. E&Ps don’t make development decisions on it, engineers aren’t held accountable for even knowing it, CEO’s aren’t given bonuses for having higher ones than lower ones. Find one that has, a company, a CEO, an engineer, and we can ask questions and then can tell us all about it. Do you know any, because I’ve been looking for years and haven’t.
Thanks for the interesting work Dennis.
Schinzy,
Glad you liked it, my pleasure.
To add to Ron’s point, the percentage of oil produced in the United States from “conventional” wells (vertical wells, straight down, unfracked) is still substantial. However, it is getting VERY difficult to find a good prospect, and once you find one, it is difficult to drill and complete.
There are new ways to log these wells, like the Cordax LWT (logging while tripping), but that only helps if you’re able to find a company that can manage a high-pressure hole, or one with high chlorine levels, or has the experience to actually stabilize an angry borehole. I mean you can’t log a well if you can’t drill it, and it’s getting difficult to find an outfit for that.
What this means is that there is a steady deterioration of a massive population of old conventional wells, many of which have been producing for five decades, and very few replacement wells. Unless you’re Pythagoras or Archimedes, it’s impossible to figure out an ultimate decline rate for that segment. But it’s coming, just as sure as the decline of shale (which could be figured out by Seneca).
It may not be a cliff, but it could be. The point is, nobody knows. And it’s going to be a shocking experience.
(And by the way, who is using the name Forest Finn? I knew Forest Finn. I would advise a new alias.)
Gerry , wrong . Total production 12.5 mbpd . Lower 48 ( conventional) is about 2.5 mbpd add Alaska 0.5 mbpd . Total 3.00 mbpd anyway not more than 3.5 mbpd . By the way I think it must be taking a lot of diesel trucks to collect from the stripper wells . EROEI ? Any guesses .
HIH
Exactly how much of the $10million frac well is diesel? For crude that you can’t make diesel from. So you can trade it into the market for crude you can make diesel from. Doing it this way is deceptive it hides the fact we need 8million bpd of imports. If the US only produced 3.6 mbpd people would wake up to the fact that the situation here is the same as Europe. And it’s only going to get worse trucking oil all around the globe to balance refinery needs doesn’t increase efficiency it takes more energy out of the system.
Gerry/HIH
At the end of the US post, I make use of STEO and LTO info to estimate conventional oil in the onshore L48. The chart has been a bit volatile for the past few months due to changes in the LTO. The latest data point seems in line with earlier data. Overall the trend in the data seems to be flat to slightly down.
Production has hovered close to 1,800 kb/d before spiking due to LTO revision.
https://peakoilbarrel.com/us-november-oil-production-shows-small-drop/#more-41281
Ovi , thanks for the update . It seem we are worse off than I calculated . 1,731 plus 0.50 Alaska brings us to only 2.25 mbpd of conventional .
HIH
If the currency numbers are correct, it appears there is a permanent loss of 300 kb/d. Not sure where it went.
According to their stats, North Dakota was down 142,102 barrels per day in December.
ND Monthly Oil Production Statistics
Ovi ,so total conventional is 2.25 mbpd and LTO is 7.25 mbpd = 9.5 mbpd . From where does the figure of 16mbpd as production crop up ? Enlighten .
https://www.eia.gov/tools/faqs/faq.php?id=847&t=6
Hole in head,
I have a slightly different estimate from Ovi, using official tight oil estimates from the EIA and the EIA’s PSM.
Dennis, Ovi’s chart is through December. Yours is only through November. The controversy is over what caused the big decline in December.
Hole in head,
Often output of total liquids is used and the US produces about 6000 kb/d of natural gas liquids
https://www.eia.gov/dnav/pet/pet_pnp_gp_dc_nus_mbblpd_m.htm
for tight oil see page below and click on tight oil production estimates by play
https://www.eia.gov/petroleum/data.php#crude
In November 2022 NGL output was 6066 kb/d, C plus C was 12375 kb/d and tight oil output was 8130 kb/d. Total US liquids production in November 2022 was 20980 kb/d, but that includes both refinery processing gain and biofuel output. Refinery processing gain is about 1000 kb/d, biofuel output is about 1000 kb/d (November) and there are about 539 kb/d of other blending components to the refining and blending process such as hydrogen (227 kb/d), unfinished oils (200 kb/d) and other blending components (110 kb/d).
see
https://www.eia.gov/dnav/pet/pet_pnp_inpt_dc_nus_mbblpd_m.htm
Ron,
We don’t really have a good estimate for December yet, we will in a few days, I don’t think the DPR is very good, nor the STEO. Blizzards do tend to reduce oil and gas output in North Dakota which happens fairly regularly each winter. By my calculation conventional output is about 100 kb/d below the March 2020 level as of November 2022, at an annual rate this would be roughly 40 kb/d per year or roughly a 2% decline rate which sounds about right.
The 140 kb/d decrease in North Dakota output in December would account for most of the decrease, if Ovi’s estimate is correct, the DPR and STEO are often revised so the estimate is likely to change which I am pretty sure Ovi said already in his post.
Dennis, I know the semi-official numbers for December US production will be in the EIA’s Petroleum Supply Monthly tomorrow. Of course even those numbers will be subject to revision. But they are always, by far, the closest and are usually revised the least.
Yes, I know the STEO is always heavily revised, and the DPR data are so ridiculous that I don’t even bother looking at them anymore. But you left out one, the EIA’s Monthly Energy Review. They have US December production down by 288,000 barrels per day in December, recovering less than half that in January. Of course, their numbers are subject to heavy revision also.
Bottom line: Everyone is predicting a heavy decline in December. The question is by just how much?
Ron,
The final two months of the MER are based on the most recent STEO at the time of publication of the MER, the PSM is much better, I tend to ignore those last two data points of the MER, December output will obviously be down due to Bakken blizzard in December, it is fairly common to see a winter drop in C plus C output since the Bakken has been a significant producer (starting in roughly 2012).
Correction:
I just looked at the MER and compared with the STEO and I was incorrect. The MER has US C plus C at 12087 kb/d in Dec 2022 and 12216 kb/d in Jan 2023. The STEO has US C plus C at 12300 kb/d in Dec 2022 and 12370 kb/d in Jan 2023. It will be interesting to see what the PSM estimate is later today. Looking at the weekly estimates, it looks like the MER may use the weekly output estimates as the basis for the most recent two months (December 2022 and January 2023). I have long believed that the weekly estimates are often quite bad, so the most recent two months of the MER are best ignored in my opinion.
How many here aware of the drought in France and it’s effect on nuclear power ?
“An additional serious problem that after agriculture, cooling of thermal reactors is the biggest consumer. Already, plants have to be shut down with regularity due to too low water levels and too high water temperatures. 80% of the 54 reactors are now cooled by river water, most of them by ‘ rain rivers’. Moreover, hydro_generation declined by 25% last year due to drought…; ”
https://www.themayor.eu/en/a/view/france-declares-water-restrictions-for-the-first-time-in-winter-11573?trans=en-US
That’s not a problem with nuclear power, but with scrapepennys in accounting.
Look at this wiki, Here you see a french nuclear plant .
https://en.wikipedia.org/wiki/Fessenheim_Nuclear_Power_Plant
And here one from Biblis in Germany:
https://en.wikipedia.org/wiki/Biblis_Nuclear_Power_Plant
What did you not see on the first picture:
Cooling towers! The German one has these for cooling when the Rhine is not usable or forbidden for enviromantal reasons (too hot), the french one just saved them. No wonder they have problems in dry summers.
Eulen , thanks . The problem is that the French plant was started in 1970 , commissioned in 1977 and decommissioned in 2020 . 1970 the Vietnam war was still on . Who thought of climate change ? Not saying you are incorrect but get it in the correct perspective . Here is 1970 for you .
http://www.eventshistory.com/date/1970/
French summers are hot and dry, even without clima.
And in the 70s you could cook a river up to 35 degrees killing all fish. Today ther are laws, even in france. Only nobody took the money in the hand.
According to Rystad 15% of European industrial production was forced to shut in in 2022:
https://www.rystadenergy.com/news/note-from-the-ceo-reflections-on-2022
My guess is that this is the reason Europe is using less energy. I doubt this production will bounce back in 2023.
European food prices are high. Fruits and vegetables are being rationed in the U.K. Banks are not lending to my brother in law who grows apples. The European energy shortage will probably cause a food shortage. I am retiring this year and will go into agroecology next year.
The UK minister says ” If you can’t get tomato’s eat turnips ” . Now there are no turnips . What next ? Let us eat them bugs , insects and cockroaches . 🙂 . Modern day Marie Antoinette ,
https://www.independent.co.uk/news/uk/home-news/supermarkets-turnips-food-shortages-rations-b2288919.html
Not raining enough in France our winter wheat crop looks dire.
No comment .
The EU countries get first choice if there is a shortage.
Has anyone saw the PBS show, How the Victorians Built Britain,? In todays world was imposed on the 1850s with ESG, Regulations galore, Lawyers and the evil carbon dioxide molecule, the Victorians could never have built Britain.
Don’t forget that laws against murder, slavery and dumping plutonium in the air are also ESG initiatives. Thank goodness.
“Victorians could never have built Britain.”
Good. This place stinks.
Just flown over it.
Didn’t smell.
The German politicians love to boast how they have reduced gas imports from Russia . They never talk about the disaster of industrial production . There is no free lunch .
It’s ok – Germany is on extreme climate course anyway at the moment. Getting clima neutral long before the EU plan.
Industry is only annoying for such plans, only state employees are much more climate friendly. Live from state money and import all things – so you don’t have the CO2 production and are a paragorn of clima movement.
Next year they want to ban oil and gas heaters for new buildings, shortly after for replacement. But clean electricity build out is lagging badly, electricity itself is lagging. Switching from gas to coal because of the boycott doesn’t help, too…
” “I’m shocked, shocked, to find that gambling is going on in here.” Louis in Casablanca .
https://www.oilystuffblog.com/forumstuff/forum-stuff/one-basket?origin=notification
ExxonMobil took a pre-tax impairment of $4.6 billion from exiting Russia (Sakhalin-I) but only a loss of 150 mmboe in reserves. It recovered $1.1 billion in taxes. Despite Guyana discoveries, remaining reserves have been showing steady decline recently. Significant impacts have come from negative revisions to US shale gas and Kearl oil sands.
When negative revisions continually just about equal annual production then there was something very wrong with the original reserve estimates (i.e. mostly with the XTO purchase – EM wrote off $30 billion in 2020, but that may not have been enough, even with the nearly doubling of average natural gas price).
Oil sands reserves were written down by half a billion despite high oil prices. I don’t know if high nat. gas prices may have had an impact – Kearl uses direct mining but process heat is needed in the separation plant and hydrogen for upgrading. The marginal economics of some reserves must raise questions about the economics for the development of the remaining resources.
Oil sands in Canada are problematic because of government intervention. Existing projects have some protection, but new projects will be harder and harder to develop. So writing it down is a sign of good accounting.
It’s the same as with oil fields in Russia.
George, the word ” marginal economics ” . I have been cranking my grey matter to describe where things are today . Can I use it in my future posts to describe events in the coming days ? Merci , Bedankt , Shaukriya .
Marginal producer will now suffer ” marginal economics ”
https://oilprice.com/Latest-Energy-News/World-News/Ecuador-Calls-Force-Majeure-On-Almost-All-Of-Its-Oil-Production.html
Ecuador produces about 500 kbpd, most of the exports go to USA and I think are heavy, which may make things interesting in some refineries (maybe another stressor to hit diesel supplies first).
Damn, George, reserves seem to be being written down everywhere. I think there is a term for this. It’s called reserve shrinkage. 🤣
Reserves go up, reserves go down. I’ll stick to the side that seems to win more often than not. And more amusingly, where do those reserves go? Back into increasing the resource estimate. And what happens to resources when price go back up? Resources go down, and reserves go back up again! It’s just crazy!
Good thing we’ve got experts to understand and explain all these things!
If correctly estimated, reserves will always decline as they are pumped from the ground. Underground reserves are always estimated. If they are overestimated, they will decline. If they are underestimated, they will grow.
Publically listed companies can be heavily fined if they overestimate reserves. That is why they have traditionally underestimated their reserves. That way, they could always add reserves simply by re-estimating them. National oil companies are under no such restrictions. They often overestimate their reserves simply for bragging rights or to increase their quota if they are an OPEC nation.
Of course, price is always part of the equation because we are always talking about “economically recoverable reserves.” So, of course, reserves will move up and down with the price of crude. But sooner or later, it will come down to pure geology and nothing else. There is no price that will pull oil out of a dry hole.
Not once did you say “resources”. I did. There is more to this game than reserves, and any peaker who hopes to understand why they have been embarassed by their claims going back to Colin Campbell screwing the pooch in 1990 needs to know how they are involved.
Dennis uses USGS estimates of RESOURCES domestically for a reason. Hint hint.
A graphic that is a great visual for understanding the basics of this. If peakers aren’t familiar with it, they should be.
https://www.eia.gov/todayinenergy/detail.php?id=17151
As understand, the SEC asks all of the listed oil companies a simple question each year. On December 31st with what you think is in the ground and with today’s technology and at todays price, how much oil could you recover. That my friends are the reserves published. Of the three variables certainly the price is the most influential.
The Albertan Tar Sands are there.
Political roadblocks will get flushed down the toilet when desperation occurs.
They’ll use a nuclear reactor to liquify it if that is what it takes
George
In Q1 2020, Suncor took a $2.8B write down on its oil sands due to continuing low oil prices, at that time $50/b. I think XOM did the same along with a few others at that time. Interestingly, I have been watching to see as the oil price rose if they would undo the writedown with a writeup.
Do you know if this is just an accounting adjustment that eventually sorts itself out and has no impact on the amount of oil they end up producing from the written down fileld?
https://www.reuters.com/article/suncor-results-oil/canadas-suncor-takes-c2-8-bln-writedown-ceo-cites-low-oil-prices-idINL1N2A60YG
SEC rules require companies to give their best estimates of reserves based on the average annual price – not to use accounting ‘tricks’. ExxonMobil took a much bigger hit in 2020 as the graph shows – almost all the developed reserves disappeared – they were down to 2 years R/P at that price. Some, but not all came back as the price rose in 2021, but a large chunk has been removed again , even as prices rose again this year. I stress again that these are supposedly proved, developed reserves. Not undeveloped, not probable (of which I doubt there is much anyway) and definitely not yet-to-be discovered resources – i.e. even at these high prices the oil is only just economic, given another drop likely most will be written off again, the reserves are marginal at best. Other resources that haven’t had the sunk development costs already spent and which will hive higher operating costs per barrel are in much worse shape. This is the consequence of low ERoI in action.
Dennis, it just occurred to me that all your production charts are based on your estimate of reserves left in the ground. That is for the US as well as the rest of the world. Is that correct?
EDIT: Dennis, I am primarily concerned here with world reserves.
Not if he is using USGS estimates of RESOURCES it isn’t. Have you missed him saying “I use USGS etc etc”? USGS doesn’t do reserves. How can you not know things this basic, this late in the game?
Sorry RGR, but as of right now, I have put you on my ignore list.
Bye now.
I apologize if knowing what Dennis has claimed is so disturbing that an echo chamber if the only solution.
check it out
https://twitter.com/EIA_One/status/1598048928888651781
Isn’t it so much fun for the professional petroleum engineer to watch the USA citizenry become convinced that we are somehow oil independent, while they have no clue that imported UNREFINED crude is relabelled “domestic” after REFINING so TPTB can continue the charade?
Whenever Rulzzzz comments we should bring up this apparently touchy topic.
But we’re pumping more and more, lower and lower energy dense and pricier liquid than ever!
Why won’t you just admit you’re an ecofascist doomer already? Can’t you see number goes up and only ever does so, as God wills it.
Dennis, we all fascinated, and Ron is apparently clueless, on whether or not your USGS numbers are reserves left in the ground. Whatever that is. Would you care to educate all us ill-informed beginners as to what the USGS does estimates of? 🙂
The USGS does estimates of crude oil extraction — for now they are puzzled why the USA can only extract 12 million barrels of crude per day from it’s territory while the USA economy consumes 20 million barrels/day.
Or perhaps they are not puzzled. They realize the deficit will only get worse, regardless of the creativity involved in the untapped resources book-keeping.
The USGS says they do “geologically based oil and gas resource assessments”. See how they don’t use the word “extraction” when discussing what they do? Crazy geologists, how dare they not write a definition that you can then claim is extraction! Perhaps, because they don’t care about extraction, they are not puzzled at all, and don’t even care? Have you ever even TALKED to one of them at a conference, picked up the phone and called, interrogated one as to why they weren’t boned headed morons and fell for peak oil 15 years ago like the other geologically/technically/economically challenged folks?
Rulzzz
Yes, the AGU conference — American Geophysical Union. Dennis and I presented there one year and there was barely any representation from the petroleum sector — our outsider paper and a couple others that we spent time talking with. I asked around trying to figure out why there was not a greater representation and determined that over the years there was a deliberate decision made to not focus on fossil fuel geology for the AGU, as that was covered by the specialized professional conference SPE — Society of Petroleum Engineers. Apparently the SPE is where they can concentrate on their delusional dreamworld where they never have to mention the concepts of finite and non-renewable.
The AGU on the other hand does all the geophysics, climate science, and other earth sciences.
Outstanding! And did you ask them if they did estimates of rates of extraction?
AGU is a bit on the eggheaded geologic side to my liking, AAPG has a higher percentage of good ol’ boys who once threw some wild parties back during the boom times of the late 70’s, same as the SPE gang. UrTEC is more modern and has a better cross blend of topics.
So….good to hear you talked to one of them…unfortunate that you claim something on their behalf that they don’t do.
That’s why we do it — cuz they don’t have the guts. As a general rule and IMO, having worked across just about all the scientific and engineering disciplines, researchers in the earth sciences disciplines are the most incurious. There’s none of the competitiveness and intensity that one sees at other scientific research conferences.
That’s what I noticed at the 3 AGU conferences that I’ve attended — long lines for the free beer.
To Paul:
“That’s why we do it — cuz they don’t have the guts.”
Obviously incorrect, as I am one of them, and did. And unlike those with “guts” but lacking the prerequistie skill sets, instead focused on getting the system built to do it right.
“There’s none of the competitiveness and intensity that one sees at other scientific research conferences.”
Good thing conferences and competitiveness aren’t the measure of getting it right and more than the presence of guts are then. You appear to be suffering from the impression that peak oil was all that interesting to the geoscience folks. As best I could tell, having been involved prior to all of the claims this century, during the claims, later when the claims were being discredited by more oil, any interest tended to be passing. Your assignment to them of a fascination with the topic just because of their specialty is misplaced. And as best I can tell, having watched the full cycle, it is because they knew that economics was in there, screwing up all the simplistic methods that kept getting it wrong, they knew it, and had no desire whatsoever to consider a social science as holding part of the key to figuring it out.
Rulzzzzz said:
I don’t see your real name. When I submit a carefully documented research article to a prestigious scholarly journal I have to include my real name. The journal editors need that so that they can assign peer-reviewers to critique the work and be guaranteed that they won’t be wasting their valuable time.
Same thing with a book proposal if it is of technical or scientific content. Sure, one can submit a pseudonymous proposal for a work of fiction or if it’s some kind of expose that could face retribution. But that’s not what’s happening here — maybe you are scared of being fired?
To Paul:
“I don’t see your real name. When I submit a carefully documented research article to a prestigious scholarly journal I have to include my real name. ”
So do I. You don’t actually consider puttering around in McPeakster online forums to be a “carefully documented research article” do you? Haven’t seen much in the way of footnotes around here doled out by anyone.
“But that’s not what’s happening here — maybe you are scared of being fired?”
One hypothetical. Another is that I don’t need another peak oil nutter showing up at the house like they tried at the office once, early in my internet wanderings. At least there armed guards are available.
Rulzzzzzzz says:
Isn’t it funny how he doesn’t understand how any of this works? We post and comment on blogs to get some feedback, which we can then use in creating a better manuscript. I consider it a variation of a lab notebook.
To Paul:
“Isn’t it funny how he doesn’t understand how any of this works? We post and comment on blogs to get some feedback, which we can then use in creating a better manuscript. I consider it a variation of a lab notebook.”
You are seriously lacking in scientists and colleagues to review and kick around ideas with? How many peak oilers who knew it was a crock back then can I kick around ideas with, us people who knew better, these 18 years later?
Maybe Dennis, did you know that Dennis is one of the few I’ve met online on this topic that can coherently discuss why estimates have been off, things he’s learned and course corrected for, and not flinch away from that being part of the learning process? Do you know how rare that is in Happy McPeakster land?
Folks who pull your rabbit out of the hat, “I couldn’t see into the the future, that’s why my answer was wrong” are worthy of exploring other nuances with? In your case, now that the maximum entrophy principle and crystal ball failed you, how about we try out chicken bones this time for a little variety?
Rulzzzz says:
There are those that understand probability & statistics at a deep enough level to apply it to quantitative analysis, … and then there are geologists.
Resevgrowthrulz,
The scenarios are based on the publicly available information at my disposal, including resource estimates, past discoveries of resources, and historical output of crude plus condensate. The scenarios for World output consider conventional and unconventional resources with unconventional resources defined as “continuous resources” such as light tight oil and oil sands from Canada and Venezuela’s Orinoco belt.
The recent scenarios have about 65 Gb for tight oil URR and 100 Gb for extra heavy oil sands URR, with the balance being conventional oil (URR about 2635 Gb). The scenario is very conservative relative to USGS resource estimates of about 4000 Gb of technically receoverable resources. My expectation is that only about two thirds of the technically recoverable resources will be economically recoverable resources.
I agree the cost curves are important, though they are a bit of a moving target, I mosty focus on costs in the tight oil sector where I have limited access to well profile data from Novi labs. The extra heavy oil part of my model relies heavily on the Canadian governments assessment of future oil sands output through 2035 and I mostly assume Venezuelan Orinoco output will be flat from 2018 levels until 2035 and then will gradually decline. The conventional oil scenario I use simply assumes total conventional oil discoveries will be about 2800 Gb, which may be too conservative an estimate. Future extraction rates for conventional oil are assumed to remain at about the 2019 level of 5.25%. The extraction rate is from conventional producing reserves which is estimated from an oil shock model at about 495.5 Gb at the end of 2022. New producing reserves are added each year as resources are developed and at this point more reserves are produced each year than are added from undeveloped reserves so the total producing reserves are being reduced. Extraction rates are gradually increasing from the low of 2020 at 4.86% to 5.29% in 2033 (these apply to only conventional oil producing reserves.)
You said resource Dennis. Ron apparently doesn’t know what those are, or what the USGS estimates are that you use. Can’t be bothered with the details, I mean, they are pesky, and who cares, just keep declaring peak oil every couple year and be surprised when folks dredge up discredited prior claims. And we’ve already discussed quite a bit of your systems privately, there is no need to waste time typing it all over again. As I told Ron, I did pay attention when you have discussed this previously, plus I am familiar with what the USGS does and have utilized that information myself.
You have a method to do the world, it works for you, at an aggregation level you are happy with, and using the information you can afford. More logically than the silliness put forth 15+ years ago, or done by those who’s excuse for getting it all wrong is “because I couldn’t see the future”.
Only one comment though, and that is your global URR number is light. By more than enough to notice. Did you use the USGS estimate for technically recoverable in Venezuela in any way, circa 2008 or so? And what ultimate numbers did you use for Canada tar sands? The published reserves numbers, the technically recoverable that the CER is familiar with, or did you get a chance to interrogate anybody on the same topic from the AER?
Reservegrowthrulz,
For Venezuela, I don’t have lot of information, my expectation is that political problems there will not be solved so I simply assume that the TRR that has been estimated by the USGS for the Orinoco belt will mostly remain in the ground and that the ratio of ERR to TRR for extra heavy oil in Venezuela will be very low. For Canadian oil sands I simply use the CER scenario called current policies scenario
https://www.cer-rec.gc.ca/en/data-analysis/canada-energy-future/2021oilsands/
Canada plus Venezuela extra heavy oil URR is about 97 Gb, this is based on the assumption that oil prices fall after 2035 to levels that lead to less development of new Canadian oil sands projects. Similarly for non-continuous resources (aka conventional by my definition) the 2800 Gb of discovered conventional oil that I assume gets reduced 2660 Gb of ERR over the 1870 to 2300 period. Below is the oil price scenario I use.
Obviously this guess will be wrong and likewise the future output scenario for World C plus C will also be wrong, actual output might be higher if oil prices are higher than I have assumed and lower if oil prices are lower than I have assumed. There are a plethora of assumptions that have been made to produce the model, all of which are likely to be incorrect. In short, the probablity is 100% that the future will be different than the scenario I have produced as it is one scenario picked from an infinite set of possible scenarios.
Reservegrowthrulz
I found this just for you. I thought it presented information in a way you would understand.
https://www.stuartmcmillen.com/comic/peak-oil/#page-116
Sorry JT, didn’t get it in the least.
I get it, thanks.
To both Dennis and RGR,
it important to recognize how Dennis has modified his work and statements over the years, it is clear, at least to me, he wants to learn and he hopes to get it correct, rather than the early years of posting what I considered ignorant uninformed propaganda. I get a kick how now he defends his work from both sides of the argument, that’s a clue to his personal growth in this area. One reason the blog is worth reading. I have never understood ones satisfaction with being wrong all the time maybe Mike S can shed some light on that topic for us.
Ron,
My estimates are not really based on reported proved reserves, I look at historical discoveries of resources and production. A model considers how these discovered resources might have been developed over time to have resulted in the historical production we have seen. Each oil discovery goes through a fallow, build, and maturation stage which varies from discovery to discovery, when a resource is developed to the point where it is producing oil those resources are considered proved developed producing (PDP) reserves. My model estimates the PDP reserves of conventional oil over time and makes assumptions about future rates of development of conventional oil resources and extraction rates for the PDP reverves to create a scenario of the future, separate models of tight oil and extra heavy oil are added to the conventional oil model to arrive at a scenario for World C plus C.
Producing reserves from recent oil shock model
Has Paul’s caveat of “it doesn’t work if I can’t fortell the future” been corrected yet? 🙂
Many challenges to making this work:
Predicting human behavior, as in game theory. See the latest COVID-19 pandemic models and what happened to them when a vaccine was quickly introduced. These are all “failed” forecasts as no one thought a vaccine was on the horizon. See also the stock market.
No controlled experiments — everything in the earth sciences is empirically-based and deduced from observations. Forever picking up clues.
Expectation of predictions and long turnaround time. Always placed in a trick box to give a single prediction and wait it out. No wonder that progress in the geosciences proceeds at a glacial pace! They’ve never heard of the concepts of cross-validation of prior data.
Lack of public data and questionable quality of nation-state data. Amazing what one can do in geophysics with data untainted by politics.
Take an example of another seemingly challenging problem in geophysics — predicting the next El Nino. No human behavior to model in this — that’s good, check. No controlled experiments possible here, true, but there is the realm of fluid dynamics to draw from, combined with highly accurate tidal models. That combined with excellent public data gathered over the last 100+ years, as there are no politics involved in taking instrument readings. And the expectation here is that predictions are required, even though cross-validation against prior data works great, example below:
https://user-images.githubusercontent.com/2855758/221393380-3d2afe9c-5b67-417a-9f09-f93d772b46c1.png
Can you imagine if tides were not a daily occurrence and instead took decades to complete a cycle? We may still be waiting for a good model.
To Paul:
“No controlled experiments — everything in the earth sciences is empirically-based and deduced from observations. Forever picking up clues.”
And? The Central Limit Theorem itself can’t be used within certain pieces of the puzzle within the oil and gas world, and yet those “competitive” scientist types can’t even be bothered to figure that out before doing it anyway. And I’m not referring just to you here, I can’t count anymore the number of times I’ve seen this among economists, statisticians (got some great stories of them screwing things up), math gurus, applying their full tilt experience to a problem without even asking if they, as a hammer, even can SEE anything other than a nail.
I have no doubt that in the academic world within a specialty all the nuances of that specialty are of great interest, and a focus, of the denizens trapped within it. To a large extent, that is part and parcel of the peak oil problem, and solving it. I’ve watched multi-disciplinary approaches to these problems come to fruition, but at small scales. They have all the moving parts, but then run right into the data issues that peak oilers have suffered from since time immemorial. It is my estimate that not all the data availability existed to build an integrated global peak oil system until about 10-12 years ago.
I really don’t see the problem. Even with the caveats I provided wrt the intractibility of game theory applied to economics, doesn’t mean that anyone with access to the data can’t do some elementary bean-counting, and then apply more sophisticated data processing such as convolutions to model projections. Sure, they might not be perfect but why do you care so much?
Continuous convolution of a single well response is a great way of analyzing tight-oil production, as Dennis has been doing for the past several years. True that when the gov’t of North Dakota opened up their data to the public several years ago it enabled lots of detailed analysis, and showed how the Red Queen proceeds. Possibly there is another algorithm on how to do convolution in the extraction literature, but it’s well-known in other scientific disciplines.
Reservegrowthrulz,
The peak cannot be predicted, that is a simple fact of which I imagine you are aware. Anyone who claims they know the future will be wrong 100% of the time. One can spend their time pointing this out if it makes them feel intelligent, seems silly to me.
Well Dennis, let me ask you this, is a probability density field through time a “prediction”? Are multiple probability fields combined to account for the uncertainty underlying resource probabilities, prices, demand/supply requirements a “prediction”?
And I’m well aware that there are no facts in the future, and people claiming that seeing into the future is a prerequisite for their models to be correct should know better. You aren’t the one who made that claim.
But of course! We use a maximum entropy approach which places the appropriate amount of uncertainty on estimates of the mean to allow excellent fat-tail projections. Suggest you look into it
Reservegrowthrulz,
Many see the scenarios I propose as “predictions” of the future and I would agree they are not. Any single scenario is simply a set of “best guess” assumptions, essentially a set of inputs to a model, in essence it is a what if proposition where we ask what would future output be if this set of inputs to a model are assumed.
To Paul:
“But of course! We use a maximum entropy approach which places the appropriate amount of uncertainty on estimates of the mean to allow excellent fat-tail projections. Suggest you look into it”
Well this is good news! Although I would like to hear more about “the appropriate amount of uncertainty”, for a science guy “appropriate” sounds terribly personal. Is there a problem with quantifying the uncertainty already contained within the data and assumptions made and allowing them to propagate out through the resulting answer as an expression of “appropriate”?
Rulzzzz asks:
Maximum entropy uncertainty is that given a mean, one sets the standard deviation equal to the mean. It’s documented to work well in many situations. Simple.
To Paul:
“Maximum entropy uncertainty is that given a mean, one sets the standard deviation equal to the mean. It’s documented to work well in many situations. Simple.’
And has already failed in your use to predict global peak oil. Right up there with bell shaped curves. So much for “many situations” including modeling global oil production. How about this for a strange idea…you try something else?
Reservegrowthrulz,
I am using the model proposed by Paul Pukite, early predictions by the model had two problems, an underestimate of future conventional discoveries and reserve growth and a failure to account for the rapid growth of both extra heavy oil output ( in Venezuela and Canada) and US tight oil. Those inside the industry may have been confident that this growth would occur, but in 2012 the EIA forecast the following for tight oil:
https://www.eia.gov/outlooks/aeo/data/browser/#/?id=14-AEO2012®ion=0-0&cases=ref2012&start=2009&end=2035&f=A&linechart=~ref2012-d020112c.10-14-AEO2012&ctype=linechart&sourcekey=0
In 2022 US tight oil output was expected to be 1240 kb/d. US output of C plus C for the AEO 2012 reference scenario peaked at 6700 kb/d in 2020.
All scenarios of the future are wrong, if you produced any, they would be wrong as well.
Dennis, you are absolutely right. There are no facts in the future. But when we get it wrong, we course correct, improve, the entire game is about getting better at the guess. Our excuse isn’t “we can’t see into the future”, everyone with a lick of sense doing this knows it and doesn’t have to say it other than as an excuse for not being willing to reconsider their methods, data or concepts.
And the solution to peak oil isn’t about producing A solution, it is about producing ALL the solutions. 🙂 I told you previously, you figure out why all the prior work has been wrong, not just your own, and build something that starts by correcting that. I knew about reserve growth in 2005, Hubbert was building equations used by the USGS in 1975 assessments, why wasn’t it obvious to everyone? The USGS had been publishing methods to estimate future discrete reservoir discoveries since the 80’s. In 2008 the USGS published the resources of Venezuela, a conversation with the CER or AER is all it took to figure out exactly what resource estimates should be used, which is different than their scenarios which aren’t based on resource restrictions, but more political ones. And in 2012 the EIA had absolutely no one who understood anything about continuous reservoirs. When did MCPeaksters figure it out? Art Berman was denying their usefulness in the fall of 2011. Seems like it was common knowledge on both sides of the aisle.
Reservegrowthrulz,
The point is fairly simple. Tight oil output was much higher than predicted by many, note that as of 2013 only the Bakken had been assessed by the EIA so we didn’t have a lot to go on, access to private information held by oil companies was not available to the general public. Below is the AEO 2014 referneve case for tight oil, a bit better than 2012, but still off by a factor of 2. The expectation for average annual output in 2019 was 4790 kb/d for US tight oil output with an average wellhead price for L48 at $89/bo in 2012 $.
https://www.eia.gov/outlooks/aeo/data/browser/#/?id=14-AEO2014®ion=0-0&cases=ref2014&start=2011&end=2040&f=A&linechart=~ref2014-d102413a.10-14-AEO2014&ctype=linechart&sourcekey=0
Also see my comment near bottom of thread addressed to you.
Things did change when the North Dakota numbers became publically available. Could readily model the statistical flow of oil by applying means and distributions to collections of wells.
Reserves left in the ground are a very big deal. In conventional basins, it is not unusual to recover 40% of the calculated reserves. But in the tight oil basins, 10-15% is probably more like it. I am aware that many people claim upwards of 25% but I am skeptical.
We’ve discussed the reasons ad nauseam. Oil is extracted and the pressure drops until it is finally below the bubble point, at which time gas comes out of the rock and also solution, progressively raising the GOR until the well ends. At the very end, the well also draws in salts, then water, so an increasing WOR is a true death knell.
The Huff-N-Puff experiments have fascinated me. They should theoretically reverse the physics of the well. One of the problems (in my view) is that most of this has been done using carbon dioxide, which isn’t really a solvent. Injected field gas for EOR should be much better, but even then we’re talking about predominately methane, which is an inferior solvent. Ethane is much better, but isn’t available everywhere.
I’m not a huge fan of shale oil, but it is what we have at the moment. And I get the feeling that someone will come up with a mechanism to claim another substantial percentage of the oil from shale. John Hess is going at it in the Bakken. Harold Hamm used Huff-N-Puff to great benefit in Grady County Oklahoma and is apparently taking his schematic to the Bakken as well.
I believe the success of Huff-N-Puff is going to be determined by the type of carbonate rock interbedded with the shale, and also the porosity of the rock. Soon we will know which areas will respond, and that’s going to be very exciting.
In reality, “reserves” should be talked about as “recoverable reserves” using conventional methodology of the moment. Recoverable reserves can change dramatically, if there is a breakthrough. For example, the reserves that are recoverable now may blossom into a pretty good rejuvenated well if this reverse physics experiment works on scale.
This gets very exciting when you consider that carbon capture from the ethanol plants might be injected down depleted wells. After all, there is a fair amount of pressure-sharing in a vast reservoir. Need is the mother of invention. If our need for oil gets great enough, invention will surely follow.
Huff-n-Puff not a good terminology. In the 70’s, paint-sniffing morons huffed fumes from baggies filled with spray paint (gold or silver preferred). Remember seeing discarded baggies all the time in the woods, until all their brains became fried. Now I see discarded eCig puffing devices ((still glowing!) and those little plastic vodka shot bottles flattened on the road.
https://americanaddictioncenters.org/inhalant-abuse/huffing
I’m watching inventory build closely. I expect oil to be a lead indicator of recession. With WTI in contango it’s a demand issue.
Two largest components of the CPI are rent and gas prices. If inventory continues to rise oil prices will tank and bring down the CPI.
All the yield curves are saying lower interest rates are coming. CPI has to fall for interest rates to go lower.
Yield curve is telling you lower oil prices are coming.
“All the yield curves are saying lower interest rates are coming”
HHH, please read this.
https://market-ticker.org/akcs-www?post=248189
Higher interest rates or societal collapse in the USA (That societal collapse will be targeting the FED and Congress like in Sri Lanka)
And higher rates are going to WHACK the companies that are playing the accumulate debt, never pay it back and rollover to lower interest rate game.
This includes the USA Federal government.
Only other time we’ve had a build like this over a 7 week period was between February-April 2020. Not a seasonal thing.
Yes, yield curves are predicting lower oil prices. Via recession. Likely nasty recession that is global.
Mr Shellman explains the economics of tight oil when gas is at $ 2.00 per mbtu .
https://www.oilystuffblog.com/forumstuff/forum-stuff/back-below-2-1-roi?origin=notification
What shortcomings?
Mike is finally retiring after working in the oilfield since he was a kid. He also worked on a lot of well fires in his day. He has somehow found time to also write a massive amount of short articles of oilfield history.
I don’t know the background of most posters, but I know Mike’s. He puts it out there for all to see. I know what kind of job he’s done operating wells, as I have looked at the production histories. He’s done a heck of a good job, as an operator, IMO.
I think I get where Mike is coming from because we own production similar to his. It’s a constant grind keeping it going. US shale has been a big disruptor regarding the oil price, and even more so the natural gas price. Huge volatility.
With shale, I have long ago been to the point of, “it is what it is.” I long ago figured out it needed an oil price just as high as ours to make a go of it. But it’s hard to compete with larger companies who have access to huge amounts of capital, and can easily Chapter 11 with no personal losses on the line.
There are thousands of stripper well owners out there in the USA, and they aren’t really known to the general public. I think it’s beneficial for people in the USA to be aware that there is a big difference between what shale is doing and what stripper well operators are doing. In particular how it’s financed.
Shale has been a huge life saver for the US. But it hasn’t exactly been managed that great. That’s because Wall Street has always been in charge.
Hopefully Wall Street will continue to value profits over production growth.
We are thankful we do other things to make money besides oil. I have seen up close what this oil price volatility has done to small operators. 2016 and 2020 were very, very tough on them. Working for free for a year, maybe some of the naysayers here should try that sometime.
““But it hasn’t exactly been managed that great. That’s because Wall Street has always been in charge.”
I didn’t know there was a Wall Street in Houston, or was it Dallas.
From my observation point the development has just looked like a free-for-all, with little if any regulation, self restraint, or resource level planning.
Its not much different on the way many of the countries natural resources have been [mis]managed.
And throughout the countries history, usually there has been plenty of investment capital available, especially if you were a white male. Probably far too much available capital in my opinion because it causes rapid booms and other distortions. That is what happens when capital gains aren’t taxed more heavily than the incomes of people who actually work.
SS,
I have always understood where you and Mike are coming from. Contrary to your impressions, I always knew it was an economic issue. It’s Mike’s constant personal attacks on fellow oil and gas professionals that left him wide open to criticism. That and either unawareness or intentional dismissal of the history of oil and gas business, It has always been boom and bust. That is why OPEC was created. It’s why we subsidize farming and energy, food and energy must be produced. It also must be produced by private rather than government interest to make sure innovation and competition is allowed to bring ample supplies to the market. We can’t have entire industries collapse and go bankrupt due to overproduction, be it food or oil.
I know you know this but it’s worth emphasizing.
I re read Mike’s article.
I don’t always agree w Mike on things, but I didn’t see anything wrong with the linked article.
It all comes down to dollars and cents. Back in 2015-2016, when shale was touting very low break even, I scoured all the LOE statements I could find for shale wells. I even got my hands on several payout statements.
Oil and natural gas prices have to be high enough, or shale wells won’t work. This Saudi America low cost stuff is just marketing BS.
There have been many, many shale wells completed between 2015-2021 that won’t payout in five years. Many never will.
A new shale well is now costing north of $11 million. Almost all of them now have a 25% royalty burden. Then there are the taxes taken off the top.
$5+ natural gas was helping these wells big time. Now it isn’t. This will be seen in upcoming earnings.
There was so much crap around 2015-2019 about shale well profitability. Yet all the independents accumulated big net operating losses during that time. Pioneer was the biggest offender, over $5 billion of accumulated NOL.
For those here who invest in non-operating interests in shale wells, how do you do it? I mean these guys throw everything, including the kitchen sink, on the JIBs.
Go back and look at PXD, EOG and the like 10k for 2016 and 2020, when oil averaged around $40 WTI. Massively horrible. Heck, look at XOM, CVX and COP. Same.
Shallow sand,
Agree 100%, I also read Mike’s post and think he is spot on.
I took a quick look at my breakeven calculation for the average 2020 Permian well, at $70/bo at wellhead and $4/MCF NG and NGL at 35% of crude price per barrel, the well pays out at 33 months assuming full well cost at 13.5 million. If we leave all assumptions except natural gas price the same and reduce the natural gas price to $2/MCF, the well pays out at 41 months. If the natural gas price falls to zero, the well pays out at 55 months. At $3/MCF the well pays out at 37 months. At $59/bo at wellhead and $3/MCF natural gas and NGL at 35% of crude price payout is at 60 months for the average 2020 Permian basin well with EUR of 480 kbo, 170 kb of NGL, and 2045 MMCF natural gas.
SS and Dennis,
You guys are missing the forest because of the trees. Allow me to attempt to explain how these issues are seen from the board room. The industry knew the oil and gas were held in commercial quantities in shale or very large tight, low permeability formations. The industry here in the US has been commercially developing these types of formations for years. Look at the Travis Peak, Cotton Valley Lime and Cotton Valley Sandstones in the East Texas Basin as examples.
When the Barnett kicked off in a time of very high nat gas prices and the very real fears of supply shocks, the industry did what we do. The problem is not that the projects were uneconomic it is that they were so vast.
Think for a second, what if it were only the Balkan that was found to produce LTO? Is there any doubt that the 1,500,000 BOPD would have led to a collapse in pricing. NO way, that would have been absorbed.They would have made a fortune. It is the fact that these resources are so vast, cover so much area.
Now you are in the oil and gas business, you go out and lease as much prospective area as you can afford. You then must drill to hold that acreage or you will lose it to a competitor. Even if your first well on a unit may not be economic, you drill it any way to hold it. As Coffee pointed out up thread new areas are still being evaluated and may yet bring even more oil and gas into the market. From where I sit that is a good thing. So yea, early in the cycle, wells were being drilled delineating the productive areas, refining the drilling and completing techniques that may have been less than economic because the areas and the total production just kept getting bigger and bigger. I do not know of one oil and gas professional that would have done it any other way. It is not how the business works. If you area a farmer and your market is flooded with food because of great weather, yea some individual farmers gets burned, but society is better off. some perspective.
Texas tea,
Mike’s post was about profitability at low natural gas prices. For the Permian basin the average 2020 well (in terms of estimated ultimate recovery) would have about $21.5 million in net revenue over 15 years at $70/bo at wellhead and $2/MCF natural gas and NGL at 35% of crude price per barrel, full well capital cost would be approximately 13 million dollars today and I assume that average 2023 Permian basin tight oil wells will have similar productivity to the average 2020 well (in fact it may be somewhat lower than in 2020). Over 15 years this would pencil out to about a 3.4% average annual rate of return (ROI is 165% (=21.5/13) over 15 years) on the initial 13 million investment.
The point is a simple one, at these prices it is a very low profit investment, hardly worth the risk.
Very interesting and since this is related to Permian it tells something about the future development courve of US Shale. As we all know it started with Thire 1 wells, than Thire 2 guess now most of the wells drilled are Thiere 3 wells. Perhaps in 2025 most wells will be Thire 4 wells. Also the cost will increase each year. I guess the consequensis will be less well drilled as simply cost will be to high and ROI might be below inflation, bank interest. How is it with the DUCs in Permian is the best used already? Than guess they need to drill new and that add cost, how much?. There is also a polution aspect that the Goverment is consern about, guess it was Ethane this might add cost. Beside this there have been several Earth Quake impacting produced water wells and as I understood this will add cost to future production. It might be EIA monthly prognose is to optemistic because the future cost is underestimated and it might also oil price forcast is to high.
Rochester , come up with a counter argument along with the data and the maths or follow the golden rule .
Look in the mirror.
Damn, but this site always seems to go south when you least expect it.
People are going to exploit whatever they can to make money for themselves. There are very few saints amongst us. The most applaudable task in oil and gas is to find it, drill it, produce it, always being a good steward of the land and the well. There aren’t many Mike Shellman’s in this old world. And the work takes a toll, and then they sell their business to someone they hope will be as good a steward as they were–only they may not be able to make it work, mainly because good sites to drill are becoming as scarce as hen’s teeth.
It’s an angry time. Enter shale oil and gas. These people are making money where they can. And yes they have botched it at times. Regarding royalty “burden,” there would be no damn land on which to drill if not for some poor folks whose forefathers decided to make a stand on a shitty looking piece of land. After a hundred years, they finally lucked into some money. Sorry but that’s part of the deal. And other people sometimes came in and bought some of that royalty, hoping to be a part of the fabled oil and gas industry. That’s part of it too.
The stripper wells play a large part of the landscape of American oil and gas. But so does tight oil and gas, whether we like it or not.
I wish Mike Shellman the very best. He’s an angry man, because he’s retiring from something he loved doing. I know the feeling. But he’s in a good spot too. He writes like Hemingway, and he has a photographic gallery of unequaled proportions, about the macho elements of making wells, putting out fires on wells, and human suffering and toil. No one on this board has the gravitas to put down Mike Shellman, because no one can throw as large a shadow.
I’m going to mosey on down the road after this. I hate these wannabe hotshots making half-assed remarks that they think are cute. On this board you can’t fart crosswise without someone with a presumed bigger IQ calling you for it. So adios, boys. I hope you enjoy the mud-fight.
Sorry if my posts were a problem. Just how I see it.
Shale no doubt has been huge for the USA.
Regarding royalty, 1/4 makes things tougher than 1/6 or 1/8 is all I meant.
AMEN!!
Sorry Gerry,
I don’t moderate every comment so some bad stuff slips through. Rochester has been banned.
I agree Mr Shellman writes excellent posts.
Are you NONY?
If so, this would be no surprise.
NONY is, after all, the ultimate consumer, who wants more of everything!
Is there something missing from this thread? It’s not cohering for me.
Mike B,
Yes some comments have been deleted.
Dennis.
You can delete mine that refer to a specific poster.
Sorry to get testy on here. I will do better to ignore the personal attacks in the future.
I really appreciate Gerry’s posts here, hope he continues to contribute.
Shallow sand,
We are always happy to have the perspective of oil men here, thanks for contributing. Sorry that sometimes bad stuff filters through, sometimes an initial comment by a person seems reasonable and they get approval and then I miss the bad stuff that pops up later. I also hope that Mr Maddoux continues to comment, but we may have lost him.
I will comment that I generally agree with Mr, Maddoux’s comments here.
I very much appreciate the comments he and LTO Survivor make, as they actually own or have owned interests in shale wells.
I’m not anti-shale. I was anti-shale,” is low cost oil, with break evens of $25-$30 per barrel.” It made things pretty hard on us a few years ago, because the oil market seemed to be buying what the shale CEO’s were saying about well costs.
It also led US policymakers to believe sub $2 gasoline, or at least sub $3 gasoline, should be the norm. I think President Trump was quoted that a fair price for a barrel of oil was $40. A famous quote from a CNBC commentator was that oil would never be $44 again in his lifetime. The response I would get when I’d say our stripper production cannot make it on $40 is, “well then you cannot compete, you will just go bankrupt, too bad, so sad.”
The above is my primary beef with shale. Secondarily, I don’t understand the idea of throwing spacing requirements out the window or allowing tremendous amounts of natural gas to be flared. Very short sighted stuff IMO.
Based on the December, 2022 US production as reported by EIA, maybe $75 WTI no longer will cut it, except in two New Mexico counties.
Thanks Shallow sand,
I agree, at $60/bo at wellhead, 35% of crude price for NGL, and $2.75/MCF for natural gas, the average 2020 Permian well (current wells may be less productive than 2020 wells, but I assume they are similar) pays out at 60 months, if average well cost is $13.5 million. At $44/bo at wellhead, the well never pays out, total net revenue over the life of the well would only be $12.5 million, a net loss of $1 million on a $13.5 million investment.
Recent tight oil data suggests an average annual rate of increase of about 488 kb/d per year from March 2021 to December 2022 for US tight oil. Permian annual increase about 491 kb/d per year over same period (monthly rate of about 49 kb/d). Note that over 100% of the US tight oil increase over this period is from Permian basin tight oil output.
The Permian rate of increase over this period is about 11% per year, my first Permian scenario presented above has Permian output increasing at about 8% per year in 2023 and 2024 and with a lower rate of increase from 2025 to 2027.
By coincidence the World rate of increase from Jan 2005 to Dec 2024 (using EIA STEO for 2023 and 2024) is similar to the US tight oil increase for the past 22 months.
Or more simply put, for all US oil production the 6 month rate of increase (between August 5th and January 27th) is….
ZERO!
2022-Aug 08/05 12,200
2023-Jan 01/27 12,200
C’mon Dennis – Using the COVID rebound to evaluate US growth in oil production is a fools errand.
The average US production at time of pandemic (March 2020) was over 13,000, which had increased 1,000 over 12 months. That’s an annual increase of more than 8%.
Annualized production increases aren’t anywhere close to 8%.
June 2022 (11.95) vs Dec 2022 (12.125) equates to right around 3% annualized growth.
Don’t exclude the pre-COVID peak! It’s there for a reason…
Kengeo,
Read the charts, they are US tight oil production and Permian tight oil production. The weekly data is not good and if you are going to look at trend data it should be at least 12 months or 52 weeks to reduce seasonality from the data. Fairly basic for most.
Kengeo,
Here’s the past 12 months for US tight oil and Permian basin tight oil. In this case we have seen a larger rate of increase for US tight oil (700 kb/d per year or roughly 9% per year) compared to Permian only (580 kb/d per year or roughly 12%).
Note that if we don’t cherry pick our data and use the past 52 weeks of US weekly crude output estimates and take the OLS (ordinary least squares) trend we find an annual rate of increase of 526 kb/d per year, roughly a 4.4% annual rate of increase in US C plus C output over the 52 week period from week ending Feb 18, 2022 to week ending Feb 17, 2023.
Just for the record . Comparisons of oil data before the war and today .
https://twitter.com/anasalhajji/status/1629785351018487808
Has Peakoil.com been plugged and abandoned? There has been nothing new since the 14th that I can see.
George , I can see posts of today 28th Feb .
Who is the greater fool?
Can someone with knowledge of Ranger oil comment
https://www.theglobeandmail.com/business/industry-news/energy-and-resources/article-canadas-baytex-energy-nearing-25-billion-deal-for-us-peer-ranger-oil/
Ranger Oil – bankruptcy and name change in 2015, originally it was mostly a conventional gas producer, but since 2012 concentrated on oil. For all announced discoveries and extensions since 2010 or so 60% have subsequently been written off in negative revisions – i.e. reserves have been overstated to a factor of two and a half, which is the worst I’ve seen for any company.
Another couple of examplrs of reserve losses: Cabot was exclusively a nat. gas producer until buying Cimarex in 2021 and becoming Coterra. Last year, despite high gas prices it wrote off 25% of its gas reserves (just about as much as it had acquired in the Cimarex purchase).
Continental Resources is supposed to be going private, but there was still a 2022 10-k report. CLR have been among the worst for overstating reserves and having continual negative revisions, and that continued. So far about 35% of all declared discoveries have been subsequently written off.
I have considered Harold Hamm after the guy at CHK , name was Aubery something to be a snake oil salesman .
Thanks George
I hope Baytex got the correct reserves info.
Ovi, Ranger is a mis-mash of Za-Za, Earthstone, Lone Star, Penn Virginia and a host of others. They operate in my backyard, I have followed them, out of necessity, and for financial reasons for 12 years. Their wells in Fayette, Lavaca and to the NE, suck. Fewer than 10% EVER reached payout. I drive by these wells all the time, the royalty owners in this shit I have known for 70 years. IB one. Baytex just bought an horrendous plugging liability as I know first hand what well production is and what lease covenants are regarding P,A, and D. I helped write them.
https://www.forbes.com/sites/davidblackmon/2023/03/01/baytexranger-oil-combination-first-of-its-kind-in-almost-a-year/?sh=5d84fb625781
How fucked up is journalism today, about tight oil? Who better to judge that by than David Blackmon? This was a horrible thing for Baytex to do, but Blackmon needs something to write about. Mergers and acquisitions, kissing your sister, or swapping spit, are somehow a function of strength and hope? Phfttt.
Blackmon needs the hundreds of dollars he made from writing this. Truth, or accurate reporting ( I just watched All The Presidents Men on TMC!) means nothing to anybody anymore.
The EIA Petroleum Supply Monthly is out with USA C=C production data for December 2022.
US production was down by 276,000 barrels per day to 12,101,000 bp/d. North Dakota was down 135,000 bp/d, and Texas was down 65,000 bp/d.
Maybe $75 WTI and very low natural gas and NGL prices only work in Lea and Eddy County, NM?
Shallow sand,
Perhaps, but severe winter weather may also have reduced output to some extent, probably a combination.
Dennis. I’m aware the weather was a major factor in ND.
Don’t recall if it was in other states? NM seemed to be the only one not flat to falling.
Shallow sand,
It has been pretty snowy this winter in the Rockies so some Western States such as Colorado, Wyoming, Utah, and Montana may have been affected by winter weather, not sure about Texas and Oklahoma, but sometimes colder weather than normal in the South during winter causes freezeups etc. It seems weather has been pretty strange this winter where I live, not sure about elsewhere.
We had a cold snap in December with multiple days below zero, followed up with temps in the 50’s.
Since then it has been a very mild winter, almost no snow. Today it was sunny and 56. Tomorrow is supposed to be 70. Was almost 70 Monday, with 35-50 mph winds and several tornadoes sighted.
We have a lake behind our home. Other than in December, it has barely had any ice on it at all. I recall many times walking across it in the winter.
We were only frozen up a few days in December on our low volume wells. I can recall years where we were frozen up on those leases from December into early March. Very variable winters in the Midwest. 2013-14 was a tough one.
On the other hand, our summers have been cooler and with more rainfall. Except 2012, which was the hottest, driest summer in my lifetime. Way worse than the droughts of 1983 and 1988.
Sorry for the anecdotes, lol.
Shallow sand,
Was the cold snap in December enough to affect monthly output for December? I think your anecdotes are wonderful. Lately it has been pretty snowy in Northern New England, ski conditions for the past week have been great. Generally the winter has been mild with weird very cold and very warm periods (relative to historic norms).
We lost a few barrels a day for about one week.
Attached is US December oil production. It is 12,101 kb/d and down by 276 kb/d from November. The biggest drop was in North Dakota 135 kb/d followed by Texas down by 65 kb/d. NM was up by 46 kb/d to 1,770 kb/d, a new high and on the verge of possibly passing the GOM.
Excuse the clarity of the attached file since I am on holidays. I expect to post the full US report on Saturday March 3.
Ovi,
Thank you for all the work you do. I am really so absolutely confused by the recent production drop and the simultaneous massive crude oil builds. Either demand is way down and we are entering a massive recession or the governmental agencies are “painting the tape” to keep oil prices lower. It does not add up unless demand is down 1 million barrels as day or President Biden is still draining the SPR at 1 million barrels a day.
Or some oil companies have snatched some discount russian oil deliveries on the grey marktet.
They are floating all around the world now that the boycott is in action. We will only know on the long run.
For oil consumption, are there anywhere additional numbers? Something like sales on gas stations, they should at least give hints at the trend.
Big blizzards in the USA hamper down not only oil production but driving, too. No way to take a long road trip in these conditions.
I’m just guessing, but I think even when the economy is not strong, there is no hard beginning of a recession with deep suppressed fuel sales with a start day of 1.1.2023.
Global trade is down. Take a look at Baltic dry index. Take a look at all the container ships parked off the coast of China.
Can’t take official numbers at face value. And not just in China. I’d say oil demand is down even though official data might not reflect that. By how much is not certain. WTI in contango.
If China manufacturing was rebounding like they say it is. China would be buying all they could get. WTI has no reason to be in contango by looking at the official data by yet it is.
HHH , no one is listening . Maybe now they will .
https://www.moneycontrol.com/news/opinion/signals-about-the-global-economy-from-shipping-containers-10178281.html
https://www.bloomberg.com/news/articles/2023-02-27/hong-kong-exports-plunge-by-most-in-70-years-as-demand-plummets
https://www.bloomberg.com/news/articles/2023-02-28/world-s-biggest-chemical-maker-sees-profit-slump-in-late-2022#xj4y7vzkg
https://www.msn.com/en-gb/money/other/irelands-energy-crisis-threatens-blackouts/ar-AA181Iv1
Thank you windpower .
https://www.siasat.com/finland-sinks-into-recession-2537465/
https://www.telegraph.co.uk/business/2023/03/01/recession-looming-germany-much-bigger-bind-britain/
https://www.nzherald.co.nz/world/south-africa-faces-civil-war-conditions-due-to-possibility-of-power-grid-collapse/5TFXMJFSHJHAZNRUXIVHBHRJXA/
The Olduvai comes to South Africa .
I can add more links but there is no cure for cognitive dissonance . Just because it hasn’t happened to you doesn’t mean it is not happening .
Today in France the chain of stores going into receivership are GAP , Go Sports , Galleries Lafayette ( 22 locations) , Cafe Legal , all located in prime city locations .
https://www.lefigaro.fr/societes/grandeur-et-decadence-de-l-empire-de-michel-ohayon-20230217
It’s like a hurricane it grows into its power supply dissipating to the maximum at its core. At its margins tropical storms and tornadoes breakout. But as the system weakens the marginal activity dissipates quite quickly.
The Anglo American system has been the core country’s like South Africa are on its margins. The strength of its core can be measured by its margins. The US is desperately trying to hold the system together but is running out of ENERGY. Ukraine
JT . in agreement but I will make it simple to one liners .
1. The cookie crumbles at the edges .
2. The fish rots from the head down .
3 . Collapse starts at the periphery and progresses to the centre .
Meanwhile in France
Restos du Coeur
From 3 to 5 March, Restos volunteer teams will be present in more than 7,000 supermarkets to collect food and hygiene products. The number of people receiving food at the Restos du Cœur has increased by 22% during the “first three months” of the winter 2022/23 campaign compared to last year, to 2.4 million users with a sharp increase in families with very young children.
More than half the people hosted by the Restos du Cœur are under 25 years old. “Inflation and the energy crisis are hitting hard those who were already precarious and others who are becoming so”. The association welcomes “more and more people who are working but still cannot make ends meet”. During winter, the association noted a rise in the number of very young children among families. In November, there were 110,000 children under the age of three and their number increased by 16% in three months. The aim of the association, founded by Coluche in 1985, is to collect 9,000 tonnes of food and hygiene products. ”
This is a translation from Le Figaro . I have earlier said that I desist from making such posts , but some just cannot be ignored . Most of the readers here are from North America , I make an effort to inform them what is happening at the core ( Benelux , Germany, France ) in Europe . If you have objections please post , I will stop .
Here’s a possible scenario…
LTO Survivor
Much appreciated.
The inventory numbers are a tricky thing to understand. It is question of imports vs exports, refinery inputs and a correction factor. The correction factor is based on the assumption that the people reporting the oil in storage tanks are doing it accurately. An assumption I find difficult to accept. Humans make errors.
Attached is last week’s balance sheet from the weekly EIA data. Again excuse the poor quality because I lack the tools I have at home.
The net daily imports were (line 4) 1,729 kb/d. That alone gives 12.1 million extra barrels for the week. Note the crude build was 7.6 million barrels. Add in the correction factor of 2,073 kb/d that is supposed to account for other number differences.
If I were home I would show you the balance sheet that puts all of these numbers together to give the proper build. However it is those two numbers that are critical. Below is a link to an analyst who rails against the “Adjustment” factor. As noted above excess imports are also a crucial factor.
The large inventory increases should stop within a week or two as refineries come off maintenance. Also US gasoline demand is on the rise. It increased by 636 kb/d last week to 8,910 kb/d. It should be staying over 9,000 kb/d shortly.
https://blog.pricegroup.com/2023/02/24/give-or-take-the-energy-report-02-24-2023/
Crude Oil Peak website had a piece today on 2022 Texas electricity generation
indicating that Nat gas accounted for 36%, Wind 25%, Coal 17% Nuclear 10%, Solar 6%
of total output.
https://oilprice.com/Alternative-Energy/Wind-Power/Wind-Power-Accounted-For-25-Of-Texas-Electricity-Generation-In-2022.html
Interesting to consider that less than 1% of the solar reserve of the state has yet been tapped into.
There are very few places in the world with an abundant mix of energy reserves. Maybe nowhere.
pie chart from ERCOT- the Texas grid operator
Hickory,
Now just imagine, in approximately 15 Years (plus or minus), just about ALL of that 25% of Wind Power will have to be replaced or repowered.
Due to high O & M Costs, most wind turbines become uneconomical after year 15. Some reach that sooner, but 15 years is now typical.
It will be interesting to see how the world is able to add and replace old wind turbines as fossil fuel prices continue to rise in the future.
steve
At the moment technological advance is still very strong with wind mills.
And with wind it is as with oil – the best place first. So having a windy spot plastered with old 500kW or even 250kW mills where you could build current 3-5 MW mills is a temptation to tear down the old ones and replace them. It will bring more profit than building the new ones on a class B spot.
As in every technology, progress will getting slower over time. Then it will be best to wear as much lifetime out of the installations by maintaining them as financial solid.
In 15-25 years it will be worth it to replace any components that need it.
Similar to the way nuclear power plants need refueling every 18-24 months…people find that worthwhile.
“the energy consumed for the manufacture of the wind turbine yielded an energy payback of 0.494 years” [6 months]
The great about wind energy is that the fuel is free.
Texas has deployed less than 2% of the capability to harvest wind energy, yet it already provides 25% of the states annual electricity generation. It will be a big exporter of electricity to other states in the future.
The EcoE is out of whack for the German economy .
https://www.tbsnews.net/bloomberg-special/germany-faces-1-trillion-challenge-plug-massive-power-gap-590590
This brings into focus an issue for the whole world.
No matter what choices a country or a region makes on energy,
huge escalating expenditures are going to need to be made to keep the lights on, the interior temperatures habitable, to keep factories operating , and to keep cargo moving.
A region that just keeps current energy mix without adjustments will pay more and more over time for fuel as fossil energy depletes, and as resource nationalism and conflict becomes more likely.
At the other end of the scale, energy importing countries that make adjustments will need to ramp up investments in the energy sector in a major way.
Perhaps that spending/investment should be considered a priority.
Spend on your strengths…or pay someone else for their excess? If they have some.
Chart- percent of energy spending globally as percent of GDP over a century.
Over 10% may be the new average, or higher. Plan for it.
As I said a few months ago, the next world war will be fought not over gaining more land but over scarce natural resources. The Chinese understand this and are preparing for this scenario. I once heard a Chinese venture capitalist speak at the Aspen Institute about 5 years ago.
He said the American’s think democracy is a form of government. He upset the crowd by saying it is not a form of government but instead a religion. America may be concerned with human rights in Nigeria for example and will boycott buying Nigerian Oil in defense of horrible labor conditions for example . The Chinese; however are not the least bit concerned with the Human rights of the Nigerian people and whether Nigerian workers are killed or treated terrible. The Chinese are only focused on securing oil for their economy and the billions of people they have to feed, clothe and keep warm.
So you are saying that totalitarianism is a better form of government to rule countries during the coming natural resource wars???
No thank you.
Although I do agree with those who believe that democracy practiced in the US is very poorly implemented, and I am personally of the mind that no system of government is well-suited to handle the problems of gross human population overshoot. We evolved in small groups and on average have not come that far.
History has shown that totalitarianism/authoritarianism does not do a good job of selecting leaders from among the population, in fact the trend is toward the leadership being comprised of bully’s with poor judgement and knowledge…surrounded by ‘yes’ men.
There have been a few exceptions, but good luck being one of them.
Hickory,
I am certain that LTO survivor is simply reporting this other individual’s point of view rather than his own.
Thanks for pointing that out.
I mistook the intent.
I am honestly curious, can you tell us about the exceptions please?
Occidental predicts a 4% drop from 4Q 2022 level in 2023 for the world oil production. I saw it in O&G Journal, but can’t find the link right now.
SEPPO,
OXY stated that it forecasts a 4% decline in its own global oil production, not world oil production in 2023.
https://www.ogj.com/general-interest/companies/article/14290411/occidental-forecasts-4-drop-in-2023-global-production-from-q4
steve
Thanks, my mistake, I glanced at it only. Thanks for the link.
I was correct using rrc data. The debate is between eia and rrc data, not about the prediction, or about gasoline being fake.
The eia data is stagnant and the other factors (imports, GOM etc) are falling to conceal any loss.
OPEC oil output rises in February as Nigeria rebounds further
LONDON, Feb 28 (Reuters) – OPEC oil output rose in February led by a further recovery in Nigerian supply, a Reuters survey found on Tuesday, despite strong adherence by top producers to an agreement by the wider OPEC+ alliance to cut production to support the market.
The Organization of the Petroleum Exporting Countries (OPEC)has pumped 28.97 million barrels per day (bpd) this month, the survey found, up 150,000 bpd from January. Output is still down more than 700,000 bpd from September.
https://www.reuters.com/markets/commodities/opec-oil-output-rises-february-nigeria-rebounds-further-2023-02-28/
U.S. Oil Exports May Be Rising But Production Isn’t
Very good article. However, I am only going to quote the last paragraph. Bold mine.
However, with global production set to tighten later in the year with no substantial production increase coming from anywhere, that lid might fall off. Yet even if it does, one thing is for sure, it seems—U.S. oil producers are not going to rush into production growth, possibly ever again.
The end of abundant energy . Report by Goehring and Rozencwaig . You will have to download the pdf , but real good . It is free .
https://info.gorozen.com/2022-q4-commentary-peak-oil?utm_campaign=2022 4Q Commentary&utm_content=239888150&utm_medium=social&utm_source=twitter&hss_channel=tw-940698796903878657
I love their analysis. Very well done. I’m glad you shared it you’re spot on the problem.
Thanks for the link HinH. I will cut and paste one paragraph from this very long article.
Conventional oil production peaked in the non-OPEC world in 2006 and today sits almost
three million barrels below that level. Including OPEC, conventional oil production peaked
in 2015 and sits 4 mm barrels lower today. Twenty years ago, a colossal interest developed
around the concept of Peak Oil and Hubbert’s theories. Since then, interest has switched
from peaking supply to peaking demand. We believe US shale oil production is nearing its
peak. Given how dismal conventional oil discoveries have been over the last 20 years, we
think it’s time to bring back the subject of peak oil. If you attended our recent investor day,
we continuously stressed that this decade would be the “Decade of Shortages.” Hubbert’s
peak is a perfect example of what we believe this decade will bring.
Reservegrowthrulz,
My first blog post was on the Oil Shock Model in July 2012.
http://oilpeakclimate.blogspot.com/2012/07/an-early-scenario-for-world-crude-oil.html
My best guess was that reality would fall between the plateau scenario and medium scenario in the chart below. If US tight oil had remained at the March 2012 level of about 2000 kb/d, that guess might have been correct, but I underestimated future growth in tight oil output. I also missed the future coronavirus pandemic, but reality was covered roughly by the low to high scenarios in the chart below (at least through October 2022). The chart comes directly from the July 2012 blog post.
Crude oil sinks on reports UAE could leave OPEC
According to the Wall Street Journal, the United Arab Emirates (UAE) is having an internal debate about leaving the Organization of the Petroleum Exporting Countries (OPEC). Crude oil prices are falling sharply.
UAE has been looking for OPEC+ to authorize an increase in its production. The report from the WSJ adds that UAE is clashing with Saudi Arabia over production levels and Yemen.
Market reaction
Following the report, WTI lost almost 3%. As of writing, it is moving off lows, trading back above 76.00$. Before the rebound, WTI hit three day lows near $75.75.
WTI extended declines to $1 on the report, from around 60-cents beforehand. Look for either some pushback or confirmation of this in the coming days. If you look at February OPEC production, the UAE is pumping 3.04 million barrels per day and has a baseline of 3.179 mbpd but says it has the capacity to pump 4 mbpd and has plans to boost that to 5 mbpd, perhaps as soon as 2025.
Ovi , storm in a teacup . All the royalty in the Middle East is interconnected by marriage within the families . The “eayila ” honor comes first so all is resolved by the ” eayila” . WSJ can now give run to tabloids . They know nothing about tradition or culture .
P.S : Eayila is english equivalent of ” family “
Has this been posted before ? The end of the oilecene (Oil + Economy ) by Tim Clark . Connecting the dots between oil and the economic system .
https://www.youtube.com/watch?v=CTGCDtoPrqY&t=2s
Didn’t anyone do a multi country profile of barrels of oil, or gasoline, consumed per increment of economic health? Vague recall of seeing such.
Hard to measure the latter. GDP is measured in printed pieces of paper. Not a solid metric.
But it would be a good consumption layout, extracting the economy variable.
Comment on the gas prices at ” The Wolf Street ” . OPM nothing to worry .
“At lot of their production is hedged at higher prices. Shale driller excel in creating gluts that destroy said share drillers. We’ve seen that over and over again. They know how to do that, as long as investors are paying for it (the oldest rule in the oil field is, “never drill with your own money.”) “
Thanks for the oldest rule Hole in Head. I will use it to explain why Hotelling is nonsense.
The Orange basin is starting to look like it could make a contribution the the down slope.
https://www.upstreamonline.com/exclusive/shell-makes-big-oil-discovery-offshore-namibia-results-imminent/2-1-1413816
A new thread reporting US December Oil Production has been posted.
https://peakoilbarrel.com/winter-storm-drops-us-december-oil-production/
A new Open Thread Non-Petroleum has been posted.
https://peakoilbarrel.com/open-thread-non-petroleum-march-4-2023/