A guest post by Ovi
All of the Crude plus Condensate (C + C) production data for the US state charts comes from the EIAʼs February Petroleum Supply monthly PSM which provides updated information up to December 2022.
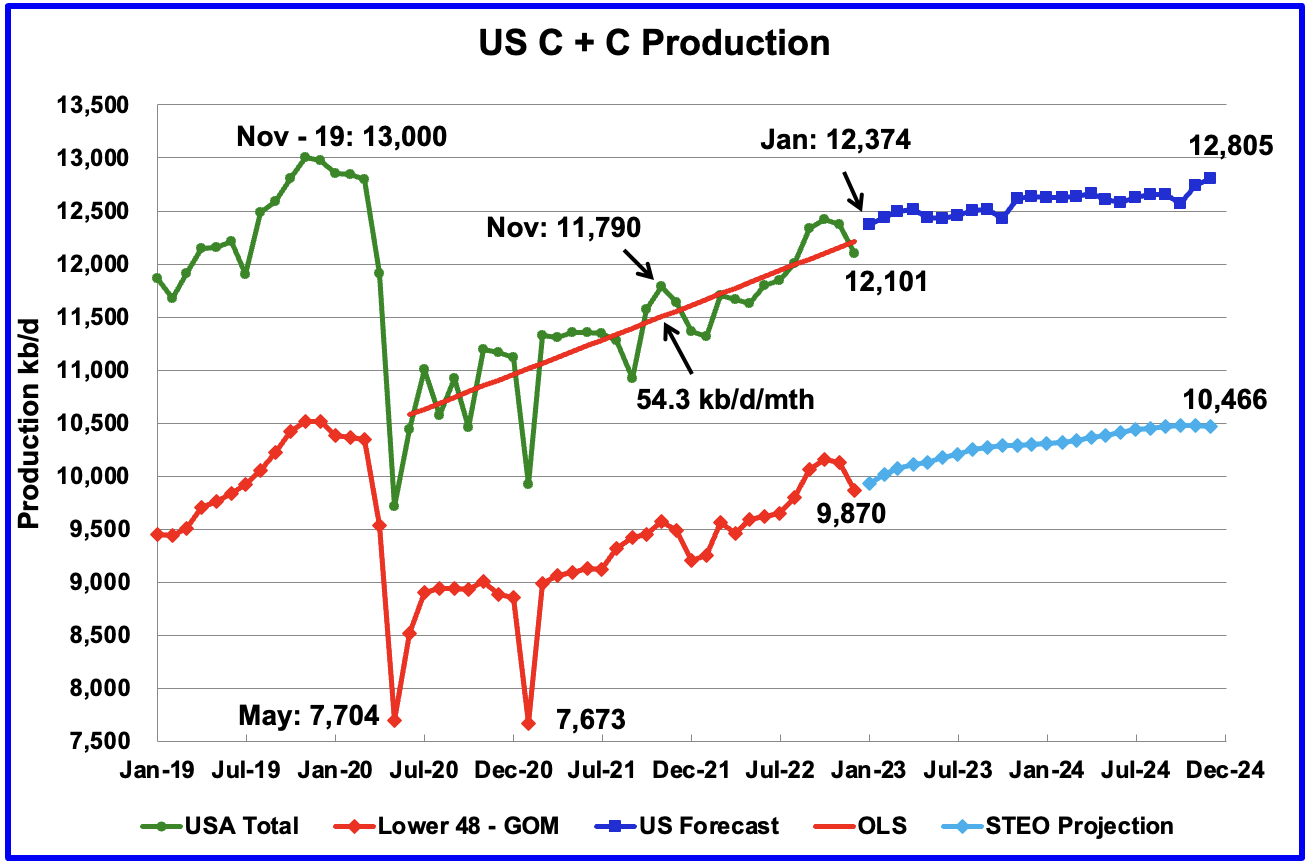
U.S. December production decreased by 276 kb/d to 12,101 kb/d. For December, the state with the largest decrease was North Dakota with 135 kb/d followed by Texas with 65 kb/d while New Mexico had the largest increase, 46 kb/d. The December production decline was caused by bad weather in many states.
The dark blue graph, taken from the February 2023 STEO, is the production forecast for the U.S. from January 2023 to December 2024. Output for December 2024 is expected to be 12,805 kb/d which is lower than the November 2019 peak of 13,000 kb/d. From January 2023 to October 2024, production only increases by 193 kb/d.
The red OLS line from June 2020 to December 2022 indicates a monthly production increase of 54.3 kb/d/mth over that period. Clearly the growth rate going forward for 2023 and 2024, shown in the dark blue graph, is projected to be lower than the 54.3 kb/d/mth seen in the previous July 2020 to December 2022 period.
While overall US oil production decreased by 276 kb/d, the Onshore L48 had a smaller but similar sized drop of 264 kb/d to 9,870 kb/d in December. The light blue line is the STEO projection for output to December 2024 in the Onshore L48. From January 2023, to December 2024, output is expected to increase by 536 kb/d.
Oil Production Ranked by State
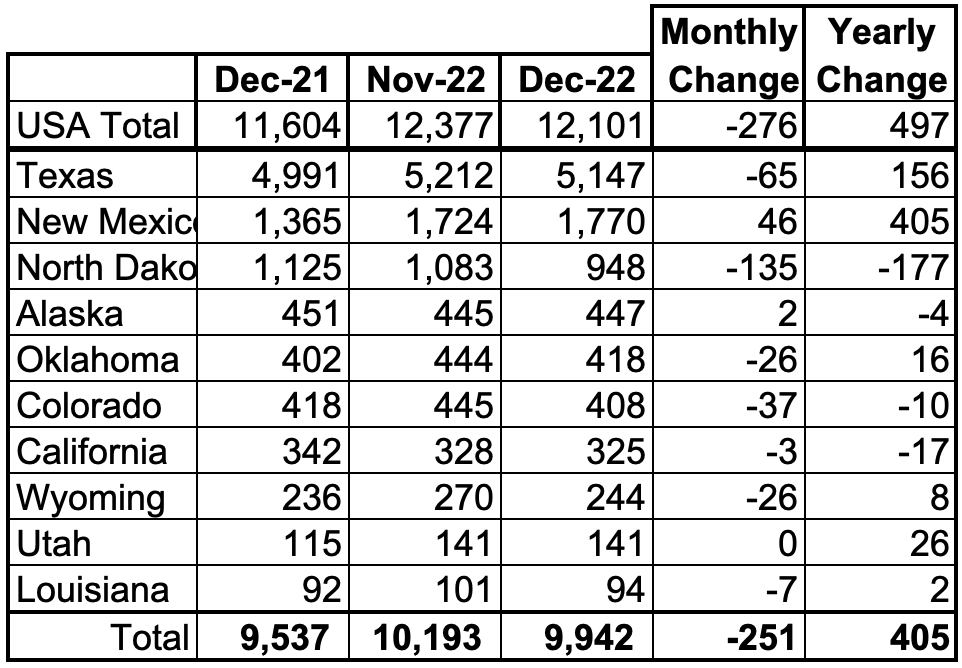
Listed above are the 10 states with the largest US production. These 10 accounted for 82.2% of all U.S. oil production out of a total production of 12,101 kb/d in December 2022.
On a YoY basis, US production increased by 497 kb/d with the majority, 561 kb/d having come from Texas and New Mexico.
State Oil Production Charts
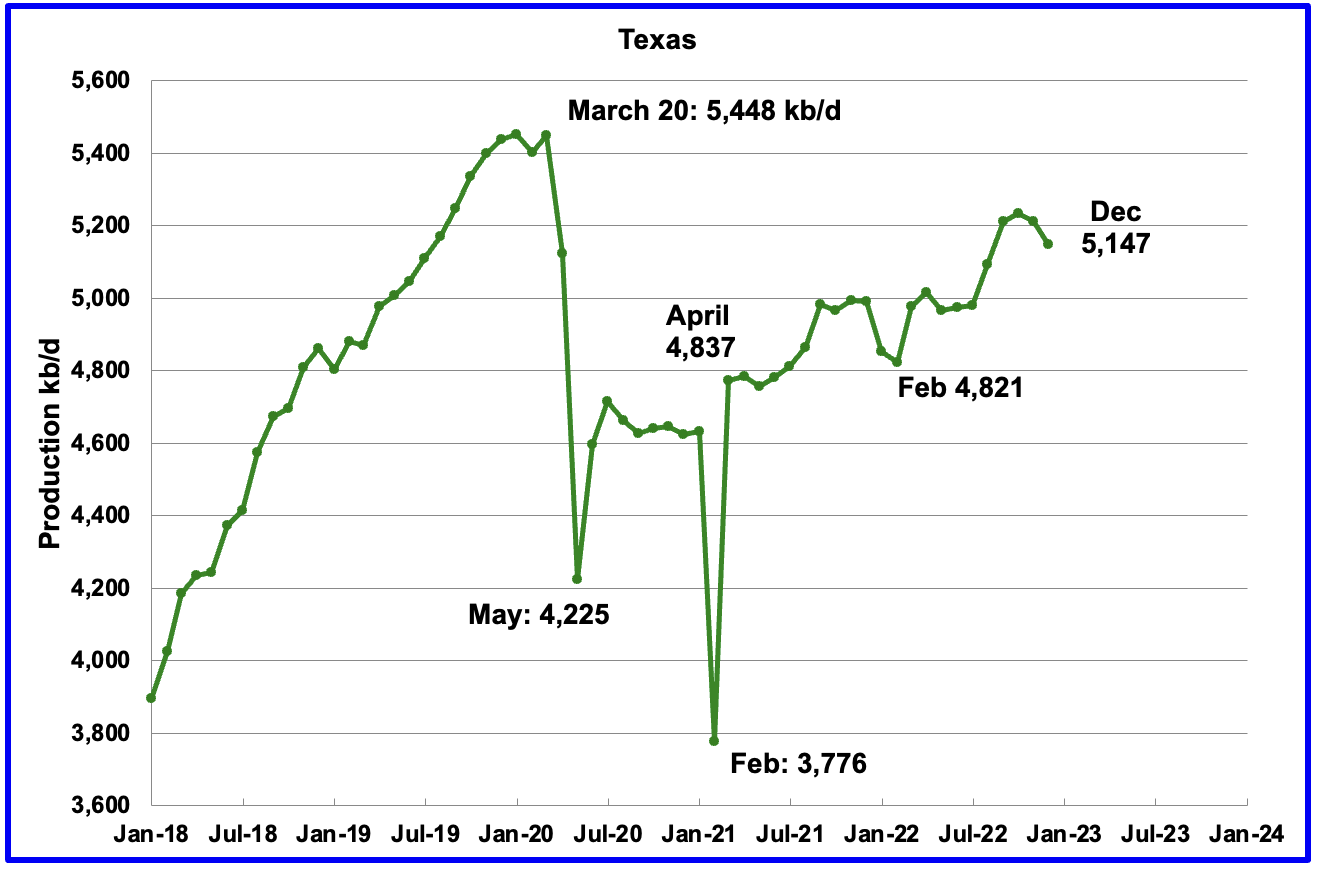
Texas production decreased by 65 kb/d in December to 5,147kb/d. The decrease was due to freezing weather in Texas.
In October 2021 there were 215 Hz oil rigs operating in Texas. By December 2022, 322 Hz oil rigs were operational, an increase of 107 rigs.
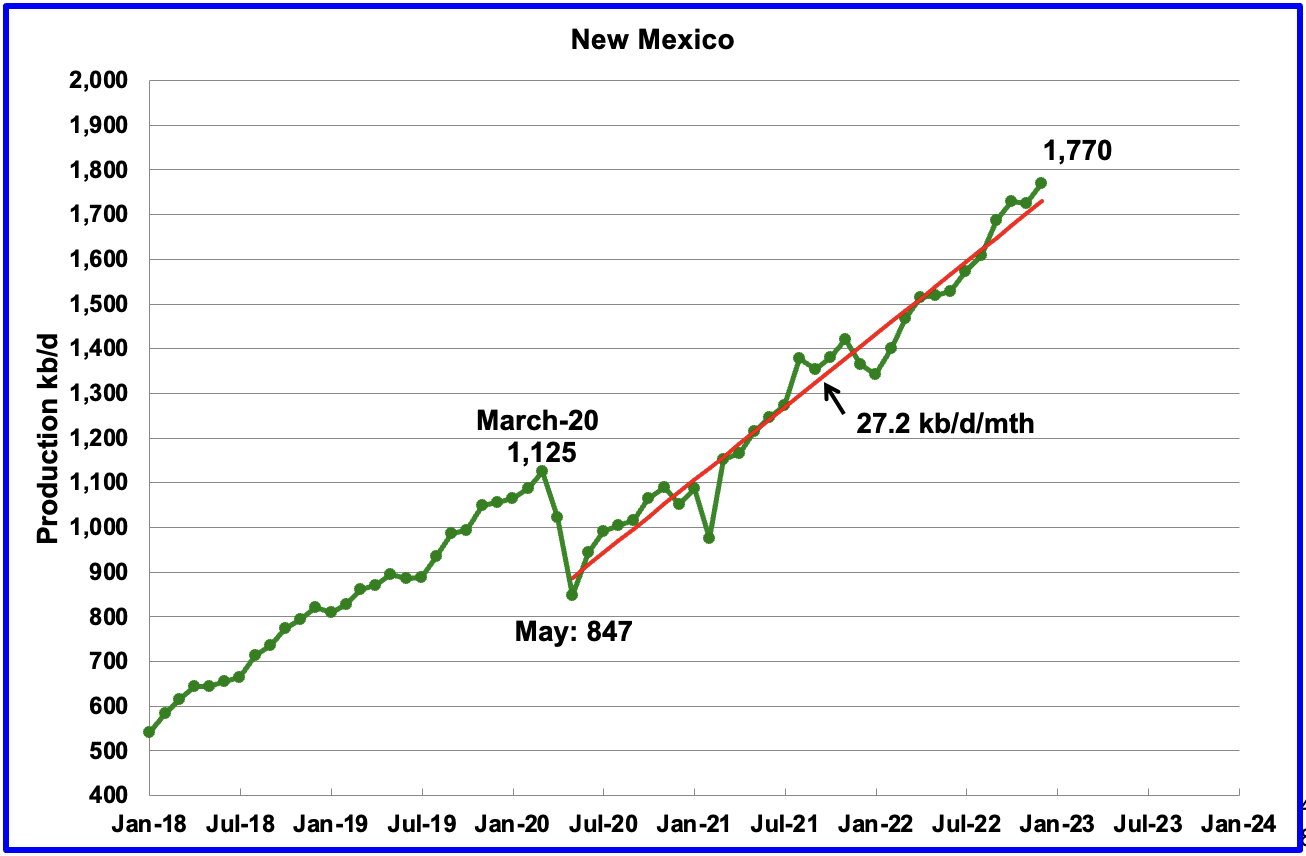
After a short pause in November 2022, New Mexico’s production resumed its climb. December production added 46 kb/d to 1,770 kb/d, another record high.
The red OLS line from May 2020 to December 2022 indicates a production growth rate of 27.2 kb/d/mth and shows no sign of rolling over. Since August, the rig count has been steady in the high 90s, 97 ±4.
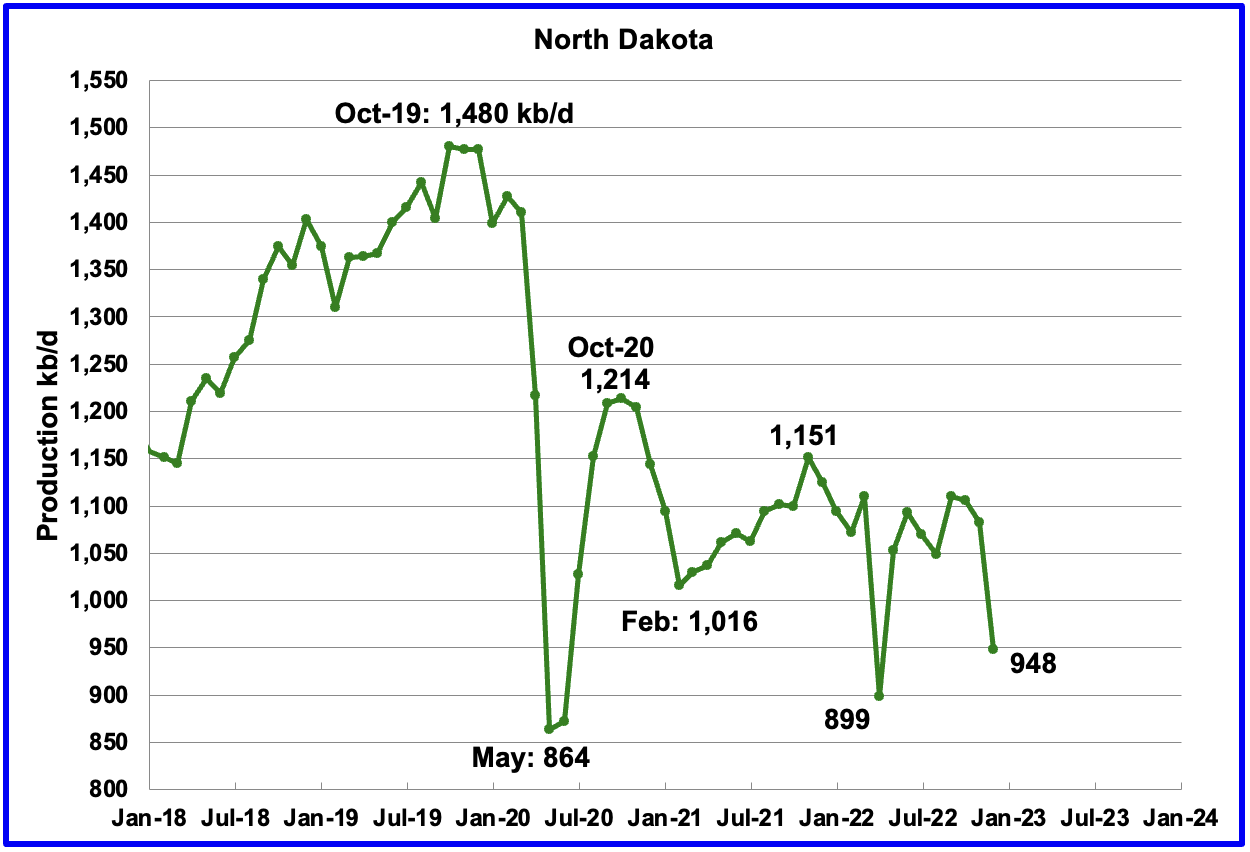
North Dakota’s December output decreased to 948 kb/d, a decrease of 135 kb/d from November. Extreme cold weather impacted production.
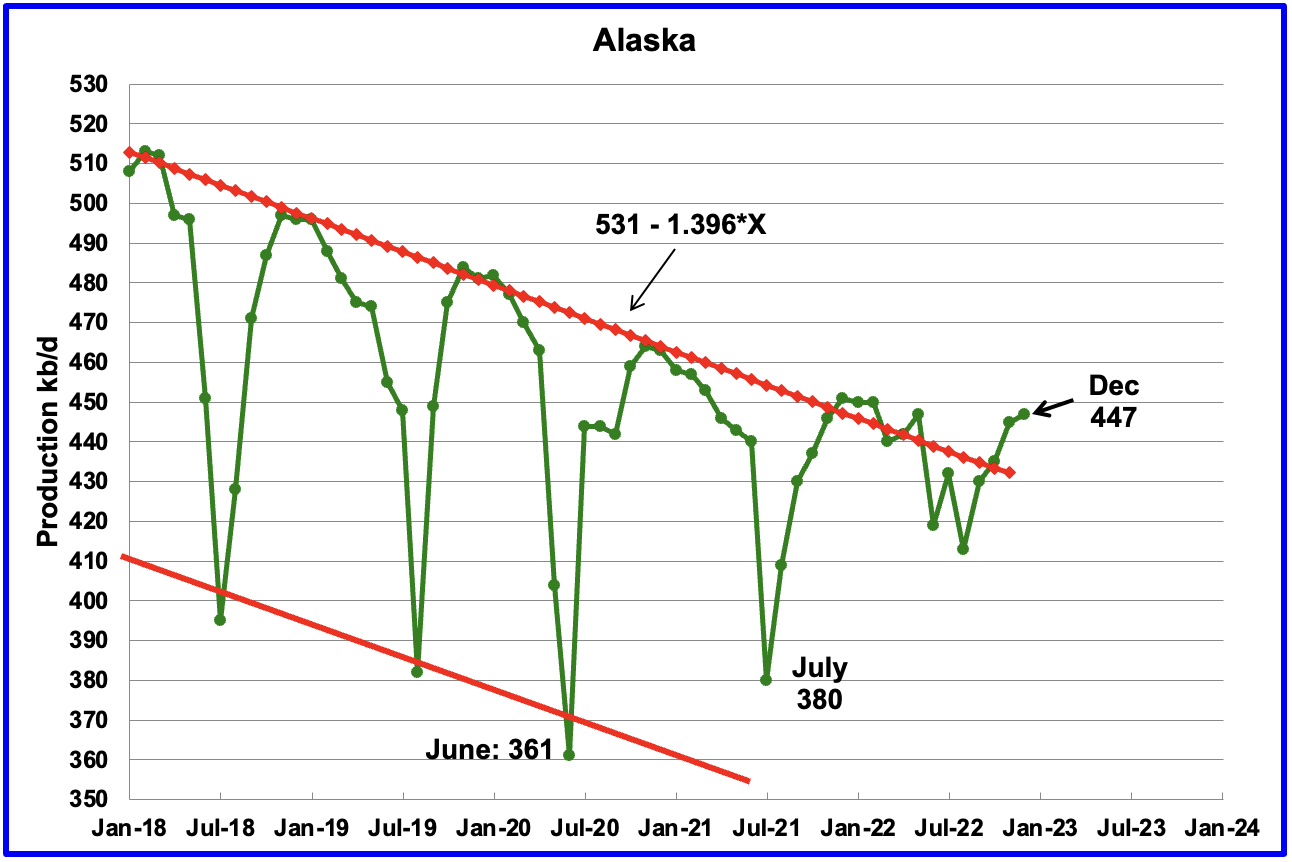
Alaskaʼs December output increased by 2 kb/d to 447 kb/d and was 4 kb/d lower than December 2021. This is an early indication that Alaska may be breaking out from the red declining downtrend line. Note how the summer lows are also higher.
According to this report, the Biden administration has agreed to advance the controversial Willow oil drilling project in Alaska. According to this source, “it’s the largest pending oil and gas project in the U.S., with expected production of 180,000 barrels of oil a day, and 600 million over 30 years. The Willow plan has passed every environmental analysis, would employ union labor and yield a revenue gusher. The final regulatory review was completed in early February, and it’s customary for the feds to give a final go-ahead within 30 days.”
“But the green left opposes Willow as a climate “bomb,” no matter that career scientists in federal agencies say. Willow completed its first federal environmental review in August 2020, only to watch a judge require another one. The Biden Bureau of Land Management (BLM) narrowed the scope from five drilling pads to three, and Willow recently passed another environmental review.”
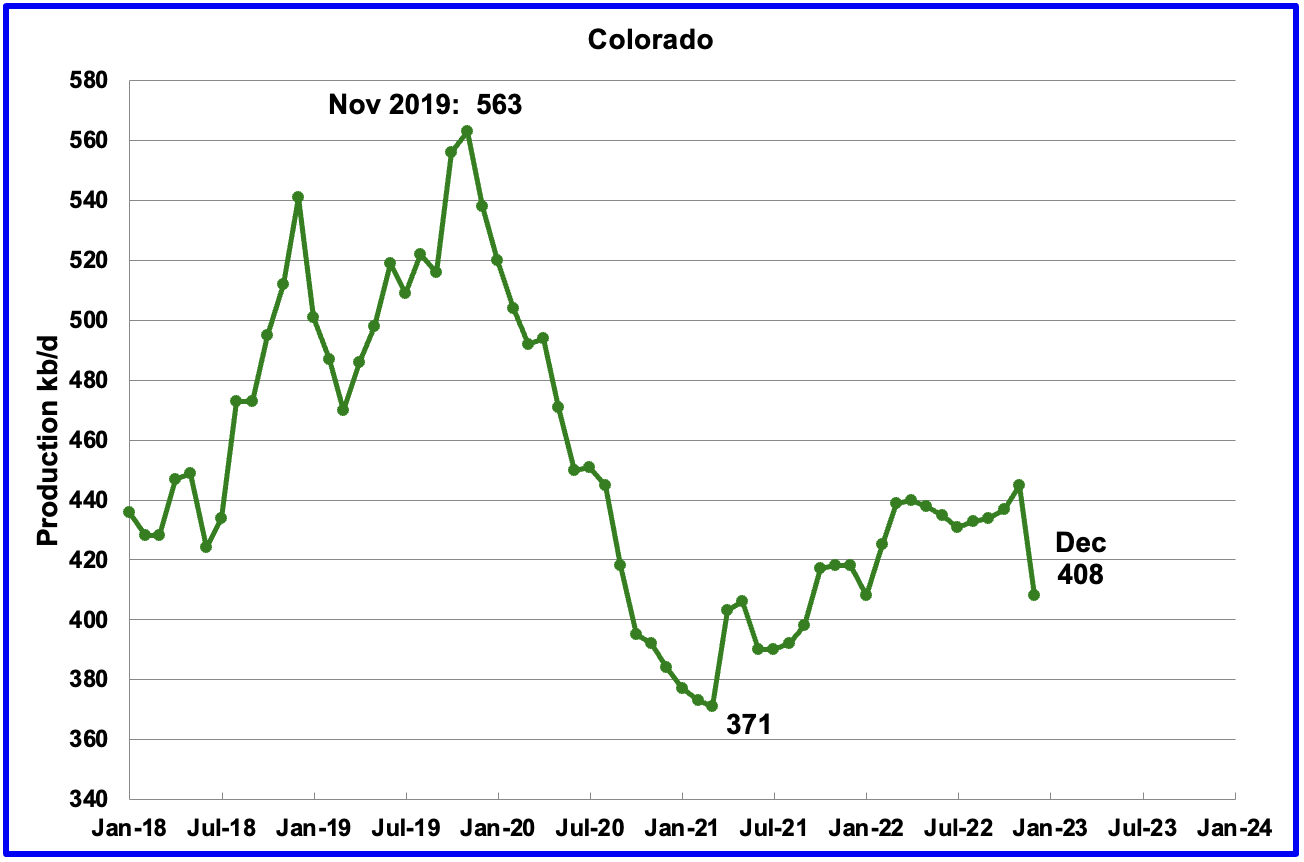
Coloradoʼs December production decreased by 37 kb/d to 408 kb/d. Could be weather related.
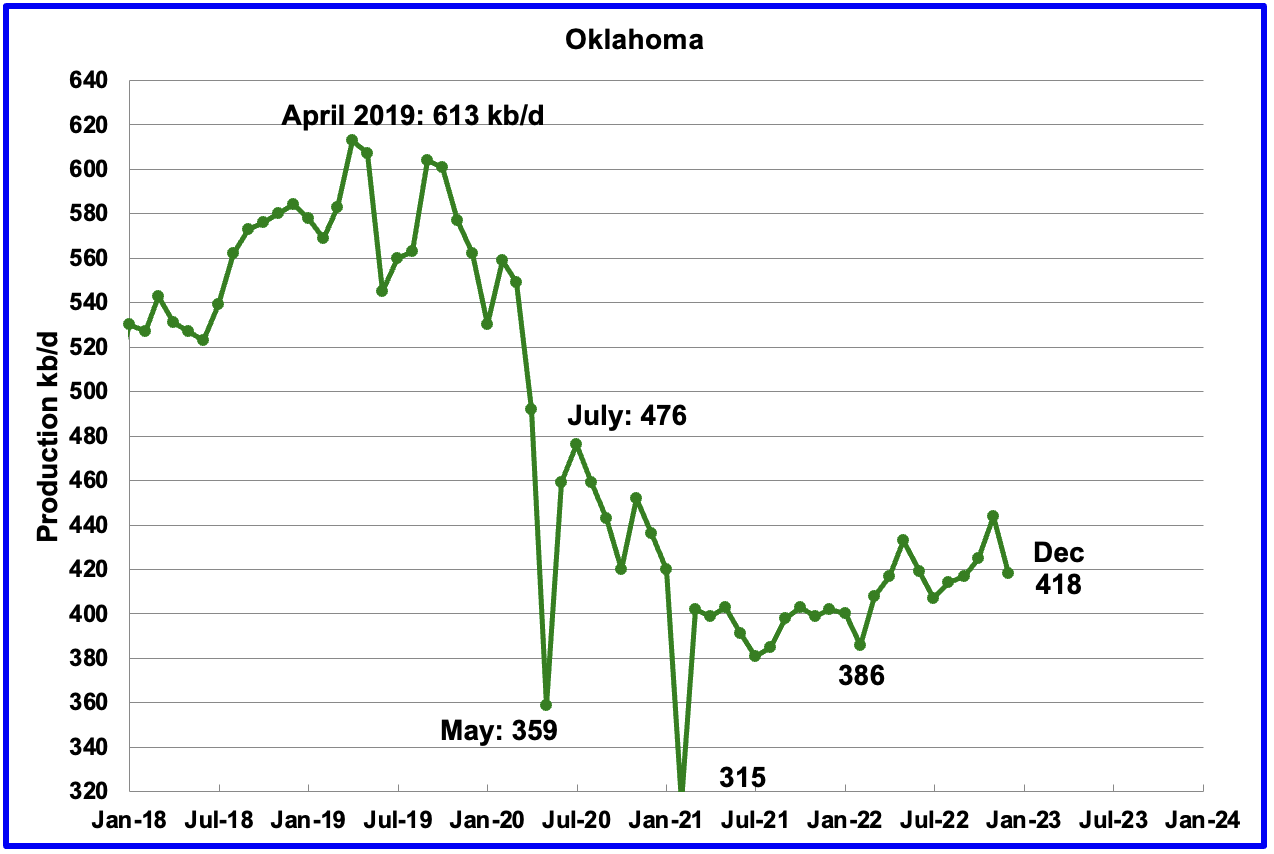
Oklahoma’s output in December decreased by 26 kb/d to 418 kb/d. Production remains 58 kb/d below the post pandemic high of 476 kb/d.
From January 2022 to April 2022, close to 50 rigs were operating in Oklahoma. By late December 2022 the rig count had increased to 65.
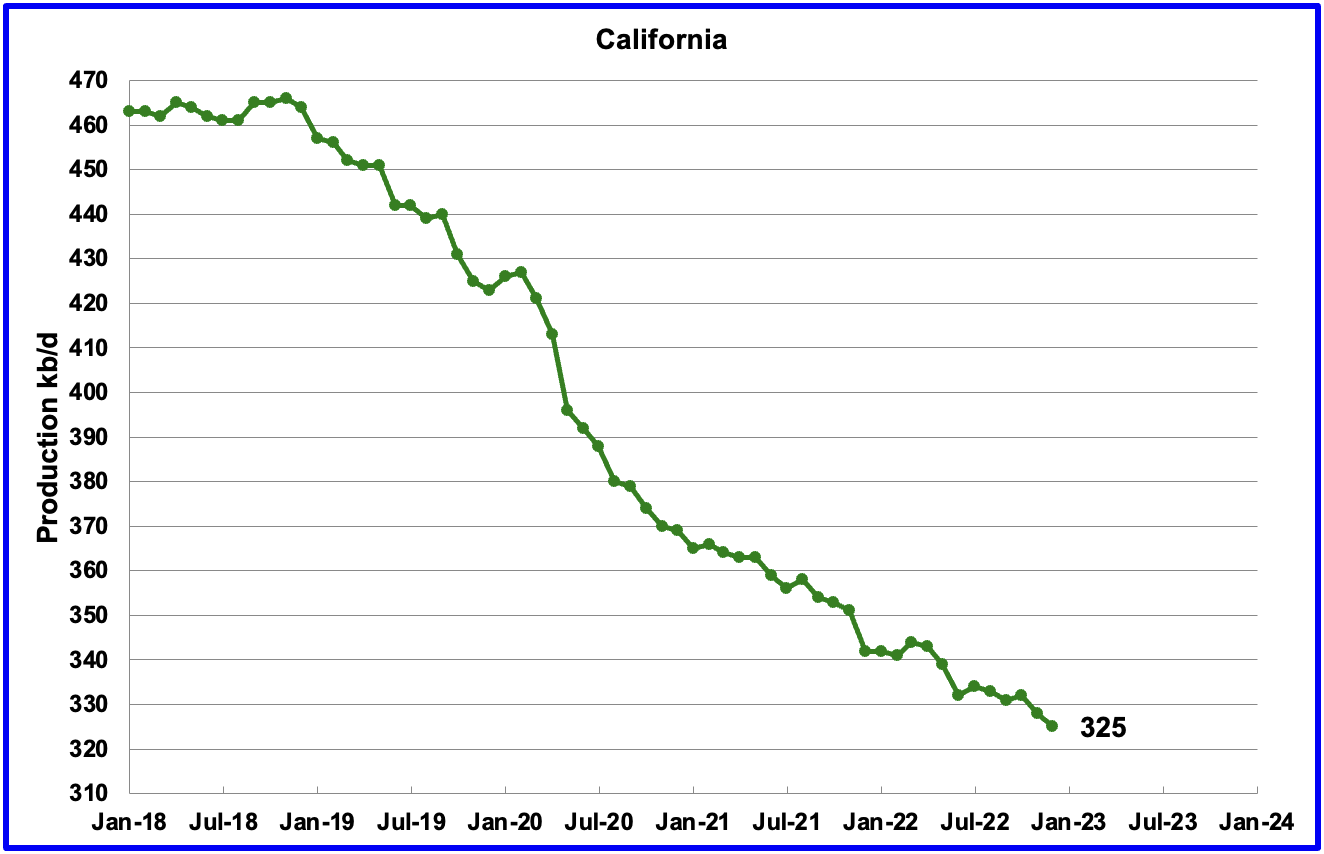
Californiaʼs overall slow output decline trend continues. December production decreased by 3 kb/d to 325 kb/d.
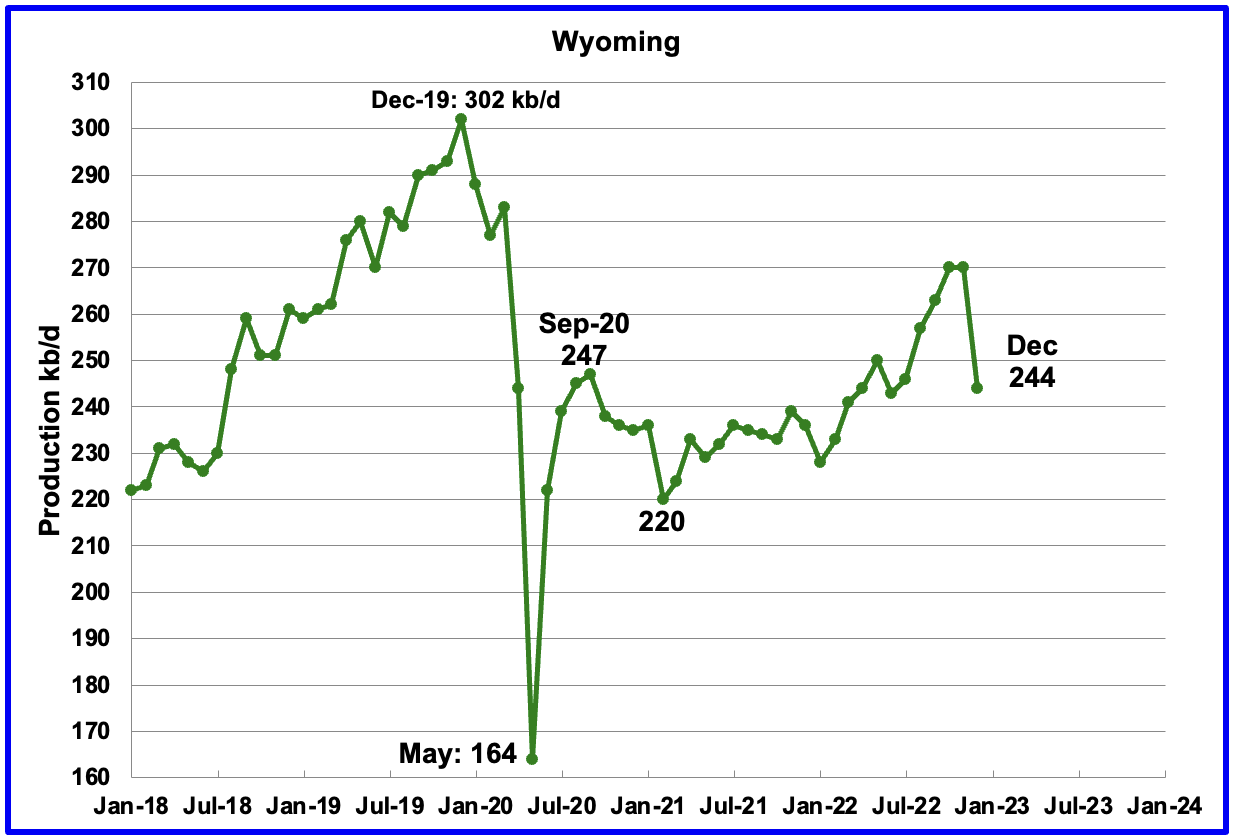
Wyoming’s oil production has been on a slow unsteady uptrend from the low of 220 kb/d in February 2021 due to increased drilling. November’s output reached a post pandemic high of 270 kb/d but dropped by 26 kb/d in December to 244 kb/d. The drop may have been weather related.
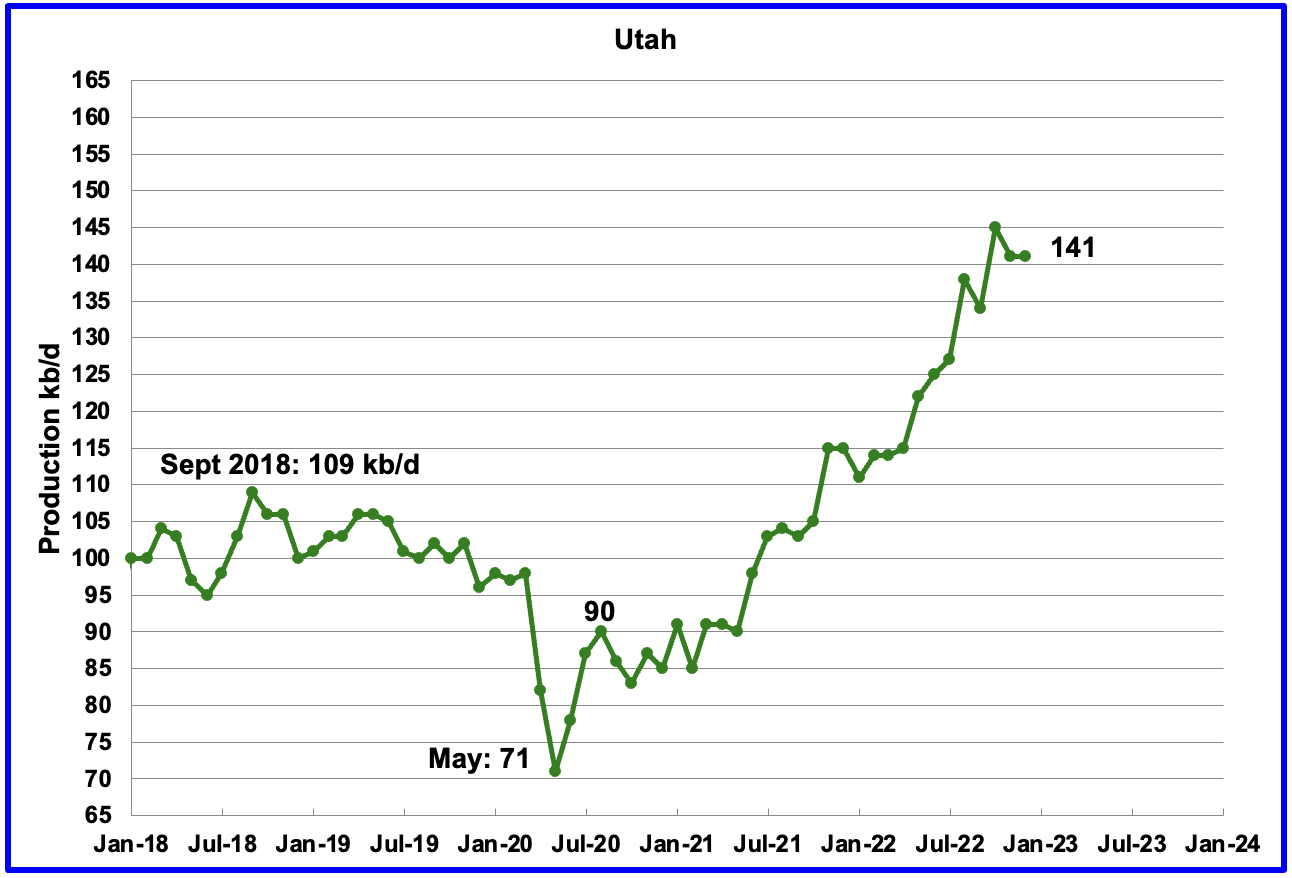
Utah’s oil production had been increasing steadily since January 2022. However November saw a drop to 141 kb/d and December saw production unchanged at 141 kb/d. Utah had 8 Hz rigs operating in December, up from 5 in January 2022.
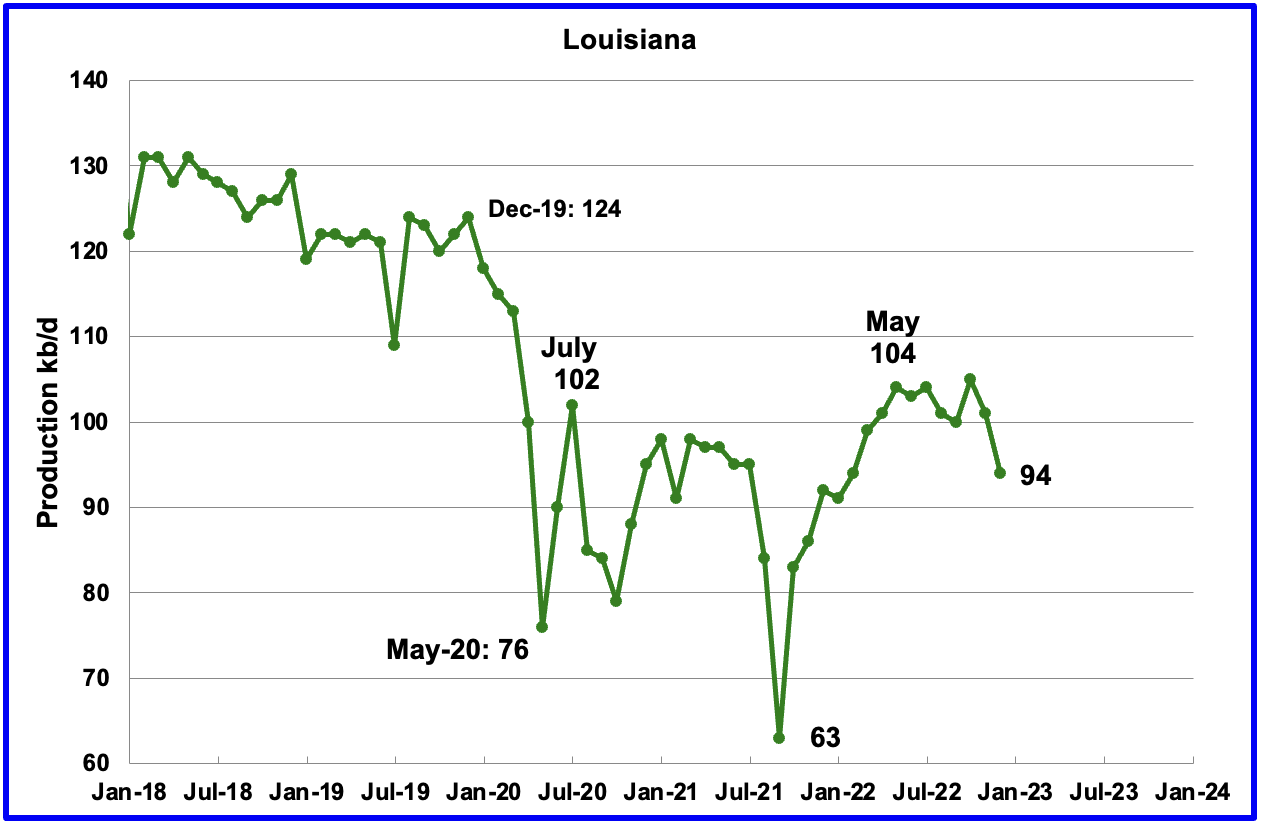
Louisiana’s output rose from the low of 63 kb/d in September 2021 to 104 kb/d in May 2022. Since then output has plateaued. November’s output decreased by 4 kb/d to 101 kb/d followd by a further drop of 7 kb/d to 94 kb/d in December.
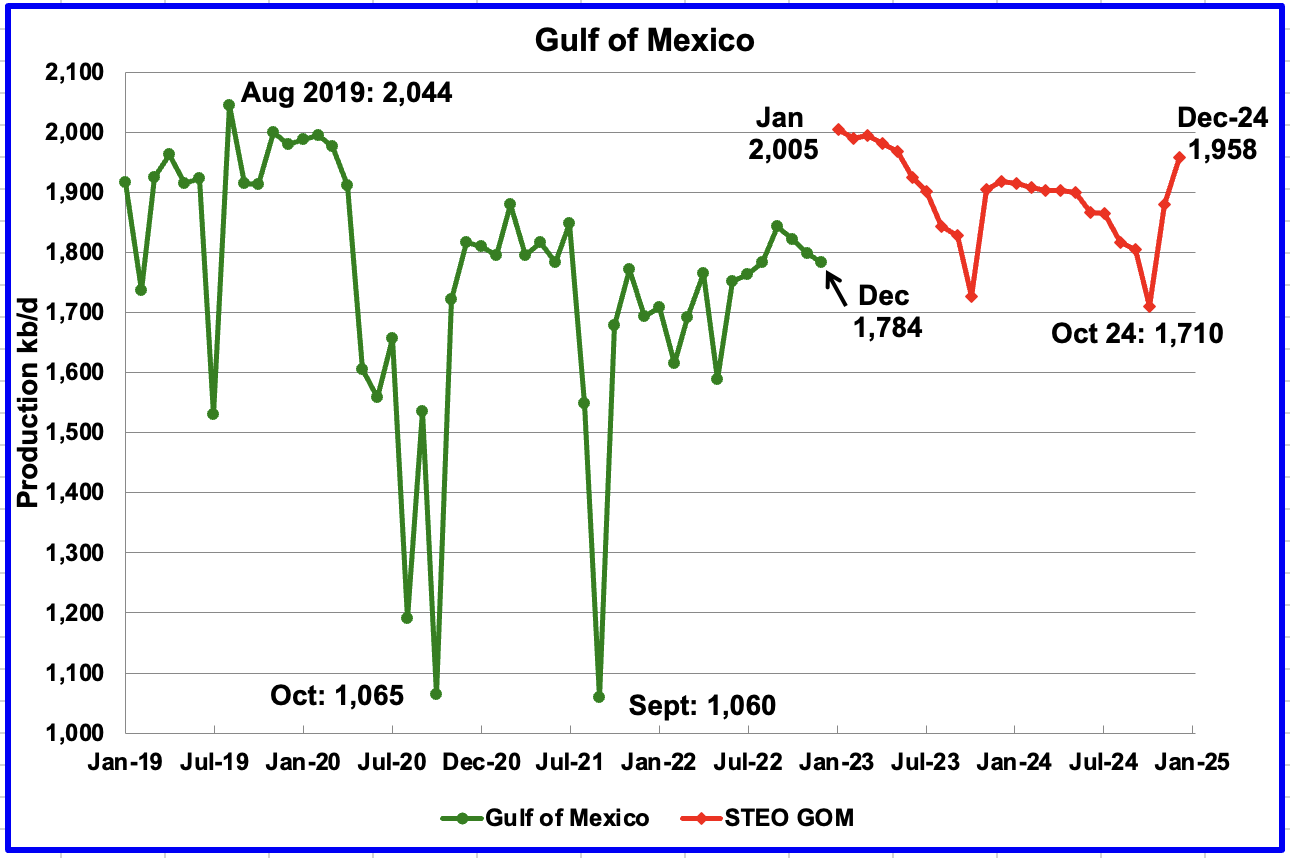
GOM production dropped by 14 kb/d in December to 1,784 kb/d. If the GOM was a state, its production would normally rank second behind Texas.
The February 2023 STEO projection for the GOM output has been added to this chart and projects that output in January 2023 will spike to 2,005 kb/d. The large spike in January is due to the projected startup of the Vito platform.
However Shell announced that the Vito platform had begun production on February 15, 2023. With an estimated peak production of 100,000 barrels of oil equivalent per day, Vito is the company’s first deep-water platform in the GOM to employ a simplified, cost-efficient host design.
The GOM spike will have to be moved back to February 2023 and the increase will be much less than the currently shown 221 kb/d.
For December 2024, output is expected to reach 1,958 kb/d. The production decline in 2023 is due to decline in existing GOM fields not being offset by the increases in crude oil production from new fields.
A Different Perspective on US Oil Production
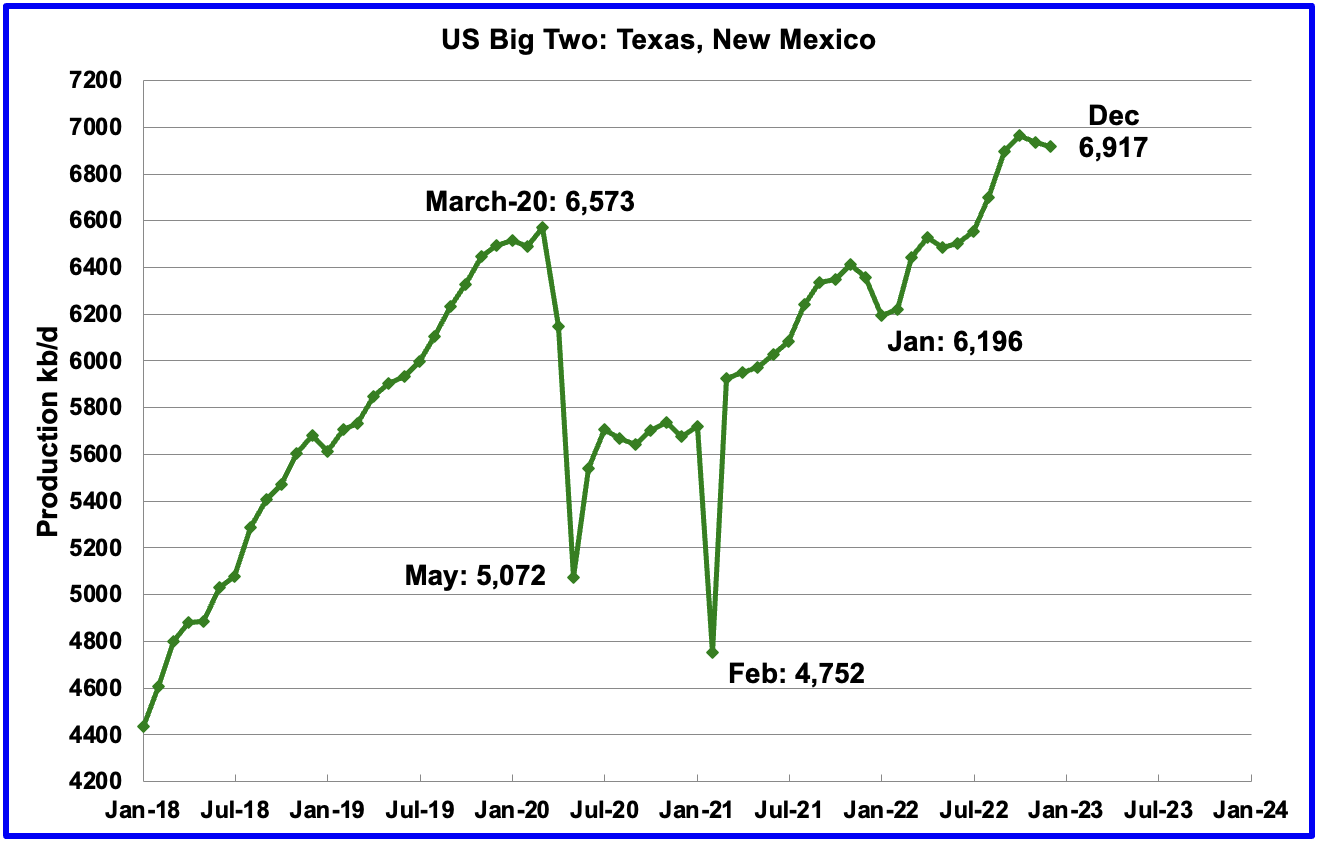
The Big Two states, combined oil output for Texas and New Mexico.
December’s production in the Big Two states decreased by a combined 19 kb/d to 6,917 kb/d with Texas dropping 65 kb/d while New Mexico added 46 kb/d.
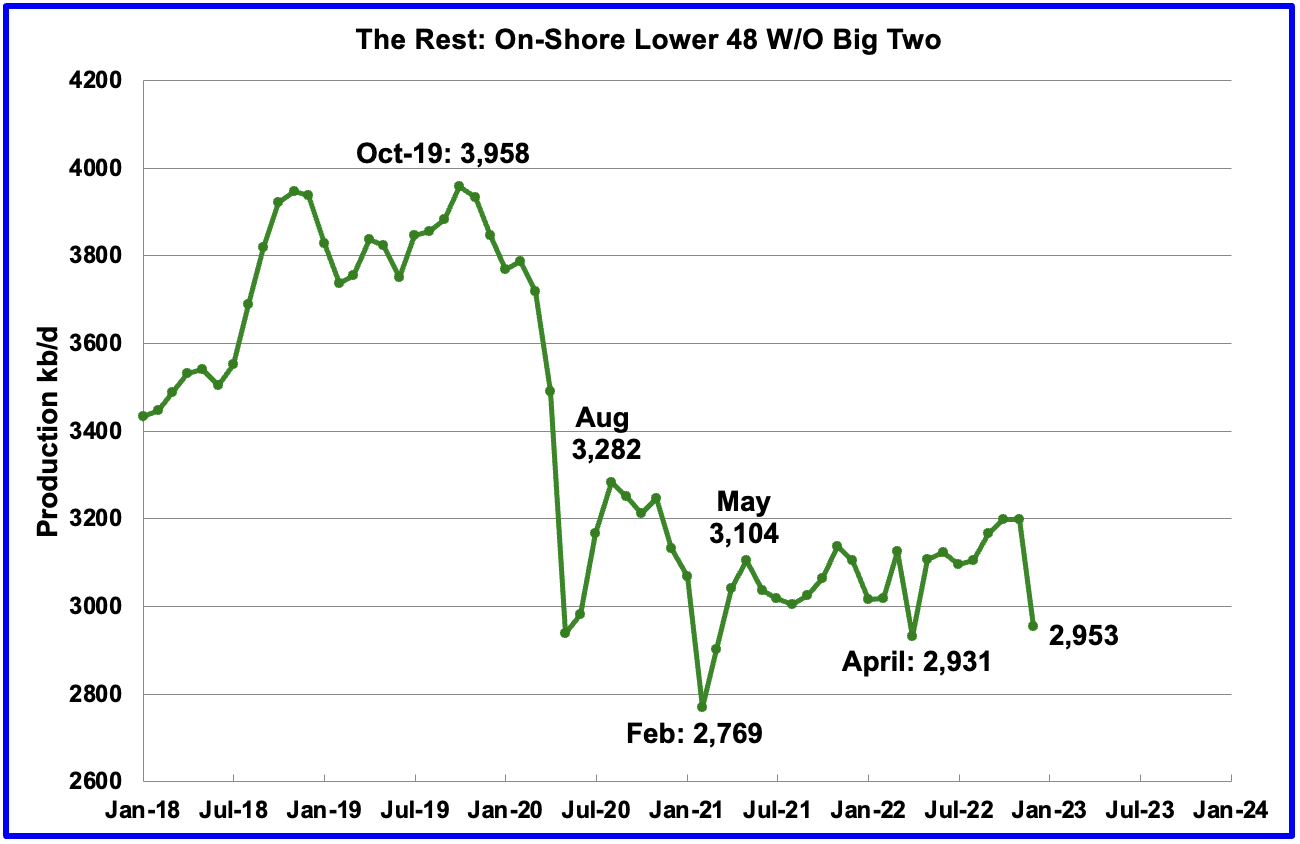
Oil production by The Rest
In December production in The Rest dropped by 245 kb/d to 2,953 kb/d. January production is expected to show a recovery.
The main thing to notice in the Rest Chart is that current production is 1,005 kb/d below the high of October 2019. The question we need answered is “Is this a permanent loss that will never be recovered?” I think it is a permanent loss.
Rigs and Fracs
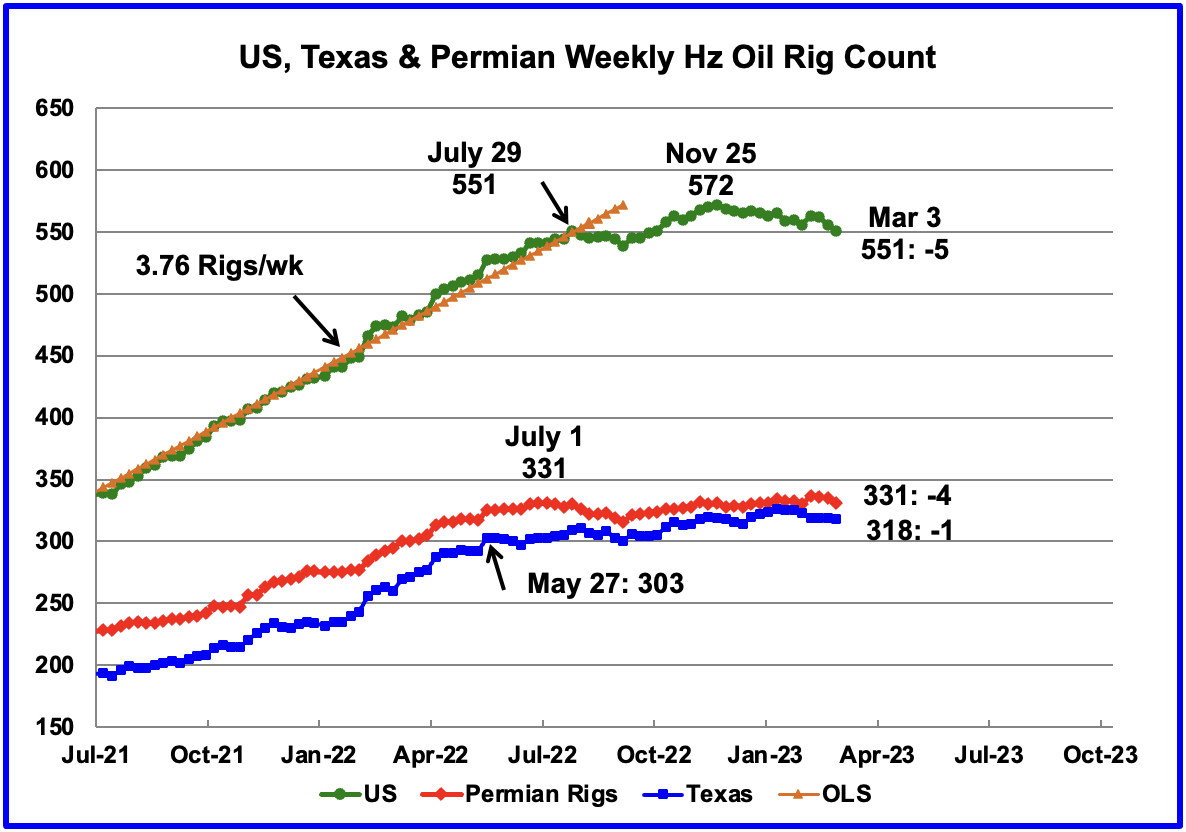
Since the beginning of April 2021 through to the week ending July 29, 2022, the US added horizontal oil rigs at a rate of close to 3.76 rigs/wk, orange OLS line, and peaked at 551 rigs in the week ending July 29. However since then the number of operational rigs has wondered primarily sideways. A high of 572 rigs was reached on November 25, 2022. In the week ending March 3, 2023 the number of rigs decreased by 5 to 551, unchanged from July 29, 2022.
In the week ending March 3, Permian rigs dropped by 4 to 331 and Texas rigs dropped by 1 to 318. Note that Permian rigs are at the same level as July 1, 2022, 331 rigs.
For frac spreads, the general trend since late February 2022 can best be described as essentially flat around the 290 level but with a hint of a slow increase toward 300 frac spreads. At the beginning of the 2022 Thanksgiving and Christmas holidays, the frac count began to drop. The frac count bottomed in the week ending January 6 at 250 and then began to recover. A similar trend occurred last year.
For the week ending March 3, the Frac count increased by 4 to 276. Since January 6, frac spreads are being added at an average rate of 3.25 rigs per week.
Note that these 276 frac spreads include both gas and oil spreads.
Drilling Productivity Report
The Drilling Productivity Report (DPR) uses recent data on the total number of drilling rigs in operation along with estimates of drilling productivity and estimated changes in production from existing oil wells to provide estimated changes in oil production for the principal tight oil regions. The February DPR forecasts production to March 2023 and the following charts are updated to March 2023. The DUC charts are updated to January.
Above is the total oil production projected to March 2023 for the 7 DPR basins that the EIA tracks. Note that DPR production includes both LTO oil and oil from conventional wells.
The February DPR report made significant revisions to the the January report. For instance, January output was revised down by 94 kb/d from 9,376 kb/d to 9,282 kb/d. The DPR is projecting that oil output for March 2023 will increase by 74 kb/d to 9,356 kb/d. March’s output is projected to be 150 kb/d higher than the March 2020 output of 9,206 kb/d. The pre-pandemic high was 9,292 kb/d in December 2019.
Over the last 4 months production has been increasing at a rate of 83 kb/d/mth, which is lower than previously reported rates.
This high growth rate is more than double the rate of 35.7 kb/d/mth shown in the LTO report in the next section. It is not clear why there is such difference between these two reports.
This chart shows the monthly DPR production increments. What is notable is the reduced month to month volatility since December 2022. Is this another indication of a planned monthly drilling and completion program by company management to meet financial commitments, regardless of the price volatility of U.S. oil.
The other thing to note is that the monthly increases in the production rate is declining. February’s production increased by 81 kb/d while March’s increase was down to 74 kb/d.
Permian output continues to rise in March. Production is expected to increase by 30 kb/d to a new high of 5,682 kb/d. Production since September 2022 hints at slowing monthly increases, possibly more related to capital discipline than geology.
If the Permian were part of OPEC, at 5,682 kb/d it would be the second largest producer after Saudi Arabia. March output is 772 higher than the pre-pandemic high 4,914 kb/d.
During January, 437 wells were drilled and 433 were completed in the Permian. (Note that January is the latest month for DUC information). The completed wells added 370 kb/d to January’s output for an average of 856 b/d/well. The overall decline was 336 kb/d which resulted in a net increase for Permian output of 34 kb/d. Of the 433 completed wells, 392 were required to offset the decline.
Note, this is the first month in which no DUCs were used in the Permian, actually four were added.
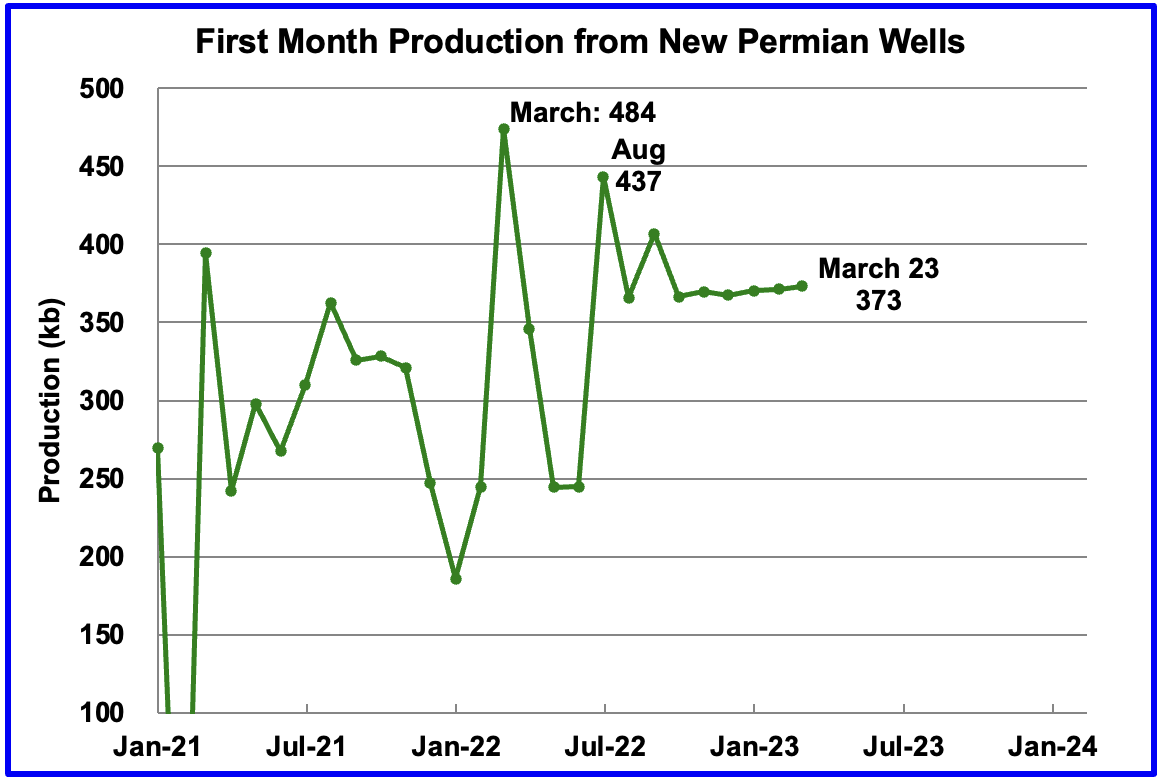
This chart shows the average first month total production from Permian wells tracked on a monthly basis. Since October 2022, the volatility shown in prior months has been reduced. Assuming the latest information is correct, total monthly production from the newest Permian wells in March continues to be at the 370 kb/d level. Part of the flat production shown is related to an essentially unchanging number of wells being completed, currently hovering slightly over 430 for the last 4 months.
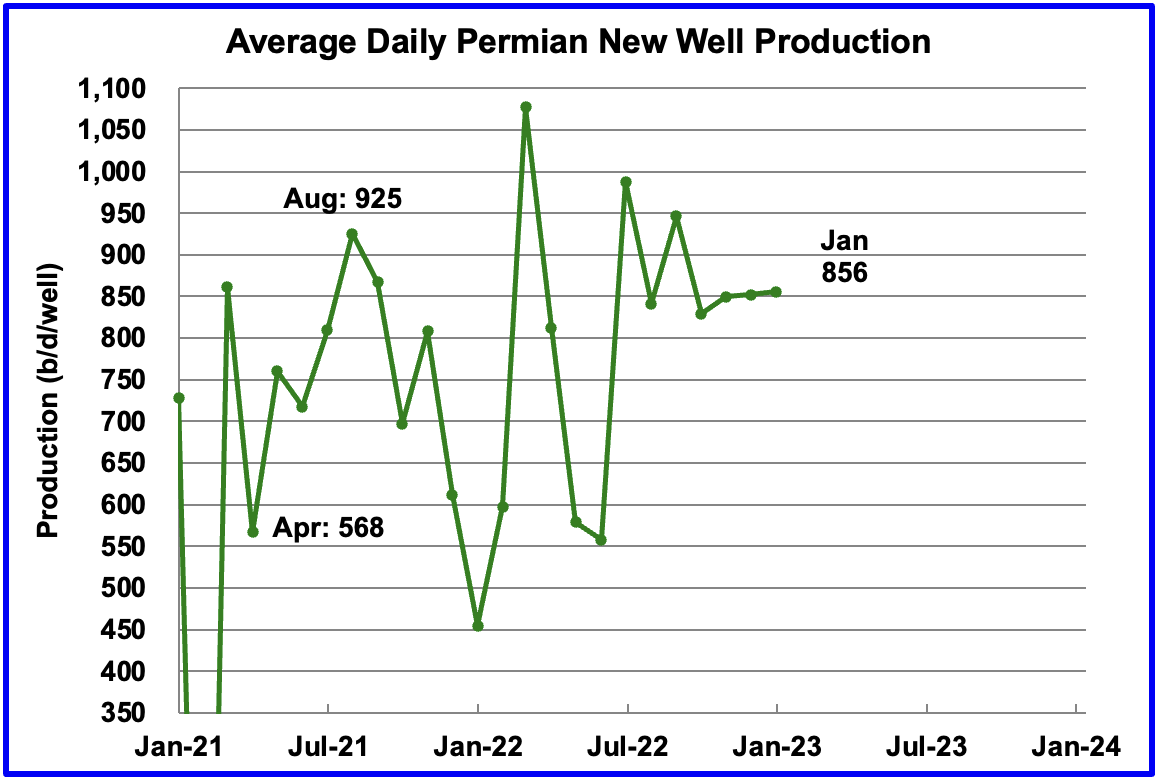
Average daily production for first month Permian wells also shows reduced volatility and indicates average production was 856 kb/d in January and appears to be stabilizing at the 850 kb/d level. Note that January is the latest month for reported completion data.
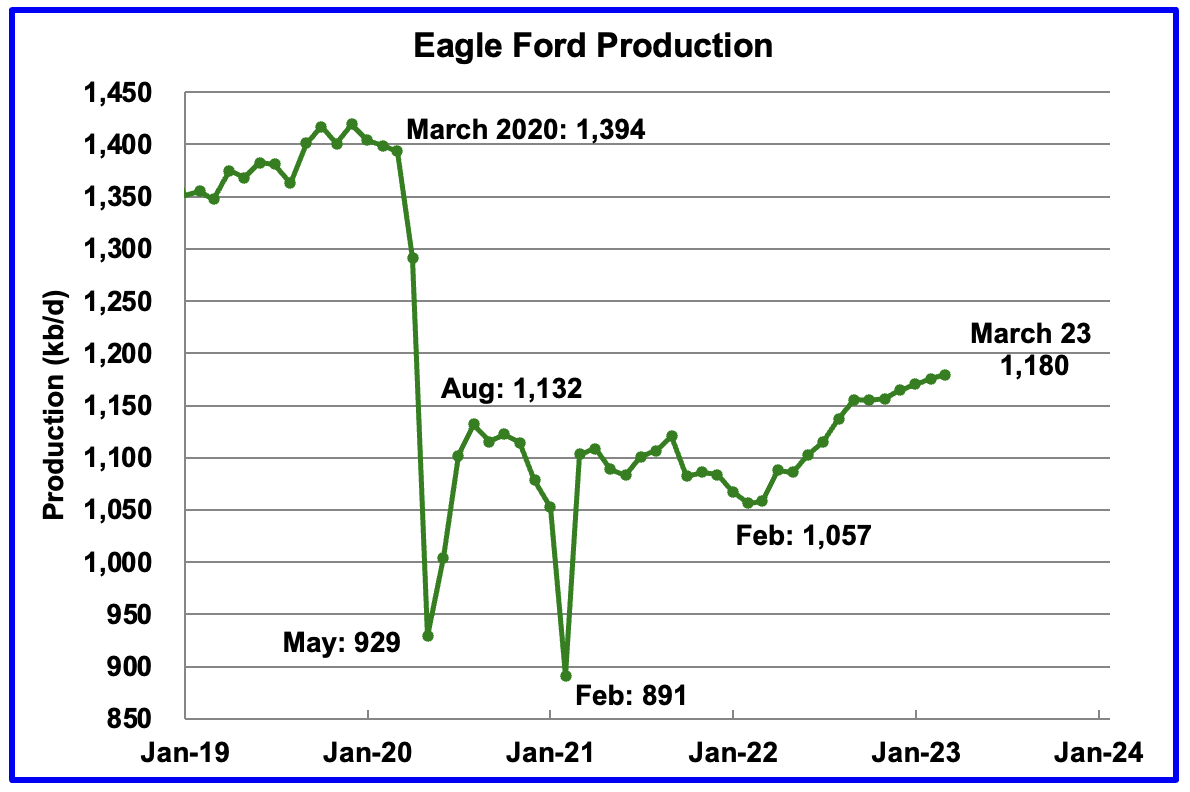
Output in the Eagle Ford basin has been showing an increasing trend since March 2022. More recent data indicates that it may be transitioning to a plateauing phase. For March, output is expected to increase by 4 kb/d to 1,180 kb/d.
At the beginning of the year, 43 rigs were operating in the Eagle Ford basin. As of January 2023, 68 were operational.
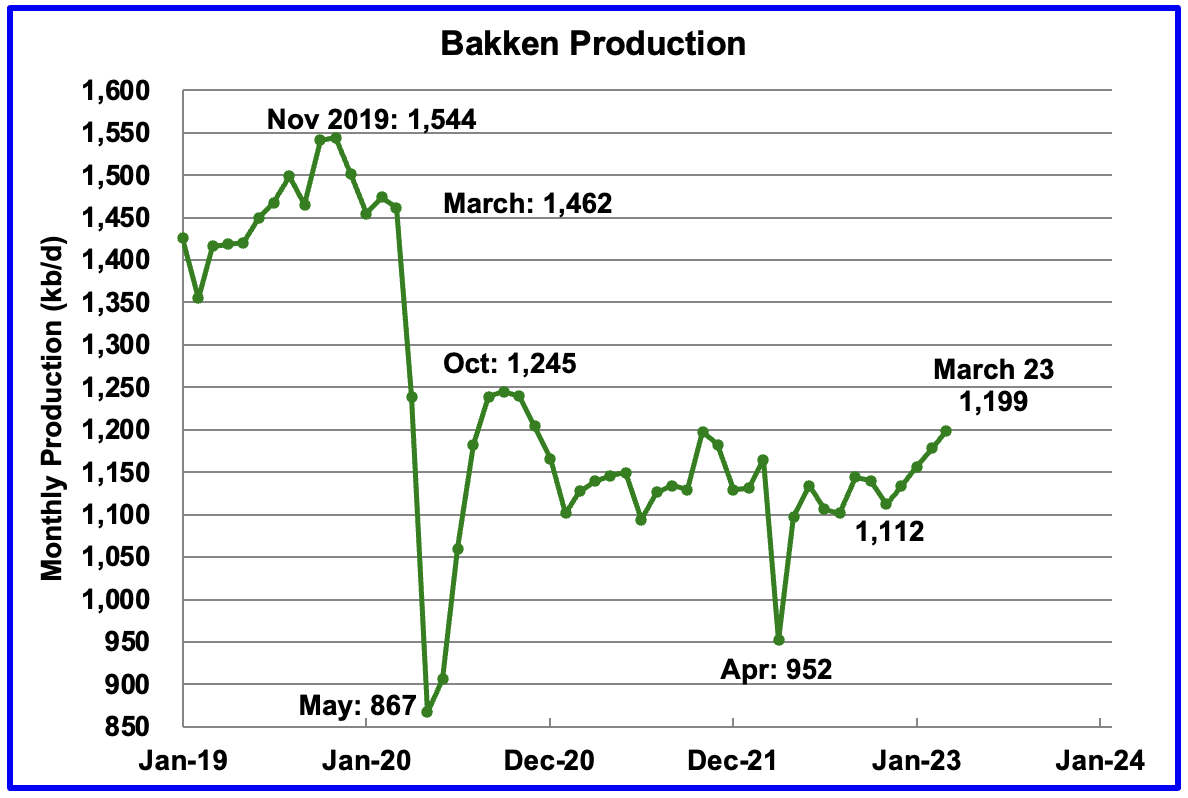
The DPR forecasts Bakken output in March will be 1,199 kb/d an increase of 21 kb/d over February. Production from September onward looks optimistic/wrong and increasing linearly. Considering the extreme weather that North Dakota experienced in December 2022, the increasing trend is incorrect. The EIA reported that December production was 948 kb/d while the DPR is reporting 1,133 kb/d for December.
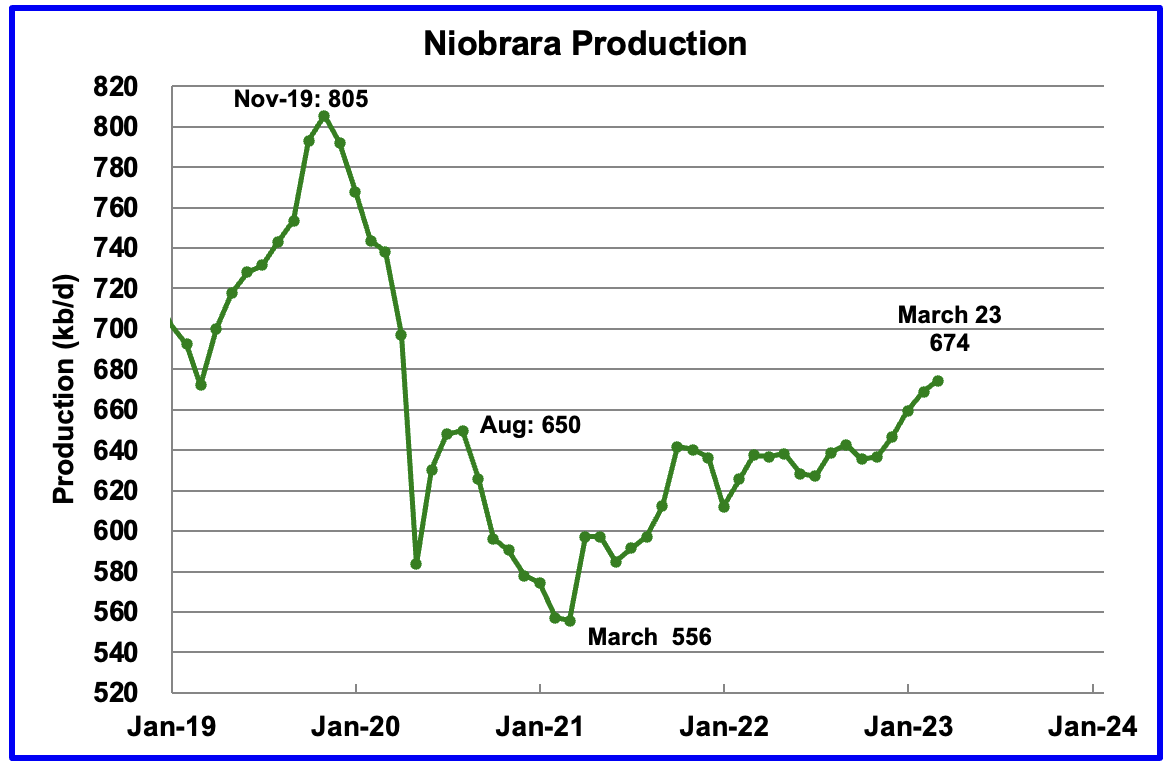
Output in the Niobrara continues to increase slowly. March output increased by 5 kb/d and set a post pandemic high of 674 kb/d. It should be noted that the LTO report in the next section indicates no growth in output in the Niobrara basin.
Production increased due to the addition of more rigs into the basin. The Niobrara had 12 rigs operating in January 2022. By December 2022, the count had increase to 18.
Completions also increased. In January 2022, 67 wells were completed. By January 2023, monthly completions increased to 106, which accounts for the increasing production. During October and November, 112 wells were completed. Over the same period, January to January, the number of wells drilled increased from 87 to 128.
DUCs and Drilled Wells
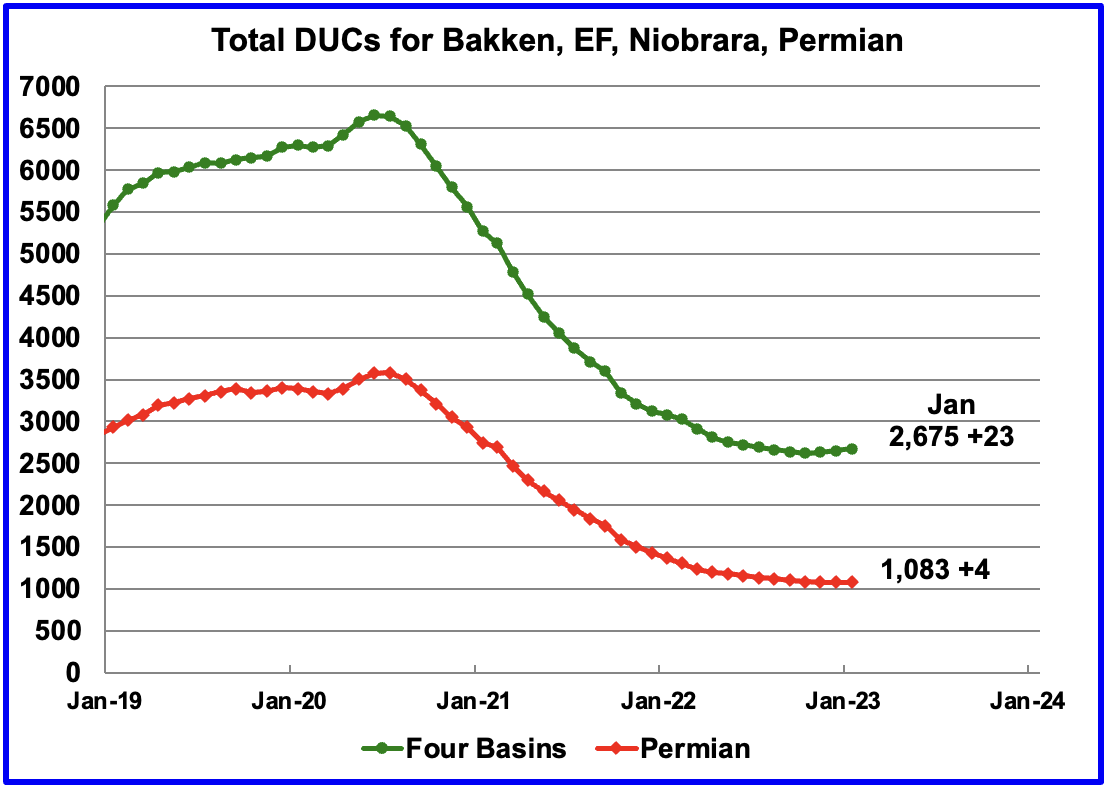
The number of DUCs available for completion in the Permian and the four major DPR oil basins has fallen every month since July 2020 but that trend has now reversed. In December 2022 the trend for total DUCs changed from decreasing to increasing. January added 23 DUCs. The biggest increase came from the Niobrara where DUCs increased by 22.
In the Permian, the falling trend in DUCs also changed. December is the first month since mid 2020 when the number of DUCs increased. January Permian DUCs increased by 4 to 1,083 because 437 wells were drilled and 433 were completed.
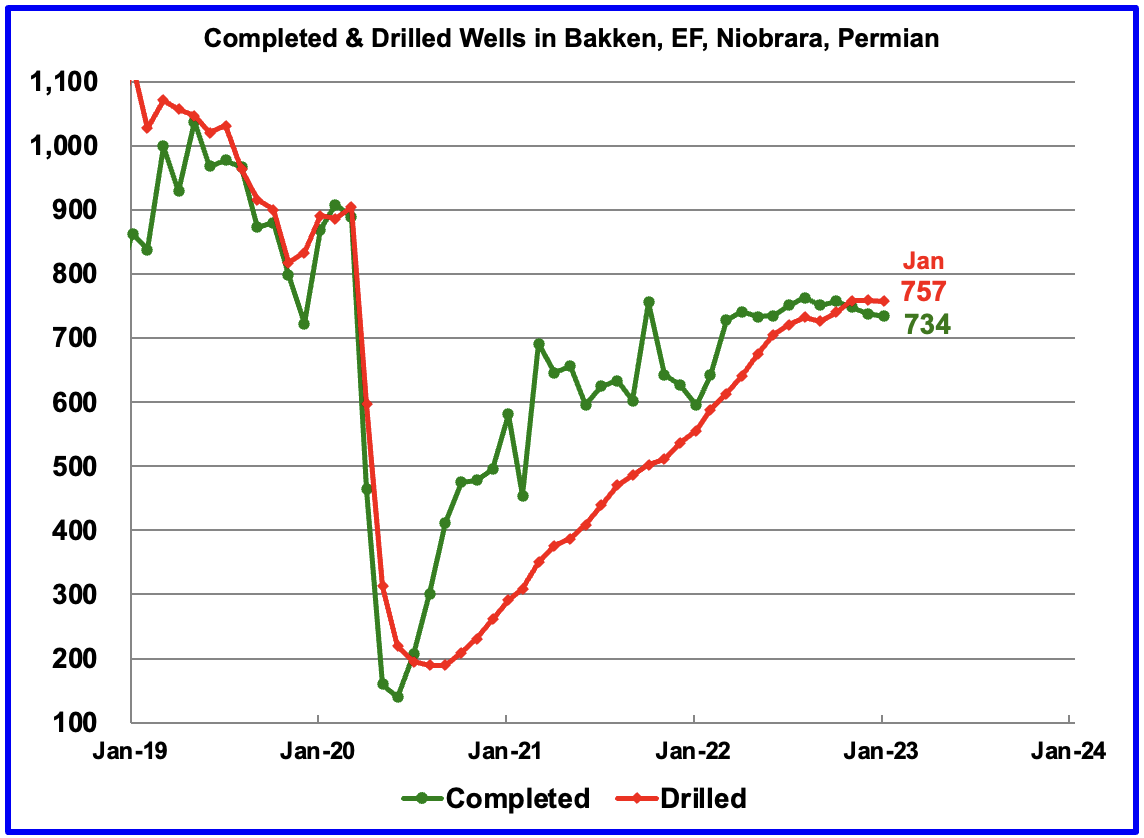
In these 4 basins, 757 wells were drilled while 734 were completed for a net increase of 23 DUCs in January.
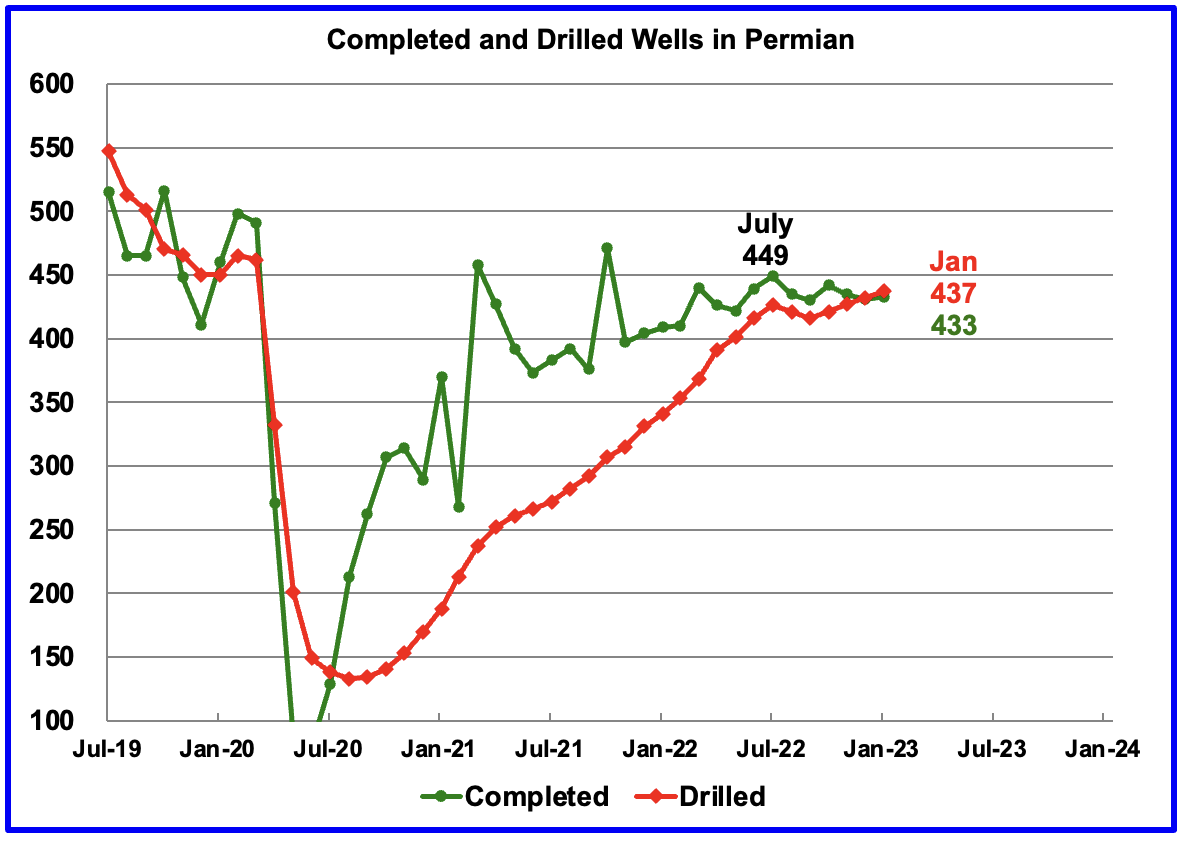
In the Permian, the monthly completion rate has been showing signs of slowing since the July high of 449. This is consistent with the frac spread chart shown above where there has been little to no growth in frac spreads since February 2022. The number of wells drilled in the Permian has been showing a slightly increasing trend since October.
In January 433 wells were completed, 2 more than in December and 16 fewer than in July. During January, 437 new wells were drilled, an increase of 4 over December. The gap between drilled and completed wells in the Permian has now essentially vanished. This raises a question. Since the producers would be completing the best wells, does this imply that most of the remaining 1,083 Permian DUCs are Dead DUCs?
It also raises another question. Were those extra 4 wells that were drilled, DUDs that became dead DUCs?
January Light Tight Oil Update
The EIA’s LTO database provides information on LTO production from seven tight oil basins and a few smaller ones. The February 2023 report updates tight oil production to January 2023.
This is the sixth LTO report published since it was updated due operational issues. The current update has made significant downward revisions to production reported in the previous report.
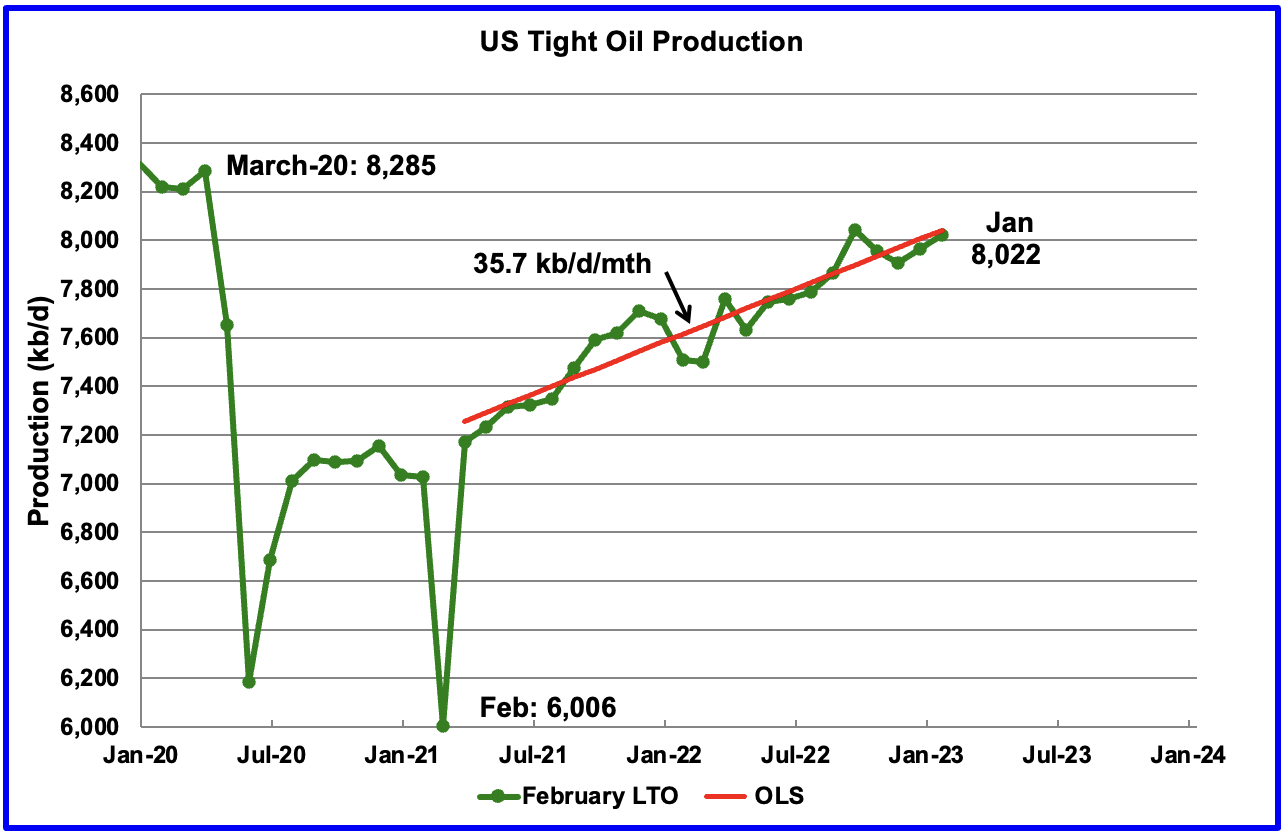
According to the February LTO report, January’s LTO output increased by 57 kb/d to 8,022 kb/d. However the December 2022 output was revised down to 7,965 kb/d from 8,188 kb/d reported in the previous report, a downward revision of 223 kb/d.
The red OLS line from March 2022 to January 2023 indicates a monthly production increase of 35.7 kb/d/mth.
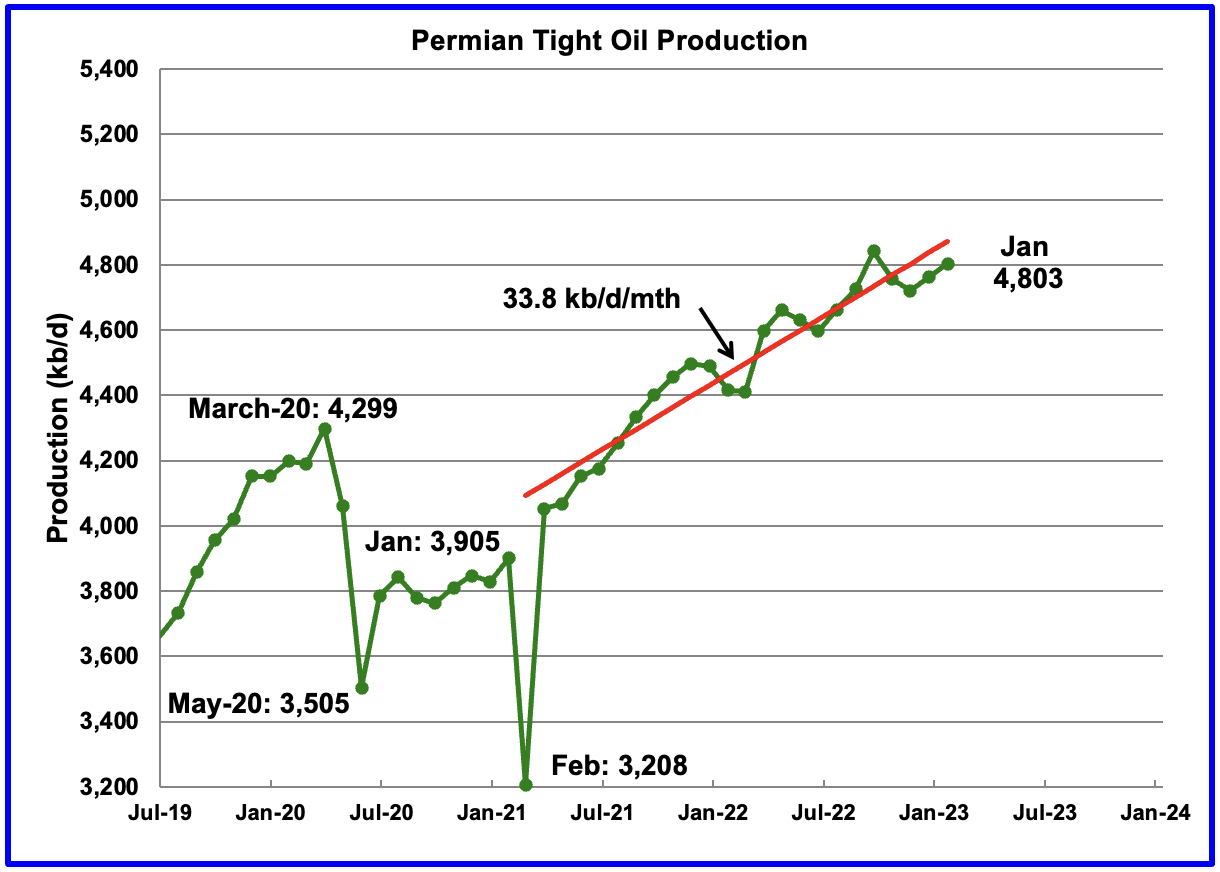
January’s Permian output increased by 41 kb/d to 4,803 kb/d and is 504 kb/d higher than the high of 4,299 kb/d recorded in March 2020. The December 2022 output of 4,975 kb/d was revised down to 4,762 kb/d, a downward revision of 213 kb/d. Most of the revision noted above for the LTO Total output is due to the Permian revision.
The red OLS line from March 2022 to January 2023 indicates a monthly production increase of 33.8 kb/d/mth.
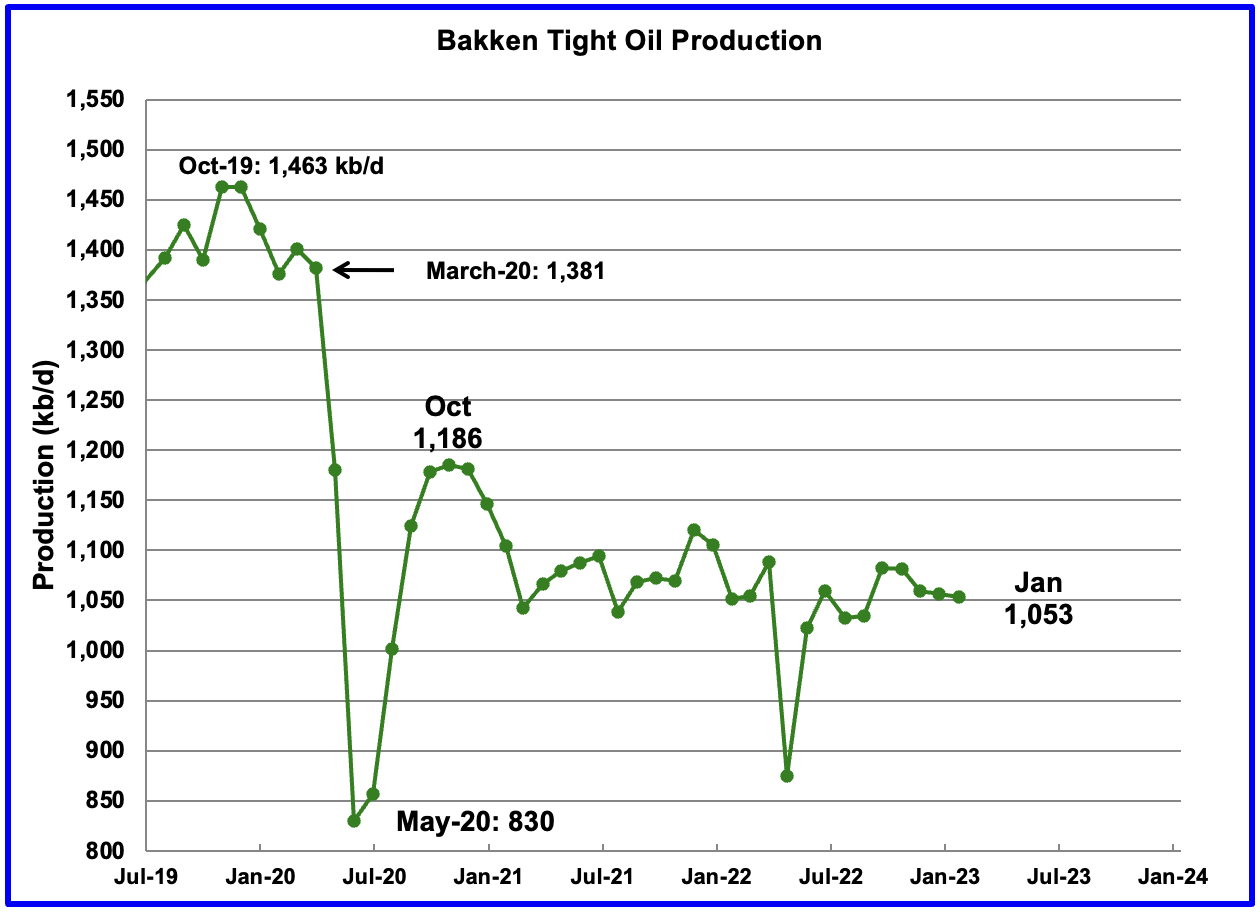
The Bakken’s December LTO output decreased by 4 kb/d to 1,053 kb/d.
The EIA reported that North Dakota December production was 948 kb/d, which is 109 kb/d lower than reported in the LTO report.
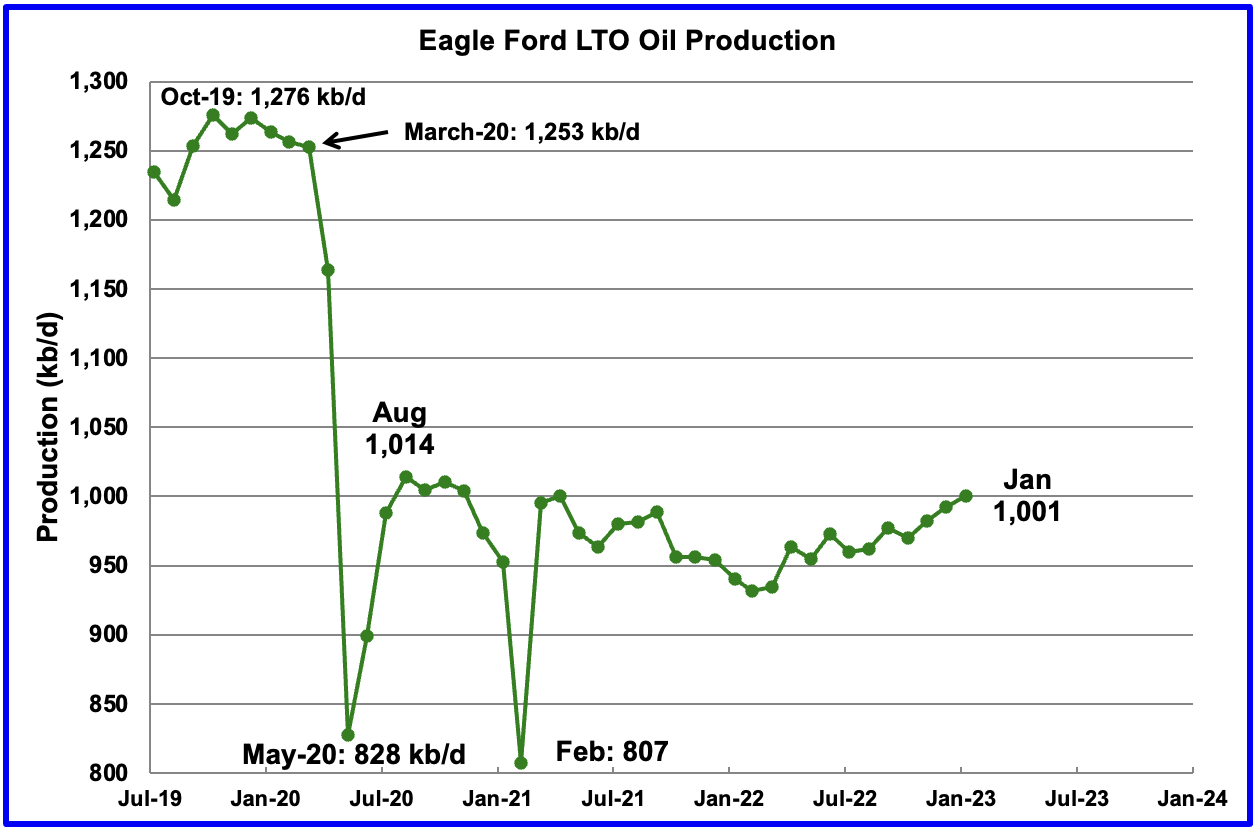
Production in the Eagle Ford basin increased by 9 kb/d in January to 1,001 kb/d and is now 13 kb/d lower than the post pandemic August 2020 high of 1,014 kb/d.
In January 2022, 43 rigs were operational in the Eagle Ford basin. By December 2022, the rig count had risen to 66.
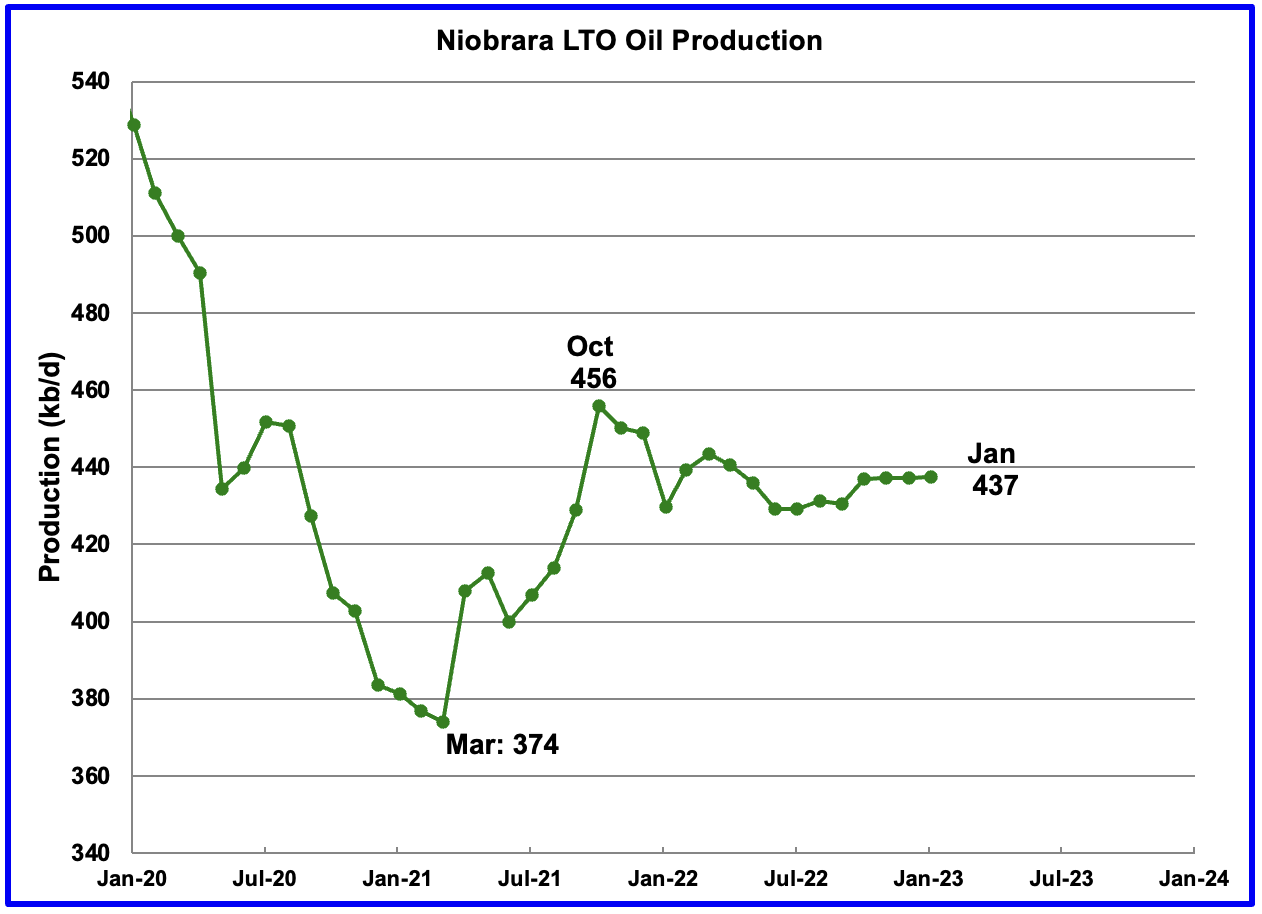
Production in the Niobrara since October has shown little growth. Output has been flat at 437 kb/d.
Onshore L48 Conventional Production
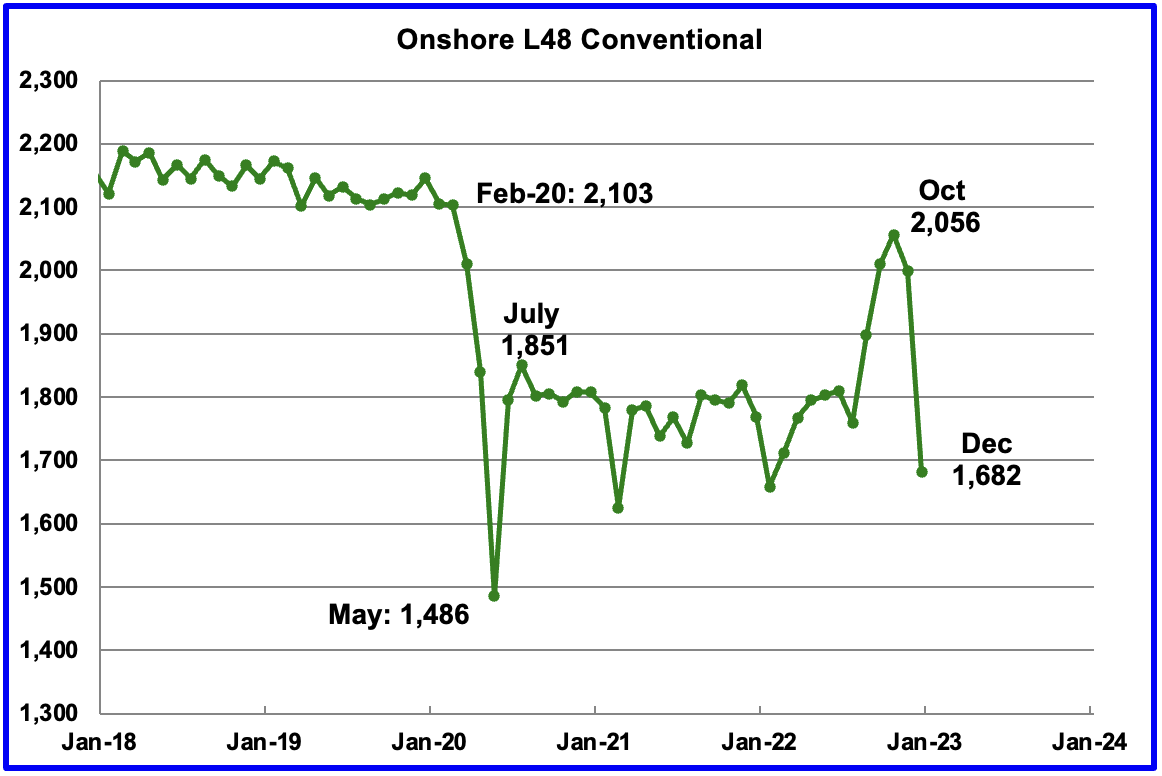
Conventional oil output in the Onshore L48 dropped by 233 kb/d in December to 1,682 kb/d and is more in line with estimates prior to July 2022. This estimate is based on a combination of the expected December LTO output and the actual Onshore L48 output reported by the EIA.
The big production drop from October is due to ongoing major revisions to the monthly LTO report. Note that the conventional oil estimate comes from subtracting two large numbers and is quite volatile month to month due to revisions.
WTI
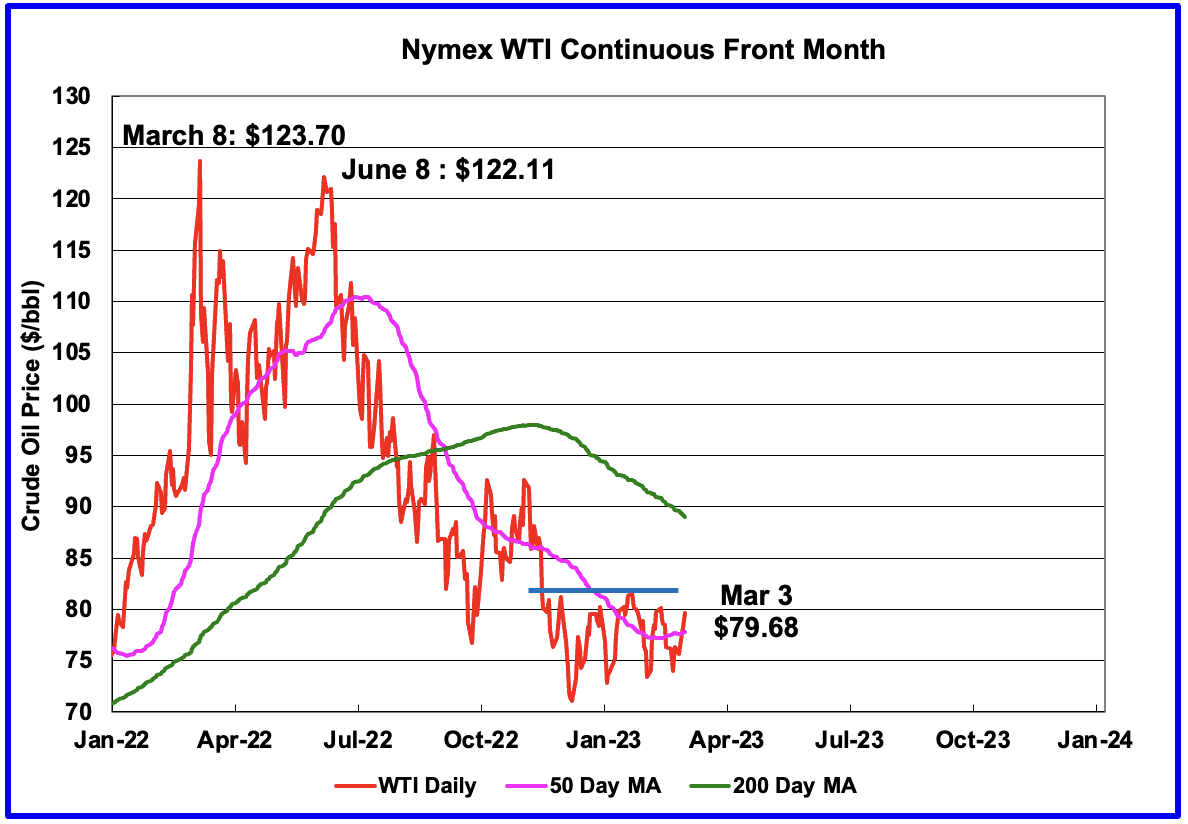
WTI appears to be making a strong bottom since the low of $71.02/b on December 9, 2022. Each successive low since then has been higher. There is also strong resistance at the $82/b price. It will have to break above $82/b to indicate that a new uptrend has started.
207 responses to “Winter Storm Drops US December Oil Production”
some here i am sure will be interested in this
https://mobile.twitter.com/EIA_One/status/1631747539232849946
“First, let’s re-acknowledge the issue.
In our petroleum data, we use a term called “adjustment” to balance the difference between oil supply entering the market and oil disposition, or oil leaving the market.
The thread below explains further.”
Quote Tweet
Joe DeCarolis
@EIA_One
·
Nov 30, 2022
In the @EIAgov Weekly Petroleum Status Report released today, we had another large crude oil adjustment of 1.45 million barrels per day. Let’s talk a little bit about this “adjustment” term. #OOTT
Didn’t see this post before I posted my sheet below. What coincidence?
LTO Survivor
In the previous post I mentioned that I would post how the information in the petroleum supply weekly is used to determine the weekly crude build or draw.
https://www.eia.gov/petroleum/supply/weekly/pdf/table1.pdf
From the above link, the attached picture was created. Rows 6,7,8 and 9 are the basic info taken directly from the link and used to determine the build/draw.
Row 13 is row 6 plus row 7. Rows 14 and 15 link directly to rows 8 and 9.
Row 16 equals 13 + 14 – 15 and has units of kb/d
Row 18 equal 7 times row 16 to get the weekly build/draw.
For the week Feb 24, the build was 1.2 M barrels and for the 17th it was 7.6 M barrels.
What is the main difference. It is row 7, Net Imports. Net imports for February 24 were 1,150 kb/d lower for a total of 8,050 fewer imported barrels. While adjustments, row 14, were big, they were roughly the same.
It makes one wonder whether importing extra crude every so often could be used to affect the price of WTI.
Ovi , I already have your headline for June 2023 ” Summer heat drops US oil production ” . 🙂 . Great work ,maestro .
beginners guide to natural gas…the future
https://oilprice.com/Energy/Natural-Gas/Natural-Gas-A-Comprehensive-Guide-To-The-Worlds-Most-Crucial-Fuel.html
This link is not very well written at all, and it is obviously be written by an internet expert. The is no distinction between gases derived from conventional or hydraulically fracced wells. The general disticntion is whether a gas source is a dry gas or wet gas from a “gas well” which is defined by the amount of condensibles as gpm (gallons per 1000 cu ft gas). Gas from “oil” wells is known as associated gas and again is measured firstly as the mount of gas produced per barrel and from the produced gas the amount of condensibles from the associated gas (as GPM). Source rock that has been buried lower in the oil window and /or for longer will generally produce more gases. Ethane, propane and butane are odourless. Pentanes + have a noticeable odour.
Sulphur will normally be present in the gas stream along with carbon dioxide Both sulphur and carbon dioxide are removed from the gas stream to minimise corrosion. Water is also removed, usually by dehydration with a glycol. The sales gas will contain methane and usually some ethane. The ethane typically must not exceed 14% v and be around a minimum of 5% v to achince the correct calorific value, which in the US is about 1035 BTU/ scf +/- 5%. A stenching agent is typically doped into the sales gas stream, usually ethyl mercaptan. Gas condensate is typically knocked out at the gas plant (and sometimes at the well head). The gas condensate typically contains C2-C10 and is sent to NGL fractionation units which produce ethane, propane, butane and pentane +. It is actually a little more complicated than this but this will suffice.
Mr Bowers , a question ? Where were you hiding ? You seperated the chaff from the grain . Please keep engaged .
HIH – sorry for the slow reply as I did not imddeiately pick it up. I have been around for a very long time, not quite as long as Mike Shellman, but I am now playing in extra time. I watch this blog and cringe at times. Sometimnes the analysis is a little flawed but what bothers me more that this was at first a Peak Oil blog, as was Peak Oil.com and the TOD. Both of the latter were atacked relentlessly by cornucopians who insisted that Peak Oil will not happen or it is decades away. That is not my view. I respect other peoples opinions but I do not respect trolling, offensive comments and name calling, which is now unfortunately happening in this blog. I do not hide behind a pseudonym.
Now that I have made my point I have a rather wide ranges of experience having started my careeer in 1978 as a mud-logger, which is you are in the driling business you will know what it is. I have worked in a number of roles during my career (sales & marketing, project assessment, mentoring, technologies, strategy) . I have worked all over the world, usually not the places you would want to go on vacation. I spent 3 years in Jubail Saudi Arabia and I have survived the Abqaiq highway and the TAP line road. All jesting aside I now work for a large German petrochemical company looking in to feedstocks and petrochemical technologies. My many years in refining are put to good use and I have a good insight into well -to refining -to first derivate petrochemicals. Before Covid I regularly spoke at conferences. I now work from home and have not travelled by air for 3 years, so I now confine myself to my home office working what the hell we are going to do in the future. I have always said that if you want to understand a process you need to understand the step before the process. In that respect if you want to undestand oil production, then it would be a idea to learn about geochemistry and oil and gas generation, and so forth. There are many misunderstandings about oil and gas production, made even more confusing by what is counted as oil and what is not counted (OPEC does not count NGL’s). The US is a large NGL producer, a fact that is often not fully appreciated by most people. It produces nearly 50% of all NGL’s. The US has by far the largest number of oil and gas wells (about 50% globally), in excess of 1 million of which about 500k are “oily”. In contrast KSA produces about the same quantity of crude oil as the US with <4000 wells. That is a large difference and demonstrates the quality of the KSA resources (note I have not said reserves), KSA very thoughtfully took over control of their destiny and booted out the IOC's. They have applied technology and restraint to maximise recovery. Resting wells when demand is low and water flooding and re-injection when appropriate. The application of chokes to limit flow rates to prolong the well life and downhole pressures. Contrast that with the shale cowboys who are only interested in IP rates resulting in rapid terminal decline, low recovery rates and gassy wells, all to make a fast buck and a pretty lousy ROI. We would not tolerate this in the petchem sector.
When I look at the drilling technology that exists today and compare it with my early days in 1978 there is no comparison. The concept is broadley the same but ability to steer the bit, and log the well whilst drilling is truly remarkable. The development of fraturing fluids for long mutlistage cluster fraccing is amazing, BUT there is not a cure for bad rock. I share Mike Shellman's views that the shale phenomena is going to be short lived. It by no means done but post 2030 it is going to look different. From my perspective this will have an impact on the petchem industry which has expanded massively in the US GC and may find that the ethane feedstock is a tad tight.
For the past two years I have been busy assessing hydrogen and renewable power, and the effect of EV's on the fuel demand. I do not share the view of Yergin, Leach, et al of Peak Oil demand offsetting Peak Oil supply. Demand is on a one way trajectory irrespective EV's and renewable energy simply because the global population is still growing and most of the developed world is only going to grow carbon dioxide output not reduce it. They do not gives a rats ass about contstraint of carbo dioxide as they only want the benefits of what they see in the west, namely food, water, electricity, mobility, and above all flushing toilet.
I have spent hours on renewable fuels and cannot see a success story ever happening. EROI/ EROEI always wins- its like entropy. Some on this blog poo-hoo EROI. If you do then you clearly do not understand it. It is a bit like entropy- always increasing. No one calculates the well profitability on EROI but in the background EROI is omni-present. Everything you buy in to complete that long lateral in your shale formation consumes energy; a lot of energy. That offshore platform producing oil and gas also burns through a huge sum each day and needs a connector to the shore or FPSO. That also comes at a cost. EROI is anaologous to swimming in a tide, or an aeroplane flying into a headwind. It is EROI that will kill most renewable initiatives. Biofuels, e-fuels, green hydrogen, wind power and PV all suffer from low EROI and when the fossil fuels are done it will only be worse.
I am glad you liked my graphic. I had to produce this myself because I have yet to find such a simple overview in a book or on the internet. I have over the past 3 years been working on training briefings for a variety of topics, starting with oil and gas generation. This has reached about 25 briefings which cover upstream (E&P), downstream (refining) and base petrochemicals all in easy to follow graphics. Some I can share, some I cannot and a lot is my own IP. I hope you liked it. I have attached a graphs of a tricondothem. This helps explain the phase behavoir of oil reservoirs. The smart guys try and avoid 2 phases in the reservoir itself (it is unvaoidable in the well bore) using chokes, gas re-injection, water flood etc to maintain reservoir pressure. So far most shale wells have been produced only by solution gas drive which ultimately results in two phases in the reservoir and generally lot recovery rates. Once the gas and liquids form two phases then the viscosity of the liquid increases and more gas flows to the well bore. The production then becomes more gassy. I think that is enough for now.
Thanks, Ovi. Great post as usual. And your comment above explaining how the EIA determines weekly production is very informative, thanks. Now I will give you my opinion as to how the EIA DPR crew makes the final few months of their view of oil production prediction. To do so I have cut and pasted part of your graph from your post above. I hope you don’t mind.
Their method is quite simple. From the last known reliable data, November in this case, they simply draw a line with an upward incline of 45 degrees, then put as many dots on it as the number of months they wish to predict, And that is their prediction. I have followed them for years and this is how they do it almost every time.
You have heard me say it many times but I will say it again. The DPR prediction is not worth a bucket of warm spit. The December production was known by everyone in the business to be hit by weather problems and be down across the board. Yet they kept shale production increasing at a 45-degree angle. We owe it to our readers to explain that this DPR prediction is worthless.
I worked at an Energy department ( Electricity ).
They do forecasts using Linear Regression. That doesn’t work well on non-linear data.
There is a mechanism (Excel Spreadsheet) where the stakeholders can “override” the predictions. I was never in the meetings where the overrides were discussed.
Everyone thinks that they have a better Idea.
But it is such a cumbersome and painful process to change the algorithm noone ever does.
The problem with fancy statistical methods is that almost nobody knows what they mean anyway, so it is unclear when they are appropriate or useful. Excel 2007 had an add-in called “Analysis ToolPak” with lots of statistical methods, bu nobody used it so they dropped it.
I agree. It’s lazy or unknowledgeable and both are not worth much.
I also agree the DPR is not very well done.
LTO Survivor.
Mike has a guest column in the Permian Basin Oil & Gas Magazine about frac sand flow back.
I understand that is increasingly a problem.
Ron
I also agree that their production data seems to come from some straight line algorithm they have, I hope the DUC and completion data is more accurate.
I do express concerns in the DPR Bakken report.
Ovi,
Great job thanks.
Chart below is similar to a chart in your post but focuses on conventional output in Texas and New Mexico and finds this by using PSM estimates for Texas and New Mexico and subtracting Permian basin and Eagle Ford output which accounts for most of the tight oil output in Texas and New Mexico. Data in chart covers August 2021 to Dec 2022, notice how the trend changes for the most recent 5 months. I believe this is due to an error in the EIA’s tight oil estimate for the Permian basin which keeps changing month to month and the EIA seems to not have a very goo handle on.
To attempt a better estimate for Permian output, I use the 914 estimate for New Mexico and Texas and the ratio of that to Permian and eagle Ford tight oil output and take the 12 month average from August 2021 to July 2022. That ratio is then multiplied by 914 estimate to model Permian output.
The chart below compares the EIA tight oil estimate with the Permian model (which is the model estimate minus Eagle Ford estimate from EIA).
Dennis
Attached is the same chart using the DPR and LTO data. The trend is the same but shifted by about 200 kb/d.
Not sure how to account for the 200 kb/d difference.
Ovi,
I think the psm is more accurate than the DPR or “official ” tight oil estimates. Also the 200 kbpd would be conventional output from non-DPR regions of TX and NM, assuming both PSM and DPR are accurate.
Dennis
I totally screwed up the title. It should read DPR Permian and EF minus LTO Permian and EF.
Ovi,
A quick way to check on the 200 kbpd difference between our charts would be to take TX and NM PSM data and subtract DPR Permian and Eagle Ford data, there might be a 200 kbpd difference, I am on a plane so difficult to do here.
Dennis
Attached is comparison of Permian production from the DPR, LTO and Novi Labs.
My primary focus is on the period March 2021 to Feb/March 2022. Check how close the LTO and Novi labs data are. Also the gap between the DPR and Novi labs is reasonably constant. In March 2021, the gap is 545 kb/d. In February 2022, the gap is 568 kb/d. The data diverges past March because of the delay in updating the data.
I wonder if this data implies that the LTO and DPR groups use the Novi labs data to back date their info and beyond that they use other sources or methods.
Ovi,
Interesting, thanks.
One thing to keep in mind is that Novi labs does not include output from vertical tight oil wells, but it does have output from other formations besides simply the Spraberry, Wolfcamp, and Bonespring formations which corresponds to LTO EIA data.
All of these use data from Enverus, which comes from TX and NM state governments. After about 12 to 18 months the various estimates start to coincide.
Dennis
You wrote “Novi labs does not include output from vertical tight oil wells”. My understanding is that vertical well are primarily conventional oil wells. LTO wells are primarily Hz wells. That possibly explains the closeness of the LTO data with the Novi Labs data.
Ovi,
You are correct for the most part, but early in the development of tight oil in th Permian basin there were many vertical tight oil wells drilled.
Just check rig count in Permian basin from 2011 to 2015. All those vertical rigs were not drilling conventional wells, also compare with the level of vertical rigs currently active in Permian.
Ovi,
For chart below, Novi-3 formations means Spraberry, Wolfcamp, and Bonespring formations (these are the formations used for the EIA tight oil estimate). Novi-other is Novi Permian total minus Novi-3 formation output. In Jan 2014 nearly half of Permian output was from vertical wells (about 350 kb/d), in April 2022 vertical well tight oil output had fallen to about 200 kb/d (from about 350 kb/d in Jan 2014). Most current Permian tight oil output is indeed from horizontal wells (about 96% in April 2022), but there is a small percentage (4%) from vertical tight oil wells. Also the April Novi estimate may not be accurate, if we go back to Dec 2021 only 140 kb/d of Permian tight oil output was from vertical tight oil wells, this might be a more accurate estimate. The Permian “other formations” (besides big 3 of wolfcamp, bonespring, and spraberry) output was also about 140 kb/d, so basically these two items balance and make the Novi and Permian data match, the reality is that about 140 kb/d of output should be added to the EIA number to account for Permian tight oil output from the “other formations”.
Click on chart for larger view.
Dennis
In the chart, what is the EIA Permian? Is that the LTO data?
Ovi,
Yes,most recent report from late February. Also the Difference line is EIA Permian LTO minus the Novi estimate of Wolfcamp, Bonespring, and Spraberry formations.
This opinion piece might be better relocated to the non petroleum section.
But back when I was a hard core peak oil doomer, I took great comfort in believing that Canada would be be in a position to supplement crashing USA domestic oil production at least to the point we could keep our farms and other critical infrastructure up and running so we could avoid a hard crash and burn economic scenario once we couldn’t import oil from the Middle East.
There may be a new world order emerging. I’m willing to consider the possibility that this is so, or even likely. China may well rival or surpass us Yankees in terms of being able to pay for any oil available for export from Russia, or the OPEC countries, or anywhere else.
It’s not hard to foresee a day when a shipload of Chinese structural steel or washing machines is a better deal for an oil exporting country than more Yankee paper……..
Ron or Dennis, delete this and copy it over to the non petroleum section if you see fit. .
https://ca.finance.yahoo.com/news/opinion-oilsands-tortoise-may-outlast-140311865.html
Currently, China is facing a real estate crisis. Real estate business represents 1/3 of China GDP. Macroeconomists are familiar of the fact that a real estate crisis is paid in the following years by a cut in the annual growth of gdp equivalent to the proportion of real estate business in GDP. If the growth of China GDP is usually of 5%, therefore it will be reduced to 3% or so with the current real estate crisis. To that you must add the decrease of the working population and of the overall population of China. And the development of massive unemployement, which will slow any economic recovery. I don’t know, in these conditions, how China could surpass US economy.
If China was the only country with problems, you would probably be right. But in the presence, almost every country and world region is dragging away with its own bag full of difficulties. The final judgement – same as with peak oil – will be held watching into the rear view mirror around or close to 2030.
It’s ironic that China made the same mistake that Hong Kong made,screwing itself by letting the entire financial industry get dependent on real estate.
OFM
I think the article is correct that the oil sands will outlast tight oil. However politics could change that.
Our current prime minister Trudeau, about 10 years ago in a public meeting stated that the oil sands needed to be shut down. The reaction from the right and from Alberta was pretty strong. He then corrected himself by says he meant to say “phased out”. He actually said what he really believed and since then has used devious means to make it happen. Since he has become the PM, he has appointed Environment Ministers that have slowly tightened the knot around the oil sands. The current EM is totally against the oil sands but must face some political reality and is moving slowly.
The companies are making good cash and paying it out to shareholders and buying back shares. Now Trudeau has decided that the government should get 2% of that buyback cash.
CC seems to be the main objective of the current government. There doesn’t seem to be any economic tests for the CC policies.
I still believe the day will come when the world will be asking Canada to increase it oil sands production.
https://www.reuters.com/business/environment/canada-warns-environmental-impact-proposed-suncor-oil-sands-project-unacceptable-2022-04-06/
Hi Ovi,
I’m not in a position to follow Canadian politics in detail. That would take a hell of a lot of time, and access to most of the relevant news is probably behind paywalls anyway.
But it’s my opinion, for what it’s worth, that barring the auto and trucking industries going electric far sooner than expected, we will be looking at a major oil supply problem before too long. Demand seems very likely to outrun supply, meaning a huge price spike, followed by a recession, etc.
If the cards fall this way, there will be enormous pressure put on the Canadian national and provincial governments to produce as much oil as possible.
My guess is that the tar sands industry is here to stay, because I’m pessimistic about the world wide economy in general.
When the going gets tough, the Canadian people are likely to insist on a nice fat stream of tax money from the tar sands, and the companies in the industry will be glad to pay the taxes, in exchange for the privilege of being in business, and paying high taxes won’t be a problem, with oil prices even higher.
But significantly ramping up production under this scenario would still take quite some time, at least a year or two, and much longer for any really major increased production, according to what I’ve read about it.
Politics is for sure THE wild card in the oil industry. Who seriously thought Putin would invade Ukraine two or three years ago?
OFM,
I see things differently, the electrification of road transport may keep oil prices under $100/b in 2022$, I do not think there will be a large spike in oil price, but would agree with a small to medium increase.
OFM
I think that Canada has maxed out its oil sands upgrading capacity. As best as I understand, building new upgraders are no longer economic. The effort now is to produce Western Canada Select (WCS) and ship it to Texas. WCS is a blend of bitumen and other crudes, including synthetic crude.
The past nine months have taken a toll on the price for WCS. A typical discount has been close to $15/b. The SPR release caused the discount to blow out to $30/b. That has recently come back to $20/b. Not sure if the increased price gap caused a slow down in WCS production.
As for Canada increasing production, I think it can add about 100 kb/d/yr.
OFM
The likely invasion of Ukraine by Putin was clearly described by John Mearsheimer of the University of Chicago in his presentation of June 2015 “Why Is Ukraine The West’s Fault”.
The E&Ps with large interests in US LTO and shale gas made big money in 2022 but did not spend it on increased investment in oil and gas production. The costs comprise exploration, development and acquisition of proved or unproved acreage. Given that the the upstream capital cost index has risen from a low plateau in 2016 to 2020 back to 2014 levels the inflation adjusted spending was probably second lowest after 2020. Part of this was because there was no M&A activity so the property acquisition costs included are low.
The companies shown are a bit of a subjective choice, but generally are those larger public E&Ps that have most of their earnings from onshore US (i.e. no major IOCs, no NOCs, no private companies). Those shown with diagonal banding have been merged or bought out (by the company shown immediately below) and disappeared.
Most excess income was used for dividends and share buy-backs, in about equal measure.
Buy-backs and dividends before the 2015 crash were mostly from COP when it was a large conventional oil producer.
The companies paid off about 10% of long-term debt, which was almost all that they had added in 2021. The dip in 2020 was because of restructuring of Oasis, Whiting and Chesapeake (in comparison combined IOC debt peaked in 2020 as they borrowed to maintain dividend payments). Total liabilities actually increased slightly in 2022, against the general falling trend since a maximum in 2012.
Dividends and buy-backs each totalled about twice as much as debt repayment.
Equity and/or assets must somehow be related to hydrocarbon reserves, but not very strongly as, for most of the time, at least until 2020, reserves have risen but equity has been fairly constant.
Thanks for these company updates George. Very informative.
The Orange basin is starting to look like it could make a contribution the the down slope.
https://www.upstreamonline.com/exclusive/shell-makes-big-oil-discovery-offshore-namibia-results-imminent/2-1-1413816
BOEM reports production in four ways: by well, by lease, by area and by monthly total. The first three generally agree with each other and they can be updated over six months, though usually it only takes a couple for all the reported data to come in. The monthly total ia an estimate, I think it may get updated annually as it usually ends up equalling the reported lease numbers, however for this year it has consistently been above the final lease/well numbers by as much as 50 kbpd. EIA makes its own estimates and these have been slightly above the BOEM monthly estimates. I’d trust the lease/well numbers as long as they are 3 to 4 months old, so I think the EIA numbers might be 20 to 40 kbpd too high on average for the second half of this year.
George
Thanks for the info. In the GOM post above I noted that Shell announced that the Vito platform came on line. Do you have any info on its initial flow rates and how long it will take to get to full production?
I think Vito wells have been predrilled and just need to be hooked up (but don’t put money on it, there generally has been less predrilling in GoM than other places). Therefore if nothing goes wrong it should get to nameplate in a couple of months, however typically for the first few months availability is only about 60-70 % so it might only average 50kbpd. Also typically new GoM projects don’t report production numbers to BOEM until 5 to 6 months after start-up. If things go well it will appear on the Shell or Equinor sites, if not there might just be rumours on some of the offshore magazines.
Mad Dog II is supposed to start up soon and EIA may be including it in the STEO numbers, but I haven’t heard anything. The problem it had, I think, was with the swivels the connect the risers to the platform. If these had to be rebuilt from scrarch then it could still be a few months away.
George
Thanks. I guess we will just have to wait.
BSEE’s latest production data shows 9 predrill wells for Shell at Vito. So that suggests they could have a pretty rapid ramp up – maybe 2-3 wells per month.
GOM January 2023 production should show full ramp up of BP’s Thunderhorse South development. I saw a January-2023 press release where BP stated that total Thunderhorse production is up to 200 kbopd or so. December 2022 production was about 140 kbopd.
Interesting big well at King-Horn Mountain – an old BP field that Anadarko/Oxy is currently operating. From October through December – 2022 their SS06 well has been producing over 30 kbopd!
Bob
Thanks for the update. Sounds like we should see a bounce in January GOM production. I still don’t believe the January number reported in the STEO.
Proved reserves of natural gas increased 32% in the United States during 2021-
‘Proved reserves are operator estimates of the volumes of oil and natural gas that geological and engineering data demonstrate with reasonable certainty to be recoverable in future years from known reservoirs under existing economic and operating conditions. Prices heavily affect estimates of proved reserves. The wholesale spot price for natural gas at the U.S. benchmark Henry Hub in Louisiana averaged $3.89 per million British thermal units in 2021’
Proved gas reserves are prolific in the United States. I agree with the chart above. Current gas prices everywhere but the US are very high and in places where the countries have little to no domestic gas production and rely mostly on imports. Gas prices are down $.29 cents in overnight trading to $2.71 per mmbtu. The current gas price does not justify drilling some of these prolific reserves like the Haynesville. The current IRR of drilling an average type curve new $18 million dollar well in the Haynesville is approximately 28%. While the wells can pay out quickly, 90% of the reserves are produced in the first 18 months basically giving these wells a less than 1.5 multiple on invested capital) MOIC ( this is if everything goes perfectly well) Unless costs dramatically decrease, I do not see companies aggressively drilling these reserves. So when I see a chart like the one above, I say to myself yes we have great reserves and then I say that these reserves will not be produced unless product prices rise. So in reality these charts don’t mean much to me unless we can economically recover these reserves. I would love to see a chart showing the price of the commodity and it’s effects on recovering these massive reserves
As a very distant observer, I expect nat gas prices to be generally be higher over the next decade…maybe much higher.
The increasing US pipeline and export capacity will be a consistent tailwind to pricing.
LTO
I think you are right on. Most of the work produced here on the POB, very well I might add, is 99.99% hindsight and using that data to extrapolate trends into the future, with little if any regard for that numerous variables that will impact those trends. Not to pick on anyones work and to quote you, “don’t mean much to me” or anyone other than those who seem to enjoy this work without making any investment decision about same.
With regard to nat gas, I think on the production side it is likely to be a “terrible” business for some time to come, as soon as any one producer gets the price signal, they all get it at the same time. The time to ramp up additional supply is so short now, I expect outside of some additional geopolitical events to have rather mild swings say $2- $5 domestically.
On the plus side, the domestic consumers and industry will have a competitive edge for some time as the demand for nat gas continues to expand and they can count on ” energy security” that is a huge advantage for team USA going forward. I still think transportation of nat gas and LNG will provide great returns, but upstream dry gas not so much.
As we move into late next year and early 2025 US export capacity will increase by an estimated 4.5BCFD. We might get a boost in price at that time. IN Oklahoma we have a very high BTU product stream, with oil and nat gas liquids comprising approximately 50%. We can still do “OK” in this environment. My view from the trenches.
TTT,
When looking at US LNG exports, do not forget the Mexican Pacific coast projects.
The Puerto Libertad operation may announce FID within the coming weeks for its ~12 Mtpa original phase.
(One Mtpa – million tonnes per annum – equates to about 135 Million cfd).
Ultimate plans call for ~28 Mtpa.
There are now 4 or 5 Mexican-based projects in various stages of development.
All will be sourced by US natgas, likely Permian and San Juan basins.
Coffee, you da man..thanks! big things a brewing
https://www.naturalgasintel.com/mexico-plans-natural-gas-pipeline-connecting-sonora-and-baja-california-to-meet-rising-demand/
‘Mexico Pacific’s anchor project, Saguaro Energía, is a 14.1 mtpa North American West Coast LNG export facility, located in Puerto Libertad, Sonora, Mexico.’
160 miles SSW of Tucson
Hickory,
Yeah, I just learned a bit more about a ‘newcomer’ … Amigo LNG. Sounds like a Singapore-based outfit also planning on using the modular design.
This approach greatly speeds up construction time, enables incremental expansion, and facilitates financing.
These west coast plants are about the same distance – or even closer – to the Permian than the Permian is to the Louisiana coast.
Economics for sales to Asian market are very compelling.
I wanted to add a bit more color and commentary regarding the nat gas price and demand picture. According to industry publications the amount of additional LNG export capacity will almost double (when compared to current conditions with the Freeport plant barely operational) by 2026. That will be an additional 11BCFGD over what is currently being exported. A “tailwind for future pricing’ might be a bit of an understatement. While I make no predictions, I am not familiar with a similar “demand Shock” of that magnitude. Those who think drilling DUC’s at current prices and waiting for the market to turn have little if any understanding of basic business principles. Unless one can see how the cost will come down, up and down the supply chain, as it relates to oil and gas production in the near future, it seems like a very prudent business strategy. When those markets open up there will be a rush to fill, so unless we get a another Covid type shutdown event(if HHH is right), cost will continue to go up.
see page 17 of the EPD presentation, for information only, I am not promoting anything.
https://ir.enterpriseproducts.com/static-files/7a61ef4a-8291-4614-9aa4-b2be2a9f409e
LTO survivor,
Here is what the EIA thinks natural gas output will look like for the US.
https://www.eia.gov/outlooks/steo/data/browser/#/?v=3&f=M&s=0&start=201801&end=202412&map=&maptype=0&ctype=linechart&linechart=NGPRPUS
Chart below is from link above which gives more detail.
LTO Survivor,
Longer term (from AEO 2022) the EIA expects US production in chart below from link below
https://www.eia.gov/outlooks/aeo/data/browser/#/?id=13-AEO2022&cases=ref2022&sourcekey=0
note the second chart shows output in TCF per year and the first in bcf/d. 1 bcf/d=365 bcf/year or 1 TCF/year is 2.74 bcf/d so the verticle axis of second chart needs to be multiplied by about 3 to get the same units as the first chart.
For Natrural gas price in 2021$ the AEO 2022 has the following for their “reference case”
https://www.eia.gov/outlooks/aeo/data/browser/#/?id=13-AEO2022®ion=0-0&cases=ref2022&start=2020&end=2050&f=A&linechart=~ref2022-d011222a.31-13-AEO2022&ctype=linechart&sourcekey=0
For STEO they only give nominal prices for natural gas
https://www.eia.gov/outlooks/steo/data/browser/#/?v=8&f=M&s=0&start=202011&end=202412&maptype=0&ctype=linechart&id=&linechart=~NGHHMCF&map=
https://mishtalk.com/economics/technically-and-fundamentally-where-is-the-price-of-oil-headed
Technically and Fundamentally where is the price of oil heading??
I was reading an article about produced water in the Permian Basin.
How do they allow these huge uncovered saltwater pits?
Where we operate we mostly have closed top salt water tanks. We do have a few inherited open top tanks. Those are required to be covered with bird netting.
It doesn’t look like these big pits in the PB are covered with netting, but maybe I just can’t see it in the phots.
Forget Peak Oil Demand: A Thirst for Barrels Puts $100 in View
(Bloomberg) — As Covid-19 lockdowns gripped the world in 2020, Bernard Looney, chief executive officer of BP Plc, made a startling admission: He thought that oil demand might never return to its pre-pandemic peak. But recently, Looney has done an about-face.
After announcing ambitious plans to cut emissions, BP, one of the world’s top crude producers, is now plowing more money into fossil fuels. Oil consumption is heading for a record this year, according to the International Energy Agency, which advises major economies. Supply — buffeted by Russia’s invasion of Ukraine, a slowdown in US shale growth and lackluster investment in production — can’t keep up.
It all comes down to China: The world’s second-biggest oil consumer is snapping up crude after reversing its strict Covid-19 policies. Against a backdrop of tight supply, the demand boost has everyone from Goldman Sachs Group Inc. to trading powerhouse Vitol Group predicting a rally to $100 a barrel later this year.
“The demand from China is very strong,” Amin Nasser, CEO of Saudi Aramco — the world’s biggest oil company — said in a March 1 interview in Riyadh.
By the second half of the year, analysts say, the market will face a shortage — a scenario that will loom over the industry leaders meeting this week in Houston for CERAWeek by S&P Global, a major annual energy conference.
There is a lot more to this article. Almost everyone is predicting a price jump in the second half of this year as supply is expected to fall far short of demand. OPEC vows not to increase production and the US increase for the year is expected to be around 560,000 barrels a day. Not nearly enough the analysts say.
No peak demand anytime soon, at least not for jet fuel.
Air India made the largest plane order in commercial aviation history
Executives for Air India unveiled the single-largest airplane purchase ever on Tuesday (Feb 14), purchasing close to 500 planes from Boeing and Airbus. Although the price was not made public, industry experts estimate the cost at about $85 billion.
interesting comment from Scott Sheffield with pioneer
https://www.youtube.com/watch?v=IpDqMP-EysE
this is why oil works in a inflationary environment, higher cost limit production until prices increase enough to add supply, it’s a cycle.
Inflation growing at the FED’s target of 2% per year is not a cycle, it is an exponential curve.
The US exports some of its inflation overseas which is why we aren’t seeing the full brunt of it ( it is sequestered in other countries reserves ).
However the FED put that ability in serious jeopordy by cancelling Russia’s dollar assets. Who wants to hold that which can be canceled on a whim?
The fed’s mandate is stable prices….that should be 0% inflation/deflation
Andre, I don’t have any real argument with your analysis. I would add that the inflation genie is out of the bottle, I have real doubts that they can, will or desire to put it back in and have done what i can to protect myself. This is all a charade from my standpoint, keeping the lemmings from stampeding over the cliff all at the same time. In this case he who panics first… panics best, witness what is happing in Lebanon.
Anybody who trust the federal government with their financial future will likely be destroyed. On that happy note, elections have consequences….its not as if they did not warn us.
Lebanon, Pakistan and a long list of other countries are experiencing inflation due to a lack of dollars, not too many dollars chasing too few goods and services. It’s not monetary inflation or an abundance of money.
It’s a lack of dollar liquidity outside US that looks like inflation but it’s not. Demand destruction is coming in a big way because there is no money per say backing these prices. Oil is going to $25 not $125
“La destrucción de la demanda está llegando a lo grande porque no hay dinero que respalde estos precios. El petróleo va a $ 25 no $ 125”
Mierda, Incluso un reloj roto es correcto dos veces al día.
marzo y $80, ¿ahora qué? Mover los postes de la portería.
JAJAJA
Take a look at Chinese trade data. Exports down 6.8%. Imports down 10.2% yoy for Jan-Feb 2023. China was in lockdown Jan-Feb 2022 btw.
So China reopens and implodes? Nah we in a global recession.
No bueno para nada.
China exports a lot of dollars when they import raw material. Dollars that their trading partners desperately need.
More than a few countries are facing a currency crisis due to lack of U.S. dollar liquidity. Maybe that’s why all the yield curves are deeply inverted.
HHH , since Jan 2021 I have said there will never be a pre covid 2019 economy . I ( you also ) were correct then and are correct now . Undertanding the Euro dollar problem was a key plus nett energy , EcoE , demographics etc and then connect the dots , this was a black hole from which there was no way out .
https://finance.yahoo.com/news/world-riskiest-markets-stumble-crisis-130000294.html
Credit Suisse is having to offer higher rates on deposits than they can afford to pay. I could tie in how a banking crisis in Europe would affect the price of oil. But I think it’s obvious.
Again Credit Suisse problem is a dollar liquidity issue that the FED and SNB can’t solve via currency swaps. Because banks reserves created at Fed aren’t a substitute for actual money.
The writing is on the wall . Ignore if you want to . No pre covid 2019 .
https://marketnews.com/mni-brief-taiwan-exports-fall-again-in-february
https://finance.yahoo.com/news/wrapup-1-china-jan-feb-062058193.html
In the meanwhile the chartist think oil is overpriced . I don’t make the news , just report it .
HHH good lord, here are two links showing the inflation in Lebanon,
https://www.thenationalnews.com/business/economy/2023/02/22/lebanon-inflation-soared-124-in-january-as-economic-crisis-continued/
https://www.reuters.com/markets/rates-bonds/penny-pinching-power-cuts-lebanons-middle-class-squeezed-by-crisis-2022-01-23/
as you can see the inflation took off in early 2019, has absolutely nothing to do with your statement above. What is the issue, same as it always is, a crises in confidence in the local currency. Will it happen here in the US, I don’t know, what I do know is the seeds were sowed over many years, they were watered, fertilized with ever higher debts, they have now sprouted, they are getting plenty of sunshine with ever larger deficits, lack of confidence in institutions, press, and politicians. There is NO sign in the data of an imminent deflationary collapse. If china goes into Taiwan and broad trade sanctions are imposed, yea I can see that type of scenario playing out, till then not so much.
inflation a primer
https://www.zerohedge.com/markets/how-country-goes-bankrupt-10-steps
A bit more context into the current economic environment for Jeff gundlach
https://www.zerohedge.com/markets/survivor-jeff-gundlach-live-webcast
of particular interest is the chart and commentary showing interest cost to the federal government as rates are hiked. sleep well🙁
China’s annual inflation came in at 1%. China is in deep shit. All that internal credit denominated in yuan turns deflationary when it’s defaulted on.
Just an educated guess but non preforming loans are likely 30-35% of all loans currently in China.
We are standing on edge of the abyss and people are still talking $100+ oil as far as the eye can see and inflation being the biggest monster in the room.
HHH,
Roughly 6 to 12 months ago you opined that oil would go to $25/bo by March 2023, would you care to revise your estimate? My guess would be March 2045. The futures market has WTI crude at $49.58/bo in Dec 2033 as of March 9, 2023.
https://www.cmegroup.com/markets/energy/crude-oil/light-sweet-crude.quotes.html
Dennis
I will not “pile” on HHH for an inaccurate prediction, but it should be noted why his prediction has failed at least thus far too materialize. The distortions in the system due to covid shut down and the unprecedented monetary response here and around the world have yet to be fully revealed let alone resolved. My disagreement with HHH prediction is one of an historical nature.
That is to say, he is thinking that China debt crises, which is not that dissimilar to what Japan went though in the early 1990’s and the US in the late 2008, will lead to widespread default, which could lead to his prediction coming to fruition. I think he fails to realize because of the size of the problem, the economic and human crises that would evolve, it will simply be handled like Japan and the US did. The debt will be assumed and papered over by the Chinese government. It must be as the issue is too large and the consequences too large. So his point is correct and until world gets past it should be watched very carefully.
My question for HHH is, if china does indeed follow the path laid out by Japan and the US, how does that change his prediction, does he still see a deflationary collapse? or an inflationary impact? I am betting on the latter but mindful of the former.
I would also add that making a prediction what the price of oil is in march of 2045 is F’ing silly and beneath a serious person.
A prediction of low price oil is simply a prediction of economic depression.
Depression could come anytime, considering that our complex world has so many points of interconnected fragility and over-extension beyond solid footing.
But to bet that one knows specifically when that may come to be
is simply the bet of a person who hasn’t been around the block yet.
Turmoil in the global markets and economy could be here by the time we wake up tomorrow… or in some other decade.
I’ve been around long enough to know to not follow anyone else’s prediction a particular time. I can make that mistake on my own, thank you.
Just early with the call Dennis. Yield curves are more certain now than they were 6 months ago that inflation isn’t a problem at all. Deflation is the boogeyman in the room that everyone should be concerned about.
Supply side shocks due to government Covid response and war in Ukraine. Are high prices with no money supply backing them. Dollars just aren’t being created in Eurodollar market like they need to be to support the inflation thesis.
These things take time to play out. I know I’m right about the call I’m just early.
Global trade data has been atrocious everywhere. To my knowledge nobody is in lockdown anymore anywhere. Where is the demand at?
HHH- “Global trade data has been atrocious everywhere. To my knowledge nobody is in lockdown anymore anywhere. Where is the demand at?”
Global oil/liquids consumption are as high as ever.
Texastea,
I expect oil supply will be higher than demand by 2035 and this will lead oil prices to fall, by 2045 oil prices might fall to $25/b in 2022$, not likely before imho.
In 2035, $50/b in 2022$ might be a reasonable guess, for 2023 my expectation is about 85/b for annual average WTI price.
HHH,
So you were early, yes I agree, you have not said how early.
So now your forecast seems to be $25/b in the future. Left as is I would concur. If you give a year and month this might occur, I am guessing it would be different than my guess which is in 20 years or so.
“Just early with the call Dennis. Yield curves are more certain now than they were 6 months ago that inflation isn’t a problem at all. ”
HHH,
Did you see SVB bank just collapse? It is because of rising interest rates because the FED is trying to halt inflation.
Just because the Yield Curve represents people not worried about inflation, doesn’t mean that they are correct.
I think Peak Oil and Debt defaults are baked into the cake and are deflationary.
But in the mean time, inflation is a big concern in the US, etc.
Dennis I have no crystal ball. I use the best data much of which is publicly available in order to figure out which direction things are going.
Yield curves don’t tell you exactly to the date when SHTF. Exactly to the minute when things collapse.
What yield curves are saying right now is vast majority of people are hedging against a really nasty recession.
What do trillions upon trillions in the bond markets know that average people don’t know? They see what is going on in real economy everyday and frankly right now they don’t like what the see at all.
more on the eia data accuracy
https://www.zerohedge.com/energy/eia-vows-improve-accuracy-its-oil-data
I think it is a blessing that natural gas resources are so vast, not only in the US but also elsewhere. Makes for a difficult and volatile market for natural gas prices for a long time; but with some skill investments can be successful. Not having the natural gas resources would on the other hand have been disastrous for western economies. The LNG market is not really liquid globally like oil – will it ever be very liquid, not sure.
Isn’t he talking about fracking (which depletes fast)?
https://twitter.com/PeterZeihan/status/1614277183492739072
https://www.reuters.com/business/energy/exxon-prepares-start-up-12-bln-texas-oil-refinery-expansion-sources-2023-01-13/
whatever happen to “We are going to phase it out”…Joe Biden
https://oilprice.com/Energy/Energy-General/US-Official-Calls-For-Higher-Global-Oil-Production.html
USA Drops More Rigs
by Andreas Exarheas|Rigzone Staff|Monday, March 06, 2023
The U.S. dropped four rigs week on week, according to Baker Hughes’ latest rotary rig count, which was published on March 3.
The four rigs comprised two land rigs, one offshore rig, and one inland water rig, the count showed. The decrease takes the total U.S. rig count to 749, comprising 732 land rigs, 16 offshore rigs, and one inland water rig, Baker Hughes’ count outlined. Of the total U.S. rig figure of 749, 592 rigs are classified as oil rigs, 154 rigs are classified as gas rigs, and three are classified as miscellaneous rigs.
Canada added two rigs week on week, according to the Baker Hughes count, which revealed that the country’s total rig count is now 246, comprising 158 oil rigs and 88 gas rigs. North America’s total rig count is now 995, and down two week on week, Baker Hughes outlined in the count.
This is about half the article. Click on link to get the rest.
Ron
There is an updated chart on rigs and fracs up to March 3 in the post. Hz oil rigs were down by 5 to 551 and are at the same level as July 29, 2022.
OFM
With energy security gaining importance, Canada must step up for the world
Attached is an article regarding what Canada’s role should be in supplying oil to the world. There are no Federal politicians there. The current government wants nothing to do with oil.
As this year’s CERAWeek gets under way in Houston, it’s unfortunately without significant political presence from Canadian elected officials – save for Alberta’s Energy Minister Peter Guthrie, his Ontario counterpart Todd Smith, and Calgary Mayor Jyoti Gondek. The world’s global energy players will therefore discuss and debate the challenges and opportunities for the sector, against a backdrop of geopolitical tensions, without Canada effectively at the table. While there will be a significant presence from Alberta’s energy sector, including those from the Pathways Alliance and a number of cleantech companies, both government and business need to be present, in order to develop policy that is in sync with where the world is going. There is too much at stake to think this can be done without listening to how others are solving the same problem, together.
Pretty sad situation.
https://www.theglobeandmail.com/business/commentary/article-energy-security-climate-goals-investing/
good golly! looks like texas tea is right once again. the whole thread is worth a read.
https://mobile.twitter.com/araj_energy
Abhi Rajendran
“We heard this also from John Kerry yesterday
And it’s a shift in messaging that makes a ton of sense. Eventually the IEA will also catch on ”
#OOTT #ONgT #Netzero
Quote Tweet
Giovanni Staunovo🛢
@staunovo
·
10h
#Australia: PM Albanese says gas essential in energy transition
https://reuters.com/article/australia-politics-energy-idUSL4N35E3EH
API Crude Storage
Crude. -3.835mm (+700k exp)
Cushing. +24k
Gasoline +1.84mm (-1.4mm exp)
Distillates. +1.927mm (-1.0mm exp)
Hopefully the end of those massive builds.
The EIA Short-Term Energy Outlook has altered its outlook for Russia. Up slightly in February then dropping 1.1 million barrels per day in the next two months.
Note. This is total liquids, not C+C.
What’s the reason for the drop ? Sanctions ?
There is a debate about that. Russia says it is because of the sanctions and price cap. But most analysts say it is because their ability to produce is declining because all the high-tech companies pulled out.
In the post above it was noted that that EIA information for January for the GOM seemed optimistic because the Vito platform did not come online till February 15th.
Today the EIA released its updated STEO projection for the GOM and made significant changes to the production profile for January and February. See attached.
Updated STEO for US C plus C and L48 excluding GOM, centered 12 month average (CTMA) shown on chart with peaks in October 2019 (for CTMA) shown (12.57 and 10.17 Mb/d) and July 2024 CTMA also shown. Peak for US CTMA C plus C output exceeded in March 2024 and for L48 ex GOM CTMA peak is exceeded in Sept 2023.
Some people don’t give up . 🙂
https://journal-neo.org/2015/10/09/oh-oil-where-is-thy-peak/
Oh.
You mean the Jewish conspiracy/ abiotic oil guy is back?
Well, fuck him.
For all the companies that get most of their production from fracking LTO reservoirs (see above charts) this shows the cumulative adjustments and the ration of that to the cumulative discoveries. In the early years most production was conventional and there were positive adjustments as probable reserves became proven, but with more LTO the adjustments have settled out at -5 to -10% – i.e. there are no net probable reserves with LTO and the proven reserves are have been slightly overestimated (and may still, though not necessarily).
For shale gas the situation is worse with overestimation at around 20 to 25%. As some of this is associated gas, which is likely to be similar to the oil (i.e. maybe only 5%) and some is still conventional gas produced by the various companies the situation in the dry gas fields will be worse and they may have been overstated by 30% or more.
This shows Suncor’s bitumen reserves (Canadian rules require probable reserves to be reported). Overall they are now into the mature stage of development with reserves declining. R/P for proven is about 17 and for proven and probable about 26 (i.e. about a 4% depletion rate – though with mining operations I don’t think this shows as a production decline). Last year there was a small addition of probable discoveries but a slightly larger revision downward for existing recoverable (with obout the same converted from probable to proven).
George
Thanks for doing Suncor. Could you please do Canadian Natural Resources (NYSE: CNQ). It is Canada’s biggest oil producer.
The bigger issue here in Canada is whether the govt will let these companies open new areas to expand their R/P. The primary issue for this govt is CC. Last April the Minister of Environment issued a warning to Suncor.
https://www.reuters.com/business/environment/canada-warns-environmental-impact-proposed-suncor-oil-sands-project-unacceptable-2022-04-06/
This morning the Canadian bank regulator told the banks to consider risks associated with CC. Note the banks fund and make good profits on financing Canadian oil companies.
“Canada’s large banks and insurance companies will have to run stress tests and disclose key aspects of their plans to manage climate change risk by the end of next year, according to guidance issued Tuesday by the Office of the Superintendent of Financial Institutions.”
https://financialpost.com/fp-finance/banking/osfi-climate-risk-rules
It doesn’t report until later in March. I can get Cenovus though.
George
That would be great. CNQ did report financials on March 2. I don’t see anything regarding reserves. Not sure where they show up
https://www.cnrl.com/investors/financials/#none
40-f comes out last week of March in SEC (it may be earlier in the Canadian equivalent but that’s far too annoying to try and find stuff in). See below for Cenovus
WSJ article:
https://www.wsj.com/articles/u-s-shale-boom-shows-signs-of-peaking-as-big-oil-wells-disappear-2adef03f?st=jeu57dyn3pqw3wm&reflink=desktopwebshare_permalink
“HOUSTON—The boom in oil production that over the last decade made the U.S. the world’s largest producer is waning, suggesting the era of shale growth is nearing its peak.
Frackers are hitting fewer big gushers in the Permian Basin, America’s busiest oil patch, the latest sign they have drained their catalog of good wells. Shale companies’ biggest and best wells are producing less oil, according to data reviewed by The Wall Street Journal.
The Journal reported last year companies would exhaust their best U.S. inventory in a handful of years if they resumed the breakneck drilling pace of prepandemic times.
Now, recent results out of the Permian, spread across West Texas and New Mexico, are mimicking the onset of a production plateau that has taken place at other, more mature U.S. shale plays.”
Rgds
WP
EIA World Data is up with data for November 2021.. World C+C production was up 101 K barrels per day in November. The big increases were Kazakhstan, recovering from serious maintenance problems, up 381,000 barrels per day, And Russia, up 150,000 bp/d. The rest of the world was down 430,000 barrels per day.
Oh my it looks as if just about everybody has now received the memo, natural gas is the future:
“As the saying goes, “a rising tide lifts all boats,” and for the Commonwealth and greater Appalachian region, natural gas is the tide that keeps rising to improve our quality of life.
Access to affordable and clean energy underpins economic prosperity. Providing roughly 20% of America’s total natural gas production, Pennsylvania is a top contributor to the low-cost, reliable, and clean energy that forms a building block of modern society.
Manufacturers, business groups, skilled laborers, and conservationists alike are looking for ways to lessen their environmental footprint without sacrificing the blue-collar way of life that’s the heart and soul of Western Pennsylvania.
Natural gas is the catalyst to achieving those goals, and we’re blessed to have it in abundance right here in our backyard. From reliably powering homes, hospitals, schools, and businesses to serving as a clean and low-cost feedstock for manufacturing and industrial processes, natural gas powers it all.”
https://www.zerohedge.com/energy/energy-keeps-pennsylvania-open-business
hop on board the water is fine🖖
TTT,
While one would think the numerous economic and social benefits of inexpensive energy should be obvious, that story you linked barely scratches the surface.
Specifically, if Pennsylvania followed Ohio’s recent legislative mandate of opening up state-owned lands to hydrocarbon development, the knock on effects would be monumental.
(Pennsylvania’s DCNR independently has been leasing mineral rights beneath state owned land for years, bringing in hundreds of millions of dollars in royalties to state coffers. This is a small fraction of available developmental land in the Commonwealth).
One need only look at Pittsburgh International Airport (stunning online images) – with 8 onsite producing gas wells (and its own microgrid power generation) to recognize just how profoundly positive can be the results of private/government cooperation in seizing the bounty beneath the ground.
If cash-strapped local governments would like additional revenue, simply looking at the new, world class high schools in tiny Watford City and Williston, North Dakota reveals just what prudent, intelligent policies can bring about when hydrocarbon resources are effectively developed.
Kinda makes ya wonder about the long running, ongoing efforts to kneecap this industry.
Coffee try as they may the real, practical and affordable solutions will be the winners.
U.S. Feed Gas Deliveries Hit Record as Freeport LNG Continues to Ramp Up – LNG Recap
BY JAMISON COCKLIN
March 7, 202
“Freeport LNG is now accepting more than 1 Bcf/d of feed gas, helping send total deliveries to U.S. export plants above 14 Bcf/d over the weekend for the first time ever.”
https://www.naturalgasintel.com/u-s-feed-gas-deliveries-hit-record-as-freeport-lng-continues-to-ramp-up-lng-recap/
Is this guy a time-traveller from the 1950’s ?
https://www.oilystuffblog.com/single-post/a-big-deal
Worth reading
Worth reading
Maybe JT. But can you give us some context?
JT,
Thanks. Great article.
Peak-Oil Fears Cast Shadow Over US Supply Outlook as Costs Climb
(Bloomberg) — The specter of peak oil that haunted global energy markets during the first decade of the 21st century is once again rearing its head.
Major US oil producers are warning that production from one of the fastest growing sources of supply appears likely to top out by the end of the decade. ConocoPhillips and Pioneer Natural Resources Co. are among those saying the American shale-oil juggernaut soon will be a spent force as the best drilling targets are exhausted and financing new wells gets more difficult.
“You see the plateau on the horizon,” ConocoPhillips Chief Executive Officer Ryan Lance said during a panel discussion at the CERAWeek by S&P Global conference in Houston on Tuesday. Once US crude production peaks around 2030, it’ll plateau for a time before commencing a decline, he added.
Government and private-sector researchers have been cutting forecasts for 2023 US oil-supply growth in the face of surging cost inflation, labor shortages and investor demands that more cash be diverted from drilling to dividends and buybacks. Although output in the world’s biggest economy is set to continue rising for a least a few more years, the zenith is fast approaching, executives and analysts said.
“I wish we could get world leaders to realize that we need hydrocarbons for another 50 years,” said Pioneer CEO Scott Sheffield, who expects US production to peak in five or six years.
Before the dawn of the shale-oil revolution, theorists like the late investment banker Matthew Simmons were issuing dire warnings that the Middle Eastern oil bonanza that fed more than half a century of unprecedented economic expansion across the Western world was unsustainable.
But those fears were swept aside as fracking and horizontal drilling innovations perfected in US natural gas fields were adopted by oil drillers, who unleashed billions of barrels of crude that had been locked in heretofore impenetrable shale.
Shale-oil production began to surge early in the last decade, pushing overall US output to roughly 13 millions barrels a day in late 2019. But publicly traded oil companies have come under immense pressure to prioritize investor returns over production growth and it is in part why output is expected to peak, said Helen Currie, chief economist at ConocoPhillips.
Rising costs that squeeze profits also are discouraging management teams from pursuing some drilling projects. Commodity-trading house Gunvor Group Ltd. estimates that inflation in US oilfields will reach about 25% this year and 15% to 20% in 2024.
“It’s not about any downgrade to the resource or any negativity but it’s really about the pace of development of these resources,” Currie said.
Ron,
Not sure any of the oil and gas industry participants posting here would disagree, I think our own LTOS made those very points some time back to his credit. I think the message is clear, oil prices will need to rise to encourage new additional production as cost continue to rise. For people like shallow and mike S and even myself with legacy production may yet see anther golden age. It will take an increase in prices to keep new oil demand flat as opposed to growing, as my link bellow shows.
a bit more color.
https://oilprice.com/Energy/Energy-General/Chinas-Oil-Imports-Set-To-Soar-Despite-Slow-Start-To-2023.html
“may yet see anther golden age.”
Yes, it will be a (golden, copper, silver) age of alternative electrical energy largely powered by the golden sun.
And I assume the copper and silver will be mined, processed and shipped using vehicles that run on oil and oil products. If that’s make you sleep well at night who am i to judge?
Trying to quell your delusions of grandeur.
https://mobile.twitter.com/JavierBlas
CHART OF THE DAY: American total oil demand rose above they key 20 million b/d level in 2022
Annual average consumption reached 20.28m b/d, shy of the 20.54m b/d of 2019 before covid-19 hit
US oil demand has only averaged >20m b/d in 2003, 04, 05, 06, 07, 18 and 2019
#OOTT
Image
There is a chart that did not post.
over 20Mb/d with highest average price since 2014 and with the democratic president begging for more, the times they are a changing.
Wow so from 1973 to 2023 – 50 years – oil demand has risen from 17M barrels/day to 20. That is truly a blistering rate of increase…and is still down 6% from the peak
That’s why context is important. Let’s not forget that in that time frame the US exported most of their industrial base abroad and is now a service economy. What about China?
Texastea,
See finished petroleum product output below, crude oil and its products are the important number not various gases such as ethane, propane and butane.
Data from
https://www.eia.gov/dnav/pet/hist/LeafHandler.ashx?n=PET&s=MTPUPUS2&f=A
Forgive me Dennis,
I am not sure what your point is. Javier’s twitter post shows that in 2022 US oil demand, despite the highest prices in 8 years, is back over 20 million bopd. It follows most serious energy journalist opinion that OIL demand is set to stay high and even rise on a worldwide basis “DESPITE” many who predicted it would not. My only point to posting it here was to say.. See, a lot of you guys were just WRONG about the need for and demand for oil and other petroleum products as your green energy pipe dream as yet to materially change the direction of worldwide demand. Forgive me for being a bit of an ass in doing so. Like Mike S. its been my career for over 45 years. I know a bit about what I am talking about and have prospered by taking the opposite side of the debate.
Texas tea,
For most here, oil is a liquid at standard temperature and pressure, this is not the case for ethane, propane and butane so the chart I posted excludes those natural gas “liquids”, they are only liquids under pressure, bottled gas as it were.
The point is very simple, oil demand is lower in the US than in 2005 when US oi demand was at its peak
It’s good you recognize the bumpy 20 year long plateau we’re on…kudos…
bumpin along…
Kengeo,
That chart is US oil demand, production is another matter. More interesting is World oil production which increased steadily from 1983 to 2019, at an annual rate of about 800 kbpd over that 37 year period.
Not exactly a plateau.
Understanding Peak Oil: What It Is And Why It Matters
Are we running out of oil?
This question has been on the minds of many experts in recent years.
The answer lies in the concept of peak oil – the point at which global petroleum production reaches its maximum potential and begins to decline.
But what does this mean for our future? Will we have to give up our cars and switch to bicycles? Or will new technologies save us from a world without oil?
In this article, we’ll dive deep into the topic of peak oil and explore its causes, implications, and potential solutions.
What Is Peak Oil
Peak oil is the point in time when worldwide petroleum production reaches its maximum point and begins to decline. It occurs when reserves of easily accessible oil are depleted, and it becomes increasingly difficult and expensive to extract remaining reserves.
The concept was first introduced by M. King Hubbert in the 1950s. According to his theory, once half of a given reserve has been extracted, production will begin to decline until all recoverable resources have been exhausted.
There is a lot more to this article, far too much for me to post all of it. But Peak oil is suddenly in the news. There are other atriclles out today on the subject. Just click on the links below to read them.
Forget peak oil demand: A thirst for barrels puts $100 in view
Oil consumption is heading for a record this year and supply can’t keep up.
Peak-Oil Fears Cast Shadow Over US Supply Outlook as Costs Climb
The specter of peak oil that haunted global energy markets during the first decade of the 21st century is once again rearing its head.
On the Return of Peak Oil and Other Long-Term Forecasts
US shale oil production is peaking and will enter permanent, if gradual, decline.
Cenovus bought most of COPs oil sands in 2017, Husky in 2021 and BP Sunrise in 2022. R/P for proven is 27 and for proven and probable 37. Organic replacement ratio has fallen below 100% for last four years.
Thanks George
Not surprised that the replacement ratio has fallen below 1. They are not spending exploration money and focussing on improving their efficiency in their SAGD process. They are happy these days that the price of NG has dropped since SAGD uses a lot of it.
“Results of this paper show that EROI of both mining oil sands (range of value: 3.9–8) and in situ oil sands (range of value: 3.2–5.4) display an upward trend over the past 7 years”…as of 2015.
https://www.researchgate.net/publication/316639756_Energy_Return_on_Investment_of_Canadian_Oil_Sands_Extraction_from_2009_to_2015
I wonder if further gains in the process energy efficiencies have been achieved since then.
Hickory,
I don’t see how the EROI of Oil Sands has increased when it continues to consume 1 Bcf/d of Natgas per 1 Mb/d of oil sands. Without the Natgas, there is no oil sands.
Remember: Oil has 6/1 Energy Equivalent to Natgas.
steve
From the paper it looks like SAGD has just got better as operation knowledge improved and mining had a step change around 2014 which might be because of start-up of new and improved plant (maybe Kearl – I had a bit of second hand knowledge and it was pretty well optimised).
George,
I don’t see how SAGD has become more efficient since 2016, if this is what the paper is suggesting. If we look at the data from the Alberta Energy Regulator comparing In-Situ oil production vs. natgas consumption 2016 vs. 2022:
Alberta 2016 In-Situ Oil Production = 1.4 mbd
Alberta 2016 In-Situ Natgas Usage = 1.52 bcf/d
Alberta 2022 In-Situ Oil Production = 1.7 mbd
Alberta 2022 In-Situ Natgas Usage = 2.1 bcf/d
In 2016, Alberta In-Situ Natgas consumption bcf/d vs. mbd was 108%, but this increased to 123% in 2022. So, it looks as if Alberta’s In-Situ oil production is consuming more natgas per barrel of oil production than it did in 2016.
steve
The paper was published in 2015 and covers 2009 to 2015, it doesn’t speak about later years but I’d agrre there is a limit to improvements that can be achieved just with operational efficiency.
George,
Another interesting Factor is how reliant Alberta Oil Sands is on the Montney Shale Gas production. So, the future of Alberta Oil Sands is tied directly to Montney Shale gas production and how long that lasts.
According to a 2018 article, Montney Shale Gas Well Decline Rates are behaving the same way as the shale gas wells in the USA. Higher production, due to Fracking On Steroids, also leads to higher declines overall.
https://energi.media/alberta/innovation-driver-performance-imodern-gas-wells-montney-formation/
It will be interesting to see how high Alberta’s Shale gas production will grow, but the world needs to realize that Alberta’s Oil Sands is totally dependent on shale gas production and not the ENERGY TOOTH FAIRY. 🙂
steve
And wait until they find out that extracting from the Green River Formation oil shale is dependent on the Colorado River flow.
Kearl started in 2013 and phase II in 2015, probably not responsible, but there were a few other new projects and upgraders around then I think.
Steve
Here are some improvements listed by Cenovus.
Electronic submersible pump (ESP).
A significant technological improvement to our SAGD process that replaces the need for natural gas to bring the oil to the surface while using less water, which improves our steam to oil ratio.
Solvent-aided process (SAP)
An advanced SAGD technique that combines a solvent, such as butane, with the steam to help dissolve the bitumen and improve recovery from the reservoir.
Steam to oil ratio (SOR)
A key measure of efficiency for operations using SAGD technology is the amount of steam needed to produce a barrel of oil. The quality of our assets and our team’s dedication to improving operational performance at our SAGD projects at Foster Creek and Christina Lake allowed us to achieve a combined steam to oil ratio of approximately 2.2 in 2017.
This means we used approximately 2.2 barrels of steam to produce one barrel of oil. The water we convert to steam is primarily brackish water, which is not suitable for animal or human consumption, or agriculture, and is mostly recycled.
This is among the lowest SOR in the industry. A low SOR allows us to grow and sustain production with comparatively smaller plants and lower energy usage and emissions, all of which results in a smaller environmental footprint.
“In early 2020, our Innovation team expected to launch a two-pad commercial demonstration project for propane solvent co-injection at our Foster Creek oil sands, however the COVID-19 pandemic delayed the trial. This in turn gave us the time to reassess our approach and deploy solvent technology more efficiently.”
Ovi,
Thanks for this information. While Cenovas may be becoming more efficient as a company in producing In-Situ oil sands, per the data I provided for 2016 vs. 2022, suggests, the industry as a whole is becoming LESS EFFICIENT.
Furthermore, up until the summer of last year, I had no idea how much Natgas was being consumed by the Alberta Oil Sands Industry. When I found out that it was basically a 1:1 Ratio of mbd vs. bcf/d, I was stunned.
Now, I find out that Alberta Oil Sands production is tied DIRECTLY to Montney Shale Gas Production (3.1 mbd oil sands from 3.1 bcf/d natgas usage), we begin to realize that Oil Sands is not powered by the ENERGY TOOTH FAIRY, but from Shale Gas that suffers a 35-40% Annual Natural Decline Rate.
NOTE: Natural Decline Rate refers to the real decline with NO NEW WELLS or CAPEX.
steve
Steve,
I imagine Alberta can import natural gas from the US if needed.
Dennis… LOLOLOL.
steve
Steve
Canada is building an LNG Terminal which will begin exporting LNG in 2025.
https://www.reuters.com/business/energy/electricity-constraints-force-canadas-first-lng-terminal-delay-renewable-shift-2023-01-16/
There are others who disagree with building this LNG terminal.
Due to climate commitments and energy security concerns, Europe is accelerating its plans to reduce gas use by ramping up energy efficiency and the use of renewable energy sources. While there may be demand for some fossil fuels, markets like Norway are more logical to fill immediate needs.
This results in a fundamental mismatch with Canadian supply opportunities. Canada cannot ramp up supply before 2025, while Europe’s energy needs will largely be resolved by that time.
High prices and energy security concerns, combined with climate commitments, suggest that new Canadian liquefied natural gas infrastructure would be at risk of becoming stranded.
https://www.iisd.org/articles/deep-dive/canadian-lng-not-eu-energy-crisis-solution
I think most of the Canadian LNG will go to Japan and China. This will free up more for Europe.
hey Ovi
” 2025, while Europe’s energy needs will largely be resolved by that time.”
I don’t understand that. Seems like a massive long term problem to me.
How do you see the energy supply situation in Europe being resolved?
Hickory
It has never been clearly laid out what the required supply situation for Europe/Germany is.
One of the main reasons for the Nordtream 2 pipeline into Germany was to supply the needs of the German chemical companies. The big ones are BASF, Bayer, Henkel, Evonik, Covestro and Merck. NG is one of their main feedstock. Ammonia and other types of fertilizers require CH4 as their feedstock. I am not sure what has happened this year to these companies production plans under NG restrictions.
So as I mention above, most of the Canadian LNG will go to Japan and China. This will free up more LNG from Qatar and Iran for Europe.
Here’s what I found regarding Canadian natural gas:
Production = 16.7 Bcf/d
Tar sands consumption = 3.23 Bcf/d
Exported to the US = 9.9 Bcf/d
If you do the math you’ll notice that almost half the natural gas consumed in Canada is for the tar sands. And 60% of what’s produced is exported to the US. So I doubt Canada will import more from the US than is exported anytime soon.
If those numbers are accurate then 19% of Canadian Nat Gas production goes to supply the oil sands industry, and there is plenty of it for that purpose at this point.
If they think it worth the trade off.
Ovi , “Canada cannot ramp up supply before 2025, while Europe’s energy needs will largely be resolved by that time. ”
Europe will not need a lot of gas at the rate it is deindustrialising .
https://financialpost.com/pmn/business-pmn/europe-loses-another-smelter-as-energy-crisis-leaves-deep-scars
https://seekingalpha.com/article/4585573-us-steel-taking-advantage-eu-steel-production-verge-of-imploding
Tata Steel in Holland want only $ 1 billion subsidy to give you green steel . Produce in India , ship to Holland , label as EU manufacture and pocket the $ 1 billion . 🙂
https://www.rtlnieuws.nl/economie/bedrijven/artikel/5369332/tata-steel-wil-1-miljard-subsidie-voor-schone-staalproductie
HIH
See my answer to Hickory above.
The EcoE is out of whack for EU manufacturing .
Frugal there are imports of natural gas to the US from Canada and also exports of natural gas from the US to Canada, the net is about 2000 BCF per year or 5.5 BCF/d on average in 2022.
If Canadians needed more natural gas for oil sand output they could simply export less to the US.
Ovi , I posted this before but once again . BASF Germany is now working at about 65% capacity . They have shutdown their ammonia production . No ammonia , no fertiliser . Many other basic chemical producers also in the same boat . Downstream is even worse. Evonik , Henkel , Covestro and Ineos in Antwerp also working at 70-75% capacity .
https://cen.acs.org/business/finance/BASF-cutting-back-main-site/101/web/2023/02
By the 2022 annual report Shell produced 17mmbbl of synthetic crude in 2022 and used one million of it in operations – presumably for diesel to power the mining trucks and excavators. In the paper above, before the 2014/15 jump mining was showing a slow decline. I would have thought that as mines age the bitumen extracted gets less concentrated away from m the core – the energy needed would be proportional to the total ore mined, rather than the oil produced, so the EROI would decline.
A big improvement with SAGD was adding a producer between steam/producer pairs, but that would show as a step change, and was probably before 2009.
George, I did visit the tar sand operations once. If I remember correctly, they told me that the open pit mines aren’t deeper than 75 m becasue this would be uneconomical. Is this becasue the tar/sand concentration decreases as you go deeper? Right now anything deeper than 75 m is done with SAGD, which obviously uses more natural gas than open pit mining.
Frugal
I think it has to do with the work associated with clearing the overburden. As the tar sands layer drifts lower, more overburden has to be removed.
OVI
That is correct, only about 20% of the oil sands is accessible for the mining approach, which is why SAGD was developed. In the early days the SAGD folks had some problems with breakthrough where steam and oil broke through the overburden to create hot oil pools for everyone to see.
I spoke to a chemical engineer who was involved in early attempts to reduce or eliminate the bulk of steam usage by using emulsifiers, surfactants and viscosity modifiers, but the research effort came to nothing because the clay that came up with the oil bound so tightly to some of the additives that it made the process uneconomic.
Propane sounds like a good avenue for investigation.
Many SAGD projects use a combined cycle power plant , selling the power from the gas turbine ( with nearly 100% thermal efficiency), then using the steam from the boiler for the heat source underground.
Note that any heat source can be used to generate the underground steam – coal, bitumen, nuclear. Natural gas is used because it is the cheapest source of energy.
Ovi, you’re right. Here’s good article explaining oil sand mining.
SURFACE MINING TECHNIQUES USED IN THE OIL SANDS
Frugal
Thanks for the link.
Dennis – Do I get to move you over here yet????
KenGeo,
I am flattered to be included. But it is not fair to Dennis.
I add nothing of value to the technical discussion of oil/gas/natural/renewable.
I pretty much copy Ron P on Oil. Its double counting Ron’s opinion.
Been following him (sounds creepy) since The Oil Drum days.
And listen to the discussion on the others.
Big fan of Dennis, Ovi, Mike S, Ron, OFM, George, Shallow, etc work and contributions.
It’s a great site.
And it will grow and grow and grow in value when the HISTORIANS LOOKING BACK WONDER WHAT HAPPENED
Kengeo,
I don’t think the future can be predicted, but I don’t fit neatly in your chart, assuming this chart is for the centered 12 month peak for World C plus C output. my best guess id 2028 plus or minus 2 years so 2026 to 2030, a peak post 2030 is possible, but lower probability in my opinion less than 1 in 5 odds.
Anybody know what the net energy flow of crude oil at the refinery level is?
[ratio of combustible energy content out/energy content of crude oil input]
Vaclav Smil says:
“After subtracting the non-fuel products (lubricants, tar, asphalt) the net energy content of the refined fuels is about 85-88% of energy in the crude oil. Specific studies indicate that gasoline contains 6-10 times more energy than the energy cost of its refining.”
Which isn’t quite a full answer but the best I’ve seen.
Thanks for that.
Interesting when we realize that we lose something like 70% of the energy content when we combust the gasoline and diesel in an ICE.
Refineries have volumetric gains but not energy gains. Also, don’t forget electric power consumption – 4% of US consumption?/!
https://www.osti.gov/biblio/7261027
Rgds
WP
WP , I think good analogies would be boiling water to get steam or adding water to whiskey to have more whiskey . Increase in volume only .
A take home point is that the net EROEI for transport fuel from crude oil derivatives, from the level of the well to the wheel on the road, is not as brilliant a gold standard as people often proclaim.
How do we make a quick run to $25/b oil?
Dozens of paths could get you there tomorrow or in the next decade.
Might start with a small headline like
“US intelligence agencies warn Ukraine of an impending Russian invasion, within weeks”, or
like happened today with a big Silicon Valley Bank SIVB
“shares plunged 60% in regular trading after disclosing large losses…
SVB Financial stock tumbles an additional 22% after hours on reports of funds advising clients to pull money from bank…,
“Before SVB Financial decided to take such a dramatic step, the movement of its net interest margin was signaling that the bank wasn’t well positioned for the combination of rising interest rates and slowing loan growth in the venture capital space.”
The possibilities could fill pages.
Or we will simply see the much higher oil prices one would expect from oil depletion.
Seems to be a ‘battle’ going on between those who are actually insane versus those who merely worship money.
SIVB is a window opening.
Most, should not look.
Hint:
Roughly 87% of Silicon Valley Bank’s deposits were uninsured as of December 2022, according to its annual report.
Interesting. Adam Tooze says:
At SVB at the end of 2022 only 2.7 percent of deposits were covered by FDIC insurance
https://adamtooze.substack.com/p/chartbook-200-something-broke-the
Ouch, that is a lot of hurt for the poor deposit holders. Could there be more banking fails to come ?
Second largest bank failure in history. What are the chances that the stock markets crash on Monday and HHH gets hi $25 oil in March?
If banks are forced to into selling assets in order to meet customer withdrawals. This is going to get real ugly real quick. Because banks really need to hold their assets. Bonds and mortgage backed securities until maturity. If they are forced to sell now it will be at a big loss. They can thank the FED for raising interest rates for that.
Anybody here ever try using bank reserves created at Fed to buy anything or pay a bill?
When you realize the FED is just a bank regulator and not a liquidity provider you’ll soon realize how out of control things get when customers pull all their money.
How is the FED not a liquidity provider?
If they buy a US Government Bond the US Treasury spends the money.
I think I know what you are thinking, Banks trade bank reserves around with each other and that is like trading laundromat tokens or poker chips. Only they can use them?
When the FED buys US Government issued debt instruments that creates liquidity?
Or have I missed the very basics of economics/finance???
FED buys the treasury bonds in secondary markets from primary dealer banks. No money is printed.
Think of bank reserves as a form of collateral that the FED swaps with the primary dealers for the treasuries and MBS’s
No money ever leaves the FED. Primary dealers aren’t left flush with cash that they can lend out after the transaction. Primary dealers have an account at FED with a credit entry with X amount of bank reserves in their name.
QE is actually deflationary as it removes collateral from banking system that could be used in the banking system to make loans and create actual money.
The inflation we have seen since beginning of Covid isn’t due to money printing. It was due to supply side shocks that could only manifest itself in higher prices for goods and services.
What we are entering now on the backside of the supply shock is the demand destruction. Which you can clearly see in trade data everywhere.
Interesting.
So all this talk about money printing never actually happened?
Back to the drawing board!!
46% of all exportable oil comes from KSA and Russia . Natt Hagens
https://twitter.com/aeberman12/status/1633958308737318912
There is an 18-minute video associated with that link that features Nate Hagens’ response to someone named Alex Epstein. It is absolutely perfect in its precise delineation of the current situation.
See here:
https://www.youtube.com/watch?v=Ltya0nnvxkA&t=5s
Thanks for the link Mike. Nate Hagens is a very intelligent man, the type of man who can see through all the hype and get to the meat of the situation.
Steven Kopits . Long time , no see .
https://www.princetonpolicy.com/ppa-blog/2023/3/8/russia-oil-production-grows-returns-to-near-pre-war-levels
Information purpose only .
Breaking News: Pioneer CEO Says USA Has Already Reached Peak Oil
U.S. won’t reach a new record in oil production ‘ever again,’ says Pioneer Natural Resources CEO
While oil production in the U.S. will continue its return towards pre-Covid levels, limits on refining capacity and inventory mean it will not grow as much as some hope, according to Pioneer Natural Resources CEO Scott Sheffield.
“We just don’t have that potential to grow U.S. production ever again,” Sheffield told CNBC’s Brian Sullivan on Tuesday at CERAWeek.
To be clear, this doesn’t mean no production growth. Many oil companies have outlined production increases as part of spending plans this year, though oil companies are now in an era of greater fiscal discipline, not shy about signaling they will favor shareholder rewards like stock buybacks over higher production levels. Sheffield expects growth to top out at a level that was already reached pre-pandemic.
“We may get back to 13 million barrels a day,” he said, which would match the record high average recorded in November 2019 by the U.S. Energy Information Administration. But he added it will be at a “very slow pace,” taking two and half to three years to match that previous record level.
For consumers, that means gas prices are more likely to stay within the current range, and pricing risk be tilted to the upside later this year.
According to the EIA, an average of 11.9 million barrels of U.S. crude oil were produced per day in 2022, below the record in 2019 of an average of 12.3 million barrels per day. The EIA is forecasting a new record for this year, but barely higher, at an average of 12.4 million barrels per day.
“We don’t have the refining capacity … if we all add more rigs, service costs will go up another 20%-30%, it takes away free cash flow,” Sheffield said. “And secondly, the industry just doesn’t have the inventory.”
There is a lot more to this article. Suggest that you click on the link and read it, whether you agree with Pioneer’s CEO or not.
If he is correct and simultaneously we get a severe world recession that would keep a support on oil prices which in turn might have severely distressing consequences.
The world would never want to be in a position where we have high energy prices at the same time as a recession. This scenario could ultimately lead to a depression in my opinion.
Well, it really doesn’t matter if the previous US peak is breached because if it is, it won’t be by much. The point is that the USA won’t be the driver of higher world production as it was in the previous decade.
If world crude oil production is to go on climbing upward than that production must come from somewhere other than the USA. Where that will be I have no idea. I really don’t believe it will happen.
To Ron:
“If world crude oil production is to go on climbing upward than that production must come from somewhere other than the USA. Where that will be I have no idea. I really don’t believe it will happen.”
Yeah, where have I heard that one before? Oh yeah…when people claimed the US had peaked in 1970 and didn’t have a clue about why there was zero reason that was required to be forever true.
A sucker born every minute is one thing, but the endlessly unimaginative rinse-recycle-repeat of peak oilers is just…mind numbing.
Of course, US conventional oil did peak in 1970. And no one predicted the shale oil boom, not even you! But now you seem to assume there will, very likely, be another such boom. Ar at least you assume we are ignorant to count another shale boom out.
But of course, we are going to find another Permian. Hell, any fool should know that.
Your bullshit is getting old RGR. Any child could come up with such nonsense as you spout. No one knows the future but we can speculate on what is most likely. It is most likely that we will not find another Permian. It is most likely that the shale boom is winding down. It is most likely that even if US production does go above 13 million barrels per day, it will not be by very much.
Speculate on what is most likely is what we do on this list RGR. And we have every intention of continuing to do that. You apparently don’t think we should do that. Well, that is just too goddamn bad. You are behaving like a spoiled schoolyard brat. If you find it mind-numbing then go somewhere else, somewhere your mind will not face such stressful opinions.
Platts Survey: OPEC+ Oil Production Fell By 80,000 Bpd In February
The combined oil production of the OPEC+ group dropped in February by 80,000 barrels per day (bpd) as a small rise in Russia’s still resilient output failed to offset declines in Angola, Iraq, and Kazakhstan, according to the Platts survey by S&P Global Commodity Insights.
Diminishing Returns of Socialism
In the end all markets respond predictably to the Law of Diminishing Marginal Utility. If you don’t believe that, then you are a Malthusian and publicly admitting you are a moron with the inability to accept outcomes you cannot personally perceive.
I put the “Peak Oil” folks in this category. And you know who you are.
I put Climate Change believers in this category as well. Yes, by the transitive property of rhetorical mathematics, I just called them all morons.
The Davos solution to their problems of overpromising the deliverables of socialism financed through the dollar is to default on those promises through global monetary inflation using war with Russia and China as the cover and Climate Change as the reason why it’s necessary.
This is to save themselves and secure totalitarian control for their posterity into the next cycle of history.
But history will prove them wrong. Because, in the end, you can’t fight a flowing river any more than you can alter the mass of human behavior with respect to their preferences. If they want to drive a car, eat a steak, live in a house, own a gun or have a child, they will.
You can delay it or make it more expensive but that expense is a double-edged sword, because as Margaret Thatcher famously said, “The problem with socialism is that eventually you run out of other people’s money.” (OPM)
Think of the Eurodollar system as the ultimate expression of OPM, which is a homophone for ‘hopium.’ . . .
The Canadian rig count dropped 23, so the thaw has definitely set in, and Permian dropped six for this week.
Decline of Soviet Union and oil . Some history .
http://www.energycrisis.com/reynolds/SovietDecline.htm#:~:text=We%20believe%20a%20more%20fundamental,of%20disaster%2C%20causing%20the%20collapse
I just checked the current oil rig count. They came out yesterday, March 10. On December 2nd, the US oil rig count stood at 627. Yesterday the count was 590, a decline of 37 rigs. Over the same period, the frac spread count dropped by 24.
I just don’t understand why some folks are so optimistic about the future production of US crude oil.
Ron Said:
“I just don’t understand why some folks are so optimistic about the future production of US crude oil.”
Yeah, seems like I remember being told that one 18 years ago too. Back then it was “Hubbert was right!” and the geologically uninformed were falling all over themselves buying doomsteads and gold and whatnot. They didn’t even know (or more importantly care) WHY Hubbert had been right, or could be wrong. Well, not everyone. Sucker born every minute I get, but folks that can’t learn from their mistakes? Thy name is peak oiler.
“Hubbert was right!”
In fact Hubbert has been right, so far at least. US crude production peaked in 1973.
The EIA shows bigger numbers today, but that’s just a sleight of hand done by show C+C in the same time series with historic crude oil number.
Condensate is not crude oil. To paraphrase Abe Lincoln, calling a dog’s tail a leg doesn’t make it a leg.
Forgive me Alimbiquared, but if memory serves, US oil was around 10 mmbbl/d, and here recently it was more like 12 or 12.5? I could be wrong, haven’t checked the figures recently, as once it was past the old peak I mean really, that would just be rubbing it in.
Good thing when I talk about oil, I talk about oil and not condensate. Folks making claims as to all those HGLs are either fighting a strawman, or being silly. Or both. There are plenty of HGLs floating around to be counted that aren’t oil, feel free to worry about them, I’ll just stick with the US making that 12+ mmbbl/d of, you know, real live C5+ oil.
Non-OPEC and World Oil Production Report will be posted tonight.
Thanks Ovi
In November 2022 OPEC C+C production stood at 30,823,000 barrels per day. That is 3,817,000 bp/d below the OPEC all-time C+C peak and 2,726,000 below where they stood in November 2018 when the world C+C peaked.
Greenland petroleum exploration history: Rise and fall, learnings, and future perspectives
In a period of less than 10 years, Greenland has seen a dramatic change in industry interest from being one of the hottest regions for investments to virtually no activities at all. As a result of detailed strategic planning and several successful licensing rounds offshore West Greenland, in Baffin Bay, and offshore North-East Greenland, activities culminated in the period 2010–2015 with large 2D and 3D seismic programs, seven exploration wells and lots of relevant science based on large field campaigns and drilling of cored holes. The history behind the licensing activities and research projects, and the most important results and models with implications for exploration are reviewed in this paper that also gives a status on present knowledge, main risks, and future needs. In the same period, Greenland experienced many political and administrative changes in relation to petroleum exploration. The massive relinquishment of licenses took place during a short period, and various key factors of importance for decision makers are discussed. It is not the resource potential nor the data background that is the main problem in Greenland exploration. It is mainly a combination of drastic fall in oil prices causing reduced exploration budgets in a critical period of decisions, high costs and technical challenges, rigid regulations, and lack of flexibility in relation to commitments that caused industry to leave Greenland. With the present industry outlook, it does not seem likely that industry will ever come back, especially not with the signals from the new Greenland Government. Data and knowledge will, however, be of importance for future scientific drilling and new research projects, especially on tectonic history combined with models of paleo climate and oceanography.
A new Non-OPEC oil Production thread has been posted
https://peakoilbarrel.com/non-opecs-november-oil-production-increase-offsets-opecs-cutback/
A new Open Thread Non-Petroleum has been posted
https://peakoilbarrel.com/open-thread-non-petroleum-march-11-2023/