A guest post by Ovi
Below are a number of Crude plus Condensate (C + C) production charts, usually shortened to “oil”, for Non-OPEC countries. The charts are created from data provided by the EIA’s International Energy Statistics and are updated to November 2022. This is the latest and most detailed world oil production information available. Information from other sources such as OPEC, the STEO and country specific sites such as Russia, Brazil, Norway and China is used to provide a short term outlook for future output and direction for a few of these countries and the world. The US report has an expanded view beyond production by adding rig and frac spread charts.
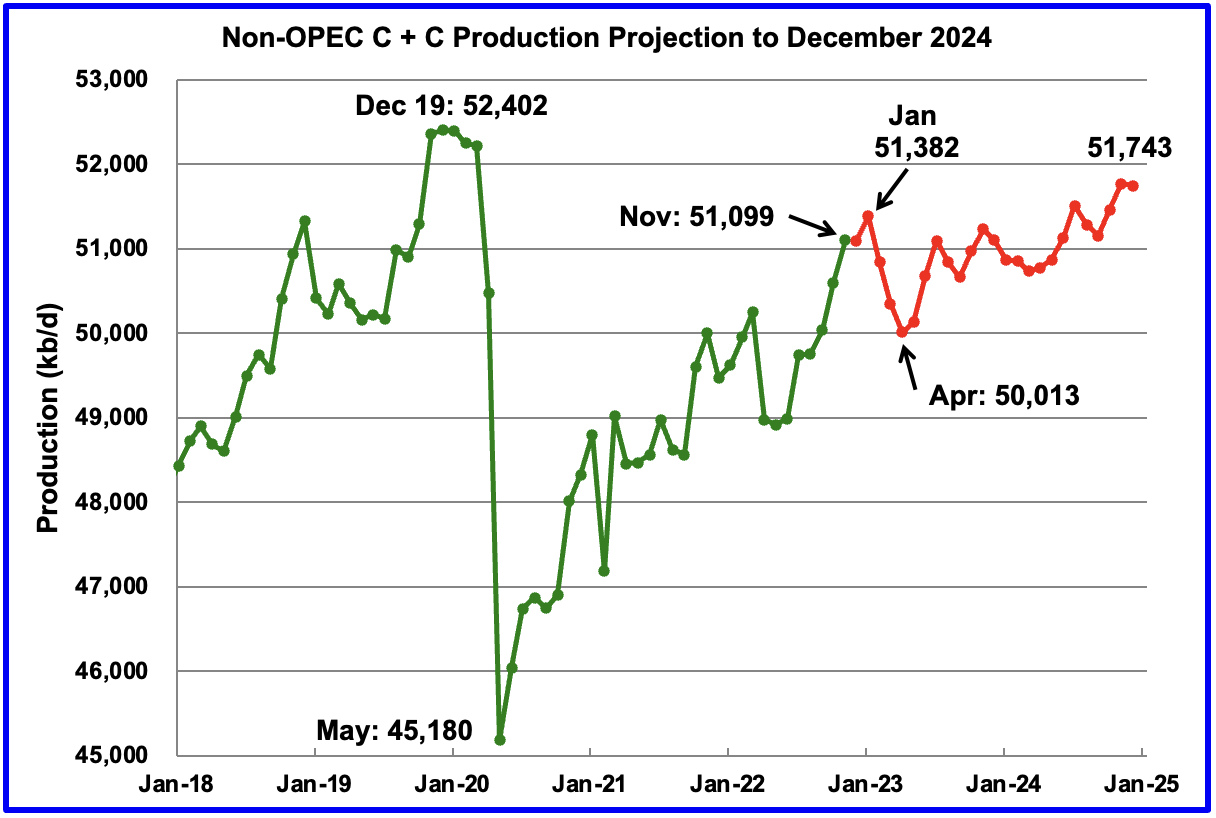
November Non-OPEC oil production increased by 502 kb/d to 51,099 kb/d. The majority of the increase came from Kazakhstan and Russia.
In the last report, the forecast for November production was 51,051 kb/d. It was low by 48 kb/d.
Using data from the March 2023 STEO, a projection for Non-OPEC oil output was made for the period December 2022 to December 2024. (Red graph). Output is expected to reach 51,743 kb/d in December 2024, which is 659 kb/d lower than the November 2019 peak of 52,402 kb/d.
Note that after the January 2023 post pandemic high of 51,382 kb/d, production drops to a low of 50,013 kb/d in April 2023, before resuming its climb. The drop is primarily due to a projected drop in Russian oil output.
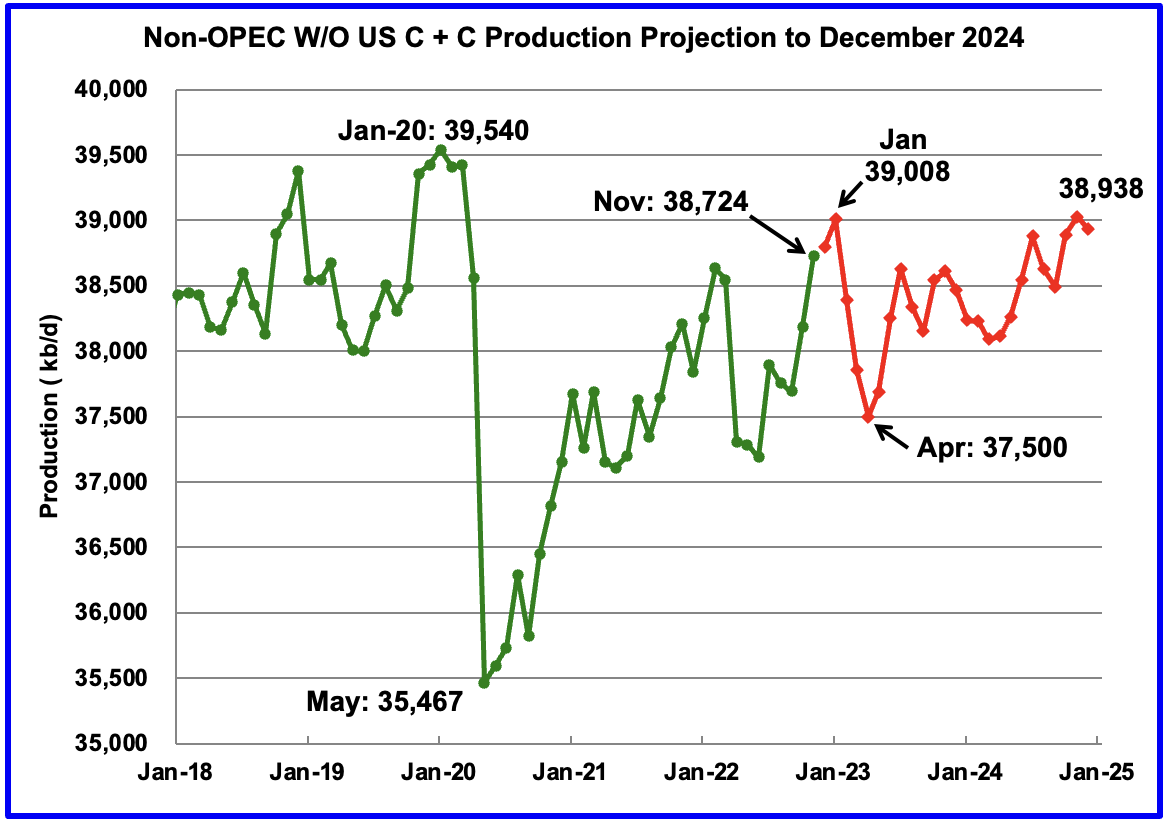
From January 2023 to December 2024, production in Non-OPEC countries W/O the US drops by 70 kb/d. This implies that most of the output increase seen from January 2023 to December 2024 in the previous chart is expected to come from the US.
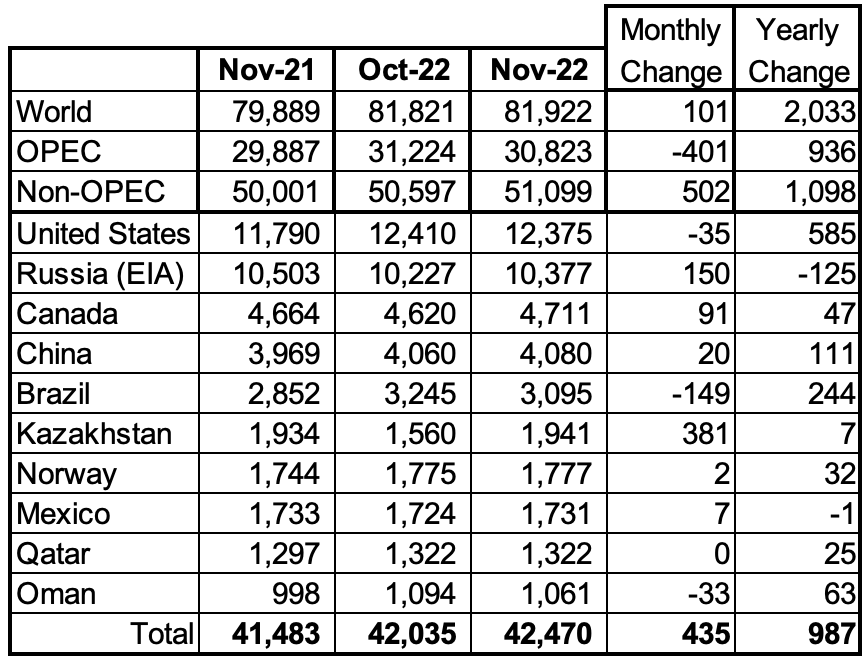
Listed above are the World’s 10 largest Non-OPEC producers. The criteria for inclusion in the table is that all of the countries produced more than 1,000 kb/d.
The overall November production increase for these ten Non-OPEC countries was 435 kb/d while as a whole the Non-OPEC countries increased output by 502 kb/d. Brazil had the largest production drop in November, followed by the US and Oman. On a YoY basis, Non-OPEC production increased by 1,098 kb/d.
In November 2022, these 10 countries produced 83.1% of the Non-OPEC oil.
OPEC C + C dropped by 401 kb/d in November but YoY increased by 936 kb/d. World MoM production increased by 101 kb/d while YoY output increased by 2,033 kb/d.
Non-OPEC Oil Production Charts
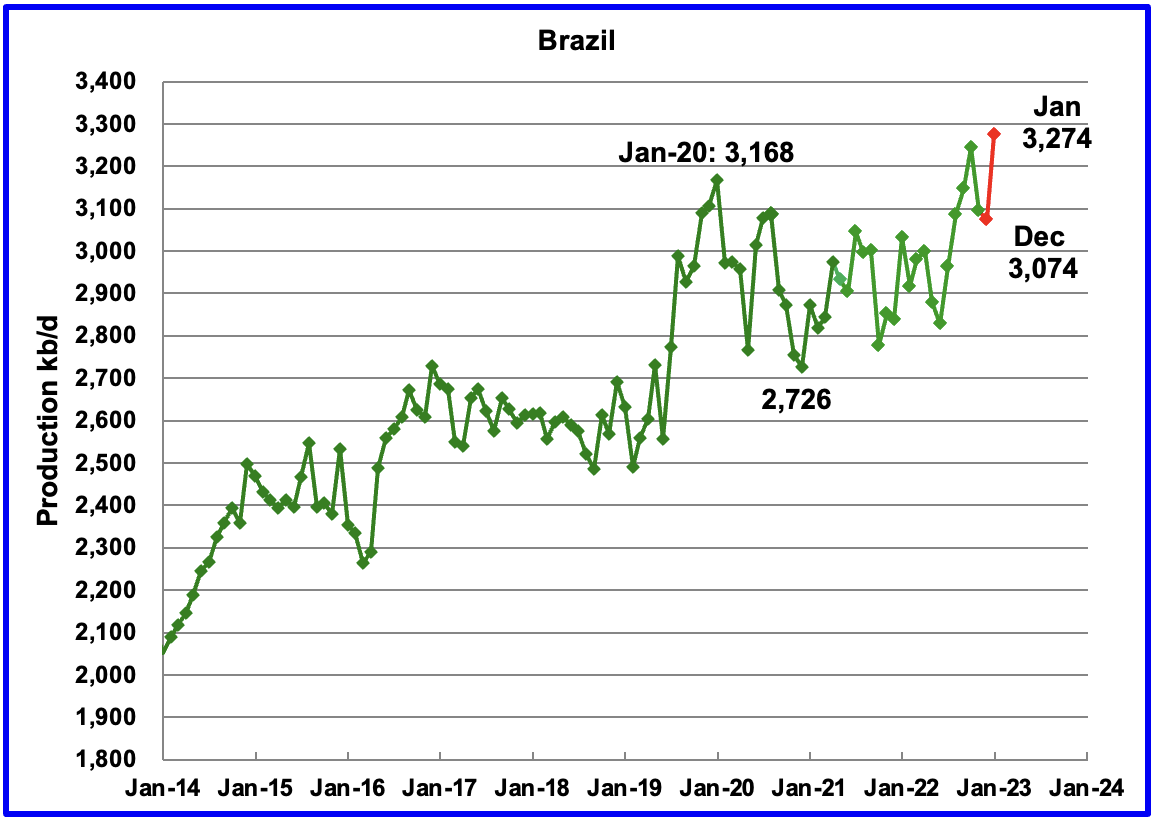
The EIA reported Brazil’s November production dropped by 149 kb/d to 3,095 kb/d.
Brazil’s National Petroleum Association (BNPA) reported that December’s output dropped by 21 kb/d to 3,074 kb/d before adding 200 kb/d in January to a new record high of 3,274 kb/d. Of the 3,274 kb/d, 2,445 kb/d came from the sub-salt layer. According to OPEC, the November and December output reductions were mainly due to some issues at the Tupi field installations.
Much of Brazil’s 2023 production growth will be from the highly productive pre-salt fields partially offset by maintenance interruptions.
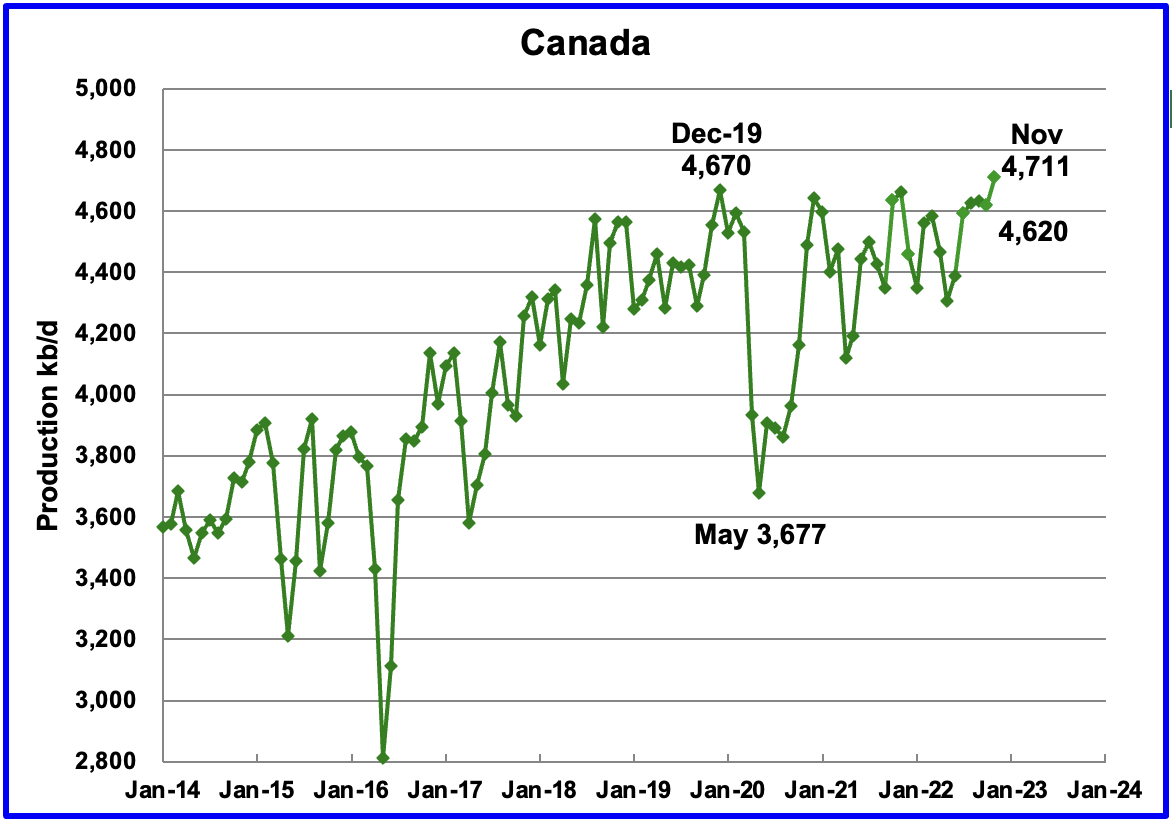
According to the EIA, Canada’s November output increased by 91 kb/d to a new record high 4,711 kb/d.
Rail shipments to the US in December increased by 4 kb/d to 126 kb/d.
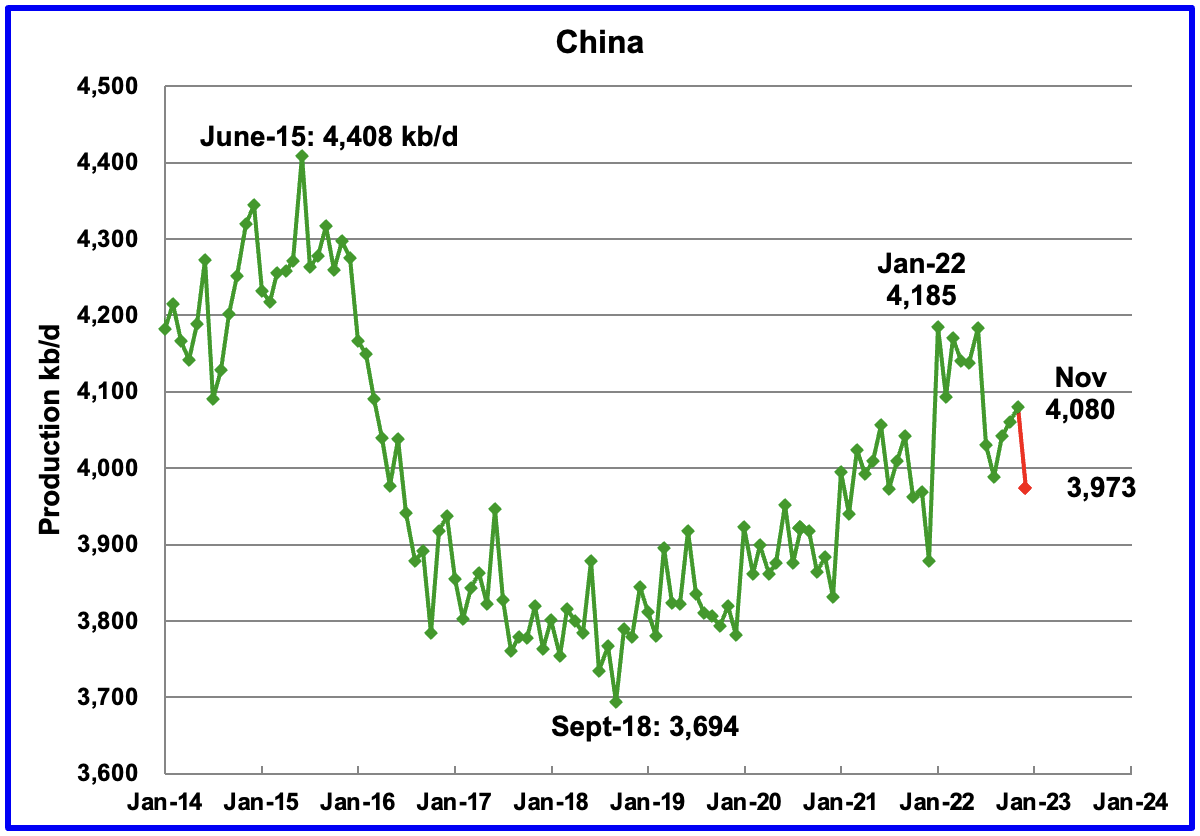
The EIA reported China’s output increased by 20 kb/d to 4,080 kb/d in November. The China National Bureau of Statistics reported that December production dropped by 107 kb/d to 3,973 kb/d, red marker.
Note that December’s output is down by 212 kb/d relative to the January 2022 high of 4,185 kb/d. China may be close to its current maximum production level of approximately 4,000 kb/d to 4,200 kb/d. To offset declines, the national oil company is investing in conventional wells, deep water wells and is also drilling for shale oil.
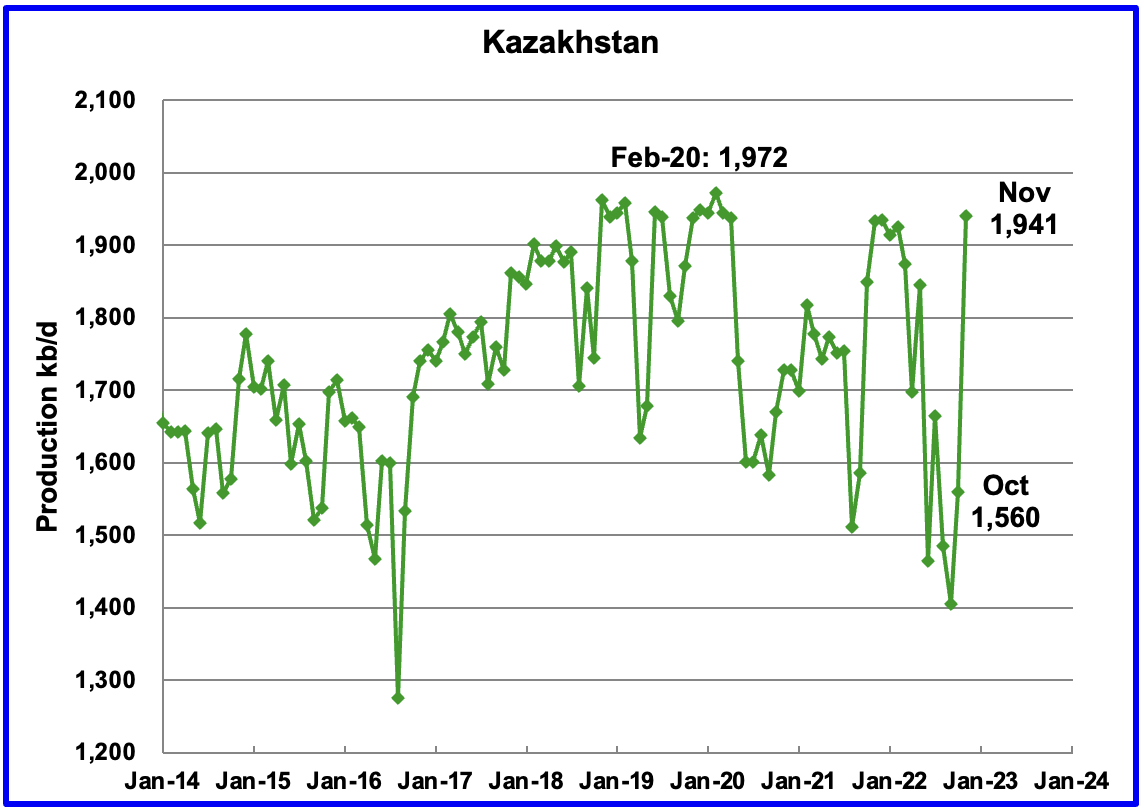
Kazakhstan’s output increased by 381 kb/d in November to 1,941 kb/d.
According to this source production was expected to recover in November. Production was restored in late October after the gas leak was repaired and reached 1,890 kb/d in early November, an increase of 485 kb/d over the September low of 1,405 kb/d.
Initial November production must have continued to increase since the final monthly average output was 31 kb/d below the monthly high of 1,972 kb/d and may have exceeded it by the end of the month.
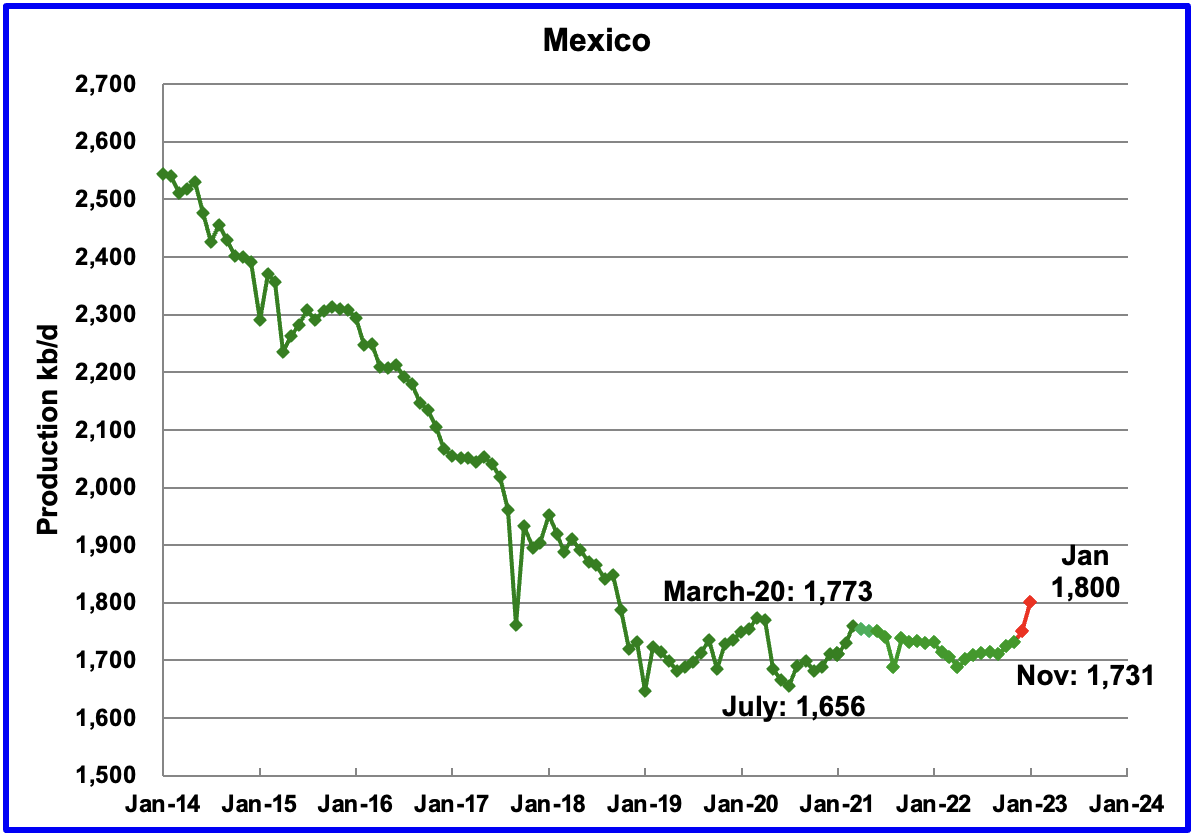
Mexico’s production as reported by the EIA for November was 1,731 kb/d an increase of 7 kb/d over October.
The December and January estimates, red markers, were obtained by using the Pemex increments over November production and adding those to the EIA’s November output because Pemex reports higher production than the EIA.
For December there was a significant change in the reported production of the Crude portion and the Condensate portion. Crude dropped by 130 kb/d and Condensate increased by 130 kb/d.
According to OPEC, the total crude production decline in Pemex’s mature fields in 2023 is projected to outweigh production ramp-ups, mainly from Mexico’s foreign-operated fields.
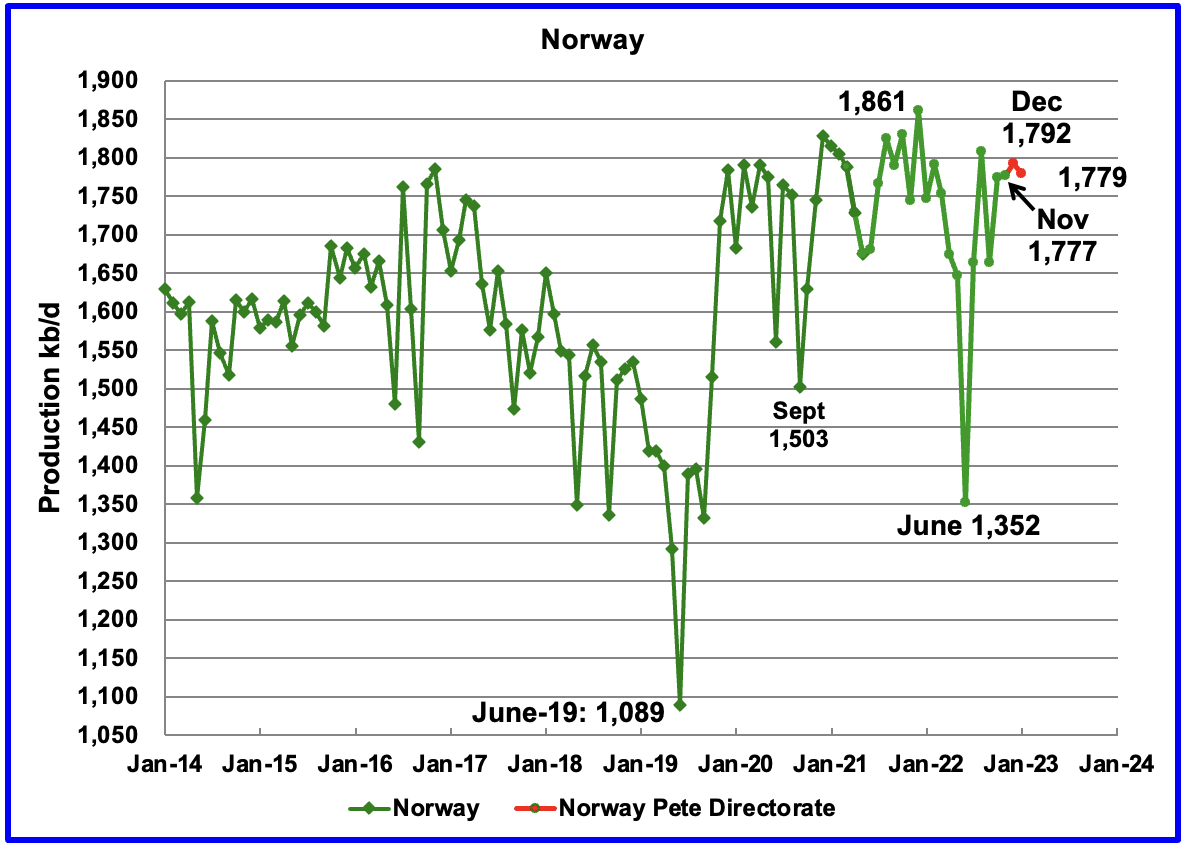
The EIA reported that Norway’s November production increased by 2 kb/d to 1,777 kb/d. This is 18 kb/d higher than reported by the Norway Petroleum Directorate (NPD) and is a new trend where the EIA reports slightly higher production than the NPD.
The Norway Petroleum Directorate reported that production in December increased by 15 kb/d to 1,792 kb/d and then dropped 13 kb/d to 1,779 kb/d in January. (Red markers).
According to the NPD: “Oil production in January was 3.0 percent lower than the NPD’s forecast. For December they wrote, “Oil production in December was 9.7 percent lower than the NPD’s forecast and 6.1 percent lower than the forecast so far this year.”
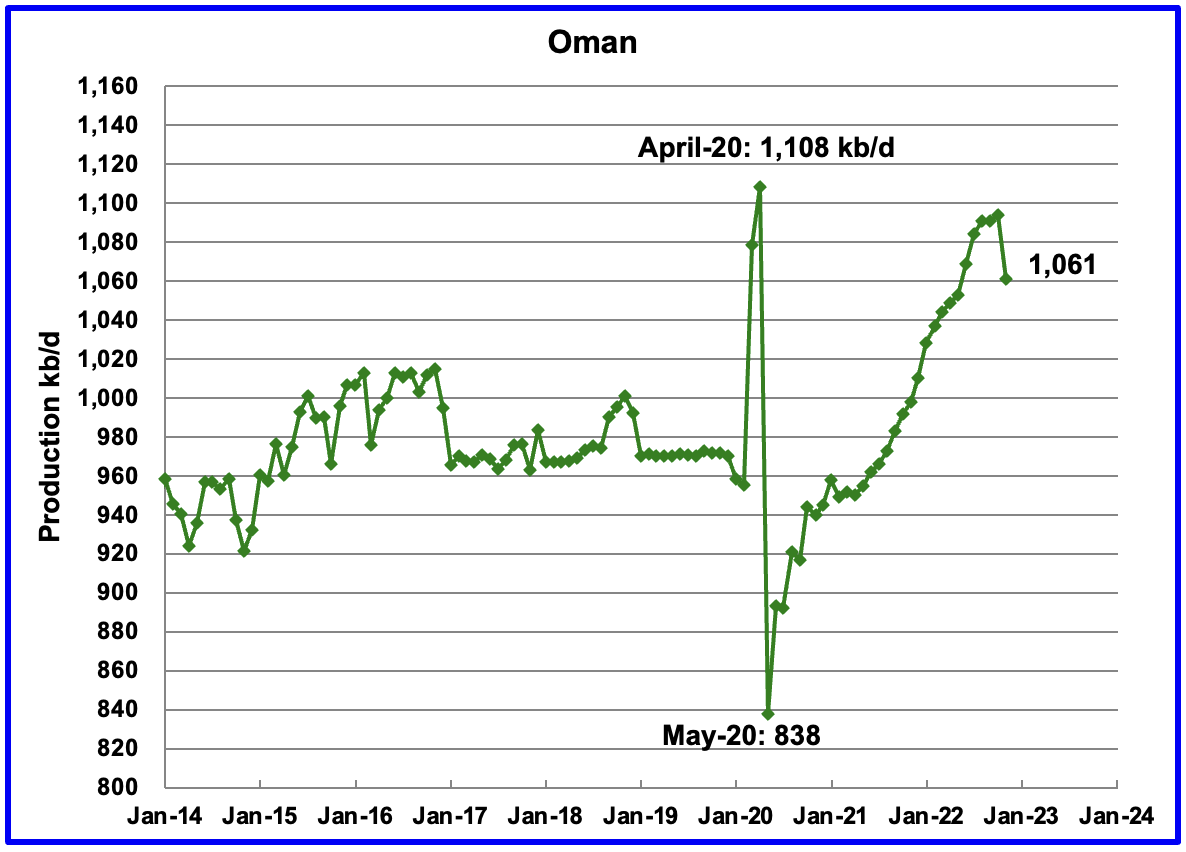
Oman’s production has risen very consistently since the low of May 2020. However Oman’s November production decreased by 33 kb/d to 1,061 kb/d.
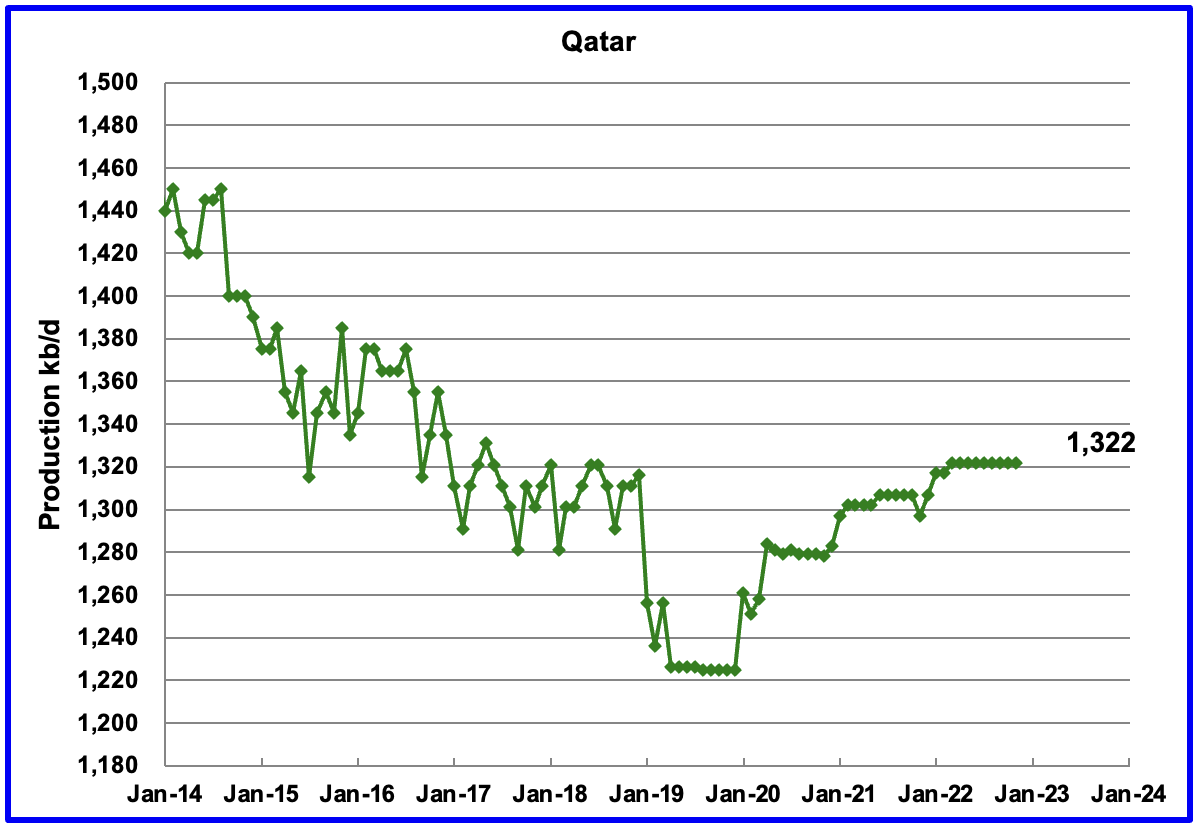
November’s output was unchanged at 1,322 kb/d.
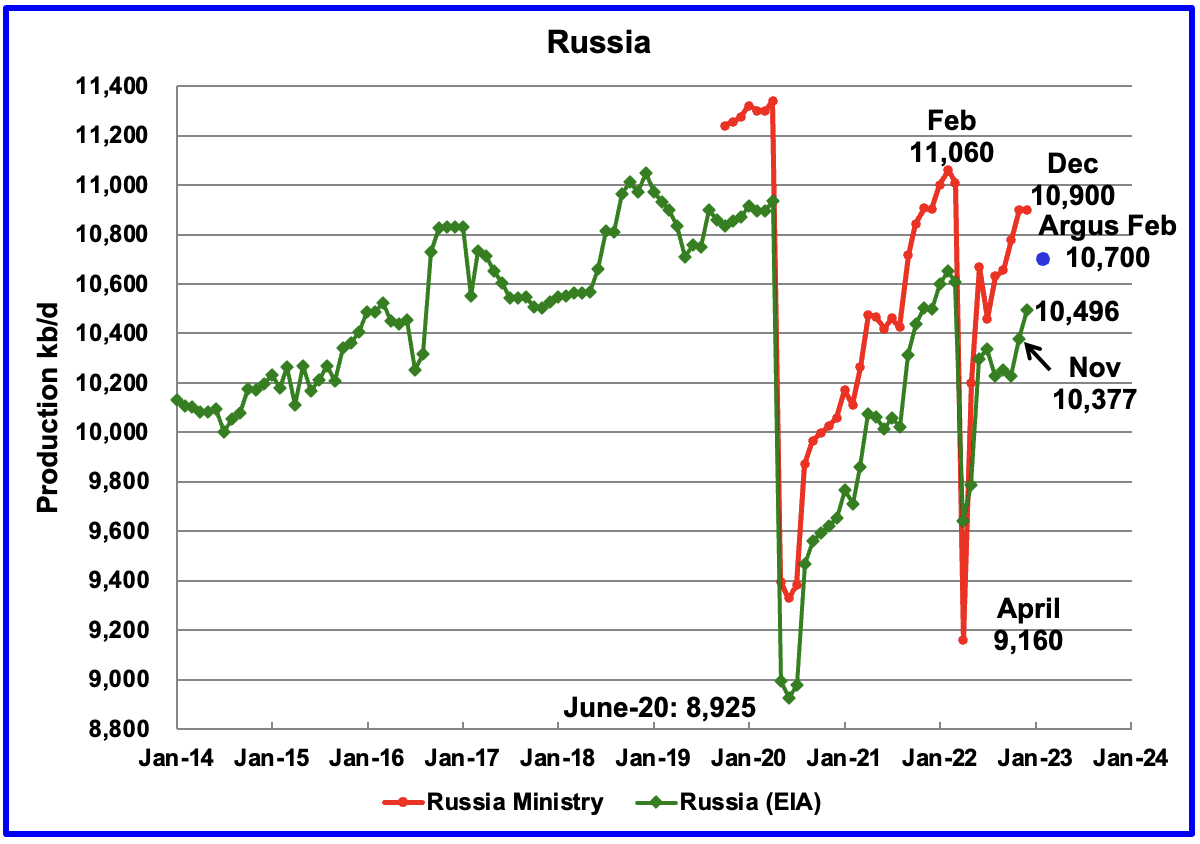
The EIA reported that Russian output increased by 150 kb/d in November to 10,377 kb/d.
Russia’s Ministry data for November production of 10,900 kb/d was taken from this source. In light of all of the sanctions, it is surprising to see such robust production.
December production is shown unchanged based on this statement: Russia will keep oil production in December at the November level amid the EU’s embargo and the price cap, Deputy Prime Minister Alexander Novak told reporters.
The EIA production number for December is derived from the Russia Ministry data by subtracting 404 kb/d. In the past, when production data was obtained directly from the Russian Energy Ministry, it was found that the EIA arbitrarily subtracted 404 kb/d from the Ministry data.
Argus Media is reporting that Russian crude production in February 2023 was 9,800 kb/d. If the typical Russian monthly condensate output of 900 kb/d is added to the crude production, Russian C + C in February would be close to 10,700 kb/d, blue marker. This report implies that February crude production continues at the same level as January, 9,800 kb/d to 9,900 kb/d, and is consistent with the Argus Media report.
“MOSCOW, March 6. /TASS/. Oil and gas condensate production in Russia amounted to 11.05 million barrels per day (bpd) in February 2023, having recovered to the level of February 2022, when sanctions were not yet imposed on the Russian oil industry, according to the analytical report of the Energy Development Center.
“At the end of February, oil production in Russia reached February 2022 levels of 11.05 million barrels per day, fully offsetting the decline due to the sanctions and restrictions imposed since then,” the report says.”
Note that the chart shows February 2022 production being, 11,060 kb/d. Removing the typical monthly extra 400 kb/d of condensate reported by Russia, that puts Russian C + C production at 10,650 kb/d in February, very close to the Argus Media estimate of 10,700 kb/d.
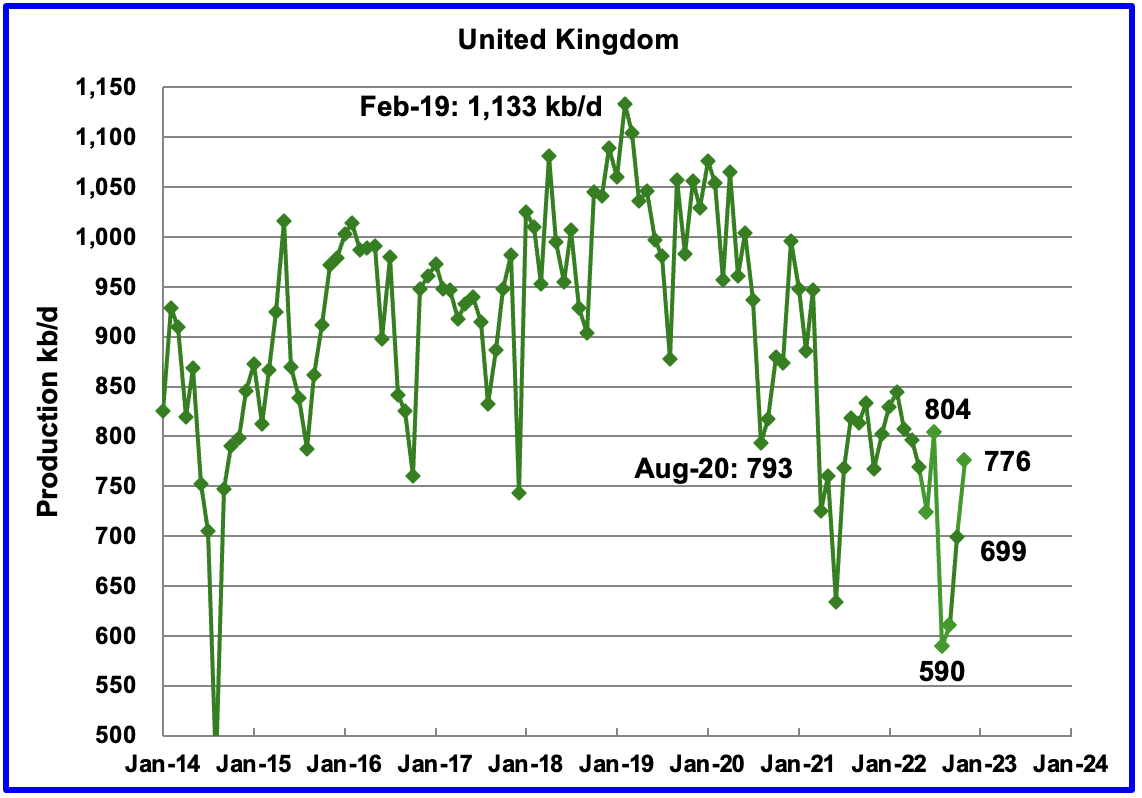
The EIA reported UK’s production increased by 77 kb/d in November to 776 kb/d.
According to this source, North Sea Transition Authority (NSTA), November’s production was 756 kb/d and dropped 14 kb/d in December to 742 kb/d.
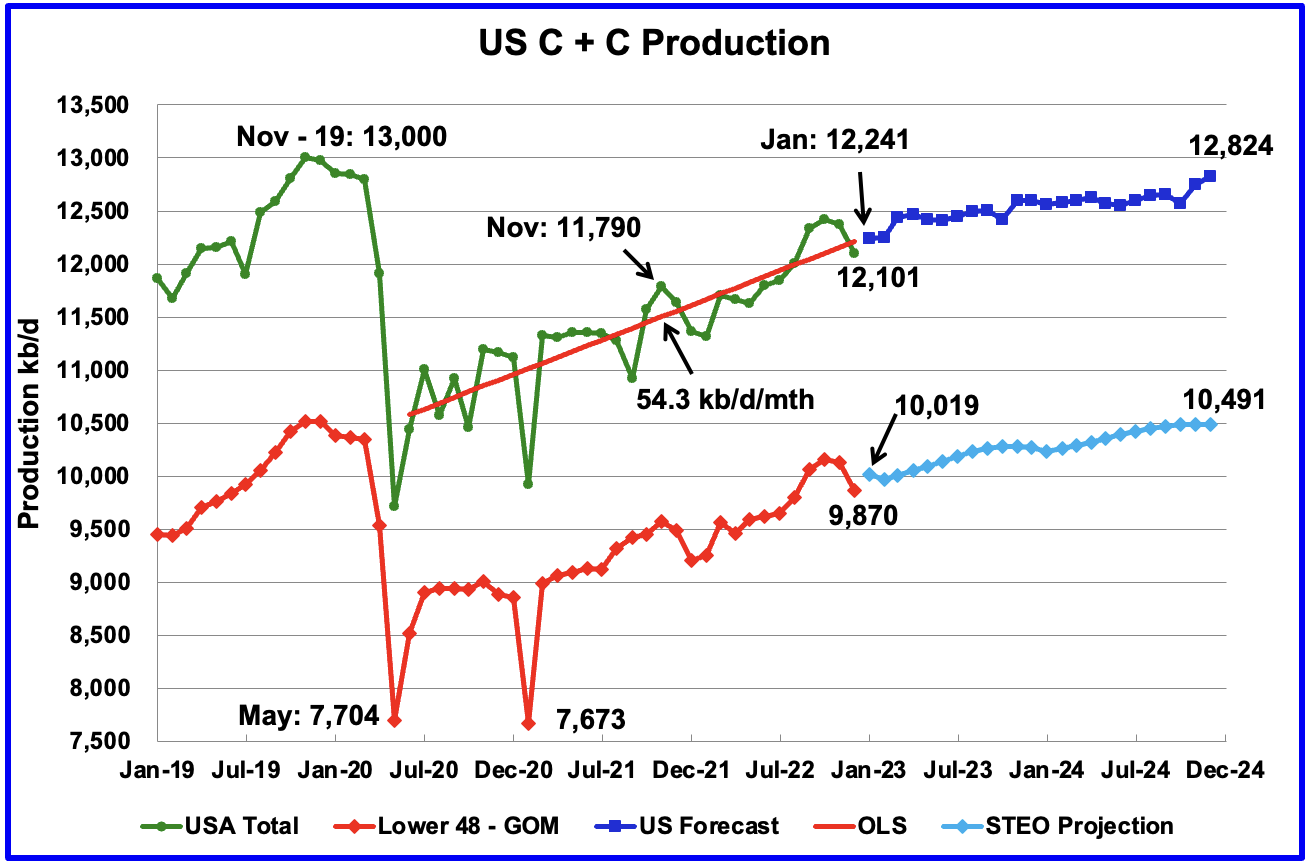
U.S. December production decreased by 276 kb/d to 12,101 kb/d. The December production decline was caused by bad weather in many states.
The dark blue graph, taken from the March 2023 STEO, is the production forecast for the U.S. from January 2023 to December 2024. Output for December 2024 is expected to be 12,824 kb/d which is lower than the November 2019 peak of 13,000 kb/d. From January 2023 to December 2024, production only increases by 583 kb/d.
While overall US oil production decreased by 276 kb/d, the Onshore L48 had a smaller but similar sized drop of 264 kb/d to 9,870 kb/d in December. The light blue line is the STEO projection for output to December 2024 in the Onshore L48. From January 2023, to December 2024, output is expected to increase by 472 kb/d.
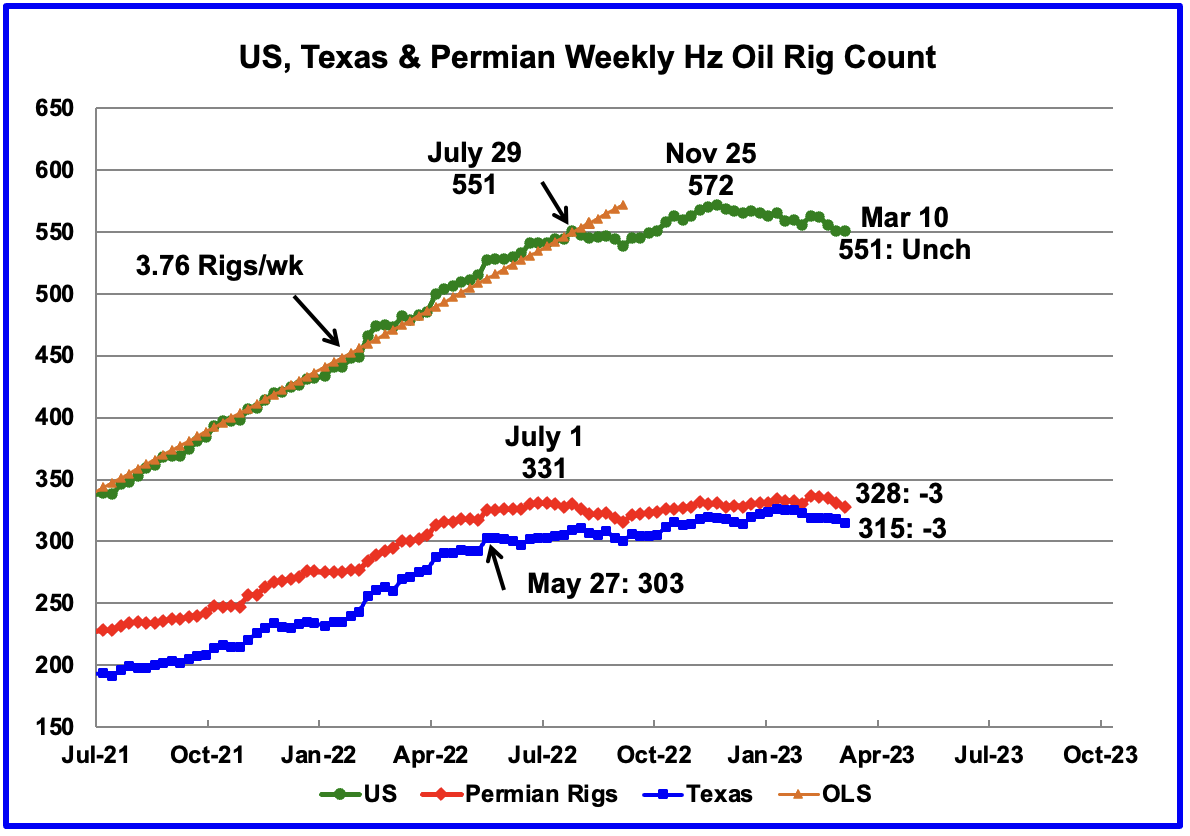
Since the beginning of April 2021 through to the week ending July 29, 2022, the US added horizontal oil rigs at a rate of close to 3.76 rigs/wk, orange OLS line, and peaked at 551 rigs in the week ending July 29. However since then the number of operational rigs has wondered primarily sideways. A high of 572 rigs was reached on November 25, 2022. In the week ending March 19, 2023 the number of rigs was unchanged at 551 and also unchanged from July 29, 2022.
In the week ending March 10, Permian rigs dropped by 3 to 328 and Texas rigs dropped by 3 to 315. Note that this week’s number of Permian rigs are slightly lower than the number on July 1, 2022, 331 rigs.
Relative to the beginning of the year, the biggest increase in the Hz oil rig count has occurred in the Cana Woodford basin in Oklahoma. In January there were 25 operational rigs. They increased by 6 to 31 in March.
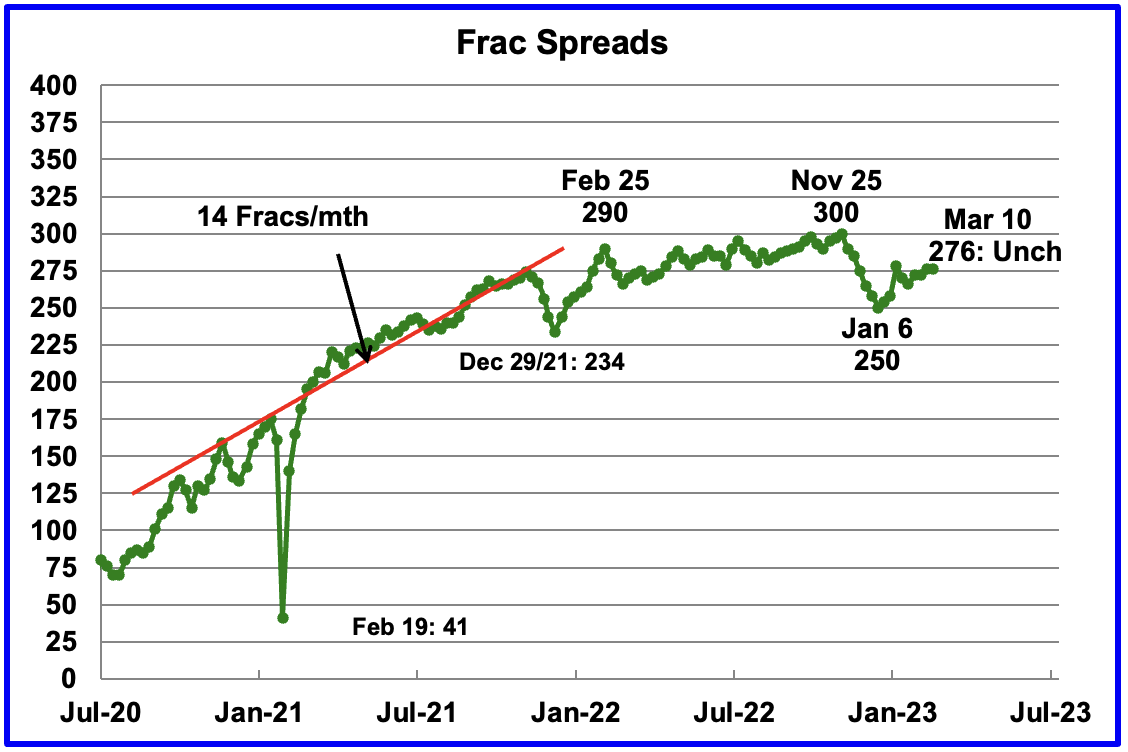
For frac spreads, the general trend since late February 2022 can best be described as essentially flat around the 290 level but with a hint of a slow increase toward 300 frac spreads. At the beginning of the 2022 Thanksgiving and Christmas holidays, the frac count began to drop. The frac count bottomed in the week ending January 6 at 250 and then began to recover. A similar trend occurred last year.
For the week ending March 10, the Frac count was unchanged at 276. It seems increasingly clear that the increase of 20 for the week ending January 27 must have been a counting error.
Note that these 276 frac spreads include both gas and oil spreads.
In looking at the relatively steady Rig and Frac Spread count over the past six months, it appears that an equilibrium has been reached between the number of Rigs and Fracs Spreads. Is this a management decision based on the price for WTI and drilling costs or geology or both?
An article in the WSJ suggests it may be geology.
“HOUSTON—The boom in oil production that over the last decade made the U.S. the world’s largest producer is waning, suggesting the era of shale growth is nearing its peak.
Frackers are hitting fewer big gushers in the Permian Basin, America’s busiest oil patch, the latest sign they have drained their catalog of good wells. Shale companies’ biggest and best wells are producing less oil, according to data reviewed by The Wall Street Journal.”
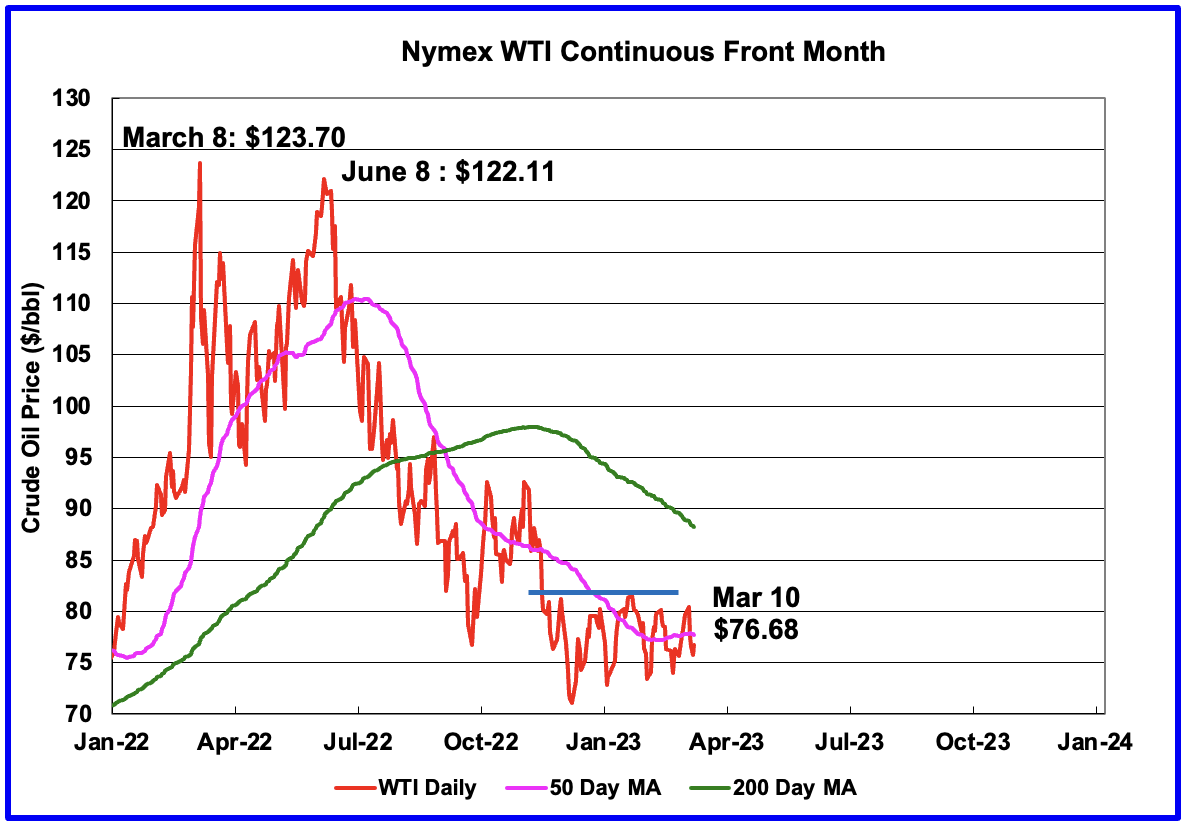
WTI settled at $76.68/b on March 10, 2023.
Since early December, WTI has been trading in a range of $71/b to $81/b. The lower limit of $70/b appears to be related to the US government’s willingness to buy oil at $70/b to refill the SPR. On the high side, heavy selling hits WTI when it crosses $80/b.
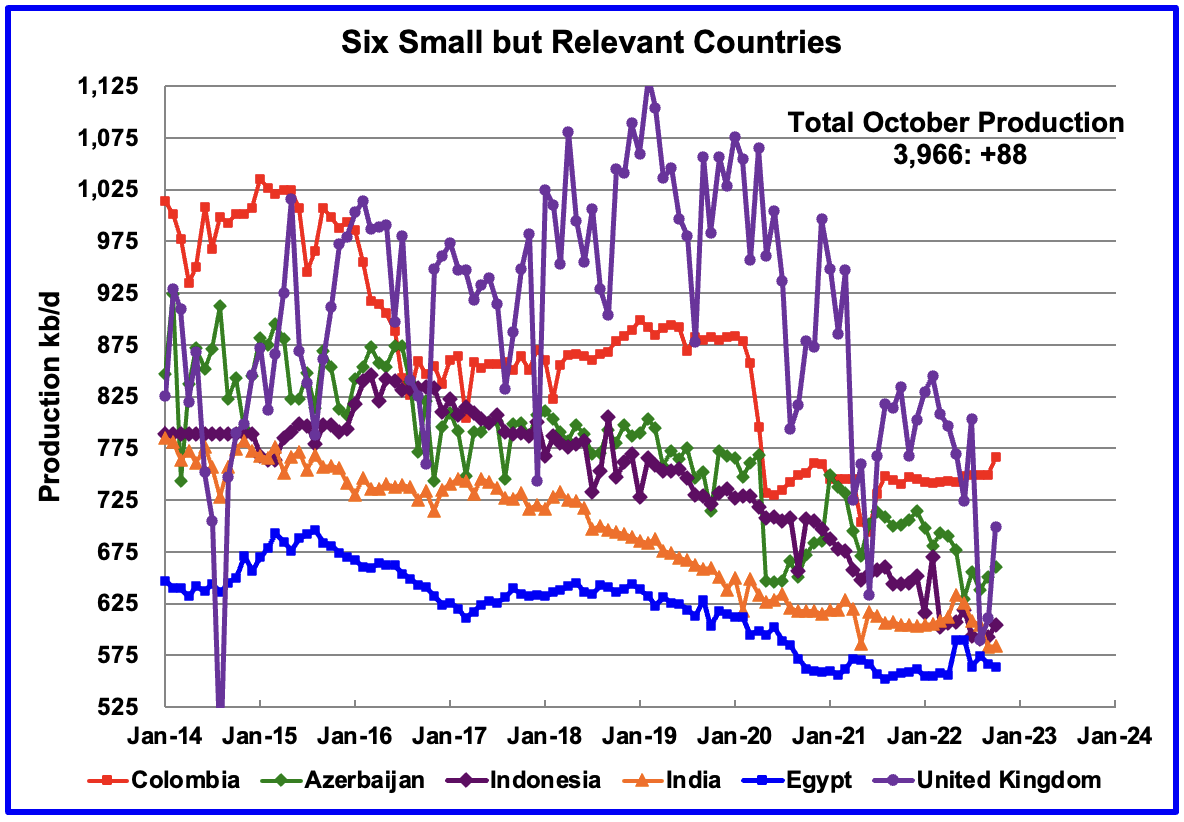
These six countries complete the list of Non-OPEC countries with annual production between 500 kb/d and 1,000 kb/d. Note that the UK has been added to this list since its production has been below 1,000 kb/d since 2020.
Their combined November production was 3,966 kb/d, up 88 kb/d from October 3,878 kb/d. The UK contributed 77 kb/d of the 88kb/d increase.
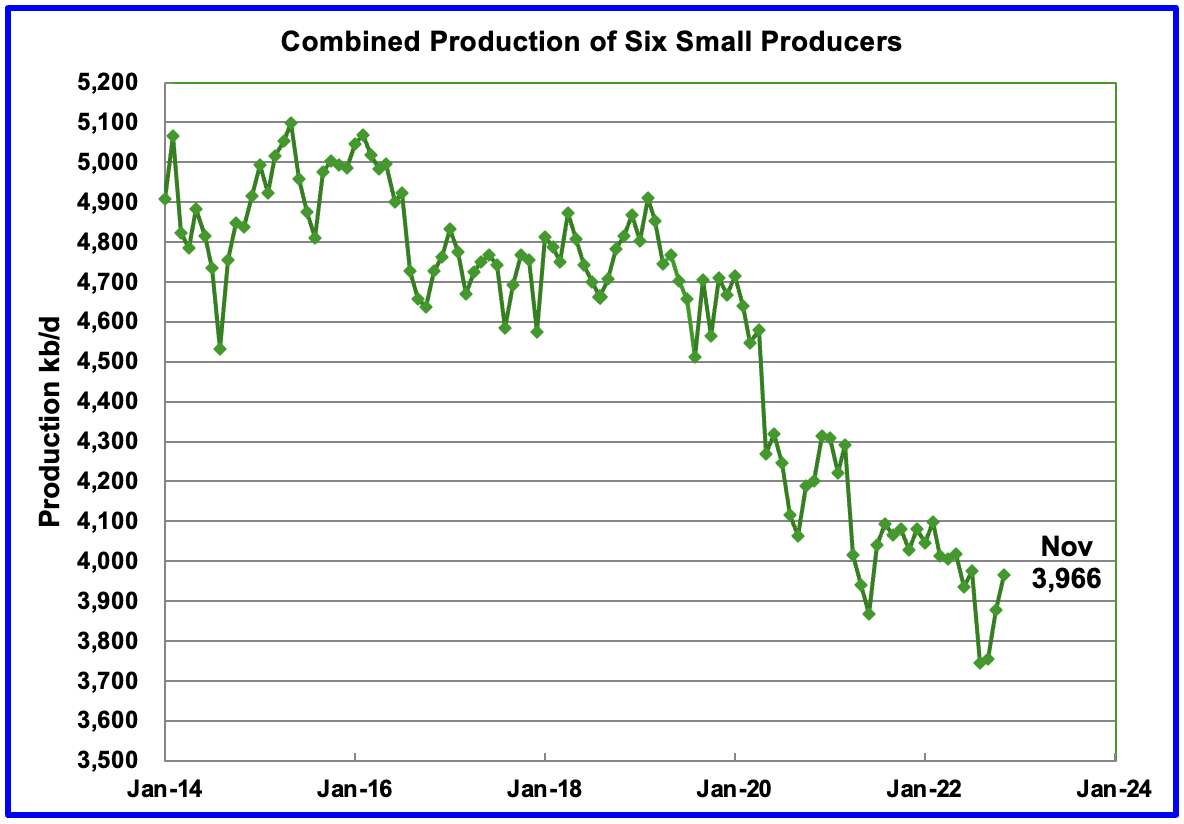
The overall output from the above six countries has been in a slow steady decline since 2014 and appears to have accelerated after 2019. However over the last three months, production has risen primarily due to production increases in the UK.
World Oil Production Ranked by Country
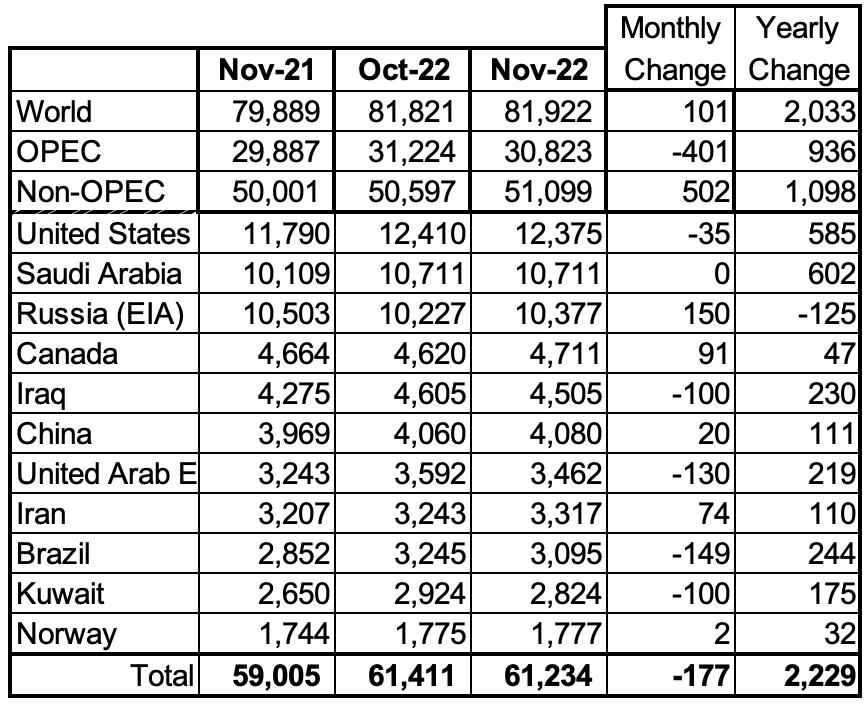
Above are listed the World’s 11th largest oil producers. In November 2022, these 11 countries produced 74.7% of the world’s oil. On a MoM basis, production fell by 177 kb/d while on a YoY basis, production increased by 2,229 kb/d.
World production increased by 101 kb/d in November. The largest increase came from Russia, 150 kb/d. Four countries had production drops of 100 kb/d or more.
World Oil Production Projection
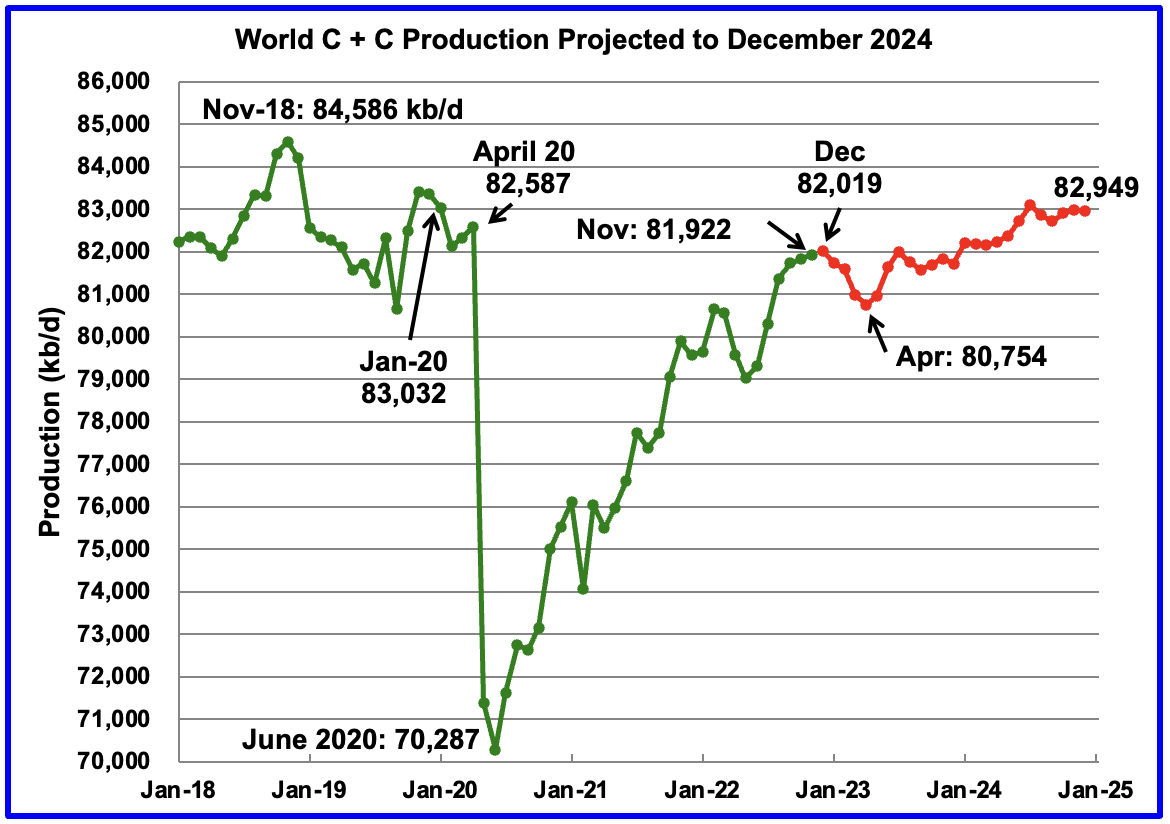
World oil production in November increased by 101 kb/d to 81,922 kb/d according to the EIA (Green graph). December is expected to add 97 kb/d to 82,019 kb/d.
This chart also projects World C + C production out to December 2024. It uses the March 2023 STEO report along with the International Energy Statistics to make the projection. (Red markers).
It projects that World crude production in December 2024 will be 82,949 kb/d, 5 kb/d lower than reported in the previous post. Note that this post pandemic high of 82,949 kb/d is 1,637 kb/d lower than November 2018 peak of 84,586 kb/d.
The drop from December 2022 to April 2023 is primarily due to a projected drop in Russian oil output.
The production increase from December 2022 to December 2024 is 930 kb/d. Of the 930 kb/d, 421 kb/d comes from the World countries W/O U.S. production. See next chart.
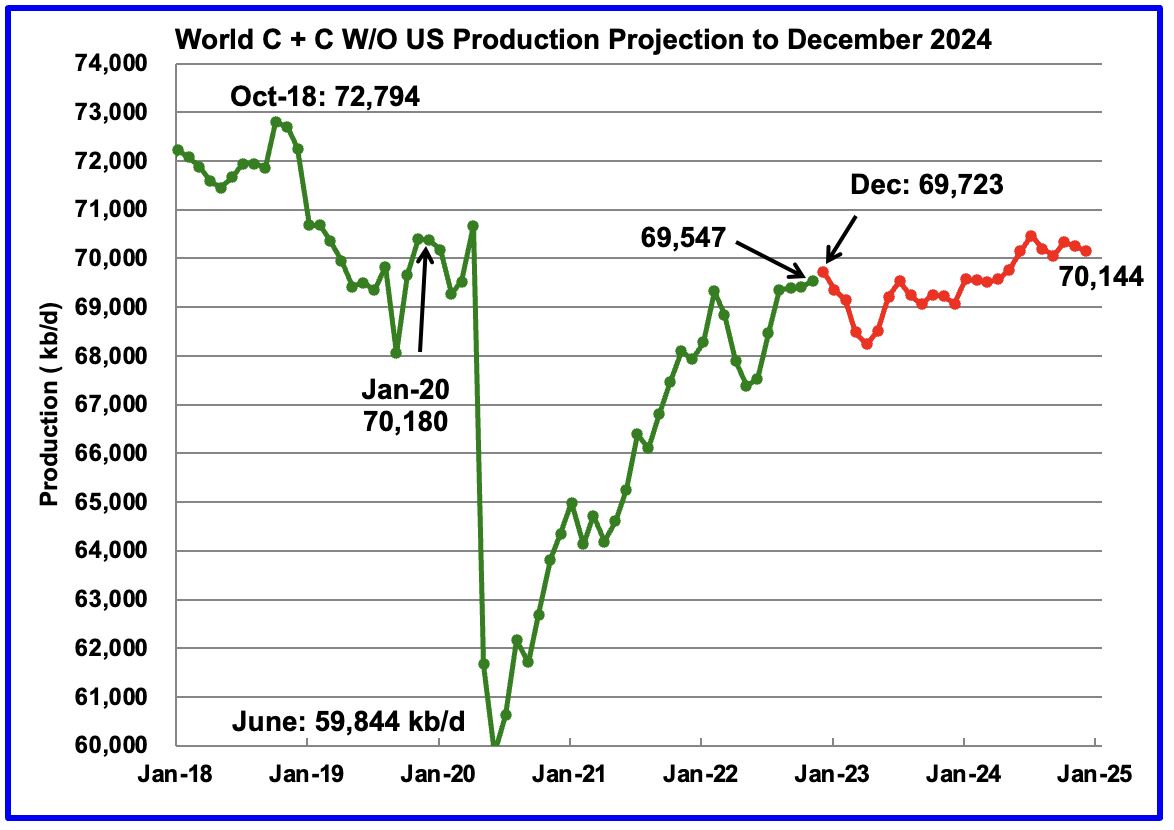
World without the US oil output increased by 135 kb/d to 69,547 kb/d in November.
World oil production W/O the U.S. from December 2022 to December 2024 increases by a total of 421 kb/d, or at an average rate of 210.5 kb/d/yr.
223 responses to “Non-OPEC’s November Oil Production Increase Offsets OPEC’s Cutback”
Zero Hedge is Reporting Big Product and Cushing Draws
Crude 1.16mm ( 100k exp)
Cushing -950k
Gasoline -4.59mm (-1.2mm exp)
Distillates -2.89mm (-600k exp)
Above there was a discussion regarding what was affecting US production, WTI, Geology, politics and management decisions on how to allocate free cash flow .
Below is a chart that indicates that a change has occurred in the relationship between the price of WTI and the number rigs being used to drill wells, at this point in time.
After the price of WTI rose quite quickly after February 2020, the rise in the number of rigs did not parallel previous rises. The difference could be due to newer rigs being more efficient. Regardless of the reason, it is difficult to see the rig count and associated Frac spreads returning to pre pandemic levels.
By the looks of that world oil production projection chart, it seems we won’t know for a long time whether oil “has” peaked or not.
Will it matter?
Only if you have confidence that the EIA’s projection is correct. I don’t. Their near-term projection may be pretty close but I believe their late 2023 projection and their 2024 projection is way off.
Ron,
I agree, it is far too low, especially if the predictions of $100/bo for Brent crude, that are forecast by several sources are correct.
Some believe in Santa Claus. Some believed in peak oil in 2015. Were sure of it.
How about we stick to models and science and geology and lest we forget, the EIA is the only organization that contemporary to the hysteria of peak oil generated during the first 4 peak oils occurred or claimed of this century (I’ll leave Ron’s 2015 claim out of that total for now), the EIA is the only one not yet discredited. Their number was something like 2037 if memory serves.
Reservegrowthrulz,
Your memory is incorrect, see table GO2 from link below
https://www.eia.gov/outlooks/ieo/tables_side_xls.php
Chart below is World C plus C from that spreadsheet, peak is 2050 at 99.3 million barrels per day for period from 2020 to 2050, though for the EIA it might be any time after that.
Chart below compares a shock model scenario with the EIA’s 2021 International Energy Outlook (IEO), reference case, neither will be correct, but I expect my guess will be closer to reality than theirs particularly from 2030 to 2050. Much will depend on future World GDP, oil prices and the speed of the transition to electric transport.
I’ve got the memory of an elephant. 8th page in the pdf. And this work was contemporaneous to the early calls of this century, not what The Principle Of Maximum Entropy is currently changing its next answer to in real time. Again. The people that wrote this report? Two petroleum engineers and a geologist. Where were you in the early peak oil days Dennis, to have missed this one? As I said…they haven’t been discredited yet.
http://websites.umich.edu/~twod/oil-ns/articles/longterm_usgs_oil_peak_estim_eia2006.pdf
Thanks for the reminder and the link. The EIA scenarios of 2000 are what I call geometric scenarios, a curve fitting exercise for various URRs.
The actual conventional crude oil peak in 2005 (see logo on my website crudeoilpeak.info) caused the US recession in 2007, the oil price shock in 2008 and the financial crisis in 2009. In response the US Federal Reserve started with monetary easing QE1-QE3 which allowed the unconventional shale oil boom at $100/barrel plus. It made money printing acceptable all over the world which created a gigantic asset bubble. Inflation was kept in check by cheap consumer goods from China. But that period is coming to an end, triggered by Covid.
We also have peak oil in dictator ships, with geopolitical consequences. Sudan, Libya, Egypt, Yemen, Syria. The 1975 peak in Iran under the Shah helped a regime come to power which will soon be able to produce nuclear weapons. And we also have peak oil in Russia and China.
Peak oil in all its shapes and sizes is a terrible reality which governments and the mainstream media don’t want to see.
Reservegrowthrulz,
No I missed that presentation from 2000, I didn’t start following this until 2004 or so.
Does their scenario with a peak in 2037 seem reasonable to you? They call for 146 Mb/d for World output for the 2% annual growth scenario in 2037 or 113 Mb/d for the 1% growth scenario for 2050. It is already clear that the 2% growth scenario was incorrect as we would have 104 Mb/d in 2022 for average World output of C plus C if that scenario had been correct. Perhaps the 1% growth scenario will prove closer, but I doubt we will see the 88 Mb/d World output that scenario calls for in 2028 and even less likely the 94 Mb/d predicted for 2035 and almost certainly not the 110 Mb/d in 2050.
I would say the 3000 Gb URR 2% growth and 3% growth scenarios have been proven incorrect, before long (by 2025, output of 85.4 Mb/d predicted for World C plus C) we will see that the 1% growth scenario is also wrong.
That presentation seems pretty simplistic to me (rather than comprehensive), the steep declines suggest a big problem beyond the peak for those scenarios.
Currently the reference case for the most recent IEO from the EIA (2021) has average annual growth in World C plus C output at about 0.7% per year from 2025 to 2050, the IEA scenarios from the recent World Outlook seem more reasonable.
To Matt:
“Thanks for the reminder and the link. The EIA scenarios of 2000 are what I call geometric scenarios, a curve fitting exercise for various URRs.”
I agree. And what do you think fitting random bell shaped curves to various URRs might be? You do notice that Dennis usually slaps URR estimates on all his scenarios, as it does appear to be his independent variable that then flows through to the results? It is unfortunate that this one thing still hasn’t been overcome by those doing at least the semblance of an effort to get at the answer.
To Dennis:
“That presentation seems pretty simplistic to me (rather than comprehensive), the steep declines suggest a big problem beyond the peak for those scenarios.”
It was simplistic. But is the only peak oil claim during the modern era though the infamous 2008 TOD claim still standing.
And if you think those steep declines suggest something, you should have seen the graph Colin published in 1989 proclaiming global peak oil in 1990 or so. It had the same characteristics. Come to think of it, similar enough that it makes me wonder if the EIA gang didn’t imitate the method. Anyway, just another classic that McPeaksters would rather forget, right up there with Hubbert declaring US peak oil….by 1950. Even more entertainingly…MULTIPLE possible peaks by 1950.
…and….
“No I missed that presentation from 2000, I didn’t start following this until 2004 or so.”
So what amount of research have you done on the topic prior to just the date you learned about it? Jimmy Carter when he was pitching the end of oil? Secretary of Interior in 1943? David White in 1919? JP Lesley in 1886? Colin Campbell in 1990 is just the beginning of the modern era, which I assign more signficance to than I do all the previous folks.
Reservegrowthrulz,
The EIA scenario is for conventional oil, which peaked in 2016. I exclude extra heavy oil from Canadian oil sands and Orinoco belt output from conventional oil output. The scenario below has conventional oil growing by 1% per year from 2000 to 2050 and then declining by 10% per year from 2050 to 2100. My recent shock model for conventional oil is shown for comparison. The shock model has cumulative output of 2575 Gb from 1870 to 2100 and the EIA scenario has cumulative output of 2818 Gb from 1870 to 2100.
Reservegrowthrulz,
Were you thinking of the IEA rather than the EIA?
See
https://www.iea.org/reports/world-energy-outlook-2022/outlook-for-liquid-fuels
They have 3 scenarios, with NZE scenario having a peak in 2019, APS with a peak in 2024 and a STEPS scenario that peaks in 2035 to 2037, note that these are total liquids projections. It is more difficult to interpret the scenario’s crude oil output assumptions. as they seem to group condensate and pentanes plus with NGL so we would have to guess the proportion of condensate in the NGL definition they use to get an estimate of C plus C in their scenarios.
Reference provided up thread. But thanks for not just calling me a liar initially, it is usually the standard response when McPeaksters are confronted with someone armed with more comprehensive information on this topic.
This thread reads like a terminally ill cancer patient calling out doctors saying they’d be dead five years ago instead of shitting blood in the near future as some kind of win.
You change nothing. Number went up… slower. Energy density went down and population size went up. What a win for our dumb civilisation.
Matt , ” We also have peak oil in dictator ships, with geopolitical consequences. Sudan, Libya, Egypt, Yemen, Syria. The 1975 peak in Iran under the Shah helped a regime come to power which will soon be able to produce nuclear weapons. And we also have peak oil in Russia and China.
Peak oil in all its shapes and sizes is a terrible reality which governments and the mainstream media don’t want to see. ”
Rockman had an acronym for this POD (Peak Oil Dynamics) . It is in play .
Is the question whether knowing we have peaked or not make any difference to individuals or institutions behaviours? If it could be shown for certain that future supply would be forever reducing I think it might, but that will never happen. No matter what kind of dip is seen there will always be those, especially those with some kind of invested interest, that will find a way to argue that it is only temporary. The COVID lockdowns just added confusion in this respect. To some extent we are currently living off the wedge of supply not produced in 2020 and 2021. If that oil was not now available there might be a clearer indication of decline in supply (we might also have had a different peak from November 2018, I don’t think so, and even if we had it would have been a relatively small bump in an undulating plateau).
EIA predictions depend somehow on predicting a price. Sometime ago Vaclav Smil showed the futility of such predictions. He plotted one years average price against the previous year’s – since around the mid 90s, when OPEC started losing its hold on price, the graph looks like a drunk lurching around looking for lost keys.
It’s fine, because we’ll peak in 2030 with this valuable resource instead of 2018. And we spent all that foresight time in totally changing our ways.
No, wait a minute…
Love the “EV adoption is growing” responses to prove me wrong, always a treat.
Ovi,
Great job!
The low forecast for World minus US is in part a reflection of a very conservative oil price forecast by the EIA.
If oil prices remain as low as the EIA STEO forecast, we might see very little growth in World oil output, primarily due to a lack of demand for oil.
IMHO the EIA’s oil price forecast is too low and as a result their forecast for future short term oil production is also too low.
Dennis/Ron
I don’t think that oil price is as big an influence as in the past. US production over the next two years Dec 2022 to 2024 is only set to rise by 500 kb/d. Geology and management decisions on what to do with their revenues is the major factor. The latest Rigs and Frac charts are a big clue to the change of thinking.
Canada will add about 0.35 kb/d over the next two years. Other small increases come from Brazil and Guyana. The big unknown drop is from Russia. To this add natural decline. I think that OPEC plus has 1,000 kb/d in reserve to bring back on line when oil hits $ 90/b to $100/b.
My bottom line is that I think that the projection out to 2024 is reasonable.
Ovi,
I agree the forecast is reasonable for the assumptions of the EIA model. Perhaps the price of oil does not matter, when I listen to oil producers, I hear that oil price matters a great deal. Note that it takes time for output to react to the price of oil and in a volatile market, it probably takes even longer because the oil producers don’t believe that high prices will continue for long so they don’t respond to high oil prices until they stick for perhaps 12 months or more, they don’t want to get burned by drilling wells at high prices only to see them disappear after a couple of months. Will we see high oil prices stick in the future? When strategic petroleum reserves have been drained to close to their lower limit and demand for oil is strong, we will see. Under those circumstances we might see $90/bo or higher for prolonged period and oil supply will likely increase faster than predicted by the EIA in their relatively low oil price scenario as assumed in the STEO.
TotalEnergies hasn’t reported yet, ExxonMobil and Shell got out of Russia fairly unscathed, but BP reserves got absolutely clobbered. Despite this BP asset value actually went up slightly, even though equity dropped 8%. BP production didn’t fall proportionally as much as reserves so liquids R/P dropped from 14 to 9 and gas from 13 to 7.
I think BP sold up all its oil sands holdings (comprising the Sunrise operations and some undeveloped leases) but, uniquely, it always reports bitumen as crude oil so it’s difficult to be certain.
George, Dennis, and Ovi, it all depends on what is driving production. Is it geology, politics, or is it price? I believe it is all three. I think it is obvious that in the USA price is a very strong factor though with every passing year, geology becomes a stronger and stronger factor. However in most of the rest of the world, geologi is the strongest factor.
That is not to discount the very strong factor politics has in Venezuela, Iran and Russia and in a few other places to a lesser extent. But politics in these places is baked in and will not likely change for several years. That is to say politics has little to do with short term swings in production. The clue will be if prices start to rise but production does not follow in lock step.
But a recession will throw a monkey wrench into everything, just as covid did. We will not know much until after the recession is over, if it ever is. I don’t mean to sound like a doomer but the outlook for the world economy does not look good. In fact it looks terrible.
It’s been discussed here before, that if oil production peaked in a high price environment then that would be indicative of a peak in supply, and conversely if oil peaked in a low price environment that would indicate a peak in demand. We appear to be somewhere in the middle, where supply and demand globally are peaking simultaneously. I think this accounts for the generally stable medium-range price recently, and it seems likely this trend will continue for several years barring large collapses in supply and demand from war/pandemics etc. This is peak oil as a nonevent – watching paint dry.
This is peak oil as a nonevent – watching paint dry.
Agreed. I’ve even said as much.
But it brings us back to the main point of the late Colin Campbell, one he kept harping on but which people kept ignoring: that the peak does not matter as much as “the vision of the long decline afterward” [paraphrasing him].
Unless we were going to lose half our production effectively overnight and go Mad Max and fight in the guzzoline wars, it was never going to be particularly interesting as a single event.
As part of societal collapse? It’s a nice addition, though being poisoned by plastics, watching huge chunks of the world burn and/or flood, and wondering how agriculture will fare fucked weather systems is far more interesting.
Raising Interest rates may not have been a bad idea but raising them as fast as Powell and the Fed has raised them was a terrible idea. Very destructive. It is almost as destructive as the volatility in oil prices. If oil and gas prices don’t move up appreciably, US domestic oil production will stay relatively flat and gas production will fall. It is almost the end of the first quarter 2023, and if prices don’t rise appreciably for natural gas, dry gas production will fall.
Thr market cannot afford high interest rates .
We will have to see how this week plays out. But as of this morning in pre market opening. The flight to safety trade is on. Meaning bonds are bid and bond yields are crashing lower.
Oil is also down over 2%
Market knows it’s not just SVB that is in trouble. J Powell can just sit back and watch CPI go negative as things deteriorate.
Watch what happens if he raises interest rates at the next meeting. It’s not guaranteed that he won’t.
Again the inverted yield curves have been warning us for months that a deflationary money outcome was likely.
Forcing him to lower interrest rates faster can only be a bond and stock chaos, not just oil.
Oil was just down 5.5%. But it’s still too early in the week to say if it stays lower or bounces.
It’s not bonds or stocks or oil per say. It’s a collateral shortage. SVB failed because they didn’t have enough collateral to borrow enough money to remain liquid.
J Powell, J Yellen and Biden will come out and tell you everything is fine but that’s just not the case.
Money dealers or primary dealers should have stepped in a provided liquidity here. They didn’t because SVB didn’t have enough collateral.
What we’ve been watching in treasury yields is a run on collateral. Everybody trying to secure collateral.
Lower yields in this environment are likely not going to be good for stocks and oil prices.
Chaos is here .
JUST IN – Trading halted for French banking group BNP Paribas after the stock plunged 8% .
https://www.zerohedge.com/markets/credit-suisse-sparks-global-de-risking-after-top-investor-bails
Still waiting for Deutshe Bank , that is when things will be ugly .
The Shale Revolution Is Dead
Great article but requires free registration. It is also very long with some great charts. I am posting only a tiny portion of it here.
I first learned about the shale revolution in the aftermath of the Great Financial Crisis when I was a teenager with an interest in global energy markets. At the time, my understanding of the topic was limited, but I was fascinated by the potential of this new technology to transform the industry. This technology made the United States an energy-independent nation during the Trump Presidency.
In 2007, the United States produced roughly 5 million barrels of crude oil per day. That number rose to 11.9 million barrels per day in 2022.
The major driver of this production surge was the shale revolution. Tight oil production in the United States is currently at 8.0 million barrels per day. In 2011, that number was roughly 1.0 million barrels per day. Major drivers have been operations in the Permian, Eagle Ford, and Bakken Basins. Especially prior to 2020, production growth rates were absolutely wild.
Huge SNIP
The reason why I bring this up is the fact that the shale revolution was the oil production growth engine of the world. That is now changing.
On March 8, the Wall Street Journal reported that frackers are hitting fewer big gushers in the Permian Basin. Major operators are running out of good wells.
“Oil production from the best 10% of wells drilled in the Delaware portion of the Permian was 15% lower last year, on average, than top 2017 wells, according to data from analytics firm FLOW Partners LLC. Meanwhile, the average well put out 6% less oil than the prior year, according to an analysis of data from analytics firm Novi Labs.”
Last year, the growth of oil production in the United States was lower than many experts had predicted. This was due to investors pressuring companies to cut back on spending and focus on generating higher returns instead of expanding production. Additionally, weaker-than-expected well-production results in the Delaware basin also contributed to a flattening of output. As a result, the Energy Information Administration is forecasting that U.S. oil production will increase at about the same rate this year as it did last year, which is about half of what was initially expected.
I’m not expert, but it seems silly to use these Hubbert curves for these frac basins.
For one thing- the short ramp up was entirely due to the quick adoption of new technique.
A quick tail dropoff like is depicted could happen by rapid abandonment of Texas, but that is unlikely.
The Hubbert curve has nothing to do with the ramp-up, only the ramp-down. A very fast down ramp could be caused by running out of prime real estate to drill. And as the article points out, that is exactly what is happening in virtually every shale basin.
But you are correct, none of this has anything to do with Hubbert’s linearization. And Hubbert’s name appears nowhere in the article, except in the charts posted. Hubbert’s linearization is not used anywhere in the article to justify the demise of the shale oil boom. That is self evident from the new well data, or at least that is the point of the article.
Ron,
Bakken average well profiles from 2017 to 2021, it is too early to judge 2022 wells as all data is not in, the data will be revised over time. Productivity decreased from 2018 to 2019, then increased above the 2018 level in 2020, then decreased slightly in 2021, but still above the 2018 level.
From
https://public.tableau.com/app/profile/peters6703/viz/shared/PDJPX7942
Original post at link below
https://novilabs.com/blog/north-dakota-update-through-december-2022/
The chart below is NOT normalized for lateral length.
Dennis , Mike S with the same graph as yours but a different outlook .
https://www.oilystuffblog.com/forumstuff/forum-stuff/get-a-horse?origin=notification
Hole in head,
Thanks.
Another excellent post by Mr. Shellman, my chart above is for the Bakken not the Permian, I focus on the forest rather than the trees.
Chart below from
https://public.tableau.com/app/profile/peters6703/viz/shared/MDG99KT5X
from
https://novilabs.com/blog/permian-update-through-august-2022/
Chart below is cumulative output by year of first flow for all Permian wells in Wolfcamp, Bonespring, and Spraberry formations of Midland and Delaware subbasins of the Permian Basin from 2017 to 2022, data only covers through August 2022 (posted in December of 2022 at Novi labs by Enno Peters.
A breakdown as of August 2022 for wells with first flow from Jan 2017 to August 2022 (as of data from Dec 2, 2022 at Novi labs) for all of Permian basin
Wolfcamp wells were 66% of all wells for the period cited
Wolfcamp A and Wolfcamp B were 85% of all Wolfcamp wells and 56% of all Permian wells.
Spraberry wells were 16% of all Permian wells
Bonespring wells were 13% of all Permian wells
Other formations (not Wolfcamp, Spraberry or Bonespring) wells were about 5% of all Permian wells completed over the 2017 to August 2022 period.
Mike complains about analysts being very selective and then chooses to focus on Wolfcamp A (XY) wells which consist of 5% of all Permian wells completed as of August 2022. Those are great wells, but better to focus on Wolfcamp, Bonespring and Spraberry wells as a group which covers 93.6% of the wells completed from Jan 2007 to August 2022. This is the forest.
Ron,
For the Central Eagle Ford, productivity has fallen by about 30% since 2017 (6 month cumulative normalized for lateral length), to roughly the 2014 productivity level. Note that output is a function of both individual well productivity and the number of wells completed per month, Eagle Ford output peaked in 2015, before average well productivity peaked. There was a secondary peak in output in 2019 even with falling normalized well productivity. Lately completion rates have been lower, perhaps because high quality locations are becoming scarce.
https://novilabs.com/blog/eagle-ford-update-through-november-2022/
For Permian see
https://novilabs.com/blog/permian-update-through-august-2022/
Chart below from that post has 12 month cumulative output per 10000 feet of lateral for Midland and Delaware sub-basins of the Permian basin.
To me it looks like average normalized well productivity has been fairly stable in both the Midland and Delaware basins since 2016.
Which formations? I checked last time when you mentioned that normalized to lateral length productivity had stabilized, and reran it this weekend. The Bonespring had dropped through Covid, recovered in 2021 and is doing better in 2022. The “Trend Area” (comprised substantially of Spraberry, but I didn’t take the time to pull the geology apart just for that one area) has been stable since the summer before Covid and through it, wells designated as Upper Wolfcamp is a bit spotty in data density and appears to have declined slightly since 2018-2019, the Wolfcamp wells had demonstrated a consistent pattern of decline 2017-summer 2020, stabilized in 2021 and late 2021-early 2022 are better than at any time previously.
When you mentioned this last time and I was surprised that while someone else had found improvement per 1000′ LL in the Haynesville and Marcellus, that the same wouldn’t be happening elsewhere, it looks to be somewhat of a mixed bag. The good news being that the most common new wells are Wolfcamp, and something has happened as of late to increase productivity per unit LL. Haven’t checked the Bakken or Eagle Ford, although I care less about the Eagle Ford as it is becoming an overall gas play at this point.
Reservegrowthrulz,
This would be the average of all wells drilled in those subbasins, by date of first flow and 12 month cumulative output per 10000 feet of lateral length for all formations in the subbasins that were producing oil.
I do not have access to the lateral length data so I cannot break it down by formation.
I don’t really follow the gas plays and pay most attention to Permian basin, but do not have access to the full dataset, it is not easy to pull this together and requires a lot of money to get access to databases that have combed through the data. The Novilabs blog posts are the best information I have access to.
See
https://novilabs.com/shale-oil-and-gas-insights-blog/
for Permian
https://novilabs.com/blog/category/shale-oil-gas-insights/permian/
Bakken
https://novilabs.com/blog/category/shale-oil-gas-insights/north-dakota/
Niobrara
https://novilabs.com/blog/category/shale-oil-gas-insights/niobrara/
and Eagle Ford
https://novilabs.com/blog/category/shale-oil-gas-insights/eagle-ford/
To Dennis:
Yeah, I won’t use anything from Novi labs related to formations unless they can demonstrate they’ve got better geologists picking tops and landing zones in Texas than the ones I’ve got.
Reservegrowtrulz,
Pretty sure they rely on data from state agencies. In any case, it is the only data I have so it is what I will use.
From most recent Permian update at Novilabs:
Sources
For these presentations, I used data gathered from the following sources:
Texas RRC. Oil production is estimated for individual wells, based on a number of sources, such as lease & pending production data, well completion & inactivity reports, regular well tests, and oil production data.
OCD in New Mexico. Individual well production data is provided.
FracFocus.org
I wish to violate my self imposed rule about commenting here on AOB because I absolutely cannot stand the arrogance of this RGR DH. I don’t like being talked down to by anybody, particularly a weenie-neck corporate engineer, supposedly, who likes to focus on the past, not the future.
I mean really, this guy could be another plumber from Boca Raton, or a retired insurance salesman from San Francisco, posing as internet expert about oil. Who knows; he’s scaret to use his real name. I can tell you straight away, this dude has NEVER owned WI in his sheltered life. Want to know if somebody on social media that has no real name is really in the oil business?
They are humble.
Since I helped Enno develop his amazing stuff years ago, and it IS amazing!, I am insulted by this RGR DH stupid comment. I would not trust Enverus as far as I could throw Rystad. I hope you catch that, Allen.
The ONLY way anybody knows what bench is being produced in, say, a 3,000 foot correlative interval in the Permian Basin called the “Wolfcamp” (TRRC), is to pick the “reported” first take point (the first perforated interval in the lateral) filed with the Texas Railroad Commission on W-2 Completion forms. The TRRC does not require you to name the bench you “think” you are producing from. It does not really care.
Then you have to plot that “reported” first take point in the lateral and correlate that to offsetting wells, where the Wolfcamp A interval goes up and down, thickens and thins, could be faulted out completely or simply changes significantly over 1000 feet. No data sell company does that; that is horse shit. If they say they do, they’re lying.
And here’s the REAL deal, from an operator in Texas of over 50 years, every operator lies about everything. If field rules say you cannot drill a Wolfcamp A XY well closer than 660 feet apart, and the last A KY well you drilled next door was a barn burner, you’re going to drill another one as close as you can to the last one and lie about it to hell and back. Do you think for one minute that the TRRC is going to run a CCL, at their expense, to see where you have actually perforated a well? Phffftttt.
Those assholes at the TRRC allow allocation wells to be drilled in Texas and allocation wells violate very aspect of mineral law in my State. It is against the law and the TSC has yet to rule on allocation wells. The TRRC Three Kings don’t care, they just want votes. In Texas there is now no Constitutional statues, no rules, no laws set forth in the Natural Resource Code that are not broken by the TRRC.
Doubt me? Spend the night in Pecos, you can read your book outside, in the dark, without electricity.
Even IF the TRRC DID check where your FTP actually is v. where you reported it, nobody knows where the actual production is coming from. Fracs go out, up and down, they find faults and before you know it, you have frac’ed way out of zone. Those assholes in the SCOOP/STACK bash shallow wells 5000 feet above them all the time. There is vertical communication all over the place, particularly in parts of the Delaware Basin, particularly in the Bone Springs.
All you guys that rely so heavily, so desperately, on “data…” you guys need to know most of the data is no bueno por ca-ca. Its really… meaningless. It’s dark down there and hard to see. In Texas nobody gives a rats ass anyway; we’re on a mission from God to drain the entire State bone dry of everything, Including groundwater and fresh air.
This RGR DH guy, don’t let him boon-doggle you. Likes assholes that everybody’s got, it’s just another opinion in a big pile of opinions.
I don’t like the “McPeakster” thing myself, since I am one, particularly coming from a McNarcissist.
Mike Shellman,
Thanks for clearing that up. I agree Enno’s data seems excellent, but as you have pointed out from time time to time, I don’t know much about the actual industry, Reservegrowthrulz seems to know quite a bit, but probably much less than you about the real world industry.
I think the question of which formations is less important than output, thought the Texas RRC reporting by lease rather than by well (as you know many or most leases have several wells producing and usually they do not start producing at the same time) makes determining individual well output tricky. Enno seems to have figured out way to estimate output per well in these cases (where there is a multi-well lease with wells having first flow on several different dates.
Actually, knowing where the lateral is placed within the gross correlative interval is very important for any analyst needing to predict the future accurately. Sweet spots are directly related to sweet benches. Good luck finding the truth about all that.
We tried using TRRC W-10 well tests to isolate wells within multiple well units; I don’t know what Novi says it can do now other than is seems to have the cooperation of a few operators somewhere. They may think they have that sorted out, I doubt it. They’ll likely build an algo based on a range of a accuracies, or inaccuracies, and try and sell that.
My point? Data originates in the well bore, down in the dark, and only operators know the secrets.
Thanks Mike.
I agree the data is far from perfect, in some states (New Mexico and North Dakota) the data is reported by individual well. I imagine each well is different in productivity, the best one can do it a distance is take the average of many wells and see how the average changes over time. This only gives us a very rough idea of how things might lokk in the future depending upon future completion rates and future changes in average well productivity.
Hickory, the decline rate is so gargantuan the first year of production and……… many people including me think much of these wells will be abandoned or temporarily shut in at much higher production rates than stripper wells due to the high cost of operating these assets. The curve could be steeper.
It seems to me that any significant drop in production will be followed by [much] higher prices.
That will then stimulate more production activity.
I don’t think that demand is going to suddenly disappear this decade.
Is there really just not much left under Texas?
Remember this chart. The USA only looks energy independent because we IMPORT loads of UNREFINED crude oil and re-label it DOMESTIC production after refining it in Texas and Louisiana.
https://pbs.twimg.com/media/Fi1PerYWIAAYGLb.png
Thanks, Paul. I wrote about the energy-independent LIE in an earlier post here but deleted it because I’m sick of having to reiterate the point. It goes nowhere.
20.5 barrels consumed per day
minus 11.9 barrels per day produced (from US wells)
equals 8.6 as the difference.
Call them “fairy barrels.”
Mike B,
We do not consume 20 million barrels of oil per day, we came close in 2005 with about 19715 kb/d of total finished petroleum product consumed. This is product supplied plus net imports of finished petroleum products. Chart below has annual averages from 1983 to 2022 using EIA data for US consumption of finished petroleum products (product supplied plus net imports of finished petroleum products).
Dennis,
So, the U.S. is only consuming 14 mbd? Then I gather, the EIA is completely Full of Shyte?
steve
Steve,
Try
https://www.eia.gov/dnav/pet/pet_cons_psup_dc_nus_mbblpd_a.htm
Finished petroleum products are the things that are consumed that come from crude plus condensate, the Hydrocarbon Gas Liquids (HGL) and other liquids are biofuels and bottled gas and in 2022 the average annual output was 3847 kb/d for these two categories, deduct this from “Total product supplied” (in 2022 it was 20280 kb/d) and we get 16433 kb/d of finished petroleum products supplied. Then we deduct net exports of finished petroleum products (2347 kb/d in 2022) and we get 16433 minus 2347 which equals 14086 kb/d.
Dennis
The question that needs to be asked is “How many barrels of oil are required to get those finished barrels. Depending on the quality of the crude, those barrels have bottoms such as bunker fuel and asphalt.
For instance a barrel of synthetic crude has no bottoms, is low in sulphur and biased toward making diesel. I have not seen what a barrel of Western Canada Select, a heavy sour crude, can produce.
To some extent the capability of the refinery determines the final finished product mix from a given barrel of oil.
Ovi,
We don’t really have a breakdown of the crude quality that goes into US refineries, much less refineries Worldwide. My point was a fairly simple one, much of the so called petroleum consumption is in fact HGL and other liquids, a better measure is crude oil input to refineries minus the net exports of more “useful” products such as gasoline, diesel, jet fuel and residual fuel that are mostly used for moving goods and people over land, sea , and air. That would give us a measure of US consumption of crude oil, many of the other finished products are just ways to use the leftovers of the refining process, essentially they are by products of the refining and blending process of crude oil and are of lessor importance.
Ovi,
Chart below has US net crude oil input to refineries and blenders plus net imports to the US of gasoline, distillate fuel, jet fuel, and residual fuel (I call these previous 4 categories “transport fuel”) to estimate US consumption of crude oil. This is annual averages from 1973 to 2022 in kb/d.
Arguing with these folks. I’m getting f—-ing sick of it:
https://www.reuters.com/business/energy/us-crude-output-petroleum-demand-rise-2022-eia-2022-12-06/
A different way to look at US consumption is to focus on gasoline, distillate fuel, jet fuel, and residual fuel. I will call these transport fuel as most of this fuel is used for land, air, and water transport. If we take the product supplied plus net imorts of these 4 fuel types we get total US consumption of these “transport fuels”. All of this comes from EIA data. The chart below covers 1973 to 2022 in kb/d for US.
So peak transport fuel was 2006 and we have been losing 1.5% annually?
Makes sense why 2022 was highest diesel price on record and also the resulting inflation it caused…
So not only is the Permian fizzling out but is also of insufficient quality to really address the diesel shortage…
Looking at EIA, distillate peaked in 2007 at 1.53 billion barrels and a second peak in 2018 at 1.51 bb. 2022 was considerably lower at 1.45 bb.
All data points to a continued loss in diesel supply of 1-2%, since diesel moves 90% of the economy it’s likely a better indicator than other measures.
I’m tending to agree with those here that see very limited upside to crude oil price, prices need to remain low to avoid global recession but aren’t high enough to spur any additional production (if that were even possible).
Compared to 10 months ago diesel prices are fairly low, especially when adjusted for inflation.
Or exports of manufactured products. Are people so unfamiliar with the US being a world class exporter of finished products that they don’t know this 2 2=4 stuff?
https://oilprice.com/Latest-Energy-News/World-News/US-Fuel-Exports-Broke-Records-In-The-First-Half-Of-2022.html
We produce and import crude. We then turn big chunks of it into products and ship it back out to the world. LNG isn’t the only thing America has quite a reputation for, have quite a bit refining capacity beyond our consumption it isn’t even funny.
We ship out crude oil as well, particularly of a gravity that refineries in the rest of the world want to change the assay that enters the refinery in order for their own need for a particular output.
Not even hilarious that they overbuilt for a finite & non-renewable resource.
Mike, the 11.9 million barrels per day is C+C. The 20.5 million barrels per day is total liquids. Total liquids include C+C, NGLs, biofuels, and refinery process gain.
In 2022 we imported an average of 8,332,000 barrels per day. We exported an average of 9,581,000 bp/d which means we had an average net export of 1,250,000 bp/d.
Table 3.1 Petroleum Overview (Thousand Barrels per Day)
Ron, it’s the energy that matters, not the barrels. Importing them, transforming them, re-exporting them has an energy cost, as well as an environmental one. We have to see how convenient it is.
And 6.6 million barrels of raw oil products are imported per day, to be re-labelled as domestic production. This bit of creative book-keeping sustains the charade that the USA is a cornucopian source of oil.
Not quite independent, but a net exporter since 2019.
https://www.eia.gov/energyexplained/us-energy-facts/imports-and-exports.php
Reservegrowthrulz,
If only finished petroleum products and crude are counted, then no the US is not a net exporter of oil, basically the US is a net exporter of HGL and other liquids. These are essentially products of the natural gas stream, not the oil stream and is just bad accounting. NGLs should be counted as part of natural gas output, not oil output. Oil is a product that is a liquid at standard temperature and pressure, ethane, propane, and butane do not fit that definition and should not be counted as “oil”.
https://www.bts.gov/content/overview-us-petroleum-production-imports-exports-and-consumption-million-barrels-day
The first chart here is explicit. The turquoise bars represent consumption. The blue line represents production. Not once in the 21-year period shown does the blue line exceed the turquoise bars. There is an impressive decrease in the red line (imports) and an even more impressive increase in the green line (exports), but they’re a wash over all.
This says to my simple, pea brain that the US is not a net exporter. It says the US consumes more than it produces. This is not some sin, it’s just a fact.
Mike B,
I agree the US is a net importer of crude oil and all of the so called net exports are simply hydrocarbon gas liquids. The problem with the chart is that it counts NGL production as petroleum consumption when it should be counted as a part of natural gas output. NGL is simply a part of natural gas production which is removed from the natural gas stream in a natural gas liquids plant producing ethane, propane and butane.
Why anyone has then decided to term this a petroleum liquid (it is only a liquid under pressure or at very low temperature) has never been clear. NGLs with the exception of pentanes plus are simply bottled gas, they are not petroleum any more than biofuels are petroleum.
The problem with the chart is that it counts NGL production as petroleum consumption when it should be counted as a part of natural gas output.
OK. You gotta wonder: is it just laziness on their part?
It makes it worse for the lay person trying to figure this shit out.
Mike B,
It might be that various agencies wanted to soft pedal the oil crisis in the 1974 to 1982 period and started to include stuff as “oil” that should never have been counted as such (ethane, propane, butane and other components of the natural gas stream) in order to make the crisis seem less severe.
In the chart you provided earlier notice that they have domestic “petroleum” production at about 17 million barrels per day in 2022, I call bullshit on that number, domestic petroleum production in 2022 was 11.9 million barrels per day, roughly 5 million barrels per day less than claimed in the chart you linked from the bureau of transportation statistics. Also note the IEA, and OPEC focus on “total liquids” for World output rather than petroleum output, the difference is nearly 20 million barrels per day (100 million total liquids vs 80 million of crude plus condensate per day.)
The 6.6 million barrels of raw oil products imported per day, to be re-labelled as domestic production, almost exactly compensates for the amount of liquids that are labelled as oil (such as NGL as Dennis points out), That’s more of the creative bookkeeping regarding hiding the net deficit in crude oil production.
Could be, the article I quoted was mentioning net energy, not specifically oil. I remember the catcalls of yesterday, it included energy as the metric as well as oil. NGLs can be counted as whatever folks want I suppose, as only pentanes plus are relevant to the an “oil” angle. While “total liquids” is an amusing metric, I recommend folks use the right data for the job.
Net energy perhaps, but politicians use crude oil interchangeably and the public believes it.
The powers that be will never remove the re-labeling of imported unrefined oil as domestic production, as it will eliminate 6.6 million barrels of propaganda per day.
Reservegrowthrulz,
Net energy is difficult to measure. Total liquids is used by the EIA, IEA, and OPEC in many of their publications of both data and forecasts, it is a strange way to account for oil production by including ethane, propane, and butane in the mix, as these are originally part of the natural gas stream (and then separated at NGPL plants) it seems accounting for them as part of natural gas production would make more sense.
Finally, all data in one diagram:
oil price in promille of BOE,
car production,
oil production.
The numbers itself vary much (dashed lines), so i have dropped values during the GFC, corona crisis, and oil price data from the LTG price crash 2015-2017.
This gives smooth curves (solid lines). Curves for a world without crises.
Ok I think it now might be safe to call for $100 oil this year.
“Translation: the Fed’s hiking cycle is dead and buried, and here comes the next round of massive liquidity injections. It also means that the Fed, Treasury and FDIC have just experienced the most devastating humiliation in recent history – just 4 days ago Powell was telling Congress he could hike 50bps and here we are now using taxpayer funds to bail out banks that have collapsed because they couldn’t even handle 4.75% and somehow the Fed has no idea!”
https://www.zerohedge.com/markets/svb-latest-developments-live-blog-fdic-auction-failed-svb-assets-underway
The road goes on forever and the party never ends 😂
I do like that song plenty [https://www.youtube.com/watch?v=iJRWtKePKuY]
but as I have seen the news…no, there will not be taxpayer funds bailing out the banks this time.
“US taxpayers will not be on the hook for either facility, the regulators said. But shareholders and holders of unsecured corporate bonds will not be protected by the regulators’ plan.”
https://www.cnn.com/2023/03/12/investing/svb-customer-bailout/index.html
I just heard that all of the other banks will be required to donate cash into a fund that will bail out SVB. The bonds that the bank holds will rebound if held to maturity. Not sure if that is part of the plan.
This a pre-existing program
““The Deposit Insurance Fund is bearing the risk,” the official emphasized. “This is not funds from the taxpayer.”
The Deposit Insurance Fund is part of the FDIC and funded by quarterly fees assessed on FDIC-insured financial institutions, as well as interest on funds invested in government bonds.
The DIF currently has over $100 billion in it, a sum the Treasury official said was “more than fully sufficient” to cover SVB and Signature depositors.”
The federal program will not be used to bail out stock holders in these banks. They will on there own.
How many more small and mid sized banks out there are in same boat?
When the treasury sent stimulus checks out to everyone. All those bank deposits hit the balance sheets of banks. Which they are by law required to back with certain assets. Mainly treasuries. They bought in when 10 year bonds were yielding between 0.5%-1.0%. Lately 10 year has been yielding between say 3.7%-4.5%.
Which is fine as long as banks aren’t forced to sale assets to meet customer withdrawals.
I’d like to point out European banks are loaded with negative yielding debt and ECB is raising interest rates. The potential for a banking crisis in Europe is far greater than that in US.
Even if SVB is bailout with taxpayers money. This isn’t going to end with just SVB.
I’d also like to point out with banks are also sitting on unrealized losses on MBS’s.
Point is the underlying collateral has been repriced. We should expect bad things to continue happening.
Market will put interest rates back at zero and FED will follow suite with the overnight rate.
When shit blows up rates go down. And so will price of oil.
Right now what the market needs most is the US treasury to issue more T bills instead of long term debt. But it seems Janet Yellen can’t figure that out.
Credit Suisse is in the crosshair . Deutshe Bank next ? In the meanwhile bankruptcies in the EU keep rising .
https://www.zerohedge.com/markets/credit-suisse-hits-new-low-material–weaknesses-found-financial-report-outflows
Bailout from SNB is mainly for public consumption. So the people won’t panic.
$50 billion in bank reserves created by the SNB don’t matter. The Saudi’s said no more money.
And the issue is collateral not the amount of bank reserves. $50 billion in bank reserves is the equivalent of putting a bandaid on a wound that requires a tourniquet and surgery.
Might get a small reprieve from the deleveraging pressure that has taken oil prices down but it likely won’t last long.
HHH , correct . Smoke and mirrors . Saudi’s will not invest / cannot invest . The by rules of their sovereign wealth fund stipulates no more than 10 % can be invested in one stock . They already have 9.9 % into CSB . Temporary relief .
54 billion is not enough . We need s bigger boat .
https://www.zerohedge.com/markets/bailout-bust-european-bank-default-risk-rises-credit-suisse-stock-tumbles
Above there was a discussion regarding what was affecting US production, WTI, Geology, politics and management decisions on how to allocate free cash flow .
Below is a chart that indicates that a change has occurred in the relationship between the price of WTI and the number rigs being used to drill wells, at this point in time.
After the price of WTI rose quite quickly after February 2020, the rise in the number of rigs did not parallel previous rises. The difference could be due to newer rigs being more efficient. Regardless of the reason, it is difficult to see the rig count and associated Frac spreads returning to pre pandemic levels, at this point in time.
Ovi,
I think the relationship would be in inflation adjusted dollars, $100/b in 2014 was different from $100/b in 2022.
Dennis
The parallelism was almost perfect from 2014 to 2020. Something more than past dollars are involved.
Ovi,
Five years there was a good match, from Feb 2011 to September 2014 there was not very good correlation. Clearly the pandemic, supply chain disruption and the War in Eastern Europe might have changed things. Perhaps 2015 to 2019 was anomolous.
Another thing to consider is that 800 horizontal oil rigs seems to be a rough high point since 2015, with only a brief period in late 2013 to early 2015 where this was exceeded in the US. Since 2018 it seems the tight oil industry has settled on a new maximum number of rigs of about 600 horizontal oil rigs, at least at a sustained WTI price of around 70 to 80 dollars per barrel in 2023 US$.
Dennis
2011 was the beginning of the LTO fracking boom. High WTI prices and OPM caused that surge up to late 2014. WTI then dropped and reality started to set in and the new relationship started in 2015.
Ovi,
The real price of oil has mostly been under $80/b in 2022$ since 2015 with the exception of a War induced price surge for a brief period in 2022. My guess is that the oil industry expected the surge in oil prices to be a brief one and chose not to invest in new output as a result, also there was a fair amount of DUC inventory that could be used instead of employing more drilling rigs. Now the DUC inventory has been depleted and a sustained increase (one year or longer) in oil prices to $90/bo or more might result in higher completion rates for tight oil producers. We will find out if we see higher oil prices for a sustained period if I am correct.
Perhaps the biggest pandemic in 100 years and the most severe World economic downturn in the past 90 years have something to do with it.
That is a pretty amazing correlation, and the breakdown from mid 2020 more so. I haven’t seen it shown so starkly before. It suggests something a bit stronger than fiscal responsability has come into play.
Oil down almost 5% – looks like someone needs his margin for more dire actions than oil speculation.
Nasdaq still is green – so still much need for hyped tech stock.
News is reporting the Biden administration has approved the Willow Project North Slope of Alaska, its CNN so take it with a grain of slat.
Javier’s Comment
“BREAKING: The Biden administration has formally approved the $8-billion Willow oilfield in Alaska. When completed, the project will pump 180,000 b/d.
Now, go and tell developing countries that they should not develop their own fossil fuel resources. ”
I think it is safe to say, energy security is now the prevailing theme. Hard to see how that changes in the near future, have we past the peak green energy idiocy? perhaps for a while anyway. How does this (change in attitude as opposed to the one project) impact all the models regarding peak oil? As Dennis to his credit has recognized without the political constraints artificially imposed as well as the prevailing price of oil over the last 6 years it’s really hard to have a high degree of confidence in peak oil being in the rearview mirror.
Texasteatwo,
Hmm, 180 kb/d output with crude input to refineries at about 16,000 kb/d for the US alone and perhaps 80,000 kb/d for the World. So this is about 1.1% of daily input to US refineries or 0.2% for World refinery input.
This is hardly newsworthy.
Dennis . ” This is hardly newsworthy. ” Agree . Won’t come to the market before 2032 even if all is 100% perfect execution . Won’t even wet the beak . TT is correct for the statement “Now, maybe it just that the green folks now realize that without (affordable) oil and gas their business model goes into the trash heap ” . As a matter of fact one of the outcomes of the Ukraine war has been that it has focused the governments especially the importers on food and energy security .
Dennis
Ok it’s 180,000bbl/day and hardly worth the effort. My question is, at what number in barrels per day IS worth the effort? I remember when Clinton vetoed drilling in ANWAR the argument was it would only be a 1,000,000 bbl/day. What a stupid argument.
Ervin,
I did not say it was not worth the effort, simply that it was not very important in the grand scheme.
Dennis –
Maybe the point here is that something that shouldn’t be newsworthy is…
Maybe we are getting to the point where any additional supply is considered a win since we are at a standstill production wise?
This reminds me of when you go hunting through the couch cushions to find spare change…cause you are short $0.10.
The collective addiction to oil is coming into the spotlight…US tight oil went for a good run (10-15 years, 2010 thru present), but is beginning to wind down (in a big way)…
We are speeding our way back into a very tight global oil supply (the Red Queen situation discussed 15-20 years ago).
There’s a critical knock on effect going on here as well. Many/most basins are getting into lower quality wells that might be 5 times less productive, so we’d really need to see the rig count growing exponentially just to keep production flat…we aren’t seeing that currently so we can expect at some point soon to see production take a huge nose dive…
Exxon, Chevron, ConocoPhillips eye Permian Basin growth in 2023
“Feb 2, 2023 — Chevron is forecasting total production to be flat or up to 3%, the company said in a Jan. 27 analysts call.”
So when will we start to see the 7% decline rate that Rystad assumes?
Individual wells are 40% initially and average 15% over time…
Looking back at your modified tight oil scenario from a year ago, you had tight oil output at 10.5 MBpD +/- 1 MBpD…(Annual Energy Outlook 2022 – 03/25/2022). Some great discussion and comments in this year old thread…Back then the charts were forecasting 12.6 for US but reality is 12.1. Some articles from last year also mentioned hitting 13 MBpD, but now that looks like a pipedream…even during the good old days in 2017-2019, an annual increase of 1 MBpD was not easy…
Really Dennis, not news worthy, news being truly in the eye of the beholder. As I pointed out and you just glossed over, the fact that DEMOCRATIC ADMINISTRATION APPROVED IT over the screams and howls of the environmental green energy lobby is news, DENNIS. If it were not news the major NEWS outlets would not have reported on it, the major energy commentators and analyst would not have commented on it and they would not be making the CHANGE in sentiment a big deal…because it is. Just when I think you want to be taken serious, Dennis you surprise with such stupid comments.
Now, maybe it just that the green folks now realize that without (affordable) oil and gas their business model goes into the trash heap!
https://www.zerohedge.com/political/biden-gives-go-ahead-giant-alaska-oil-project-greens-furious
https://nypost.com/2023/03/13/biden-greenlights-8-billion-oil-drilling-project-in-alaska/
https://www.cnn.com/2023/03/13/politics/willow-project-alaska-oil-biden-approval-climate/index.html
https://www.nytimes.com/2023/03/12/climate/biden-willow-arctic-drilling-restrictions.html
“The project is enormous by almost any measure. Its $8 billion price tag puts it at the forefront of pending U.S. oil projects today. And the 180,000 daily bbls of crude it’s projected to eventually yield represents roughly 1.6% of current U.S. oil production.
Willow presents a test of Biden’s energy and political priorities. The president campaigned on a pledge to block new drilling on public lands and accelerate the transition away from fossil fuels. Yet Biden also has implored oil companies to boost output to tame prices and address market disruptions spurred by Russia’s invasion of Ukraine.”
https://www.worldoil.com/news/2023/3/13/biden-administration-to-authorize-8-billion-conocophillips-willow-oil-project-in-alaska/
TTT,
Venture Global just announced FID on Phase 2 of their Plaquemines Parish LNG facility.
The entire 20 Mtpa project will now be built.
This facility is simply 2 Calcasieu Pass projects being constructed on the same jobsite as the modular equipment is virtually identical to the 10 Mtpa CP operation.
Required feedgas will be about 2.7 Bcfd.
More LNG FIDs are expected in the coming months.
Go gas.
Coffeeguyzz,
Perhaps the rush to export as much natural gas as possible is not a smart move for national security, just as the export of so much US tight oil (about 3000 kb/d) might also be unwise, as Mr. Shellman has pointed out on many occasions.
A copy/ paste of an observation by John on OSB regarding LNG .
“as the LNG export facilities get built out and US focuses on project its foreign policy on Europe and Russia, that we will see “LNG part deax” a superficial sequel to LTO-America Energy Independence. An ocean of USA NG turned into LNG and sent to Europe and Asia.
Until 1999 Europe was a major USD buyer and financed much of the USA deficit spending. Then the Europeans decided to compete with the USA and launched the Euro. I doubt the Europeans will pay for LNG with Euros. And I don’t believe for a minute that the US will restrict LNG exports if Americans are crushed by NG priced as a global commodity ”
So the question is how will Europe pay . The Eurodollar party is over , the export engine Germany is stuttering . How many Louis Vitton bags , Moet Chandon champagne and Hermes scarves will they have to sell to get dollars for a tanker of LNG ? We have already talked about the dollar shortage worldwide . Got dollars ?
Texastea,
The tight oil boom resulted in an extra 8000 kb/d for US output (so far, I expect it will increase to almost 10,000 kb/d by 2028, but many believe I am too optimistic), that was a big deal, 180 kb/d not so much imho. YMMV.
Yeah, impossible to say where the peak is.
The triangle is as always geology, politics and money. At shale oil, geology is the most easy part to predict, the other two can change fast.
From geological side a higher peak is possible, but the other factors time must decide.
It’s a fantastic debate here, as always. Amazing we focus on a relatively tiny portion of world supply (US), meanwhile 80% plus of world supply continues crashing since 15-20 years ago…
As Ron has pointed out many times, what little growth is left in US supply is nothing compared to the drop that all the other producers are experiencing…5% plus US declines will happen relatively soon (5 years into the future if you believe some estimates…or maybe delclines already started in 2018/2019?)….
Globally speaking, between 1982 and present world oil production hasn’t ever remained flat or fallen like it has since the 2018 peak in November of 84.5 MBpD…
We are almost 5 years post peak with no signs of production anywhere near 85 MBpD…
How much longer will some of you hold on to the pipe dream of growth forever???
Kengeo,
Not growth forever, but a small increase up to 2028 is my best guess. Many think this is too optimistic, others believe it is pessimistic, from an environmental perspective, it might be better for life on the planet if I am in fact too optimistic and the peak is indeed past. I am not that much of an optimist. In my view the scenario I have most recently presented is realistic.
Mr Steve Kopits on the Willow project .
““The most plausible interpretation is that US crude and condensate production will stagnate for the balance of the year. As I wrote in The Oil Supply Outlook (Feb. 2), the plateau has been expected since at least 2017 (see Fig. 6), so it should come as no surprise. I think the surprise, however, will be in production trends going forward. The EIA sees a long platuea in US shale oil production. I think it more likely that we’ll see the beginnings of an erosion in supply from 2024.
In light of this, President Biden’s approval of drilling in Alaska is not hard to understand, but don’t expect it to have a material impact on supply anytime soon.”
All of this may be related to the announcements from the recent CERA conference.
I am going out on the limb . We will not see a drop off oil from the Willow project . The rubber meets the road , the road will win . All air , no punch .
Pretty interesting.
Accusing this to be all lies. Knowing something about the oil and gas industry I would take the opposing view, that there are reserves to be developed. The question is more what is the cost? That is a question that is relevant not just for this project. It is a global issue – what is the cost for oil/gas projects compared to expected revenue streams. And are there any subsidies involved etc. ?
Yes, you are out on a limb on this.
But that is a completely normal place for you
I have come to understand.
I prefer hanging around closer to the trunk.
To each their own.
Too shallow to fill content needed to grasp reality.
hint:
“The commitment by the Biden administration to do “whatever is needed” to protect the money and riches of financial investors, speculators and the wealthy has again laid bare the real nature of capitalist governments as the executive committee for managing the affairs of the ruling monied elites.”
It the cheapest to stop a crash at the beginning.
If you let go, there are examples in the history books from 19th century. A peak unemployment of 50% was recorded at some of the crashs here in Germany, when a railway tantrum from USA crossed the lake. I’ve seen it in a local museum here, it was part of the foundation of social movement.
At the current rate of interrest rate rising, a chain reaction could kill ALL banks and MOST of companies – resulting in a complete chaos.
Democracy with regulated capitalism is by far not the best form of government – but the best form we know. So keep improving (and no, socialism is not the solution).
if you let go, there are examples in the history books from 19th century. A peak unemployment of 50% was recorded at some of the crashs here in Germany, when a railway tantrum from USA crossed the lake.
Mr. EULENSPIEGEL, to suggest that a railway dispute in the USA caused unemployment to rise to 50% in Germany, in the days before globalization, stretches credibility to its limits. And your use of the word “tantrum” shows that you are not interested in constructive dialogue, only in making wild accusations.
Democracy with regulated capitalism is by far not the best form of government – but the best form we know.
If you, or anyone else, don’t know of a better form of government, then it is asinine to suggest that it is far from the best. If you believe democracy is far from the best form of government then it behooves you to name a better one.
Just to remind folks, the very large increase in US output from 2008 to 2015 occurred while a Democratic president was in the white house.
I would rephrase, the growth in production occurred with no help by the democratic president in office.
Ervin,
An industry that is 140 years old is pretty mature and should be able to stand on its own, the Obama/Biden administration did little to stand in the way of the tight oil boom.
The Baker Hughes International Rig Count has not yet risen to it’s pre-covid level. The data in the chart below is through February 2023.
Note: This is not the entire international rig count. Iran, Russia, Venezuela, and a few other nations are not included. This is usually due to politics.
Saudi Arabia Rig Count. Data is through February 2023.
EIA Drilling Productivity Report Bakken Revisions For DUMMIES…
After the EIA Drilling Productivity Report forecast of the Bakken reaching 1.2 mbd in NOV, DEC, JAN, FEB, & MAR was not reached, they stopped smelling the GLUE and provided a more realistic APRIL 2023 figure. However, this will also likely be revised lower.
Interesting, how could the Bakken production go up in April when it was 1.2 mbd in DEC 2022?
steve
EIA Drilling Productivity Report Eagle Ford Revisions For DUMMIES…
After the EIA Drilling Productivity Report of the Eagle Ford forecast of 1.2 mbd for NOV, DEC, JAN & FEB was not reached , they also decided to put the CAP back on the GLUE and report a more realistic figure.
Also, how can the Eagle Ford go up in April 2023, when it was supposed to be 1.237 mbd in DEC 2022?
SHYTE now hitting the U.S. Shale Oil Industry…
steve
Again, the diagram with peak car and peak oil.
I have added the line for world GDP in Trillion USD. Clearly,
there are three times with GDP reduction:
2009, together with a reduction in car sales and oil price,
2015-2016, together with a reduction in car sales and oil price,
2020, together with a reduction in car sales, oil price and oil production.
Each economist can explain, that at all three points there are economic crises, causing the fall.
But they can’t explain, why car sales had a peak in 2017, and oil production had a peak in 2018.
Which economic crisis has caused the peaks ?
And they can’t explain why the oil price had a maximum in 2011 and went down until 2020.
Geologists can’t do it, too.
Thermodynamics is required to understand the trends.
You forgot the other possibilities..here are a couple-
The world doesn’t need any more cars, after having massively overbuilt for the past 70 years.
Cars last a lot longer now- average in the US having doubled in recent decades.
Hickory,
First: a saturated market has constant sales numbers, not decreasing.
Second: An improvement of car quality over several decades will result in a effect visible over decades, with a duration of decades, not in a reversal in only 4-5 years.
And why are peak car and peak oil nearly simultaneous ? I believe, Sherlock Holmes will tell you, that a connection is high probable.
Peak oil plateau is not a concept that has crept in to mind of the global auto customer.
The collective purchasing power of the world is higher than ever,
and vehicles can be purchased if they are needed.
I suggest that the world is saturated by heavy overproduction of vehicles for decades.
Where is there a shortage of vehicles, where is there pent up demand?
To the contrary…the world is overstuffed with vehicles.
Its hard to get away from them.
That must be why 84 month autoloans exist: cars are just too damn cheap and plentiful.
Right! When I was younger I remember wondering how stupid people could be when they started offering 48 month auto loans instead of 36 month with 20% down. I bought a used 1971 VW Camper in 1975 for $1500.
I’m literally seeing 5-year-old Fords at my local dealer going for more than they went when new in instances, since I had to get a new car to replace one that was on its last legs.
As someone who generally hates car culture and thinks are are too many of the things, it’s one weird take to say they’re cheap given, across the pond in America, people have $1000/month autoloan repayments or lease costs now. On used as well as new.
The OPEC Monthly Oil Market Report just came out. No big surprises. The OPEC 13 was up 117 Kbp/d in February. But that was after January production was revised downward by 69 Kbp/d. So OPEC production was up only 48 Kbp/d over what was reported last month.
Zero Hedge reports Big Product and Cushing Draws
Crude +1.16mm (+100k exp)
Cushing -950k
Gasoline -4.59mm (-1.2mm exp)
Distillates -2.89mm (-600k exp)
I think this oil storage report that moves prices a lot is much overrated. Since the USA is heavy involved in oil and product trading, the content of this report is in reality very low.
For global oil storage much more countries must be countet, including China. A next to impossible task.
BOEM has corrected its monthly production numbers to match reported numbers, so it is looking even more likely that the EIA have overestimates of about 25 – 50kbpd for GoM for the past six months
George
What is the issue here? Does it have something to do with wells being shut down unexpectedly and they don’t get reported for 3 or 4 months. In other words, the EIA continues to assume that the producing wells continue to work until they are notified 4 months later that a few wells were shut down.
Could unknown decline rates also be a problem?
It’s just a guess but I think it is to do with delays in new projects. New leases coming into production don’t normally get reported for 4 to 6 months (I don’t know if this is to allow the operators to make sure their metering systems are all working properly or an issue of confidentially). Therefore BOEM and EIA make estimates to fill in the gaps, that later get corrected as the actual numbers come in. If a project is delayed but the news is too late to allow adjustment (and unless a new start-up date is given officially then I don’t think the estimates are changed) then there will be a significant overestimate in the uncorrected numbers. Mad Dog II and Taggart have both been delayed in 2022.
Thanks George
Looks like there are a lot of unknowns.
Will the US start filling the SPR now that WTI has fallen below $72?
SS
I assume they will issue a tender with a fixed price. The question is will someone step up and agree to deliver said barrels at that price.
WTI now below $69/b.
WTI at 66.81 currently. A whole lot of de-leveraging going on.
It will probably bounce off the weekly 200MA. Before resuming downtrend.
The North Dakota Monthly Oil Production Statistics is just in, a day late, with January 2023 production numbers.
North Dakota C+C production recovered somewhat from the December blizzard. Their production was up 102,844 barrels per day to 1,060,708 barrels per day. This is still well short of their pre-blizzard numbers.
Looking at the EIA numbers, something is way off. The numbers suggested we are back to exporting 5,00 million barrels per day which is 2,0 million barrels per day over last week’s average export numbers. Production numbers were flat, refinery throughput was up a little bit, distillates and gasoline inventories were drawn a little . Based on the export numbers, crude oil stocks should have drawn 15 million barrels over the past week but instead we had another EIA “adjustment” giving the crude oil storage number another small build. I am convinced the EIA no longer has legitimate numbers. It makes zero sense. Perhaps someone here smarter than me has answer. If you look at the Crude oil storage chart on the EIA website, it would tell you we have grown 60 million barrels in storage in just over two months. This is not possible unless demand has fallen 2.0 million barrels per day Since January 1, 2023.
As a side note, much of the downward pressure today on crude prices were attributed to hedge Fund sellers liquidating other positions due to the crashing of the 2 year bond yield.
The system is breaking down.
LTO,
While oil and natgas prices are plunging, what are you seeing as prices of pipe & materials in the oil industry?
steve
They haven’t moved very much yet Steve, but they will. The price of steel is still high. The only way those prices come down is if companies curtail their drilling programs dramatically. This industry is uninvestable with this price volatility. I heard from a few friends, that the Hedge Funds were unloading oil positions today due to their negative positions in the crashing of the yields in the two-year bonds. This may be true or false.
I can’t see how the Rig count won’t crater from here. Perhaps the market is pricing in a huge recession or some other collapse. I would think owning real assets would be way better than paper assets at this time, but it doesn’t to be the case today although gold is going higher. I wouldn’t look for this administration to buy back oil for the SPR with all of the other problems staring them in the face like the cracks unfolding in the banking system. Interest rates were held down for way too long and the FED raised rates way too quickly without seeing the impacts of these rate increases on the overall financial system. I would bet stressed commercial real estate loans will be the next big bomb to drop. Not a pretty day.
LTO,
What you describe in your first paragraph seems to be the perfect symptoms stemming from what I call, the Energy Cliff. You are correct… increased volatility, which is a result of the Energy Cliff dynamics, is not good for the oil industry or economy.
As for your second paragraph, I also agree that “Real Assets” are going to be the best places to be, but unfortunately, the market DOES NOT YET KNOW what they are. They think they know, but due to rising oil production for more than a century, this has provided a BID for most Stocks, Bonds, and Real Estate. When we head over the Energy Cliff (for good), then that BID disappears.
Lastly, when the Fed & Central banks have to go back to PROPPING up the Economy & Financial System… we get the next leg of Energy Cost Push Inflation. This one could be a BIG ONE pushing oil up to $200 a barrel… but that may be some time.
steve
LTO Survivor
Attached is the balance sheet for today and last week with some Modifications.
The normal EIA balance estimates shown in Columns 1 and 2 make this one BIG ASSUMPTION. The inventory barrels and the import and export number are accurate. In column four, the assumption is made that the import and export number are correct. As you noted above, this assumption results a draw of 14.1 M barrels.
This now leaves the EIA with a problem because the inventory reports say that the oil stocks have increased by 1.6 M barrels. So to correct this discrepancy the EIA throws in this big adjustment factor of 2,230 kb/d or 15,610 M barrels.
So the question becomes, what numbers are known more accurately, the import export numbers or the inventory numbers. I will cast my vote for the import export numbers because there is cold hard cash behind these numbers. I am assuming that the companies reporting the imports and exports are providing accurate data.
In column 3, I made a guess at what the adjustment factor would have been if the inventory barrels would have been a 2 M barrel draw. The adjustment would be 500 kb/d lower, 1,730 kb/d.
Not knowing how the inventory numbers are collected, one would have to look at the possible sources of error. Could a few tanks be missing from the count. Calibration errors in the tanks that use measuring floats for electronic reporting is another possible error source. Are any tanks still being measured with a dip stick?
Do the inventory numbers include product in pipelines?
Assuming they do, there have been a lot of pipelines placed into service since the shale boom began.
I have wondered if this is one reason why the numbers seem so inaccurate? How easy is it to measure how much product is in all the pipes at any one time?
Count me as baffled how the US could release a record amount from the SPR and have minimal commercial inventory build, and almost immediately after the SPR releases stop, large commercial builds commence.
The only answer is a coinciding demand collapse. That is too convenient for me to buy.
SS
This is the definition of inventory straight from the weekly supply sheet.
1 Includes those domestic and Customs-cleared foreign crude oil stocks held at refineries and tank farms or in transit thereto, and in pipelines.
2 Includes non-U.S. stocks held under foreign or commercial storage agreements.
I agree. Demand could not have dropped by 2,000,000 barrels a day. If you look at the chart, it is such an anomaly compared to the product charts which I could post as well which appear very much in line with the past few years and by the way still way below the five year average. I am not a conspiracy theorist, I honestly don’t understand those anomalous crude oil builds for the past few months. The builds don’t make any rational sense. We quit buying from the SPR according to the news and we are exporting more ( 5 million bopd) and production is relatively flat. So how do we build? Maybe they are carrying oil in the pipelines as inventory now. That’s the only logical explanation.
does this chart look right?? Barrels out of thin air!! They have been explained as adjustments?
If the EIA says we, the US, use about 18 million BOD, how can this chart be right? (Which is a good question)
7 days/wk * 20MBOD = 140 MBOD yet the lowest value in the graph is 395 million barrels.
Peter , EIA = Energy Inaccuracy Agency . Courtesy Mr. Shellman .
Dennis –
Reviewing cumulative oil produced, I get a total of ~1,500 Gb to date (plus/minus).
If total URR is in fact 3,000 GB then we are right at the volumetric mean and should be close to the global peak, right?
It total URR is in fact a bit less, say 2,700 Gb (see reference below to Laherrère), then we are about 56% (1500/2700).
This would put the mid-point in 2018, which so far matches the current peak…
The mid-point (peak) could be pushed out to 2030 if URR is a bit more, say 3,150 Gb (likely too high of an estimate, see below).
Averaged out, high and low estimates of URR give a peak at 2024 +/- 6 years…
You’ll prob. say that the actual peak doesn’t have to match the production mid point…
From the most recent Rystad numbers:
1P – 298 Gb (this would result in world peak of 2003)
2P – 548 Gb (world peak of 2007)
50% of 2PC – (world peak of 2008)
75% of 2PC – 914 Gb (world peak of 2014)
100% of 2PC – 1218 Gb (world peak of 2019)
90% of 2PCX – 1415 Gb (world peak of 2022)
100% of 2PCX – 1572 Gb (world peak of 2025)
Based on these values, we get estimates of peak ranging from 2003 to 2025.
Throwing out the low and high estimates we get 2007-2022, a 15 year timeframe.
Using the full 2PCX and subtracting the 400 Gb that Laherrère says should be removed, results in 2PCX(-400) of 1172 Gb, which works out to a 2018 peak…
What URR are you using for your current best-guess(es) model(s)?
Kengeo, thanks for that fantastic piece of work. You speculated that Dennis might say that the peak does not have to come at the production midpoint. This is correct. It is far more likely that the production peak would come well before the production midpoint. There are two reasons for this. The first reason is the easiest-to-find oil will be produced first. The second reason is the easiest-to-recover oil will be produced first. The peak should be well before the hard-to-find and hard-to-produce oil is produced. Well, at least most of it.
I agree with Laherrère. I believe we have somewhere between 1,000 and 1,200 thousand Gb left to be produced. However, even is there is 1,500, or even more oil left in the ground the peak will still very likely be 2018 because of the easiest oil being produced first.
Ron – That makes sense, also, we know that the global peak is an amalgamation of the individual fields (geographies, countries, or however one would like to group them). As such, we know that behavior of the entire group can’t deviate too much from its parts/groupings (individual fields/countries).
I’ll copy and paste a comment from last year, which I think still remains true.
What stands out to me is there were an early group of peaking countries from 2000 – 2009 timeframe…the canaries in the coalmine so to speak….
One other item that stands out is that every year there are less and less key big producers at the table, but there are still growing hungry economies waiting for their share of oil production…at what point do economies become unable to move forward when there’s no oil men (countries) at the table, seems like we are fast approaching that situation (globally at least).
KENGEO
06/28/2022 at 9:14 pm
My key take-aways:
On average, the Top 9 (U.S – Saudi Arabia – Russia – Africa – Canada – Iraq – China – UAE – Iran) oil producers peaked in 2017-2018.
The Top 9 currently account for ~75% of all oil production (in contrast, in 2000 the ‘Others’ accounted for almost 40%, while the Top 9 were 60%). 22 years ago Mexico, Venezuela, and Norway played a larger role than they do today (together those 3 produce less than half of what they did in 2000).
Actual observed world peak was 2019 largely due to massive gains in US output between ~2016 and 2019 (~40% increase).
US #1 (2019 peak)
Saudi #2 (2018 peak)
Russia #3 (2019 peak)
Africa #4 (2012 peak)
Canada #5 (2021 peak)
Iraq #6 (2019 peak)
China #7 (2015 peak)
UAE #8 (2016 peak)
Iran #9 (2017 peak)
Everyone else ‘Others’ #10 (peaked in 2005).
For the ‘Others’, between 2015 and 2020, production has been falling steadily at an average of ~3%/year.
Before that (2005-2015), the decline rate was less, only ~0.7%.
Some other highlights:
Between ’18-’19 there were 3 considerable drops in production including Iran, Venezuela, and Saudi Arabia. Their total decrease was around 2.5% of world production. Three notable increases in Norway, Iran, and China were observed between 18′-’19.
Comparing ’19 to 21′ (excluding the 20′ covid slump), the most significant countries falling short in 21′ (compared to 19′) were Saudi Arabia (-879k barrels), Russia (-735k barrels), Iraq (-677k barrels), US (-529k barrels), Nigeria (-476k barrels), Venezuela (-368k barrels), and UAE (-331k barrels).
I’ve seen estimates (Dennis) where US shale increases year over year adding ~600k barrels each year until ~2030. If actually possible, that still wouldn’t make up for the ‘Others’ decline rate.
It’s very important that we look carefully at the past 10-20 years of data, it shines a light on where we are headed…
Kengeo,
US tight oil is currently at about 8 Mb/d in 2022 and my best guess scenario has tight oil output increasing to about 9.9 Mb/d in 2028, that is about 1.9 Mb/d over 6 years or about 317 kb/d per year on average, in addition I have extra heavy oil increasing by about 400 kb/d over 6 years (2022 to 2028) or about 67 kb/d per year increase on average.
The explanation for low output from many large OPEC plus producers (Russia, KSA, and UAE) was that they were holding back output in 2021 so the excess World petroleum stocks would be reduced. OPEC still believes the World is well supplied with oil and might maintain low output until the price of oil suggests otherwise.
In 2022, Laherrere published a paper suggesting a URR of 3500 Gb for World C plus C.
https://www.sciencedirect.com/science/article/pii/S2666049022000524
see figure 6 (top right chart) from section 5.1 of paper and also table 1 from section 5.1
I use a URR for my best guess scenario of about 3000 Gb for World C plus C.
Dennis – Look at Fig. 7. “Forecasts to 2100 of production of four aggregations of classes of oil, based on HL estimates of URR from Fig. 6.”
Laherrère models three URRs (2500, 3000, and 3500 Gb). Not counting All liquids of 5,000 Gb.
Peak for 2500 is ~2019 (conventional only)
Peak for 3000 is ~2024 (conventional + LTO)
Peak for 3500 is ~2031 (conventional + LTO + XH)
Don’t miss this either:
“Overall, the key conclusion of Fig. 7 is just how soon are the expected peaks of global production for all four aggregations of oil. This in turn reflects the nature of a Hubbert curve, where a significantly greater URR leads to a higher production peak but one not much postponed.”
Should we really include the URR for extra-heavy oil?
READ: “The reality is that most non-conventional oils are still far from market, being difficult and energy-intensive to produce (Poisson and Hall, 2013), and where only some 20 Gb in total has been produced to date despite massive efforts.”
Your peak date of 2029 implies a URR around 3400, I believe Laherrère says 2500 Gb is the best available value at this point (plus maybe a little LTO)…
You might know better than Laherrère? Or have a paper of your own?
I know we are splitting hairs here but if 2018 was the peak and we are still below that production level (by a lot!), at some point the debate is over, right?
How often do you revisit/recalibrate your models (6 months seems like a minimum for little tweaks and annually for the big picture)…
Kengeo,
Laherrere typically focuses on C plus C less extra heavy (XH) oil. His best guess for that in 2018 was about 2800 to 3000 Gb, my scenarios use 2870 Gb for C plus C less XH oil and assume about 100 Gb for extra heavy oil (Laherrere estimates about 200 Gb for XH oil in 2018. The most recent paper by Laherrere has different numbers, but uses a more top down methodology thn the 2018 paper which looked at the 35 largest oil producers in detail.
See updated 35 nation forecast updated in October 2018 below (original paper published in August 2018)
https://aspofrance.org/2018/10/03/updated-extrapolation-of-oil-past-production-to-forecast-future-production/
Kengeo,
My best guess uses 2780 Gb for conventional oil, 70 Gb for tight oil and 97 Gb for extra heavy oil ( Canadian oil sands and Orinoco belt). Conventional oil peaks at 1268 Gb cumulative output in 2016 for my best guess model.
Unconventional oil (tight and extra heavy oil) peaks at 76 Gb of cumulative output in 2028. Unconventional output increases from 7.6 Mb/d in 2016 to 14.2 Mb/d in 2028 (an increase of 6.6 Mb/d), while conventional oil decreases from 73.5 Mb/d in 2016 to 69.7 in 2028 ( a decrease of 3.8 Mb/d). From the 2018 peak of 83 Mb/d, output increases by only 0.9 Mb/d by 2028 (peak of 83.9 Mb/d). In a sense the scenario is roughly a plateau from 2014 to 2035 with an annual decreasing trend of 4 kb/d per year over that 22 year period, basically output is roughly flat over 2014 to 2035.
Thanks Dennis – Appreciate the update, while I think you are still overestimating the URR (looking at past production I get URR values ranging from about 2,400 to 2,700 Gb). Your estimate is not much above my high range though, 10% above.
Still having trouble wrapping my head around cumulative production of 1500 GB and your estimate of ~3,000, that means peak oil production is right now or within next several months, right? At some point we have to reconcile the past production with estimates for the future. Do you have a date in mind, maybe a year from now? Just curious if you are able to draw a line in the sand? I think measuring growth from 2016/17 values might be a good starting point….
Kengeo,
I take the information I have available and have little faith in estimates using Hubbert linearization, economics will play a role and future oil prices will determine what resources are profitable to produce. Perhaps you expect future oil prices will be low? I think they will be over $90/b for most of the next 5 years and possibly 10 years, perhaps much more, this allows higher rates of profitable resource development. In my view my scenario is realistic and possibly on the pessimistic side. If oil prices remain unser $70/bo long term, then my scenario will prove too optimistic, I am skeptical that occurs prior to about 2035 and more likely around 2040.
Let’s take the 2018 estimate by Laherrere of World C plus C URR (about 2900 Gb) and average it with the estimate from 2022 (3500 Gb), that would be about 3200 Gb for World C plus C URR, my best guess scenario is about 200 Gb lower than that average, some would say it it too low. The USGS has TRR estimates for the World of about 3500 to 4000 Gb (this is C plus C including “continuous resources” of about 500 to 1000 Gb). By that measure my URR estimate would be quite low, but economics (low profits at low oil prices) will leave much of the continuous resource (as much as 90%) and a bit of the “pools” of oil (conventional resources) in the ground (assuming the USGS estimates are accurate.)
Dennis –
I’m thinking that now might be a good time to revisit your growth assumptions for the next 5-10 years.
It sounds like you are essentially conceeding any type of global peak beyond the one that already occurred, maybe I’m misunderstanding you but sounds like you think best case scenario is some type of double peak (2018 + 2028). In this case I guess we can take their average and call right now the peak (2023)?
I know that last year some of your models had US growth at 2 MBpD each year (part of it maybe related to post-covid rebound). The consensus among oil companies appears that little/no growth is forecasted for at least next 12 months (not sure what cause growth beyond that timeframe). Prices also headed the wrong way to support additional production…lots of headwinds at the moment…
Over 34 consecutive years, production grew from 55 MBpD to 84.5 MBpD. That’s an annual increase of 0.9 MBpD, if that trend continued we could expect to hit ~89 MBpD this year…we are about 10% below that -something is up!
Kengeo,
From 2020 to 2022 World C plus C output has grown by about 4 Mb/d (annual average output was about 76 Mb/d on 2020 and about 80 Mb/d in 2022. You are incorrect that I had US output growing by 2 Mb/d per year in any year from 2019 to 2028. In 2022 tight oil output increased by about 700 kb/d (average 2021 to average 2022), in 2023 I expect about 400 kb/d growth, about 200 kb/d in 2024, another 700 kb/d in 2025, 300 kb/d in 2026, 200 kb/d in 2027 and about 50 kb/d in 2028. I expect most of US growth will come from tight oil with GOM increases offsetting decreases from conventional oil and Alaska.
Great – This is a good starting point:
For US production (mb/d) does this seem reasonable? End of 2023 at ~12.5, end of 2024 at 12.6, end of 2025 at >13, and peak of ~13.4 in 2028?
Is this with certain oil price assumptions (>$70?)?
This would be around 2% annual growth from now until 2027, then drop off…seems reasonable if geology and economics agree…
End of 1Q23: 12,100 kb/d
e2Q23: 12,200 kb/d
e3Q23: 12,300 kb/d
e4Q23: 12,400 kb/d
e1Q24: 12,450 kb/d
e2Q24: 12,500 kb/d
e3Q24: 12,550 kb/d
e4Q24: 12,600 kb/d
e1Q25: 12,600 kb/d
e2Q25: 12,700 kb/d
e3Q25: 12,850 kb/d
e4Q25: 12,900 kb/d
e1Q26: 13,000 kb/d
e2Q26: 13,050 kb/d
e3Q26: 13,150 kb/d
e4Q26: 13,200 kb/d
2027: 13,300 kb/d
2028: 13,350 kb/d
Regardless, it looks like shale is no longer a swing producing market balancer that it once was…
Kengeo,
That’s not how I would do it. I would take Bob Meltz’s GOM projection (mid case) as a starting point and then look at US C plus C minus tight oil and GOM production and extend the trend from the 2015 to 2019 period and extrapolate that trend to estimate future US production added with my tight oil scenario and Bob’s GOM mid case scenario.
See Bob’s most recent post at link below
https://peakoilbarrel.com/gulf-of-mexico-update/#more-37130
George Kaplan has also done these scenarios in the past, the last I see is from 2017
https://peakoilbarrel.com/gulf-of-mexico-discoveries-reserves-and-production/
The last GOM futures post I find from Mr Kaplan is in 2020,
https://peakoilbarrel.com/gom-summary-part-v-possible-futures/
The chart at link below is of great interest, see link above for explanation
https://peakoilbarrel.com/wp-content/uploads/2020/10/GOMProj003-1.png
It would be interesting to hear the perspective of Bob, George or both on their views of future GOM output.
Kengeo,
Not clear where we call a peak in a plateau scenario and it is not clear it is of any importance, we could call it an undulating plateau from 2014 to 2035, the mid-point would be Dec 2023/Jan 2024 of that plateau, but this is a guess which has about a 100% probability of being wrong, so not worth a lot of energy arguing over. Much depends on the transition to electric transport which may affect oil prices and future economic growth which will also affect demand for energy and oil price, these developments are impossible to predict accurately in my view.
Also my scenario is not a “best case” (unclear what that is) it is my best guess of how things might play out and will be wrong with a best guess probability of 100%.
Kengeo,
Average annual output in 2018 was about 83 Mbpd. An increase of 818 kb/d (that’s the trend from 1983 to 2018 for average annual increases) would be 3200 kb/d over 4 years which would bring output to 86 Mb/d, also note that 2018 was above trend by almost 1000 kb/d, the trend has us at 85 Mb/d in 2022. Obviously the pandemic and war in Ukraine disrupted things and I do not expect World output will ever make it to 85 Mb/d, my expectation (or best guess) is roughly a plateau, at 81 plus or minus 3 Mb/d from 2014 to 2034, midpoint of plateau is 2024. (2020 and 2021 are outside of the plateau range due to pandemic)
Kengeo,
Since 1973 there have been 10 new oil peaks (I am using the centered 12 month average peak), the 2018 peak is simply one in a long line of peaks, it took 14 years for the 1979 peak to be surpassed, my best guess scenario has the 2018 peak being surpassed in 2026, so only 8 years, in part due to the disruption of the pandemic. My expectation is that the next peak may be the final peak, but maybe we will have to wait 15 years beyond that peak to know for sure (some time in 2043 perhaps).
Latest from Steven Kopits . Shale is now in decline and will remain so . H/T to OSB for posting it .
https://www.princetonpolicy.com/ppa-blog/2023/3/15/hi6novds423jhaiom6nq6hhy7rzl8m
Oil prices are falling and steel prices are staying high. Rig count likely to fall for the foreseeable future.
https://oilprice.com/Metals/Commodities/US-Steel-Prices-Surge-As-Supply-Fails-To-Meet-Demand.html
At risk of getting a whack from Mike S but still I am posting this . Connect this with Steve Kopits article above .
Don’t say you were not informed .
Art Berman and decline rates .
Interesting to how fickle the oil market is.
The drop in oil price over the past week seems related to the bank troubles.
These particular bank troubles have close to zero impact on national or global oil production or consumption prospects.
I probably have never used the word fickle before, but it seems to fit.
Hickory
I think this was Longs betting on oil heading back up to over $80 being hit with this black swan event and just dumping their positions. The oil market is bouncing back today.
I suppose that is what I mean by ‘fickle’…
price bouncing around in a large way just based on short traders and short term ‘beliefs’ about
what is happening, rather than being based on real factors affecting supply and demand.
I do feel sorry for those who have to make planning decisions based on this kind of silly system.
I think a possible answer is this.
If the banking sector gets shakey a lot of lenders will tighten belts and stop lending.
If they stop lending it leads to reduced growth in almost all sectors excluding possibly consumer staples (depending how bad it gets). In essence a recession would proceed from banking troubles.
Recession implies reduced demand for oil (and all energy sectors) hence the drop in price.
This is just a more verbose “humans are stupid” observation, though fickle is a nice word and needs more love. I agree, and the bank stuff starting with SVB is the hilarious merry-go-round of 2008 and 1929 all over again. Love to repeat the greatest hits of this dumb system and see the talking heads in media act astonished at what unfolds.
Ovi – agree, adjusted for inflation oil hasn’t been this cheap since 2020…
Doesn’t seem there’s any technical force to drive oil price below $80-$90 range…
My guess is oil starts running up soon, $80 by April, $90 by May, $100 by June and peak of almost $150 in August/September. Just a wild guess…
Anyone joining this event right now?
https://www.rff.org/events/rff-live/looking-ahead-unpacking-the-eia-2023-annual-energy-outlook/
RFF Live | Looking Ahead: Unpacking the EIA 2023 Annual Energy Outlook
EIA biggest update is they see max EV adoption at 15-20% over next 10-20 years…
Don’t remember what Dennis was modeling, but suspect it was a bit higher than that…
Kengeo,
Yes my model is very different. I guess the simple question would be why does growth in adoption of EVs increase rapidly in their model and then stop at either 13% in the low oil price case or at 28% in the high oil price case. Over time the cost of EVs relative to ICEVs is likely to fall, there will be more charging stations making them more convenient and range may increase. I expect that by 2050 close to 100% of the light duty vehicle fleet worldwide will be plugin vehicles with about 90% of those being BEV (not a plugin hybrid).
World wide plugin light duty new vehicle sales have been growing at about 42% per year from 2012 to 2021.
My model has 100% of new light duty vehicle sales being plugin vehicles by 2031, than it takes nearly 20 years for existing ICE vehicles to be replaced. I model the fleet leveling out at 1800 million vehicles with 900 million plugin vehicles reached in 2036. Heavy duty vehicles follow the light duty growth curve (proportionally) with a 10 year lag. Note that if self driving vehicles ever get approved for use, the number of light duty vehicles falls by a factor of 5 as few will choose to own a vehicle and will just use robotaxis and rent for vacations, or use a shuttle service plus robotaxis.
Global Oil Production Dropped To A 7-Month Low In January
Crude oil production worldwide fell to a seven-month low in January, dragged down by lower output in major producers Canada, Iraq, Russia, and Bahrain, data from the Joint Organizations Data Initiative (JODI) showed on Thursday.
Global oil production declined by 365,000 barrels per day (bpd) in January, which was the third consecutive month of falling output, showed the JODI data shared by the Riyadh-based International Energy Forum (IEF).
A month after the G7 price cap and the EU embargo on seaborne Russian crude imports took effect, crude oil production in Russia was down by 47,000 bpd to 9.98 million bpd in January. This was the lowest Russian output in three months and 277,000 bpd below the levels from January 2022, according to the JODI data.
Global consumption dropped seasonally in January and was only slightly higher compared to January 2022, the data showed, but it did not include January 2023 data for China.
Ron
It will be interesting to see if the January drop is the first of 4 that will result in a low in April 2023 as shown in the World C + C chart in the post
Has US Oil Drilling Finally Reached its Zenith?
A leading U.S. oil executive raised eyebrows last week, proclaiming the days of increasing oil production in this country are a thing of the past.
Maybe this time it will actually happen.
A myriad of other so-called “peak oil” predictions, some going back decades, all ultimately proved inaccurate. But now, Scott Sheffield, chief executive officer of Pioneer Natural Resources, said factors beyond merely finding more oil would constrain U.S. production growth.
“We just don’t have the potential to grow U.S. production ever again,” Sheffield told CNBC at CERAWeek, billed as the world’s annual energy conference.
1
“We don’t have the refining capacity.”
Predictions the U.S.— and indeed, the world—someday would start running out of oil date to at least the 1950s, about a century after Edwin Drake drilled the first oil well in August 1859 near Titusville, Pennsylvania.
2
Those predictions, though, generally focused either on the availability of oil in the ground or the boundaries of humankind’s ability to extract it—not on what to do with it afterward.
Innovative drilling techniques have repeatedly allowed energy companies to procure more oil than thought possible. But an array of market forces—ranging from promises to investors to the push for renewable energy—may finally conspire to cap the production threshold.
The resulting implications could reinforce the changing dynamics in the U.S. energy sector, which is already focusing somewhat less on finding and drilling for crude, and more on developing alternatives to fossil fuels.
As that happens, the sector’s burgeoning commitment to providing more stable shareholder returns may only intensify.
Ron – Not only has it, but it’s been (un)common knowledge for a very long time…
In fact, almost 15 years ago it was nailed down by the UK Energy Research Centre:
“…resource-driven peak in conventional oil production before 2030 appears likely, with a significant risk of a peak before 2020.”
Almost everyone who posts to the site agrees with this statement (even Dennis)…those who don’t either don’t understand it or may have other reasons/motives…
Queue the “Jaws” Theme song…
A slightly different Headline
US oil production will remain at ‘historically high volumes’ through 2050: New government report
But a new report released Thursday by an independent agency of Biden’s own government projects it will even be much much longer than that.
In fact, the 2023 Annual Energy Outlook from the Energy Information Administration (EIA) finds that U.S. oil production may even increase between now and 2050 even as clean energy sources like wind and solar power increase dramatically as well.
The analysts say that U.S. demand for oil and gas is likely to remain remarkably steady for decades and “we expect U.S. production to remain at historically high volumes as exports of finished products grow,” said Angelina LaRose, EIA Assistant Administrator for Energy Analysis, during a session Thursday around the release of the report.
https://finance.yahoo.com/news/us-oil-production-will-remain-at-historically-high-volumes-through-2050-new-government-report-211713075.html
Ovi,
From the Yahoo piece.
But the process is likely to be very gradual. In the EV space, for example, EIA analysts project that clean cars will only make up less than 20% of the overall automobile market in 2050.
The EIA analysis of the future EV market is seriously flawed in my opinion.
Consider that in Europe plugin vehicles were 25% of new light duty vehicle sales in 2022, up from an 11% share two years ago.
https://insideevs.com/news/651363/china-plugin-car-sales-december2022/
In China in 2022 plugin light duty vehicles were 30% of new car sales, two years ago the share was 5%.
https://www.statista.com/statistics/1029909/market-share-of-electric-cars-in-norway/
Consider also Norway where the share of plugin vehicles in new car sales has risen from 6% in 2013 to 86% in 2021, Norway plans to end sales of light duty ICEVs in 2025. California and Maryland also plan to end sales of light duty ICEVs by 2035, more US states may soon follow California’s lead.
This is a major flaw in the EIA’s analysis, the uptake of EVs is likely to accelerate. Especially if we consider the EIA’s reference case for nominal oil prices. See chart below and link below for greater detail.
https://www.eia.gov/outlooks/aeo/data/browser/#/?id=1-AEO2023®ion=0-0&cases=ref2023&start=2021&end=2050&f=A&linechart=~ref2023-d020623a.53-1-AEO2023&ctype=linechart&sourcekey=0
Also consider US light duty EV sales (BEVs only)
https://cleantechnica.com/2023/02/25/us-electric-car-sales-increased-65-in-2022/
Over the 2019 to 2022 period the trend in BEV sales growth has been about 42% per year on average over those 4 years. If we assume sales growth continues at 40% per year, annual sales would reach 16 million by 2031 (and 22 million by 2032), recent annual sales in the US for all light duty vehicles has been about 14 million per year and the peak was about 17.5 million, so potentially if EV sales continue growing rapidly (like Norway has done in the past) we could see close to 100% of new light duty vehicle sales in the US by 2031. Under that scenario a 30% EV share of the light duty fleet is reached by 2033, a 50% share by 2035, and a 100% share by 2049.
In 2022 Norway reaches a 25% share of plugin vehicles in Vehicle fleet by September 2022 up from a 5% share in December 2015. Note that there are many more good choices of EVs and plugins today than in 2015 to 2022 so growth could accelerate from what Norway has achieved historically.
Dennis
The EV market is still in transition and is being driven by subsidies. Until that sector begins to pay its fair share, it is difficult to use past increases to project growth. Germany has cut subsidies and that has also cut EV sales, dramatically.
“Registrations of new electric vehicles collapsed in Germany following cuts in buyers’ premiums at the beginning of the year.
Registrations for battery electric vehicles dropped about 83 percent to 18,100 in January from 104,300 in December, when many people rushed to receive the full subsidy, according to the Federal Motor Transport Authority (KBA).”
The other subsidy that will hit at some point is a road toll. Not sure how that will be implemented. For instance, a $500 fee when the car license is renewed could be imposed. That would turn off a lot of buyers.
I agree that the transportation sector will have to move towards more EVs, preferably Hybrids with 60 miles EV range. However it will occur through legislation and California has woken up and will allow PHEVs after 2035.
https://thedriven.io/2023/02/07/electric-car-sales-plummet-in-germany-following-subsidy-cut/
I have been tracking German car registrations for a while. Even if this year will be below the long term trend, it is pretty clear where we are heading. In 2026 most new cars could be full EVs already in Germany, if it continues as in the last 9 years.
Ashtorack , what you are doing is linear thinking . Try lateral thinking . You can’t get a better hole by digging the same hole deeper . Edward de Bono .
The source of Ovi’s chart above is How Biden is wrong about the future of oil. And underneath that chart reads: “SOURCE: S&P GLOBAL • PHOTO: GETTY IMAGES”. The text reads, bold mine:
S&P thinks global demand for oil will peak around 2031, as the chart below shows. But instead of plunging, as Biden seems to expect, demand for oil will more likely stay close to peak levels for years, maybe decades. Advanced economies are pushing hard for a transition to green energy, but it will take a long time to transform mature infrastructure not easily replaced without permitting fights and layers of opposition. Developing nations will adapt more slowly and burn more fossil fuels as they grow. Population growth, meanwhile, will mean more people driving, traveling and consuming energy.
There is confusion here, are they talking about demand or production? And the text reads like they are totally uncertain as to what is going to happen between now and 2040.
At any rate, this is all wild speculation. We all know just how accurate the EIA’s predictions have been in the past. I have no idea how accurate S&P Global’s predictions have beeen. Eyeballing the chart they show world production hitting 83 million bp/d this year and about 85 million bp/d next year. I call bull shit on that.
Ron,
Looks to me like about 83 Mb/d in 2024 and 85 Mb/d in 2026, I agree it is too optimistic for both supply and demand. From 2030 to 2040 we may see a fairly significant decrease in oil demand as the World transitions to electric transport, oil prices might be falling by 2035 and lots of oil resources will no longer be profitable to produce, much of the unconventional extra heavy oil will remain in the ground and some portion of conventional resource as well (particularly deep water offshore and Arctic oil will no longer be viable due to low oil prices). Much of this is a peak oil demand story.
Dennis, I may have been a little high for what the chart shows for 2023. The chart shows what they believe production will be at the end of each year. At the end of 2023, they have production of at least at 82.5 Million bp/d and at least 84.5 at the end of 2024. However, you have their 2026 production horribly wrong. Look at the chart again. They have 2026 production at about 87 million barrels per day.
Click on the chart to enlarge it, then place a line up from the 2026 mark and look again.
At any rate, the entire chart is laughably wrong. They appear to think there is twice as much oil left in the ground that what the vast majority of oul geologists believe.
I agree
So S&P Global , in their chart ‘Oil isn’t Going Anyway’
seems to think that oil depletion has been repealed.
Don’t they have an editor?
What are these guys smoking? Oil Prices cratering definitely means Drilling Rigs coming off quickly……… Do they really get paid to make ridiculous predictions. Even with much higher prices, production will not stay this high. Shale Drilling Locations are finite!!!!
EIA corrects data and hammers shale production.
https://www.zerohedge.com/commodities/new-eia-report-reveals-massive-downward-reductions-us-shale-oil-output
From the link:
“It shows simply massive downward reductions in US shale oil output. In the March report, shale oil output from the key plays is reduced by 443,000 bpd for January and 250,000 bpd for February. If we go back one more month to the January DPR, shale oil production has been reduced by 542,000 bpd for December 2022. This is a huge revision, more than 4% of total US crude and condensate production over a two month period.”
This was before oil prices fell $10 this past week…
These revisions are big. If true then US LTO has peaked, which means US has peaked. Because these production levels are coming from decisions made last summer and fall when oil prices were $30-50 higher, due to the 5-6 month time lag. It looks like there could very well be a half million barrel drop in US production this year rather than a rise.
Production down, price down and yet WTI is in contango. WTI is still in contango after another $10 drop in price.
Sounds like economy isn’t doing very well. I can already hear the oil bulls saying that this has to be a bottom or close to a bottom and prices can only go higher. 😂
Or don’t worry the FED has tools to fix whatever banking issues we might have and everything will right itself in a week or two and oil will be back at $100 by year end.
No. Oil is going to $25 maybe lower.
HHH,
You have been making that call for a while, if we wait long enough you may be right. Perhaps in 2045.
Dennis I think you live under a rock and have no idea what goes on in real world around you. I can’t argue with someone as ill informed as you because it’s pointless. 2045 it is then.
HHH,
My view is the main stream view. We will see in the future who is more correct.
I will note you have been bold in your $25/bo prediction, but I have also noticed that since you got your March 2023 prediction so wrong you have been pretty shy about offering a new date. The futures market has oil at about $50/bo in 2033, you should buy some options if you think you are correct, you could make some money. I think you would be left naked. We will see.
Maybe I have missed it, but is $25 an average price for a period of time?
We are resigned to oil prices being extremely volatile. That is why we have been hoarding cash and not drilling wells.
What is important to me is the price for the next 10 years, not a yearly low or even a one year average.
I’m feeling a lot better this crash than prior ones. We survived 2015-2020 and hoarded cash. We can now survive extremely low prices for a very long time.
It is annoying, though, this ridiculous oil market.
I’m of the opinion that what we are entering will be far worse than 2008 was.
I’d say lower oil prices that last longer. 5-10 years of low oil prices.
You have to understand central banks don’t matter. Bank reserves aren’t a substitute for actual money. They aren’t lenders of last resort like they say they are. If they were they’d print the money and it would be end of story. You’d not see it in the news anymore.
Only way I see Credit Sussie surviving is with taxpayers money. And Switzerland’s tax base is likely not large enough. So bank run will continue regardless of if UBS takes them over or not.
Credit Sussie will be taking down the rest of the large banks in Europe with it. I’d love to see the details of their derivative book and who is exposed.
IMHO, the smart investors are hoarding US dollars.
Wealth is made by buying assets for 10 cents on the dollar.
Debt default is baked in, as is Peak Oil.
You can get whiplash looking at inflation vs deflation.
Inflation is a huge problem in US, etc because it can topple a government.
But deflation will win out in the end.
Well, that would be more than annoying.
So people in developed countries will be starving?
Part of the problem is banks are hoarding US dollars. Not wanting to lend them to each other. But there is good reason why they don’t want to.
https://www.fool.ca/2021/03/05/warren-buffett-why-hes-sitting-on-roughly-140-billion-in-cash/
Warren Buffet is hoarding cash.
You got to give it to Warren. He is 92 and still counting every penny.
Maybe it was in his genetics? me thinks!
Overall HZ rig count was down by six. Much rig movement among basins. Texas was the big loser, down 11
Below is the movement of rigs between basins. EF down 8. Permian up 7. A drop of 6 in “Other”
The Banking Crisis May Cause US Oil Production to Decline
Pimco: U.S. oil, gas production may decline amidst multiple banking crises
(Bloomberg) — The turmoil engulfing banks, including Credit Suisse Group AG, threatens to curb U.S. oil and gas production, sowing the seed for future imbalance, according to a Pimco managing director.
The combination of tightening credit conditions and lower energy prices has the potential to constrain U.S. driller spending, or lead OPEC+ to review their output targets, “altering the forward outlook for oil and gas supplies in a non-trivial way,” Greg Sharenow, who manages a portfolio focused on energy and commodities at Pacific Investment Management Co., said in an interview Wednesday.
U.S. oil futures plunged to levels not seen since December 2021 on Wednesday as worries over the fate of Credit Suisse, following the collapse of some U.S. banks, fueled fears of a financial crisis. The drop comes at a time when U.S. producers, reaping an unprecedented cash bonanza, have opted to spend more on dividends and share buybacks than on capital projects.
“At these price levels, one would expect to see the U.S. no longer grow,” Sharenow said. Energy traders are still contending with assessing the risk of a potential recession and its impact on demand for energy and other commodities, he added. “That’s probably the first-order biggest issue.”
I love this economic system.
Kleiber , I love it too . I thought in 2008 it was the end of it . However they gave us another 15 years of BAU . I hope they can pull off another one ( low probability ) , it would be helpful .
Here is the latest on Credit Suisse.
https://www.zerohedge.com/markets/ubs-seeks-government-backstop-it-rushes-finalize-credit-suisse-takeover-deal-soon-tonight
My view on that is what happened to their central bank the SNB being all powerful and enough to stop any bank run?
Oh yeah all SNB has is bank reserves.
Even if UBS takes over Credit Suisse that doesn’t solve any of the problems. My guess is deposits will start leaving UBS as soon as they ink the deal if not before.
Guess we will find out next week. Hopefully I’m wrong. But in the case that I am right. Next few weeks could be really ugly for not just the price of oil but for the price of most everything.
If this goes down the ECB and FED will also be exposed as not being all powerful too.
Got dollars? Got collateral?
Yield curves has been flashing red for a year. They don’t say what or when. What they do say is there is an extreme amount of hedging going on. Now we know why.
New posts are up
https://peakoilbarrel.com/opec-update-march-2023/
and
https://peakoilbarrel.com/open-thread-non-petroleum-march-18-2023/