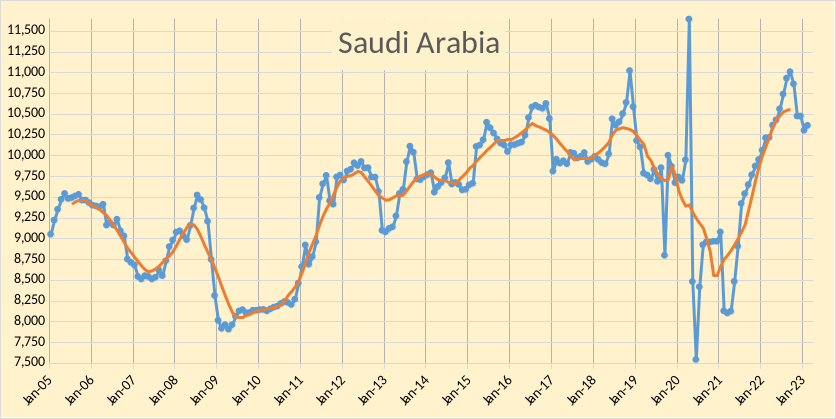
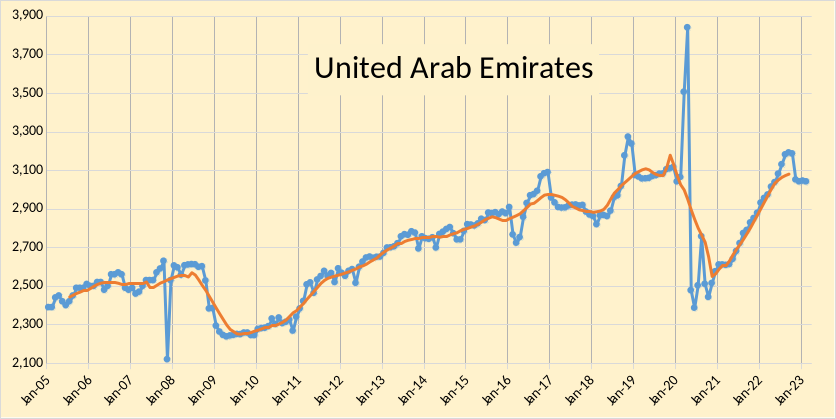
The OPEC Monthly Oil Market Report (MOMR) for March 2023 was published recently. The last month reported in most of the OPEC charts that follow is February 2023 and output reported for OPEC nations is crude oil output in thousands of barrels per day (kb/d). In many of the OPEC charts that follow the blue line is monthly output and the red line is the centered twelve month average (CTMA) output.
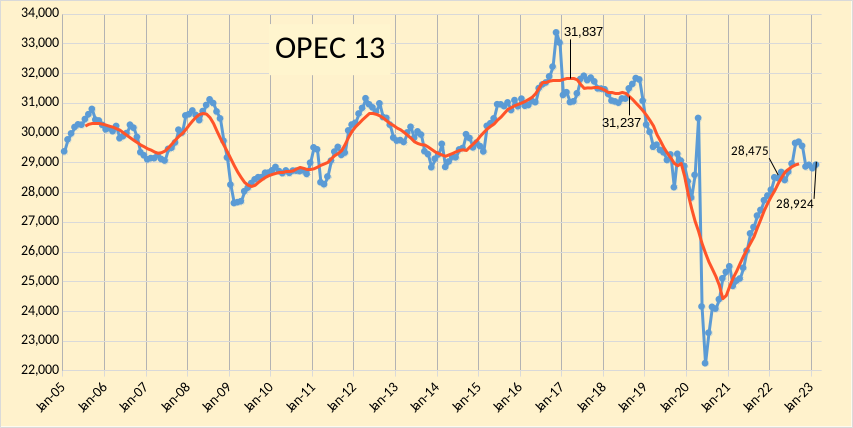
OPEC crude output was revised lower in January 2023 by 69 kb/d compared to last month’s report and December 2022 OPEC crude output was revised lower by 7 kb/d. When the World was at its centered twelve month average peak for C+C output in August 2018, OPEC crude output was 31237 kb/d (as shown on the chart), February 2023 OPEC crude output was 2313 kb/d below that level. The centered twelve month average (CTMA) peak for OPEC crude output is also shown on figure 1 (31837 kb/d) which is 2913 kb/d higher than February 2023.
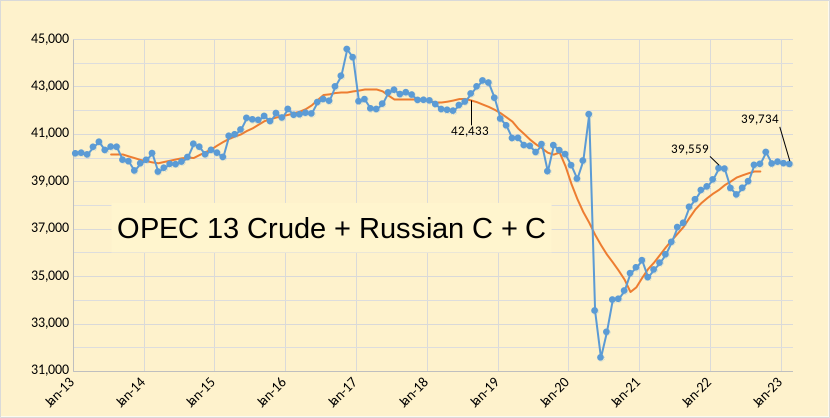
In the chart below we have Russian C + C and OPEC crude oil output. The centered 12 month average (CTMA) of output for OPEC13 crude and Russian C+C was 42443 kb/d in August 2018 when World C+C output was at its centered 12 month average peak, output for Russia and OPEC was 2699 kb/d below the August 2018 CTMA at 39734 kb/d in February 2023. In the past 12 months OPEC and Russian output has increased by 175 kb/d from 39559 kb/d in February 2022.
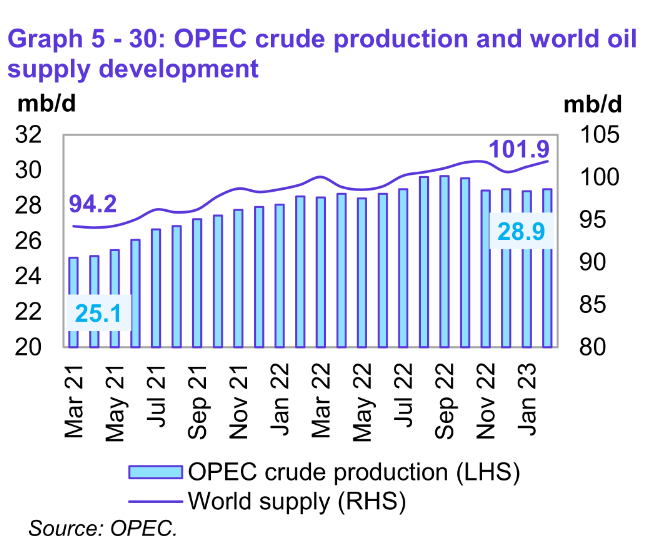
Based on OPEC estimates, World Oil Suppy (all liquids) was 101.9 Mb/d in February 2023 7.7 Mb/d higher than output in March 2021, OPEC crude oil output increased by 3.8 Mb/d over the same 23 month period. World C+C output was 76 Mb/d (EIA estimate) in February 2021 and over the Jan 2021 to November 2022 period World C+C was about 80.6% of World total liquids output (based on EIA estimates). Assuming the ratio of World C+C to total liquids has remained close to the level of the Jan 2021 to Nov 2022 period we can estimate that World C+C might be around 82.1 Mb/d in Feb 2023. This suggests that World C+C may have increased by roughly 6 Mb/d over the past 23 months. This is about 200 kb/d higher than the EIA estimate for November 2022 (81.9 Mb/d).
The OPEC estimate for demand for OPEC crude in 2023 is forecast to be 29.26 Mb/d, about 160 kb/d lower than last month’s MOMR estimate. If OPEC can return to the 2022Q3 level of output (29.4 Mb/d) and its demand and supply estimates are accurate, then oil prices may remain subdued in 2023. I think their supply estimates for non-OPEC output may be too optimistic and expect oil prices will rise. If there is a severe recession in 2023 worldwide, oil prices may remain under $80/bo.
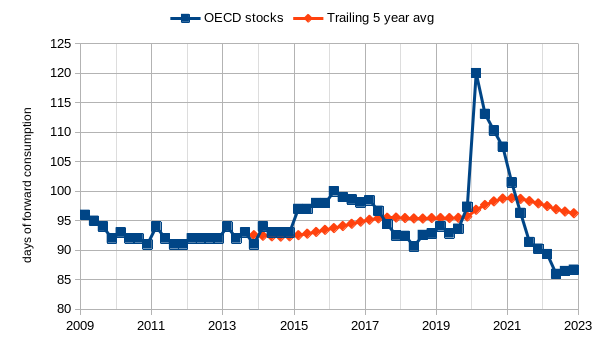
OECD oil stocks are at about 87 days of forward consumption, close to the low point since 2009. Visibility for World oil stock levels is not good which might be part of the reason for recent oil price volatility.
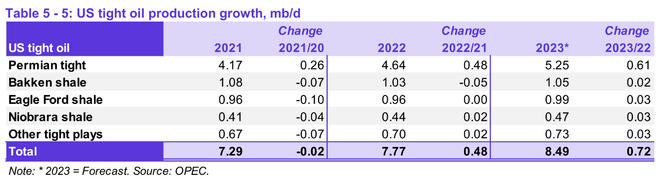
OPEC expects US tight oil will increase by 720 kb/d in 2023 compared to 2022 (annual average output for both years), with most of this coming from the Permian basin (610 kb/d). This is a downward revision from last month’s MOMR estimate for US tight oil by 30 kb/d for all of US tight oil and 10 kb/d for the Permian basin. My most recent model for US tight oil has the increase from 2022 to 2023 (annual average output for each year) at about 394 kb/d for all US tight oil, with about a 399 kb/d increase in the Permian basin.
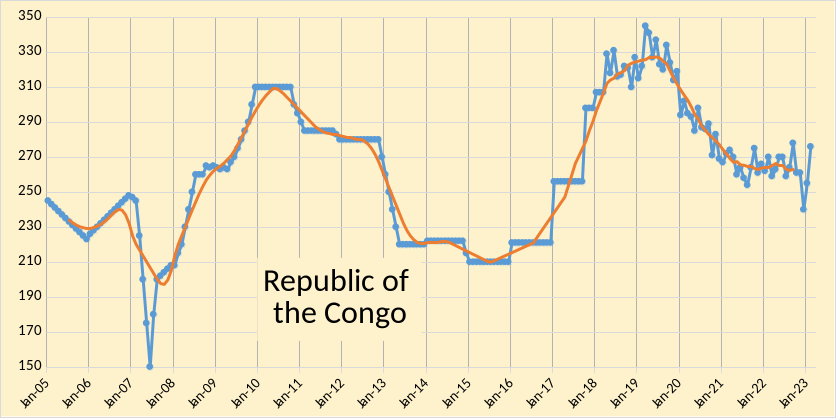
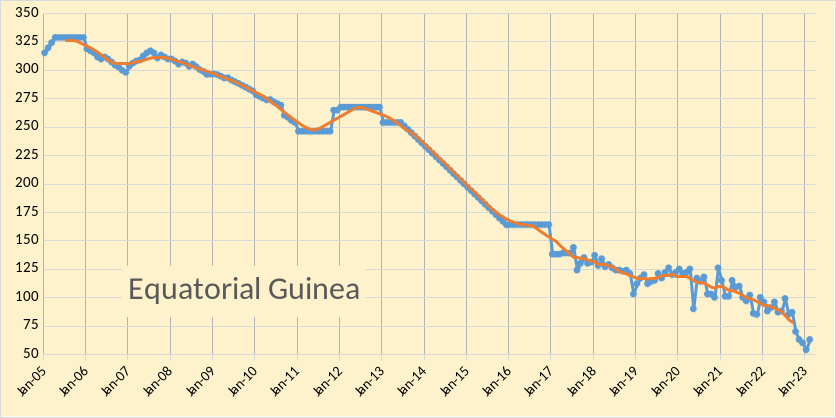
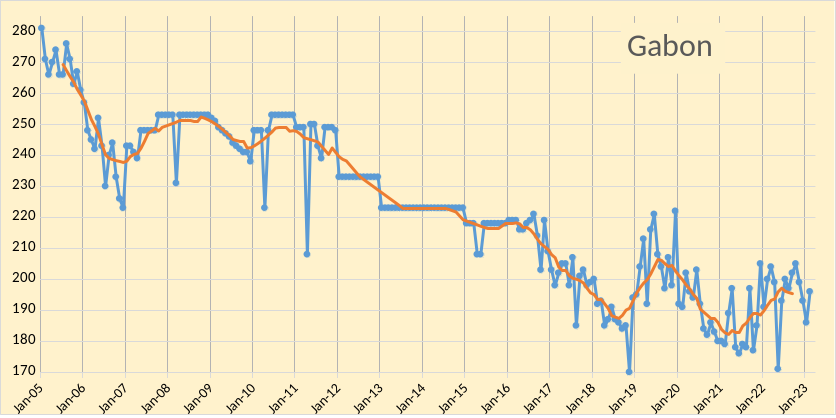
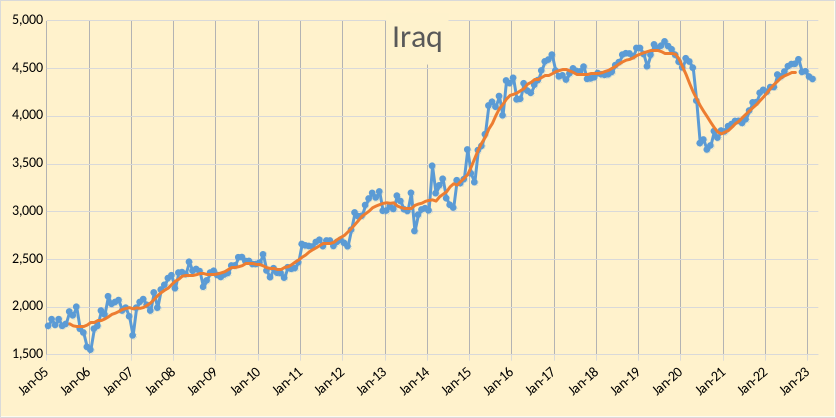
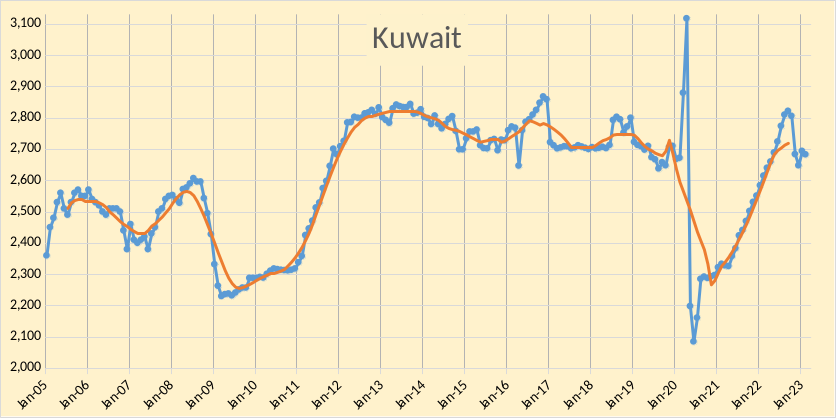
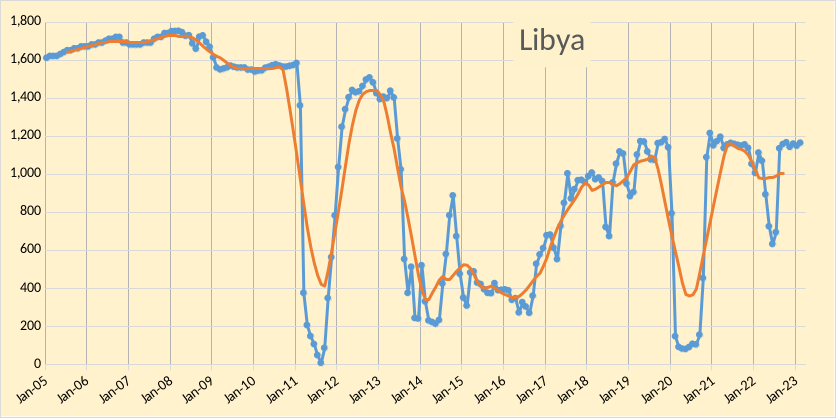
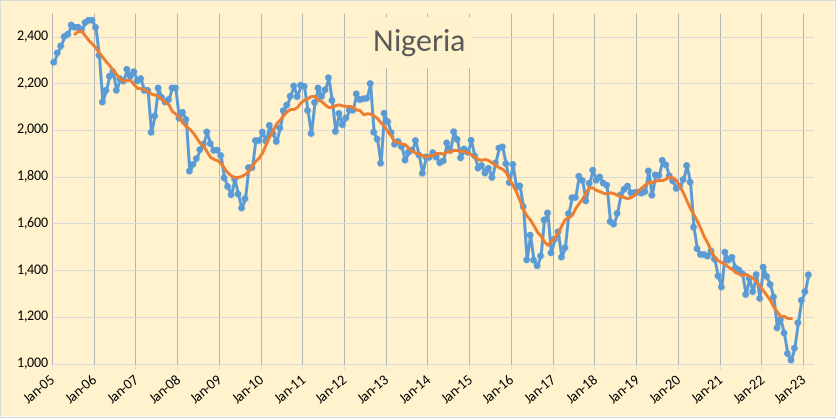
A final note on comparing the top 6 OPEC producers in 2015 (Big 6 are Saudi Arabia, Iraq, UAE, Kuwait, Iran, and Venezuela) with the “Other 7” OPEC producers. The chart below has the Big 6 plotted on the right axis with the Other 7 plotted on the right axis. Notice that the scale from minimum to maximum is the same on both axes (that is the difference from the largest to lowest number on each axis is 12000 kb/d), this allows the slopes to be visually compared more easily. The vertical scale on each of the following 4 figures is the same (maximum minus minimum is 12000 kb/d).
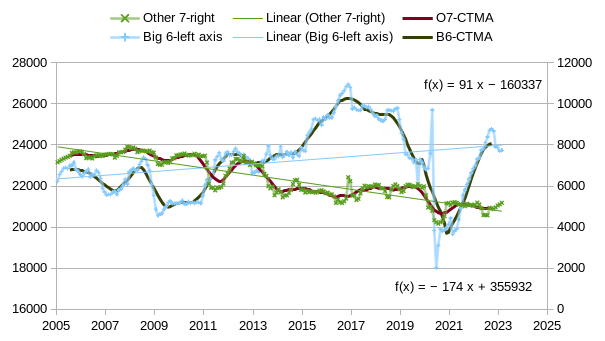
At first glance it appears that OPEC output might continue to decline in the future as the net of both slopes is -83 kb/d per year over the Jan 2005 to Feb 2023 period. Note the sharp decrease in the Big 6 line especially after 2018, before the pandemic began. A possible explanation is revealed by plotting the Big 4 which includes Saudi Arabia, Iraq, UAE, and Kuwait.
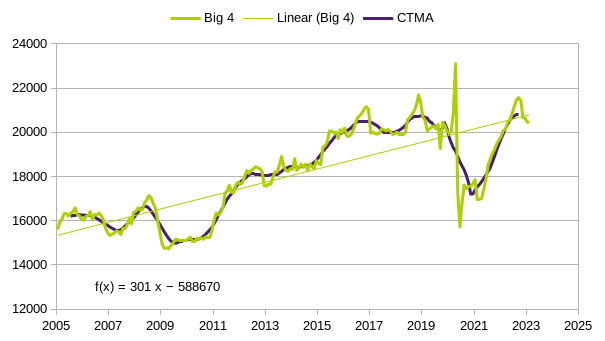
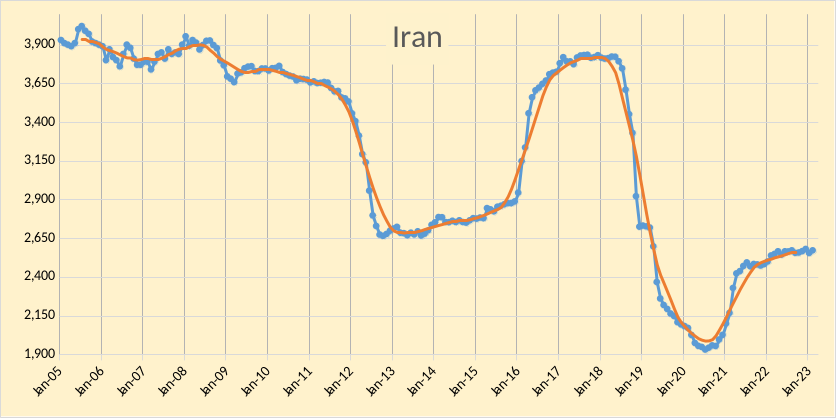
For the Big 4 the CTMA peak is the final point to the right and the trend from Jan 2005 to Feb 2023 is an annual increase of 301 kb/d. In 2018 the US imposed severe sanctions on both Iran and Venezuela and caused a severe downturn in crude oil output in both nations. This was in part a result of the Trump administration believing the Saudi America story which led to poor policy decisions. The chart that follows shows combined Iranian and Venezuelan output.
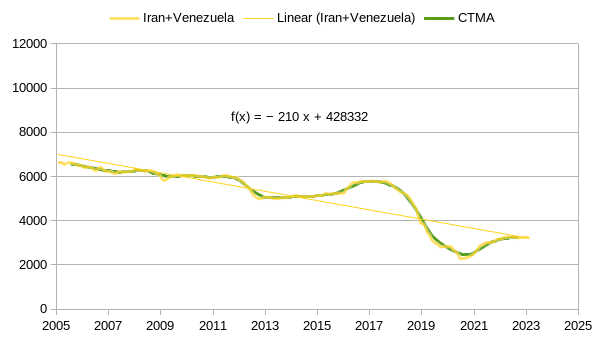
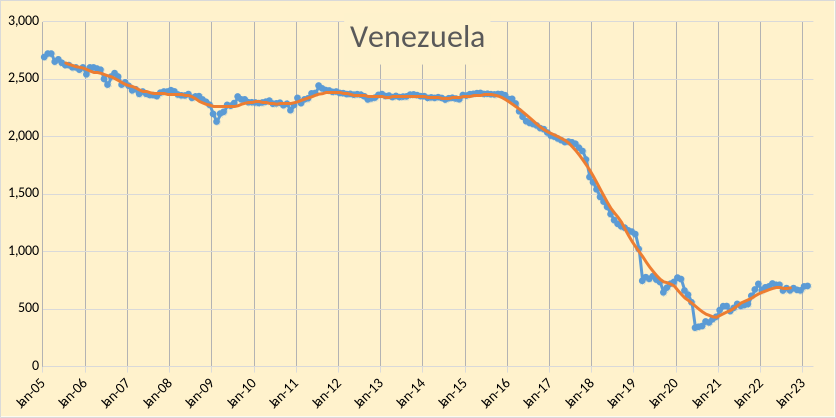
Venezuela plus Iran had been declining slowly for many years from 2005 to 2017 (most of this was Iran up to 2017), then a steep decline from 2018 to 2020 due to sanctions plus the pandemic and now output has stabilized at about 3200 kb/d. Output is unlikely to deteriorate much further and is more likely to increase slightly over the next 5 to 10 years as sanctions may be gradually lifted (or nations may find ways around the sanctions). The main point is that the annual decline rate of 210 kb/d for Iran and Venezuela is likely to change to zero or become a slight increase in annual output. In addition higher oil prices may lead to more development of OPEC resources in the Big 4 (or Big 6 with sanctions relief) which could lead to higher OPEC output. Even without higher rates of resource development I would expect OPEC could raise output by at least 125 kb/d annually over the next 5 to 10 years.
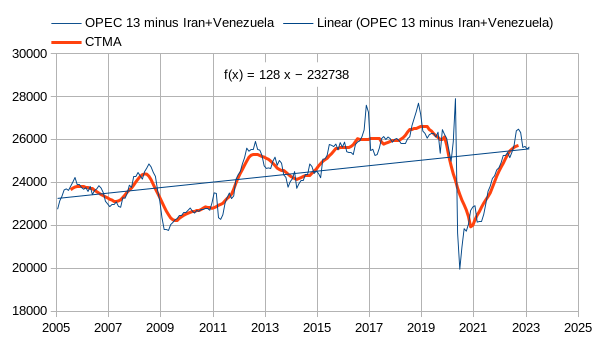
If we consider OPEC 13 minus Iran and Venezuela as in figure 12, we see output increased at an average annual rate of 128 kb/d per year over the Jan 2005 to Feb 2023 period, if that rate continues in the future and Iran and Venezuela simply maintain their Feb 2023 output, then OPEC minus Iran and Venezuela would return to the level of Jan 2019 (the CTMA peak of 26620 kb/d), OPEC 13 would be at 29891 kb/d. This would be 1946 kb/d below the all time OPEC 13 CTMA peak. At the rate of increase shown on the chart it would take 7.5 years for OPEC to reach that level. Note that the pandemic had a significant impact in the rate of increase, prior to the pandemic from Jan 2005 to Dec 2019, the rate of increase for OPEC minus Iran and Venezuela was about 248 kb/d per year. It seems unlikely that OPEC returns to its previous peak unless Iran and Venezuela increase output which also seems unlikely at present. OPEC crude output may not breach 30,000 kb/d in the future, unless OPEC accelerates the development of its oil resources.
264 responses to “OPEC Update, March 2023”
I think it is likely OPEC peaked in 2016 while OPEC less Iran and Venezuela peaked in 2019. But the plateau began in 2016 as the red line shows.
But we could really draw the line anywhere. Lines mean nothing. It is just silly to believe future production will follow the lines we draw. All we have is our best guess. My best guess is OPEC 13 peaked in 2016 and it’s all downhill from here.
Ron,
I agree there are many different lines that might be drawn, I also think it likely that the OPEC peak may be in the past, but a high oil price environment long term (over $100/bo) and/or a recovery in Iranian oil output (as was seen recently in 2016 to 2018) might get us pretty close to that previous centered twelve month average (CTMA) peak in early 2017. We might also see a long undulating plateau (at 29 to 31 Mb/d) in OPEC output for 20 years, followed by decline.
Ron – Agree, here’s my take on it using Dennis’ chart…even assuming the largest possible values for URR (>3000 Gb) we are still past the 50% point…the only thing a plateau would accomplish is a much steeper drop somewhere down the road…so the longer we maintain course the worse the cliff becomes…it’s truly impressive that tight oil bought us 15 years…but depletion never sleeps…
Hey Dennis, maybe the market is well supplied and the world is more efficient today than most of us believe. More efficient vehicles and manufacturing, less commuting, front door delivery’s, Europe changes, Russian economy, war and China Covid slow down. Maybe we’re past peak demand.
I don’t think Venezuela, Iraq and Iran are geologically constrained. Iran could increase production by 4mbd and Venezuela, Iraq could add 2mbd each for 10 years pretty easy.
Huntingtonbeach,
Eventually demand bay become the constraint on further output growth, but I don’t expect that until 2035 or so, I am also less optimistic that OPEC can raise output significantly in the short term, I think 30 Mb/d is the current limit without sanctions relief for Venezuela and Iran, perhaps high oil prices will change US policy as the SPR has limited capacity so further draining of the SPR will no longer be an option.
Dennis
Nice job.
The question of what to do with Venezuela and Iran in charts is always a problem because their past does not reflect their essentially unchanging flat current output since January 2022. We might see a small increase in Venezuela now that Chevron is allowed to produce oil there.
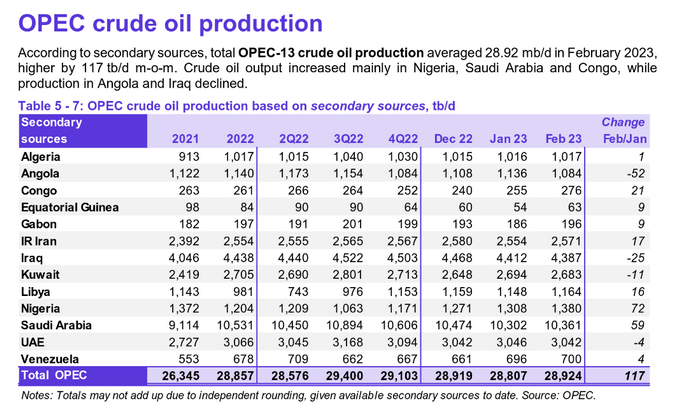
Attached is the latest table from the IEA that shows February production and effective spare capacity in the last column. Assuming those numbers are correct, and if the 3,320 kb/d of spare capacity is added the the current OPEC 13 production of 28,924 kb/d, total OPEC 13 production is 32,244 kb/d. This puts OPEC production barely above the 32,000 kb/d reached in mid 2017 and late 2018.
The biggest spare capacity increases come from SA and the UAE. Neither one has demonstrated the ability to produce at those IEA levels for more than one month. Both have reached slightly lower production in early 2020 as shown in your SA and UAE charts. In a stretch I could see SA spare capacity in the 1,000 kb/d to 1,250 kb/d range and the UAE in the 500 kb/d range. So I think a more realistic OPEC spare capacity estimate is in the 2,000 kb/d range, which would put max OPEC production at 31,000 kb/d about two years from now if demand starts to pick up.
Ovi,
Thanks.
I agree with your assessment, but only if we assume on major new developments in OPEC big 6, especially the Big 4 from my post and low long term oil prices (defined below). UAE and Iraq have claimed in the past they could raise output with new investment, it seems likely that Saudi Arabia and Kuwait might be able to do so as well. We may find out if the predictions of $100/bo oil prices prove correct, note that the recent EIA AEO reference case has nominal oil prices over $100/bo for WTI for most of the 2023 to 2050 period. A lower long term oil price environment (nominal oil prices under $70/bo) would be more consistent with a max OPEC capacity of 31 Mb/d.
Dennis
Yes there could be some increases from Iraq, SA, Kuwait and UAE but it will take time to bring on the new capacity, in the order of five years. In the meantime world and OPEC decline continues 24/7.
Note that SA states that Ghawar declines at 2% per year, even with infill drilling. I wonder if that is a reasonable assumption to assume for the other big OPEC countries.
Provided demand picks up over the next six months, which I believe it will, we will begin to see how the supply side reacts to this stress.
Since I believe we are close to peak production, I think the only meaningful lines to draw are from 2018 and going forward. World production, excluding the U.S., entered a new slower growth production phase in 2018.
We are staring down a very serious financial crisis with a financial system which can’t even handle 5% interest rates in the western economies. Chinas economy doesn’t look bright either so where is the demand coming from?
Ovi,
Some nations decrease and others increase, not clear why we would ignore data prior to 2018, data after 2018 is affected by sanctions, pandemic and War in Ukraine, so not clear it provides much information. In chart below blue line is CTMA.
Dennis
Attached is a world C + C chart starting in 2010. I am not going to put any lines on it but to my eye, it appears to be in a topping pattern after 2016. Your chart shows the same plateauing trend after 2015. Current world November 2022 production is close to 1,000 kb/d below the November 2016 level.
If you check Ron’s World W/O US chart below, you see a very flat plateau at 72,000 kb/d starting in 2016.
Also attached is the Rystad discovery chart from 2015 and on. No big oil discoveries and always less that what was consumed.
So IMHO there are a numbers of indicators showing world oil production entering a plateauing phase after 2016. So without significant discoveries, use of past production, i.e. back to 2010, to predict future growth is not realistic.
‘Bumpy plateau (over 80 mbpd) through the end of the decade, roughly.’
I can autograph copies of this, out at a table around the side entrance.
Ovi,
I expect slower growth than 2010 to 2019 in the future, but the “top” you see is a result of several events, oversupplied World oil market in 2018 and then the Pandemic in late 2019. I think there will be further growth. Note that there are a lot of discovered resources yet to be develoed and there is likely to be reserve growth if oil prices rise and potentially more discovery. There is quite a bit of unconventional resources yet to be developed, take Canada for example where only 19 Gb of 161 Gb of Canadian oil sands proved reserves are under active development as of the end of 2020 (according to BP Statistical Review of World Energy.) Similarly only a small proportion of Venezuela’s unconventional resources have been developed. Much of this resource might never be developed, if oil demand peaks by 2035 as I expect, but the resource is there.
Ovi,
We could use a short time frame. Such as the following chart, but I think the answer is not very realistic.
Ovi,
I agree using 2015 to 2019 may make sense, but note that using that period when oil prices were low, might not predict future growth very well. The 2011 to 2014 period was a period with higher oil prices, if we see higher oil prices for a sustained period, we may see higher growth rates than 2015 to 2019. Remember also that OPEC plus was reducing output in 2019. So 2015 to 2018 may be more accurate for future growth in a low oil price environment.
Rystad Discovery Chart
From the OPEC Monthly Oil Market Report
For 2023, Russian liquids production is forecast to drop by 0.7 mb/d to average 10.3 mb/d. Annual growth is revised up by around 152 tb/d from theprevious monthly assessment, due to higher-than-expected production in 1Q23 (although production projection for remaining months of the year is maintained as projected last month). In addition to a number of planned start-ups this year, by Lukoil, Gazprom, Novatek, Sigma Energy and others, it should be noted that Russia’s oil forecast remains subject to high uncertainty due to geopolitical developments in Eastern Europe.
U.S. shale drillers “well prepared” to manage potential credit crisis Bold mine
(Bloomberg) – U.S. shale explorers are well prepared to manage a potential credit crisis after piling up cash and paying down most of their debt, according to private equity firm Kimmeridge Energy Management Co.
“I don’t think the upstream business has ever been in better position for a downturn than it is today,” Kimmeridge managing partner Ben Dell said in an interview. “We’re heading to being essentially debt-free as an industry.”
The shale industry has historically been heavily reliant on loans secured by their oil and gas assets, stoking concern that the turmoil engulfing the banking sector will cut off drillers’ access to credit. Fears of a recession, meanwhile, are weighing on fuel prices and threatened to erode profits after a two-year bonanza.
But shale drillers have made a strategic shift in recent years from reckless spending and unchecked output growth to strict capital discipline. The new business model could help shield the industry from the fallout of a credit crunch.
SNIP
Record costs from a shortage of labor and supply-chain snarls are contributing to a slowdown in production growth from the U.S. shale patch. Explorers are also running out of top—tier acreage. In recent weeks, some of the biggest U.S. oil companies have reaffirmed plans to keep growth low this year.
“If you grow, you accelerate your inventory problem,” Dell said. “Until capital comes into the space, until multiples expand, there’s actually no real incentive to grow.”
GET READY FOR EVEN LOWER OIL & NATGAS PRICES….. FOR DUMMIES
Here is a chart that energy investors need to look at. While Europe faced certain Energy Death Last Year, it survived due to three factors:
1) Very Warm Winter
2) Green Energy Outperformed
3) Cut Back On Natgas Demand & higher LNG Imports
Due to these reasons, Europe’s Natgas inventories are now 110% higher than they were last year. Furthermore, if the current trend continues… then Europe WILL NOT NEED any more NATGAS by the end of August… inventories will be completely full.
If this is true… what will that do to Natgas prices?
steve
Steve
Maybe this just means they have more than enough for heating. Maybe the big chemical plants like BASF and Bayer can restart their chemical factories.
I think Germany’s chemical demand is much bigger than heating demand.
Ovi,
Maybe… however, with the United States Natgas Inventories at 5-year highs at this point, and we are now we are heading into the Spring Surplus-Storage mode, I don’t see this as BULLISH for NATGAS either.
The next 1-2 quarters going to be quite interesting.
steve
Steve
I wonder what will happen to US NG storage as the Freeport LNG plant comes back online and the second and third liquefaction trains start up.
By the way, I am not a NG bull.
OVI,
Here are some points to consider. While it is true that Freeport LNG will come back online at Full Capacity shortly, it will be shipping 2-3 more LNG tankers per week. It is currently doing one tanker.
However, total U.S. Dry Natgas production increased by 5-6 bcf/d (101 bcf/d vs 94 bcf/d), compared to the same period last year. Thus, Freeport coming online at Full capacity won’t use up all of this extra natgas supply. And then we have U.S. natgas consumption soon falling to lows during the Spring.
If we continue to see U.S. natgas inventories increasing more than the 5-year average highs, even with Freeport online, then it will be bearish for the Natgas price in the short-term (1-2 quarters).
steve
Steve , here is a website that you can consult for daily gas storage etc in the EU . I look for stock/consumption ratio .
https://agsi.gie.eu/
also
https://gas.kyos.com/gas/de
Hole,
Thanks… I use the first link, but not the second one. I’ll check it out.
steve
World Less USA seems to be stalling. This data is through November 2022. Look for December and January to drop.
Ron,
World output is the important number, why leave out the US, last I checked it was on planet Earth?
Dennis
US production from November 2016 to November 2019 increased at a rate of 1,270 kb/d/yr. Going forward US production will increase at something less than 500 kb/d/yr. That is why it is important to ignore US production over the period 2014 to 2020.
No other country has ever increased production at the US rate over those three years and I don’t think that the US will do that again.
Ovi,
Over that same period Nov 2016 to Nov 2019, Iranian and Venezuelan C plus C output decreased at an annual rate of 1212 kb/d. This also is not likely to be repeated. A better chart looks at World C plus C minus US, Iran, and Venezuela.
Dennis
Attached is the same chart as yours but I have added your favourite CTMA. It tells the same story. Plateau after 2016.
Just noticed that Ron put up the same chart. Great minds …..
Ovi,
What has happened after every plateau in World C plus C output from 1973 to 2017? Perhaps history may repeat, until 2030 or so.
Ovi,
The CTMA should only be included for the points on your green line, that would exclude the last 5 points on your red line, also the first 6 points on the red line at the left of your chart should also be left off. Notice that this is the case with all of my charts that include a CTMA.
Dennis
New plateaus came because new fields were discovered and came on line. LTO also came on line. Discoveries have been meagre since 2015.
The CTMA graph is correct. They used data before and after what is shown on the chart.
Ovi,
I understand it is correct, but the proper way to chart a CTMA and monthly data is to show all the monthly data that is used to calculate the CTMA on the chart, in my opinion.
Note that in every chart that shows a CTMA, that is how I do it.
On plateaus, some of it is discoveries, some of it is the rate of development, some of it is war and politics, some of it is the price of oil, in many cases “peak oil” has been claimed and then something not foreseen occurs and oil production continues to rise. I do not think we know what will happen, we might see a long plateau, we might see a slight increase or we might see a small decrease. Historically my best guesses have been wrong on the low side, except for major unforeseen events such as the Covid-19 Pandemic. Perhaps this time will be different.
Dennis
I think the important thing is that a CMTA is calculated correctly. Not quite sure why one has to show empty starting and end points.
Also I am not a fan of adding CTMA to every chart, I find it adds nothing except confusion to the eye. Also in some cases it looks totally ridiculous, especially at the current time when dealing with the covid crash.
CTMA must be used in the context of trying to make a point or clarify a discussion. If one is discussing peak oil, should it be by month or a 12 month average, CTMA adds value to that discussion.
In the case of my chart above, it is difficult for the eye to sort out the volatility of the monthly data from January 2015 to 2020. The CTMA in that case helps to clarify what happened on average over that period. It nicely show that production was essentially flat.
Not being critical, just expressing my view that graphs should be kept as simple and clear as possible and relevant to the discussion.
Ovi,
You are welcome to do your charts how you like and I will do the same. I prefer the centered twelve month average because it lines up better with the monthly data and avoids the 6 month shift to the right that we get with a trailing 12 month average, but if we are going to use the 12 month average and also show the monthly data, it seems clearer to me to show all of the monthly data that is used to calculate the 12 month average shown on the chart. To me, Ron’s chart is more enlightening than yours in my view because all monthly data used to calculate his 12 month average is shown on his chart.
Ovi,
Remember that real oil prices were relatively low from 2015 to 2022, compared to 2011 to 2014. Higher oil prices might change the future rate og growth.
Dennis, I have said it before and I will say it again: Your charts are designed to obscure rather than to enlighten. You deliberately stopped your data at November 2019. Why?
My chart below clearly shows that the World oil production without the USA, Iran, and Venezuela seems to have stalled at over 2.5 million barrels per day below the monthly peak and one million barrels per day below its 12-month average. The data is through November 2022.
Of course, the decline from Iran and Venezuela will not be repeated. The decline will be in the rest of the world. And US shale will not be there to make up the difference.
Click on the chart to enlarge it.
Ron,
It stopped at 2019 because it was intended to show the prepandemic trend.
Obviously output went down sharply during the pandemic and then has recovered sharply. I expect it will reurn to the prepandemic trend within 18 months and then might follow that trend for 5 years or so.
Note that output has plateaued many times from 1973 to 2022, followed by an increase in output. Yes output is currently below the 12 month peak, output is likely to increase in future.
Dennis, I was just showing that world production without the USA has declined by about three million barrels per day since the 2016-2018 plateau. Now that the general consensus is that the USA has peaked, or is about to, that without the USA’s input world oil production is in deep shit.
Yeah, and what Ovi said in the above post.
Quick to judge, quick to anger, slow to understand…ignorance and prejudice and fear walk hand in hand
Ron
I wonder if the EIA report of propane/propylene inventories 40% above the five year average is inhibiting the enthusiasm of the shale drillers?
Ron,
The consensus might be that the US has peaked on POB, but in the real world it is a minority view. I respectfully disagree.
Note also that the US CTMA peak was 14 months after the World CTMA peak.
The consensus might be that the US has peaked on POB, but in the real world it is a minority view.
Dennis, please read, or listen to, the link: “Peak Oil Gets Admitted” posted by George Kaplan and myself below. The whole thing please, and give us your opinion. The conses of opinion in the real world will change a lot sooner than you think.
Ron,
I think the IEA has it right, demand will peak for oil and other fossil fuels. Many claim renewables won’t cut it, I think they are wrong, I was unimpressed with his writing off of EVs and renewable energy. I agree fossil fuel resources are limited, solar power is relatively unlimited and the main ingredient of solar panels (sand) is very plentiful. Stationary batteries can be made form many different kinds of materials (not simply lithium used for cell phones, laptops and BEVs).
This is a major hole in the analysis in my view.
Dennis, I am not going to argue as to whether renewables will cut it or not. My claim is that peak oil happened just over four years ago and I think that will become obvious this year. I think that was the point of the article.
As to renewables, things are going to happen a lot faster than you, or almost everyone else imagines. If renewables can ramp up that fast, then great. I have my doubts but I am not a renewable expert so I will not argue that point.
Ron,
Output is likely to increase over the next 5 years in Saudi Arabia, UAE, Iraq, Kuwait, US, Canada, Brazil, Norway, and Guyana, there will be some decline elsewhere, but by less than the increases in those 9 nations.
Dennis, I am not at all sure the combined production of those nine nations will increase very much. But I am confident that the world, less those nine nations, will decline quite a bit. The chart below shows the world less your Big Nine, Saudi Arabia, UAE, Iraq, Kuwait, US, Canada, Brazil, Norway, and Guyana, increasing in the last month but that was primarily Kazakhstan recovering from severe pipeline problems. Look for the chart below to see huge declines throughout 2023.
Sorry Dennis, but I think you severely miscalculate this one.
Click on the chart below to enlarge it.
Ron – That is an extremely useful plot. My analysis below, key take away is in past 8 years that group is down ~6 MBpD.
-Immediately following the late 2014 peak, it shows annual decline rate of 0.5% (July 2015 thru April 2017)
-Decline rate increases to 1.9% between April 2018 thru Jan. 2019
-Another big increase to 4.4% between Jan. 2019 thru Jan. 2020 (before Covid)
-Next step down is Covid, where decline rate went to 17% (Apr. 2020 thru Dec. 2020)
-Post Covid recovery decline rate appears to be 0.5% right now.
Looking at the 8 year period of Oct. 2014 thru Oct. 2022, the average decline rate is 1.7%, which is a loss of nearly 1 MBpD annually. If we see decline rate of 5% return for this group then that will be a loss of 2 MBpD annually.
For the big 9, I would disagree with Dennis that he can expect any growth from them. As I’ve said since last year, best hope is producing group could remain flat (and right now that looks to be asking too much)…
Dennis will eventually see the light, I’m sure of it.
Ron,
The chart would be better to show World minus 11 nations, the nine I mentioned plus Iran and Venezuela. In your chart the “rest of World” sees a decrease of about 4500 kb/d from June 2018 to Oct 2022. Roughly 3000 kb/d of that decrease came from Iran and Venezuela due to US sanctions. The World minus 11 nations would have a decrease of bout 1500 kb/d over a 4 year period, about 375 kb/d annually. I expect Iran and Venezuela will be flat to up going forward and the “Big 9” are likely to see increased output. Note also that the steep decline from 2018 to 2020 is explained by OPEC plus cuts (only 4 nations from the 18 nation group subject to cuts is part of the big 9) in 2019 and by further cuts during the pandemic, also snactions n Russia due to the war in Ukraine have had an impact.
Kengeo,
We will see, I adjust my expectations based on the data I see, for now my expectations are unchanged best guess is a new World peak in 2028 /-2 years for C plus C CTMA.
Dow futures are up 224
Nasdaq futures are up 63
WTI is up 31¢ to $67.05
UBS buys Credit Suisse for $3.2B
Does this mean that the Banking crisis is over?
No, Banking crisis has just begun. Bond holders are taking the loss. A lot money was just lost. And absolutely nothing is fixed.
Going to be a lot of deposits leave UBS because of the way this was handled. The shareholders of UBS were suppose to vote on it. That was taken away by government.
Not saying there won’t be any reprieve here. But nothing is fixed. It will take markets a bit to sort it out.
If dollar deposits start leaving. Their currency will get crushed and the swap lines with the FED isn’t going to matter much because they are just swapping bank reserves.
And raising interest rates to fight currency flight will crush the value of the collateral on bank balance sheets. Their banks are loaded with negative yielding government bonds.
Decade long experiment with negative interest will comeback to haunt them.
Michael Howell thinks that soon banks will be nationalized in many countries.
WTI less than $50 within a week or two looks distinctly possible. I don’t see TPTB having many short term tools that they can employ to reverse current sentiments and there are any number of outside shocks that can hit the markets to make things worse (e.g. fall out from whatever happens with Trump tomorrow, refinery strikes in France). More negative news about oil production might boost prices a bit but that seems to be too long term for the markets to take in – they seem mostly to respond to short term (and volatile and unreliable) storage numbers (and mostly crude alone without including products, which I’ve never understood).
George – The only way that happens is if OPEC doesn’t cut supply…Are you thinking OPEC is going to go head to head with US shale again like they did in 2014/2015? My guess is they don’t need to this time around and won’t let oil price drop below ~$65.
Most are calling forecasts of ~$100+ over medium timeframe…
Adjusted for inflation, today’s WTI price is 2005 equivalent of <$50…that's very low. $150 oil price seems likely by June…
Well, they have some tools. The discount window for instance. I’m assuming it would be a shock for most people to learn that a week ago actually surpassed the 2008 GFC in terms of borrowing. “so you’re saying there’s a chance?”
https://www.reuters.com/markets/us/fed-emergency-lending-banks-boosted-overall-fed-holdings-latest-week-2023-03-23/
I think prices are ultimately headed lower, there will be a few bounces along the way though. But the fundamentals are weak. Look for a close underneath the $65 support and the 200 weekly moving average. Should be the tell tale sign of further declines.
and by “fundamentals” I’m assuming you mean – the entire global economy
Outsized market moves are actually more common features of bear markets. (slow never-ending melts are more common in bull markets). Just as an example – during the dot-com crash, the NASDAQ had 11 rallies of +10% or greater from 2000 – 2002. And S&P had similar repeated outsized moves during 2008-2009.
Here’s a good article about peak oil.
https://thehonestsorcerer.medium.com/peak-oil-gets-admitted-eb0ea928e10
Thanks, George, I missed this one. Hey people read this Peak Oil article! Or, you can listen to it.
Peak Oil Gets Admitted? Bold theirs
Inmy start of the year essay I predicted how peak oil will be announced in 2023 — only to be buried under a pile of BS. Well, here you go, and it’s only March. Paraphrasing Captain Benjamin L. Willard from the movie Apocalypse Now we could say:
“Oh man… the bullshit piled up so fast [in the energy business], you needed wings to stay above it.”
Before we start flapping our wings, first let’s hear the admission that peak oil is not a crackpot theory. As Mr Kern, the Educated Realist from Oilprice.com — “the no.1 source for oil and energy news” — explained with his own words (my emphasis added in bold):
Peak oil is the point in time when worldwide petroleum production reaches its maximum point and begins to decline. It occurs when reserves of easily accessible oil are depleted, and it becomes increasingly difficult and expensive to extract remaining reserves.
There is a lot more to this article. It is a nine-minute read. If you are serious about peak oil, you will read it. Even if you are a peak oil denier, you will either read it or or admit you don’t believe in evidence, you only stubbornly think you know the future. However, I am aware of only one outright peak oil denier who posts on this blog and he goes by the handle “Resservegrowthrules”. Simply being off by 10 years does not make one a denier. 🤣
You can even listen to it. Just click on the little “listen” thingy above the headline: Peak Oil Gets Admitted?
Ron – Even Rystad has been predicting this (~2019 peak) for a long time, I guess the only thing is they expect a very long plateau…but their model (Ucube) assumes significant annual discoveries which could be brought online relatively quickly (which is completely ridiculous for lots of reasons – A-simply not finding discoveries, B – future discoveries (if any) will be complex and expensive to develop, meaning they will take a long time to happen. Here’s an output from Ucube dated ~2016 (Erik Wold)…
http://web.idg.no/app/web/online/Event/energyworld/2016/pdf/wold.pdf
Thanks Kengeo. Of course this article is totally out of date. But it is interesting to see what they expected to happen back in 2016. I do wish these kind of projections would deal with crude oil or C+C instead of total liquids. What might happen to natural gas liquids has very little to do with crude oil. Making predictions by mixing NGLs into the barrel with crude oil is only a confusion factor.
“If you are serious about peak oil, you will read it. Even if you are a peak oil denier, you will either read it or or admit y”ou don’t believe in evidence…”
Those who can calculate when peak oil happens can’t also be deniers. And those who have claimed it previously, and keep doing it because, you know, they FORGOT they predicted it, are suffering from both selective memory and a broken clock problem on this topic.
RGR, you are absolutely full of shit and an egomaniac of epic proportions. It really doesn’t matter in the big scheme of life what predictions failed, when or why, it only matters that one is capable of not focusing on the past (and all that anger, wow! I’ve read your shit on POMB)…but the future.
In that regard, you have absolutely NOTHING to offer, as a retired engineer or just a plumber from Boca Raton, bored out of his mind, who enjoys being a disruptor (who knows, really…you are scaret to say). If you have something to say, say it. Try not to say it at the “expense” of someone else. Be productive, not counter productive.
Lets try this, I’ll make it easy for you: how many more years of HZ tight oil production from the Permian Basin can be “had,” at current oil and natural gas prices (3.20.23)…without borrowing more money? And don’t forget all that debt. Do the best you can with the well economics thing ( I know its hard for engineers); us dumb McPeaksters need hep.
Forget the political bullshit, the if, ands and buts; you are “supposedly” an engineer (you have Dennis Coyne fully onboard, that’s for sure), enlighten us. Ten, twenty, forty more years? We all need guidance from the SPE and those that really know.
You owe us. I’m an SPE member, I’ve read the the moral obligations you have to your profession, your code of ethics. Let’s hear something, anything, other than ridicule.
The dude has had the luxury of criticizing a discipline which has only one correct answer but virtually an infinite number of incorrect answers.
+1
Mike says “you are absolutely full of shit and an egomaniac of epic proportions.” This coming from a “man” who has a chip on His/her shoulder the size of Texas. Every time I read anything you write, a feel a bit more sorry for you than the time before.
What a waste of life, if you truly have been financially successful in your oil “bidness” why don’t you go take a walk, get a girlfriend, watch a sunset, go fishing, do a crossword puzzle something that actually might give you some pleasure in your final years. Nothing you say or add here (not unlike any one else including me) is going to make one bit of difference to any outcome. You come across as a humorless, bitter, egoistical numb nut with nothing to add to almost any discussion.
There is no answer to your question that you will except, so why ask it? You are one of the folks here that has a decade long record of being wrong, tell us what you learn from that experience, it should be plenty. If you haven’t learned anything you might do some deeper reflection on your capacity to learn. IN the mean time here is one from louie to pick up your day.
https://www.youtube.com/watch?v=VqhCQZaH4Vs
Sorry Tex, but I will have to agree with Mike S. on this one. People like you and RGR, who have nothing to do but criticize other people’s posts are a sorry lot. How about posting your own predictions? And how accurate were your past predictions? I believe, just like RGR, you had none. So you have nothing to do but sling mud at everyone else.
Let me borrow a phrase from Mike S. You are absolutely full of shit.
Get a life.
Peak Oil: The Perennial Prophecy That Went Wrong
Ariel Cohen – Contributor – I cover energy, security, Europe, Russia/Eurasia & the Middle East
Nobody can quite agree on when we will reach the point of Peak Oil or even what will cause it. Norwegian state-owned oil company Equinor and energy researcher Rystad Energy predict a peak around 2028 owing to low investments in oil supply and increasingly efficient competition from renewable energy projects. McKinsey Consulting and French oil and gas company TotalEnergies, estimate peak oil in the early and mid-2030s respectively due to slow growth in the chemical industries as well as peak transport demand.
A recent OPEC outlook report estimated steadily increasing demand, which would result in peak oil in approximately 2040. The International Energy Agency and U.S. Energy Information Agency foresee oil demand “plateauing” and recommend immediately exploring alternatives to sustain energy needs. According to BP’s outlook, international oil demand may double as the developing world buys more ICE cars and builds Western-style consumer societies, and peak oil not hit until 2050 based on known oil resources with the application of today’s technology.
American geoscientist Marion King Hubbert predicted that global crude-oil production would peak in 2000. Sadad Ibrahim Al Husseini of Saudi Aramco predicted that Peak Oil occurred in 2006.
Debates about Peak Oil do not serve the environmentally or economically conscious. Peak Oil will happen when technology makes ICE too expensive relative to the electric engine for transportation, and environmental regulation would make the polluting gasoline obsolete.
https://www.forbes.com/sites/arielcohen/2022/11/30/peak-oil-the-perennial-prophecy-that-went-wrong/?sh=28b62a572bbe
Virtual Walk: Beautiful Beach Sunset in 4K over Monterey Bay, California
https://www.youtube.com/watch?v=BCJdm2RLjHE
I am doing well, TT; thanks for asking. The girls all send their best. Fishing, yeah: I did an overnight trip to the back of Alasan Bay the other day and nailed a 28 inch trout on an 8 weight and pink crab pattern I’ve caught permit on. In a foot of water! She was full of eggs and I put her back on her bed, both of us better for the experience. She won’t do that again for awhile. I hope.
I should apologize to the community for that rant but you see I get tired of people using fake names to ridicule people. It’s weanie-neck; the worst kind. You know, sorta like you just did to me. Again. How many times is that now?
And I’ve got this thing with pompous engineers, or people who claim to be engineers (or other oil “professionals”) looking down on folks. That arrogance is exactly why 98% of America hates the oil and gas industry. Everybody’s got a right to be worried about oil in America and if you are truly “professional, you wouldn’t arrogantly shove your bias opinions down their throats. Antagonism is a stupid way to make a point.
Me and Coots both hated engineers and other phony people. Its as old as the oilfield. Maybe this will explain it better: https://www.oilystuffblog.com/single-post/coots-1968. If its too long I understand. You could do it in multiple sittings.
All’s good here, Bluebonnets and Paint Brushes everywhere! Natty prices suck, uh? You royalty owners need tougher drilling commitment provisions in your leases; we need moar Freedom gas! Moar LNG terminals, moar pipe, more exports ! Moar money for you !!
Ron, I have learned a thing or two in life and one is there is little value in arguing with an old man. SO I will not take the bait below as I know where it comes from. On the other hand, since I first starting posting here, I attempted to bring my experience as an active oil and gas professional, with 4 decades of experience in mapping, packaging, raising money and investing in oil and gas deals. Those in my position KNEW the crap that being spewed here on BOP regarding the impact of horizontal drilling technology would have and said so, too much distain here. That’s fine I could care less, if people want to stay stupid and ignorant its no skin off my back. But as long as I am permitted to do so, i will confront outright falsehoods or out right propaganda regarding the industry. Those who were wrong and missed the biggest impact to our domestic energy industry since the East Texas Field or Spindeltop discoveries, are in no freakin position to throw stones. And, by the way I may have a bit of fun doing it. I think based on the investments being made we may be in the 3 or 4 inning in the buildout, many years of oil and gas professional providing the necessary oil, gas and nat gas products to a demanding world, with that I say Cheers, isn’t it your vodka time 🥃
Tex, RGR is a blowhard that can do nothing but criticize others. He brings up my 2015 wrong pridiction over and over again. Sure I was wrong but so was everyone else who did not see the shale revolution coming. And that was everyone! So RGR’s shit was getting old. Mike S. came to my defense. Then you trashed him for doing so. That pissed me off. Why didn’t you just stay the fuck out of it? RGR deserves all the criticism anyone can pile on him. He is nothing but a blowhard.
Yes, I am an old man but I do not drink Vodka or anything else for that matter. I used to drink bourbon but I quit six months ago. I got to enjoying it too much and I could see where that was headed. So I quit.
American geoscientist Marion King Hubbert predicted that global crude-oil production would peak in 2000.
King is ON FILM saying his prediction “assumes an orderly evolution,” which obviously is NOT going to happen, which is his tacit acknowledgement that his own prediction is bound to be wrong. That’s why Hubbert said–back in the goddamned 80s–that we have to start converting to solar and nuclear, NOW, which means in the 1980s.
This is identical to Carl Sagan saying in 1985 about global warming mitigation, “If we don’t do something now, it will be too late later.”
We didn’t do anything in either case.
And so we’re fucked.
“And so we’re fucked”
Mike B, when in your lifetime haven’t we been fucked ?
May I suggest you take a view of young professional ball players. Currently in the Western Conference Division of the NBA, its a battle for half the teams to make the playoffs with less than 10 games left to go in the season. Not all the teams are going to get in. After every game the players get interviewed by the press about how their going to get into the playoffs. Their answer almost every time is to not look forward past the next game and to focus on the things they can control to win it.
Go back 15 years vs. today. Today we have a viable alternative to ICE and a proven reserve of shale to make a reasonable manageable bridge to electric transportation. Regarding those who believe there is some “energy cliff” looking at us in the near future are just fear mongering. I’m in the Dennis, RGR and TT camp. There is oil out there that is not counted in the proven reserves. It’s going to be more expensive and the market economy will adjust. Labor and capital will be the primary factors to the energy supply curve in your lifetime.
HB: The oil patch needs a Steph Curry to pull this one out. And there’s only one Steph Curry.
Here you go, from SPE’s Journal of Petroleum Technology:
https://jpt.spe.org/plummeting-energy-return-on-investment-of-oil-and-the-impact-on-global-energy-landscape
The SPE writer introduces a term as concerning as The Red Queen, this one is Energy Cannibalism. What happens when EROEI keeps declining.
Well, I might grant you the egomaniac angle, but in a relatively limited area. Dennis might be on board, you can ask him why. I certainly have paid close attention to his methods and logic if only because he has them, he lacks to my satisfaction the near religious fervor on the topic that advocates have…I won’t mention names but then I probably don’t have to. Ron.
I am known for telling folks how silly their ideas were as far back as 2005, and will happily allow that (and all the usual derogatory claims) to be the sum total of my reputation in McPeakster amateur hour environments until I choose otherwise.
From what I can tell you have the reputation of, and are only “known” for… having the manners of a goat.
Fortunately, for both of us, you don’t owe me a thing, no sir.
He’s also known as a chickenshit
Standard Chartered Blames Gamma Hedging For Overdue Oil Selloff
Oil prices have crashed spectacularly, with WTI crude falling from $80.46 per barrel just 10 days ago to the $67 range, while Brent has declined from $86.18 per barrel to the $73 range, levels they last touched in December 2021. On Friday, things improved slightly, with Brent moving into the $75 range and WTI testing $69.
Commodity analysts at Standard Chartered warn that the oil price crash has been exacerbated by hedging activity–specifically, due to gamma hedging effects, with banks selling oil to manage their side of options as prices fall through the strike prices of oil producer put options and volatility increases. The negative price effect has been exacerbated because the main cliff-face of producer puts currently occupies a narrow price range.
While gamma hedging effects did not cause the initial price fall, they have caused a short-term undershoot, further magnified by the closing out of associated less committed speculative longs. StanChart has worked out the distribution of producer puts based on a survey of 46 U.S. independent producers.
Banks are deleveraging to free up collateral. Not saying that there isn’t any truth in that article because there is. What he is saying is absolutely true.
But the CTA’s are also shorting oil and stocks. I disagree with the view that the selling is overdone.
In a banking crisis, banks tighten lending standards and don’t make loans that they would normally.
We are in the 1st inning. 200 small and mid size banks in US are in trouble. This will take months to play out.
If anyone bothers to look at financial records of any Chinese banks then we are really screwed.
FUBAR . SNB now has to offer a line of $250 billion . Black hole .
https://www.reuters.com/business/finance/switzerland-puts-up-260-billion-francs-credit-suisse-rescue-documents-2023-03-20/?taid=6418762664bd6100013e43d0&utm_campaign=trueAnthem:+Trending+Content&utm_medium=trueAnthem&utm_source=twitter
If the SNB could print money there would be no need for taxpayer money from government. Bank reserves are no substitute for bank deposits.
And bank reserves also aren’t high quality collateral that can be used in REPO to secure funding.
SNB is useless. But in order to keep appearances up they must do something even if that something amounts to nothing.
In a way though that is exactly what the FED is doing – buying long dated bonds at par when they are trading at 70-ish creates reserves for the banks which have super short duration. So that fixes the fundamental issue of the maturity mismatch that the banking system is facing. The cleaner way of course is to raise equity to plug the Hold To Maturity ( HTM) gap that they are facing but my guess is that current shareholders aren’t fans because of the dilutive effect and new shareholders want to get a good deal i.e. a low price.
Rgds
WP
Reminds me of nuclear power, benefit now, let some other poor schmuck pay later.
Peak Oil? It is more and more in the news these days. Soon everyone will be talking about it. This YouTupe podcast is the perfect example. However, it is one hour long so I doubt many of the members of this blog will take the time to watch it.
Have We Reached Peak Shale?
It is as much about peak oil as it is about peak shale.
Yes, very good vid. You will learn a lot about world shales. Six of the best ten shales in the world are in the US. The Permian is the ONLY source of oil growth in the world, acc. to vid.
I’ll watch it thanks.
RON,
The real question is… have we reached PEAK STOOPIDITY?
steve
BERNDT – Not sure if you are looking at this post/comments.
Curious on your estimate of annual decline rate for next ~5-10 years.
My estimates have world production dropping 3-5% for next 1-2 years…
But increasing considerably after that (6% drop in 2026, 7% drop in 2027, 9% drop in 2028, 12% in 2029, 15% in 2030, and 20% in 2031). 70 MBpD in 2026, 60 MBpD in 2028, and 50 MBpD by 2030…
The primary cause for this drop in production is depletion from Russia, China, Iraq, UAE, Kuwait, and Norway. These six countries make up almost 30 MBpD (11 Gb annually) of supply and don’t have many remaining reserves (1P = <40 Gb).
Might as well put that projection in a chart for everyone to see and marvel at.
People get excited by steep descents.
Unless we are entering a catastrophic era that has nothing to do with global geologic oil reserves,
I’m guessing that you are a tad pessimistic on this early decline phase.
Your decline to 60 Mbpd in 2028 will come a minimum of 5 years later, as I guess it.
I’ve rarely been the greater of two when it comes to optimism on energy supply…this is a near first (some would call that a second).
In short, I think there will great economic incentive to produce tough oil for a long time.
An extremely disruptive problem will be failure of distribution…much worse than the patchy distribution this world has now. Importing countries that have been accustomed to purchasing oil products may find that their traditional suppliers have switched to a different preferred block of customer countries, and not necessarily based on the dollar as the trading medium.
The ‘coalition of the aggrieved’ is gathering strength, while the pax Americana conditions are on a slow fade, and the industrialized, aging and overextended oil importing nations are gradually losing the relative monopoly on economic and geopolitical clout. Its a case of resting on your laurels and taking the advantageous scenario since the 1950’s for granted. A whole different set of peoples of the world are the motivated ones now.
As I see it.
Kengeo, i look often at peakoilbarrel.
My last calculation has resulted in the following:
-The world needs each year about 2.2 percent of a BOE more energy to produce crude oil.
-Crude oil today requires about 150 percent of its energy content to get produced.
-All kinds of energy are used by the oil production process and converted to oil energy.
I believe, the world can sustain this high energy requirements until 2027. Up to 2027, the oil supply will remain relatively high (only 2% loss each year), after that it will go down fast (10 % loss each year).
Yesterday, i have finished my english version of the book containing all calculations. Now, i look for english native speakers to help me to eliminate errors.
Happy to proofread.
rgds
WP
You can find the preprint book in pdf form on researchgate, DOI 10.13140/RG.2.2.31431.78243.
3 minutes ago, i have uploaded it.
Thanks – I will download later today.
rgds
WP
Do you have a reference other than the DOI? I can’t seem to search by DOI…..
Thanks
WP
This Link works for me:
https://www.researchgate.net/publication/369388244_THE_LAST_YEARS_OF_THE_LAST_YEARS_OF_THE_OIL_AGE_THE_OIL_AGE_Physics_kills_Oil_and_Cars_Physics_kills_Oil_and_Cars_THE_LAST_YEARS_OF_THE_OIL_AGE_Physics_kills_Oil_and_Cars?channel=doi&linkId=6419e9d9a1b72772e4177d1b&showFulltext=true
Nevermind – I am an idiot.
I got the paper and will read it.
rgds
WP
I pinged you on LinkedIn – can you accept?
Thanks
WP
BERNDT
Could please provide some examples to back up the following quote from your comment above. What is your data source. Can’t believe this is happening in SA.
-Crude oil today requires about 150 percent of its energy content to get produced.
OVI, thats the wrong question. I have calculated the energy to be supplied by the world economy, not the part of SA. My diagram is valid for the average energy, not for single countries or oil fields.
This is not for EROI, it is for “Societal EROI”, as defined by Charles Hall.
BERNDT
I am not into that FUZZY societal stuff created by economists.
I will stick with real world EROI. That is what shows up in the bottom line of the oil companies
No offense Berndt, but this frankly seems impossible to calculate. Can you share your formulas, input data, and the source of that data?
I’d actually be happy with the formulas only.
see above
Kengeo,
proved reserves are less important anthan proved plus probable reserves which are the petroleum engineer’s best guess estimate. Over time the 2P reserves tend to increase as fields become better understood as they are produced. Read Laherrere on this subject, and note that Laherrere has tended to asuume reserve growth would be zero on average and has had to continually increase his estimates of URR in part because he does not account for the fact that reserves tend to be revised higher over time.
Ok, sure Dennis…I’ll quote him one last time:
“Dennis Coyne forgets geology and bases his forecast on unrealistic ultimate with drilling unrealistic number of wells
He follows EIA unrealistic AEO2022 reference
Dennis forgets often also the historical past, making graph on recent past”
We might not have Laherrere figured out but he certainly has you figured out…
Kengeo,
Laherrere often gets things wrong, the only place I use specific numbers of wells is for tight oil and my tight oil scenarios are pretty conservative with a URR of about 70 Gb (EIA has a URR of about 127 Gb for tight oil). How about sources for your quotes for Laherrere? I look at World oil production from 1870 and use Laherrere and the research of many others in my analysis.
See
https://aspofrance.org/2018/08/31/extrapolation-of-oil-past-production-to-forecast-future-production-in-barrels/
From paper above see page 15 to 16 where Laherrere writes regarding World less extra heavy oil
Graph 2018 production forecast for U = 2600 (creaming curve) & 3000 Gb (HL)
So averageing these two we get about 2800 Gb for URR, then add Laherrere’s estimate for 200 Gb of extra heavy oil (100 Gb each from Venezuela and Canada) and we get a URR of 3000 Gb for World C plus C, see page 115 for extra heavy oil URR ( Canada oil sands 115 Gb URR and Orinoco URR=100 Gb).
A more recent Laherrere estimate from 2022 has World C plus C URR at 3500 Gb.
Also see Laherrere’s Bakken estimate from https://peakoilbarrel.com/bakken-oil-peak-jean-laherrere/
In that post from 2014 he estimated about 2.5 to 4 Gb for URR for North Dakota Bakken output. Art the end of 2021 North Dakota Bakken cumulative output wass 4.1 Gb and proved tight oil reserves were about 3.9 Gb at the end of 2021, for a total URR of at least 8 Gb, roughly 2 times Laherrere’s estimate. My current best guess URR estimate for ND Bakken is about 9 Gb with 27000 total wells completed (abut 17000 wells had been completed by the end of 2022).
My early scenarios probably did overestimate the number of future wells, based on reports by the NDIC which projected 60000 wells and others that used about 40000 wells. I also underestimated in 2014 the increase in new well productivity that would occur from 2013 to 2018. My best guess in 2013 was about 8 Gb plus or minus 2 Gb see
http://oilpeakclimate.blogspot.com/2013/10/exploring-future-bakken-decrease-in.html#more
From that post:
The most realistic cases would have economically recoverable resources between 6 and 10 Gb, with the best estimate around 8 Gb. Cases 1 and 3 are the most realistic presented in this post, …
Fig 1 from that post in Oct 2013 below
Thanks Hickory – Appreciate your perspective and input.
I recognize it’s a very aggressive estimate…look at the shark fin plateau model. It’s pretty easy to lose 10% in a year, Russia will be a good example.
I agree with Ron that the decent should be steeper than the run up, either way we will know very soon.
It’s not going to take 15-20 years to figure this out.
There are only 3 options:
A- Growth continues (a new world max would be reached soon, within 12-24 months or so)
B- Plateau for some period then modest decline
C- Decline happens (or continues from 2018), likely decline between 2%-10% annually.
A major contributing factor could be related to failure of world economics/currency.
From what I can tell, no one hear (except maybe 1-2) believe option A is remotely possible. Several or maybe half here think option B is possible. But majority here consider option C is most likely.
Momentum is the key, and everything is pointing deceleration of production and prices, a vicious feedback loop for producers of the more expensive fields.
Depletion rates of 5-10% seem reasonable:
“Decline and depletion rates of oil production: a comprehensive investigation
Mikael Höök , Simon Davidsson , Sheshti Johansson and Xu Tang
Published:13 January 2014https://doi.org/10.1098/rsta.2012.0448”
Peak cars 2017 -2018 . If you can’t afford it then you can’t have it .
https://www.zerohedge.com/markets/stock-clearance-most-major-automakers-slash-prices-china-demand-stalls
In the US light vehicle sales/capita peaked in 1978, and is now down almost 40% from that peak.
But cars last a lot longer, and the roads are as packed as ever.
Its only one country, but most countries have more than enough vehicles.
https://www.advisorperspectives.com/dshort/updates/2023/03/03/vehicle-sales-per-capita-as-of-january-2023
The countries where people are riding hanging out of the bus windows, and up on the roof, are not in that category. Lack of affordability is nothing new for billions.
Notable countries with the fewest vehicles/capita-
VietNam, Pakistan, India, Nigeria, Kenya, Philippines, Congo, Egypt, Iraq
All of these have a lot more vehicles on the road than ever before.
Have there purchases peaked? I doubt it.
https://hedgescompany.com/blog/2021/06/how-many-cars-are-there-in-the-world/
As an EV owner and l long-time oil observer, I have come to terms with the limitations of EVs as a replacement for ICE vehicles and the need for oil. There seem to be many who believe EVs can replace ICE vehicles. That is somewhat true for people like me who live in a suburban community with a garage where a Level 2 charger is installed. Of course, that assumes that the electrical infrastructure in my community could handle large scale EV adoption — it cannot at present. It assumes that the electrical generation capacity will grow at a sufficient rate to provide the electricity, I don’t see how that happens, certainly not from renewables. And what about apartment dwellers, particularly those in dense cities like NYC? And does anyone believe EV semis will replace diesel semis?
I own two EVs and still need an ICE vehicle for long trips or even shorter trips when I didn’t have time to recharge my car. Eventually the recharging network will relieve some of that, but we are a LONG way from being there. There is nothing today that matches the convenience of an ICE vehicle when it comes to adding range quickly.
But what if it did happen? What if ICE vehicles were replaced by EVs as the EV proponents envision? What would the economic impact be? No more auto mechanics except those at dealers who are trained to work on EVs — and many fewer of them will be needed due to the reliability of EVs. Drastic reduction in employment in the oil industry. Reduced employment in the auto industry as EVs require far fewer parts. Drive down any main street and count the number of businesses that exist only to repair or service ICE vehicles (engine, transmission, parts stores, muffler shops). Tremendous economic disruption.
Of course I understand this could not and will not happen overnight. But I wish that those who see an EV future as an unvarnished positive would understand what an EV future, if it were possible, would look like. We have built a society based on the convenience of transportation powered by the most convenient and energy dense fuel.
“unvarnished positive ”
Nope…but it will sure beat the alternative
which is having no back up plan for depleting transport fuel,
and thus resorting back to nonmotorized modes- walk bike mule
Yes, tremendous work to be done.
Electricians rising.
No one should be pretending that the big fade in abundant oil will leave civilization unchanged,
and that certainly includes our collective expectations for transport.
STEPHEN,
You bring up legitimate concerns about Ramping Up EVs. However, the 50-ton Brontosaurus in the room is that diesel is by far the most important liquid fuel, not gasoline. Even ramping up EVs, reduces more gasoline demand, but I am not really seeing that.
Regardless… the Trains, Ships, Barges, Trucks, and Airplanes, run on Diesel and Jet Fuel. Anyone crazy enough to get into an EV Airplane… please include me in your will.
steve
Steve
The first step has been taken. Pictured is a modified Dehavilland Q100 Hybrid. Note the battery packs on the side of the fuselage.
While not explained in the article, this is an aircraft powered by a propellor driven electric motor and a turbine engine driving a generator. At takeoff, power is provided to the motor by the battery and the turbine. During cruise for a limited range, power comes from the battery, possibly 100 miles, just a guess. When the battery gets low, the jet fuel powered turbine kicks in for the additional range. Similar in concept to a plug-in hybrid car.
The idea here is to replace the standard turbo-prop engine which has to be sized for takeoff power and may only need 60% power for cruise. So the turbine engine used to power the generator would just be sized for cruise power.
I think the market for this type of aircraft would be Europe, India and China which may have a large number of routes under 200 miles.
https://dehavilland.com/en/news/posts/de-havilland-canada-working-with-pratt-whitney-canada-to-support-the-development-of-sustainable-hybrid-electric-aircraft-propulsion-technology
Hybrids are a great technology for extending available oil resources. Toyota and Honda both took the position that hybrids are better and that’s why they are behind the curve on EVs. If I had to live with one car, it would NOT be an EV, it would be a hybrid or a plug-in hybrid. Unfortunately, all the emphasis today is on pure EVs (BEV). But, as I said, EVs make sense primarily for suburban homeowners with garages. For anyone else, hybrids make sense.
Stephen
The problem is California which is pushing for 80% BEVs by 2035. The problem is exacerbated by the 10 NE states that have adopted California emission standards over Federal emission standards. Toyota has been fighting the California Standard and have a partial victory.
Things could change around 2030 if Lithium prices continue to rise.
Yes, the diesel issue is an interesting one. As far as I know, you can’t make just diesel from crude — you have to make gasoline and other liquids in various fractions. Correct me if I am wrong about that.
In an all EV world where diesel is still in use, gasoline would be a waste product without a market. Of course, this will not happen. Gasoline would continue to have value and gasoline powered cars would continue to be produced to use it, even if just as hybrids and PHEVs. This, I think, would give longer life to the viability of ICE vehicles.
Stephen
I would expect the price gap to grow between gasoline and diesel as excess gasoline is produced.
The world will learn to make due with cargo being transported by residual bunker oil, electricity, and perhaps hydrogen, as oil products available for transport becomes too expensive or unavailable.
No choice but to make do.
I suspect that much of the optional uses of transportation will be weeded out over the next couple decades [super wealthy exempt from limitations , as usual].
We can make a priority list of oil product use.
Either the market or politicians will eventually make and enforce such a list.
Here are few list items to consider
-using diesel to grow corn for ethanol is ridiculous [the net energy output per acre is pitiful]. Almost any other use of the prime farmland would be an improvement
-on the other hand, most diesel for agricultural food and fiber purposes is a high priority
-close to 100% of aircraft travel is optional, and can be simply phased out quickly. I would continue on with search and rescue, law enforcement, and coastal defense flight operation capabilities, for example
-RV travel, hobby fishing, and cruise ships are the type fuel use that could be phased out quickly without the collapse of civilization
-in the US the Nixon mandate for nationwide 55mph speed limit to conserve fuel could be re-initiated and enforced by automated camera detection linked directly to your newly required Federal Credit/Debt Ledger for instantaneous balance adjustment…
The move toward a system of supply restriction/rationing/penalties will be pretty quick if ‘the market’ doesn’t get the job done in what is perceived as an effective and equitable manner.
Electric transport looks pretty damn compelling when faced with a soon to come future of depleting oil,
despite the biggest drawback- range not what you have been used to.
I am so surprised by the attitude of many…desperately holding on to the notion that one option is to just stay the course with petrol just as it has been for 70 years. Sorry to pop the bubble folks, but time to change our act. Its twenty or thirty years late to just be getting started, but the change needs to embraced with intense enthusiasm if you want things to rolling.
I agree — we are headed to a future of “make do”. It will not be an electric utopia nor a medieval dystopia. But our current mode of living will come face to face with the reality that it can’t continue. I expect I will live to see just the beginning of the change, but my son will certainly see it in full form in his life time. You are also right that EV transport looks compelling — that’s why I have two of them! But it will be available primarily to those in the correct situation — relatively affluent suburban home owners. I see my EVs as long term insurance policies against whatever may come.
Some interesting statistics can be found here: https://www.researchgate.net/figure/Summary-of-the-EV-Owners-Demographic-Characteristics_tbl1_335455046
EV owners are primarily older males (>50), highly educated, high income, and have 2 or more vehicles.
Another report summarizes: “The current top demographic of EV owners are middle-age white men who earn more than $100,000 and own a home with a garage to support home charging.”
Your ideas about the demographics of EV ownership is
-certainly not what is seen in the biggest EV country…China
-is going to be an antiquated demographic characterization even in the US as this decade rolls on
“And does anyone believe EV semis will replace diesel semis?”
Two and Three axle class 8 day cab tractors that return home to be charged overnight are doable with todays batteries. You can include class 7 and below bobtails doing local delivery also doable.
Over the road highway tractors demands are far from being served by todays batteries. It’s my belief we would need to see at least a doubting of todays battery storage ability or self driving highway units which could slow down, platoon their speed and reduce energy demands. Self driving changes the cost function per mile and driver rest downtime factor.
Example, Today a owner operator picks up a 45′ trailer of limes in Ventura at 6pm on Friday and has 58 hours to deliver it to the market place in Chicago 2000 miles away at 6am Monday morning for $3500. The driver runs most of his route at 75mph , works two log books to fake being legal and spends $2000 in fuel getting 5mpg. The self driving rig runs at 50mph and consumes 2KW per miles at a cost of $1000 with 18 hours to recharge and no labor.
Agree that EV Semi’s aren’t remotely scalable yet.
Problem is most states besides CA have truck speed limits of 70-80 MPH. Tesla Semi at those speeds would likely burn 3 kw/mile, dropping it’s range to 300 miles. This would mean driver (or driverless rig) would be stopping every 4 hours to charge for an hour and your 2,000 mile trip take a lot longer (I don’t think there are any drivers that want to give up 3-4 hours per day to charge). No sure there would be real fuel savings, lots of range anxiety to boot… annually each EV Semi could consume 250 MWs. Assuming 10% market at some point – that would be around 250 TWs (daily load of ~1 TWs, which is more than 25% current demand). To get 50% EV Semi’s on the road we would need to at least double electricity generation…
Unfortunately, it seems like Semi’s should be the last to get electrified…also, what do you do with 10-15 million semi’s that are no longer needed? What does the EV Semi do when the power is out???
Conversion to hydrogen seems like a better option than using 1000kwh battery in a semi (which is enough to power 10-15 passenger EVs). Those 10-15 EVs would also use a fraction of electricity compared to the Semi (50-100 TWs total vs. 250 TWs for the Semi).
The EV Semi (Tesla) will be a niche vehicle for the giant companies to buy and highlight in their sustainability reports, a good reason why we haven’t seen them delivered (more than a few) yet…
The future of EVs is small and efficient formats (2 wheels, 3 wheels, and other ultralight setups). Large EVs are too power hungry, reality is long haul freight should be done via train anyway/not trucks…trucks should be used to move short 100-200 mile distances…
The EV Semi (Tesla) will be a niche vehicle for the giant companies to buy and highlight in their sustainability reports, a good reason why we haven’t seen them delivered (more than a few) yet…
Tesla says their semi is good for 80% of runs (500 miles without recharging, so a 250 mile round trip), and cost much less to fuel and maintain. You haven’t seen more because they are still ramping up production. It takes time to sort out production lines and supply chains.
Regarding long-haul there is already a quite efficient mode of transport, perhaps you´ve heard of it, it´s called electric rail…
But for final delivery, BEHVs will work great. H for heavy, if needed.
The problem is not the trucks, it’s the recharging. I read recently that a truck stop builder wanted to include eight recharging stations for future EV truck use. The plan was shot down by the town because those eight slots would use more electricity than the entire town. Really good article on this issue:
https://www.bloomberg.com/news/articles/2022-11-14/tesla-s-electric-semis-are-coming-and-trucks-stops-aren-t-ready?leadSource=uverify%20wall
Just think through the implications. Chargers that sit idle most of the time then create the demand of a small town? How do you ever balance the grid? Sounds like they’ll need backup diesel generators to me.🤦♂️
Hello Stephen,
I’ve been an EV owner (’18 Bolt, ’22 Model Y) for 4 years now and have taken cross country trips in both cars. I would agree with your assessment if you are driving a Bolt or similar smaller packed, slower charging EV. I have no qualms about driving cross country in a Model Y or similar EV with about 300+ miles of range. The Supercharger network is first rate and many motels are offering Level 2 overnight charging.
My cross country experience says that with a 300+ mile range, I need to stop and refresh (rest room and meal). At 60 MPH, this is approximately once every 4 to 5 hours. While doing a refresh stop, I plug in and recharge. Time-wise, it is about the same as doing the same type of stop with an ICE except the refueling comes either before or after the refresh period. I’ve timed it and it works out to be about the same +/- ~5 minutes???
At home, my PV array generates 300 to 400 kwh in January. At 4 miles per kwh, this is 1200 to 1600 miles. The problem is the initial expense and I have no way of capturing the electricity I don’t use. It goes out on the mains.
I can see adding a Powerwall and another array of similar square footage but I am waiting for more denser batteries and more efficient solar. The other technology is V2G where my EV acts like a Powerwall. How this all transpires is a crap shoot.
With regard to your statement about auto mechanics, my ICE mechanic wants to buy my EV when I go to sell it. I go to him for my state safety inspection. But I see him in the same position as saddle makers, blacksmiths, and other horse related businesses back in the early 1900’s. He thinks he can still make a go of it with EV’s that need A/C services, etc. I hope he is right but I am not so sanguine. But we will see.
We are definitely living in interesting times.
Fast chargers work if you are on main highways. It’s a different story when your trip takes you off the beaten path. But even with fast chargers, you can’t beat the range and quick recharge provided by a gas pump, not to mention the iniquitousness. We are a long way from EVs providing an equal level of convenience compared to ICE vehicles.
Stephen.
In some ways ICEVs are more convenient, but “refueling at home is pretty convenient, with a little planning EVs work fine with Tesla’s supercharging network, which is widely available in the Northeast, even in fairly rural areas off the interstates. I no longer own an ICEV, just 2 Teslas, they work fine for me. Far nicer than any vehicle I have owned in the past.
It’s crossing over and favoring EVs for most applications. A little planning and you can get by just fine. The only place where I might run into a problem are remote off the road situations and for those, I can rent a car or jeep or pickup. Last time I ran into such a situation was in SW Texas in the Big Bend area. Very few Level 3’s in the area but a number of Level 2’s.
If I were to do it today, I would take my time. Overnight charge while viewing the stars at a motel but then I’m retired. A Level 2 and 14 hours of charging can add 350 miles. Arrive at 5 PM and leave at 7 AM the next day.
A Tesla Model 3 has batteries with an energy density of around 250 wh/kg. Next year one of the Korean(?) companies is said to have batteries with 360 wh/kg and there is a battery announced from a lab with an energy density of 685 wh/kg. Add 10% to that density and it would have an energy density of 753 wh/kg or 3 times the density of a Model 3 pack. The range of a Model 3 is 359 miles but with a 753 wh/kg pack, that range could extend to over 1,000 miles.
The cases where ICE vehicles have a use-case over an EV are diminishing.
Goldman’s Currie reiterates bullish oil thesis: The greatest impact from regional bank crisis will be to limit the capital available to shale drillers, which would ultimately curb oil supply.
“What kind of lending gets hit? It’s what’s going to go to the shale patch.”
https://twitter.com/zerohedge/status/1638154269701308416
Thoughts? Figure some here would know the ins and outs of funding in shale.
Investing in a traditionally volatile asset class (commodities) going into the heart of an economic slow down (earnings recession), credit event (banks), and popping of the mother of all bubbles (almost every market on the planet), while Fed is raising interest rates… I don’t know, sounds risky.
NOW – if the Fed CUTS rates today, then I think oil above $100 is in the cards.
Yield curves disagree with Goldman’s bullish oil thesis. Another way to state that is trillions in bond markets disagree with Goldman’s bullish thesis.
Perhaps Goldman needs to unload some of their long oil positions and is looking for bag holders.
There is a thing called the interest rate fallacy. Lower rates aren’t stimulus. They are a sign of tight money and less lending. Markets are going to cut rates towards zero forcing FED hand to cut rates. And it’s not going to be positive for oil prices.
No one can correctly predict inflation or deflation. Yield curves are what people think will happen. They don’t know.
So I’ll make my prediction.
Peak Oil and Debt Default are deflationary and virtually guaranteed. Long term deflation is the future.
Inflation topples governments and while it is on the rise the government will try to raise interest rates.
Congress and The Fed in the US will save themselves at all costs. They are already set for life financially. The only thing they have to fear is civil unrest.
Why would peak oil be deflationary ?
By definition it should be inflationary as supply depletes oil prices should rise.
You can get “whiplash following inflation vs deflation arguments” (James Howard Kuntsler).
I think part of the problem is there are different definitions of the 2 and people don’t clearly define what they are talking about when having a debate.
1st definition:
Inflation = increase in prices as measured by CPI/PPI and other metrics;
deflation = decrease in prices as measured by CPI/PPI and other metrics.
2nd definition:
Inflation = increase in the money supply relative to economic productivity
deflation = decrease in the money supply relative to economic productivity.
The change in money supply might have an impact on prices as measured by the CPI/PPI, etc
There are probably more. But that is where my confusion begins.
I side with the 2nd definition, the decrease or increase in the money supply that might cause prices to rise or fall based on CPI / PPI and other data.
Debt Default unquestionably will reduce the money supply.
Peak Oil seems like it would reduce the money supply as people can’t borrow or earn an income.
These are “when not ifs” IMO, and they would overwhelm any other force that might counter it.
I read so much about inflation is coming or hyperinflation or deflation or the whole system crumbling. Having been in the business of drilling and completing wells, the economics currently for this venture are less than impressive ( and that is everything goes well in the field). The people gambling at the oil futures casino currently are predicting a contraction in economic activity. If there is a global contraction and no growth, we may have a few million barrels of excess supply temporarily. 83% of the growth of oil supply has come from the Shale Basins. If there is no growth coming from the shale basins. Where will it come from? Everyone believes Saudi Arabia, Iran and Iraq have endless quantities of oil. If that were truly the case, the Saudis would have been drilling to discover another Gahwar when production of the largest field in the world slipped to 3.5 million barrels a day. The Saudis would never admit that they are seeing a “twilight in tue Desert” for a multitude of reasons but they do like making money and when oil was $130 per barrel last year, if they had more spare capacity they would have produced it. They weren’t intentionally antagonizing Joe Biden by rejecting his request for more oil, they simply don’t have the spare capacity and I would bet they are producing every drop they can today.
In reality because of the volatility in the futures market and the all out global attack on fossil fuels from governments, financial institutions, climate activists, political parties and lousy PR from the Major Oil Companies, underinvestment in a depleting resource will rule the day at some point. If prices are not high enough and costs are too high and investment returns are too low for most of the newly discovered oil in the world, there will not be enough oil to preserve our way of life as we have enjoyed in the 20th and 21rst Century. Some can argue good riddens like Huntington Beach on POB and some can argue this will lead to infinite wars fought over claiming the last producing barrel.
George’s chart showing energy reinvestment in hydrocarbons over the past few years is the most important chart on this whole blog. The easy oil has been found and produced. Without significant over-investment, we will be short of oil and gas and the decline will be much steeper than anyone expects
Whether we have seen peak oil or not can be debated but in reality the oil and gas industry faces “peak animosity” from the Western World. While the west is focused on saving the planet, China and the other BRICs are focused on securing as much oil, gas and coal as possible. We will see who wins this tug of war in time but I think China is fully bought in on the peak oil prophecy.
LTO…I agree with the gist of your perspective.
“I think China is fully bought in on the peak oil prophecy.”
It makes complete sense that they take fossil fuel supply (and solar,wind, nuclear, EV’s, batteries)
much more seriously than the US. Its not just peak oil, but energy security in general.
-their domestic consumption of oil, gas, and coal is highly dependent on imports, as compared to the US, so far.
-the energy imports are seen by them as very vulnerable, subject to whims of US navy and airforce who roam their front yard (east coast), where all the port terminals are located.
They have the ‘luxury’ of autocracy to make hard policy of long duration….be very careful what you wish for- Autocracy is like playing Russian Roulette, except most of the chambers are loaded.
“Growing demand for foreign oil is also causing energy security concerns for China. Since 1993, China has been a net importer of crude oil, and in 2017, it surpassed the United States as the largest importer in the world. About 67.3 percent of China’s crude oil supply in 2019 came from imports. This dependence on foreign energy is likely to increase. Some estimates have suggested that by 2040 around 80 percent of China’s oil needs will be sourced from elsewhere.”
https://chinapower.csis.org/energy-footprint/
Unlike the USA, the Chinese realize they have to secure their energy resources overseas.
The USA has been deluded into the lie the we have a 100 years of everything we need.
When humans think about their offspring, kids and grand kids is about all we think about.
That is why everything is 100 years IMO (speculation)
If peak oil destroys the economy (as some think it will), then that may end up being deflationary.
If peak oil is positive for the economy I will convert my meager USA reserves to Venezuelan Bolivars
And use them for toilet paper.
Iron Mike,
I think many expect that peak oil would lead to severe recession or depression and that tens to be deflationary. This is especially true of those that expect a very steep decline in World oil output. I doubt this scenario is realistic unless there is a very rapid transition to electric transport which might lead to a crash in oil demand. It is doubtful that occurs prior to 2035 in my view (and 2040 is probably more realistic). After 2030 we might see a 1% to 2% decrease in World C plus C output, high oil prices and perhaps a rapid transition to electric transport.
Not sure what the future holds Dennis. But seems like we still haven’t seen geological peak oil.
Lets take a hypothetical example here. Imagine the world has another severe pandemic. At the bare minimum the global economy would still need consumer staples, transport of goods and healthcare which need oil as an input.
If oil supply is depleting in this scenario of severe recession/depression (pandemic), prices would never go negative like they did during covid. In other words there will ALWAYS be a support in prices for the bare minimum in which society can still function.
Lets take another hypothetical when the global economy is in BAU. Geological oil depletion would imply oil prices increase, which implies high inflation. High inflation in turn implies CB needs interest rates high which reduces spending, which in turn reduces demand for oil so there will always be a balancing act here. Please note, this scenario may not come to fruition if global population growth rate is declining below replacement.
There might be a point in which EROI will enter terminal decline so will global GDP possibly. Which will spell the end of the current economic system. It will be noticeable when living standards start to drop drastically i suppose. Electrification will soften that landing depending on how quick it is done. Also if population declines with oil depletion, then there maybe a soft landing also.
I personally think ww3 will occur before we feel any of the ill effects of geological peak oil.
Iron Mike
“I personally think ww3 will occur before we feel any of the ill effects of geological peak oil.”
On this one I pray you are wrong.
“The fact that central bankers and economists are energy-blind, and that even today most are clueless as to where currency comes from might provide some kind of get-out-of-jail card were it not for the fact that in the wake of 2008, they did nothing to disabuse the wider public of the notion that they somehow knew what they were doing. Indeed, given the complexity of the modern global economy, they might even have confessed that it is impossible for anyone to be in charge. But having taken the six and seven figure salaries that go with the job, this time around, we simply must hold them to account. As the old saying has it: “Fool us once, shame on you. Fool us twice, shame on us.”
You can read the whole article here .
https://consciousnessofsheep.co.uk/2023/03/22/of-course-we-should-hold-them-to-account/
HHH
I found this URL that helps explain what I think you are trying to say:
https://thepensivenugget.com/the-interest-rate-fallacy-mini-series/
Interest rates are a way of predicting future returns with regard to other investments.
Low interest rates say that business opportunities are not there. However, the shale phenomena was accelerated by low interest rates and higher prices for crude. So frackers loaded up on low interest paper.
Conversely, high interest rates say that business opportunities are there and businesses are likely to borrow.
HHH, Its not just Goldman:
https://www.zerohedge.com/markets/andurand-sees-oil-prices-hitting-140-year-goldman-sen-echo-optimism
I still see all events at tilting towards an inflationary outcome unless there is a complete breakdown in confidence in the banking system, bank lines, etc. Of course at that point it will not matter what the price of oil is, there is only a couple of assets I would hold in a deflationary depression that you “seem” to be calling for, I hope I am not putting words in your mouth.
Inflating the debt away is the preferred outcome rather than wholesale default. But who knows, the variables and complexities and the abilities of officials to come up with here-to -for unknown ways to inject liquidity where it is needed tilts the outcome in favor of inflation, in my opinion.
there might be a time to sell your gold. but today is not that day.
Central banks don’t inject liquidity like they say they do. Rate cuts don’t inject liquidity. QE doesn’t inject liquidity. Currency swaps don’t inject liquidity. That’s all bullshit.
Dealer banks distribute liquidity. And those in need of liquidity have to have collateral to borrow that liquidity. If you don’t have collateral then you don’t have liquidity. If the collateral you do have is impaired then you don’t have liquidity.
No collateral no liquidity no $140 oil. Prices aren’t set. Prices are bid to whatever level they are at.
You have too much faith in the central government, central planners. Because you believe they have a printing press.
Japan has been doing QE and rate suppression for 30 years. Has it worked at any point over those 30 years? The answer is a resounding no it hasn’t. Why? Because all that stuff isn’t what they say it is. It’s just smoke and mirrors.
Tom,
From my recent experience, there are fewer and fewer banks willing to loan to the domestic upstream Petroleum Industry. Our company just secured a line from two different banks on two different assets. I would say only a handful of banks were interested in our business. Both lines are undrawn and since the most recent price downturn, the banks have cut the line by almost 30%. Additionally, they have required a hedging requirement of almost 50% of 2023-2024 production based on a strip deck for both oil and gas commodity prices. Based on our hedge of gas at $4.00 per MCF for the next year, the line of credit equates to approximately 1.5 years times cash flow and approximately 30% of the proved developed producing net present value with zero credit given to Proved Undeveloped (PUD)locations, and zero credit for Proved Developed non Producing (PDNP) or simply zones behind the pipe.
If prices do not fall any further, I would anticipate, this Spring Bank redetermination season will continue to reduce the lines of credit available to the Oil and Gas Producer. While many oil and gas companies enjoyed a banner year last year in profits, the first quarter of 2023 will show a substantial reduction in net profit for those companies who are not aggressively hedged for 2023. Natural Gas prices stood at above $7.00 per mmbtu in November of 2022 and are now in the $2.26 range per mmbtu.
In running single well economics for Haynesville wells, at these low prices, moic (multiple of invested capital) pencils out to a return of approximately 1.25:1 which is a slim margin to incentivize drillers to continue to drill. Since most of the production from these wells comes within the first 18 months, I anticipate there will be a significant slow down in drilling for dry gas in every one of the shale basins for sure.
Since PE for the most part has vacated the upstream sector, most companies private and public will have to drill out of a reduced cash flow, we would expect with the smaller publics, dividends will be cut depending on each company’s hedge position.
In summary cash flows on new drilling will be very modest, labor and material costs remain stubbornly high, banks will continue to be constrained and restrict credit and large PE is still on the sidelines.
However, for those with capital, we think it may be really great time to make acquisitions based on the current strip pricing deck and money will be raised from family offices interested in investing at this low point in the cycle.
Earlier, I predicted production in the shale would rise modestly. My thoughts are changing and unless commodity price rise, I predict flat to slightly down production coming from the shale basins and leaning more to the later side of production being slightly negative.
The recent banking crisis during these past two weeks has placed a spotlight on these smaller regional banks willing to lend money to the upstream oil and gas industry. While we believe there very few if any problems with Energy loans in these smaller banks, we would bet that there are more issues in their real estate portfolios which have not been fully recognized yet. This will only serve to again restrict loans not only to the real estate industry but will spill over into tightening credit for all businesses served by these smaller lending institutions.
I hope I answered your question. This has been our experience and perhaps someone else on this blog has a different point of view.
LTO S,
That is an exceptionally concise – yet comprehensive – snapshot of what seems to be unfolding in the upstream hydrocarbon world regarding financials.
Thanks for posting.
Thanks. I could speak more on this but it is interesting to notice Diamondback’s 4rth quarter profit was barely higher than their 2021 4rth quarter. The First quarter profits for Energy E&Ps in 2023 could be appreciably lower depending on the different hedge books of the various companies. Most companies cannot hedge new production coming from wells drilled currently therefore it could spill over into the second quarter again depending on the commodity prices.
https://www.worldoil.com/news/2023/3/22/quantum-energy-u-s-shale-drilling-to-drop-20-at-current-energy-prices/
According to Deputy Prime Minister Alexander Novak, the Russian Federation will reach the goal of reducing production by 500,000 bpd in the coming days
MOSCOW, March 21. /TASS/. Russia has decided to extend the voluntary reduction in oil production by 500 thousand barrels per day (b / d) until June 2023 inclusive. Deputy Prime Minister of the Russian Federation Alexander Novak told journalists about this. link:https://tass.ru/ekonomika/17329443
OPRITOV ALEXANDER
I find it difficult to believe that Russia has cut 500 kb/d of production in February and March. If they had, I would have expected the price of oil to respond to the upside. Add in what has happened over the past week with oil dropping to a new low this month, it is difficult for me to believe that the cut was there in March.
I wonder if this was an attempt to jawbone the price of oil up.
Perplexed.
Ovi, they did not cut anything in February. And they are only in the process of cutting right now. And in mid-March, they said they were in the “process” of cutting 500K bp/d.
Dated 21 March: According to Deputy Prime Minister Alexander Novak, the Russian Federation in the coming days will reach the goal of reducing production by 500 thousand bpd.
So they began earlier this month and will soon reach their goal. I think the process is mostly decline due to sanctions. However….
Thanks for the clarification.
Dennis – It should also be noted that the group of 9 you mentioned have dropped 0.3% annually for the past 4 years, are you expecting this 0.6 MBpD deficit to change sometime soon to get them back above the 2018 peak?
Previously you were placing all the production increase on US, but sounds like you aren’t seeing that happen anymore?
Curious if anyone has seen analysis broken down as follows:
(Tier 1 producers above 10 MBpD – Top 3; US-Saudi Arabia-Russia)-32 MBpD; 42%
Tier 1 2P total URR is ~200 Gb (43%); Cumulative production of ~700-800 Gb; currently 25% remaining based on 2P.
(Tier 2-3 – Canada-Iraq-China-Brazil-UAE)-19 MBpD ; 25%
Tier 2 2P total URR is ~140 Gb (30%) Cumulative production of ~300 Gb; currently 33% remaining based on 2P.
(Tier 3-1 – Kuwait-Iran-Kaz.-Nor.-Mex.-Qatar-Nig.-Lib.-Ang.-Oman-Alg.)-17; 22% MBpD
Tier 3 2P total URR is ~100 Gb (21%) Cumulative production of ~450 Gb; currently 18% remaining based on 2P.
(Tier 4-0.1 – UK-Colombia-Venez.-Azerb.-Indo.-Arg.-India-Egypt-Mala.-Ecu.-Aus.-Congo-Gasbon-Turkmen.-Ghana-Viet.-Bahrain.-Thailand)-8 MBpD; 11%
Tier 4 2P total URR is ~30 Gb (6%) Cumulative production of ~250 Gb; currently 10% remaining based on 2P.
What is noteworthy is that Tiers 1 & 2 only have around 30% remaining if using 2P (if a higher value is used that could become 50% remaining).
URRs:
Tier 1 – ~1,000 Gb (minimum 20% remaining and max of 50% remaining)
Tier 2 – ~500 Gb (33% remaining)
Tier 3 – ~500 Gb (20% remaining)
Tier 4 – ~300 Gb (10% remaining)
Total remaining (~25% of URR) between 500 to 700 Gb (20 years supply +/- 5 years), but would likely play out over ~20-40 years based on decline rate between 1% to 5%
Total 2,300 Gb (assuming 2P) – this would equate to a 2011 peak for the half way point, which I think aligns fairly well with data. Might need to exclude US tight oil.
So we enter the 4th and final chapter of the oil age soon (2025-2050). 1850-1950 was the prequel. 1950-1975 was the great ramp up, 1975-2000 was the growth period, 2000-2025 was the plateau, 2025-2050 will be the great ramp down…
Kengeo,
Hmm, has anything unusual occurred in the past 4 years? In 2019, OPEC plus cut output because the World eas oversupplied with oil in 2018, in 2020 and 2021 we had a major Worldwide pandemic, and in 2022 a war in Eastern Europe affecting the 2nd largest World oil producer in 2018 (Russia). I have always expected increases would occur in several nations, including the US, I have focused on tight oil because that has increased by roughly 7.3 Mb/d from 2008 to 2019, my expectation is that US tight oil will grow moderately from 7.3 Mb/d in 2021 (annual average) to an annual average of about 9.9 Mb/d in 2028, and average annual rate of increase of roughly 433 kb/d per year over 6 years (2200 kb/d divided by 6).
URR estimate for the World by Laherrere from 2018 is about 3000 Gb with roughly 2700 Gb conventional and 300 Gb unconventional (tight oil and extra heavy oil), his estimates have tended to be quite conservative in the past.
Dennis – So you do believe in fairy tales!
I’ll entertain that notion…if we look at 2PCX=~1550 (Rystad) for Tier 1 thru 4 we get following:
Tier 1 (Top 3) – 600 Gb remaining of 1350 Gb total (59% depleted)
Tier 2 (#4 thru #8) – 400 Gb remaining of 700 Gb total (43% depleted)
Tier 3 (#9-20) – 300 Gb remaining of 750 Gb total (57% depleted)
Tier 4 – ~250 Gb remaining of 500 Gb (50% depleted)
Overall – 1550 remaining of >3000 Gb total (~50% depleted)
2PCX includes existing fields, contingent resources in discoveries, and risked resources in undiscovered fields. For the 250 Gb that haven’t been discovered, what period do you expect those discoveries over? 10 yr, 20 yr, or more?
So no matter how the problem of peak oil is approached (using realistic estimates of remaining oil, or using completely bogus estimates which overestimate future discoveries) it’s 100% in the rear view…(we can disagree on the height of the production peak, but not the mid-point – it’s simply a point in time when half of all producible oil is above ground while the other half is still in the ground. Not entirely clear yet, but we have a range of dates of when that could have happened. For 2000 Gb total producible oil, the mid-point was 2005. If you want to pick some intermediate ranges, say between 2250 Gb and 2750 Gb, you can place the mid-point somewhere between 2010 and 2018. If you fancy a much larger value of 3000 Gb, then you get a mid-point of today (2023). 3300 Gb pushes the mid-point to 2028 (which I think is the timeframe you have in mind, about 5 years from now…
We can all agree that somewhere between 1/2 and 3/4 of the world’s ‘easy-to-get’ oil has been consumed.
Some think the final decent started in 2015-2020 time range, others think it will start very soon (<5 years).
No one at all thinks we will continue to see the production growth cycle which dominated ~1985 thru 2015.
Please take another look at the fundamental points Laherrere makes:
He spells out that discovered conventional oil is 2150, of which 1400 has been produced thru 2020. This aligns perfectly with conventional oil plateau in 2005, see below…
"…global production of conventional oil (purple line) has been on a plateau since 2005…"
"Thus, we suggest that the global reserves of ‘realistically-accessible’ oil (essentially, conventional oil including ‘light-tight’ oil) are probably only about 750 Gb or so"
"Overall, the key conclusion of Fig. 7 is just how soon are the expected peaks of global production for all four aggregations of oil. This in turn reflects the nature of a Hubbert curve, where a significantly greater URR leads to a higher production peak but one not much postponed."
I think we may disagree on exactly what message Laherrere is making, ultimately though – I think we are agreeing on the take home message which is a major decline in world oil production hasn't started yet, it's lurking right around the corner and will likely happen sooner than anyone anticipates.
Kengeo,
I disagree on what you claim Laherrere has said. In his 2018 paper analyzing the 35 largest oil producing nations he estimated C plus C less extra heavy (XH) oil as 2700 to 3000 Gb, an average of roughly 2850 Gb, if we deduct tight oil from this (say a URR of 70 Gb) we get a conventional oil URR of about 2780 Gb, my estimate is 2800 Gb, with 70 Gb tight oil and 160 Gb of extra heavy oil.
These are not fairy tales, these are estimates by knowledgeable people, a recent 2022 estimate by Laherrere and others is a URR of 3500 Gb, some 500 Gb higher than my estimate. My estimate is perhaps too low by 500 Gb, the fairy tale is thinking that 2500 Gb or even 2800 Gb for World C plus C URR is correct. Such claims are the reason people do not take peak oil seriously in my opinion.
Quite simply they are poor estimates.
Note that discoveries are a combination of new discoveries and reserve growth of previous discoveries.
Someone At The EIA Is Sniffing GLUE…
Amazing how U.S. oil production can remain at 20 million barrels per day for the next 30 years, while the EIA reported reserves that may last until 2030.
However, Oil Production Forecasts are now Political in Nature because who on earth wants to start a PANIC?
It’s much easier to draw a straight squiggly line across than scare people with one that declines in the same way it came up.
steve
I posted this on the 8th of March, two weeks ago. It got not one comment, not one! So I am posting it again, in hopes that on this Peak Oil Site, someone will notice it.
Understanding Peak Oil: What It Is And Why It Matters
Are we running out of oil?
This question has been on the minds of many experts in recent years.
The answer lies in the concept of peak oil – the point at which global petroleum production reaches its maximum potential and begins to decline.
But what does this mean for our future? Will we have to give up our cars and switch to bicycles? Or will new technologies save us from a world without oil?
In this article, we’ll dive deep into the topic of peak oil and explore its causes, implications, and potential solutions.
What Is Peak Oil
Peak oil is the point in time when worldwide petroleum production reaches its maximum point and begins to decline. It occurs when reserves of easily accessible oil are depleted, and it becomes increasingly difficult and expensive to extract remaining reserves.
The concept was first introduced by M. King Hubbert in the 1950s. According to his theory, once half of a given reserve has been extracted, production will begin to decline until all recoverable resources have been exhausted.
There is a lot more to this article, far too much for me to post all of it. But Peak oil is suddenly in the news. There are other atriclles out today on the subject. Just click on the links below to read them.
Forget peak oil demand: A thirst for barrels puts $100 in view
Oil consumption is heading for a record this year and supply can’t keep up.
Peak-Oil Fears Cast Shadow Over US Supply Outlook as Costs Climb
The specter of peak oil that haunted global energy markets during the first decade of the 21st century is once again rearing its head.
On the Return of Peak Oil and Other Long-Term Forecasts
US shale oil production is peaking and will enter permanent, if gradual, decline.
“Energy Cannibalism”
https://jpt.spe.org/plummeting-energy-return-on-investment-of-oil-and-the-impact-on-global-energy-landscape
Dropping productivity
https://twitter.com/BernsteinBuzz/status/1636040790932594689
RON,
Yes, I saw it, and you are SPOT ON. I hear people discussing Peak Oil Demand, and my thoughts on this are… “DID IQs DROP SHARPLY WHILE I WAS AWAY?” Quote from the movie Aliens.
Supply = Demand. The world will get as much as the supply will offer, not a bit more.
What we are now witnessing is the ENERGY CLIFF.
While the Middle East Oil Shocks (1973 & 1978) caused massive inflation throughout the world, it was due to “Curtailing Supply.” This is no longer the issue. We have just run out of most spare capacity, and the degree of volatility will only get worse going forward.
Lastly, while the oil price may begin to go back higher, it looks like we are heading to SUB $2 Natgas and possibly $1, due to Europe being 118% higher in Natgas Inventories vs. last year and the U.S. at 5-Year highs. And, we are just getting into the Natgas Building Inventory Season.
steve
Supply = Demand . Correct . The question is the price . If you can’t afford it , then you can’t have it .
Rationing by other means ?
Companies with zero debt will shut in Natural gas wells at below $2.00
I been burned before. Like many, I was convinced of the 2008-2010 peak. It was a hell of a way to discover I know nothing.
So, as oil possibly enters terminal decline, and as a complete non-expert, I tremble to say anything to anyone.
Besides, it doesn’t fucking matter anyhow. My geology professor knew back in 2007 that it was too late to mitigate.
“too late to mitigate”
… more apt to adapt ?
I think it was Westtexas, i.e. jeffery Brown, who stated in ~2010 or so that you should prepare, but do it wisely, in a way that works in both worlds. As an example, reducing energy use (at a reasonable cost of course) will pay off either way even if energy isn´t that scarce/expensive in the future.
As it is now in Europe insulation and better windows was a really good investment for me.
Better than CS bonds at least : )
USA Shale Drilling Set for 20 Percent Drop at Current Prices
The US shale patch may lose as much as 20% of its activity over the next year if energy prices hold at current levels, according to one of the biggest private equity players in the industry.
Crude would need to rise by about 15% to $80 a barrel, and gas would have to climb by more than a third to $3 per million British thermal units for drilling and frack work to maintain its current pace, Quantum Energy Partners Chief Executive Officer Wil VanLoh said in an interview Tuesday. Oil and natural gas prices have slid since mid-2022 on fears of a global economic slowdown.
The rig and Frac numbers over the next month or two will give a pretty good clue on management’s plans on how to allocate funds. I still think the new norm is slow and steady. Drill baby drill is dead. Italics are mine.
https://www.rigzone.com/news/usa_shale_drilling_set_for_20_percent_drop_at_current_prices-22-mar-2023-172341-article/
Don’t know if it was posted earlier .
The x-axis ends at 2020 and this is 2023. Would like to see the recovery such as it is.
EIA completes study on rising crude oil adjustment, with two upcoming changes to reduce it
https://www.eia.gov/petroleum/weekly/
Thanks T3. I knew the EIA was overstating the Crude Oil Inventories. If you look at this mornings numbers just based on net imports, crude would have drawn 12 million barrels. Anything to prevent the oil price from rising. First draining the SPR, now manipulating the inventory numbers to keep gas prices down. Wow we are in deep trouble. I would bet the crude oil inventories are overstated by at least 85 million barrels.
No doubt.
I still can’t understand how we were releasing 1 million BOPD from SPR and treading water on commercial, and as soon as SPR release stops, we build.
Hey, keep gasoline at $3.50 or less, and see how high demand spikes in summer driving season.
Someday they won’t be able to lie anymore and it will be like slots hitting jackpot.
Funny thing. We SI for 4 weeks late April and early May, 2020. We thought we lost production. We saw and INCREASE in 2022 over 2021 of over 3% with ZERO wells drilled. 2023 is ahead of 2022, but weather matters so much so won’t make any definitive statements till year end 2023.
Gotta love our little field, 300 million cumulative and still cranking. Will be 118 years old 8/29/23.
On that date in 1905, the great wildcatter, Mike Benedum, and his partner, Joseph Trees, hit pay on a 25 IP well. Well #2 was a gusher out over the Derrick, 2,500 IP, and the rest is history. So many lives spent in our little field, so many mouths fed.
Very hard not to be proud of our history. Mike gets it. He’s lived it more than my family, and that’s why he shouldn’t get dissed on this site. The man is stripper well royalty.
Such an untold story, the thousands making a living in the US on tired old 1 BOPD and less wells.
Shallow, what a kind, gracious thing to say to me. Thank you.
We have known of each other a long time ( a decade, I suspect ?) and have exchanged many emails and lots of oily stuff between each other. Your family’s history, in the VERY historic IB, is amazing and you should be very, very proud. I am proud for you and your entire family. It is astounding work y’all have done.
When the tight oil and tight gas industry is gone, gassed out and unable to con anymore money out of anybody, history will show it was nothing but a very credit dependent speed bump in the long road to depletion. A fart through tight jeans in a strong, north wind.
So many internet newby’s to our industry, so many self declared “experts”…tight oil and gas was really not very much to get excited about, ever. It was the PERFECT example of the end of affordable oil in the world. All it took was OPM to make work; the hypocrisy of how it changed everything is astounding to me, still.
YOU and YOUR family will still be standing when the Wolfcamp looks like a raisin, doing what you’ ve done for 50 years, providing America what it needs. NONE of your oil, I know, gets exported; it’s a valuable resource to our country for its quality.
Don’t buy into the snide remarks about lowly stripper well operators. We can stand, always, on our own financial feet. I suspect you and I could buy most of these “professionals” here below American Express card credit limits. So what?
Hopefully YOU know, at least, I love the industry I was born into and spent my entire life in. That I broke my back in, literally. I love it with all my heart…my beloved Texas and my country. I am critical of the manner in which the last of our nation’s resources are being grossly (mis) managed, by idiots. Private enterprise to regulators to politicians. I am simply not a sheep.
We as an industry can always do better and to regain the trust in America we deserve, we need to set aside enormous egos, politics, this peak oil bullshit, and simply tell the truth. America deserves that from us.
Thanks again, sir. Good night.
Mike.
We haven’t done anything astounding. The people that deserve the credit are the ones like you, actually out in the field daily, and the employees and contractors who keep our wells pumping. People who are on call 24/7, which is always the case when the primary job is handling the produced water.
I think it has been about 9 years, 2014, when I started reading here. I was trying to determine the economics of US shale, oil particularly.
People have different agendas. I really don’t know most peoples backgrounds here. But I do know yours and LTO’s, so I pay attention to your posts.
I guess my views are less political, and more about the financial side of oil production. The economics have to work. I also think a lot about the environmental. It seems like the environmental aspects of oil are most polarizing.
I’ll try to stay out of fights. I’m afraid the last one I was in indirectly led to another poster, whose posts I also respect, leaving. Gerry contributed very much here.
Take care.
yep
Giovanni Staunovo🛢
@staunovo
·
1h
EnergySec Granholm said the 26mb SPR sale, in which oil will be delivered from April 1 to June 20, and maintenance at the reserve at two sites will make it difficult to buy back oil this year #oott
Quote Tweet
Giovanni Staunovo🛢
@staunovo
·
1h
US energy secretary says it could take years to refill oil reserve
Ovi – CNRL oil sands reserves. The chart says bitumen but most are actually listed as net synthetic crude oil. CNRL has bought a lot of assets over the last few years including much of Shell’s original holdings.
George
Thanks. CNQ produces close to 900 kb/d of crude. Using the 10,000 mmboe of proved undeveloped gives close to 30 years of production. Below are a few links to articles regarding the sale.
Murray Edwards, the CEO at the time, apparently walked across the street in London to close the deal with Shell. At the time WTI was $46/b and Shell was under pressure to start to shift to clean energy. Shell sold the CNQ shares they got for $Cdn44 in 2018. Today they are $Cdn70.
https://globalnews.ca/news/4194135/royal-dutch-shell-canadian-natural-resources-sale/
https://financialpost.com/commodities/energy/shell-to-sell-all-but-10-of-canada-oilsands-assets-to-canadian-natural-resources-for-7-2-billion
this is great point from Abhi commenting on Equinor economist regarding the “transition”
“💯 truth from
@Equinor
— and this is largely the fault of policymakers and energy virtue signalers at the highest levels including the UN etc
We won’t get to needed levels of clean energy spending in the next 10 years minimum. Hope doesn’t create money ”
https://mobile.twitter.com/ARaj_Energy/status/1638881282724864001?cxt=HHwWgoDR3f31vL4tAAAA
Wasn’t sure where to put this comment, seems applicable to many/most of the discussions here:
Dennis – Got (peak) electricity???? See chart for N.A. below…
EVs, big and small use it…as far as I can tell electricity generation is tied directly to oil production growth, hence essentially flat since 2007…
Another line of evidence for peak oil back in 2007…
Even if we could get the semi EVs in large numbers (not likely), they would not be ‘Megacharging’…that’s for damn sure…
My biggest take away is we need to fast track nuclear reactors at a scale never seen before…
Kengeo,
Chart below uses data from BP Statistical Review of World Energy for World electricity generation in TWh per year.
Less electricity is used by Noth America because we import many manufactured goods that are produced elsewhere so less electricity generation is needed. The World data is a better metric. The average annual growth rate in elctricity generation for the World from 1985 to 2021 is 2.95% per year.
KenGeo. You clearly haven’t spent much time keeping on the electricity sector. I know you can do better than 6th grade level on the subject.
Oh thank god, I’ll reach out to China and see if they can send some cheap electricity to North America. Silly me – What was I THINKING???!
Maybe we can ship the EV Semi’s to China, get them all charged up and ship them back?
But seriously, to some degree any EV growth will be curtailed by the high electricity costs that result from that growth, this will create or has already created a serious headwind to future EV growth…
EVs have or will become victims of their own success…
Let China know that Europe is interested too in all their extra electricity…
(Europe and China actually might be able to trade Electricity if everyone in between can agree on it, I’m sure there are some obstacles but more realistic than N.A.)
Kengeo,
Similar problem to North America, more high energy manufacturing occuring in other nations, simply a lack of demand, also better efficiency of appliances and lighting. No doubt there is excess generation capacity in Europe as well, charging EVs will not be a problem.
That doesn’t sound right. More like price spikes pushed consumers to more efficient devices/uses…
https://www.enerdata.net/publications/daily-energy-news/german-residential-electricity-prices-doubled-between-2000-and-2014.html
Jevons paradox
https://en.wikipedia.org/wiki/Jevons_paradox
China will be happy to send you some cheap electricity. They’re called solar panels. And they will charge your EV for the next 30-40 years. If you don’t have the financial sense to take advantage of that combo deal then nothing can help you.
Very well put, a concise statement I agree with.
Too bad we don’t have the amount of sunshine here in Northern Europe to fully take advantage of this. Roughly 1/3rd of the potential of California (depending on a lot of variables as always when it comes to energy).
Kengeo,
Lots of capacity in the US to produce electricity, this is simply a demand problem. In 2021 only 44% of combined fossil fuel, hydro and nuclear generating capacity was utilized in the US, plenty of potential for more electricity output if needed. Less electricity supply due to lower electricity demand, it is that simple.
Electicity supply for EVs will not be a problem. Also most EV charging occurs during low utilization periods, basically charging the car overnight.
Dennis – Take a look at the continuing price increase in electricity. Do you really think the grid is in any position to add significantly more capacity? Prices usually fall when supply is greater than demand.
Kengeo,
Prices have increased in general. No more capacity is needed, only 44% of existing capacity is being utilized. Much of the cost of electricity is transmission and distribution rather than supply, most people understand this, it is not very difficult to understand. Just look at your electricity bill.
The electrical grid capacity, capability and management will need major upgrading to handle the energy situation of this century, starting about 30 years ago.
[A portion of the money spent on the Iraq invasion and nation building (hah) would have been enough to cover to the work].
A coordinated effort from the government would be how they handle things like this in China. Here we stumble along, hoping that people are awake enough and focused to get important jobs done. seems everyone is more focused on obstructing the other team, than on getting results.
Dennis,
Looking at it from a Norwegian perspective, we already have an oversized electricity network compared to most nations. This is because the aboundance of hydro power made it resonable to heat homes based on electricity alone. Now, heat pumps are reducing that proportion of the electricity expenditure. With the current infrastructure a 7.2 kw ev charger is just enough to overnight charge a 2.5 ton EV car. It works out great. Still, a lot of work is being done to expand and making the electricity network more robost (nationalised through Statnett). I guess the US can make it work, given increased grid infrastructure and that renewables can make sure electricity supply is good enough. Ultra light EV’s, hybrids and some sort of reductionism overall is most likely in play as well.
The U.S won’t do that because they don’t believe in nationalised utilities and infrastructure, everything MUST be privatised otherwise it is labeled as socialism or worse communism lol.
Neoliberal idealogy is rampant in most western countries at the peoples peril and only primarily benefits shareholders at the taxpayers expense.
You are lucky Norway hasn’t been poisoned with neoliberal economics and idealogues.
Iron Mike,
Much truth in that, though some policy measures in the US do encourage certain types of investment, generally in the US it is believed that private investment is better than government run industries, though from a neoclassical economics perspective this tends to lead to underinvestment is those industries that have positive externalities, which is unfortunate and leaves the United States worse off as a nation.
Dennis, I really don’t know how to comment to this only 44% is being used statement. So I’ll try this. For any country to be great and provide the standard of living for its citizens that all humans aspire to have. The ability to provide electricity must be the amount needed on the hottest or coldest days the country experiences. Right now the PJM system has an 80,000 MW load but come this summer 135,000 to 140,000 MWs is not out of the question. The average usage is meaningless
Ervin
It’s that way of thinking that supports wind and solar. People don’t understand demand and demand charges or generation. In an electrical grid you can only have one variable not two. Our system is built on variable demand with Dispatchable generation. The other choice is variable generation with dispatchable demand. Meaning you shut of power anytime your demand exceeds supply. That’s the future for a preview visit South Africa.
“You can only have one variable not two”
No that’s silly. It’s easy to implement time of use (TOU) charges for electricity and people will respond effectively to this. Load-shedding devices on things like water heaters that draw a lot of juice but are unlikely to be needed when demand is high are another, not many people taking hot showers when it’s 100F out so no real loss, people get a discount for installing them and if you insulate your water heater it doesn’t even affect you.
The real problem here is that we build houses without any internal thermal mass to store energy during the day or night. Instead of being able to stay cool through a hot summer day we have to constantly use mechanical means rather than passive means to keep them cool since there’s no thermal battery. Which is why on the energy descent we will be building homes out of cob rather than wood, plastic and drywall. Look out for a new book on cob coming out late this year.
https://newsociety.com/products/9780865719682
Get used to electricity generation, transmission, storage and use being the dominant energy mechanism for almost all uses.
Because that is exactly what is in store for the country and the world.
Ervin,
There is a simple solution for peak loads and that is demand pricing, customers can get reduced rates for low use hours and most EV charging will be done during those hours, I have time of use electricity billing and pay about 5 cents per kWh less from 9 PM to 7 AM, most of my charging for my cars occurs during those low use hours. Most EV owners will choose this option and will not be charging their cars during peak electricity demand periods.
Currently in areas with good wind or good solar resources wind or solar are the cheapest form of electricity generation. Natural gas will play a backup role in the future and coal fired electricity will be eliminated.
A note to my fellow oil men.
Today I received a check in the mail from Devon Energy. It was a relatively small check, mid 5 figures. The reason I was sent this check, was back in 1900 my great grandfather settled a small 80 farm in Blaine County Oklahoma. He had 7 children, two were lost in childhood, two others died in WW11. I know all this because I contacted my relatives to notify them of this pending development (Devon and DOW joint venture) and to help them to get their titled cleared up so that they can also receive their royalty payments. Passed down to my grandmother, and then to my mother and then to me and my deceased brothers son. It’s a great story. While this will not impact my life there are many if not most who will really need this kind money.
So what is my point. The point is this all over Texas, Oklahoma and other states with similar oil and gas rights, individual are profiting, schools are getting new books maybe better facilities, counties are better able to serve their residents, the multiplier effect is huge. Each time this happens to an individual or family a new conservative republican is born. They have a stake in the outcome, they laugh when ole joe goes on and on about phasing it out.
The production and the facilities bring in huge revenue to all levels of local government and with that, political clout. The clout to keep the wolves away from the door. Clout to keep affordable reliable energy flowing, to industry, to business and our households and now even our trading partners. The next time one of you feels the need to dump on the industry, keep in mind standing alone you would be eaten alive, together we will prosper and thrive, with that i am going to the bank. 🖖
Yes TT , we get it why Republican are in denial about climate change and use family as a code word for personal financial interest first over humanities interest. About the closest thing I can compare it to is Mexican cartels who sell fentanyl across the border into Texas. It’s only income for them and their not the ones that have to deal with the damage from it. If it was really about family, you would care more about the environment your grandkids or grand nieces and nephews will have to live with.
Worse yet, Biden’s policies aren’t going to effect your five figure dividend check. You will be dead and gone before current oil production ends from the transformation to decarbonization. I guess Ron was correct and you wear it like a badge of honor.
“You are absolutely full of shit.”
Thanks for the ignorant rant HB, most republicans are small business owners, we run things, we grow things, we fix things and we know bullshit artist when we see them. If you and greta want to hold hands and wait for the world to end knock yourself out . Acting like a bunch of crazy Karens is NO way too run ones life, and if you think you are going to change the minds of over 60% of the US population, and 90 % of the world population that currently thinks you are the one that is FULL OF SHIT, you are going have to cook the climate books a bit more, get a few more screaming children on TV and come up with ever more climate hysteria that you and whoopee Goldberg can put on TV. 😎
https://www.rasmussenreports.com/public_content/politics/biden_administration/is_climate_change_a_false_religion
it would be an interesting experiment to poll people beliefs on a number of recent hoaxes to see what part of the population is just prone to believe false narratives that the media puts out. If thats the team you are playing on all I can say is god’s speed😂
“Perhaps because of different choices in news media consumption, Democrats are significantly more likely than other Americans to overestimate the death risk from COVID-19. Twenty-eight percent (28%) of Democrats think more than 10% of people diagnosed with COVID-19 have died from the disease – more than five times the actual mortality rate. Just 14% of Republicans and the unaffiliated believe the COVID-19 mortality rate is over 10%.”
“most republicans are small business owners, we run things, we grow things, we fix things and we know bullshit artist when we see them”
That’s a fucking laugh. Trump got his money from his daddy just like you. Never punched a clock working in his life. His whole career has been lying and playing the victim. Republicans, the party of power hungry narcissist. Just at least know who you are. Full of “shit” and “denial”.
For those who prefer to engage in “looser think” a bit of reality, not that it will do any good to you HB.
https://www.businessnewsdaily.com/2871-how-most-millionaires-got-rich.html
There are two types of millionaires: self-made millionaires and those born into wealth.
More than two-thirds of individuals with a net worth of $30 million or more are considered “self-made.”
No matter how millionaires get their money, they all share some core traits, including prioritizing savings and diversifying investments.
This article is for those curious about how self-made millionaires got to where they are today and hoping to learn something from their success.
TT, I value my environment and self made abundance. My father didn’t raise myself to demonize or damage others for my personal financial gain. Neither did he leave myself an endowment of money and entitlement. I started my career washing inside rear car windows for $1.35 per hour. I had my own insurance brokerage for over 20 years. My industry makes the case that without insurance, there would be no advanced business. I still get direct deposits every month from my prior work, not daddy. I live where you and your family wish to vacation.
If you are so smart, how come you have so much money?
Mike, Shallow LTOS and other OIL MEN, you see what HB did here? He compares those providing the oil and gas, that the entire world uses and depends on…. to mexican drug cartels… and for that ridiculous comparison there was not one single reply from you guys. I find that fascinating. Does that make it clear where and who you should use your time demonizing rather than fellow oil and gas professionals, I could not make the point any better.
Unlike your approach, and I am not saying you are wrong, but I will not for one minute lay dawn for these maoist/Stalinist types to run over me.
IN the words of George Patton as portrayed by George C. Scott, I intend to…
“We’re going to hold onto him by the nose, and we’re gonna kick him in the ass. We’re gonna kick the hell out of him all the time, and we’re gonna go through him like crap through a goose!”
this is a metaphor so no one will be confused🖖
“He compares those providing the oil and gas, that the entire world” is addicted to and destroying the environment humans need to live. “To Mexican drug cartels” which destroy lives selling drugs.
Garbage man you are intentionally in “denial” and Ron thinks your full of shit(me too). You should spend half the time you waste making a fool of yourself from denial and educate yourself on the effects of the “entire world” burning fossil fuels has on the environment. Instead, you play the victim to protect your self pronounced entitlement. Stop dumping your garbage truck here and educate yourself.
I don’t blame those who produce oil from the ground. I disdain those who deny the effect of burning it for personal gain like you. Your all metaphor and no cattle.
“Your all metaphor and no cattle.” you are wrong there HB, I do have cattle, black angus, grass fed, steroid free. Spent the whole weekend with them, the oil business and the cattle business go hand in hand here in Texas.
Supplying food and fuel to my fellow man…Texas and texans will be doing just fine two or three decades from now, but I am not sure we have room enough for all the Mexicans and the Californians.
TTT actually did a very good job of explaining the motivation of the segment of the country and the party that has worked hard to obstruct energy transition since the 1970’s when conventional oil production in the lower 48 peaked.
Its all been about personal vested interest, to the point of outright greed frankly.
Entitled to privilege. And you wonder why the majority of voters find no admiration for that political position.
Help me a bit hickory, is there any other purpose of business other than to make money, why do people go to school, why do people invest their money?
Now let’s talk greed you know the hunter biden type of greed, the hookers, the drugs the selling of ones political office ….thats greed, going to school starting a business building it, running it through ever changing regulations, shut downs, price fluctuations that’s called work not greed and all successful people engage in it it. Give it try, that is if you got some stones.
“is there any other purpose of business other than to make money”
Its about getting a job done, and providing for yourself, family and wider community.
Gloating about your smug entitlement
is not business, and it is not work.
Tell you what hickory, You need start every conversation with the AA model, “I am hickory and I think Like a loser”. That way people like me will not need to engage you to find out your core philosophy. With that I will say the oil and gas community does get the job done, does provide for ourselves and our families and the wider community, that was the whole point of my post.
To the extent that offends you I am pleased.
Hickory
You’ve been deceived by urban myth. Electric cars were not run out of business by big oil. Their range was too short to have practical value. The power to weight ratio of oil is simply superior . Without oil there would be no airline industry no container ship industry no rail industry and trucking industry. At least not one we recognize. And by the way oil is solar energy.
I was just reading a podcast on hydrogen and had no idea that the global production of hydrogen produces more CO2 than the airline industry. Most hydrogen comes from gas and coal. And 1/3 is used in the Haber Bosch process to fix nitrogen for fertilizer. And by mass half the nitrogen in our bodies come from the Haber Bosch process. Are the greedy oil companies responsible for that to? They cornered the food market?
I don’t think so. I completely agree with TTT that oil is business like any other and on a competitive scale won the battle with alternatives hands down no fight. Alternative systems are only appearing now because of desperation. And personally I don’t think they can work. Which we’re already seeing in Europe.
Anywhere on earth using any process known to man, the energy content in the hydrogen that’s produced is at best one half of the energy needed to produce said hydrogen. What’s the point?
My point is indirectly fossil fuels are part of the human ecology even at a molecular level. We basically can’t live without them now.
I got you beat HB, I stared my “career” as I garbage man. That’s right I started at 16, Not counting being paper boy, mowing yards etc, as a garbage man. Riding on the back of a truck picking up garbage 10 hours a day on Monday and Tuesday, 8 hrs a day wed and Thursday and 5 hours on Friday. I was so good at it they promoted me to driver of the garbage truck 😂
Of course a couple of summers as a roustabout and I spent more holidays and weekends sitting wells than with my family. We all got stories. The only thing I would add is I have not set foot in California since the 1960’s but I have met a number of Californians that are very happy to have left the place to make a new future for themselves here in Texas. If I had you for a neighbor I can sure see why! happy for your good fortune now perhaps we can focus on ideas rather than name calling.
https://www.borowitzclark.com/californians-are-relocating-in-huge-numbers-where-are-they-going/
The S&P (ex-IHS) upstream cost indices for 2015 are close to 2015 levels. However that was the bonkers year of highest industry capital spending, the last three years have seen the lowest spending since at least 2000, and inflation adjusted last year was probably the lowest.
https://www.spglobal.com/commodityinsights/en/ci/Info/cera/ihsindexes/index.html
Downtsream costs are are highest ever.
PE for the most part is gone. This is why spending has been diminishing plus the lending institutions have red lined this industry due to ESG and climate activism. We will face an energy cliff in unconventional drilling and development if prices do not rise and on the flip side could be significantly higher prices.
PE=Private equity
Perhaps LTOS, just perhaps we have reached the peak of the esg con.
https://www.zerohedge.com/markets/esg-cover-begins
Last year was the highest by far for share buy-backs among the major IOCs and large independents. This indicates an industry slowly disappearing up its own backside for lack of investment opportunities, not one eager to grasp the renewable nettle (for all the guff coming from Shell, BP, Total etc.).
Dividends were highest too.
Debt pay down was highest.
Capital investment stayed low, and given the inflation in the UCCI (see above) the actual material investment in new oil and gas production was probably the lowest this century (maybe equal with 2020). Note that the ENI and TotalEnergies figures for this chart are estimates until the official ones come out in 20-f’s – their numbers in the other charts above are from 4Q reports so are final.
Some of Shell, BP and others investments were redirected to renewables (but notably not EM and Chevron), but nothing like the amunts paid for buy-backs, dividends and debt repayment.
Awesome – did you make those graphs?
rgds
WP
George great charts and summary, just a question when you state, “This indicates an industry slowly disappearing up its own backside for lack of investment opportunities” do you give any consideration to the fact that the oil market supply was in surplus, inventories brimming, unprecedented price volatility, as opposed to solely the lack of investment opportunity? Seems to me these issues are the overriding factors as well as the political and regulation environment. Add in the business cycle consideration but I bet in time new investment will come back to the industry, there will be new opportunities, but it will come in a much different supply and price and regulatory environment than what we have experienced in the last 6 years. It must, as there is currently no substitute.
+1 . Great charts . Several years ago was a presentation by Steve Kopits ( I think ) where he said ” The oil majors are in Self Liquidation mode ” . Your charts just confirmed this .
The EIA Is Dead Wrong About The Future Of U.S. Shale
In early March, the Energy Information Administration forecast that U.S. crude oil production would rise by close to 600,000 barrels daily this year to a record high of 12.44 million barrels daily. On the surface of it, the industry looked like it had every motive to boost production: demand was strong, especially from overseas, oil prices were higher than breakeven levels across much of the shale patch, and the federal government wanted more oil getting extracted.
However, this was only half of the story. The other half was about industry executives declaring the U.S. shale boom over, cautioning against expectations of much higher production and warning that cost inflation was making a lot of wells uneconomical. On top of it all, many new wells were not as productive as expected in a sign that the top drilling inventory of the U.S. shale industry was nearing exhaustion.
It was in this context that Quantum Energy, the private equity company focused on oil and gas, this week issued a warning: drilling in the U.S. shale patch could decline by as much as 20 percent if prices remain at current levels.
Crude oil prices need to rise to at least $80 per barrel and natural gas prices need to rise to around $3 per million British thermal units for the U.S. shale industry to keep drilling at current rates.
At lower prices, drilling will begin to shrink, especially at private companies that have much weaker balance sheets than the big players, Quantum chief executive Wil VanLogh told Bloomberg.
These comments echo similar ones made by Pioneer Natural Resources’ Scott Sheffield last year when he said that “You just can’t keep growing 15% to 20% a year. You’ll drill up your inventories. Even the good companies.”
Then there is the inflation problem, too, with double-digit price increases hitting the industry and curbing the positive effect of higher oil prices on balance sheets.
“We’ve seen anywhere between 30 and 50 percent inflation — depending on which cost category you’re talking about — that’s what we’re walking into in 2023,” said the chief financial officer of Devon Energy, Jeff Ritenour, during the company’s latest earnings call, in February.
Taken together, all these challenges would naturally combine for weak production growth, with that growth coming from the big shale oil and gas producers who can afford to make smaller profits after a record year.
https://peakoilbarrel.com/non-opecs-november-oil-production-increase-offsets-opecs-cutback/#comment-754209
Doosh Bank in limelight . Only surprised that CSB occurred first .
https://www.zerohedge.com/markets/deutsche-bank-bloodbath-reignites-global-bank-crisis-fears
Rig and Frac Count info is out
Hz rigs added 1 to 546 for the week ending March 24. They are down by 26 rigs relative to the high of 572 on Nov 25. Permian Hz rigs were up by two and Texas was down 1.
The frac count 2 weeks ago Jumped by 14 and was flat for the week ending March 24. The current Frac count is the same as it was 13 months ago on February 25, 2022.
It will take a few more months to see if the drop in oil prices from $95/b in November 2022 to the current price holding in the $65/b to $70/b range will result in a further drop in the total rig and frac count. Note that the Permian rig count shows a different but nevertheless very slow increasing trend.
Rystad has a remarkably accurate assessment of tight oil full cycle “breakevens” out, which I have addressed at my place. As LTO Survivor implies, ROI’s in the Permian, far more relevant than manipulated IRR’s, are struggling to be 125-140%. That is little more than spending $12 MM to earn $15MM dollars over 12 years. Maybe. Who would actually DO that?
50% of revenue streams in the Permian, EF and Bakken are now at, or approaching natural gas related. WH gas is well below two bucks. C plus C prices are set to increase for sure, 2H23; but NOT natty, nor NGL’s. The implications of that for tight oil cores, that are gassing out, should be obvious. Friday night lights in the Permian are back, baby!
Daily rig rates have escalated relative to other inflationary costs. Fuel, dope, labor, EVERYTHING went sky high in 2022. Insurance went to the moon, all of which had to be passed on to operators. Out of fear many tight oil operators locked into drilling contracts that will now cost them, or rather, their shareholders, an arm and a leg to cancel, or set aside for a few months. Rigs should be going to the barn but it will simply drain the free cash cookie jar the sector created the past 18 months. It a decision of what not makes more money, rather what loses less money.
For example, when DVN woke up to Fayetteville economics years ago it cancelled all of its rig contracts and hauled ass outta there. That cost them nearly 100 million bucks in cancelled rig contracts alone. And they lost tens of thousands of acres bought at absurdly high bonuses for lack of meeting royalty owner’s drilling commitments.
Its fascinating to me to watch a sector so often shoot itself in the foot, time and time again. $5K per acre lease bonuses, 25% royalty burdens, wasting natural gas, overleveraged oversupply that drove their product prices down, growth over profit (WTF was THAT about?), debt, debt and more debt. It’s all remarkable. In 60 years I’ve never seen anything like it, ever. Some suggest I cannot accept the “new” oilfield, the shale revolution for what it is, that I am stuck in the past.
Yeah. I am good with that.
Mike – Fear not, WTI is going to $200-300, we will also see 600,000 bbls year of year increases from the shale patch for the next 50-60 years. Can’t stop won’t stop – infinite growth!
Mike.
Dennis just needs to add an up vote button.
That way I could just up vote LTO’s and your posts, and otherwise not stick my foot in my mouth and run off some other good posters like I did w Gerry.
Shallow, thanks. Mr. Survivor’s observations about tight oil are rooted in reality, real life experiences, and from a having skin (personal money) in the game. Some like me… from the bottom looking up.
Oil men are generally always cynical (Sheffield, for example); it comes with the territory. It happens when you stand on your own financial feet, as YOUR family has…you win some and you lose some. It’s a hard business to BE in much less succeed in.
As to this fella, “Survivor, ” how many tight oil men do you know that actually invest in these stinking wells and then have the cajones to question the bullshit that is said about how wonderful they are?
Data matters but so does experience, hearsay, rumors, anecdotal evidence from colleagues; what service providers tell you about other people’s wells, by watching flares and vacuum trucks, by putting your own AFES’s together; by balancing your checkbook. By listening and learning from others. By thinking for yourself and checking the Energy Inaccuracy Information BS at the front door. You can’t analyse the forest if you never even seen a tree.
There are a lot “experts” here that don’t even know what the data means today, much less what it implies six months down the road. Their degrees mean more than actually struggling in the oilfield life and they have NEVER, nor ever will, put their money where their mouths are. They analyze what we do to make a living from the top, down, using URR and TRR, hope for higher oil prices, anonymous names, and bluff, because that is all they are capable of.
Thanks Mr. Shellman, great comments.
Shallow sand,
I prefer not to make this a popularity contest. You could always just put a +1 after comments you like or say great comment.
+1
Mike, a reasoned argument that few will have any quibbles with, including myself. TO your point, “Its fascinating to me to watch a sector so often shoot itself in the foot, time and time again.” That is the very nature of the business, risk taking…. we don’t always get it right. Now I am going to admit, I personally have drilled “WAY”more dry holes than successful ones. There is not a single career oil and gas exploration geologist that would not admit to that fact. We all are/were looking for that one or two career makers. I am just not sure why you have such a beef, that is the business. Look at Apache’s Alpine high. Huge promotion but an economic bust because it holds more gas than oil and there is no takeaways capacity, BUT when that changes and It will soon, it will be developed.
Now just for fun Mike, why don’t you tell us, what were you career failures, surely you have some, of course you might just be the only oil man in Texas who always got it right.
Mike….
It’s really easy to keep condemning the shale industry with your rear-view mirror adjusted to perfect clarity isn’t it. Kinda getting old…. broken record style.
Sometimes in business you make decisions in the moment with the best of your knowledge and ability, momentum and goals. All industries have moments of excess while pursuing profits. This is nothing new.
Have you not ever made a wrong move in your career? Hopefully… you have made many and were then driven to higher successes as you adapted. Risk is the foundation to success and failure. Oilfield risk can result in extremes of success and failure. This is nothing new. Just curious why you continue to demonize what is inherently normal for our industry. So, in 60 years you never heard about Sid Richardson, Glenn McCarthy, etc…. they were the shale equivalent of their era. Nothing has changed and they started before you.
By the way, I love the 25% royalty burdens. They pay for this keyboard.
It would be helpful if you big royalty owners would pick a specific example I used above and address IT, refuture IT, rather than rail on me in a feeble attempt at making a point. Take leveraged oversupply for instance; here we are, once again, with <$2 natgas and on the express elevator down because the tight oil sector can get off the drilling hamster wheel. Google the definition of insanity.
I am a student of oil and gas history and at no time in that long history has there been anything remotely similar to mass manufacturing shale wells on 660 acre spacing (330's!) using borrowed capital for 150% ROI's. The decline in that shit is staggering. No great oil finder I have read about or researched would have voluntarily dove off into that shale stuff.
I've had many failures in my exploration career, of course, and lost personal money and investment money for my WI partners. Most of that was related to wandering around undrilled areas, taking risks, and looking for new stuff. I learned from every minute of it. So what?
Its MY industry as well and it has always been complacent about changes, it is quite content with doing the same 'ol dumb stuff over and over again because it worked in the past and it was indeed, "normal." Life changes, oil and gas is becoming more difficult to find and much less profitable to extract. The oil industry needs to change also, quickly. And it needs to quit lying to the American public about abundance and long term sustainability. So you can imply I am "demonizing" the tight oil sector but it seems to be doing a pretty good job of that on its own.
Don't read what I write if it pisses you off or you feel threatened by it. Or better yet, address the message, don't attack the messenger. And I'd leave out the bragging about free royalty part; that just pisses the anti-oil crowd off more than they already are.
plus 1
Great comment Mike, thank you.
No, terrible comments. Will respond on your new thread for continuity.
Thanks again for your efforts.
Fracs
As we sell off our strategic oil reserve , ponder this . 3.5 minutes read .
https://brucewilds.blogspot.com/2023/03/as-we-sell-off-our-strategic-oil.html
Expect to see more of this as peak awareness becomes real.
Chad has nationalised all the assets and rights, including hydrocarbon permits and exploration and production authorisations, that belonged to a subsidiary of Exxon Mobil, the West African nation’s energy and hydrocarbons ministry said in a statement on Thursday.
https://www.aljazeera.com/news/2023/3/24/chad-says-it-has-nationalized-all-assets-owned-by-exxon-mobil
Peak Oil Dynamics (POD) in play . It is called ” Resource Nationalism ” . Oil is the beginning and now add as other countries resort to this for critical minerals and food — the end of globalisation .
Lightsout
Could the invisible hand of China be involved here. This could mean an additional 28 kb/d of oil heading to China instead of to the highest bidder.
https://chinaglobalsouth.com/2021/04/21/whats-at-stake-for-china-in-chad-following-the-unexpected-death-of-president-idriss-deby/
A bit more evidence that I am right on my theme that nat gas will be the transitional fuel. the proposed alternative will not be affordable. Only question is what is the max pain point in terms of inflation and unreliability that blue states voters(red states are already there) will tolerate before coming to the same conclusion.
Abhi Rajendran
@ARaj_Energy
Who is surprised given govt math blunders on inflation, budget balancing, the banking crunch situation etc. This is probably at least somewhat overblown, but the view that IRA math was balanced never made sense
#InflationReductionAct #OOTT #ONGT #Netzero
Quote Tweet
Brian Sullivan
@SullyCNBC
·
Mar 25
Goldman Sachs report: the Inflation Reduction Act’s green subsidies could cost $1.2 trillion—more than 3X govt projections.
WSJ says the IRA may go down as one of the greatest cons ever on the American taxpayer. https://wsj.com/articles/inflation-reduction-act-subsidies-cost-goldman-sachs-report-5623cd29
https://www.zerohedge.com/political/eminent-oxford-scientist-says-wind-power-fails-every-count
Ron,
I reread a post I made above and wanted to apologize. When I said there is no value in debating/ arguing with an old man, it came out wrong. It was too dismissive and I did not intend that. I do appreciate the work you do and have done. I don’t agree with a great deal of what you write, but I did not intend to be rude. As for your sobriety, I thank that’s great, its what gives us purpose. With any luck I will also become an old man, when I am, I hope to have your mental acumen.
my best wishes
Apology accepted Tex. I don’t post nearly as much as I used to as a lot of the stuff posted these days just does not interest me. Of course, I am still interested in the environment and appreciate those who are concerned. But other than that world oil production is what I post about mostly.
I also appreciate your input as one of the oilmen who posts on this blog. It shocks me, however, that you oil guys disagree with each other so much. But please keep posting. We all enjoy your input.
Take care.
from
Javier Blas
@JavierBlas
China National Petroleum Corporation (CNPC) today said that Chinese oil apparent demand is likely to rise to 756 million tonnes in 2023.
Look below at the levels of Chinese “peak oil demand” and when they would be achieved, also by CNPC | #OOTT
CHINA AND OIL: This is the time of the year when Chinese super-major CNPC releases its long-term “peak oil” demand forecast for China. It keeps changing:
2020: peak before 2030, at 740m tonnes
2019: peak in 2030, at 705m tonnes
2018: peak by 2030s, at 690m tonnes
New posts are up
https://peakoilbarrel.com/eia-short-term-energy-outlook-and-annual-energy-outlook-2023/
and
https://peakoilbarrel.com/open-thread-non-petroleum-march-27-2023/