A Guest Post by Ovi
All of the Crude plus Condensate (C + C) production data for the US state charts comes from the EIAʼs January Petroleum Supply monthly PSM which provides updated information up to November 2022.
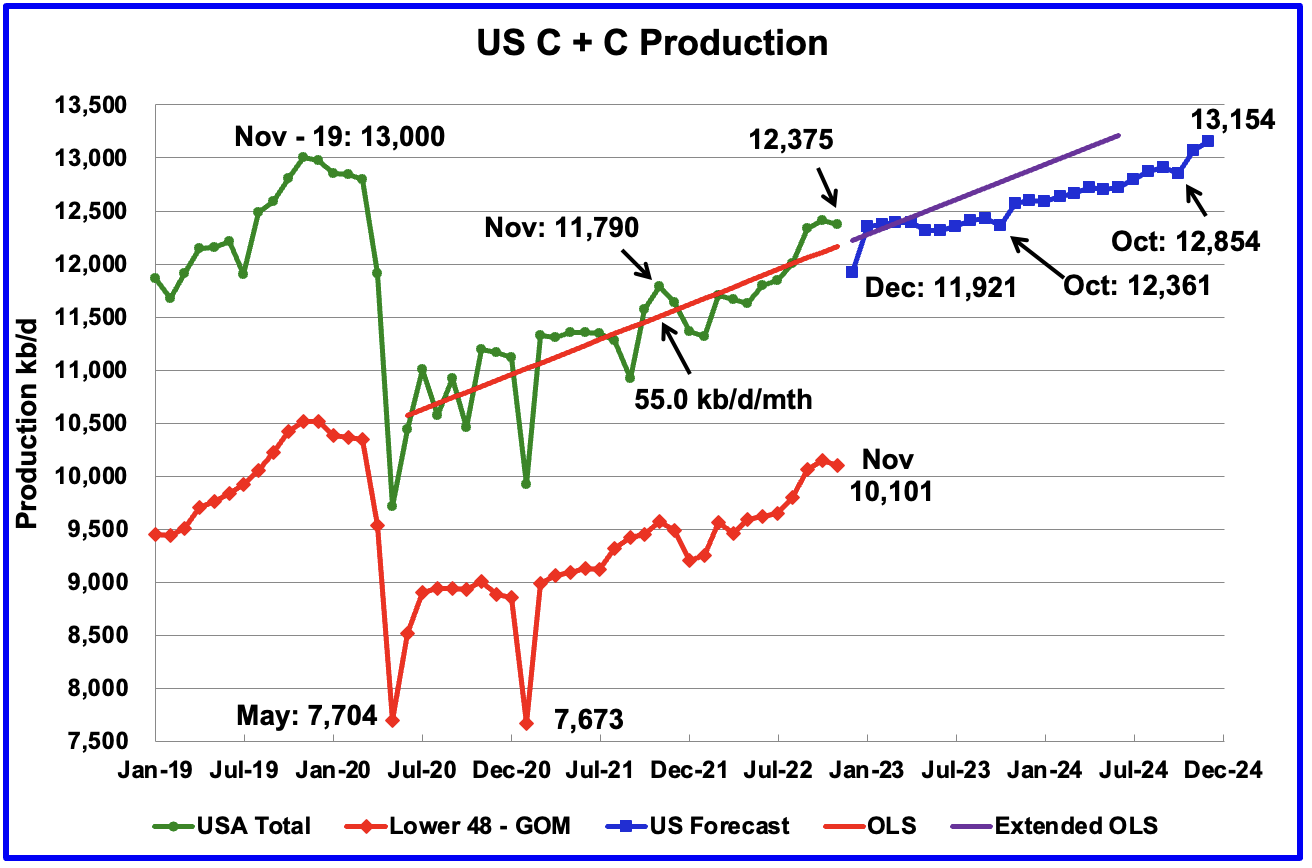
U.S. November production decreased by 35 kb/d to 12,375 kb/d. For November, the state with the largest increase was Oklahoma with 19 kb/d while North Dakota had the largest decrease, 23 kb/d. The GOM also experienced a production drop.
While overall US oil production decreased by 35 kb/d, the Onshore L48 had a larger drop of 50 kb/d to 10,101 kb/d. This means that the source for the largest US production decrease came from the Onshore L48.
The blue graph, taken from the January 2023 STEO, is the production forecast for the U.S. from December 2022 to December 2024. Output for December 2024 is expected to be 13,154 kb/d which would exceed the November 2019 peak of 13,000 kb/d.
Note that production in October 2023 is forecast to be lower than November 2022. The flatness in overall US output up to October 2023 is due to the production increase in the Onshore L48 from December 2022 to October 2023 being offset by declining production in the GOM. See GOM chart further down.
The red OLS line from June 2020 to November 2022 indicates a monthly production increase of 55.0 kb/d/mth over that period. The first portion of red line stops at November because that is the range covered by the OLS analysis. The second portion is the same OLS line extended to see how well it fits the STEO forecast. The growth rate for 2023 and 2024 is expected to be lower than the 55 kb/d/mth seen from July 2020 to November 2023.
Oil Production Ranked by State
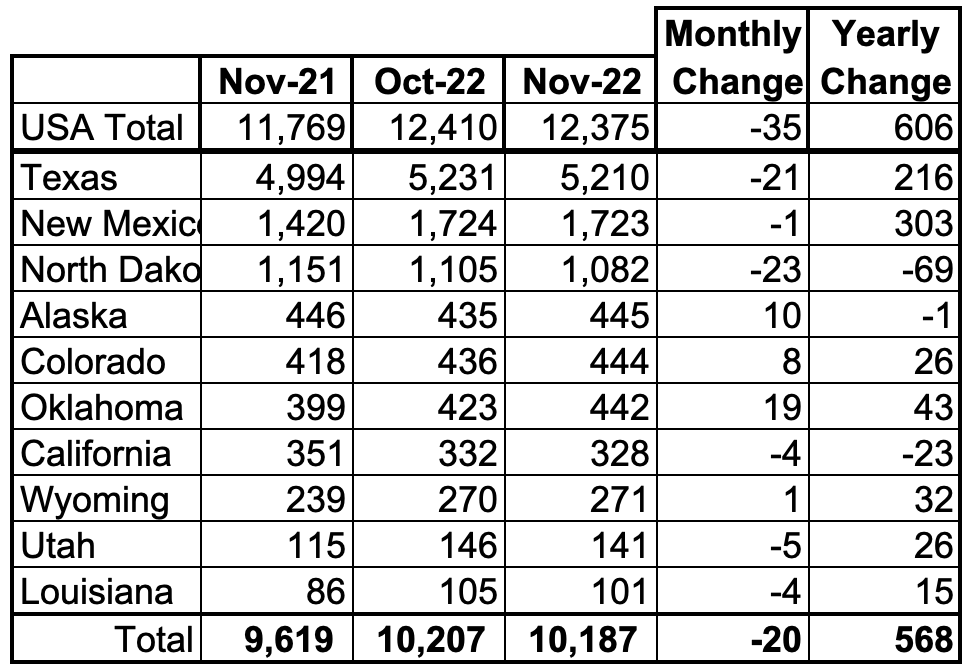
Listed above are the 10 states with the largest US production. These 10 accounted for 82.3% of all U.S. oil production out of a total production of 12,375 kb/d in November 2022.
On a YoY basis, US production increased by 606 kb/d with the majority, 519 kb/d having come from Texas and New Mexico.
State Oil Production Charts
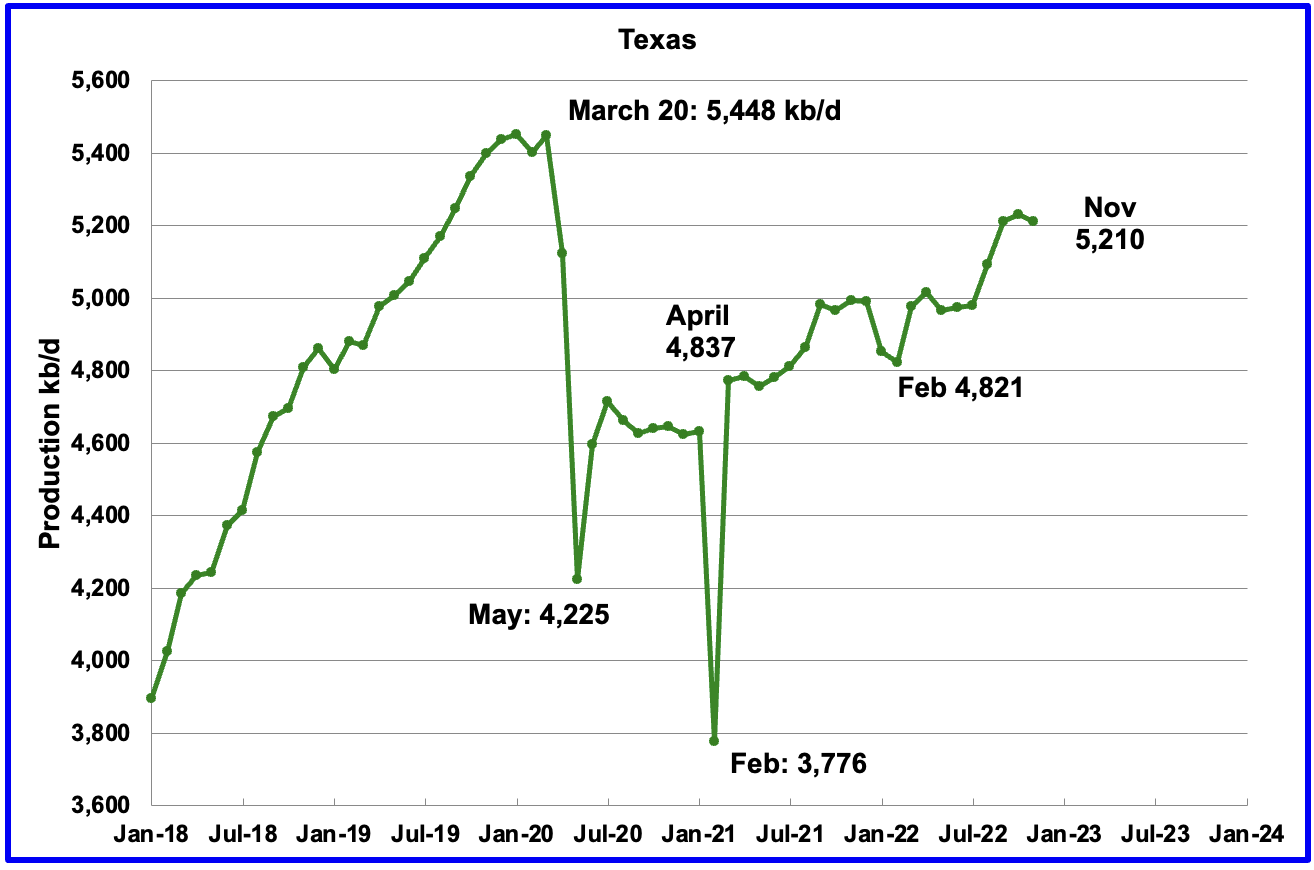
Texas production decreased by 21 kb/d in November to 5,210 kb/d. The decrease is due to October being revised up by 35 kb/d from 5,196 kb/d to 5,231 kb/d in the previous report.
In October 2021 there were 215 Hz oil rigs operating in Texas. By November 2022, 319 Hz oil rigs were operational, an increase of 104 rigs.
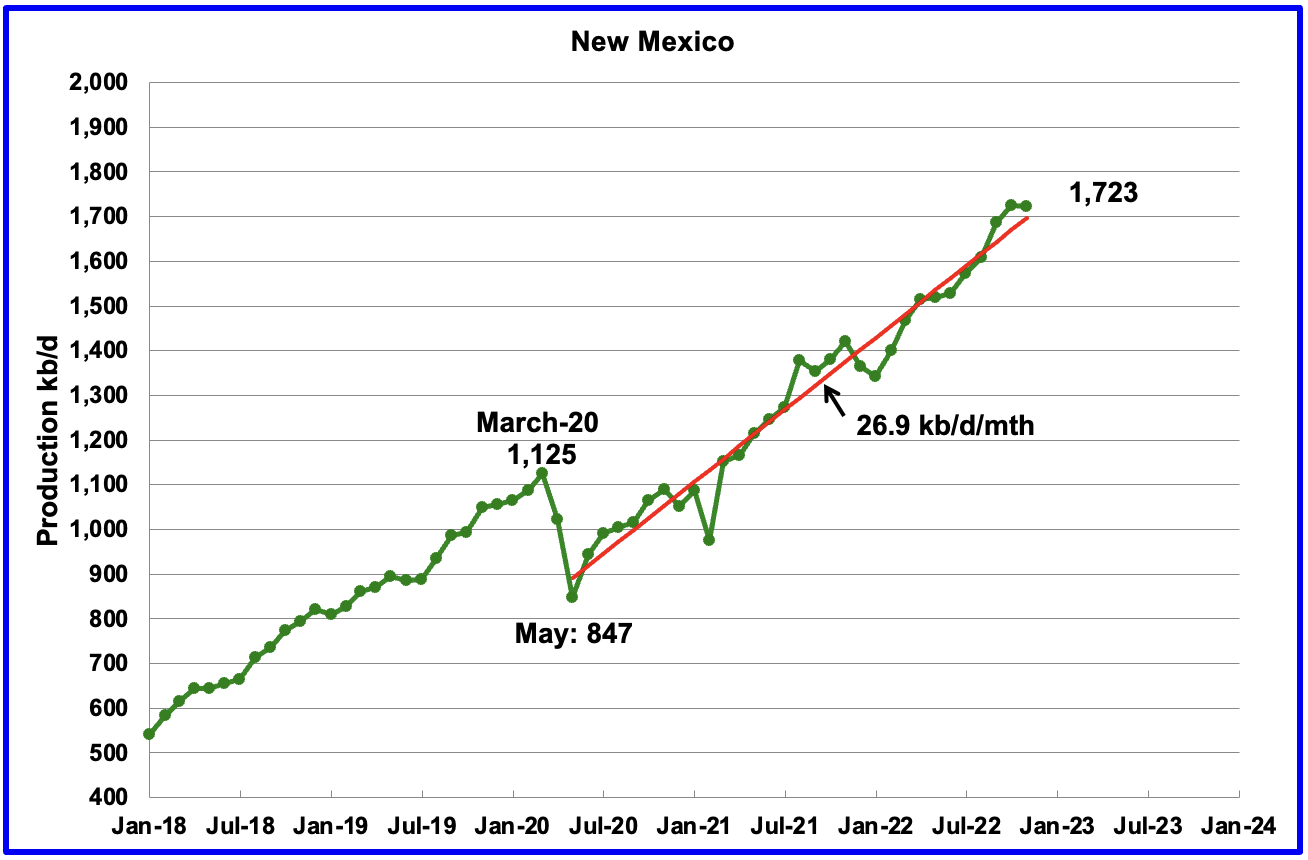
November’s New Mexico production was essentially flat at 1,723 kb/d, a decrease of 1 kb/d. The red OLS line from May 2020 to November 2022 indicates a production growth rate of 26.9 kb/d/mth and shows no sign of rolling over. Since August, the rig count has been steady in the high 90s, 97 ±4.
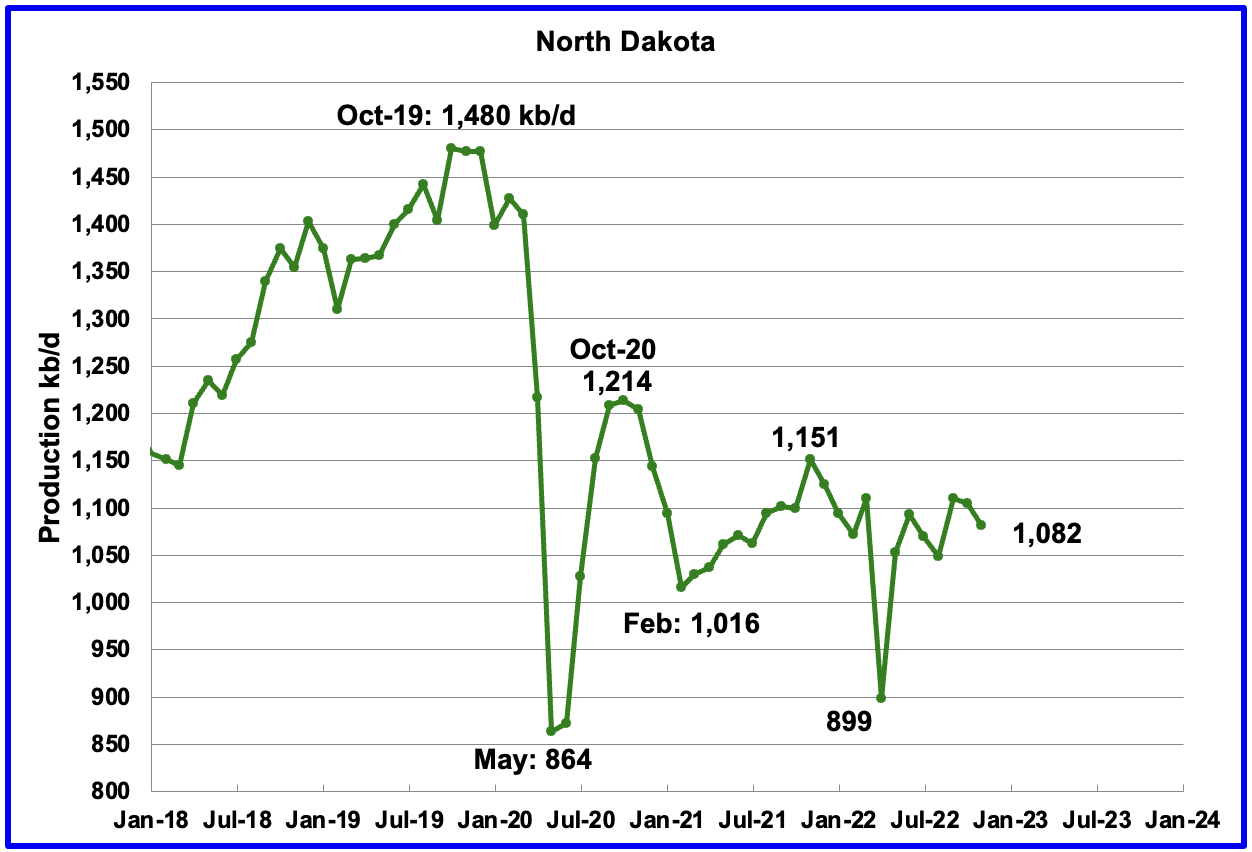
North Dakota’s November output decreased to 1,082 kb/d, a decrease of 23 kb/d from October.

Alaskaʼs October output increased by 10 kb/d to 445 kb/d and was 1 kb/d lower than November 2022. This is an early indication that Alaska may be breaking out from the red declining downtrend line. Note how the summer lows are also higher.
According to this report, the Biden administration has agreed to advance the controversial Willow oil drilling project in Alaska.
“Erec Isaacson, president of ConocoPhillips Alaska, said in a statement that nearly five years of regulatory review should conclude “without delay.” Isaacson added the project is “ready to begin construction immediately” after Interior’s final decision is issued.”
On the other hand, “The world and the country can’t afford to develop that oil,” said Jeremy Lieb, a senior attorney for environmental law firm Earthjustice. Lieb and other advocates are concerned that Willow may be the start of a future drilling boom in the area.
You can’t keep everybody happy.
Conoco Philips states that the Willow project could produce up to 180 kb/d. Another article states 130 kb/d.
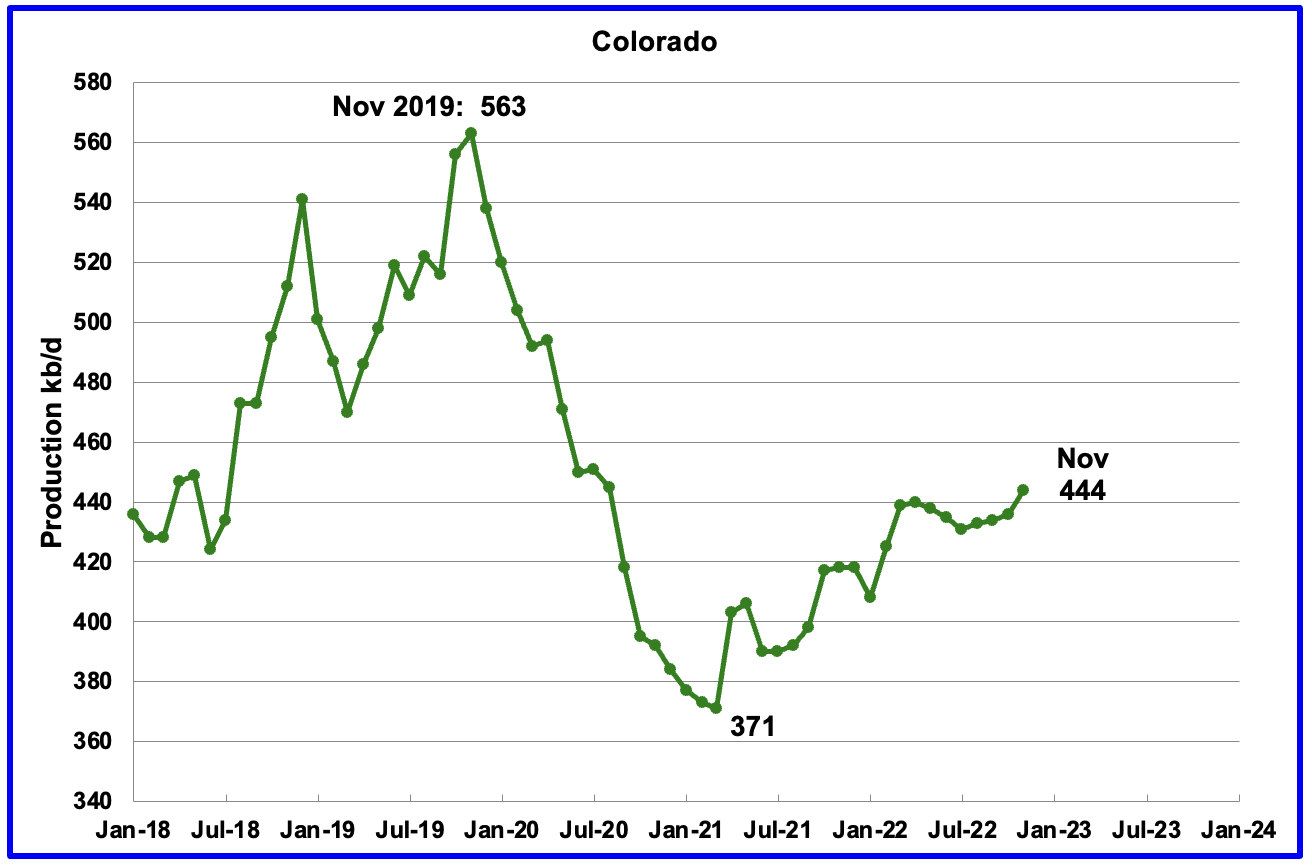
Coloradoʼs November production increased by 8 kb/d to 444 kb/d.
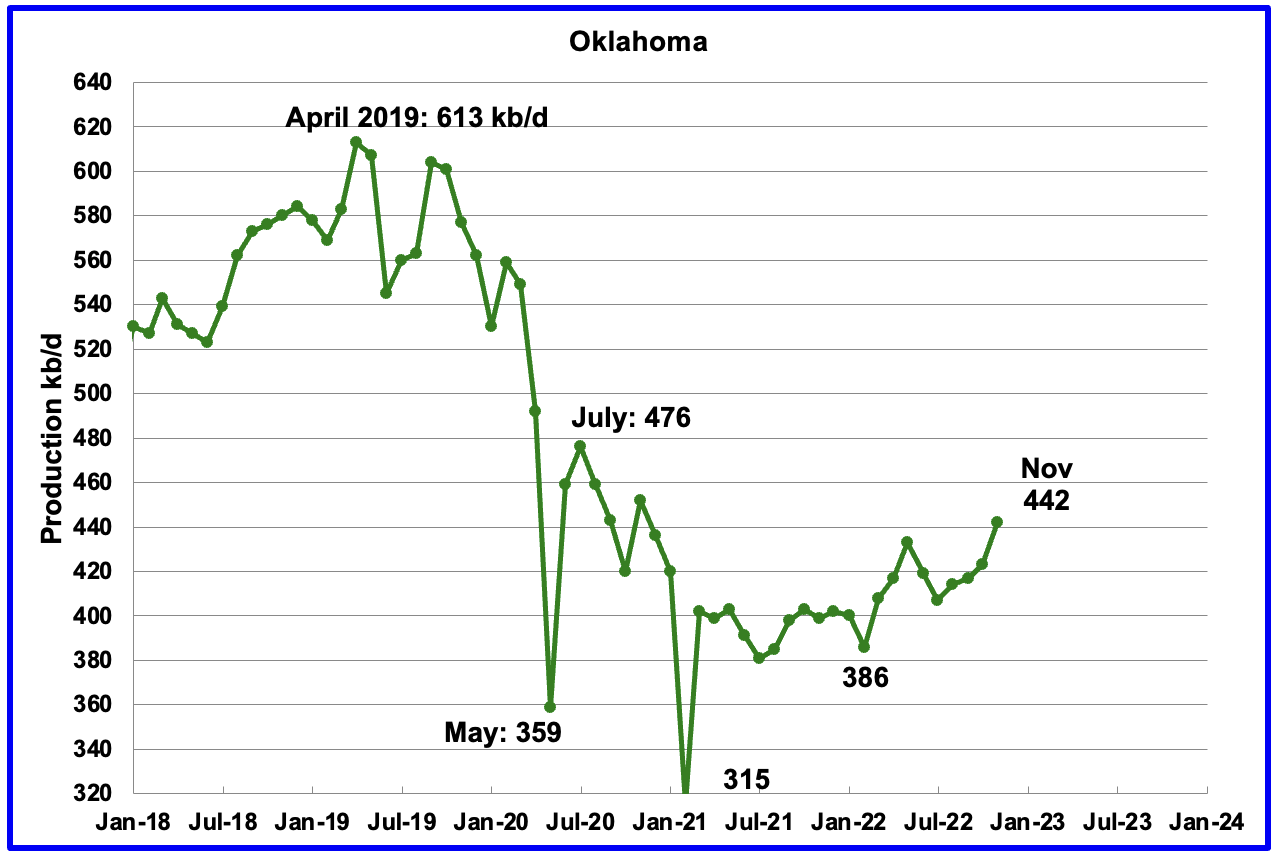
Oklahoma’s output in November increased by 19 kb/d to 442 kb/d. From January 2022 to April 2022, close to fifty rigs were operating in Oklahoma. By late November the rig count had increased to 69.
Production remains 34 kb/d below the post pandemic high of 476 kb/d.
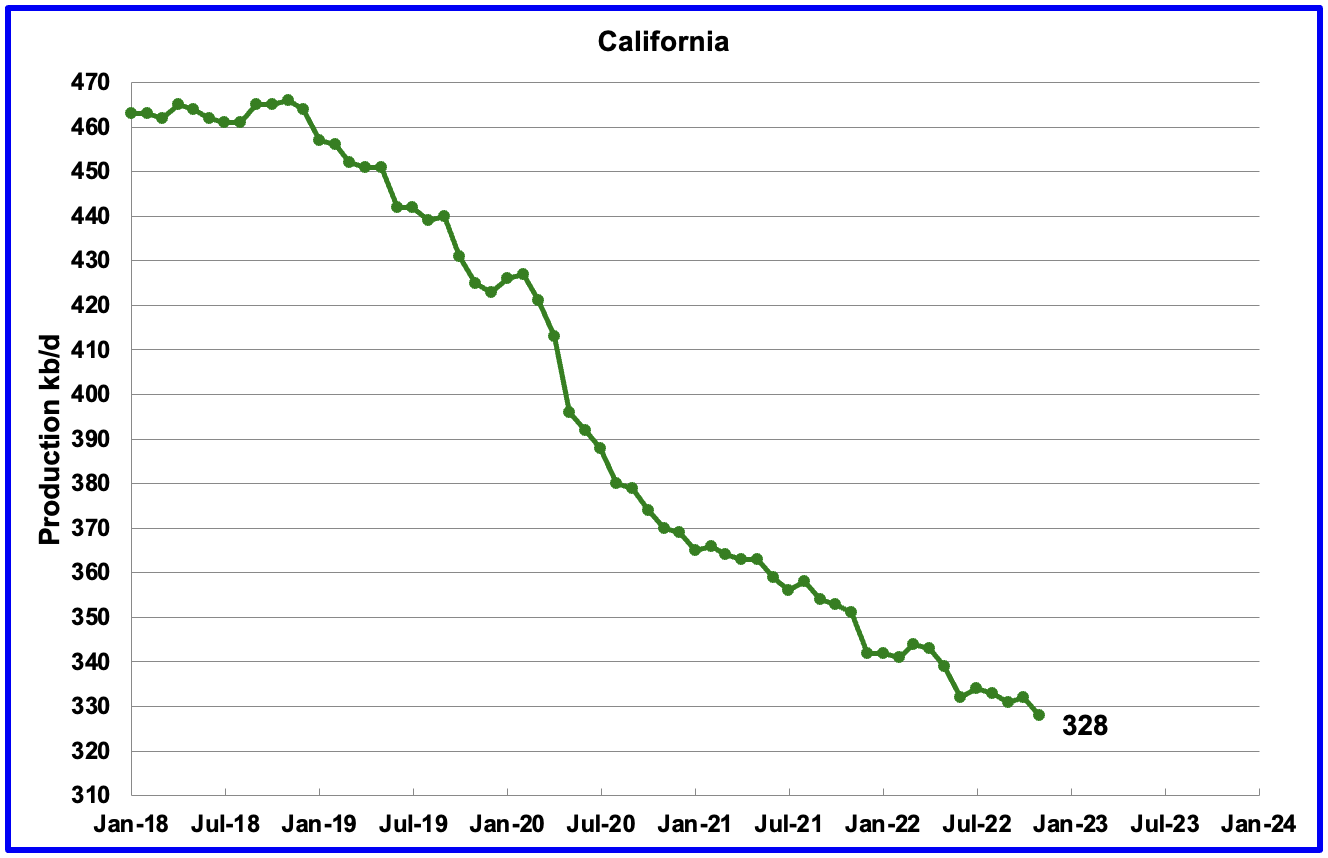
Californiaʼs overall slow output decline trend continues. November production decreased by 4 kb/d to 328 kb/d.
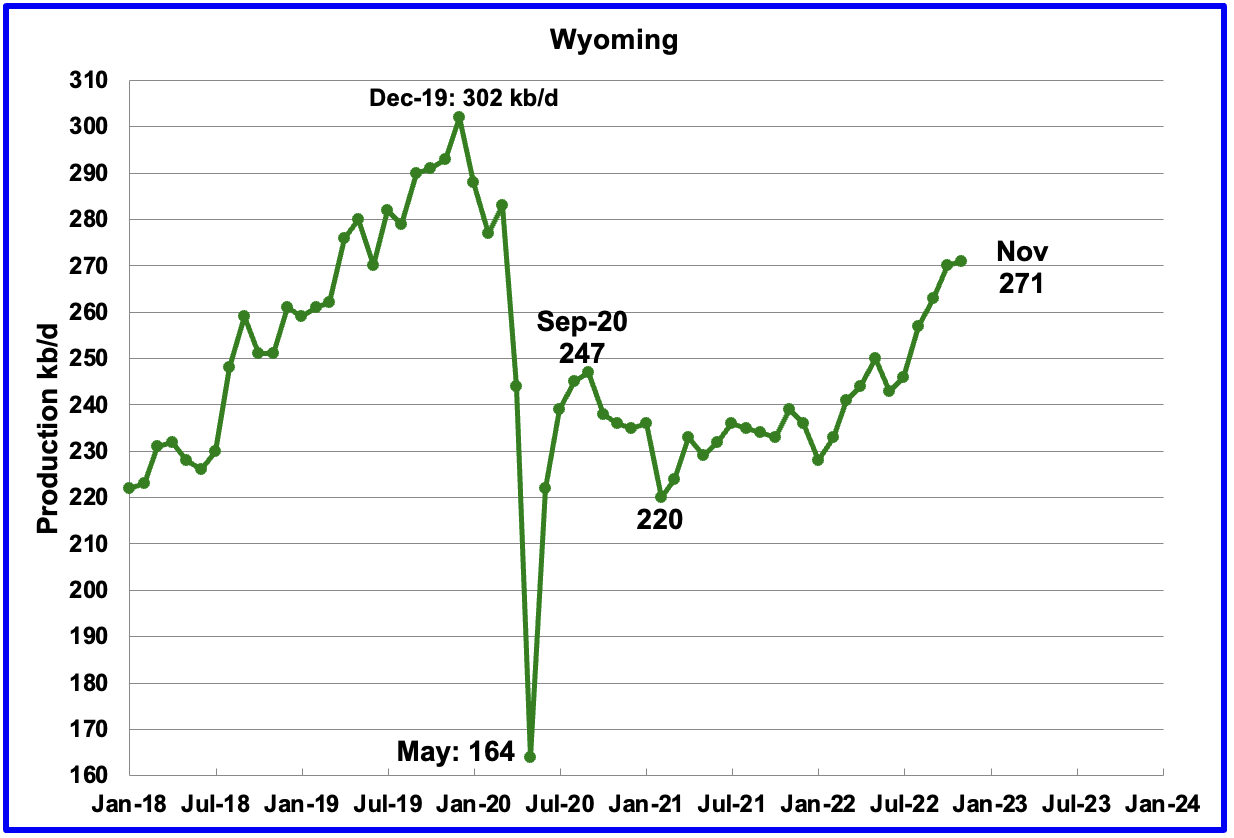
Wyoming’s oil production has been on a slow unsteady uptrend from the low of 220 kb/d in February 2021 due to increased drilling. November’s output reached a new post pandemic high of 271 kb/d, an increase 1 kb/d over October.
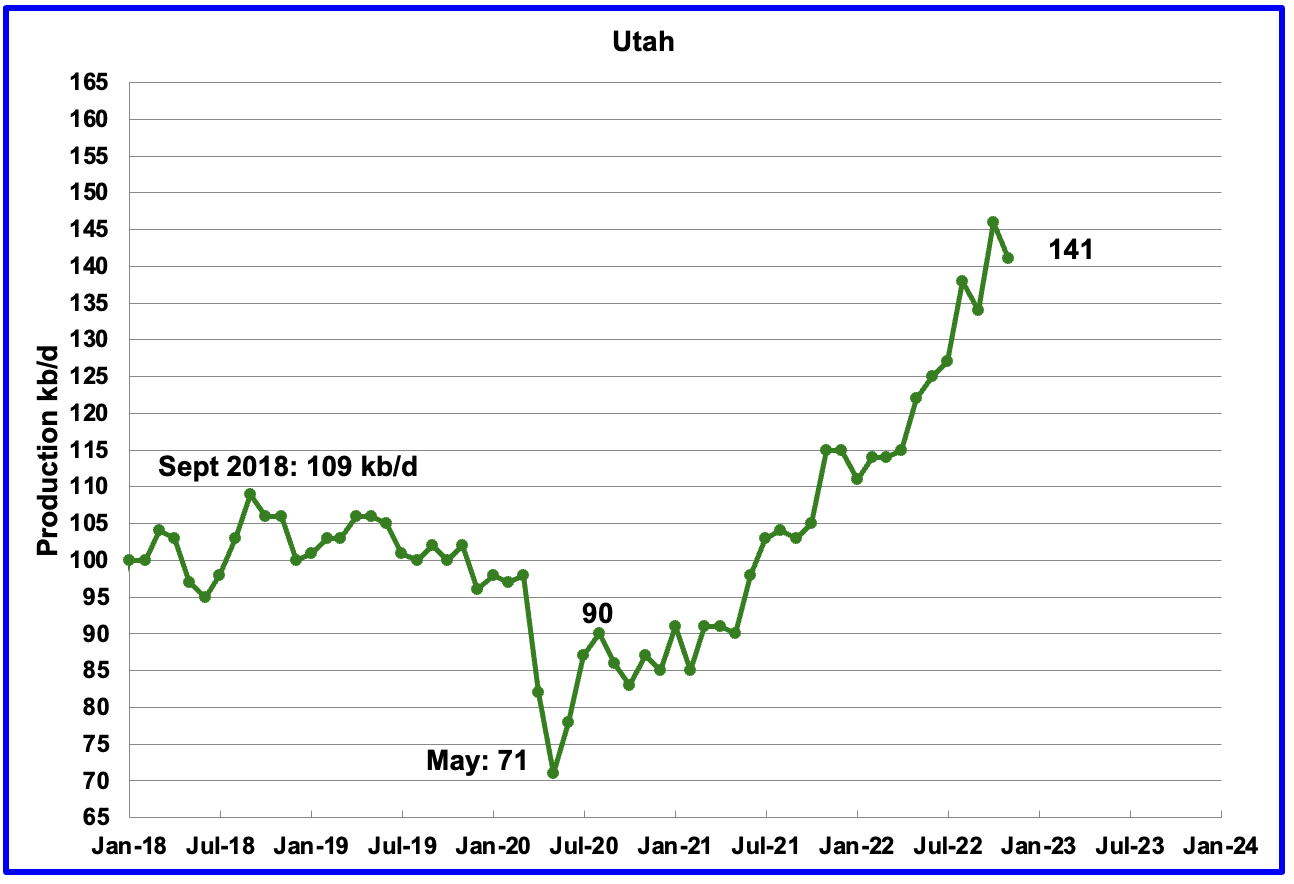
Utah’s oil production had been increasing steadily since January 2022. However November saw production drop by 5 kb/d to 141 kb/d. Utah had 8 Hz rigs operating in November, up from 5 in January 2022.
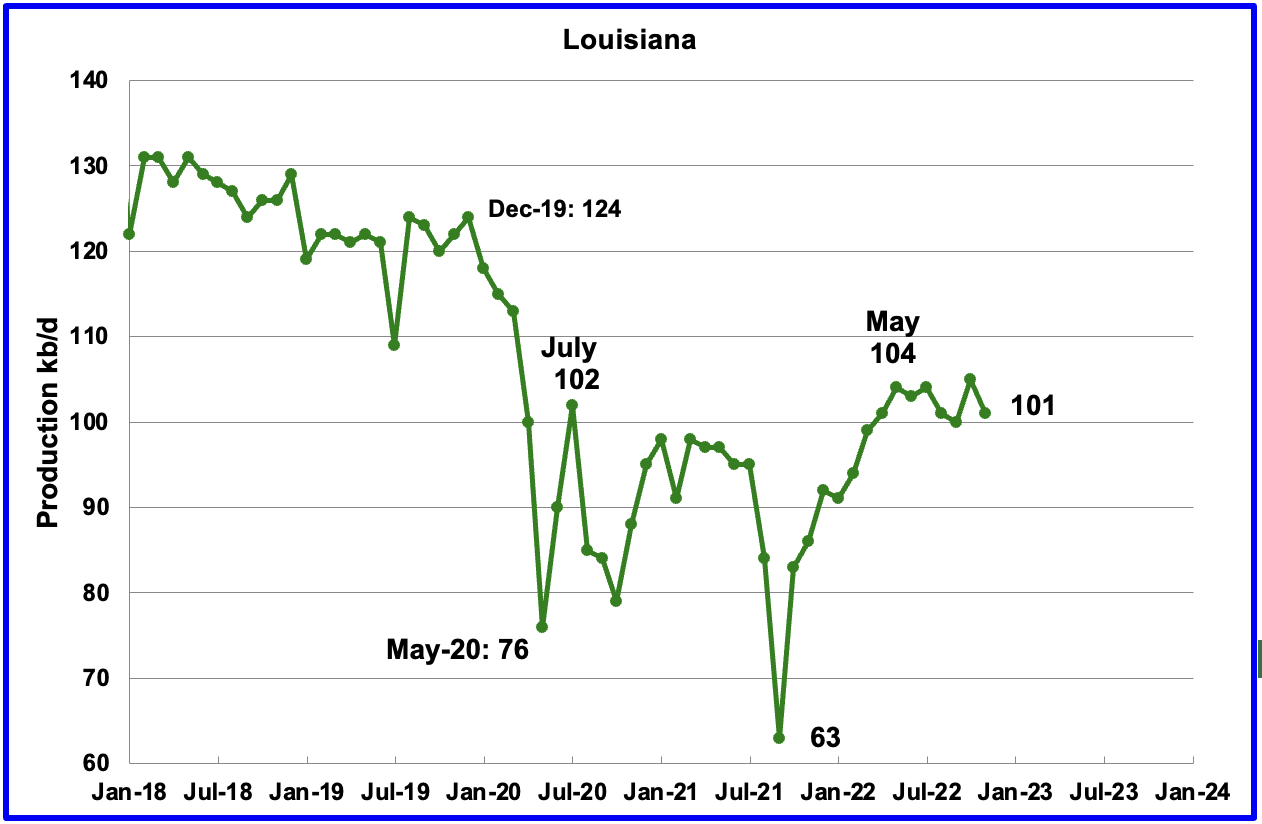
Louisiana’s output rose from the low of 63 kb/d in September 2021 to 104 kb/d in May 2022. Since then output has plateaued. November’s output decreased by 4 kb/d to 101 kb/d.
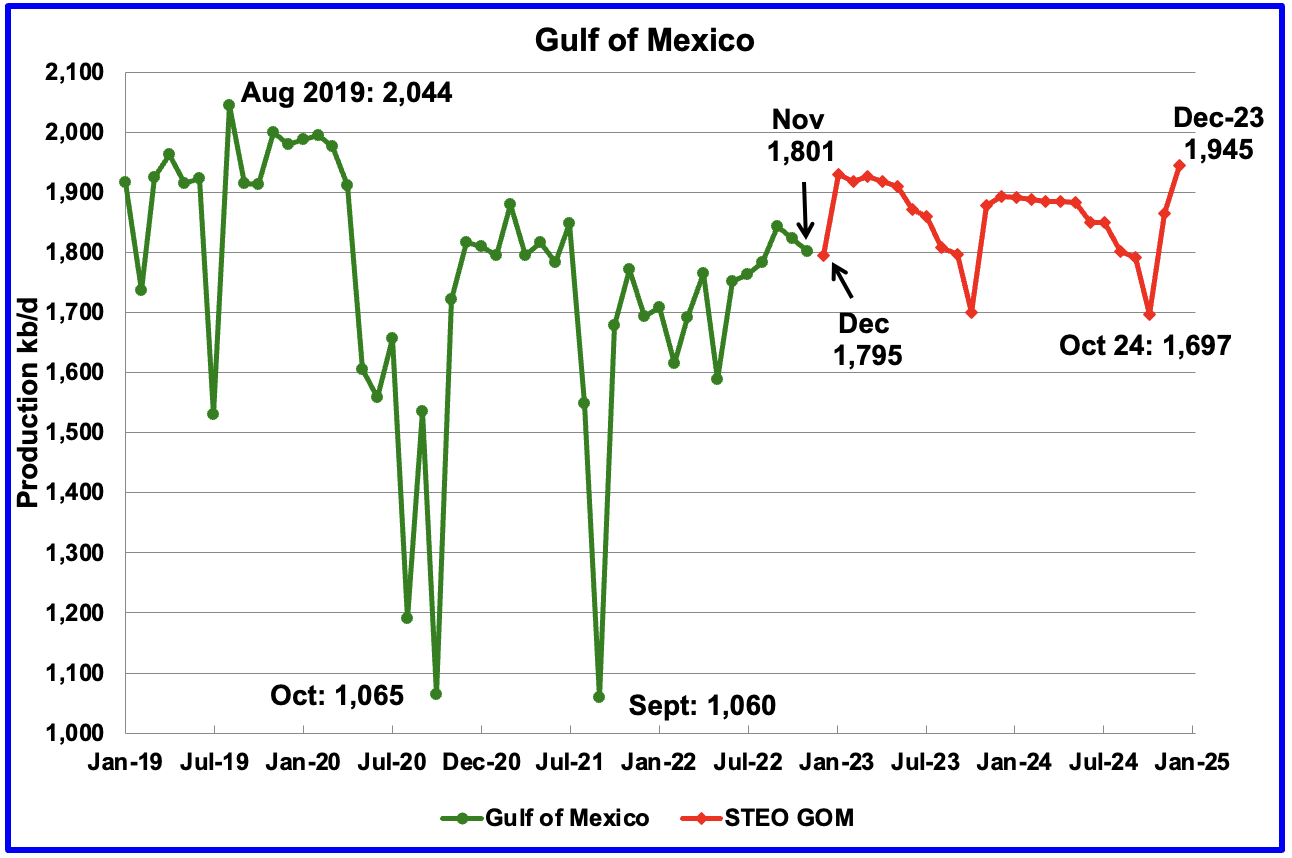
GOM production dropped by 23 kb/d in November to 1,801 kb/d. If the GOM was a state, its production would normally rank second behind Texas.
The January 2023 STEO projection for the GOM output has been added to this chart and projects output will be 1,945 kb/d in December 2024. The production decline in 2023 is due to decline in existing GOM fields not being offset by the increases in crude oil production from the new fields mentioned below. The large spike in January may be due to the startup of the Vito platform.
In an August update, Equinor states that Vito startup has been delayed till early 2023. Shell confirms that the start-up of production at its Vito platform in the US Gulf of Mexico will slip into the first quarter of 2023.
According to this source, the EIA expects nine new Gulf of Mexico fields to start production this year. The fields expected to come online this year include those at Argos/Mad Dog 2, Vito, Lobster, Dome Patrol, Olympus, Taggart, and the Kings Quay fields. The EIA noted that the large development fields at Argos/Mad Dog 2, King’s Quay, and Vito each has a peak production capacity of 100,000 barrels of oil equivalent per day or more.
A Different Perspective on US Oil Production
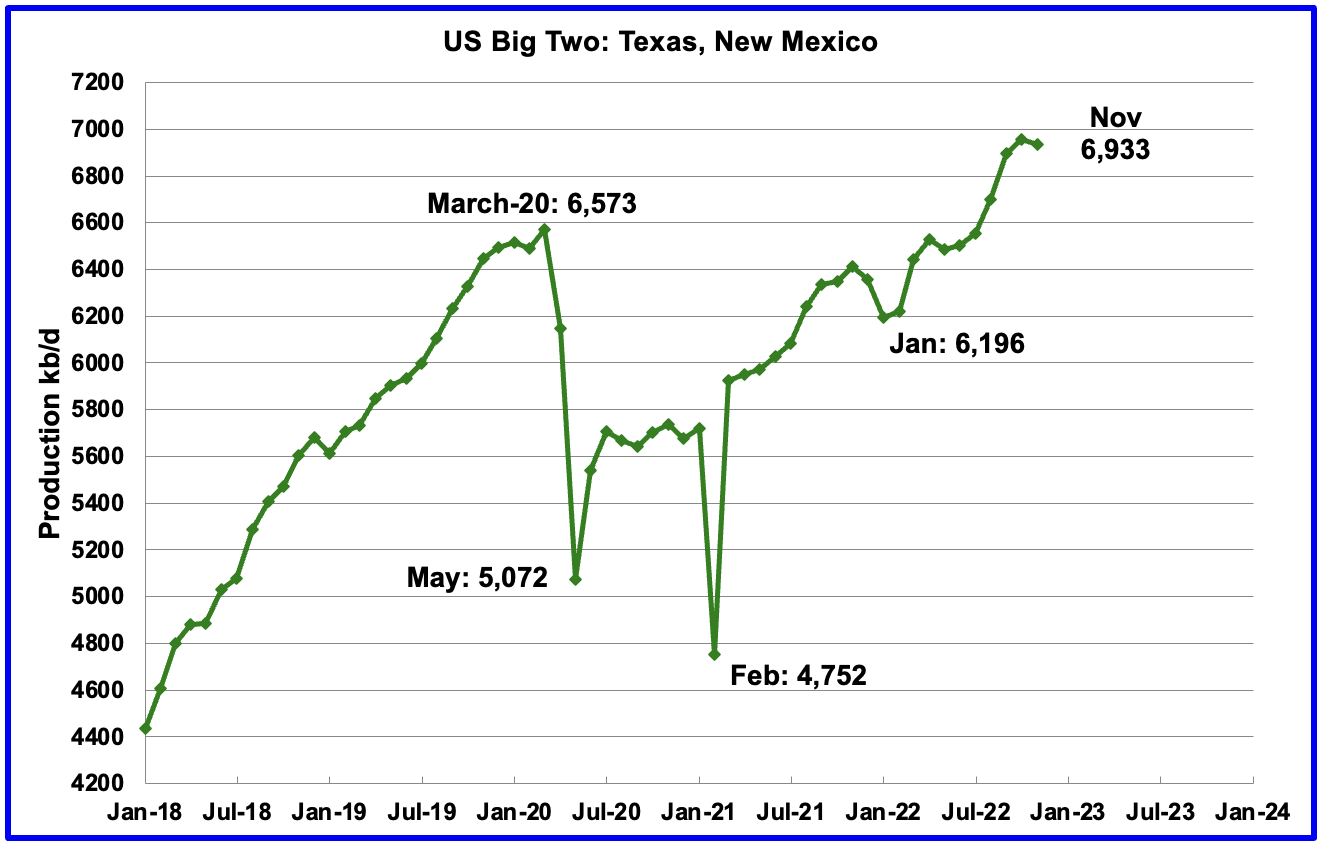
The Big Two states, combined oil output for Texas and New Mexico.
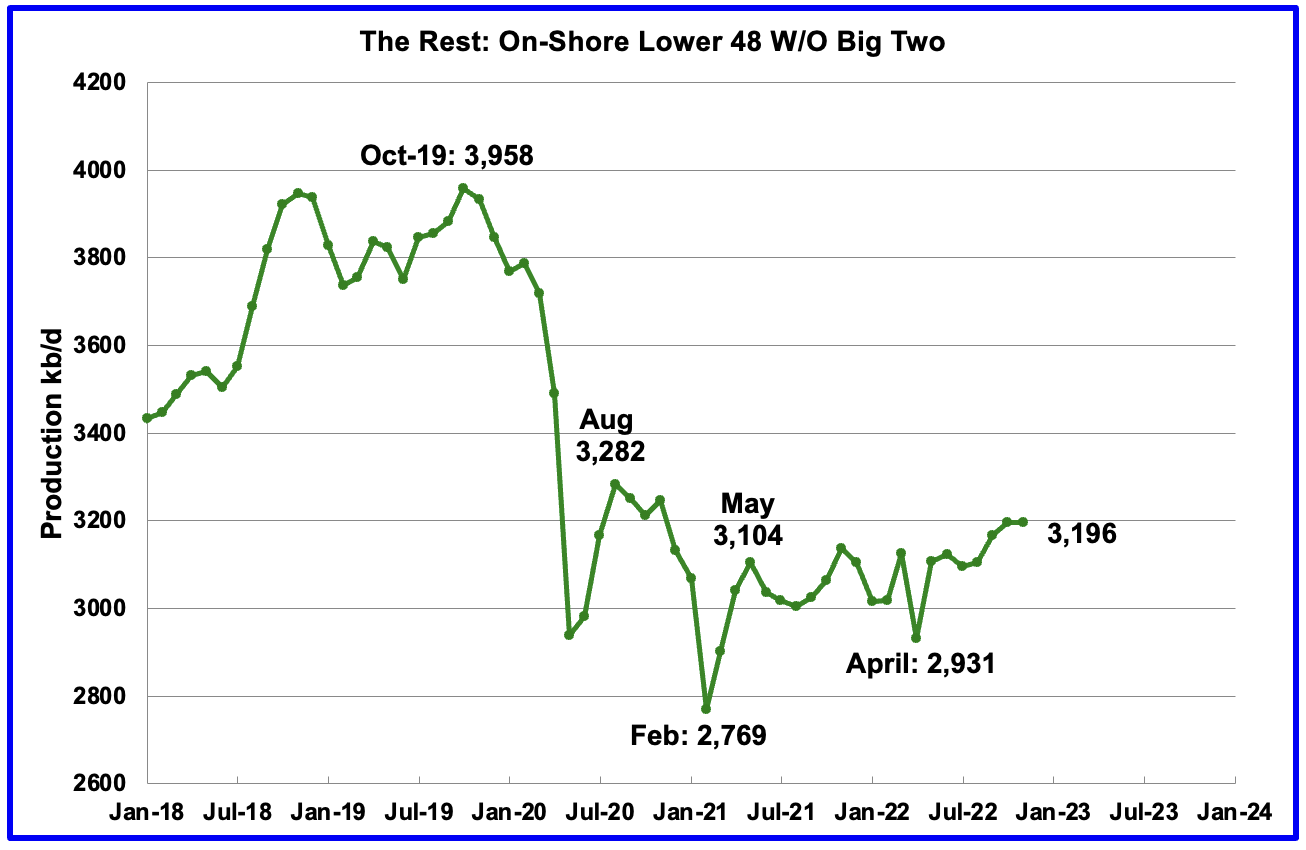
Oil production by The Rest
November’s production in the Big Two states decreased by a combined 22 kb/d to 6,933 kb/d with Texas dropping 21 kb/d and New Mexico dropping 1 kb/d. In November production in The Rest was unchanged at 3,196 kb/d.
The main thing to notice in the Rest Chart is that current production is 762 kb/d below the high of October 2019. The question we need answered Is “Is this a permanent loss that will never be recovered?” I think it is a permanent loss.
Comparing May 2021 output with November 2022 output, the Rest have added 92 kb/d to US output, indicating a period of slowly increasing production .
Rigs and Fracs
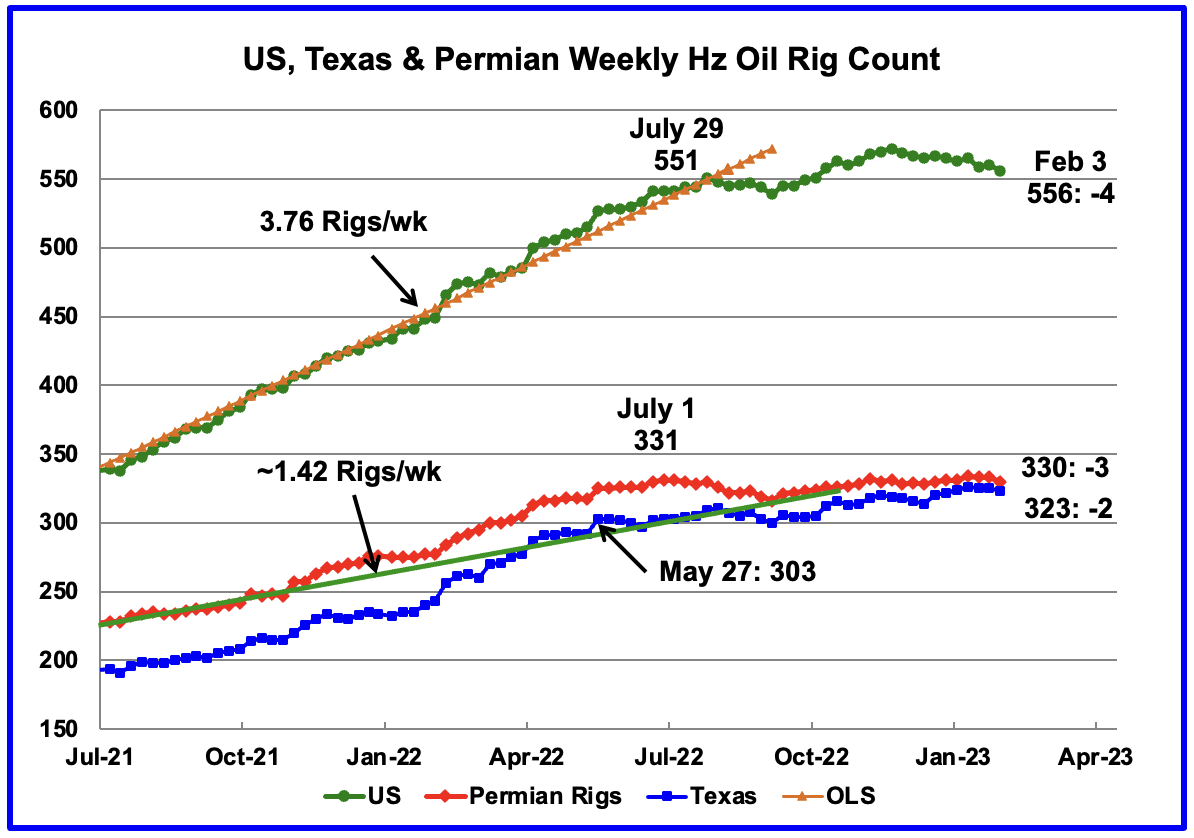
Since the beginning of April 2021 through to the week ending July 29, 2022, the US added horizontal oil rigs at a rate of close to 3.82 rigs/wk, orange OLS line, and peaked at 551 rigs in the week ending July 29. However since then the number of operational rigs has wondered sideways. In the week ending February 3, the number of rigs decreased by 4 to 556, 5 higher than July 29, 2022.
In the week ending February 3, Permian rigs dropped by 3 to 330 and Texas rigs dropped by 2 to 323. Note that Permian rigs are are at the same level as July 1.
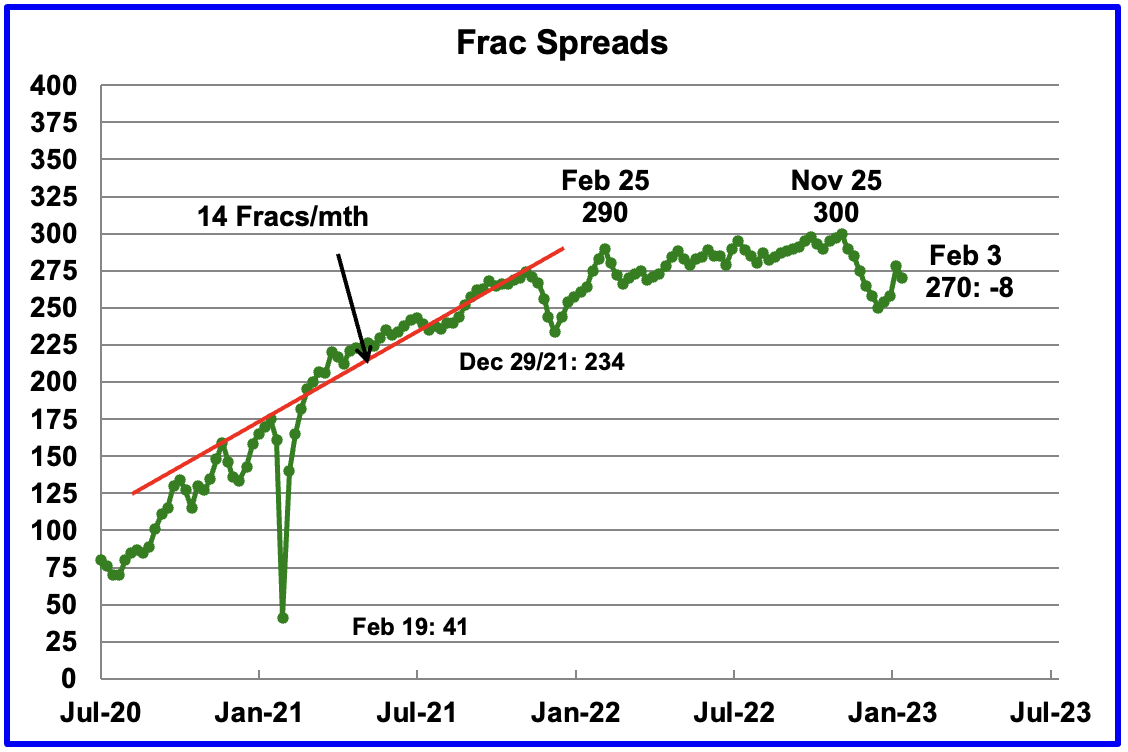
For frac spreads, the general trend since late February 2022 can best be described as essentially flat around the 290 level but with a hint of a slow increase toward 300 frac spreads. At the beginning of the 2022 Thanksgiving and Christmas holidays, the frac count began to drop. The frac count bottomed in the week ending January 6 at 250 and then began to recover. A similar trend occurred last year.
For the week ending January 27, the Frac count increased by 20 which was then followed by a drop of 8 to 270 for the current week ending February 3. Was the 20 increase a counting error?
Note that these 270 frac spreads include both gas and oil spreads.
Drilling Productivity Report
The Drilling Productivity Report (DPR) uses recent data on the total number of drilling rigs in operation along with estimates of drilling productivity and estimated changes in production from existing oil wells to provide estimated changes in oil production for the principal tight oil regions. The January DPR forecasts production to February 2023 and the following charts are updated to February 2023.
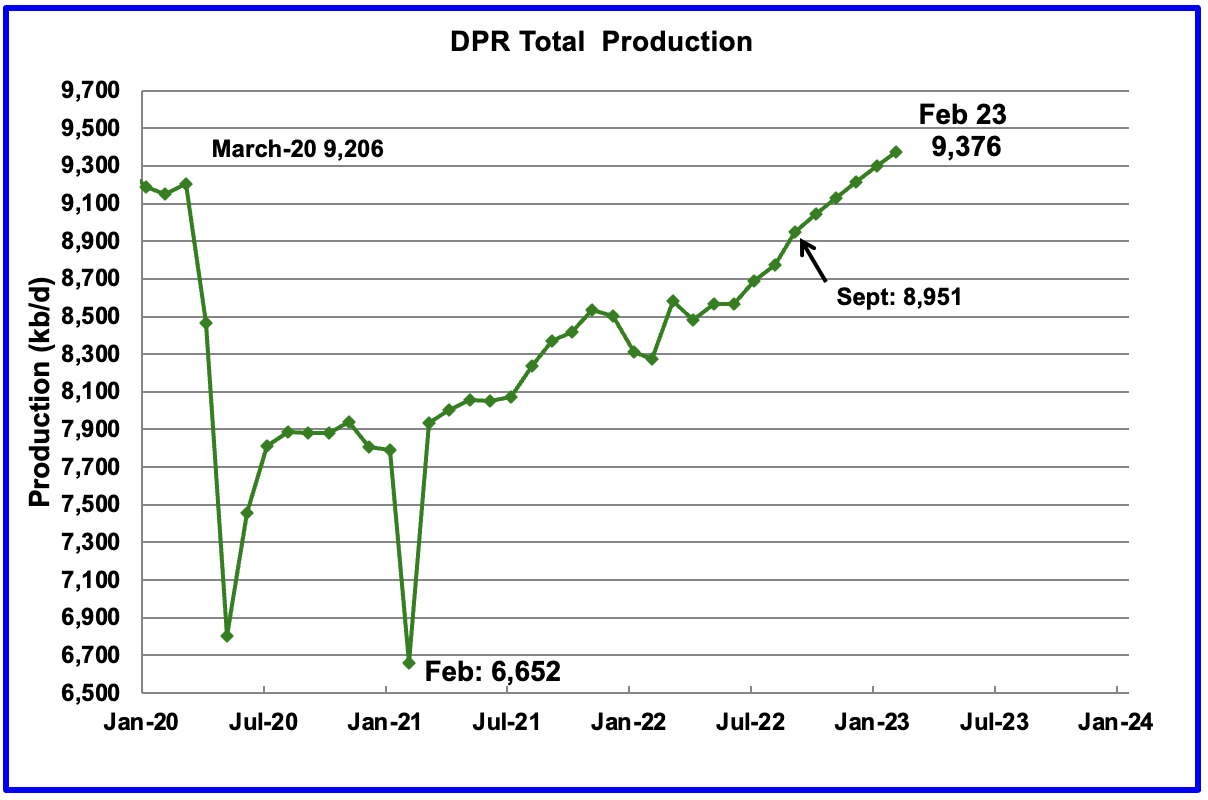
Above is the total oil production projected to February 2023 for the 7 DPR basins that the EIA tracks. Note that DPR production includes both LTO oil and oil from conventional wells.
The January DPR report made made minimal revisions to the the December report. For instance, January output was revised down by just 20 kb/d. The DPR is projecting that oil output for February 2023 will increase by 78 kb/d to 9,376 kb/d or 58 kb/d relative to the original December report. February’s output is projected to be 172 kb/d higher than the pre-pandemic high of 9,206 kb/d.
From September 2022 to February 2023, output in the DPR basins is forecast to increase by 425 kb/d or by an average growth rate of 85 kb/d/mth. This rate is lower than reported in previous posts which were greater than 100 kb/d.
This high growth rate is almost double the rate, 54.5 kb/d/mth, shown in the LTO report in the next section. It is not clear why there is such difference between these two reports.
It should be noted that questions are raised regarding the methodology used by the DPR to project their production forecasts.

This chart shows the monthly DPR production increments. What is notable is the reduced month to month volatility since September 2022. Is this another indication of a planned monthly drilling and completion program by company management to meet financial commitments, regardless of the price volatility of U.S. oil.
According to this source: “US shale producers in particular are struggling with supply chain constraints, cost inflation and capital discipline, the IEA said noting that: “This casts doubt on suggestions that higher prices will necessarily balance the market through additional supply.”
According to OPEC, the global oil industry needs to add 5 million b/d of new production capacity each year to offset natural declines, with a total of $12.1 trillion in spending needed through 2045.”
That decline rate of 5 Mb/d is ten times higher than the decline rate in the 50 small countries tracked by the author.
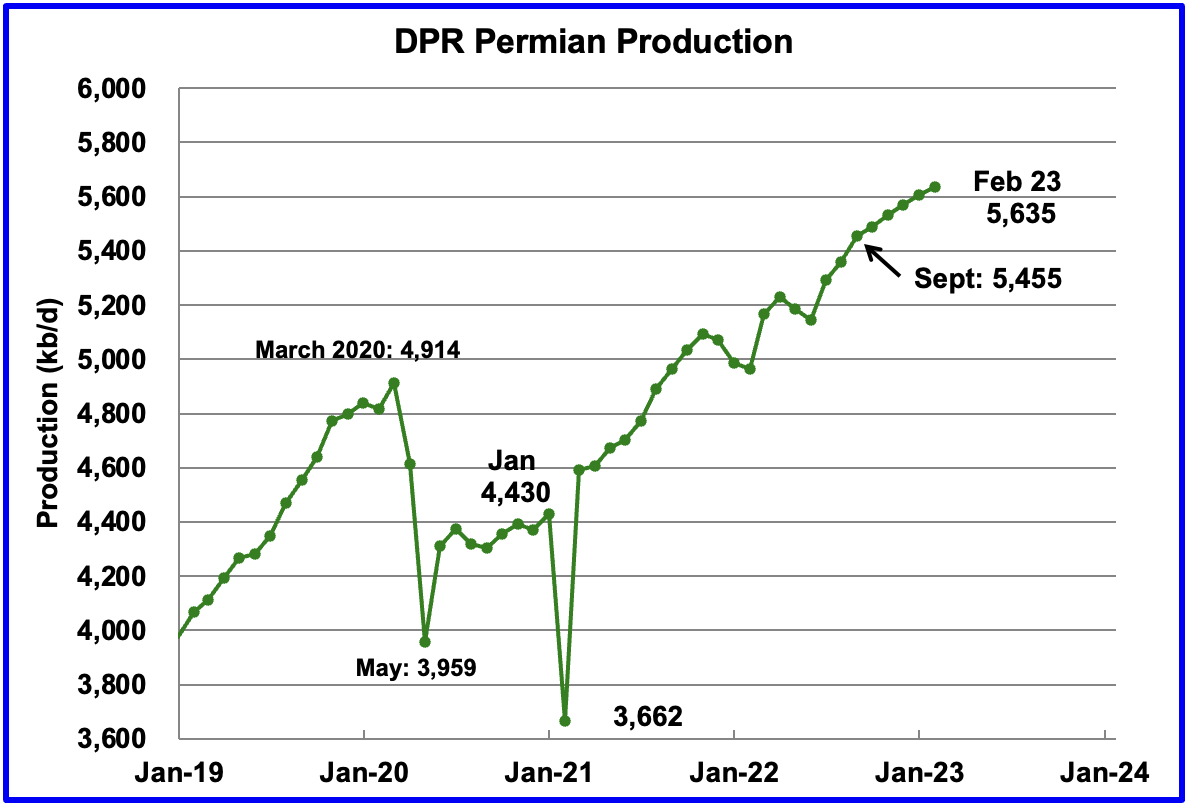
Permian output continues to rise in February. Production is expected to increase by 30 kb/d to a new high of 5,635 kb/d. From September to February, production is forecast to increase by 180 kb/d or at an average rate of 36 kb/d/mth which is lower than rates from earlier this year. Production since September hints at slowing monthly production increases, possibly more related to capital discipline than geology.
If the Permian were part of OPEC, at 5,635 kb/d it would be the second largest producer after Saudi Arabia.
During December, 432 wells were drilled and 431 were completed in the Permian. (Note that December is the latest month for DUC information). The completed wells added 367 kb/d to December’s output for an average of 852 b/d/well. The overall decline was 329 kb/d which resulted in a net increase for Permian output of 38 kb/d. Of the 431 completed wells, 386 were required to offset the decline.
Note, this is the first month in which no DUCs were used in the Permian, actually one was added.
An Exxon spokesman made the following comment regarding their Permain DUCs:
“If you look at 2021, we added about 90,000 barrels a day of production. 2022, very similar number, 90,000 barrels a day. And that, in part, was what I’d call the organic development and the drilling and the production, as well as clearing our DUCs inventory. So, as we were in the pandemic, obviously, not a lot of incentive to bring production on.
And so, we concentrated our spend on drilling. And then as we got into higher-priced environments, concentrated on clearing that inventory and bringing those wells to production. And so, we were bringing our DUC inventory down. As we go into next year, we’re going to rebuild that inventory, get to an optimum level that we can then use and maintain as we go through the next several years.”
So what is the strategy going forward. Spend extra cash to rebuild the DUCs inventory, rank them, and complete a mix of wells to optimize/control output and profits?
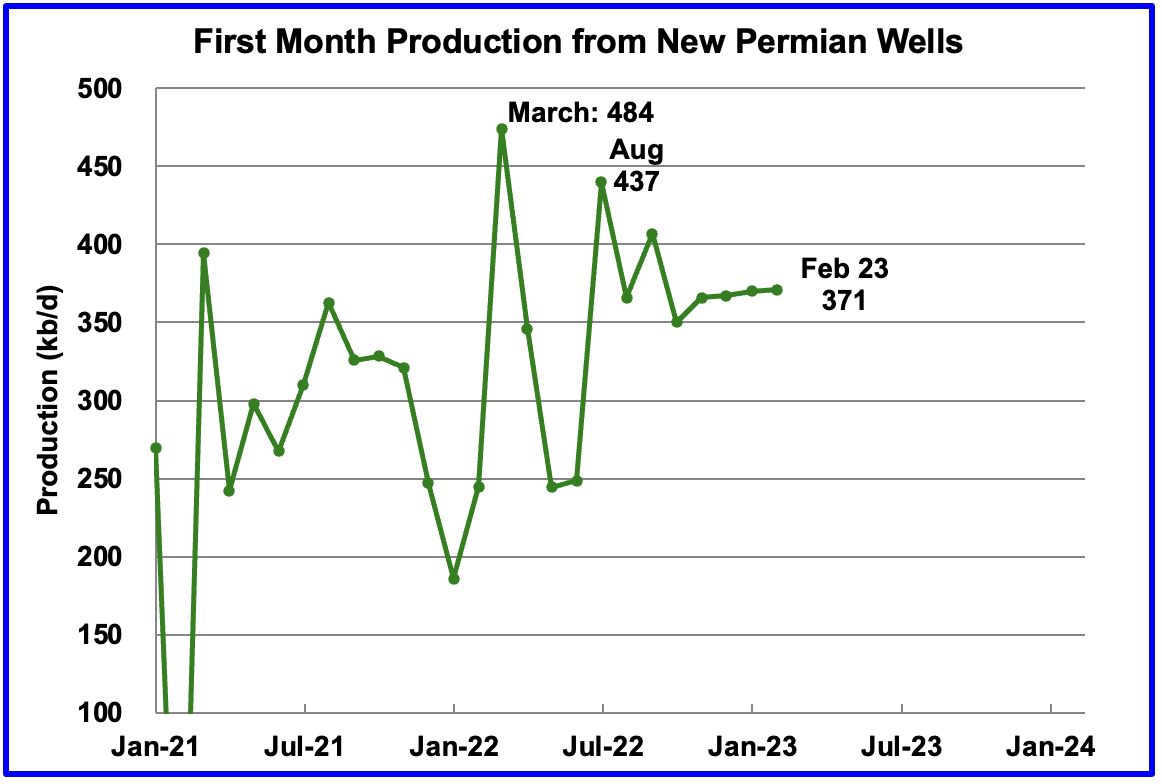
This chart shows the average first month total production from Permian wells tracked on a monthly basis. Since September 2022, the volatility shown in prior months has been reduced. Assuming the latest information is correct, total monthly production from the newest Permian wells in February may have stabilized around the 371 kb/d level. Part of the flat production shown is related to an essentially unchanging number of wells being completed, currently hovering slightly over 430 for the last 4 months.
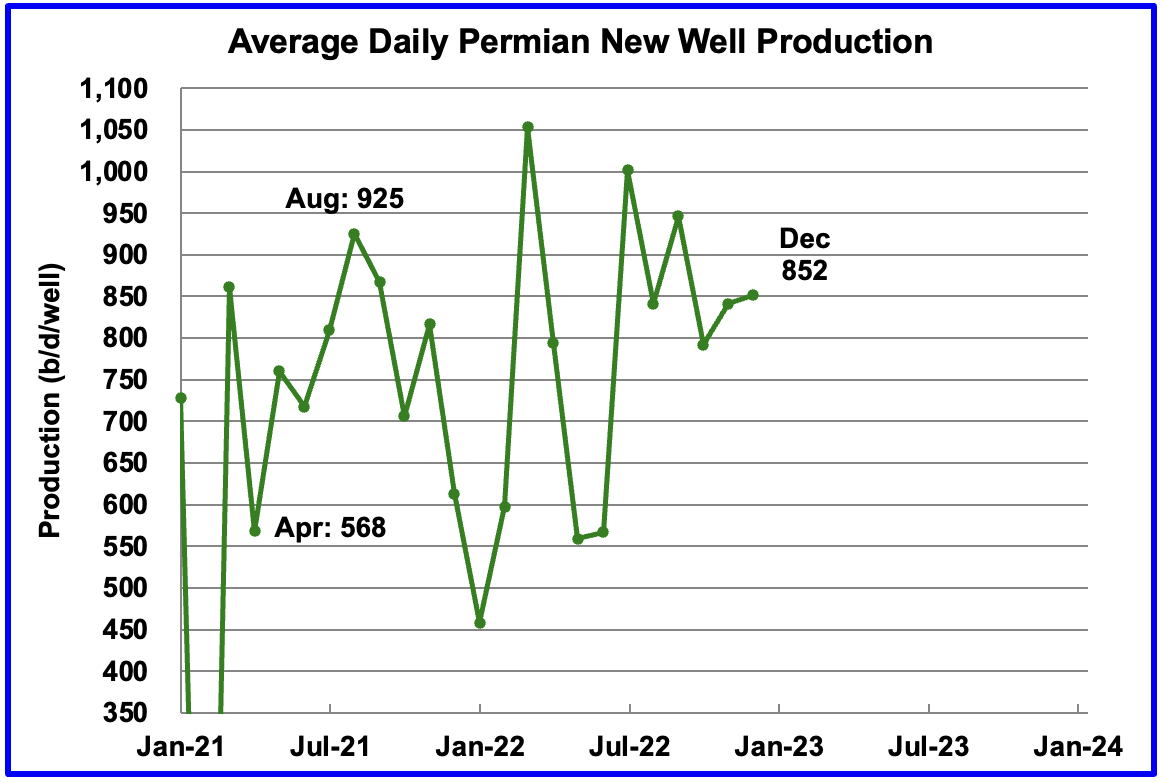
Average daily production for first month Permian wells also shows reduced volatility and indicates average production was 852 b/d in December and could be stabilizing in the 850 kb/d range. Note that December is the latest month for reported completion data.
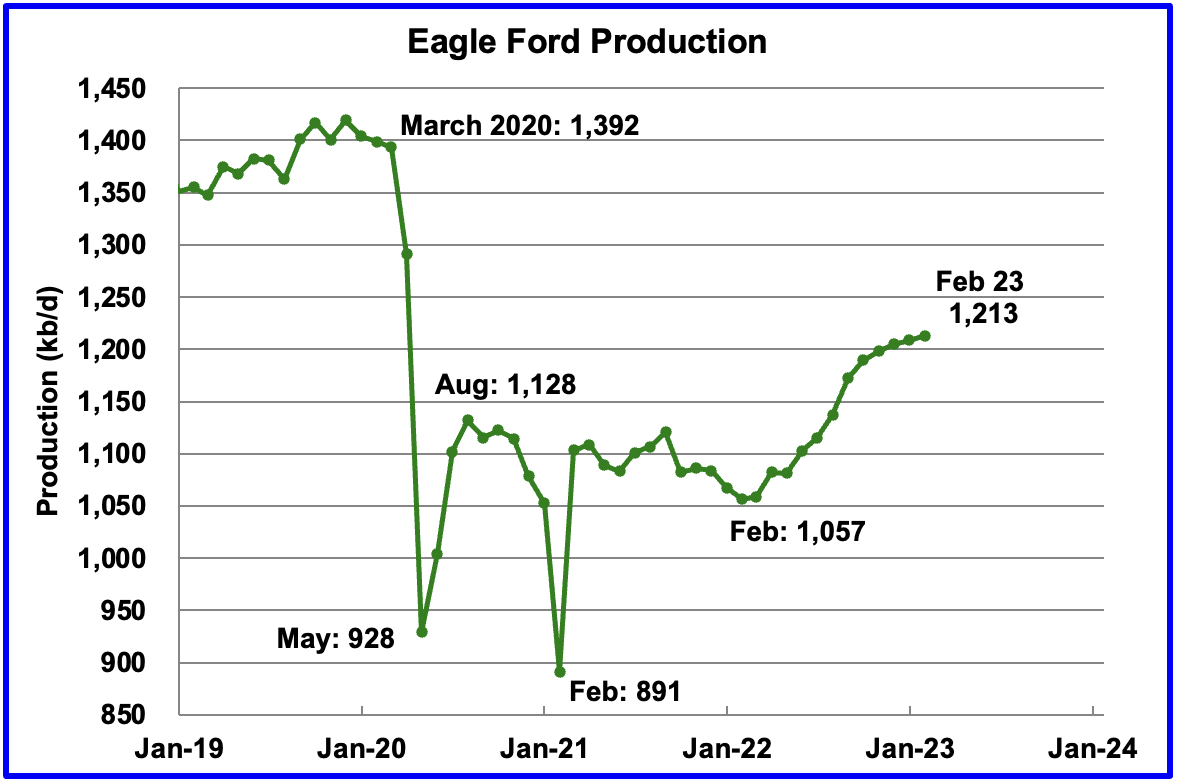
Output in the Eagle Ford basin has been showing an increasing trend since March 2022. More recent data indicates that it may be transitioning to a plateauing phase. For February, output is expected to increase by 4 kb/d to 1,213 kb/d.
At the beginning of the year, 43 rigs were operating in the Eagle Ford basin. As of January 2023, 68 were operational.
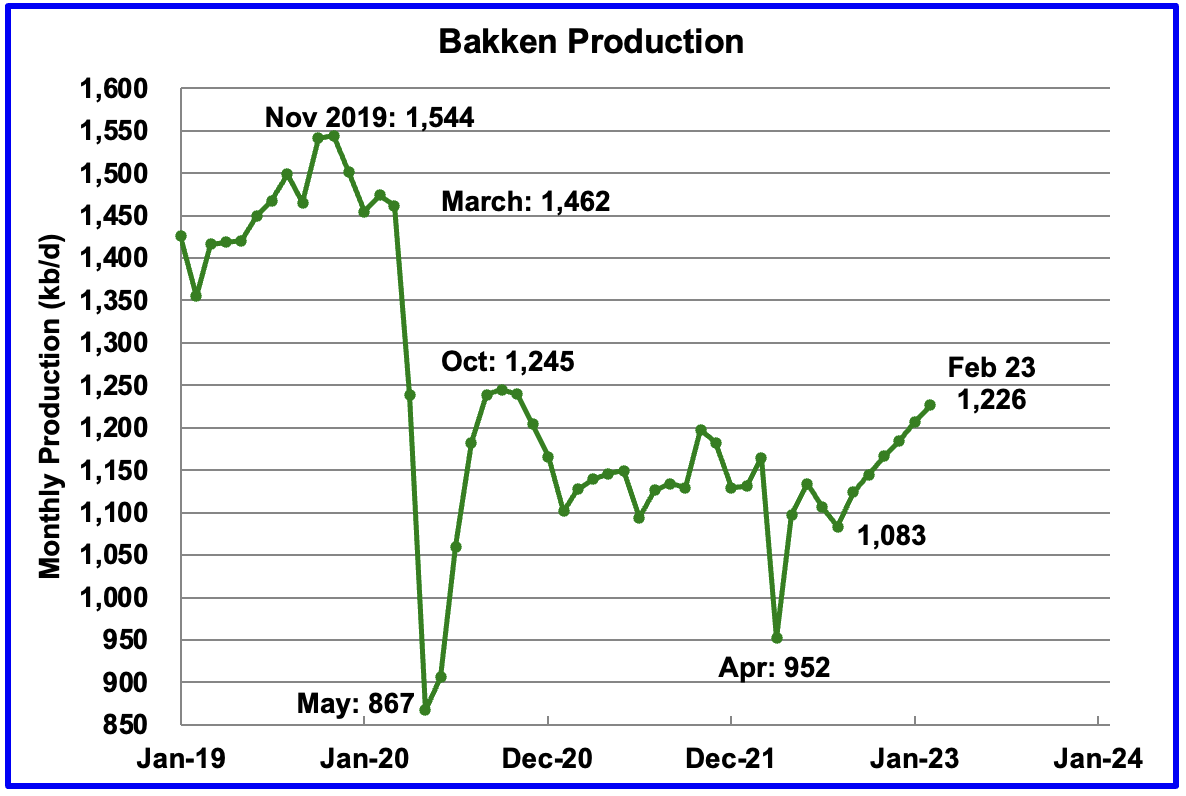
The DPR forecasts Bakken output in February will be 1,226 kb/d an increase of 20 kb/d over January. Production from September onward looks optimistic/wrong considering the extreme weather that North Dakota has experienced recently. The North Dakota Department of Mineral Resources reported that November production was 1,098 kb/d, see next chart, while the DPR is reporting 1,166 kb/d for November.
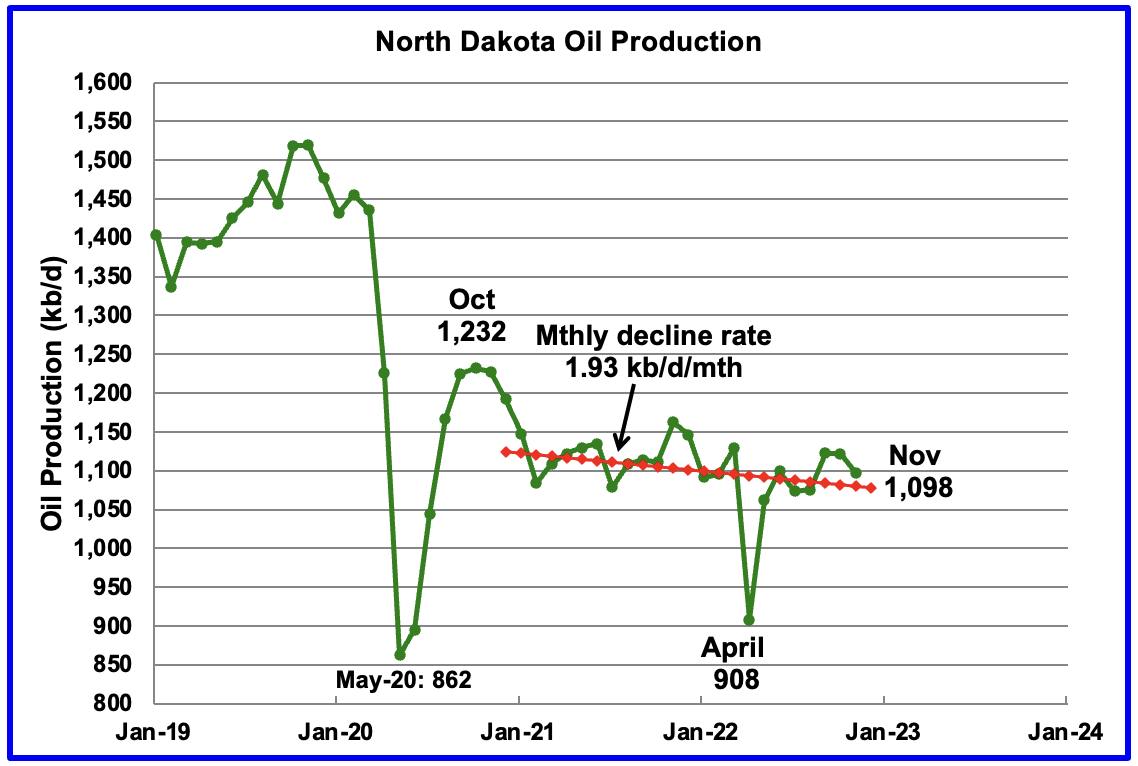
North Dakota production as reported by the Department of Mineral Resources. November production was down by 24 kb/d.
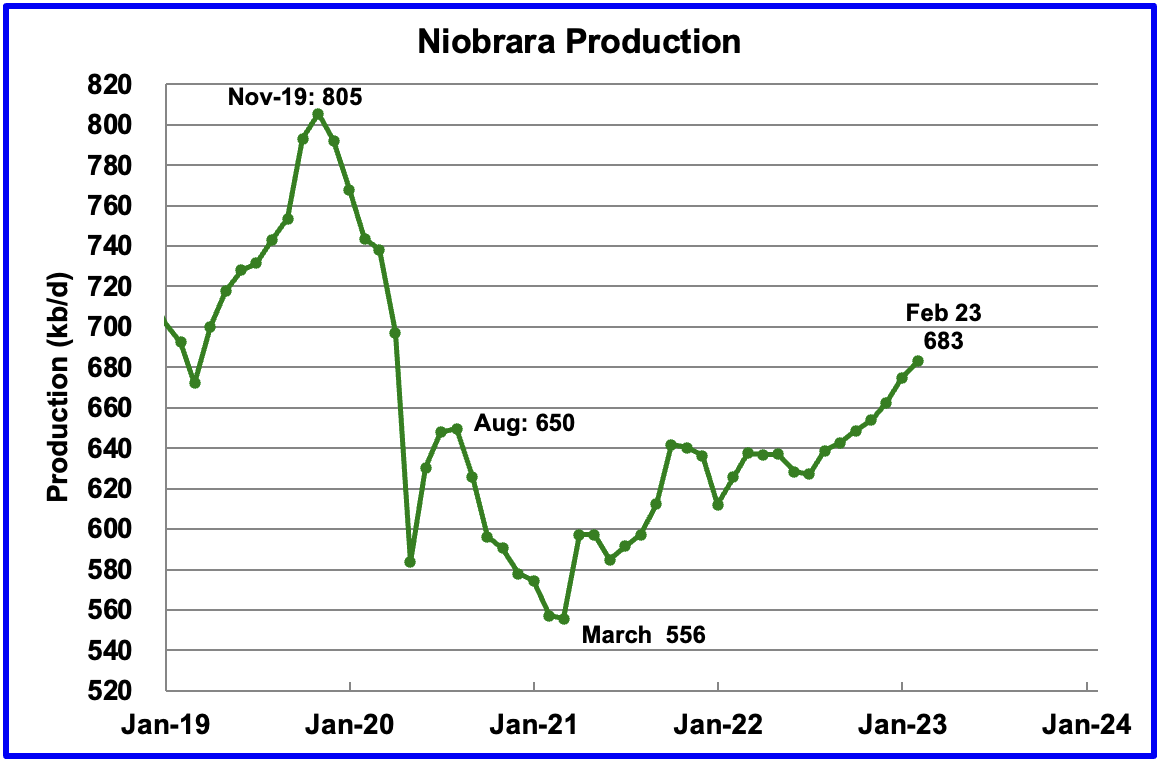
Output in the Niobrara continues to increase slowly. February output increased by 8 kb/d and set a post pandemic high of 683 kb/d.
Production increased due to the addition of more rigs into the basin. The Niobrara had 12 rigs operating in January 2022. By November 2022, the count had increase to 19.
Completions also increased. In January 2022, 73 wells were completed. By November 2022, monthly completions increased to 109, which accounts for the increasing production.
DUCs and Drilled Wells
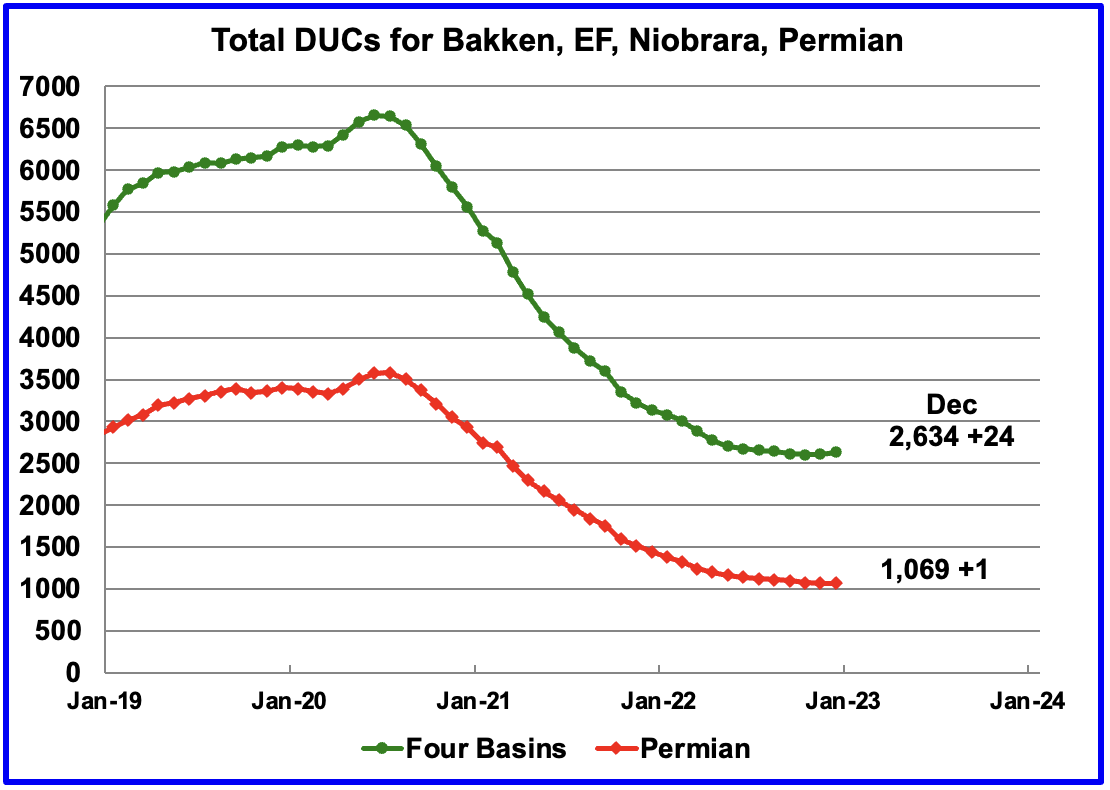
The number of DUCs available for completion in the Permian and the four major DPR oil basins has fallen every month since July 2020 but that trend has now reversed. In November 2022 the trend for total DUCs changed from decreasing to increasing. December added 24 DUCs.
In the Permian, the falling trend in DUCs also changed. December is the first month since mid 2020 when the number of DUCs increased. December Permian DUCs increased by 1 to 1,069 because 432 wells were drilled and 431 were completed.
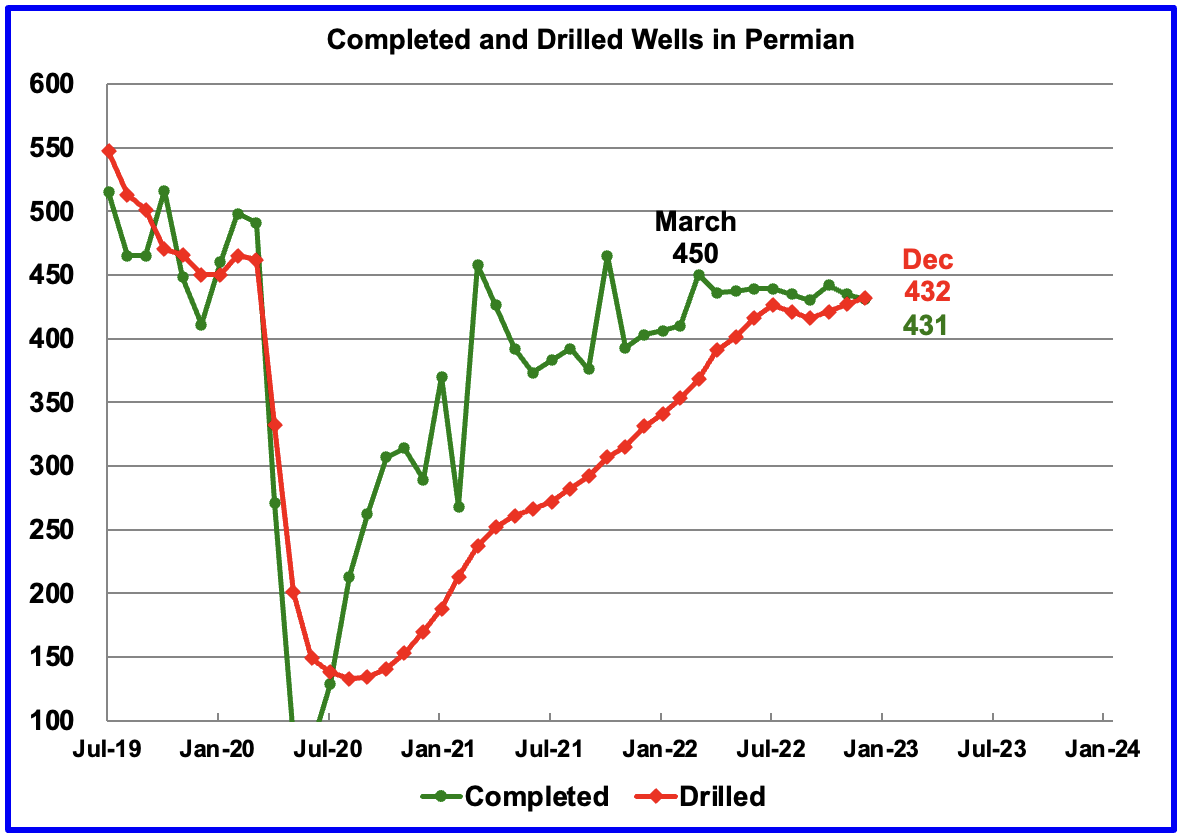
In the Permian, the monthly completion rate has been showing signs of slowing since the March high of 450. This is consistent with the frac spread chart shown above where there has been little to no growth in frac spreads since February. Also the number of wells drilled in the Permian has been essentially flat since July at close to 430.
In December 431 wells were completed, 4 fewer than in December and 19 fewer than in March. During December, 432 new wells were drilled, an increase of 5 over November. The gap between drilled and completed wells in the Permian has now essentially vanished. This raises a question. Since the producers would be completing the best wells, does this imply that most of the remaining 1,065 Permian DUCs are Dead DUCs?
December Light Tight Oil Update
The EIA’s LTO database provides information on LTO production from seven tight oil basins and a few smaller ones. The January 2022 report updates tight oil production to December 2022.
This is the fifth LTO report published since it was updated due operational issues. The current update has made minimal changes to production reported in the previous report.
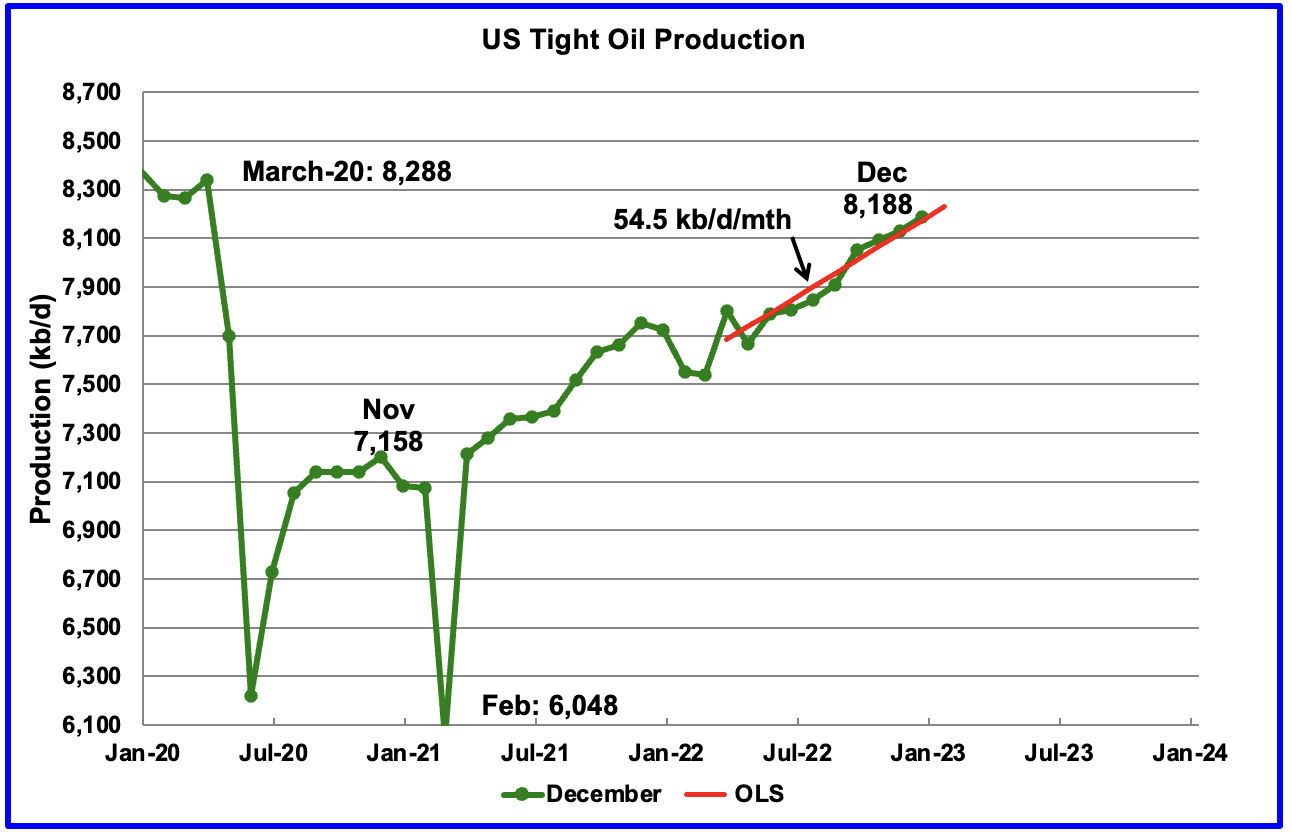
According to the latest LTO report, December’s LTO output increased by 58 kb/d to 8,188 kb/d.
The red OLS line from March 2022 to December 2023 indicates a monthly production increase of 54.5 kb/d/mth.
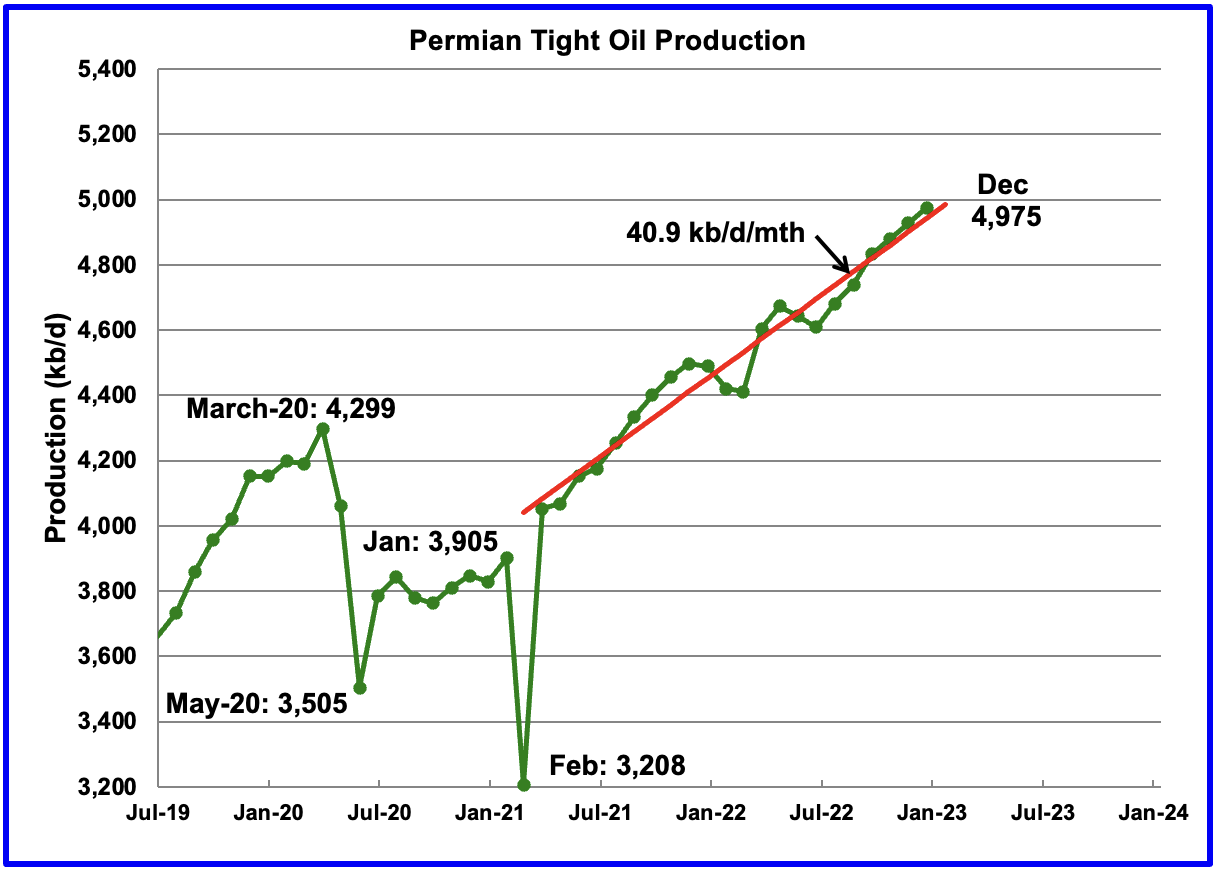
December’s output increased by 48 kb/d to 4,975 kb/d and is 676 kb/d higher than the high of 4,299 kb/d recorded in March 2020.
The monthly production increments for the last three months are close to 47.5 kb/d/mth and appear to be slightly larger than the average slope from March 2021. Over the last 3 months, completions were close to 432/mth and may account to the roughly consistent monthly production increases.
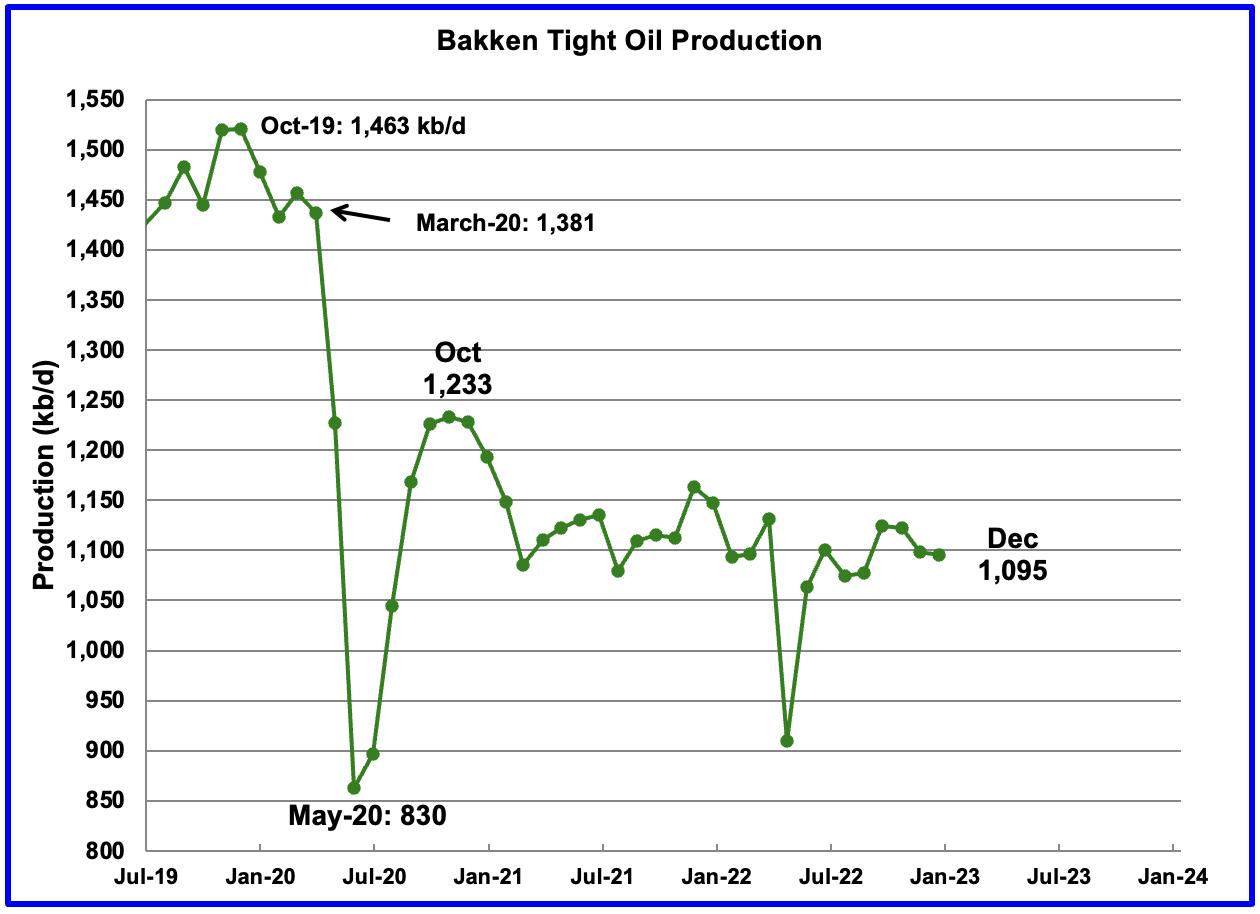
The Bakken’s December LTO output decreased by 4 kb/d to 1,095 kb/d. For comparison, note the DPR Bakken report above, December production increased by 19 kb/d and increased steadily from August to February which is inconsistent with this LTO report. The North Dakota Department of Mineral Resources reported that November production was 1,098 kb/d which is consistent with the LTO report.

Production in the Eagle Ford basin increased by 5 kb/d in November to 971 kb/d and is little changed from June 2022.
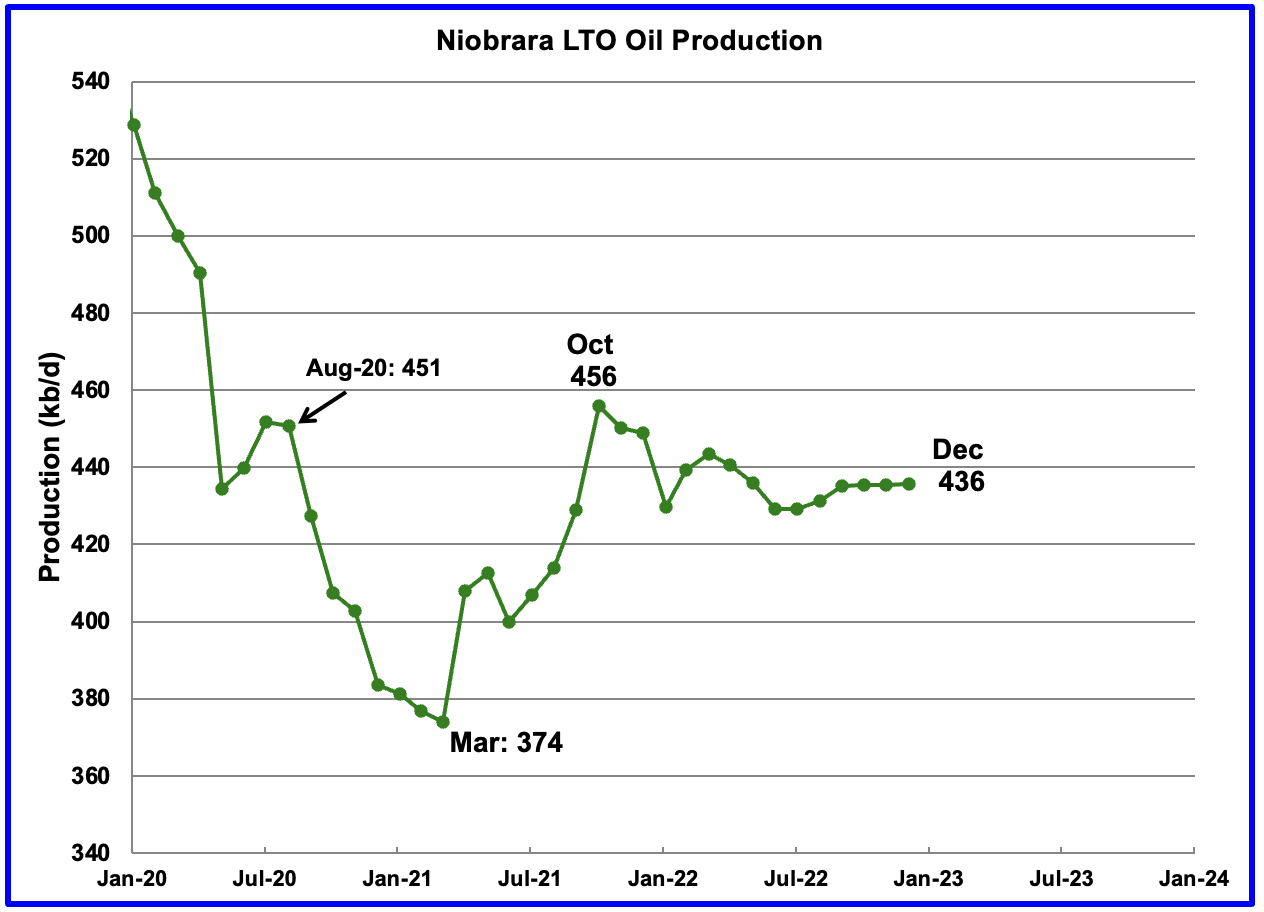
Production in the Niobrara since September has shown little growth. December’s output increased by 1 kb/d to 436 kb/d and has been essentially flat for the past four months. In late October, 19 rigs were operating in the Niobrara basin. In late December and all of January, the number of operational rigs had fallen back to 15.5.
Onshore L48 Conventional Production
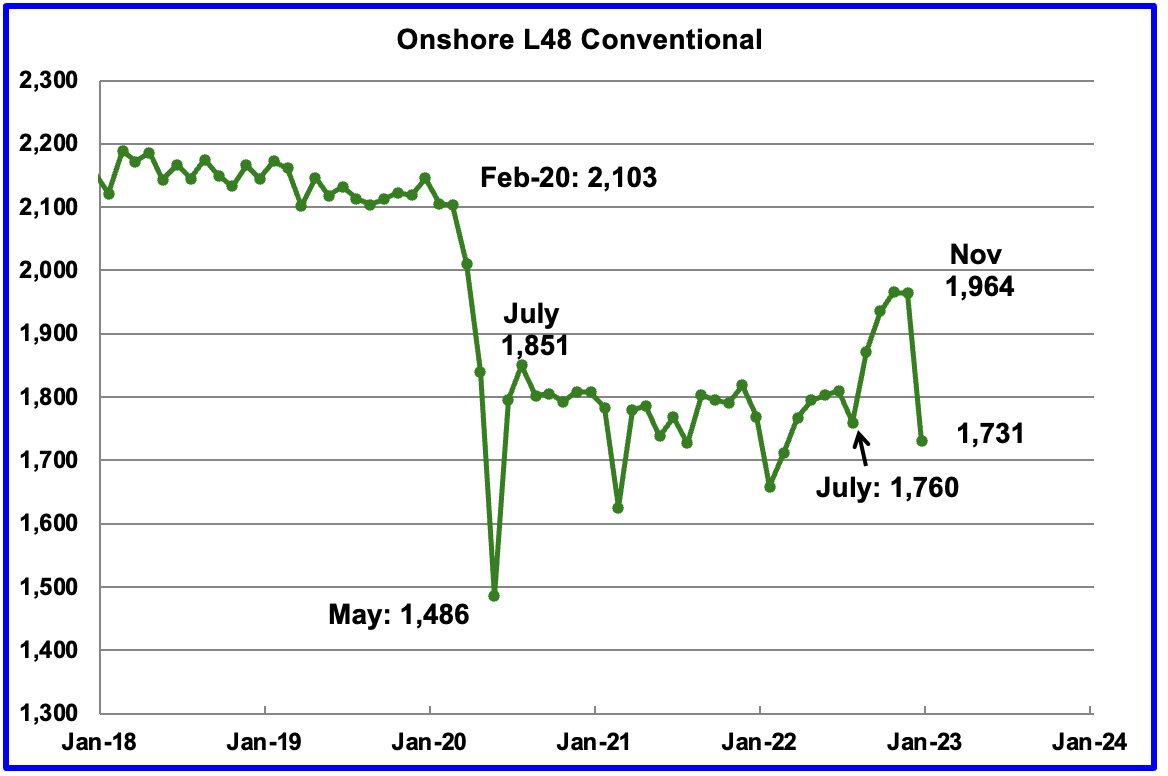
Conventional oil output in the Onshore L48 dropped by 233 kb/d in December to 1,731 kb/d and is more in line with estimates prior to July 2022. This estimate is based on a combination of the expected December LTO output and the January 2023 STEO report that has a December 2022 forecast for the US Onshore L48 output.
The big production drop of 233 kb/d is due to a 175 kb/d November to December drop forecast in the January STEO and a 58 kb/d increase in LTO output. Note that the conventional oil estimate comes from subtracting two large numbers and is quite volatile month to month due to revisions.
122 responses to “US November Oil Production Shows Small Drop”
Ovi , better headline .” November 2022 US production fails to pierce peak 2019 US production ” . You are being soft . 🙂 . Effort appreciated . What would we do without you ?
HiH
Thanks
I would have to post that headline for at least the next 20 months. The STEO thinks we might get there by November 2024. It’s a long time to wait. Much will happen between now and then to change the outlook.
These charts are very frustrating to watch. They are worse than watching grass grow.
global coal demand at an all time high, it’s as if the world does not believe in or care about the changing climate.
https://mobile.twitter.com/ArjunNMurti/status/1622272506554892289
possible alternative is that they recognize governments have zero capacity to change the weather, but do have the capacity to make some people extremely rich.
‘”Coal has been in terminal decline in the US and EU”
The USA has the largest coal reserves on the planet. How could it be in terminal decline?
Coal is in decline because it’s too expensive. The American industry has been surviving for decades by not investing in new power plants. The US has one of the oldest coal fleets in the world. Now the old plants are shutting down, and investing in new ones that can’t compete with gas wind or solar just doesn’t make sense.
My definition of terminal decline is that you are post peak and the trend is all downhill from the peak.
The USA isn’t producing coal because it doesn’t need to.
The potential remains for it to do so, some estimates are that the USA has 500 years of coal ( coal reserve estimates seem to be all over the place and unreliable however).
True, but then the US could also keep producing indigo in vast quantities for centuries on end. It was an awesome product and once the staple of the South Carolina economy. But when IG Farben started selling large quantities of cheap Prussian Blue dye in the mid 19th century, the indigo industry entered a terminal decline
The same thing could be said about cathode ray tube TVs. A marvelous technology, and one that could easily be produced in vast quantities even today. But nobody wants them any more, thanks to liquid crystal displays, so the industry is dead as a door nail.
And this: https://www.eia.gov/todayinenergy/detail.php?id=55419
Here’s a chart showing how old American and European coal plants are: https://www.iea.org/data-and-statistics/charts/age-structure-of-existing-coal-power-capacity-by-region
And how new Chinese plants are.
That is a very useful interactive chart.
One of the take home messages that you can draw from it is that just about 2/3rds of the existing coal burning plant capacity of the world is less than 20 years old,
and predominantly in Asia.
I would be very surprised if that new capacity doesn’t get a long run of heavy use.
It will be needed to supply the air conditioning for the hotter world. Joking I am not.
Coal is literally saving the environment. Look:
https://www.npr.org/2023/02/05/1152823939/despite-billions-to-get-off-coal-why-is-indonesia-still-building-new-coal-plants
Elon needs more Teslas to save the planet, and dammit, he will get them.
Hickory,
The problem fossil fuel based electricity generation has now is that building new solar is often cheaper than keeping existing coal fired plants running.
Alim- that has been show to be true for many places, however it doesn’t necessarily move the needle much.
One big reason is because the sunk costs in developing the coal burning infrastructure [mines, ports, trains, power plants] result in a high incentive to service the loans, support the jobs, and reap the political support from the industry. In short- inertia and vested interest.
All of this new coal burning capacity will continue to be used, and yet more will be built.
Solar/wind will also be deployed simultaneously, at increasing rate.
As oil begins to decline, electrical demand will continue to grow to make up some of the energy shortfall in transportation.
Charts for nuclear plants would look the same. The US has not invested much in infrastructure fo 40 years
TTT,
You might be interested in the article – from 2 days ago on the Wattsupwiththat site – describing Vietnam’s stunningly successful plunge into manufacturing-led industrialization that is being fueled by Indonesian lignite and – in the coming years – US LNG.
(The jaw dropping images of Da Nang are worth the look see by themselves).
As the ever increasing precariousness of the ‘decarbonization’ policies manifests, more and more people are apt to step back and re-evaluate current pathways.
TexTea, the climate has been changing on the Earth ever since there has been a climate-atmosphere on the earth for more than 4 billion years!! https://www.science.org.au/learning/general-audience/science-climate-change/2-how-has-climate-changed
with respect to the conversation on coal, one might ask what would the US coal demand be without the huge increase in natural gas supplies and demand.
Goldmans oil call:
https://www.zerohedge.com/markets/oil-face-serious-supply-problem-2024-production-capacity-runs-out-goldman-warns
I am not in 100% agreement with Curries arguments but $70 oil does not get the job of increased supply to the market and prices were not high enough for long enough to bring on supply in the out years.
Coffee thanks, as Europe is now learning you can’t run an industrial economy with windmills as industries move to where there is sufficient dependable energy. I think they call offshoring carbon use. Much like then fellow who orders a diet coke and two big macs, he may think he is doing something good, but the numbers say something else.
Texastea,
As more US natural gas is exported, the price of US natural gas might start to approach a World price (differential will be LNG price in Europe and Asia minus Henery Hub, maybe $5/MCF). It is not clear at what price World demand for natural gas will match World supply in 2028, but my guess will be something like $8/MCF at Henry Hub (and $13/MCF in Europe/Asia for LNG) or perhaps higher.
At that price wind and solar will take a lot of market share for electricity production in the US and even including the cost of battery backup for Wind/Solar natural gas and coal are not likely to be competitive.
See
https://www.eia.gov/todayinenergy/detail.php?id=55419
Of planned capacity additions to the electric power plants in the US in 2023 about 82% is solar, wind, and battery (44.5 GW of 54.5 GW).
Dennis
You need natural gas for the following industrial uses, fertilizers, petro-chemicals such as plastics and medicine, nylons, plastic bags, rubber gloves, hydrogen, etc….
Wind and solar are not viable replacements/alternatives.
Germany’s economy is very dependant on natural gas to run its chemical plants, such as Bayer and BASF. I am not sure how much of the chemical industry had to cut back because of the limits on the use of natural gas.
Maybe someone can convert the past use of Russian natural gas in Germany and Europe to the number of daily LNG ships.
Ovi,
Yes, that is correct. A significant amount of natural gas is used for electric power and heating. In 2022 approximately 87% of World natural gas was used for electric power, I imagine a significant amount was also used for heating of buildings and water, the amount used for other purposes may not be very large (perhaps 5 to 10% of World natural gas output for uses other than electric power and heating of buildings and water). My guess is that there will be plenty of natural gas for those other uses for the next 50 years at least, and perhaps as much as 100 years.
My point was that natural gas demand is likely to fall due to less use of natural gas for electricity production and for heating buildings and water as heat pumps displace natural gas boilers, furnaces, and water heaters over time. As the price of natural gas increases (in the short term) this displacement of natural gas by wind and solar may accelerate. Eventually natural gas demand may fall below supply which will then drive down natural gas prices which might lead to reduced natural gas supply as fewer natural gas prospects will be profitable to produce. I expect a peak in World natural gas output around 2030 to 2035 as this scenario plays out. The speed of the decline in natural gas output after the peak will depend in part on the relative price of electricity produced by natural gas power plants vs wind, solar, and nuclear power plants. Impossible to predict that in advance,
Dennis , ” My guess is that there will be plenty of natural gas for those other uses for the next 50 years at least, and perhaps as much as 100 years. ”
Almost had a coronary when I read this .
I can understand why Mike S is pissed off .
My guess is that there will be plenty of natural gas for those other uses for the next 50 years at least, and perhaps as much as 100 years.
https://www.oilystuffblog.com/forumstuff/forum-stuff/almost-out-of-stupid
“Assuming the same annual rate of U.S. dry natural gas production in 2020 of about 30 Tcf, the United States has enough dry natural gas to last about 98 years.”
https://www.eia.gov/tools/faqs/faq.php?id=58&t=8#:~:text=Assuming the same annual rate,to last about 98 years.
Conservative –
1. a person who is averse to change and holds traditional values.
2. a person favoring free enterprise, private ownership, and socially traditional ideas.
If Mike is a conservative, how come he doesn’t believe in free enterprise when it comes to exporting energy ? For the last 60 years America has been a major net importer. Burning and wasting other countries limited energy resources. Had the rest of the world lived by Mikes standards, America would be a much more efficient country today and a lot poorer. In addition, if Mike beholds traditional values. During world war 2 America rationed gasoline during it’s fight against tyranny. Where is Mikes call for rationing as America and Europe fight against Russian tranny in Ukraine? I’m convinced conservatives are only conservatives when it benefits themselves.
If America doesn’t transition to renewables. Mike’s grandchildren will live in poverty and his family values will be meaningless. Depletion doesn’t rest. Not exporting isn’t going to save them.
Courtesy Mr Shellman’s blog .
https://rbnenergy.com/the-final-countdown-bearish-gas-market-punctuates-last-throes-of-shale-era-abundance
Also revisit the comments section of the > almost out of stupid < post above . Comments by Art Berman and Ted Cross . Interesting reads ,
Hole in head,
If the natural gas demand for electric power and heating of buildings and water for the World decreases from 145 EJ to 11.6 EJ over the next 20 to 40 years as wind, solar, and batteries ramp up and as heat pump use ramps up replacing much of the heating use of natural gas, then there will be plenty of natural gas for fertilizers and petrochemical use etc.
Dennis , your post at 11.08 am . Too many IF”s
1. IF we get consumption down . Keep dreaming .
2 . IF we can install heat pumps .
3 . IF we can get battery storage .
4. IF we can ramp up wind and solar .
5. IF we had 20 /40 years .
My retort : IF wishes were horses beggars would ride . I have another one but I will refrain from posting that .
Dennis
I guess my focus was more on Germany and to a lesser extent Europe. Germany approved Nordstream 2 because they needed more gas for their chemical industry. Both Germany and Russia were big suppliers of fertilizer CH4 > NH3. Not sure what has happened to those plans. Are they on hold pending LNG imports?
nuclear…really dennis. my god I think he has seen the light. 😉 I am curious however, if we go nuclear, and I believe we will, why the hell do we need to be building these windmill farms that will be obsolete by the time the nuclear plants are built? you know other then to funnel big money to the democratic donors?
Texastea,
Are the windmills in Texas all owned by Democrats? Nuclear is much more expensive than wind and solar, there is not a lot of growth in electric power output from Nuclear since 2000 or so. Chart below uses data from BP Statistical Review of World Energy.
This may be a result of falling costs for wind and solar relative to nuclear power.
Texas tea,
Comparison of nuclear generation and wind and solar net generation of electric power worldwide.
From 2010 to 2021 wind and solar net output of electric power grew at an annual rate of about 18%/year.
“if we go nuclear, and I believe we will, why the hell do we need to be building these windmill farms”
I guess reality isn’t your strong suit.
Your ‘belief’ is not what the countries utilities base their project development budget on.
They look at finding the best bang for the buck with current technology.
And both wind and solar beat nuclear hands down this decade, and likely even more so next decade, and the next. It is not even close.
Only a few nuclear reactors have come online in the US in the past 25 years, at very high expense.
Maybe someday the prospects will improve for nuclear.
In the meantime the US electrical generation capacity additions will lean hard into the countries areas of strength.
In fact the US has a massive reserve of untapped solar and wind energy.
This isn’t your grandfathers energy scenario anymore.
Wind is only cheap when you back it at least 90% with conventional energy.Otherwise, it will get expensive to build all these storage plants. There is a base of pumped hydro here, but it’s only tiny compared to the need.
Current production:
https://www.energy-charts.info/charts/power/chart.htm?l=en&c=DE
The cheapest energy here is brown coal – and the most dirty. All C02, enviromental impact (huge pits) and pollution.
Building new wind energy plants is lagging here at the moment – the fixed minimum price is too low, since inflation also hit the construction of them hard.
Building nuclear energy, if wanted, has to be done like the building of the wind mills. Medium sized reactors need to be produced in factories and only mounted in site.
Today reactors are build like hypercars – all by hand. That’s why a hypercar costs 2 million and a GM 30.000.
TEXASTEATWO —
Nuclear is basically dead in the water. Like the coal industry in the rich world, it has survived by not spending any money on new plants for decades. As a result, the fleet is old and aging fast.
What happened in France this year is a sign of things to come. Production was down by 40% or so on the year because a large number of plants, all built around the same time, all turned out to have the same problem. And that problem is a symptom of aging.
If we started a massive round of construction now, the first plants would come on line in about 2045. By that time, most of the existing fleet will likely have shut down. So the best hope is maintaining the status quo. And it’s a faint hope.
Eulen “Wind is only cheap when you back it at least 90% with conventional energy.”
That 90% is a fallacy. It ignores various forms of storage and a grid connection with other regions and sources of energy.
Even in a scenario where no significant attempt was made to adjust to the intermittency of wind, as worse case scenario of inept planning, then the wind energy benefit would simply be a mechanism to decrease the monthly bill that a region or country has to spend on imported fossil fuel.
In that scenario all of current fossil and nuclear generation capacity should be kept available.
Ovi,
Quick, back of the envelope calcs for Europe/Germany substituting LNG for Russian natgas … (2021 data, recently skewed)
Europe would need ~1,500 shiploads of LNG (~4 per day).
Germany would need ~436 shiploads (1.2 per day).
For context, the US sends out ~3 ships per day, increasing slightly as Freeport comes back online, and should go to over 4 per day by 2024.
American LNG goes worldwide, including Asia, South America the Caribbean as well as Europe. (Just might surprise people if Australia becomes a customer in the future).
The economic, infrastructure and geopolitical factors all weigh in heavily in these matters. As such – while the above numbers should be accurate – it is largely a illustrative response that addresses your question.
Coffeeguyzz
Thanks for the estimates. Back of the envelope is always good. 4 for Europe and 1.2 for Germany.
So Bayer and BASF could be back up to full production shortly, if they are not already. So is the Russian gas that went to Germany and Europe shut in?
Ovi,
The Real World particulars are far more daunting with many aspects to consider.
The shipload numbers were derived by simply getting European 2021 Russian natgas imports (155 Bcm), dividing by 600 to get liquid status, then divide by 173,000 – average ship capacity.
Same with Germany after changing their Petajoule numbers to LNG.
Germany’s 1.2 ships per day … 36 shipments a month … almost double current US total deliveries.
Some of the challenges are that there is insufficient import terminal capacity, and virtually all the product – American sourced, anyway – is already contracted out.
Many more ‘wrinkles’ involved, but I think the European and German industrial base will be hurting for quite some time.
Coffeeguyzz here,
The statement of 3/4 US LNG ships per day SHOULD have been 3 to 4 per WEEK.
Sorry for any misunderstanding.
Thanks for that clarification. Was wondering.
Take note that data from EU 3rd quarter shows Nat gas imports by source country-
Norway 31%, US and Russia 15%, UK 12%, Qatar 7%, Others 20%
[EuroStat]
Hickory,
Yes. Your more current data reflects the dramatic sanctions-driven change from my (2021) numbers.
In 2021, 55% of Germany’s imported natgas came via Russia … 1.6 Trillion cubic feet total.
Dennis/Ovi . I hope this will assist .
Can’t read chart. Maybe a link would help.
Also I can’t stand on my head to read the chart. 🤣🤣🤣
Ovi , here is the link .
https://www.icis.com/explore/resources/news/2022/08/23/10798349/poland-s-azoty-stops-capro-pa6-nitrogen-ferts-production-on-gas-pricing/
Also see
https://www.eia.gov/todayinenergy/detail.php?id=55239
In our latest Short-Term Energy Outlook, we expect that increased U.S. power generation from new renewables capacity—mostly wind and solar—will reduce generation from both coal-fired and natural gas-fired power plants in 2023 and 2024.
With the new solar and wind projects coming online this year, we forecast these two energy sources will account for 16% of total generation in 2023, up from 14% last year and 8% in 2018. In contrast, our forecast share of generation from coal falls from 20% in 2022 to 18% in 2023; the forecast share from natural gas declines from 39% to 38%.
One of the most significant shifts in the mix of U.S. electricity generation over the past few years has been the rapid expansion of renewable energy resources, especially solar and wind. The U.S. electric power sector operated about 74 gigawatts (GW) of solar photovoltaic capacity at the end of 2022, which is about three times the capacity at the end of 2017. U.S. wind power has grown by more than 60% since 2017 to about 143 GW of capacity.
Based on planned additions reported to EIA, solar capacity will expand another 63 GW (84%) by the end of 2024, which is consistent with its declining construction costs and favorable tax credits. As a result of this expected increase in solar capacity, we forecast that the solar generation share will rise from 3% of U.S. generation last year to 5% in 2023 and 6% in 2024. Scheduled growth in wind power is slightly slower this year than in recent years, at about 12 GW of new planned capacity over the next two years. The forecast wind generation share in 2023 remains relatively similar to last year, averaging 11%, and then increases to 12% in 2024.
Longer term chart from EIA STEO (Jan 2023) covers 1997 to 2024 (2023 and 2024 are STEO forecasts). click on chart for larger view
Dennis,
I will defer to your expertise on wind and solar as they seem to have no real word application in the private market place. I am curious on your take of the article below. My read is, with out huge government subsidies there would be NO green energy revolution. As an aside and an extension of that argument, why doesn’t the private market place put its resources there and what are the risk when government picks winner and losers rather than the market place? I think there is a serious risk of misallocation of valuable resources as well the risk to long term energy security. Seems like those real world lessons are being learnt once again.
https://www.zerohedge.com/weather/wind-power-makers-suffer-huge-losses-want-abandon-major-project
Texastea,
Often it is assumed that private markets will yield an optimum allocation of resources. The underlying economic analysis that leads to that conclusion requires a number of very unrealistic assumptions to arrive at that conclusion.
Fossil fuel will deplete and replacement will be needed. Private investment looks to short term gain in most cases and would prepare badly for a transition in the absence of government incentives in my opinion.
Consider preparation in Texas for winter storms by oil and gas producers in 2021 as an example of how well private enterprise prepares for the future. Government intervention is sometimes needed.
The perfectly competitive markets upon which neoclassical economics is based is a fiction that exists in only a small part of private enterprise.
The article you linked ends with this:
It is beyond the time to end subsidies for wind power. Not only has atmospheric CO2 risen without serious consequence, the doomsaying models proven consistently wrong, but the financial thumb on the scale via subsidies has encouraged development of a technology that is still immature, if it ever will be viable.
When I get to this, I no longer take anything that was said in the piece seriously. Climate change is real, those who claim otherwise are simply wrong.
What many fail to understand is that once atmospheric CO2 increases it takes thousands of years for it to return naturally to levels consistent with most of the Holocene. In addition it takes hundreds of years for the Ocean to reach a thermal equilibrium with the warmer atmosphere so the consequences of higher atmospheric carbon dioxide levels take a considerable period to become apparent.
This is what the geophysicists and geochemists attempt to model and we would be wise to listen to them.
respectfully Dennis if you studied economics and did not come to learn that the free market place has self corrective mechanism built in, where governments do not. Perhaps a reread on your part of the Soviet Union collapse would be in order.
I would never argue the free market always is it right, but I trust those risking their own money over those that are risking others money all day long and twice on Sundays, you would be wise to adopt such an approach.
With respect to yet another lecture on climate change, I will offer this history of how we got here, from the people who were there. What do we call people who listen or want to hear only one side of a scientific debate. Children
https://www.youtube.com/watch?v=7LVSrTZDopM
Both Abhi and Javier had some interesting comment on BP’s return to sanity. Or as I like to say, where energy fiction meets energy reality.
https://mobile.twitter.com/araj_energy
https://mobile.twitter.com/JavierBlas
Texastea,
There is a middle ground between a planned economy such as that of the old Soviet Union and a free market economy such as that of the US prior to 1930. Any student of economic history will understand this.
Only a fool thinks an unregulated capitalist system is self-correcting, that theory has been relegated to the dustbin of history.
There a number of problems with Walrasian Economic Theory, the system is mathematically elegant but requires several unrealistic assumptions.
A well regulated capitalist economic system is the best system yet devised by humans for a complex social system when coupled with a representative democratic political system.
Note that the self correcting mechanism for a government is the ballot box for a representative democracy. The “self correcting mechanism” of a laissez faire economic system is a fallacy of classical economics which was pointed out long ago by Keynes.
Texastea,
Much of the “debate” about climate change by those in the scientific community is whether things will be bad or worse.
Those who cling to the notion that there is no problem that needs to be addressed and think there is any debate about the need to reduce fossil fuel combustion as quickly as possible are akin to those debating whether the Earth is flat or roughly spherical (technically an irregular ellipsoid). Children sometimes have those debates, but adults don’t waste their time.
“with respect to the conversation on coal, one might ask what would the US coal demand be without the huge increase in natural gas supplies and demand”
one step further…without coal, oil and gas there would be no tree left standing,
and without gas and oil- coal would be extremely hard to find by now…maybe none left, lready burnt down to the smallest and deepest chunks….even the dust.
Coal has a big future in regions that don’t have better alternatives, in those who are in deep poverty, and in those who have been asleep at the wheel as if it is still the 20th century on an energy technological and economic basis.
Get ready for a much hotter world.
For the US, coal is trending down fast to a backup grid role.
Hickory,
Poorer nations will choose the cheapest type of electric power, this is likely to be wind and solar rather than coal. Coal will deplete and become very expensive if wind and solar do not ramp up, nuclear power is also not likely to be able to compete with wind and solar power. The trend in coal use for the US is likely to be the future trend for World coal use with a lag of roughly 15 years. For the US from 2008 to 2022 electric power output from coal fired power plants decreased at an annual rate of about 6.5%.
Yes that is true Dennis if they were starting from scratch but many countries already have coal plants and so they will stick with that production capability for as long as the plants last and as long as they can get coal for cheap.
And if they have good solar resource, as over 80% of the worlds population does, then they will be slowly adding solar to the mix.
Overall, I agree with the gist of your statements with a handful of countries being in a contrary situation. Poland is an example with a big coal industry and marginal solar. They have good wind resource but will be burning coal heavy for along time, as will India, China, Viet Nam, Indonesia, for example.
Hickory,
I do not expect coal use will stop overnight, but coal will deplete and as it does will become expensive, costs for solar in particular are falling rapidly and soon the cost of electric power from solar will be cheaper than the cost of power from existing coal plants. When we reach that point, the lowest cost option (solar) will become dominant. This will likely be the case within 2 decades, and within 4 decades very little coal will be burned for electric power.
There are some people who are opposed to your statement “Fossil fuel will deplete and replacement will be needed.”
not because they don’t understand fossil sunlight energy depletion,
but because they hope to profit from the period of disruption
when energy is in shortage- the more severe the better…for them.
The Problem with polnish wind is the weather pattern: High pressure shutting it of for weeks sometimes.
So it needs a 100% backup anyway. They start going nuclear now.
Does anyone think the Chinese balloon was testing the waters regarding EMP shutdown of the American electrical grid?
A charge at 60,000 feet would do it.
EV’s would be particularly vulnerable. So would any ICE vehicles after the late fifties–due to computer chips.
Not particularly a conspiracy theorist, just interested in what this thing was doing up there.
EMP in America just before an invasion of Taiwan would stack the deck.
Yes, that is certainly possible. Although delivery by means other than balloon may be much more viable.
Both countries are playing with fire.
Imagine how they feel with our naval fleet hanging out around their front door through which all of their cargo, including liquid fuel, comes and goes.
It would be wise to consider all tactics being on the table of possibilities.
I’m sure the military of both sides sees it that way.
Gerry/Hickory
I think there was a secret agreement that went off the rails. Note that the DOD is saying there were three transits when Trump was in power and one in October 2022.
Many years back, a US spy plane, P3 Orion, was struck by a Chinese plane. “On April 1, 2001, a mid-air collision between a United States Navy EP-3E ARIES II signals intelligence aircraft and a People’s Liberation Army Navy (PLAN) J-8II interceptor fighter jet resulted in an international dispute between the United States of America and the People’s Republic of China, called the Hainan Island incident.” The plane made an emergency landing on the island.
As a result of that incident and some attempt to ease tensions between China and the US, possibly within the last five years, the two came to an agreement to let China balloons overfly the US and China agreed to let US planes sniff around the edges of China and not be harassed. So as long as no civilians spotted the balloons there was no problem. Nobody saw the oversights during Trump’s time and in October with Biden. The military did not pass the news up to the higher ups since the flights were part of an agreement.
What went wrong. I think the balloon was supposed to get to 80,000 ft. Something went wrong and it stopped at 60,000 ft and some sharp eyed person reported it and then the hysteria started.
A comment on TAE .
Chinese Balloons
I wonder what it cost for China to make and release that unguided balloon. It cost the US one fighter jet plus fuel plus $400,000 missile to pop it. (Was the balloon that tough?) What if China released hordes more? 99 of them? Or more? Hmmm. 🙂
Yes, should have used the 20 mm cannon instead
The New “Wind-Solar-Natgas” Volatile Electric Grid Management For Dummies…
I’d imagine some bright Grid Managers across the world see the writing on the wall when it comes to ramping up extremely unreliable and volatile Wind & Solar Power, backstopped by Natgas Peaker Plants. These poor Grid Managers, who really need their sleep, likely suffer from horrible nightmares.
Regardless… as the United States and the world continue to ramp up GREEN ENERGY as the Wind Industry losses MONEY HAND OVER FIST (Siemens Gamesa reported a $936 million loss on $2.1 billion in revenue Q4 2022), get prepared for a great deal more Volatile Energy Prices, Shortages & Surpluses.
California is paying a great deal more for Natgas due to higher demand and lower regional inventories. The Pacific Region Natgas inventories are 29% lower than in the same period last year and much lower than the other U.S. regions. We wish all Californians all the luck, especially those who have PLUG-IN EVs.
GOD HATH A SENSE OF HUMOR…
steve
“Wind-Solar-Natgas” Volatile Electric Grid Management”
Get used to it. Get good at it. Get used to storing some of it.
The modern grid management scenario is what will be happening more and more as coal gets either displaced or depletes.
Many states also have a considerable mix of Nuclear, Coal and Hydro to juggle as well.
Its all better than having no balls to juggle.
“These poor Grid Managers, who really need their sleep”
Really Steve, this is were your empathy lies ? You seem to glee for those who try to transform to a renewable energy source. Those who prepare for the future will out preform the dead heads.
Those who laugh last, laugh best.
well this is refreshing! after being wrong about tight oil and gas compaines for what seems like years, you are now picking on wind and solar. the good news here is you will be right this time, god’s speed. If you want people to believe in what you write, you might want to start with the lessons you learnt for being so wrong, for so long, regarding domestic upstream companies. every journey starts with a single step.
Regarding coal.
Don’t forget metallurgical coal.
Alpha Metallurgical Resources (AMR) has trailing 12 month earnings of almost $82 per share, current share price is just $159.
Shallow sand,
In 2019 about 14% of World coal production was metallurgical coal with 86% being burned, see
https://www.iea.org/reports/coal-2020/supply
It is the 86% we are trying to reduce, that’s the part that ends up in the atmosphere as CO2.
I’m glad you are aware of that Dennis.
Do you think the average person understands the coal industry?
I know the average person doesn’t understand the oil industry.
Not that the average person should understand these industries. But our political leaders tend not to, which is a real problem.
Shallow sand,
The average person understands very little about energy, our political leaders seem to be of fairly average intelligence and probably understand much less than they should. One problem for politicians is that energy policy is very nuanced and that does not translate well in today’s sound bite world. Perhaps they know more than is revealed in public comments.
“BP Plc (NYSE: BP) has predicted that the country’s [Russia] output is likely to take a big hit over the long-term, with production declining 25%-42% by 2035. BP says that Russia’s oil output could decrease from 12 million barrels per day in 2019 to 7-9 million bpd in 2035 thanks to the curtailment of new promising projects, limited access to foreign technologies as well as a high rate of reduction in existing operating assets.”
12 years. Lets split the range and call it down 33%, which is average decline of almost 3% per year.
Maybe that is representative of the decline in oil production on a global basis as well.
If so, what are some of the repercussions?
-For places that are not oil producers, or places that are oil producers but the oil is claimed/owned by outsiders with a higher bid or a bigger gun or that own your debt, there just might not be enough oil on the market to keep everything indispensable up and running in your country or region.
-It will most certainly mean that geopolitical rearrangement of priority will come to the forefront. Think of the Saudis leaning toward China or India leaning toward Russia, and both leaning toward Iran, as we have seen over the last year in a minor way. Magnify that. South China Sea.
-Industries that rely on oil derivatives for discretionary use are going to get squeezed hard.
-The economic incentive for electrification of everything will gain momentum…Big Time.
-Oil ‘have nots’ will become a big disrupting force. Maybe this shows up first where diesel for industry and commerce is in short supply. Borders will not protect anyone from the disruption of energy poverty and climate instability, any more than borders kept countries from being unaffected during WW2.
The bad scenario oil depletion-wise is
If something like this happens to Russia while simultaneously US shale and the Saudis all enter decline at a similar timeframe. The less developed countries of the world will struggle mightily to maintain basic services in such a scenario and more developed counties will stagnate economically, possibly leading to military conflict.
Stephen- when you say that less developed countries will struggle mightily in the scenario of oil shortfall
I would suggest considering a different look at it.
Purchasing power of importers might be a better measure of who will or will not experience shortage of oil products, than level of development level. Purchasing power and alliances with suppliers.
Also, most countries that are less developed have oil consumption/capita that is much lower than more highly developed countries…they generally aren’t use to having so much oil sloshing around in their economy.
Just saying that the oil dependency and supply fragility of various nations has a lot of complexity to it.
In the GoM the Kings Quay start-up (fields Mormont and Khaleesi) went as well as any can be expected to, and it is now operating slightly above nameplate of 100kboed (about 80kbpd). Samurai was added in October but has not reported production yet. Spruance (tie-in to Lobster) has also performed as expected. Taggart (design about 15 kbpd) and Dome Patrol (I think 5 to 8) both appear to be having well issues. Each produced around 1000 t0 2000 barrels (i.e probably for a few hours – invisible on chart) in May and April respectively, but have been offline since. The biggest disappointment is probably PowerNap (for Shell and produced through Olympus. It was originally designed for 28kbpd, then downgraded to 18, which it achieved for one month only, and has steadily dropped to, as of December (not shown), below 10 (there may be more wells to be added, however, but the final recovered reserves are going to be well below expectations of, I think, over 100mmboe, whereas at the moment it will struggle to reach 10 ).
Note EIA numbers don’t exactly match BOEM in the last couple of months. Also Vito and Kings Quay have nameplate 100,000 total, but 80,000 oil only. Mad Dog II is more like 140,000 I think, but maybe that is for both platforms combined.
The smaller mature deep fields (typically less than 10kbpd) and shallow fields have been maintaining production with in-fill drilling and tie-backs, but since April there has been a steady and significant decline, coinciding with rising water cut. Appomattox and Buckskin have shown similar declines over the same period but have more potential to recover. Thunder Horse has recovered back to nameplate capacity after a year or so of declines (I think as part of Thunder Horse South upgrades, however the expected decline rate is steep at around 25% per year).
Game of Thrones themed oil coming to your petrol station soon.
We already have Animal House – Otis, Bluto, Niedermeyer, Delta House – there could have been a few Bond themed group but I think only Odd Job was productive.
Disappointed Deepwater Horizon wasn’t named Blofeld or SPECTRE.
Goldman Sachs says oil demand to outstrip supply later in 2023, a serious problem in 2024
Jeff Currie heads commodities research at Goldman Sachs. He spoke on the sidelines of a conference in Riyadh, Saudi Arabia, on Sunday.
Bloomberg (gated) reports, main points:
Oil will rise back above $100 a barrel this year
sanctions likely to cause Russian oil exports to drop
Chinese demand expected to recover
OPEC+ will unwind production limits and look to raise output later this year
“Right now, we’re still balanced to a surplus because China has still yet to fully rebound.”
Capacity is likely to become a problem later this year when demand outstrips supply
“Are we going to run out of spare production capacity? Potentially by 2024, you start to have a serious problem.”
A far more detailed report can be found here:
Goldman Sachs: Oil faces production issue in 2024.
“…because China has yet to fully rebound”
Not seeing it happening this year, and likely to be underwhelming next year too. China is getting beat up by Covid and a large chunk of the labor force 50 male will not make it back to work. The rates of cigarette smoking among this demographic is very high.
Hope you’re feeling better Ron
A friend sent me this link:
https://www.msn.com/en-au/money/news/is-australia-one-of-the-world-s-biggest-oil-producers/ss-AA17bfMl?ocid=msedgdhp&pc=U531&cvid=1f294534687a4e4d8a9973c8cec1187b
The last picture has the US as the top producer at 16.585 MBOD
while the link in this graph from our Energy Information Agency has US under 13 MBOD:
https://www.eia.gov/dnav/pet/hist/LeafHandler.ashx?n=pet&s=mcrfpus2&f=m
What is causing the difference?
It all depends on what liquids you are counting. Your first link appears to be counting C+C, NGPLs, and other liquids. Your last link is C+C only.
Thanks Ron!! I figured it was something like that but didn’t have the data link(s).
I was unaware of the nat gas potential of Algeria. If the reserves potential is as stated, Europe is only a decade away from energy security. In this case, they can have their cake and eat it too. That is everybody can drive an electric car and have the generation capacity to handle that.
“Chevron is also assessing the vast shale gas resources that Algeria is estimated to have. Algeria is believed to have the world’s third-biggest shale gas resources, at 706.9 trillion cubic feet, more than the U.S. shale gas resources estimated at 622.5 trillion cubic feet, according to data compiled by the U.S. Energy Information Administration. Only China and Argentina are estimated to hold more shale gas resources than Algeria.”
https://oilprice.com/Latest-Energy-News/World-News/Chevron-Looks-To-Seal-Gas-Exploration-Deal-In-Algeria.html
TTT,
If you are unfamiliar with the Bowland and Weald shale gas basins in the UK, you might want to check them out.
Between 50 and 100 years natty right beneath the Brits’ feet.
Likewise, the Beetaloo Basin in Australia is showing very positive early results, although the operating conditions are a bit challenging.
Shale-sourced hydrocarbons are all over the world with the Bazenhov potentially dwarfing the Permian.
A free post by Art Berman ,
https://www.artberman.com/2023/02/07/a-new-oil-paradigm/
When a geologist tells you there isn’t any significant oil in US shale source rock…prior to the US using exactly that to become the world’s largest oil producer… you’ve got to ask if anything they charge you for is worth listening to when the free stuff is that silly.
Dennis,
With respect to all your wind energy charts up thread, they do nothing other than to show the obvious, without addressing the question at hand. Government preference including the Texas state government allowed, promoted and subsidized wind energy. By doing so, wind energy as well as solar has increased. That increase in energy, as as expressed in your charts, picks up some and by now maybe even a majority of the new incremental energy demand in certain areas. That is to say, despite now being well into the 3rd decade of this buildout, wind and solar has not replaced demand of fossils fuels as an energy source despite it huge cost any where on the planet. Given that the lifespan of many of these projects are now well past halfway and will need to be replaced or substituted before an new alternative energy source ( nuclear) is found, do we as a society keep funding the “temporary, obsolete, costly, intermittent energy” rather than move towards a stable more permeant solution.
Since we now know that they are money losing projects despite decades of research and that private industry will not pick up the tab, they will only continue with one inflation fighting government bailout bill after another.
As long as people are getting rich off government subsidies, permanent solution can never rise. And don’t get me wrong, this is just academic to me, I sell oil and nat gas and I am happy to do so. I have had “FU” money for several decades. I have always worked for my self. You guys and your silly energy ideas just keep me laughing all the way to the bank. But as a citizen hoping for a better future I argue for a better direction. The video of Dr Lindzen I posted above explains why this is unlikely to happen, but hope springs eternal.
Texas Tea, you seem to be under the delusion that the nuclear industry and fossil fuel industries are not subsidized as well. I kindly suggest you take the time to read further on this subject. Most nations subsidize their energy industries because their citizens use energy.
Sounds like sour grapes on your end because you aren’t the one receiving the subsidy in this case.
Texastea,
The oil industry started about 150 years ago and has had plenty of government support over that period. It will take some time to replace, oil and natural gas will be needed for the transition, but it is likely that by 2030 demand for oil, natural gas, and coal will be decreasing and likely nuclear power as well.
Solar energy use has been increasing at a 26% annual rate (2011-2021). In 2021 about 82% of total energy use was provided by fossil fuel for the World, a total of 489 EJ fossil fuel of 595 EJ of primary energy. If solar energy continues to increase at 26% per year from 2022 to 2038, all of the 2021 fossil fuel use would be replaced by solar energy. Clearly it will not be that simple, the scenario is just an illustration of how quickly fossil fuel use could be replaced, it would be faster with growth in wind, hydro, geothermal, and nuclear included in the analysis, though these would probably just cover increased energy use over time. Note also that with renewable energy sources less energy will be needed as most fossil fuel combustion has about 60% of the energy wasted as heat that is not utilized.
always ahead of my time, in this case about 1.5 hours 😊
https://oilprice.com/Energy/Energy-General/Climate-Crisis-Tide-Turns-For-Big-Oil.html
Texas tea,
Note that Exxon’s scientists had pretty good models for climate change for quite some time, though they kept quiet about it because the predictions were more dire than the mainstream models of the IPCC.
The scientists at Liberty may not be as good as those at Exxon, or the CEO may not listen to them. CEO’s are not always the sharpest knives in the drawer.
Have you listened or read the Liberty CEO’s comments?
The North Face deal is the direct result of the stupid sloganeering campaign against fossil fuels.
Mike has a great post today on his blog about his career drilling shallow wells.
But the small guys get demonized right along with the big companies. Doesn’t matter that stripper well operators have little in common with shale and deep water. All evil to the political people and the urban dwellers.
Dennis,
Sincere thanks to you for providing my biggest LOL moment of the week.
“CEOs are not always the sharpest knives in the drawer”.
From Chris Wright’s bio …
Graduated from MIT in Mechanical Engineering
Did graduate work at MIT and UC Berkley in Electrical
Engineering
Founded Pinnacle Technologies that pioneered the
mapping of hydraulic fracturing. Ranking up there near
George Mitchell (IMHO) in the evolution of the ”Shale Revolution’
Currently a Member of the Board of Directors of the
Federal Reserve Bank of Kansas City’s Denver affiliate
Dennis, your disparagement of Chris Wright is a clear display of “Sergeant Schultz Syndrome’, aka shunning any topic with which one finds disagreement… no small factor in today’s larger social/political polarization.
Aside … it is good to see more varying views on this site, Texas Tea being just one.
A wider perspective may not induce much (any?) opinion change, but it at least offers an opportunity for broader self education for those who choose to continue to learn.
My appreciation is extended to you, Mr. Patterson, and Ovi for keeping this site running for the past ~ decade.
Not very smart at all. Chris Wright should realize that climate change activists and fossil fuel depletion activists have the same long-term goal, even though they may not talk to each other. This may even be intentional, as peak oil becomes a “I told you so” retort in whatever way it ends up shaking out. There’s a name for this — the No Regrets Strategy or No Regrets Policy. Prepare for the energy transformation with no regrets.
And Texas Teat mentions Dr. Richard Lindzen. I should put up a blog post here to show how Linden screwed up atmospheric science research for a generation. Geophysicists are not the sharpest knives.
I should put up a blog post pointing out that modelers who can’t predict peak oil and claim it is so “because they can’t see into the future” have a difficult time in their modeling credibility until they solve that particular problem. 🙂
Not a huge surprise here, as I read the various retorts on my post, we are talking past one another. I will try again, but I am sure this will go over your collective heads. I am here mostly looking at information that will help me build long term investment ideas. I like to hear all sides of issues even when I disagree, I do from time to time learn a thing or two even from the most ignorant. In this case, since I don’t have those type of people in my life, I find them here.
First, I will give those of you who think the green energy evolution is 1. possible, 2. affordable and 3. can endure the test of time, ie be sustainable over several decades, that this is the course the US, Canada and EU are currently on. The question is, does it make sense? Second, I will admit, I am not a sharp knife as all my 1% friends can attest, I am a dull soup spoon at best.
The attached article show the vast amount of material (Metals, minerals, cement ) needed to build out various energy sources as wells as the challenges of getting them to market. What you see is that nat gas and nuclear requires a fraction of the material vs wind and solar. On top of that, you build in competition of the various materials currently used for everyday applications with rebuilding a new vehicle fleet concurrent with new energy sources. That competition will undoubtably put severe price pressures across the board, add in government funding and you can rest assured inflation to run rampant across the globe for the foreseeable future. Since the funding is being borrowed, government debt will also continue to skyrocket and the same time we have the demographic time bomb exploding.
Now you add in the lack of investment in oil and gas on top of that, which in all likelihood will build in a perpetual inflationary feedback loop, as the oil and gas that will be required to mine, transport, refine and manufacture the green energy infrastructure will increase demand at a the same time as the 10 years lack of investment diminishes future supply.
I suppose this is what you get when sharp knives like Dennis are in charge of making decisions rather than common sense practical businessmen. This is no disparagement of anyone, but it looks to me that no one has thought this through. Furthermore, folks better have a backup plan, because this train is going to run out of track sooner rather than later. My personal investment thesis to bet against things that have no possibly of working and place bets on those items that individual must have. The green energy revolution, despite being unwritten by bankrupt governments are the definition of things that can’t go on will not go on. Borrowing money that does not exist, to pay for things we don’t need on such a large scale is the very definition of something that can not go on for long.
https://www.mining.com/web/the-fossil-fuel-elephant-in-the-electrification-room/
“An extension of the infrastructure buildout is the global transition towards a “green economy”, which can only be accomplished with renewable power, electric vehicles and energy storage technologies.
All of these require lots of minerals. The amount of raw materials we’ll need to extract from the Earth to feed this transition is staggering.
EVs require, on average, six times the amount of minerals such as nickel, copper, cobalt and lithium, as traditional gas-powered cars.
According to the International Energy Agency (IEA), an offshore wind farm uses nine times as many resources as a natural gas plant, with 8,000 kg of copper needed to produce just one megawatt of power (1GW = 1,000MW)”
One final thought since Dennis likes to make a lot of useless charts, I sincerely think he should start a PEAK GREEN ENERGY MATERIAL BLOG, I would think it would have as much relevance if not more than Peak oil🖖just think of all the new charts that would generate.
Texas Teat Wo said:
So the sooner the better to get started.
All present energy sources require mining.
Isn’t population growth rate the real issue?
Birth rates are dropping. So maybe some hope?
Or maybe not. Per the UN, world population reached 8 billion recently, will hit 9 billion in 2037 and 10 billion in 2058.
Growth is slowing, but growth really needs to reverse into population decline quickly.
I’m a mere amateur regarding world population issues, but this seems to be the primary issue.
We actually lost population in Oregon last year.
Good news!
Shallow Sand ” population growth rate the real issue”
Yes indeed, the human footprint is more related to population size than to anything else, and that footprint is bigger than the earth itself.
An extremely hard pill to swallow is the idea that both population size, and the resultant overall economic scale, will need to decline….if a state of stability is eventually to be achieved.
There is no recipe for contraction. Calm and managed contraction.
I am sorry to realize, and say.
Hickory…. You forget that humans are creative and adapt. Your assessment is under the linear projection that there is no reaction by humans to change the direction. Contraction is not likely as we will change the direction and breed like mad!
Hey “dull soup spoon”,
You’re quite the character
“over your collective heads”
“I do from time to time learn a thing or two even from the most ignorant”
“those type of people in my life, I find them here”
Thanks
HB, So the moral of the story is that the guy doesn’t know what a mirror does?
one for coffee:
https://www.zerohedge.com/energy/dear-mr-president-let-appalachias-energy-lead-way
one for Dennis:
https://oilprice.com/Energy/Crude-Oil/Permian-Oil-Production-Could-Surge-By-500000-Bpd-This-Year.html
I have investments in PAA largely because of their exposure to the Permian
We sell oil to them.
Why did their stock crash? Too much CAPEX too fast?
Isn’t ENB better, or too boring?
I kind of don’t believe it will surge 500k
Russia to cut oil output by 5% as sanctions bite
Russia will cut crude oil production by half a million barrels per day starting in March, a little over two months after the world’s major economies imposed a price cap on the country’s seaborne exports.
“We will not sell oil to those who directly or indirectly adhere to the principles of the price ceiling,” Russian Deputy Prime Minister Alexander Novak said in a statement. “In relation to this, Russia will voluntarily reduce production by 500,000 barrels per day in March. This will contribute to the restoration of market relations.”
The cut is equivalent to about 5% of Russian oil output.
However, this is not really a cut, but natural decline due to the major oil companies and the service companies pulling out.
Russia’s Novak: January oil output in line with December -Interfax
Novak said in December that Russia may cut oil output by 5%-7%, or 500,000-700,000 barrels per day (bpd), in early 2023.
“We said that we have risks of a production decline, but so far we have not seen a decrease in production,” Novak said on Thursday.
Do you think that’s really voluntary? Because sanctions or the will to implement them is nothing new.
Russia is producing every barrel they possibly can and will be in March also. Their production will now gradually start to drop. By December 2023, they will be producing about 1.5 million barrels per day less than in December 2022.
Yup
https://www.wsj.com/articles/russia-to-cut-oil-production-sending-prices-higher-5697a8e8?mod=hp_lead_pos2
And not a single mention of supply issues. A friend of mine was the lead pipeline engineer for Shell for the Shakalin project. One of his comments was that almost all of the design and all of the more complicated construction was done by foreigners. Over a somewhat longer horizon the pulling out of Shell et al is going to hurt production capability.
rgds
WP
Has anyone here read “Cobalt Red”?
Contrast working in the modern US fossil fuel industry with what is described in this book.
Capitalism with out regulations is modern day slavery.
“The boiling frog is an apologue describing a frog being slowly boiled alive. The premise is that if a frog is put suddenly into boiling water, it will jump out, but if the frog is put in tepid water which is then brought to a boil slowly, it will not perceive the danger and will be cooked to death.”
Shallow, humans burning of fossil fuels on earth is just a large scale equivalent of slowly boiling a frog. Except humans are the frog. One can easily visualize the cruelty of children mining cobalt. The mining of fossil fuels is not perceived as a danger to those who are under the ether.
Next time you express FoxNews talking points about Biden. You should stop and try to realize, Biden understands something you don’t and deals with a larger scale of problems than stripper well operators.
Humanity is your complete entire family. There is no plan B for humanity living anywhere other than planet earth.
I would like to personally thank the NE liberals for showing us texans how to keep the electric on during major winter storms; burn oil
https://www.eia.gov/todayinenergy/detail.php?id=55459&utm_source=Twitter&utm_medium=EIAsocial&utm_id=Amplification
does their hypocrisy have any bounds?
Probably none.
But you Texans do need a bit of help, even by hypocrites.
According to your link, “NE liberals” are doing just fine, despite the harsh climate. The biggest problem is undue dependence on not-so-liberal gas.
What’s your point?
How a mixed electric grid can work with managed integration of source inputs
Iowa 2021- https://iub.iowa.gov/iowas-electric-profile
Wind 55%
Coal 33%
NG 10%
Other 2%
Like it always has been, its all a work in progress.
Hickory,
The playbook is (as it has been for some time now) to be able to manage a 70-80% renewable grid long term. With a managable buffer when it comes to blackout and somewhat challenging enviroment, but not too draconian, when it comes to demand management of electricity. A bit of interstate overbuilding of transmission capacity comes to mind when I think about Iowa and the wind rich inland states in the US. But I am absolutely certain that this is being planned at government level already, and that is a typical strength of a democratic structure as a whole. Some geographical areas have fossil fuel resources cheap enough that it is not politically acceptable to pursue this goal. And if being pragmatic, we just have to accept it. World trade and sound relations all around are just too important.
As for the critisim towards renewable energy, I find it a little bit agenda driven. After all it is energy that is created outside what is not already proven underground. And if the EROEI invested is positive, which it clearly is at different degrees based on location, why not? The second argument is that transferring energy from now to the future (locked in) makes sense. It is all perfectly logical. The fear of this natural evolvement has probably to do with the price of minerals. To ensure that prices are fair is probably the most important consideration to ensure that the current world order continues for years to come. How long? Decades…. The total crisis scenario is probably still far away anyway.
https://www.ercot.com/
A big chunk is coming from renewables.
rgd
WP
These percentages are technically impossible unless that is a very windy area night and day for 55% of the year.
With all respect, the above is exactly why so much of this green energy push sounds so hypocritical to those of us in the oil and gas business. They boast of using wind for 55% of their energy needs, but don’t stop to consider that coal makes up 33%, as opposed to only 10% from natural gas–despite the fact that GHG emission from NG is almost exactly half that from coal, and that’s if the coal is high-grade.
I submit that if they had eliminated the coal completely and used NG exclusively, they’d be at just about the same GHG emission level that they’re at now.
This sort of thing is happening with China too. The world community–especially Europe–gives them a big attaboy for producing more EV’s and windmills, yet they’ve added more coal-burning (brown coal) utility plants than all the rest of the world put together.
Sorry, but this is a feeble argument.
Gerry,
Iowa utilities are generating electricity as best they see fit.
And they are not boasting about it- just getting the job done with the resource mix and equipment that they have.
Its not a complicated thing to understand.
btw- Iowa produces no oil, nat gas or coal.
My comments were not to disparage Iowa, which I like, but rather to point out that it’s a paradox to use 33% coal energy and only 10% NG when they have thousands of miles of NG pipelines and the GHG emission from pipeline gas is only 50% that of the very best coal.
I have no idea where they got their coal, but my bet would be Appalachia. The natural gas from the Appalachian basins is selling at a very low price point. Understanding why you would burn coal instead of NG is a complicated thing for me to understand.
But I also have a tough time understanding using corn as a biofuel when millions of children are hungry. Not trying to be Mother Theresa here but this is a high-carbon situation: using the Haber Process to make billions of pounds of ammonium nitrate to grow corn to use as a vehicular fuel.
I think I may have stumbled onto a web site that is just too tough for me.
A new Non-OPEC October Production Thread has been posted.
https://peakoilbarrel.com/non-opecs-oil-production-rise-continues-in-october/
A new Open Thread Non-Petroleum has been posted.
https://peakoilbarrel.com/open-thread-non-petroleum-18/